Predictive Maintenance of Power Substation Equipment by Infrared Thermography Using a Machine-Learning Approach
by
Irfan Ullah
1, 
Fan Yang
1,*,
Rehanullah Khan
2,
Ling Liu
3,
Haisheng Yang
3,
Bing Gao
1 and
Kai Sun
3 1
State Key Laboratory of Power Transmission Equipment & System Security and New Technology, School of Electrical Engineering, Chongqing University, Chongqing 400044, China
2
Department of IT, CoC, Qassim University, Buraydah 51452, Saudi Arabia
3
State Grid Shanxi Electric Power Company Jinzhong Power Supply Company, Jinzhong 030600, China
*
Author to whom correspondence should be addressed.
Energies 2017, 10(12), 1987; https://doi.org/10.3390/en10121987
Submission received: 21 October 2017
/
Revised: 23 November 2017
/
Accepted: 27 November 2017
/
Published: 1 December 2017
Abstract
:A variety of reasons, specifically contact issues, irregular loads, cracks in insulation, defective relays, terminal junctions and other similar issues, increase the internal temperature of electrical instruments. This results in unexpected disturbances and potential damage to power equipment. Therefore, the initial prevention measures of thermal anomalies in electrical tools are essential to prevent power-equipment failure. In this article, we address this initial prevention mechanism for power substations using a computer-vision approach by taking advantage of infrared thermal images. The thermal images are taken through infrared cameras without disturbing the working operations of power substations. Thus, this article augments the non-destructive approach to defect analysis in electrical power equipment using computer vision and machine learning. We use a total of 150 thermal pictures of different electrical equipment in 10 different substations in operating conditions, using 300 different hotspots. Our approach uses multi-layered perceptron (MLP) to classify the thermal conditions of components of power substations into “defect” and “non-defect” classes. A total of eleven features, which are first-order and second-order statistical features, are calculated from the thermal sample images. The performance of MLP shows initial accuracy of 79.78%. We further augment the MLP with graph cut to increase accuracy to 84%. We argue that with the successful development and deployment of this new system, the Technology Department of Chongqing can arrange the recommended actions and thus save cost in repair and outages. This can play an important role in the quick and reliable inspection to potentially prevent power substation equipment from failure, which will save the whole system from breakdown. The increased 84% accuracy with the integration of the graph cut shows the efficacy of the proposed defect analysis approach.
1. Introduction
Thermal energy plays an important role in the electrical equipment of power substations for diagnosis of the fault in its early stages, which increases the operational reliability of the power grid’s working life. All electrical objects with temperature above zero emit infrared radiation which increases the internal temperature of electrical equipment in the electrical power substation. The current passing through electrical equipment in the substation causes heat in the electrical devices such as relays, capacitors and transformers. The human eye cannot visualize the thermal energy because infrared energy is emitted as heat energy in objects. The heat images of an object’s surface are only possible by infrared thermography, in which the invisible heat energy is converted to visual heat energy, which shows the heat picture of the object. The color of the object in the thermal picture changes with the temperature of the surface of the object. As a result, an increase in resistance determines an increase in the heat signature of the electrical equipment. With the passage of time, electrical components also begin to depreciate, due to various reasons such as poor materials, dirty joints, overload, unbalanced load, insulation, corrosion and wiring faults [1]. Therefore, the electrical equipment in power substations such as arresters, air-breaker switches, step-down transformers, distribution, cutout switches and fuses, circuit breakers, and so on, suffer breakdown when the inside temperature of electrical equipment rises at an irregular level. Besides the previously discussed reasons, the main anomalies also arise because of reasons including unbalanced current, minor cracks in insulators, contact problems, and increases and decreases of voltage levels and other similar related issues. In this work, we focus on detecting this increase in temperature, which helps in the remedy of breakdown even before it occurs.
Thus, in this article, for non-destructive defect analysis and prevention in power substations, we use the computer vision approach and machine learning to detect the problem in early stages of equipment breakdown by exploiting and taking advantage of the infrared thermal images. Therefore, our approach and contribution augments the non-destructive approach to defect analysis in electrical power equipment using computer vision and machine learning, and thus shows the efficacy of our approach. We use a total of 150 thermal pictures of different electrical equipment in 10 different substations in operating conditions, using 300 different hotspots and using a total of eleven features. These features are first-order and second-order statistical features. For detection, our approach uses the multilayered perceptron (MLP) to classify the thermal condition of components of power substations into “defect” and “non-defect” classes, achieving an accuracy of 79.78%. For performance enhancement, we use the graph cut to increase the accuracy to 84%. By using and augmenting the graph cut to increase performance, we argue that the successful development and deployment of our approach can play an important role in quick and reliable inspection to potentially prevent power substation equipment from failure, saving exponential costs. The 84% accuracy shows the efficacy of the proposed defect analysis approach.
The heat produced in electrical components can be sensed by infrared thermography (IRT). IRT captures the thermal profile of different electrical components using an infrared camera. The thermal profile contains the heat image and values of temperature scale of the equipment. Colors of different temperatures represent different temperature regions in the electrical devices. With the thermal profile, the thermal images can be analyzed by the thermographers which categorize the status of defective parts by the urgency level of maintenance of electrical equipment. Finally, the concerned departments can examine the hot component, fixing the equipment according to the matter of priority.
Over the years, thermography has become an important method for preventing and predicting the surface defects of different materials as a result of its non-intrusive, safe and inexpensive setup. Therefore, many studies have shown that thermography performs a variety of applications and is a useful technique for the operational working of electrical equipment [2,3,4,5,6,7,8,9,10,11,12].
As an electrical device deteriorates, its resistance rises and it thus produces more heat. The thermal energy produced from an electrical component is proportional to the square of the current, and its resistance (I2R loss) [11]. The increase in heat can trigger the failure of an electrical component and set the equipment on fire. By using thermography for investigating the electrical equipment under peak working conditions, the damaged part of the equipment can be classified and identified by its level of seriousness [11].
Supporting cost of electrical components plays an essential part due to the reduced cumulative working expense of power substations. The maintenance cost of electrical equipment can be increased by the absence of information data and repair of equipment in the power substation. Generally, the working performance of electrical equipment is not checked frequently, which can play a vital part in the early prevention of a fault and for increasing the life of electrical equipment. Rather, the timetable for maintenance is determined by using the failure component history of the substation. Infrared thermography is nowadays widely used for screening the performance of electrical equipment, which gives data with respect to the working status of the component for increasing work operation of equipment, counteracting possible failure and controlling the maintenance expense of electrical equipment.
Typically, when the IRT techniques are applied, the thermal electrical defect and status of the defect are recognized by inspection of its delta T (ΔT) criteria [12]. The procedure is commonly known as a qualitative-based temperature estimation system [13]. The delta T criteria of any part of the component is explained as an increase in the value of the temperature over the temperature of a reference value—which is normally the ambient temperature—the temperature of a similar segment of electrical component under a similar condition, or the most extreme acceptable temperature of the component [14]. Different standards for the ΔT criteria [14] are defined by NETA, NFPA, NFPA 70-B [15], ASTM-E [16], and so on.
In Refs. [17,18], artificial neural networks (ANNs) are used for the classification of a defect in different materials. The neural networks are powerful and strong mathematical models for the classification and pattern-recognition problems. These days, ANNs are famous for being used to resolve real-world non-linear complex problems in electrical equipment. In the past few years, different research papers about ANNs’ application for fault analysis in electrical equipment using infrared thermography have been presented. In these research papers, the different suitable thermal image features were utilized as inputs to the ANNs for classification of faults in the various electrical systems. Research presented in Ref. [19] used a neuro-fuzzy network approach for the fault detection in surge arresters while the inputs of the ANN were thermal images and selected identification feature variables. The system was classified into four different categories that are light, faulty, normal and suspicious classes, and the overall system performance for diagnosis of fault is no more than 10% for classification of light, faulty, normal and suspicious classes. In the article [20], the author obtained 93.38% of the accuracy of a three-layer ANN classifier. The author used RBG color space for the scaling the data and internal temperature data to identify the faults in electrical equipment into four main classes that are high, medium, intermediate and low. In Ref. [21], the author used the support vector machines (SVM) classifier for the classification of ground substation faults. The accuracy of the SVM classifier was about 83%. The total dataset consisted of 20 images of feature samples of Zernike moments. The authors of [22,23] proposed an intelligent classification technique. The three-phase intelligent fuse and an ANN-based class system for diagnosing different types of connection problems in electrical equipment were presented. The three input features were absolute extreme temperature, mean temperature distance and relative maximum temperature, compared to other areas of image distance and histogram in other areas of the image. The test error rate using only the histogram distance as input was 31.2%, and for the remaining three features as the input of ANN, the performance noted was 9.5%. The data set was only 74 infrared thermal images. One of the main disadvantages of these works was a limited thermal image database that can sometimes be the result of uncertain reliability and is questionable in the research community. In the article [24], the MLP classifier and discriminant analysis classifier are used for circuit breaks only. The system accuracy for multilayer perceptron networks was 80.40%, and the accuracy of the discriminant analysis classifier was 82.42%. The total database used 368 thermal images. The author recommended that the infrared thermography technique is more useful for fault diagnosis in circuit breakers. Actually, this is a two-dimensional prediction and is cost-effective in electrical equipment, especially in circuit breakers. The infrared thermographic technique was used in Ref. [25] for predictive maintenance of parallel power cables in electrical equipment. In the article [26], the author used the self-adaptive technique for the fault diagnosis system of the rolling bearing under different working conditions using IRT technology, and genetic algorithm (GA) and nearest neighbor (NN) models for selecting suitable features to increase the accuracy. In Ref. [27], the author used the thermographic infrared technique for the fault diagnosis of three phase-induction motors. In Ref. [28], the author presented a new approach for testing the thermal power installation equipment using the infrared thermographic technique. The SVM classifiers were used to detect the status of computer servers using thermal fault diagnosis, achieving 81.5% accuracy [29].
In this research article, we investigate the application of thermography infrared technology for predictive maintenance to identify the presence of a defect and non-defect in electrical power substations of 110 kV .The maintenance cost of electrical components plays an essential part to reduce the cumulative working expense of power substations. The maintenance cost of electrical equipment can be increased by the absence of information and repair of equipment in the power substation. Generally, the working performance of electrical equipment is not checked frequently, which can play a vital part in the early prevention of a fault and for increasing the life of electrical equipment. Rather, the timetable for maintenance is determined by using the component failure history of the substation. Therefore, from the automated defect analysis and detection perspectives, we use the machine-learning approach of MLP to detect defects in a non-destructive manner. From an image perspective, we use the statistical features in infrared images to characterize the thermal status into the “defect” and “non-defect” categories in power substation equipment.
2. Predictive and Preventive Maintenance of Electrical Equipment
Usually, for the maintenance of electrical equipment in the power substation, there are typically two main approaches used, being run to failure (RTF) and preventive maintenance. The RTF approach is straightforward and simple, where in this case there are no outflow cash expenses on the maintenance issues of electrical equipment before the electrical equipment shuts down. The method is based on waiting for the electrical equipment to shut down before any equipment care action is taken. Thus, this approach is costly and time-consuming. Hence, an infrared thermography-based technique for the diagnosis of electrical power substations allows the predictive and preventive maintenance for early protection of electrical equipment failure without shutting down the running operation of the power substation. This approach is thus feasible and optimized, saving a great amount of time and considerable resources.
According to historical US data [30], the effective use of predictive and preventive maintenance of electrical equipment reduces the cost to 33% from 50%, which is neglected by the majority of the production and the manufacturing plants in the world. The benefits of predictive and preventive maintenance from various points of view are as follows:
- Decreases the unscheduled shutdown
- Increases the suitable use of manpower
- Increases the output volume of the plants
- Decreases the management expenses of instruments
- Increases working life of devices
2.1. Predictive Maintenance of Electrical Equipment
Looking after electrical devices based on the online monitoring of real-time operating status—by frequently collecting data on the efficiency of different electrical equipment, heat distribution of devices and other factors dependent on statistical data—relates to the predictive maintenance of electrical equipment. Therefore, the program plans the entire maintenance action based on the accurate data, and in case of an important anomaly, this is fixed before the failure of the whole system. Detection of faults in early stages of electrical equipment can prevent them before serious disorder occurs, and thus, significantly reduces downtime, the maintenance cost of devices, and increases working time of devices.
2.2. Preventive Maintenance of Electrical Equipment
Monitoring of electrical components in power substations according to the historical data of working capacity, previous failure data of components and mean time to failure (MTTF) component performance, is called preventive maintenance of electrical components [31]. The preventive maintenance of electrical components technique requires upgrading and repairing actions for components. Let us suppose that an electrical component in a power substation generally works for almost 10 months before needing a little fix. By using the preventive approach, the electrical component is removed from the site and reconstructed after ten months of working operation. From this example, the schedule of fixing the electrical component is already defined, and is determined by monitoring personnel. If there is no essential repairing after nine months, then it is a total waste of time, money, materials and labor. This approach is an accidental decision which is not maintained by any kind of accurate data.
3. Artificial-Intelligence Defect-Identification Model for Power Substations: Proposed Approach
3.1. Thermal Image and Delta Temperature Criteria Analysis
For our approach, we use the infrared thermal digital camera manufactured by FLIR T630 to capture the thermograms of electrical equipment of 10 power substations in Chongqing, China. The infrared camera standard temperature measurements range from −40 °C to +150 °C and +100 °C to +650 °C. The thermal images contain focal plane array; the detector-type uncooled microbolometer has a pitch of 17 um, working in the spectral band of 7.5 um–14 um. The IR resolution of T630 is 640 × 480 pixels with the thermal sensitivity Noise Equivalent Temperature Difference (NETD) of <40 mK at +30 °C (+86 °F). For taking the thermal images, the thermal camera lens direction was kept straight to the required electrical component in order to obtain the correct thermal measurement of equipment. The distance between the required component and the infrared camera was in the range from 5 to 8 m. The radiation coefficient was fixed to 0.95, as suggested for the electrical equipment thermography [32]. The temperature around the devices was approximately 2 degrees centigrade to 6 degrees centigrade during the inspection in the power substation in winter in Chongqing, China. We collected a total of 150 thermal pictures of different electrical equipment in 10 different substations in operating conditions, with 300 different hotspots used.
In this paper, depending on the electrical component working temperature, the thermal states of the components have been primarily manually classified into two groups based on the significance level, which is from level 1 to 3, using ΔT conditions listed in Table 1. Furthermore, these three groups are divided in two groups which are “defect” and “non-defect”. The maximum difference between hotspots and the normal temperature is set as ΔT criteria. This technique is commonly identified as qualitative temperature measurement classification. The key advantage of this technique is the slight change of emissivity of the temperature measurements. At the same time, the main disadvantage of this technique is that it cannot define the effect if a shutdown occurs at the same period in the equipment, because of the reference equipment [10].
3.2. Feature Extraction
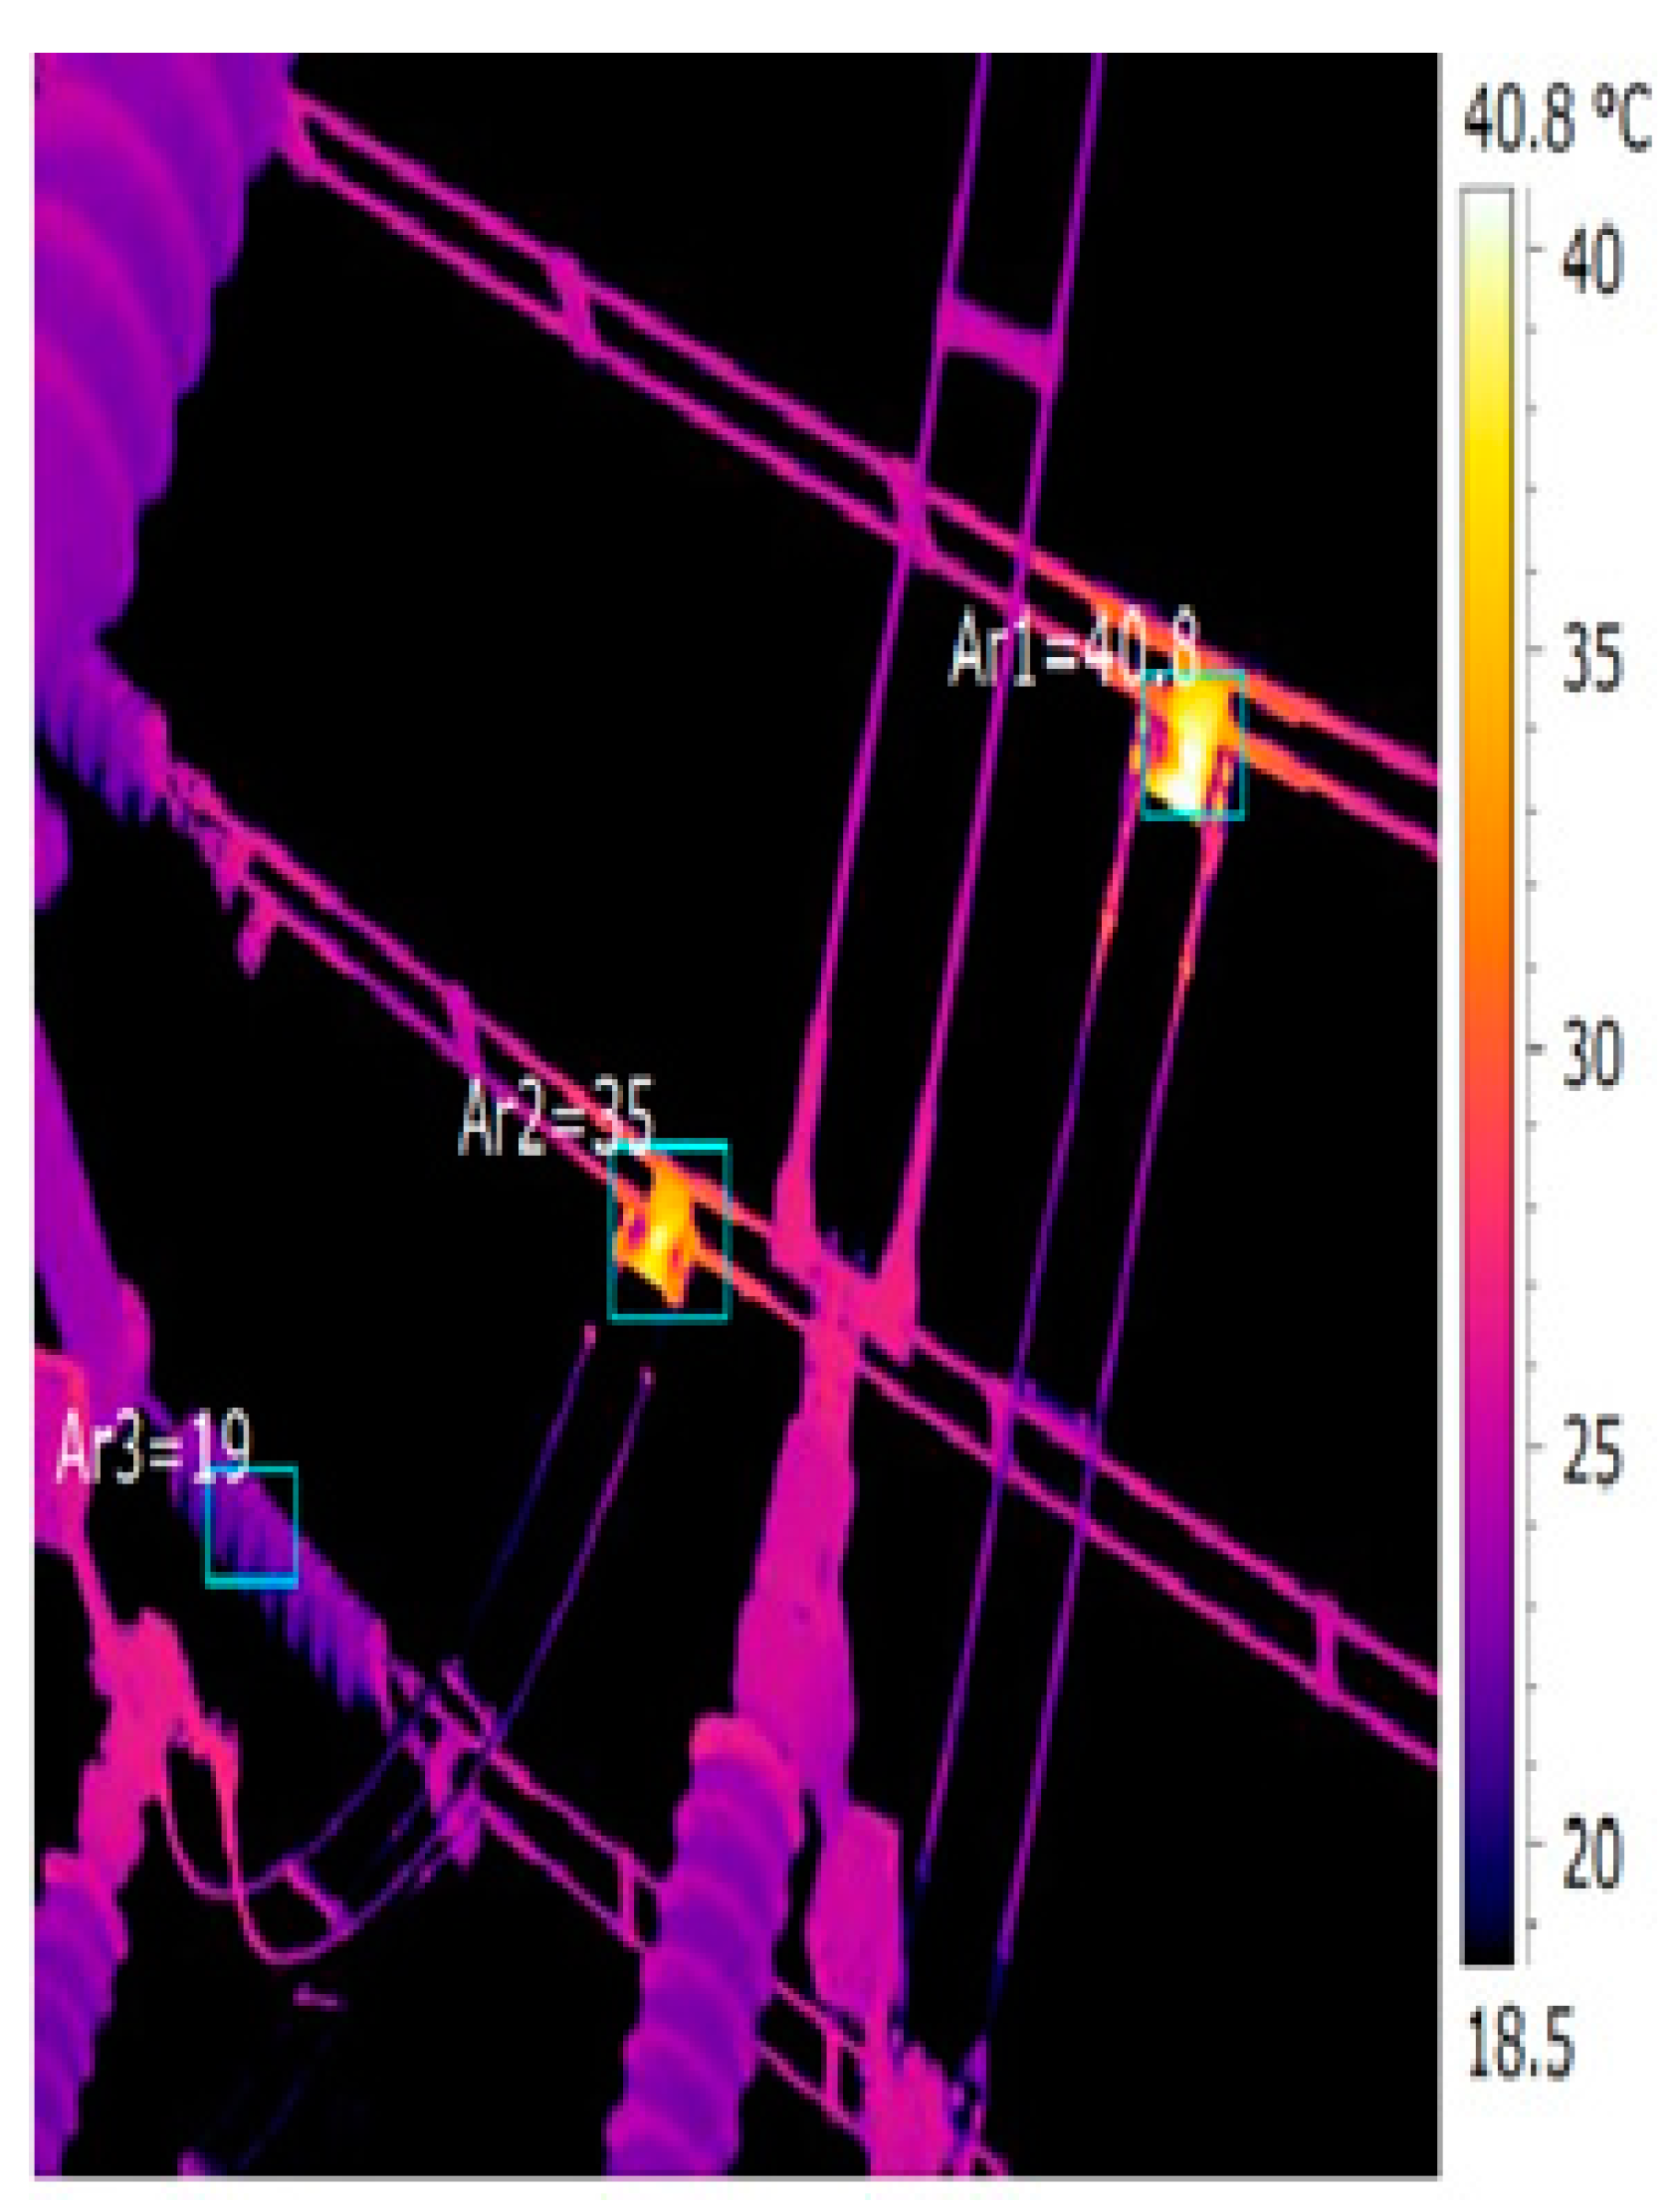
For feature extraction, the thermal images are manually located in small rectangular shapes. The sample thermal images are shown in Figure 1 and Figure 2. For feature analysis, these thermal images are then converted into grayscale, in which the hot areas correspond to white regions and cold areas to black. A total of eleven second-order and first-order statistical features are extracted from the area of interest and are evaluated in this research study. The seven first-order features are mean, variance, standard deviation, skewness, kurtosis, energy and entropy. The-second order statistical features are energy, contrast, entropy and homogeneity. The statistical features list is shown in Table 2. The eleven statistical features are denoted as B1, B2, B3, B4, B5, B6, B7, B8, B9, B10 and B11.
3.3. ANN: Multilayered Perceptron (MLP)
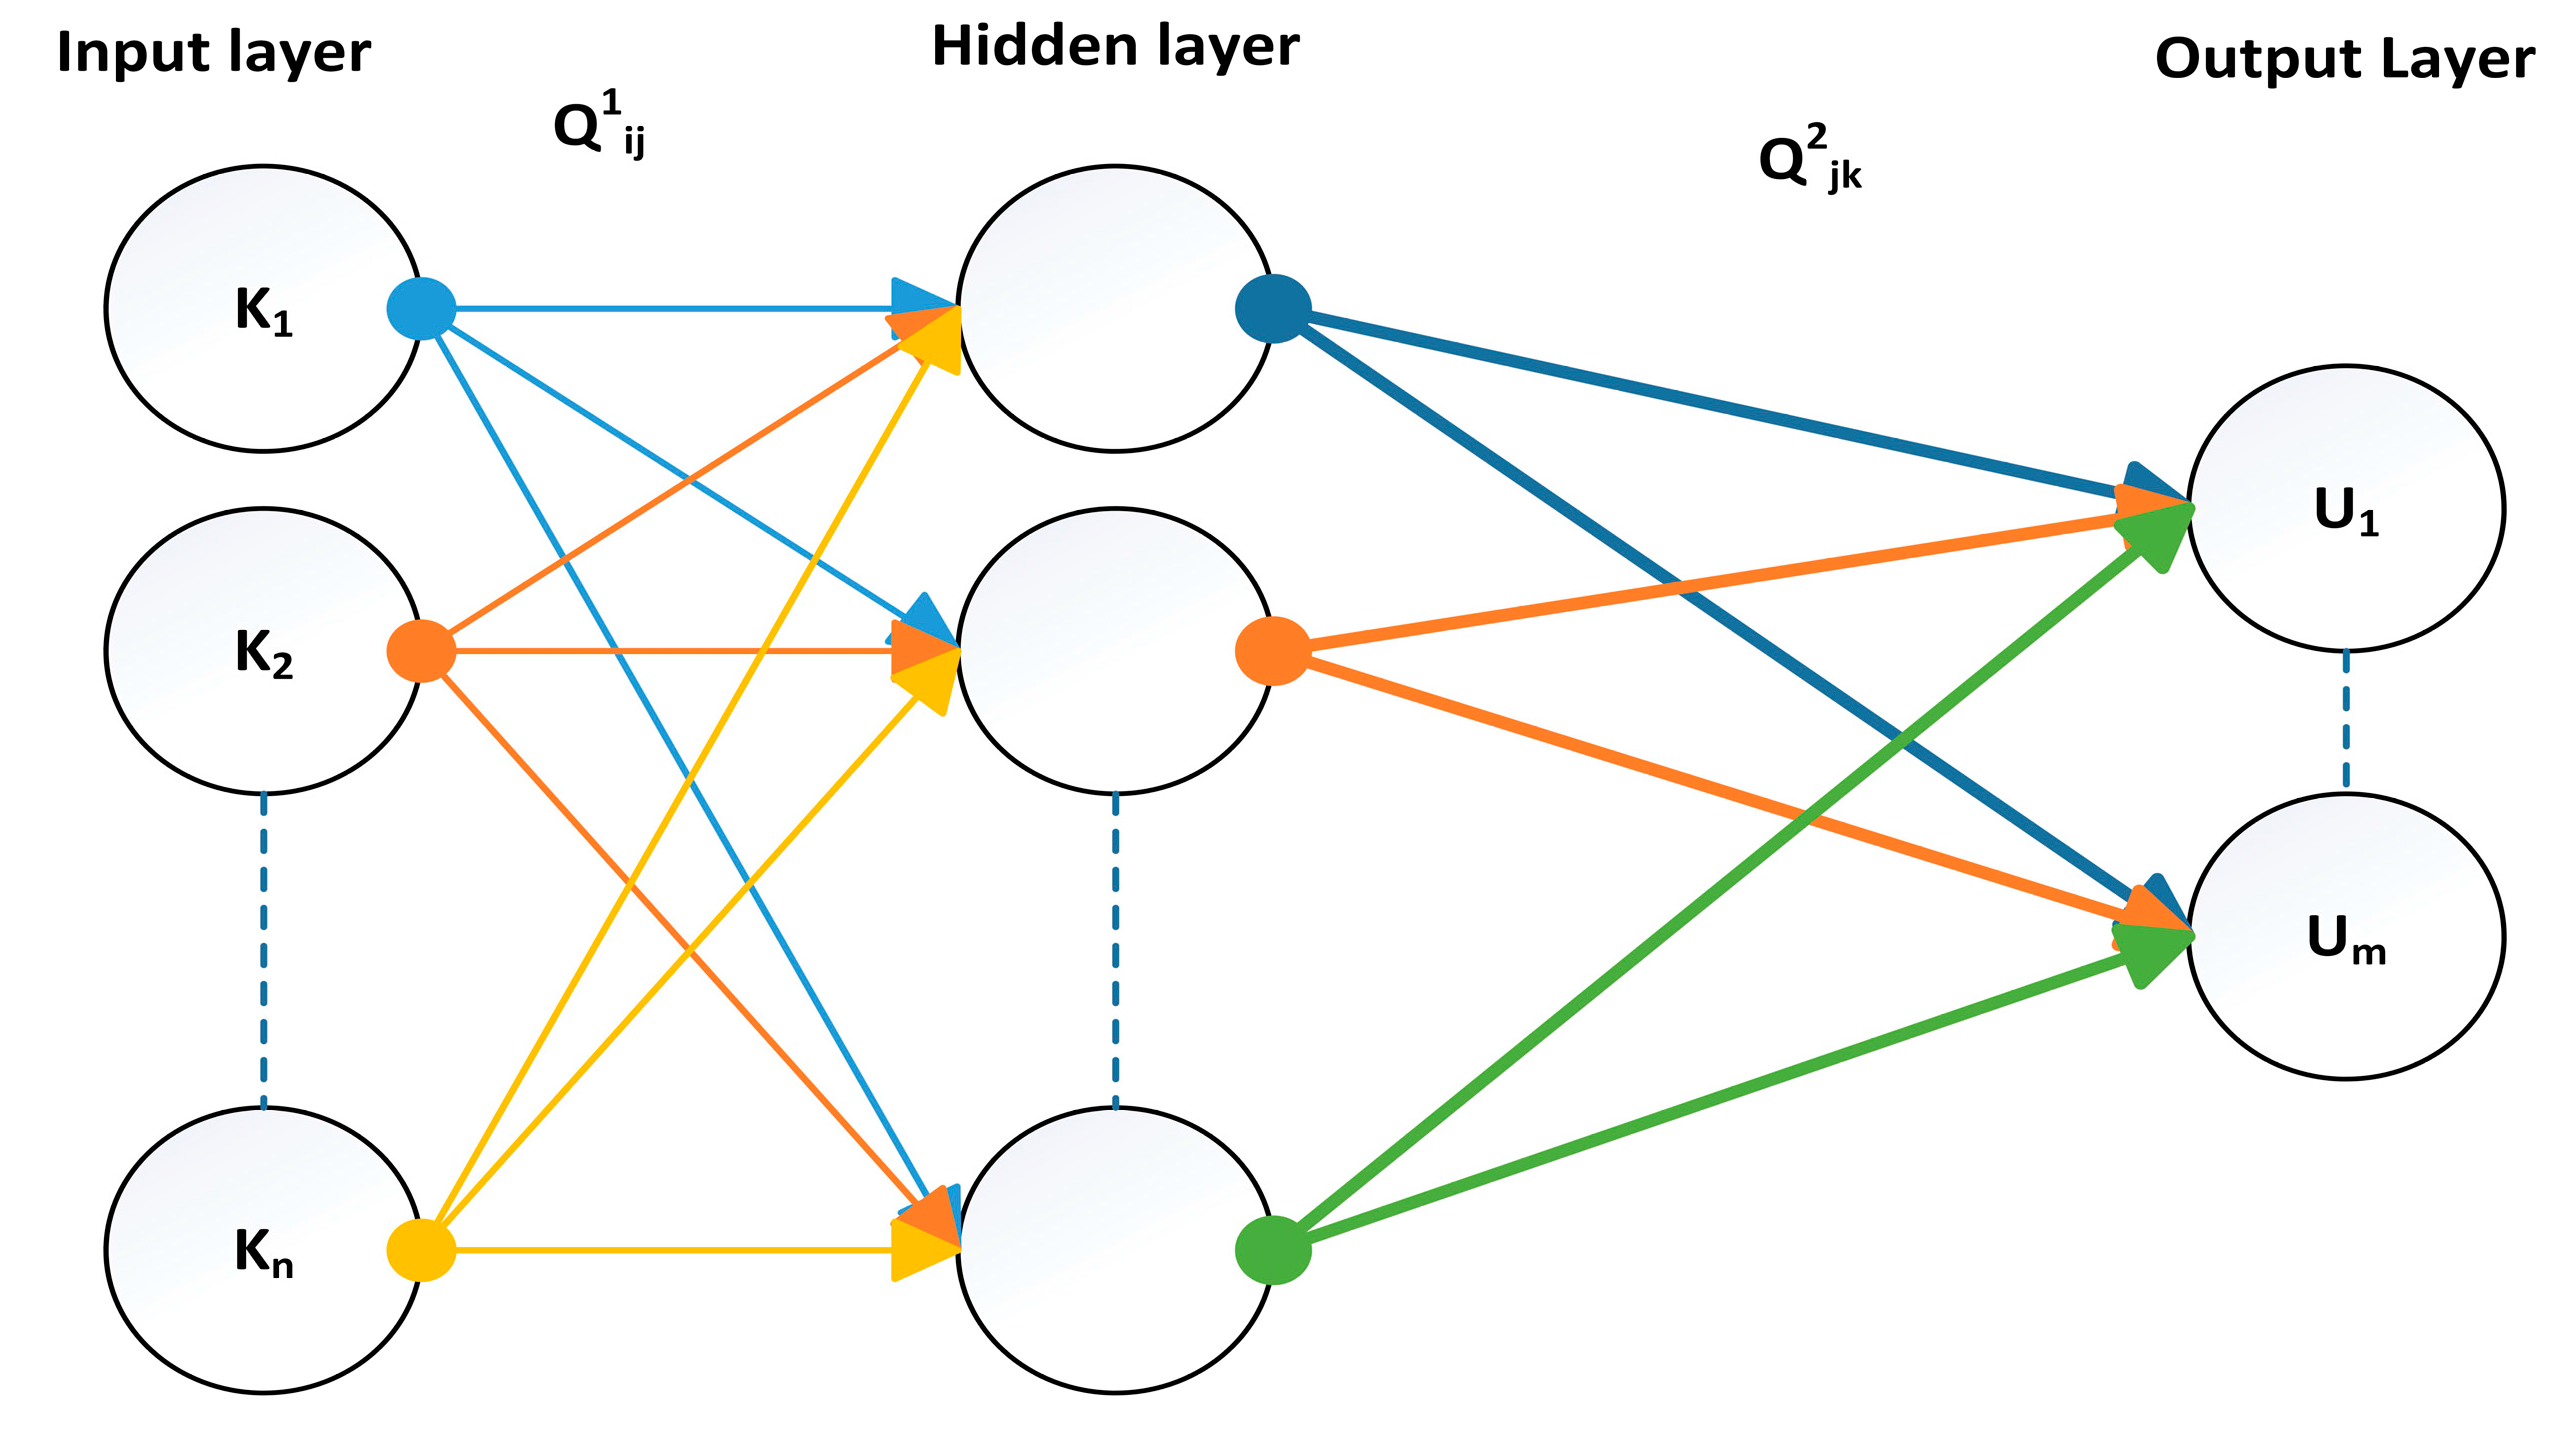
In this subsection, we explain the generic structure of the ANN (MLP). Section 4.1 represents the experimental MLP analysis. Figure 3 shows the generic model of the MLP. The MLP is considered one of the most popular networks for object classification and recognition. The MLP architecture consists of three layers: input layer, hidden layer and output layer. The architecture of the generic MLP network is shown in Figure 3. In the generic MLP of Figure 3, the input layer represents the number of nodes, which is equal to the input features count; and the output layer represents the number of nodes, normally equal to the number of the target classes. A single hidden layer is shown. However, the number of hidden layers depends on the problem at hand [33].
In the standard MLP neural network of Figure 3, the input nodes are K1, K2 … Kn, the predicted outputs are U1, U2 … Um and the middle layer is the hidden layer. Q represents the weights between the layers and corresponding nodes. Figure 3 shows only the generic model. In our experiments, 11 input nodes due to 11 features and one output node due to binary classes “defect” and “non-defect” are used.
4. Experimental Setup and Result Analysis
As our objective is to construct a reliable non-destructive system for the detection of defects in power substations, one of the problems of any automated defect/non-defect detection system is the acceptable detection performance given features within the computing resources. The point here in this research work is the investigation of the thermal images and its feature-set calculation to get acceptable automatic defect/non-defect detection performance with limited resources. With 11 features and the MLP, we design a system that can generate an acceptable performance. We further increase this performance by introducing the augmentation approach using graph cut. The augmentation approach uses the graph to combine the MLP and thermal image structure to increase the performance to 84%. In order to construct a reliable system based on machine learning (ML), the system must be investigated from multiple parameters and settings. Therefore, we show different modalities and their effect on the performance. Firstly, as the initial defect analysis is based on MLP, we discuss the experimental setup for MLP, a training phase and testing phase of the MLP and then the graph cut to increase classification performance.
4.1. MLP-Based Defect Analysis
From an experimental analysis point of view, we use the MLP from MATLAB, R2012a and WEKA. WEKA is used for checking the conformity of the results. For the performance evaluation of the MLP neural network for power substation electrical equipment thermal fault recognition (i.e., non-defect and defect classes), the temperature around the devices was approximately 2 to 6 degrees Celsius during the inspection in the power substation in winter in Chongqing, China. We collected a total of 150 thermal pictures of different electrical equipment in 10 different substations in operating conditions, with 300 different hotspots; the 300 thermal image samples are separated into testing and training datasets. For ordering the testing dataset and training dataset, the five-fold cross-validation technique is used in this experiment [34]. As there are comparatively fewer data samples, therefore, we used five-fold cross validation rather than ten-fold cross validation. Also, we believe that five-fold cross validation will have a better chance to cover the entire training samples and produce a reliable model. In the five-fold cross-validation technique, the whole dataset is divided into five folds. The details of samples in each fold are given in Table 3. The five iterations of testing and training are presented in Table 3. In every iteration, for training the MLP, the four-fold data are used. For testing, the single-fold data is selected. At the final stage, the average value of all the five folds is calculated as the MLP performance. The multilayered perceptron network is trained by changing the hidden-nodes layers from 1 to 20, the epochs are fixed at 330, and 0.005 is selected as the learning rate. For performance evaluation, we use accuracy, sensitivity and specificity. We use these parameters as they are standard for tasks similar to ours and provide a good representation of the performance for the autonomous tasks based on machine learning. These parameters are defined as follows:
Hence, D = total number of “defect” states correctly classified; ND = total number of “non-defect” states correctly classified; l = total number of “defect” states classified as “non-defect” states; and m = total number of “non-defect” states classified as “defect” states.
4.2. Graph and Graph-Cut Integration
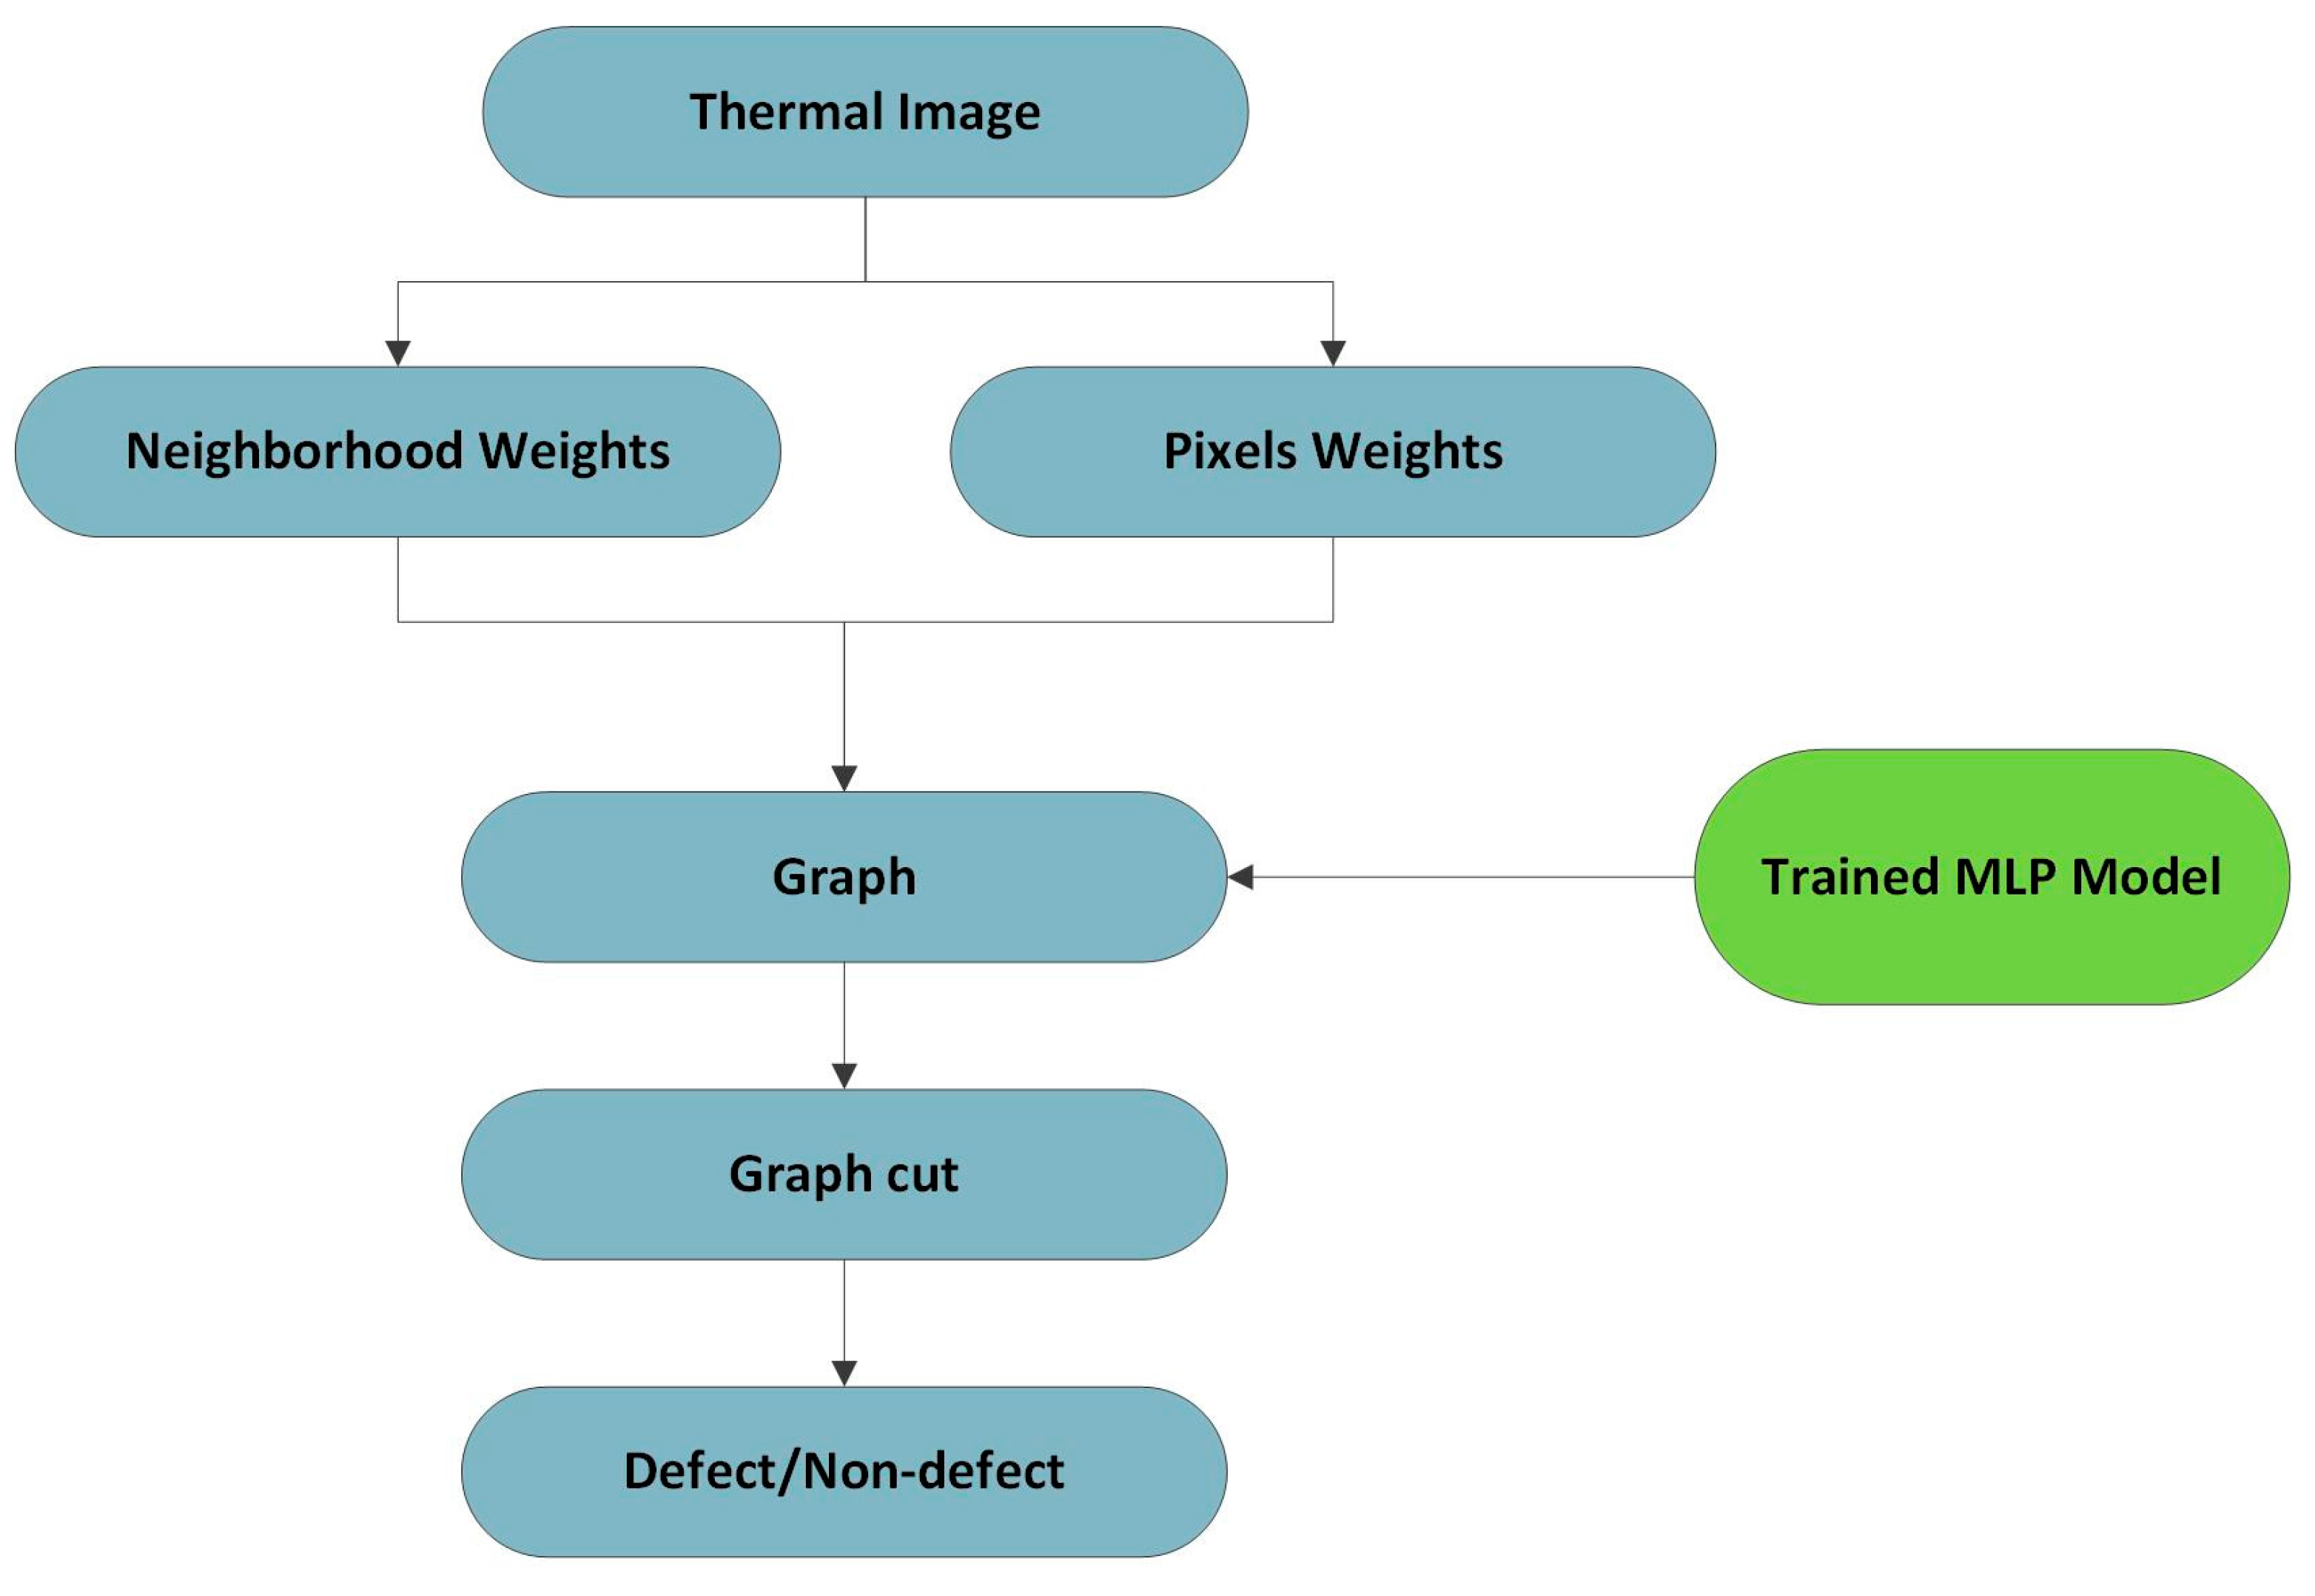
A graph is a combination of nodes and edges (arcs) representing a phenomenon. Graph cut is a technique for segmenting a graph, based on the weights of the nodes [35]. Graph cuts have many applications in different fields. In this paper’s context, we integrate graphs and graph cuts into an MLP-trained model to increase the classifier performance, or in other words, to help the classifier increase the classification performance. Graph cuts are very famous for minimizing energies in the binary class problem. Since our problem in the experimental setup is “defect” and “non-defect”, we integrate graph cuts in the MLP setup to increase classification performance. Figure 4 shows a setup of exploiting graph cut and the MLP model created to increase the classification algorithm. The proposed algorithm is explained in the following results section to enhance the MLP classification of the “defect” and “non-defect” detections.
4.3. MLP and Graph-Cut Results
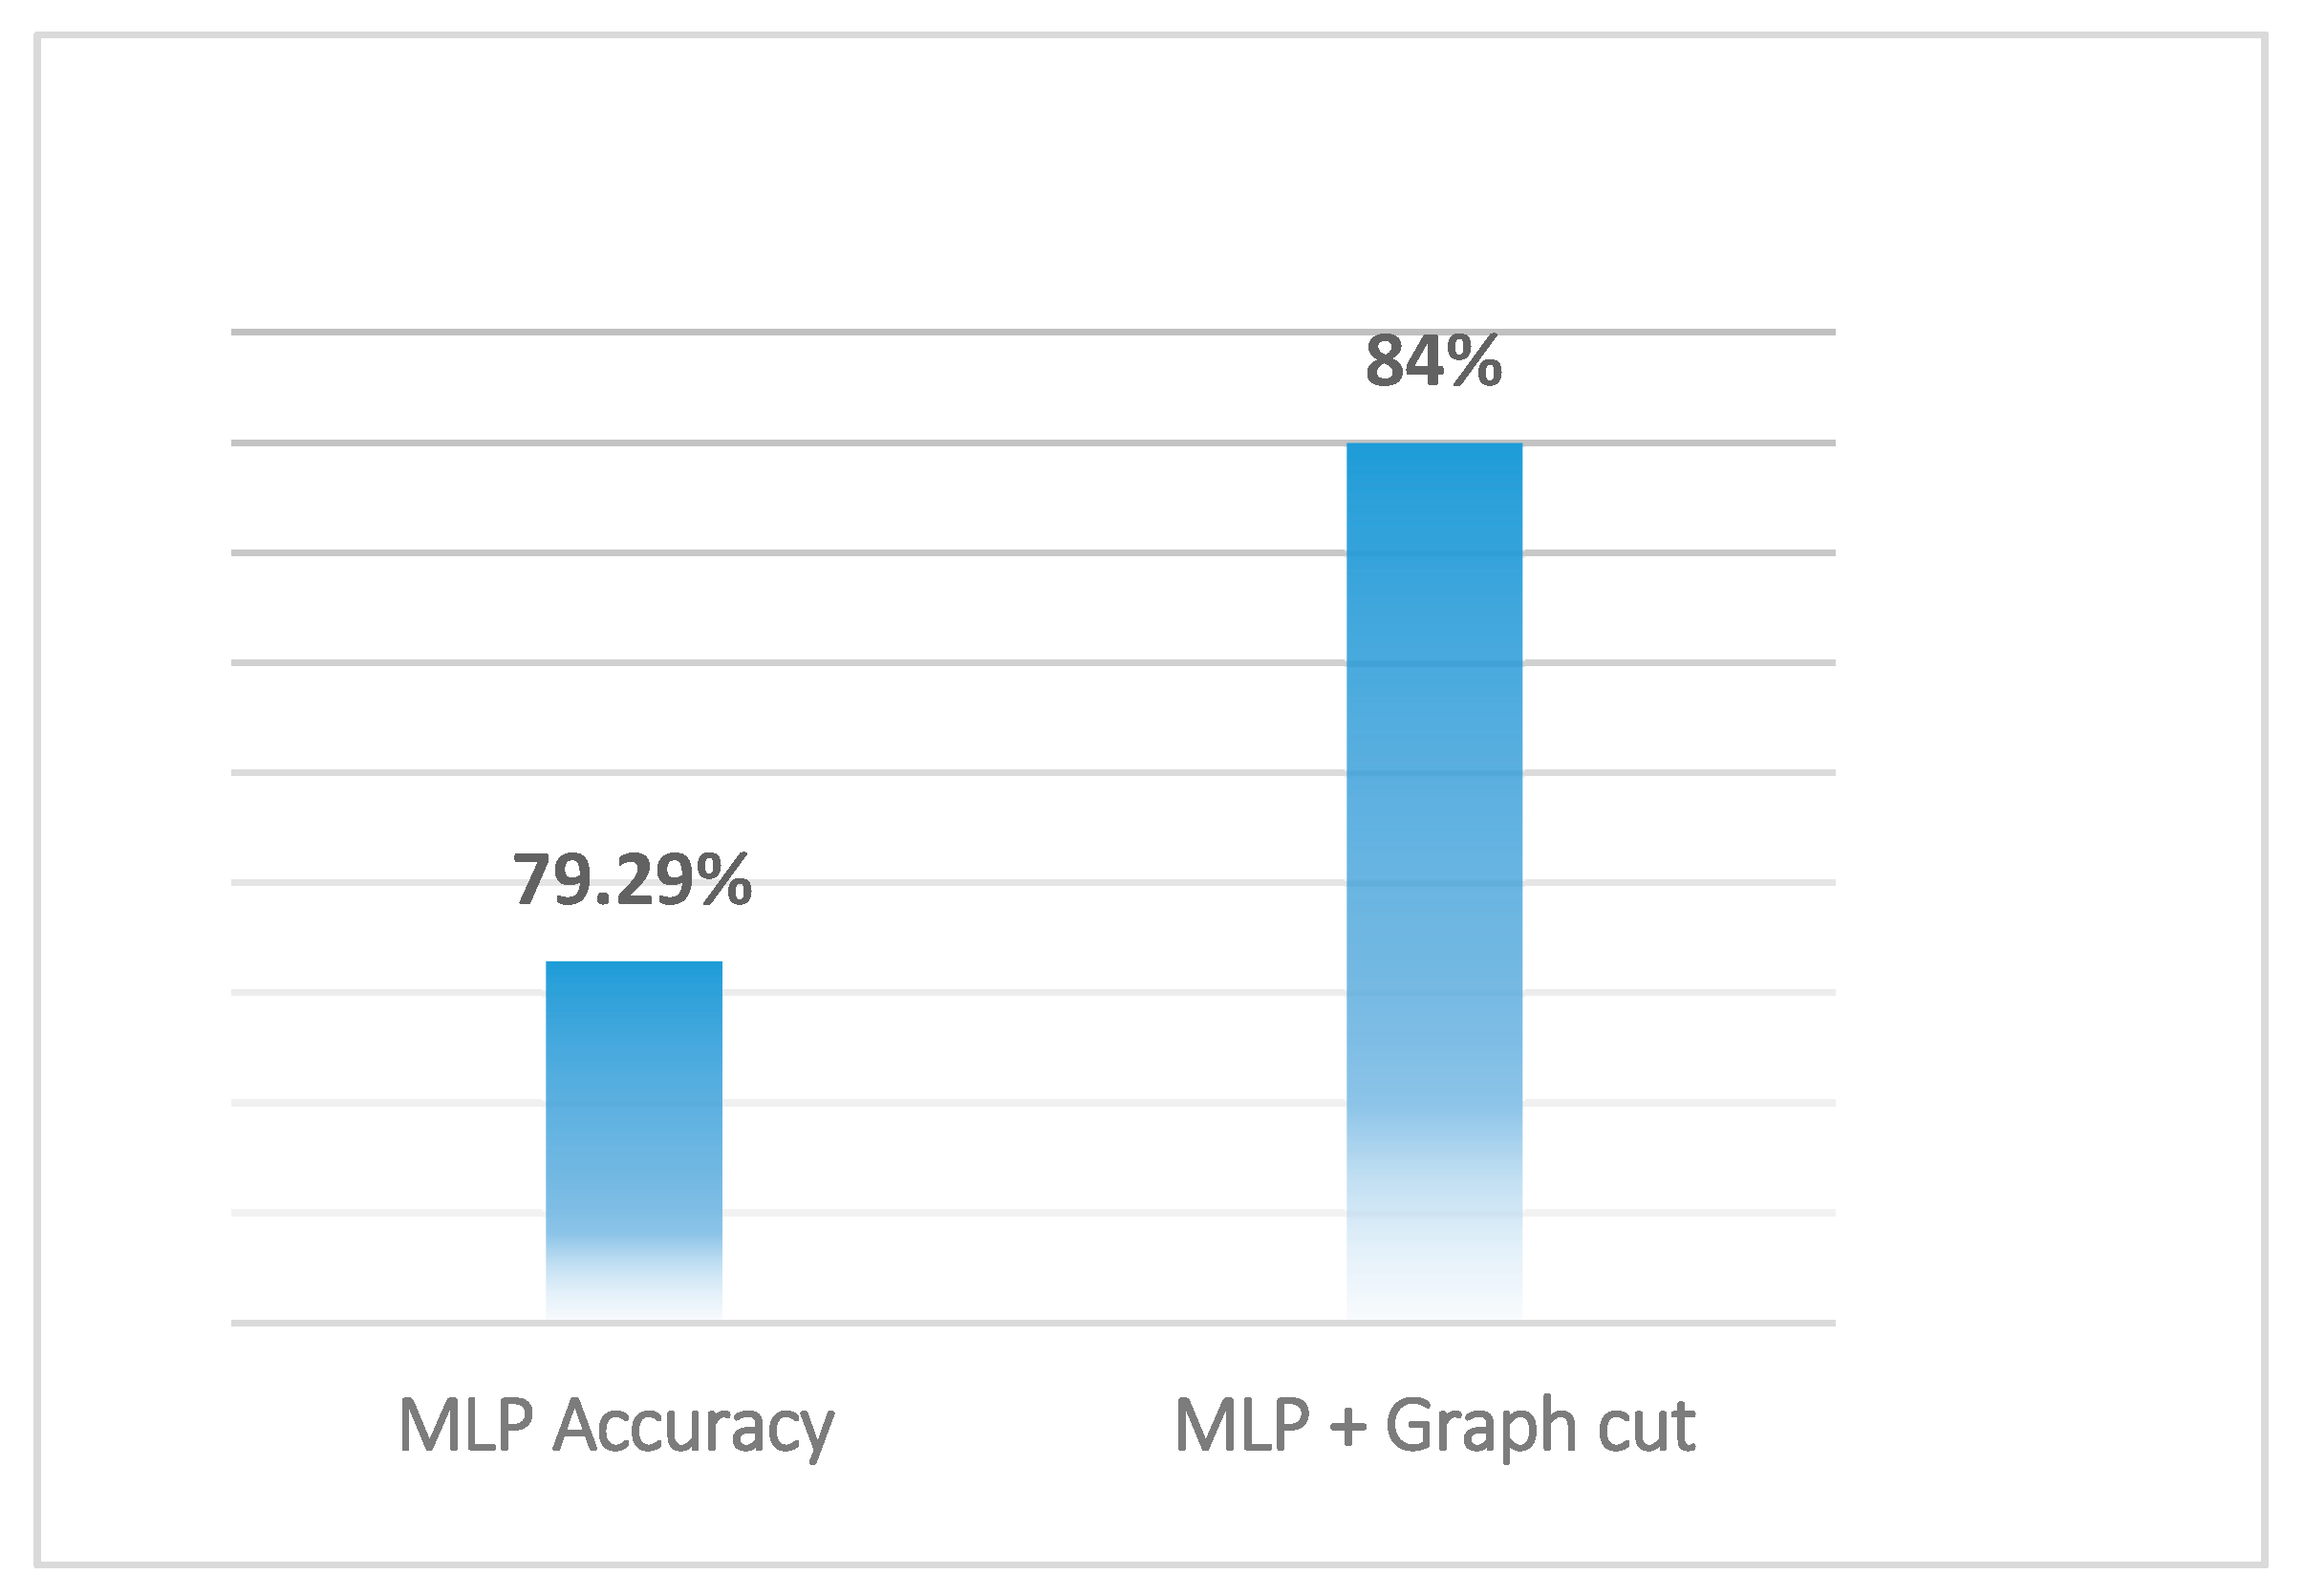
Based on the two previous subsections, we carried out the experiments for defect and non-defect detections in thermal images using MLP. Firstly, we discuss Figure 5 and Figure 6, which show the training phase of the MLP and the testing phase of the MLP, respectively. This training and testing is shown for comparative analysis. Figure 5 shows the training performance of MLP trained using the Levenberg–Marquardt (LM) algorithm. In Figure 5, in the training session, multilayer perceptron (MLP) neural network achieves an average of (from the five folds) 92.16%, 86.47% and 88.90% for specificity, sensitivity and accuracy, respectively. From the set of five folds, the performance of the fifth fold is highest for specificity, sensitivity and accuracy, which are 95.54%, 91.01% and 100%, respectively. For the testing in Figure 6, the same MLP gives 82.72%, 80.26% and 79.78% for specificity, sensitivity and accuracy, respectively. In this research, we are interested in accurate detections, that is, accuracy. Our results in the testing phase show an almost 80%-accurate model, which is enough for our application purposes in this project. However, as a contribution, we present an approach to enhance the defect detection performance in thermal images. We integrate the graph and the 79.78%-accurate MLP model into the setup to further make the proposed robustness. The proposed approach/algorithm is depicted in Figure 4. In this approach (Figure 4), we use the MLP model created already (in previous experiments) and represent it as the trained MLP model in the algorithm of Figure 4. We start with the thermal image, and based on the idea of weight calculation for [36], we calculate the two types of weight from the thermal image. One of the weights represents pixel strength, represented as “pixel weights” in Figure 4, and the other weight represents the neighborhood weight, represented as the “neighborhood weights” in Figure 4. These pixel weights are merged with the weights from the MLP model, which is the probabilistic output of the thermal image pixel value of MLP. Finally, the graph constructed from this combination is cut into defect and non-defect sections using the graph-cut algorithm of [35]. We tested this approach on thermal images and found that it increased the detection accuracy by more than 4%, as shown in Figure 7. With the algorithm of Figure 4, we get an accuracy of 84%. We believe this is a good contribution, as the normal classifiers, for example MLP, have limitations on correct detections due to training data and noise in the data. With the proposed algorithm of Figure 4, we successfully showed that a classifier output can be increased by combining with other modalities. The 84%-accurate detection shows the efficacy of our detection setup and requirements of the project.
5. Conclusions and Future Work
For autonomous and non-destructive fault detection in power substations, we have demonstrated the application of computer vision and machine learning to detect the problem in early stages of equipment breakdown. For this, we used the thermal images generated by an infrared camera. Therefore, our approach and contribution augments the non-destructive approach to defect analysis in electrical power equipment and shows the efficacy of the approach. We used a total of 150 thermal pictures of different electrical equipment in 10 different substations in operating conditions, using 300 different hotspots and using a total of eleven features. These features are first-order and second-order statistical features. For detection, our approach used the MLP to classify the thermal condition of components of power substations into “defect” and “non-defect” classes, achieving an accuracy of 79.78%. For performance enhancement, we adopted the graph cut to increase the accuracy to 84%. By using and augmenting the graph cut to increase performance, we argue that the successful development and deployment of our approach can play an important role in the quick and reliable inspection of power substations, and can potentially prevent power substation equipment failure, thus saving exponential costs. The 84% accuracy shows the efficacy of the proposed defect-analysis approach.
In the future, we plan to increase the performance of the defect analysis using a non-destructive approach to at least 90%. We also plan to investigate this area in light of deep learning, as it provides an accurate model and performance enhancements. One of the problems is the number of images available, and we hope to increase the number of images by visiting and analyzing other substations.
Acknowledgments
This work was supported by the National Natural Science Foundation of China (grant numbers 51477013) and the State Grid Shanxi Electric Power Company Jinzhong Power Supply Company. We are thankful to all our lab fellows for providing support during research experiments and for valuable suggestions.
Author Contributions
This paper is a result of the collaboration of all co-authors. Irfan Ullah was responsible for the modeling results and wrote most of the article. Fan Yang and Rehanullah khan conceived and revised the manuscript. Ling Liu and Bing Gao provided the theory. Haisheng Yang and Kia Sun supervised the project and helped in related most of the corrections.
Conflicts of Interest
The authors declare no conflict of interest.
Abbreviations
| IRT | Infrared thermography |
| ANN | Artificial neural network |
| MLP | Multilayer perceptron networks |
| SVM | Support vector machine |
| NETA | National Electrical Testing Association |
| NFPA | National Fire Protection Association |
| ASTM-E | American Society for Testing and Materials |
| RTF | Run to failure |
| MTTF | Mean time to failure |
| CB | Circuit breakers |
References
- Korendo, Z.; Florkowski, M. Thermography based diagnostics of power equipment. Power Eng. J. 2001, 15, 33–42. [Google Scholar] [CrossRef]
- Ge, Z.; Du, X.; Yang, L.; Yang, Y.; Li, Y.; Jin, Y. Performance monitoring of direct air-cooled power generating unit with infrared thermography. Appl. Therm. Eng. 2011, 31, 418–424. [Google Scholar] [CrossRef]
- Lahiri, B.B.; Bagavathiappan, S.; Jayakumar, T.; Philip, J. Medical applications of infrared thermography: A review. Infrared Phys. Technol. 2012, 55, 221–235. [Google Scholar] [CrossRef]
- Bougriou, C.; Bessäh, R.; Le Gall, R.; Solecki, J.C. Measurement of the temperature distribution on a circular plane fin by infrared thermography technique. Appl. Therm. Eng. 2004, 24, 813–825. [Google Scholar] [CrossRef]
- Balaras, C.A.; Argiriou, A.A. Infrared thermography for building diagnostics. Energy Build. 2002, 34, 171–183. [Google Scholar]
- Royo, R.; Albertos-Arranz, M.A.; Cárcel-Cubas, J.A.; Payá, J. Thermographic study of the preheating plugs in diesel engines. Appl. Therm. Eng. 2012, 37, 412–419. [Google Scholar] [CrossRef]
- Manana, M.; Arroyo, A.; Ortiz, A.; Renedo, C.J.; Perez, S.; Delgado, F. Field winding fault diagnosis in DC motors during manufacturing using thermal monitoring. Appl. Therm. Eng. 2011, 31, 978–983. [Google Scholar] [CrossRef]
- Titman, D.J. Applications of thermography in non-destructive testing of structures. NDT E Int. 2001, 34, 149–154. [Google Scholar]
- Al-Kassir, A.R.; Fernandez, J.; Tinaut, F.V.; Castro, F. Thermographic study of energetic installations. Appl. Therm. Eng. 2005, 25, 183–190. [Google Scholar]
- Jadin, M.S.; Taib, S. Recent progress in diagnosing the reliability of electrical equipment by using infrared thermography. Infrared Phys. Technol. 2012, 55, 236–245. [Google Scholar]
- Lizak, F.; Kolcun, M. Improving reliability and decreasing losses of electrical system with infrared thermography. Acta Electrotech. Inf. 2008, 8, 60–63. [Google Scholar]
- Gill, P. Electrical Power Equipment Maintenance and Testing; CRC Press: Boca Raton, FL, USA, 1988. [Google Scholar]
- Chou, Y.-C.; Yao, L. Automatic Diagnostic System of Electrical Equipment Using Infrared Thermography. In Proceedings of the SOCPAR ’09 International Conference of Soft Computing and Pattern Recognition, Malacca, Malaysia, 4–7 December 2009. [Google Scholar]
- Infraspection Institute. Standard for Infrared Inspection of Electrical Systems & Rotating Equipment; Infraspection Institute: Burlington, NJ, USA, 2008; pp. 1–18. [Google Scholar]
- National Fire Protection Association (NFPA). NFPA 750 Standard on Water Mist Fire Protection Systems 2006 Edition; Style (DeKalb, IL); National Fire Protection Association: Quincy, MA, USA, 2006. [Google Scholar]
- ASTM E1934—99a(2014) Standard Guide for Examining Electrical and Mechanical Equipment with Infrared Thermography. Available online: https://www.astm.org/Standards/E1934.htm (accessed on 22 September 2017).
- Manduchi, G.; Marinetti, S.; Bison, P.; Grinzato, E. Application of neural network computing to thermal non-destructive evaluation. Neural Comput. Appl. 1997, 6, 148–157. [Google Scholar] [CrossRef]
- Darabi, A.; Maldague, X. Neural network based defect detection and depth estimation in TNDE. NDT E Int. 2002, 35, 165–175. [Google Scholar] [CrossRef]
- Laurentys Almeida, C.A.; Braga, A.P.; Nascimento, S.; Paiva, V.; Martins, H.J.A.; Torres, R.; Caminhas, W.M. Intelligent thermographic diagnostic applied to surge arresters: A new approach. IEEE Trans. Power Deliv. 2009, 24, 751–757. [Google Scholar] [CrossRef]
- Shafi’I, M.A.; Hamzah, N. Internal fault classification using artificial neural network. In Proceedings of the 2010 4th International Power Engineering and Optimization Conference (PEOCO), Shah Alam, Malaysia, 23–24 June 2010; pp. 352–357. [Google Scholar]
- Rahmani, A.; Haddadnia, J.; Seryasat, O. Intelligent fault detection of electrical equipment in ground substations using thermo vision technique. In Proceedings of the 2010 2nd International Conference on Mechanical and Electronics Engineering (ICMEE), Kyoto, Japan, 1–3 August 2010; pp. V2-150–V2-154. [Google Scholar]
- Smedberg, M. Thermographic Decision Support—Detecting and Classifying Faults in Infrared Images. Master’s Thesis, Royal Institute of Technology, Stockholm, Sweden, 2006. [Google Scholar]
- Wretman, D. Finding Regions of Interest in a Decision Support System for Analysis of Infrared Images. Master’s Thesis, Royal Institute of Technology, Stockholm, Sweden, 2006. [Google Scholar]
- Huda, A.S.N.; Taib, S. Application of infrared thermography for predictive/preventive maintenance of thermal defect in electrical equipment. Appl. Therm. Eng. 2013, 61, 220–227. [Google Scholar] [CrossRef]
- Mendes, M.A.; Tonini, L.G.R.; Muniz, P.R.; Donadel, C.B. Thermographic analysis of parallelly cables: A method to avoid misdiagnosis. Appl. Therm. Eng. 2016, 104, 231–236. [Google Scholar] [CrossRef]
- Huo, Z.; Zhang, Y.; Sath, R.; Shu, L. Self-adaptive fault diagnosis of roller bearings using infrared thermal images. In Proceedings of the 43rd Annual Conference of the IEEE Industrial Electronics Society (IECON 2017), Beijing, China, 29 October–1 November 2017. [Google Scholar]
- Jeffali, F.; El Kihel, B.; Nougaoui, A.; Delaunois, F.; Manssouri, I. Thermal diagnotic of a rotating machine using the nondestructive technique of infrared thermogrphy. J. Nat. Sci. Sustain. Technol. 2015, 10, 219–232. [Google Scholar]
- Łopata, S.; Kocot, M. The conditions for thermographic testing of thermal power engineering installations. Czasopismo Techniczne 2017, 10, 179–192. Available online: http://www.ejournals.eu/Czasopismo-Techniczne/ (accessed on 28 November 2017).
- Liu, H.; Xie, T.; Ran, J.; Gao, S. An Efficient Algorithm for Server Thermal Fault Diagnosis Based on Infrared Image. J. Phys. Conf. Ser. 2017, 910, 012031. [Google Scholar] [CrossRef]
- The Basics of Predictive/Preventive Maintenance—Google Search. Available online: assets.tequipment.net/assets/1/26/Documents/Ti30predictive_maint.pdf (accessed on 2 July 2017).
- Fluke Corporation. The Basics of Predictive/Preventive Maintenance; Fluke Corporation: Everett, WA, USA, 2005; pp. 1–6. [Google Scholar]
- FLIR Advanced Thermal Solutions: FLIR T600 Series Infrared Cameras for Research & Science. Available online: http://www.flir.com/science/display/?id=46818 (accessed on 22 September 2017).
- Haykin, S. Neural Networks: A Comprehensive Foundation, 1st ed.; Herrmann, M., Bauer, H.-U., Der, R., Eds.; IEEE Press: New York, NY, USA, 1994; pp. 107–116. [Google Scholar]
- Schaffer, C. Selecting a classification method by cross-validation. Mach. Learn. 1993, 13, 135–143. [Google Scholar] [CrossRef]
- Boykov, Y.; Kolmogorov, V. An experimental comparison of min-cut/max-flow 193 algorithms for energy minimization in vision. IEEE Trans. Pattern Anal. Mach. Intell. 2004, 26, 1124–1137. [Google Scholar] [CrossRef] [PubMed]
- Micusík, B.; Hanbury, A. Automatic image segmentation by positioning a seed. Eur. Conf. Comput. Vis. 2006, 3952, 468–480. [Google Scholar]
Figure 1.
Sample thermal image with hot and cold points.

Figure 2.
Sample thermal image with possible expected defects.
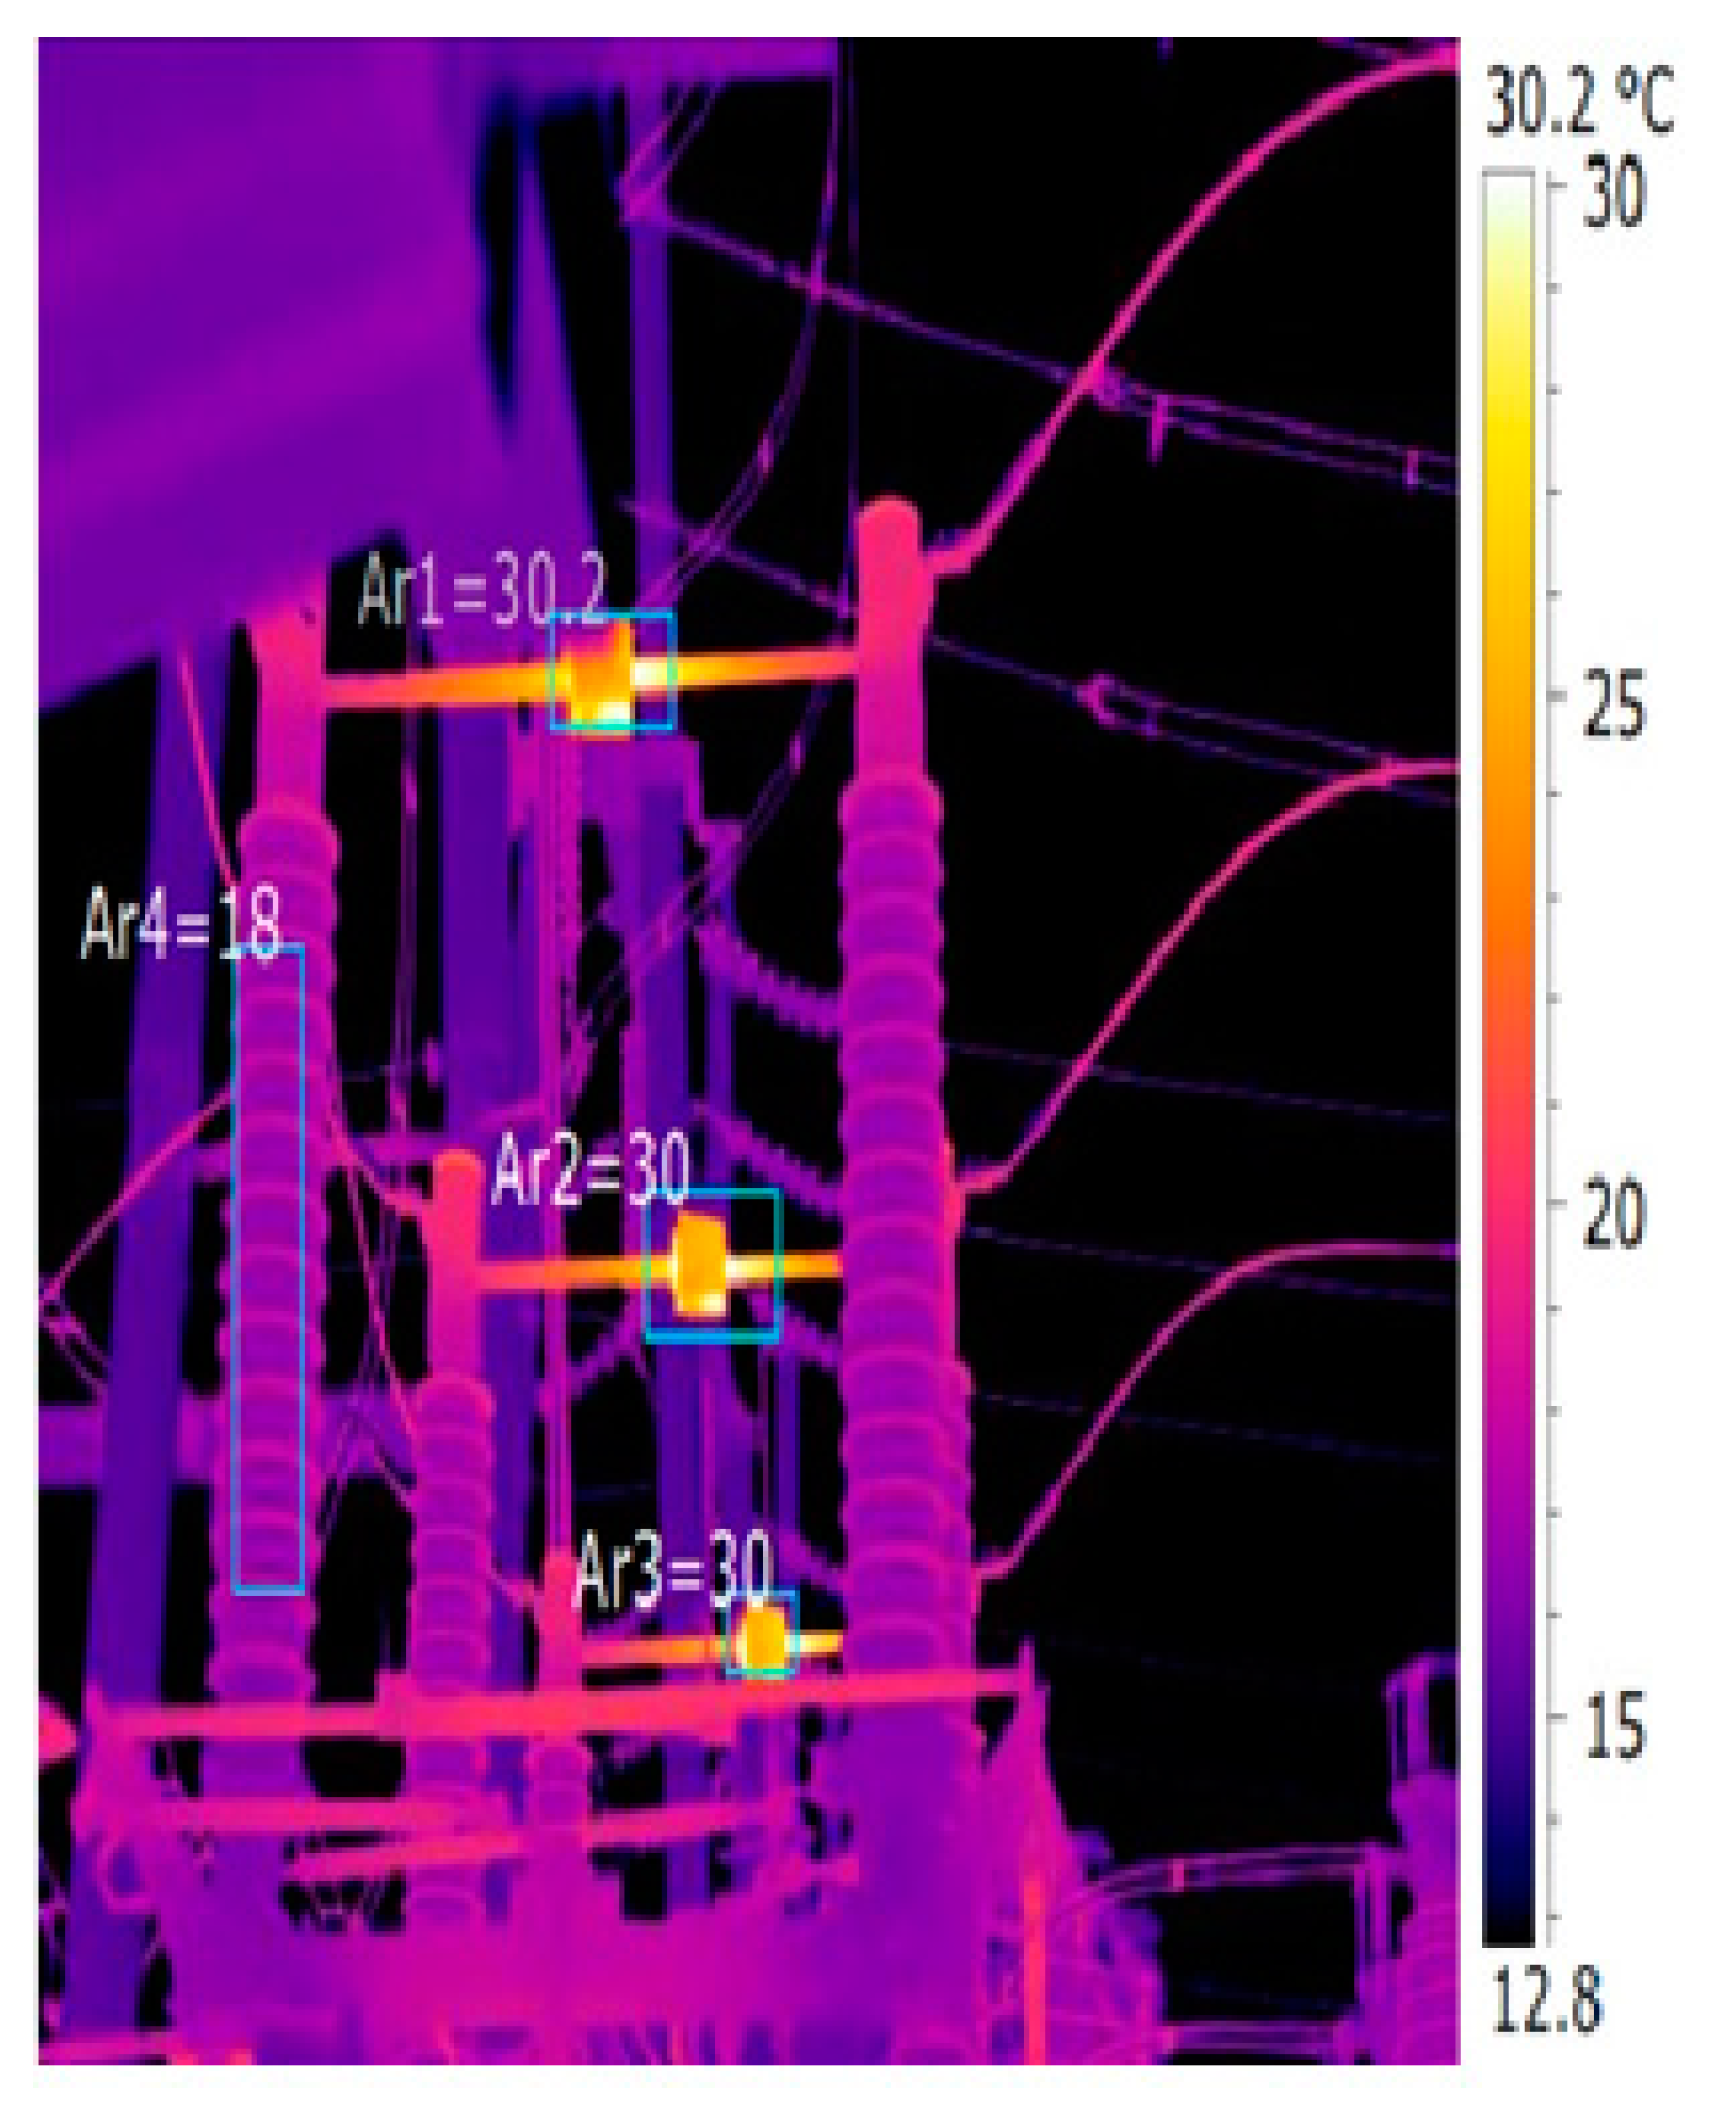
Figure 3.
Standard MLP model.

Figure 4.
Generic diagram to improve accuracy of the defect/non-defect detections.

Figure 5.
Training stage performance.
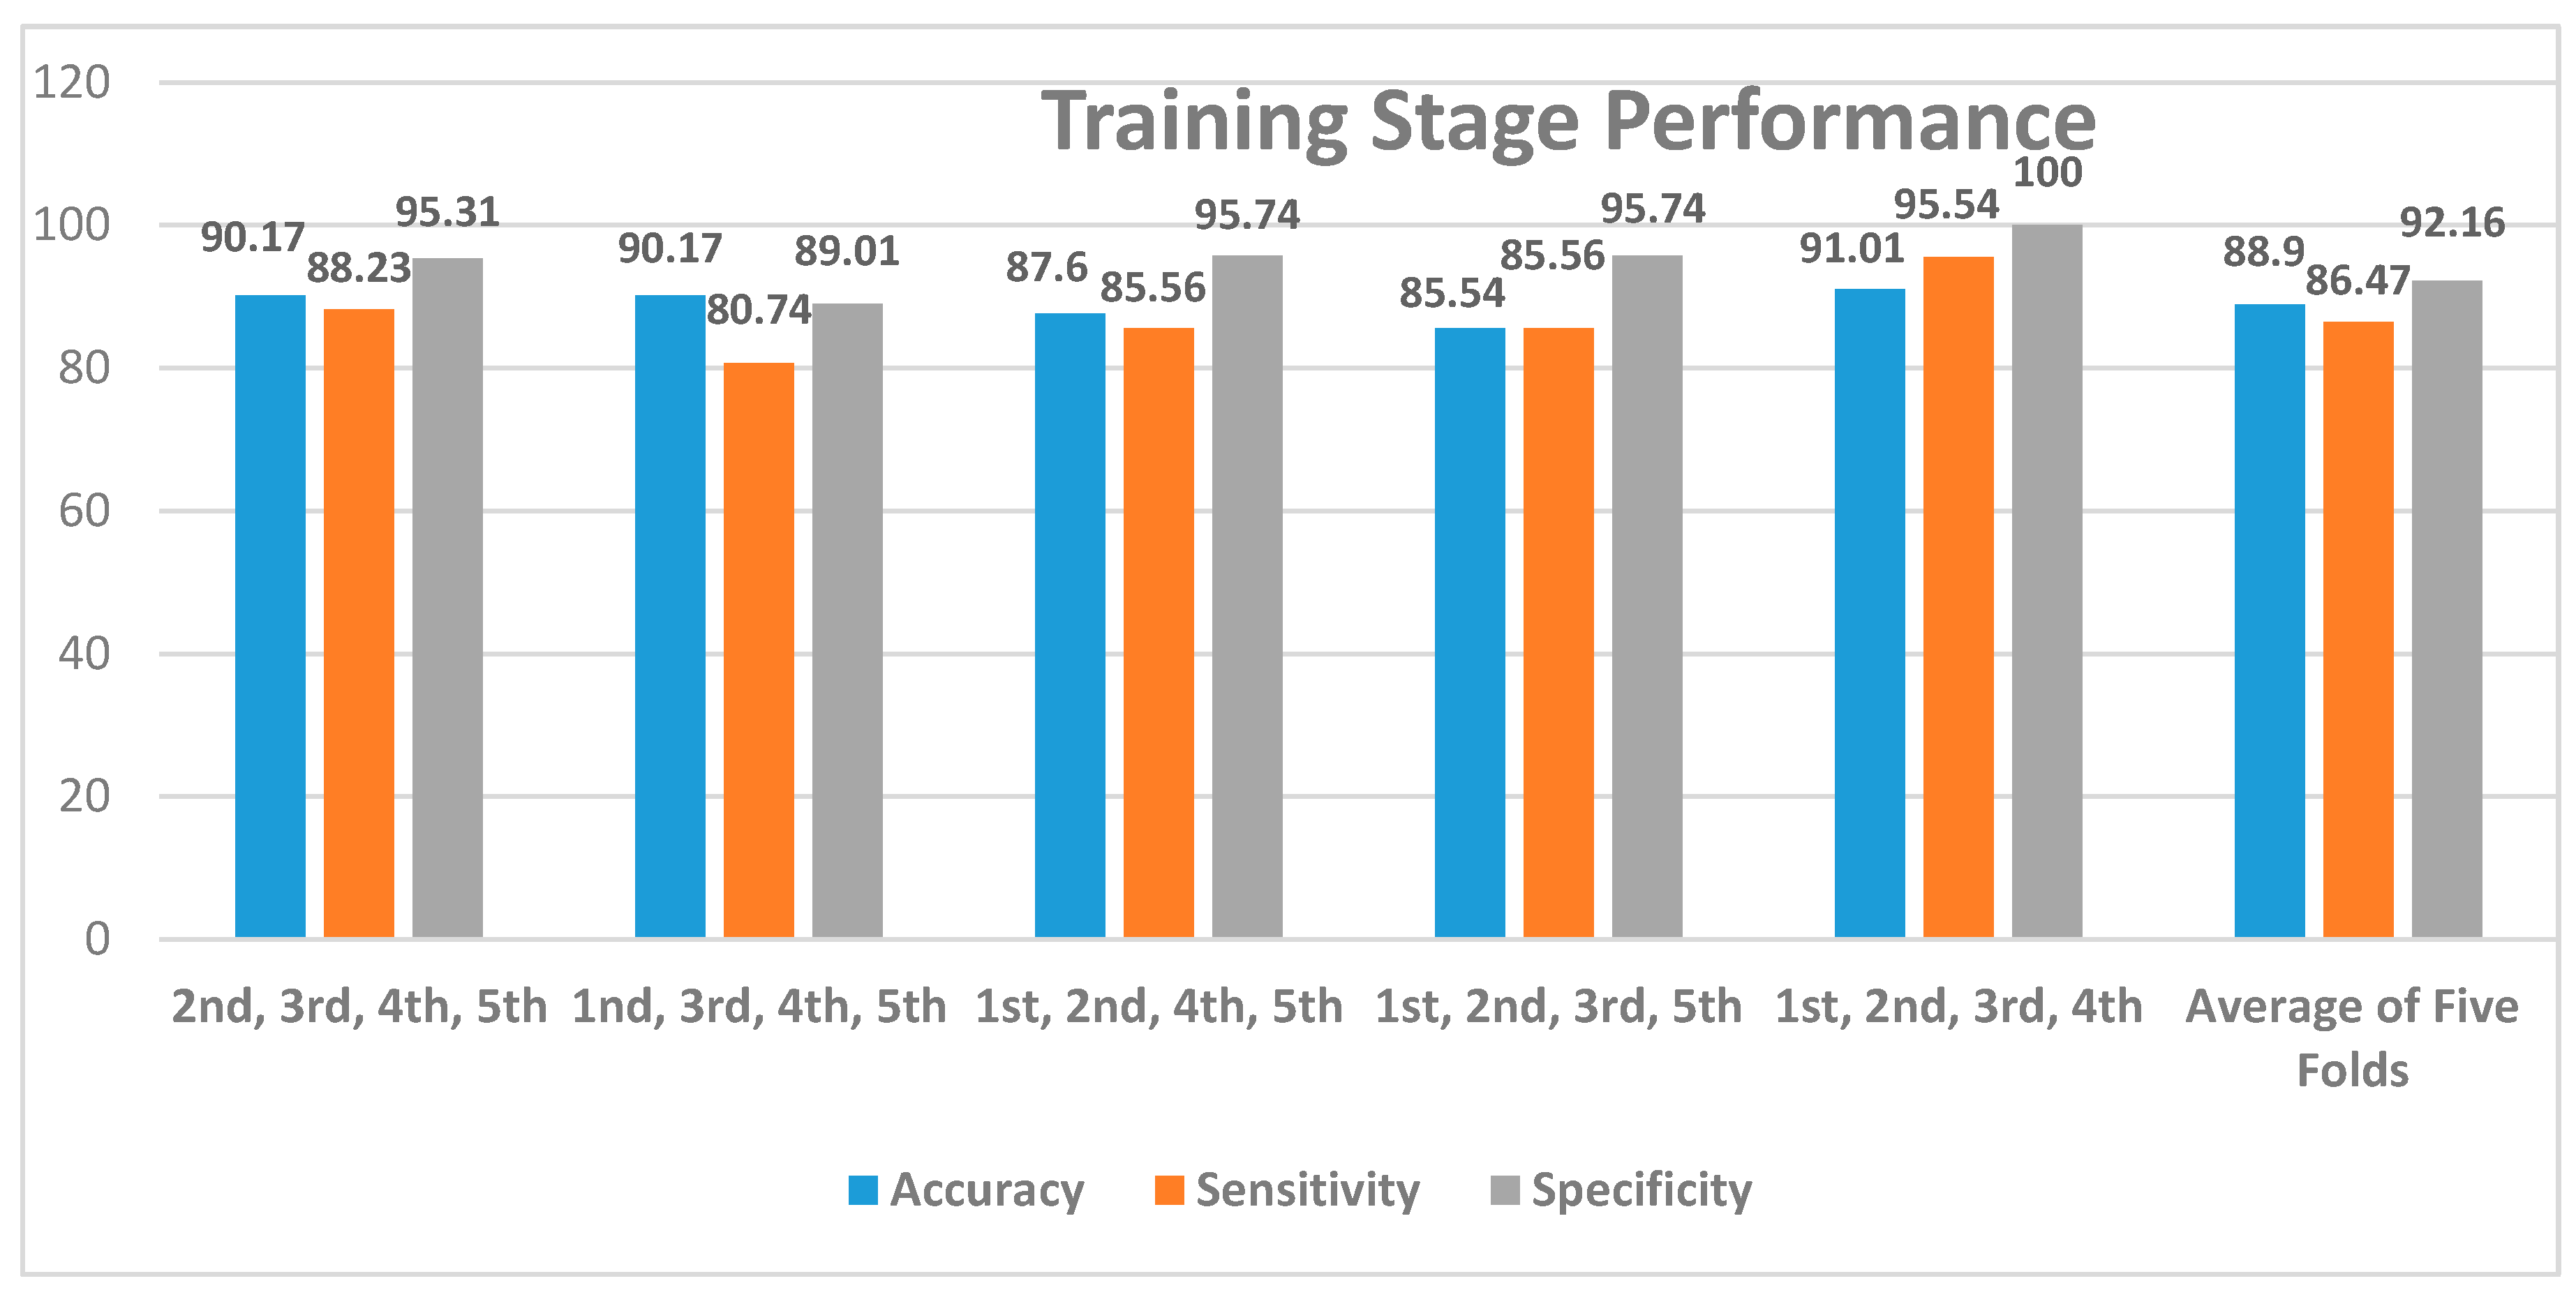
Figure 6.
Testing stage performance.
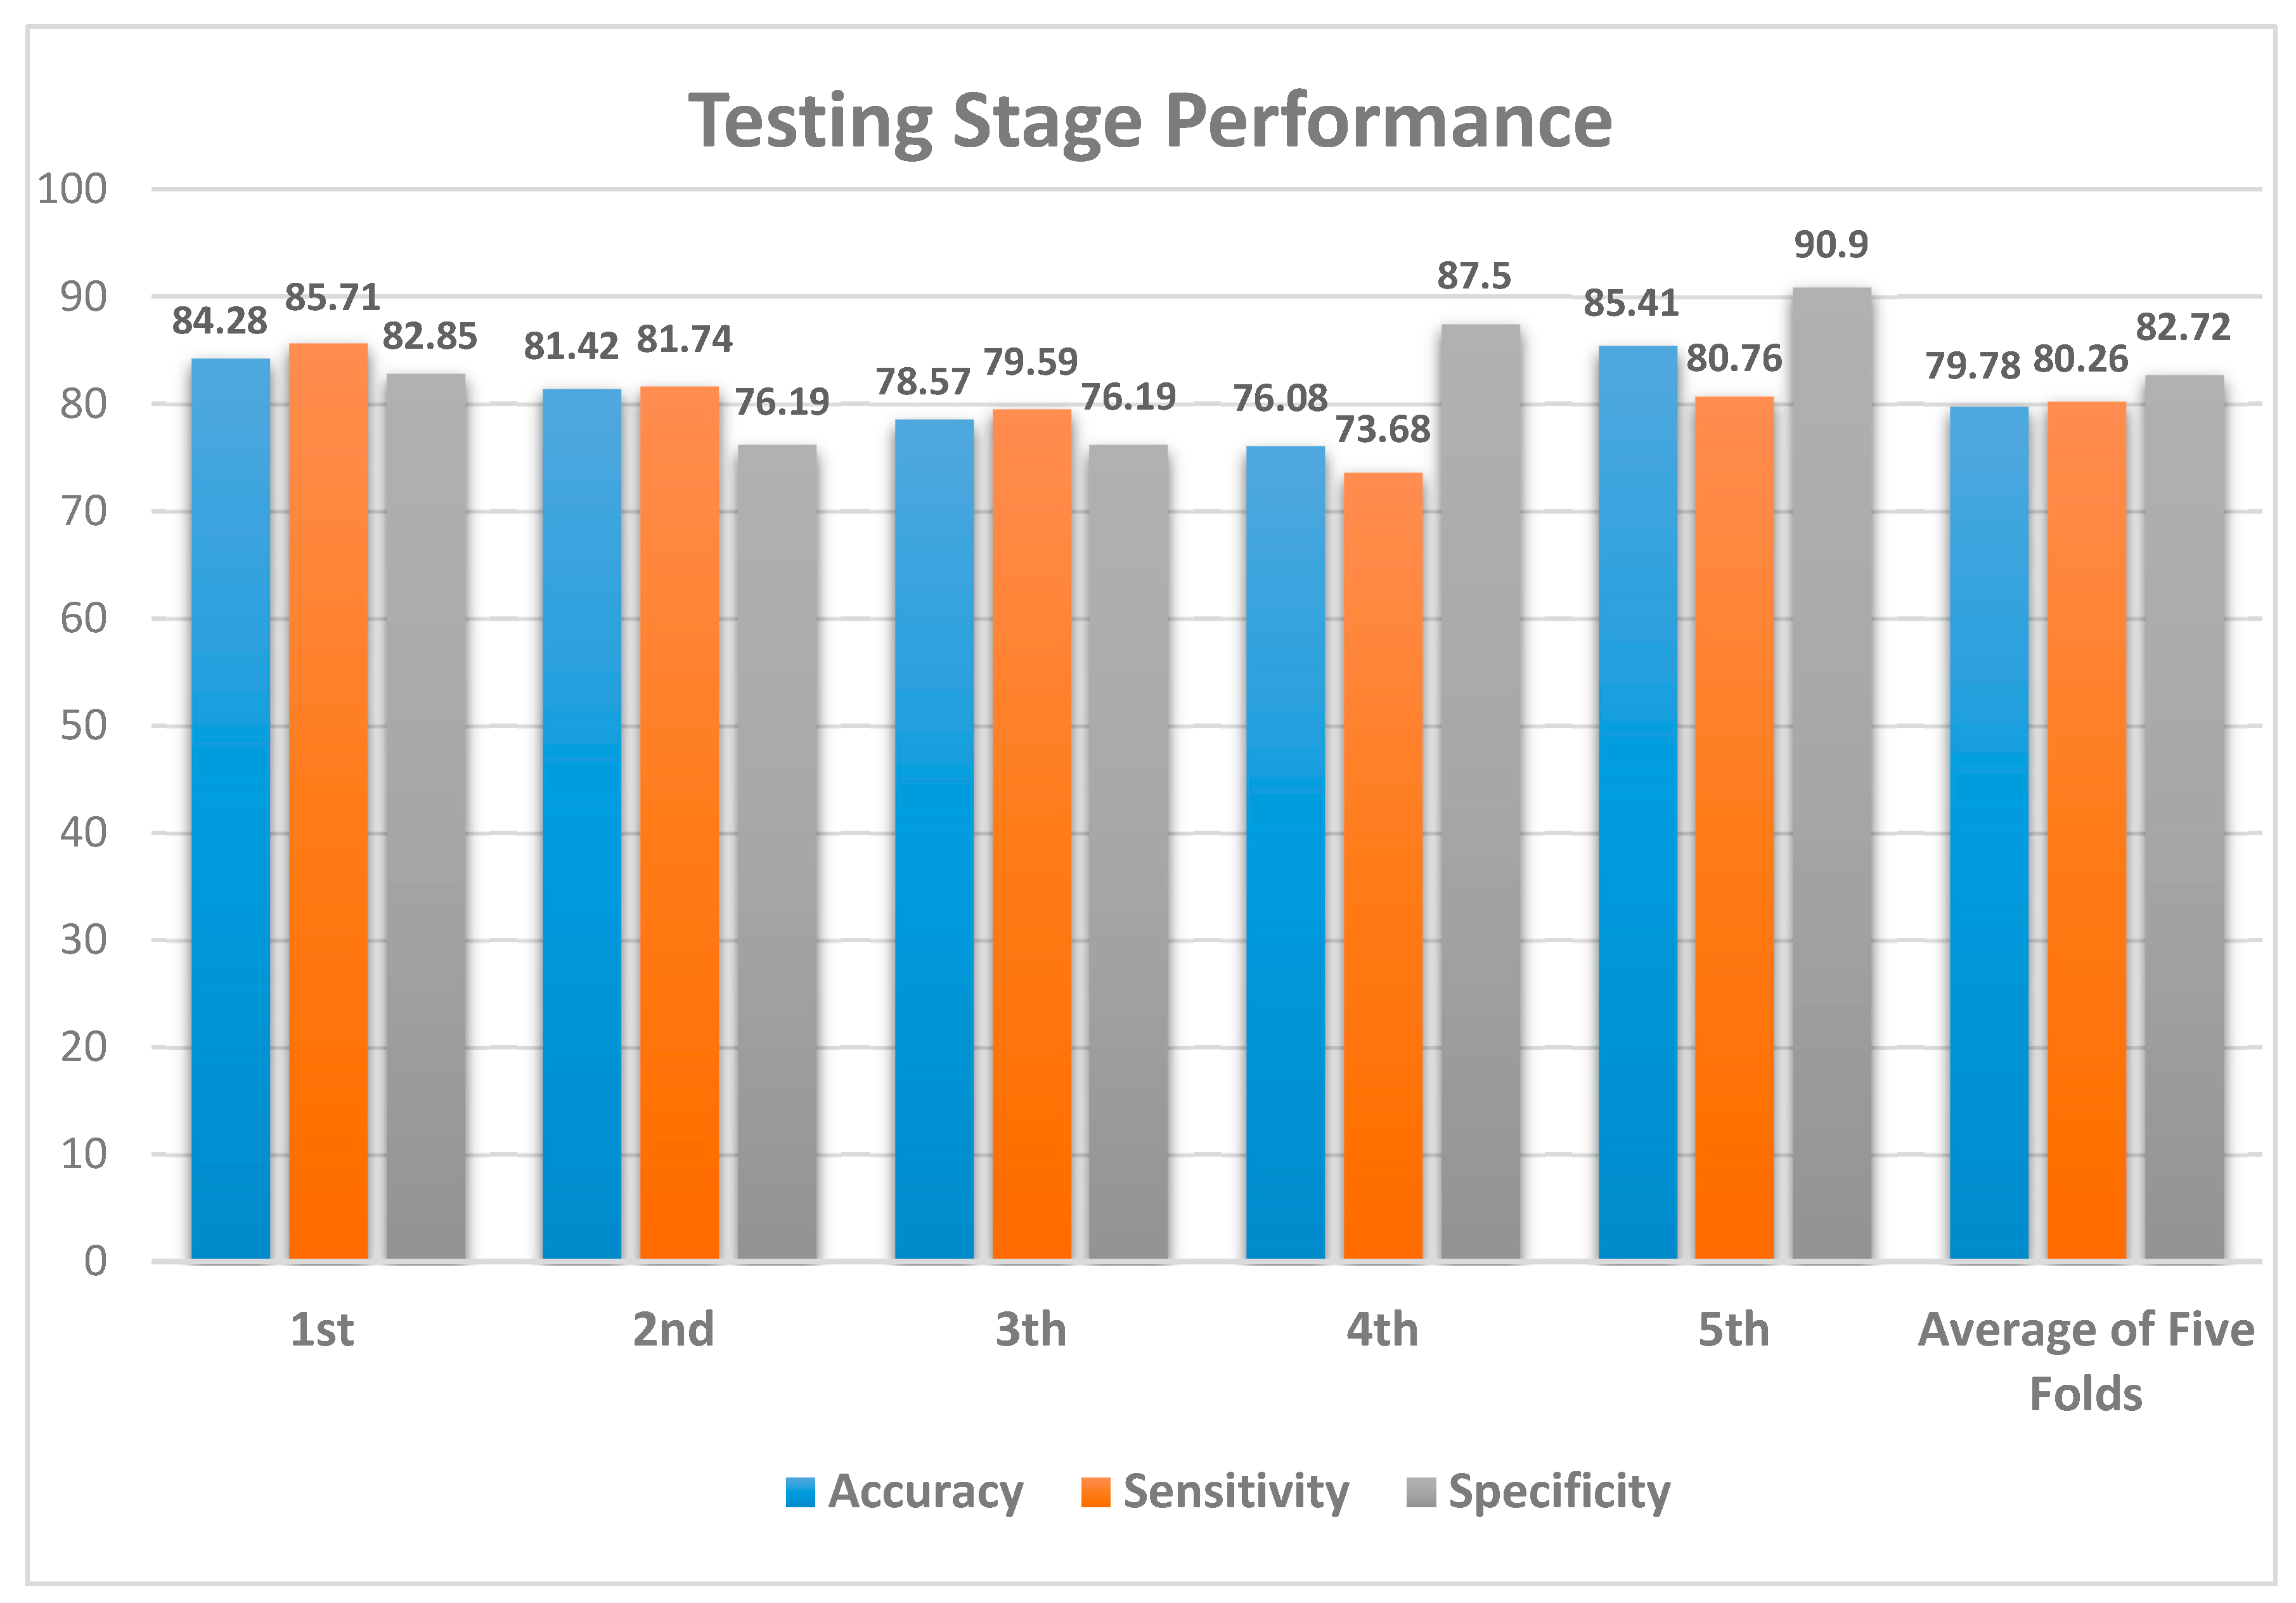
Figure 7.
Performance comparison of MLP and MLP with graph cut.

Table 1.
Three categories of investigations with recommended suggestions.
| Class of Equipment | ΔT (°C) | Recommended Suggestions |
|---|---|---|
| Non-Defective Equipment Defective Equipment | <16 >25 16 < T < 25 | Normal equipment section Defected area of equiment, repair instantly Minor defect, check on specific area of equipment |
Table 2.
List of extracted features used in experiments.
| Feature Kind | Feature | Abbreviation |
|---|---|---|
| First-order histogram-based features | Mean | B1 |
| Variance | B2 | |
| Standard deviation | B3 | |
| Skewness | B4 | |
| Kurtosis | B5 | |
| Energy | B6 | |
| Entropy | B7 | |
| Gray-Level Co-Occurrence Matrix (GLCM) features | Contrast | B8 |
| Correlation | B9 | |
| Homogeneity | B10 | |
| Energy | B11 |
Table 3.
Data samples and their distribution in classes.
| Folds | Defect Class | Non-Defect Class | Total |
|---|---|---|---|
| 1st Fold | 50 | 20 | 70 |
| 2nd Fold | 60 | 10 | 70 |
| 3rd Fold | 40 | 30 | 70 |
| 4th Fold | 30 | 15 | 45 |
| 5th Fold | 20 | 25 | 45 |
| Total | 200 | 100 | 300 |
© 2017 by the authors. Licensee MDPI, Basel, Switzerland. This article is an open access article distributed under the terms and conditions of the Creative Commons Attribution (CC BY) license (http://creativecommons.org/licenses/by/4.0/).
Share and Cite
MDPI and ACS Style
Ullah, I.; Yang, F.; Khan, R.; Liu, L.; Yang, H.; Gao, B.; Sun, K. Predictive Maintenance of Power Substation Equipment by Infrared Thermography Using a Machine-Learning Approach. Energies 2017, 10, 1987. https://doi.org/10.3390/en10121987
AMA Style
Ullah I, Yang F, Khan R, Liu L, Yang H, Gao B, Sun K. Predictive Maintenance of Power Substation Equipment by Infrared Thermography Using a Machine-Learning Approach. Energies. 2017; 10(12):1987. https://doi.org/10.3390/en10121987
Chicago/Turabian StyleUllah, Irfan, Fan Yang, Rehanullah Khan, Ling Liu, Haisheng Yang, Bing Gao, and Kai Sun. 2017. "Predictive Maintenance of Power Substation Equipment by Infrared Thermography Using a Machine-Learning Approach" Energies 10, no. 12: 1987. https://doi.org/10.3390/en10121987
Note that from the first issue of 2016, this journal uses article numbers instead of page numbers. See further details here.