Energy Performance and Economic Feasibility Study of Historical Building in the City of Matera, Southern Italy

Department of European and Mediterranean Cultures, University of Basilicata, 85100 Potenza, Italy
*
Author to whom correspondence should be addressed.
Energies 2017, 10(12), 2009; https://doi.org/10.3390/en10122009
Submission received: 29 August 2017
/
Revised: 31 October 2017
/
Accepted: 22 November 2017
/
Published: 1 December 2017
(This article belongs to the Section L: Energy Sources)
Abstract
:In this paper a careful energy audit and an energy restoration of some historical buildings was performed. In particular, three cultural heritages buildings situated in the city of Matera in Southern Italy were analysed. To analyse these buildings, an integrated approach based on measurements in situ and on dynamic energy simulations was used. Then, some energy efficiency actions were performed, safeguarding the authenticity value of these structures. The thermal conductance, the indoor temperature and the energy consumption were measured in situ and then the numerical virtual model was created by the Energy Plus code (Energy Plus is free, open-source, and cross-platform developed by the U.S. Department of Energy’s and Building Technologies Office) (U.S. Department of Energy’s (DOE) Building Technologies Office (BTO), Washington, DC, USA). The numerical model was validated by using the Inequality Coefficient (IC) and then different parametric energy analyses were performed. The paper analysed different energy improvements and a techno-economic feasibility study was performed for each improvement. This analysis was conducted in dynamic regime by using the Energy-Plus code. In these buildings the thermal system improvements have a better payback time than envelope improvements. Two different thermal system improvements were analysed: the absorption heat pump with thermostatic valves and the compression heat pump with fan coil unit. Moreover, the replacement of present lighting with LED technologies has a payback time near one year.
1. Introduction
The building sector is responsible for 40% of overall EU energy consumption. The building stock is continuing to expand and this is increasing energy consumption. Thus, energy consumption reduction and the use of renewable energy sources in the building sector are important needed actions to decrease the EU's energy dependency and greenhouse gas emissions. In the Italian building stock 78% of the buildings were constructed before 1977, the year the first energy Italian law was passed [1]. The percentage of ancient Italian building stock is 89% considering the latest energy Law 10/’91 [2]. Law 10/’91 defines envelope limits; then these limits were modified by Legislative Decree 192/2005 [3]. The requalification, even if only a fraction of the buildings was constructed before 1991, would be an important step towards meeting the Europe 2020 Strategy objectives [4]. The benefits relate to different fields such as environment, life quality, safety and economy for the individual user and country. Performing energy analyses of existing buildings, especially those that are part of the historical, archaeological and architectural heritage, is the key to reduce the impact of inefficient energy use and to ensure the conservation and protection of historic centers.
Until now the Italian regulatory framework, in accordance with the guidelines published by the European community, allows exceptions for such buildings when there is “a substantial alteration of their character or appearance, with particular reference to historical profiles, and artistic landscape” [3].
The importance of improving the energy efficiency of these buildings was introduced by Ministry of Cultural Heritage and Activities and Tourism (Italy), with the publication of the corresponding guidelines [5].
The envelope is an important aspect in low energy consumption building design. This is the factor most responsible for the heat loss and solar gain, allowing the ingress of natural daylight and influencing the indoor comfort conditions. To design a building envelope, it is necessary to consider often contradictory aspects such as heating, cooling and natural and artificial lighting. For example, it is desirable to allow high levels of natural light without solar gains which are too high during the summer. At the same time, it is necessary to ensure an adequate amount of solar gains during winter for the reduction of heating loads. Therefore, an efficient configuration cannot focus on a single aspect, but it must consider all aspects at the same time, examining all the interactions between the different sources of energy consumption. For example, the application of some energy improvements to the existing building stock can improve the energy performance of the whole building sector. Some authors have investigated the most common retrofit solutions used in Italy, focusing in particular on the energy performance of historical building envelopes [6]. Energy performance analyses were conducted for two typical base cases in four different Italian cities using the TRNSYS software, and some common retrofit measures were analysed. In [7] the authors analysed an energy upgrade proposal of a historical building located in Naples (Italy). A few energy efficiency interventions on the building envelope and its plants were performed. This paper shows how the choice of compatible solutions to improve the energy efficiency requires accurate analyses from different points of view such as preservation and architectural aspects. In [8] the authors presented an approach for assessing the economic performance of different retrofit solutions performed in residential buildings in a temperate-humid climate. The authors analysed typical residential buildings in Istanbul, then an economic impact analysis was performed by considering the costs during their life cycle phases. The lifecycle cost assessment is done according to the following variables: window-to-wall ratio (WWR), window system, thermal insulation material, orientation and building age. The authors demonstrated that the insulating exterior wall, projected floors, floors above unheated space and roof floors separately provide the highest benefits at the age of 30, and the lowest benefits occur at the age of 15 for all WWRs.
In the paper [9] was investigated the impact of different kinds of glazing systems , window size, orientation of the main windowed facade and internal gains on winter and summer energy need and peak loads of a well-insulated residential building. The climatic data of four localities of central and southern Europe have been considered: Paris, Milan, Nice and Rome. A statistical analysis has been performed on the results in order to identify the most influencing parameters.
In [10] by using a multi-disciplinary research approach, the authors analysed the sustainability of different energy improvement solutions of the huge historical (XVII–XIX century) complex of the “Albergo dei Poveri” in Genoa. The results allowed them to show that better results can be reached in the environmental sustainability certification by means of added not strictly needed, but allowed actions. A proposal of a methodological approach to the sustainability evaluation for historic building renovation was the main outcome of this research.
In [11] the authors investigated the thermal performance of seven types of insulation on a historic brick wall, by using heat flux sensors, external and internal wall temperature sensors and a thermal imaging survey. Thermal paint, aerogel, cork lime, hemp lime, calcium silicate board, timber fibre board and Polyurethane foam board were all analysed. This research demonstrated that, in-situ, insulations underperform compared to their manufacturer’s specified properties (wall U-value higher by 13–25% with the exception of cork lime). This is attributed to the differences between real in-situ environments compared to ideal testing laboratory conditions.
Moreover, in [12] a historical building situated in Pisa (Italy) and used as public offices was investigated. The authors investigated in particular an energy audit of the lighting system. These interventions have a short payback time, that varies between 4 and 34 months, allowing a reduction of the electrical energy consumption for the artificial indoor and outdoor lighting variable from 1.1 MWh/year to 39.0 MWh/year.
In this work we analyse the energy performance and the economic feasibility study of three historical building located in the historical center of Matera, a city of some 60,000 inhabitants located in the Basilicata region if Southern Italy. These buildings are used for school activities and most students spend more than half of their time (about 80% of a day) in these buildings.
Until now energy audits on historical buildings typically underestimated the passive energy characteristics of these buildings and their behaviour in relationship to the real external climatic conditions, and in some cases, the introduction of inadequate or excessive technological systems produce more problems. Through an hourly dynamic energy simulation, it is now possible to assess the real effects produced from different energy efficiency interventions and recovery interventions in general. Using a dynamic model, it is possible to optimize the building-plant system performance and to evaluate the impact of each choice will have on the building performance and on investment and operating costs.
2. Research Aim and Methodology
The present research describes a method to analyse the energy performance of some historical buildings situated in Southern Italy. This method can be divided into three steps: in the first step different monitoring campaigns were performed in situ, in the second step we created a numerical computing model and we performed some dynamic analyses, in the third and final step some energy improvements were analysed. In the end an economic feasibility study was performed for the different energy improvements used where the payback time was calculated.
In particular, in this paper three historical buildings situated in the town of Matera (Southern Italy) were analysed. Two different monitoring campaigns were performed: an energy consumption monitoring campaign and a thermal conductance monitoring campaign of walls.
The energy consumption was measured for four years and then, the mean value was considered. On the other hand, the thermal conductance was measured continuously for 10 days in 15 min steps according the ISO 9869:2014 standard.
In the first step the values measured were used to create a numerical virtual model by using the Design-Builder software (Design Building is a software that use the energy plus code to measure the performance of buildings.). This software uses the Energy-Plus code to analyse the buildings and their thermal systems in dynamic regime. By comparing the measured and simulated values the virtual numerical model was validated, and then, a good energy audit was obtained.
In the third step a few energy improvements were analysed: the building envelopes’ thermal systems and electric consumption improvements. For all improvements we performed an economic feasibility study and we also calculated the payback time.
3. Technical and Historical Characteristics of the Case Studies
The region of Matera is situated in southern Italy and it has a unique morphology characterized by of valleys, canyons and plateaus of sandstone calcarenite. The site has an altitude of 401 m above the sea level. Historically, Matera has hosted different civilizations since the Paleolithic to the present day.
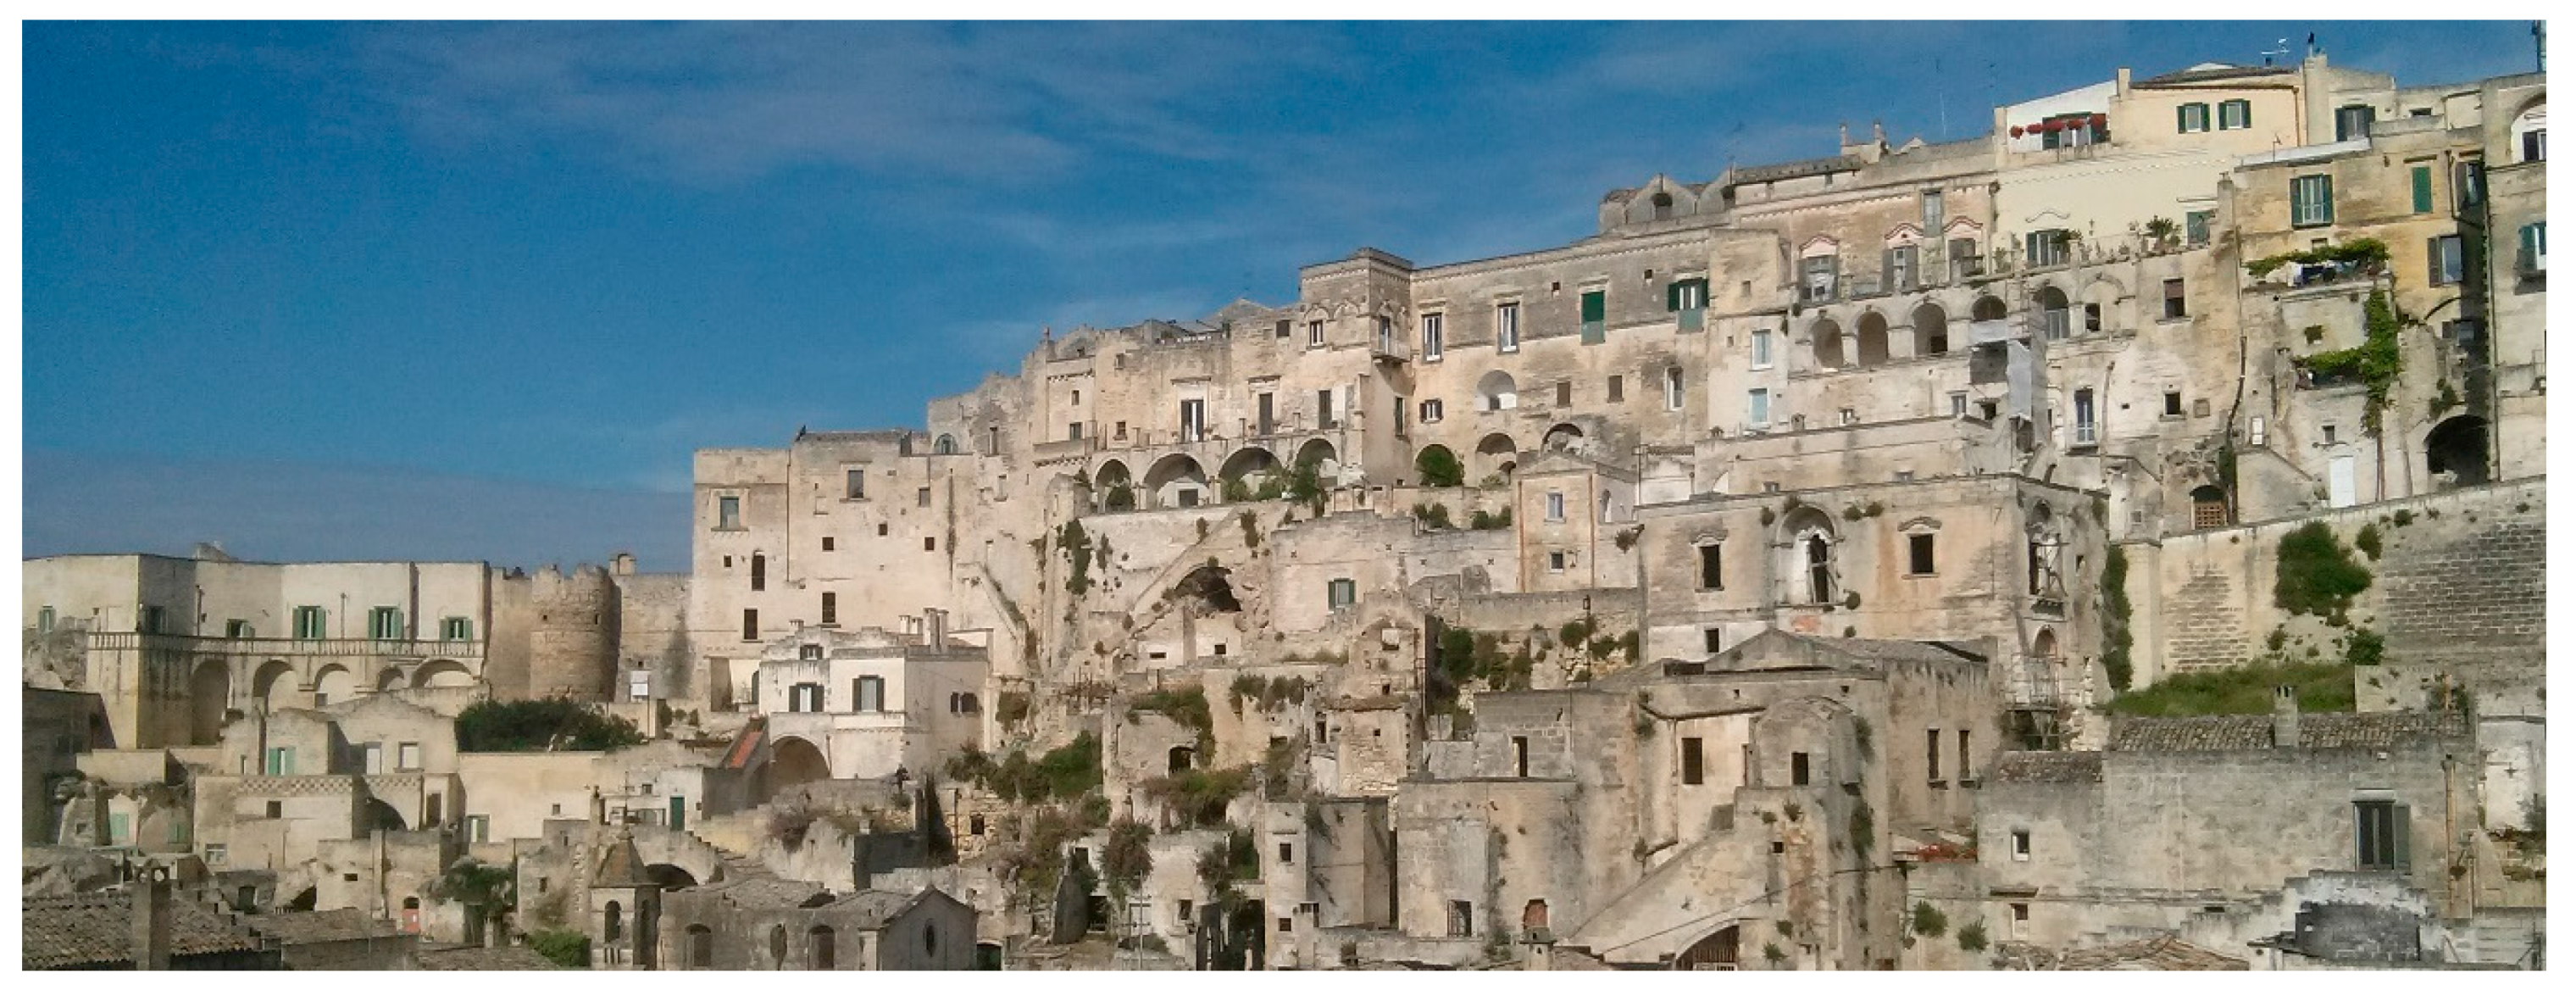
The ancient town of Matera is called Sassi (a UNESCO Heritage site since 1993) and it is divided into two neighbourhoods: the Sasso Barisano and the Sasso Caveoso. The fortified centre of the town (the Civita) was built between the two Sassi upon a hill, where the cathedral and the aristocratic buildings were situated (Figure 1).
Matera, fortified by the Lombards, began to develop around the natural acropolis of the “Civita”. With the arrival of the Normans in Matera the feudal era began, which had as its urban setting the rigid demarcation of the fortified town with moat and castle walls. In the sixteenth century the city grew, shifting the centre of gravity of the city from the “Civita” to the new “Piazza Maggiore”, now called “Piazza Sedile”. The Sassi’s buildings were built by using the natural locally available resources. These complex structures use simple bioclimatic systems, like a thermal mass or natural ventilation, to guarantee the comfort indoor. Moreover, in these buildings there are ingenious rainwater collection systems. The neighbourhood architectural structure consists of two systems typologies, essential for the life and wealth of the community: one, immediately visible, created from successive layers of houses, courtyards, galleries, palaces, churches, streets, gardens; and the other more inner, invisible at first sight, consisting of tanks, caves, tunnels and water control systems.
The Matera region has a Mediterranean climate, characterized by temperate winters, with a minimum temperature near to zero and warm summers, with maximum temperatures higher than 40 °C.
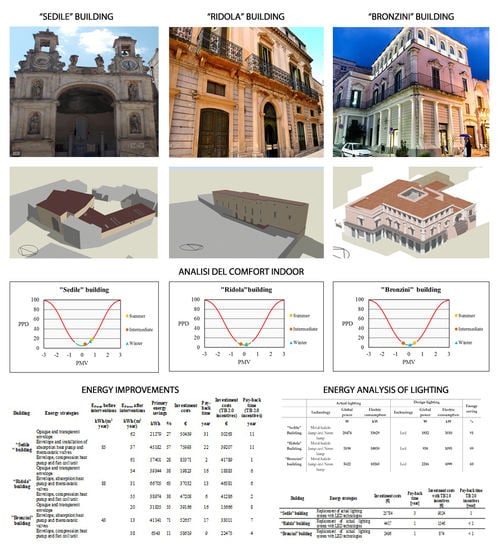
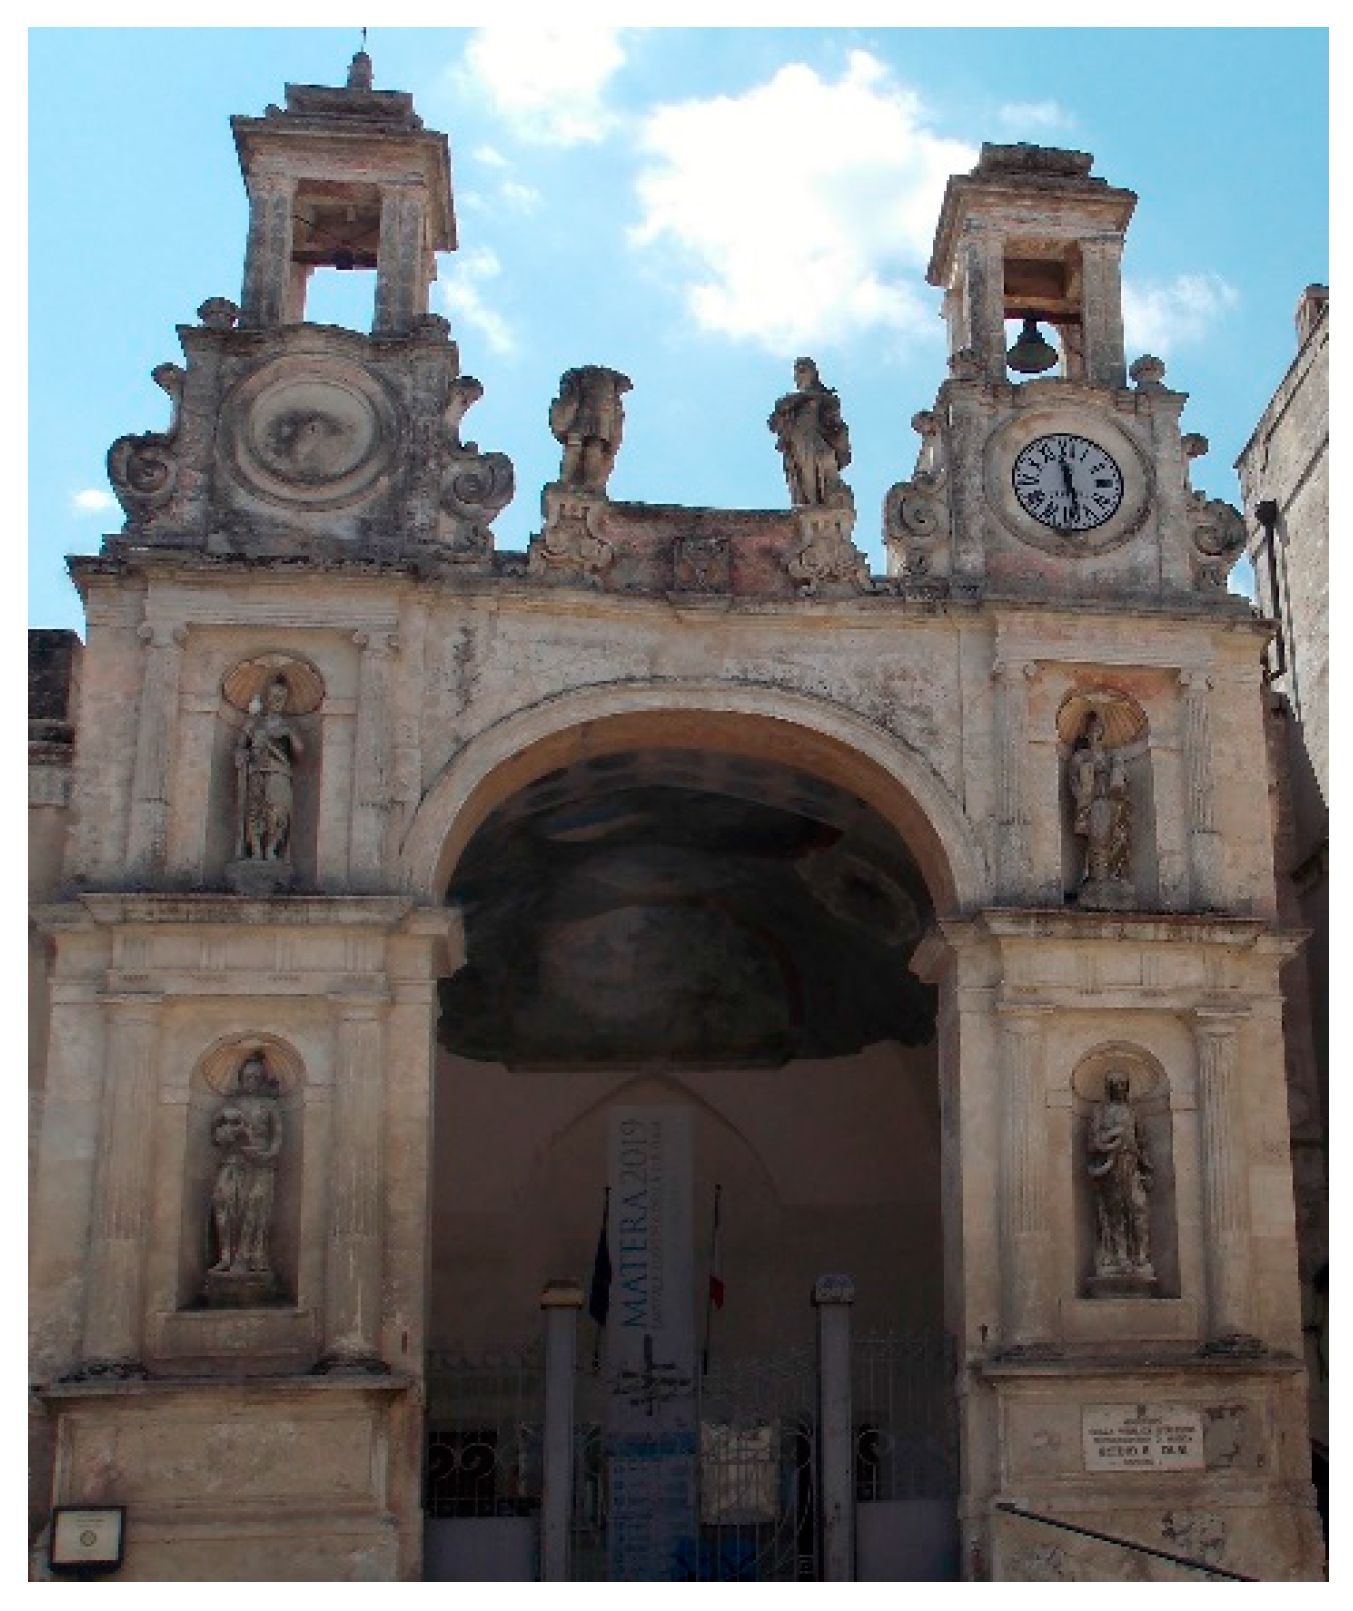
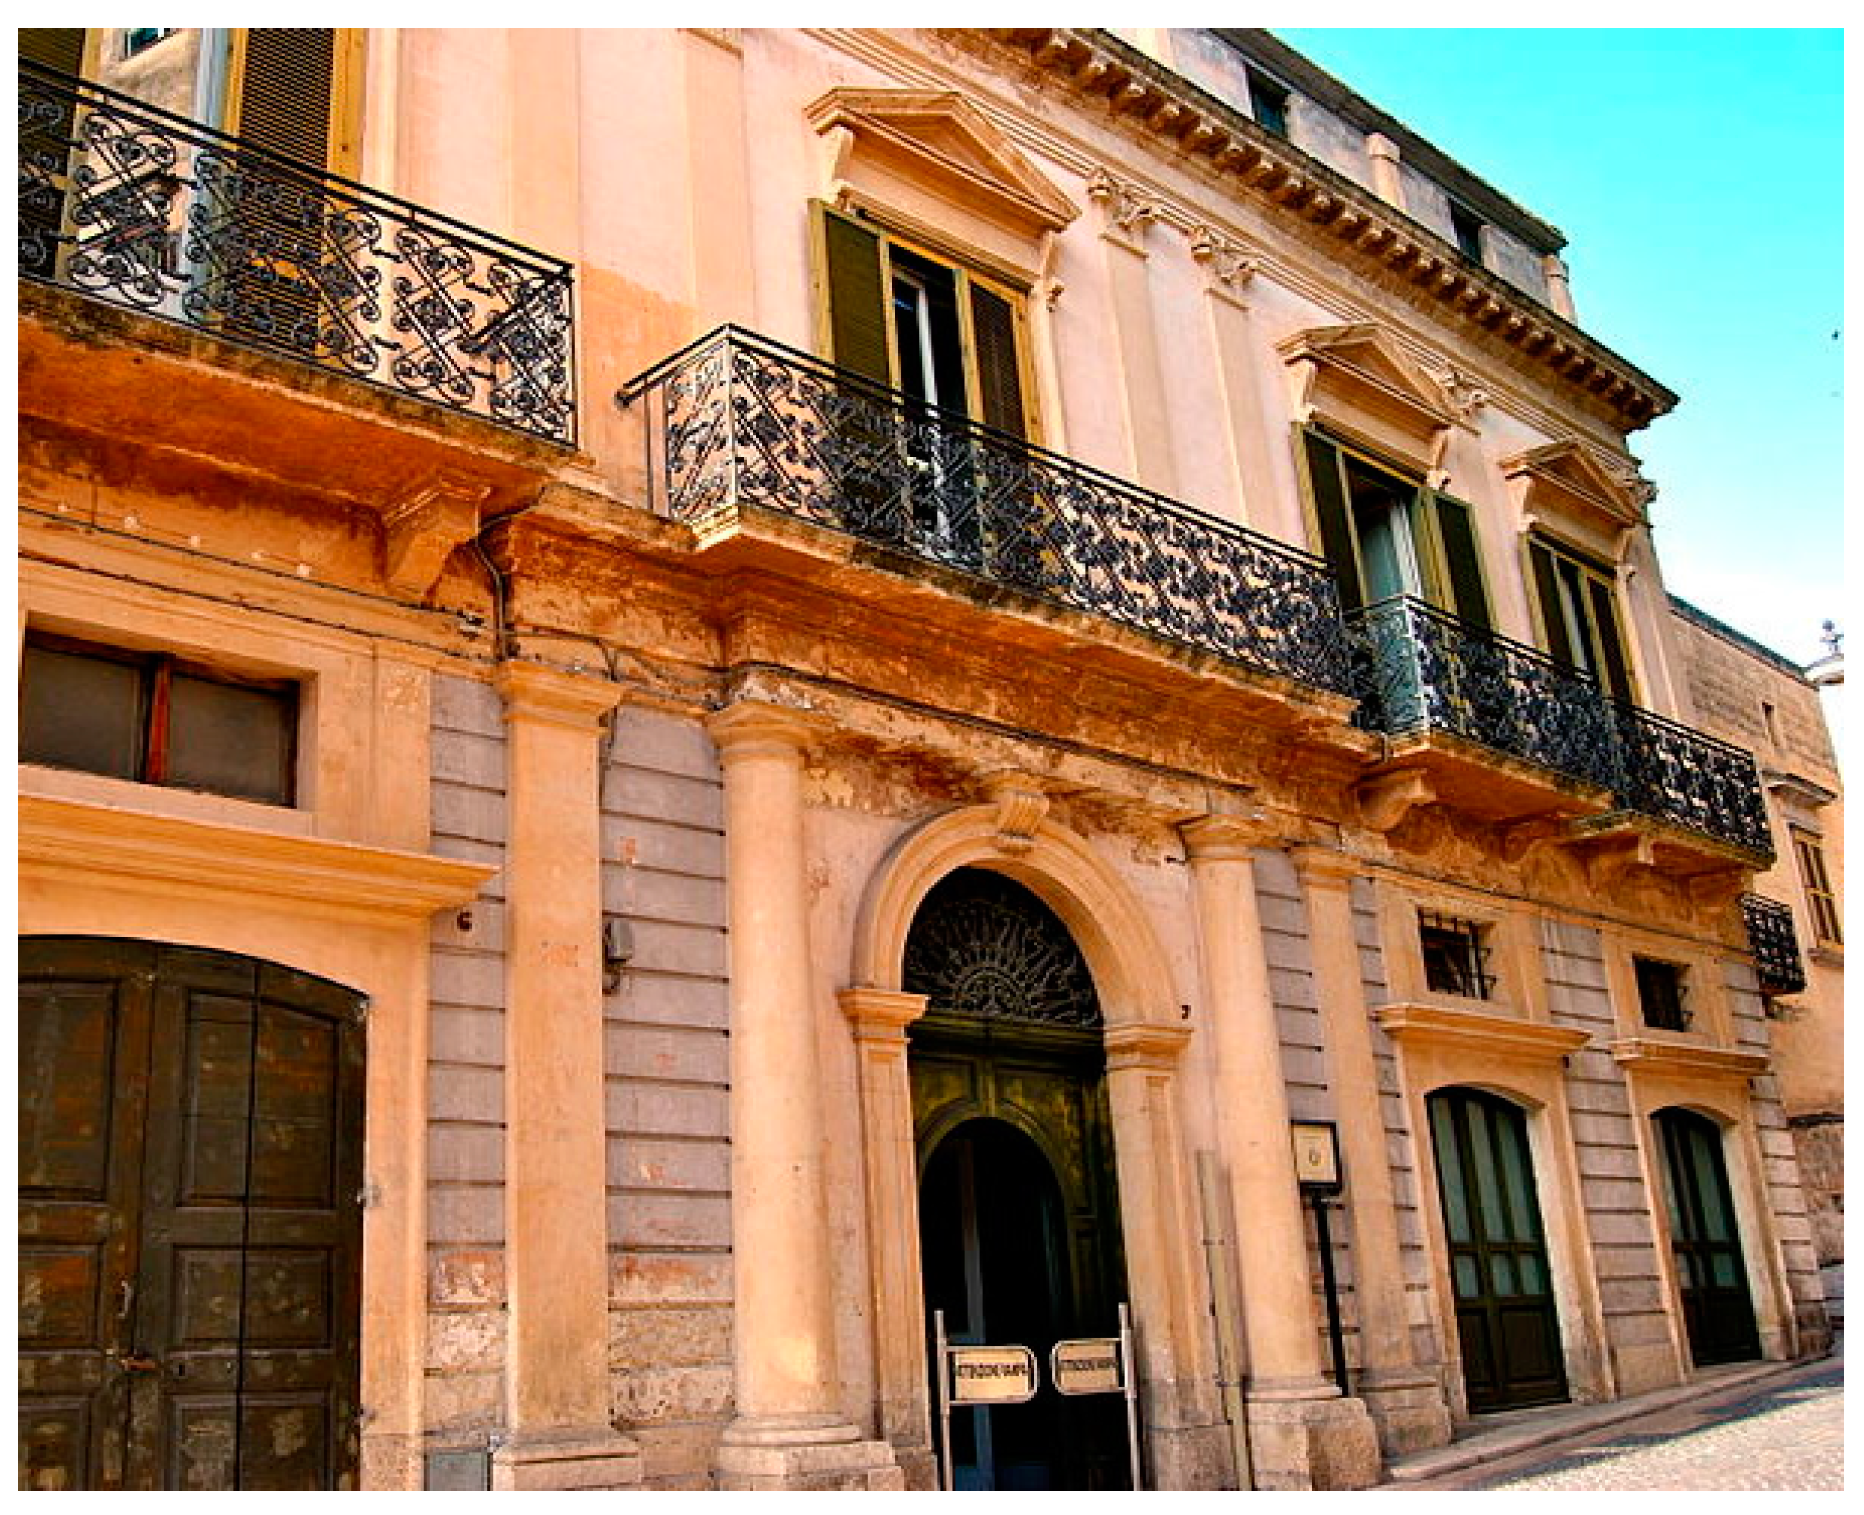
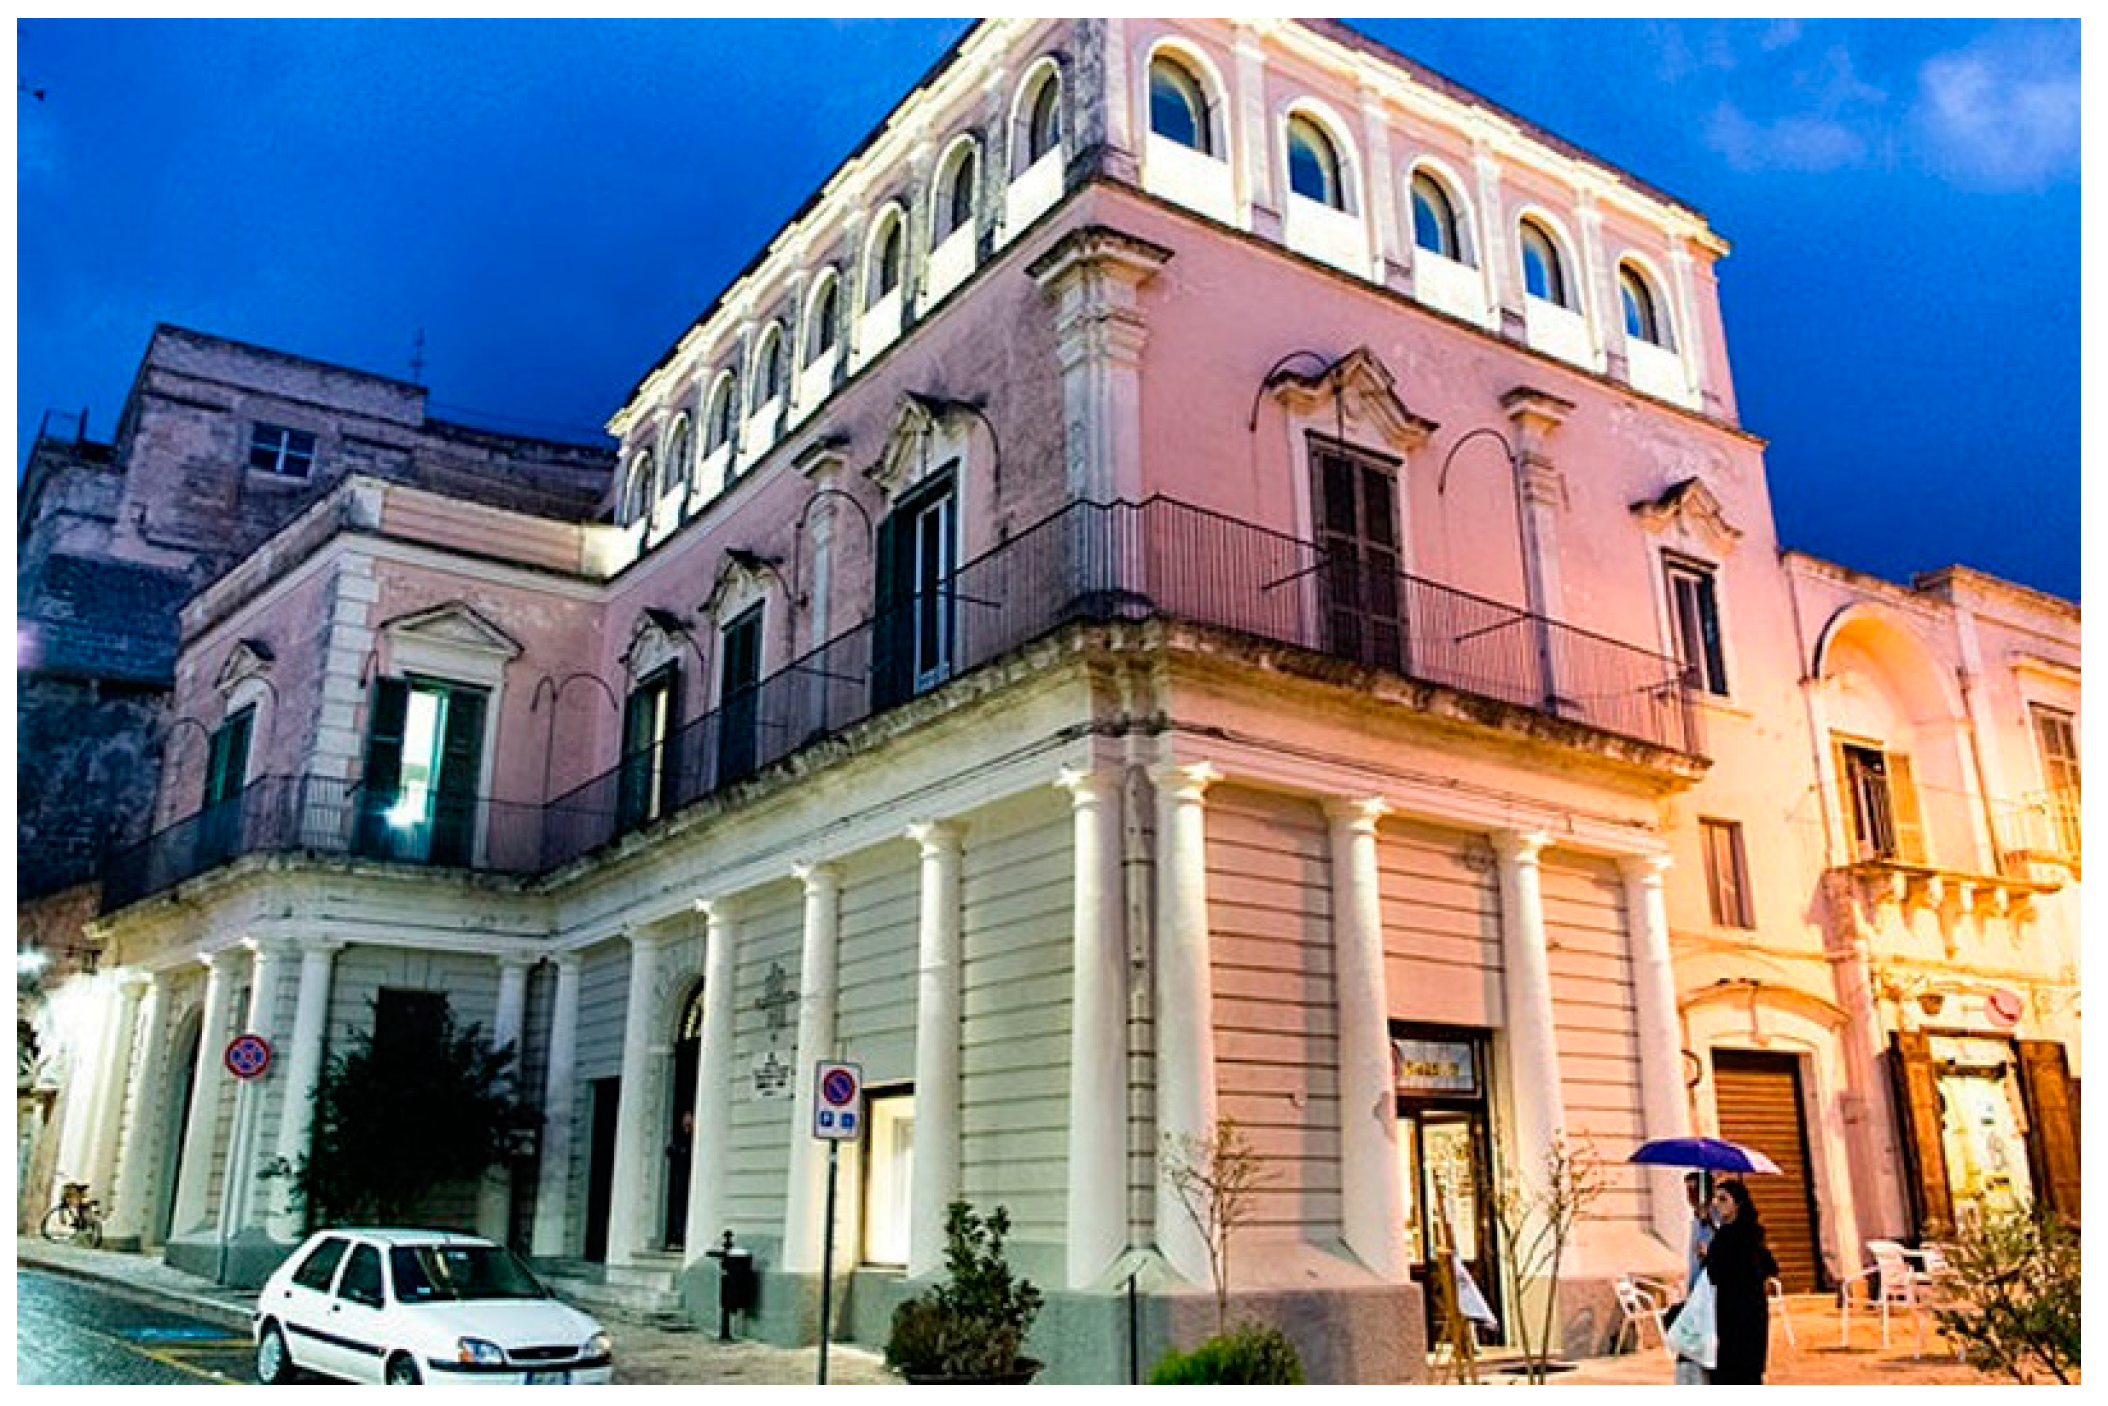
The paper analyses three historical buildings situated in two ancient squares of Matera: The “Sedile” building, “Ridola” building and “Bronzini” buildings. The “Sedile” building (Figure 2), was the old Municipal Parliament, an institution present in all free towns of the Kingdom of Naples [13]. This building was built in 1540 with limestone bearing walls and it has two levels. The walls have a thickness that varies between 0.80 to 1 m. The ceiling of its rooms has a vault typology with different heights. The “Ridola” building (Figure 3) was built in the nineteenth century [13]. The building was created with limestone bearing walls with a thickness between 0.6 to 1.0 m. In these buildings there are a complex vault ceiling systems and in some rooms there are flat ceilings. The “Ridola” building has three levels, two above the ground and one underground. The “Bronzini” building (Figure 4) was built in 1830 after the demolition of the St. Sophia Church [14]. This building was created with limestone bearing wall with a thickness between 0.7 to 1.1 m.
4. Results and Comparison
4.1. Energy Audit
In this work, thermal and energy performance of three case studies were analysed with the dynamic method based on Energy Plus Code [15]. Energy-Plus is a whole building energy simulation program which is used to model both energy consumption—for heating, cooling, ventilation, lighting and plug and process loads—and water use in buildings. Energy-Plus is a console-based program which reads input and writes output to text files. We used the graphical Design-Builder interface to create the virtual numerical model and insert the functionary schedules of the systems.
By the dynamic simulation it is possible to calculate a more accurate primary energy demand of buildings than by using the stationary method. By using a dynamic method all parameters (temperature, humidity, sun irradiance, etc.) can be set with an hourly time-step. This involves the need to know in detail the real conditions of the building use, energy consumption, building envelope thermal proprieties and thermal system efficiency.
As it is stated in the second paragraph, the methodology adopted to perform the energy audit can be divided into the two following steps: (1) data collection and measurement in situ, where we measured the thermal conductance of envelope and the energy consumption, and (2) numerical computing model implementation and parametric analysis with dynamic simulations. After creating the numerical model, we calibrated it by comparing simulated and measured values. After calibrating the model, some energy strategy improvements were analysed: buildings envelope changes, thermal system improvements or both.
Thermal Properties and Energy Audit with Dynamic Method
The thermal transmittance for opaque vertical envelope was calculated through in situ measurements by using ISO 9869:2014 (Table 3) [16]. We used a measurement acquisition step of 10 days and an interval of 15 min. The measurements were performed only if the mean temperature difference between the outer and inner envelope, across all campaigns of measures, was at least 10 °C.
After 10 days, 4800 data points were obtained by each measurement campaign and then, the thermal conductance and thermal transmittance were calculated with the “progressive average” method.
By using this method, we calculated the thermal conductance from the sampled values of the surface temperature and the heat flux using the following equation:
where qj is the thermal flux, Ti,j is the indoor surface temperature and To,j is the outdoor surface temperature. As N increases, the ratio tends to converge to a stationary value and is not influenced by the thermal mass of the wall. The C function converges with oscillations around a horizontal asymptote, with a maximum amplitude of approximately 0.05 W/m2 K.
To obtain the thermal transmittance U, we added the normed indoor and outdoor surface resistances Ri (0.13 m2 K/W) and Re (0.04 m2 K/W) to the value 1/C. We used the following formula:
The transmittance of horizontal and transparent envelope was calculated respectively by UNI EN ISO 6946:2008 (Table 3) [17] and UNI EN ISO 10077-2:2012, because the stratigraphy is known (Table 3) [18].
The calculated thermal dynamic properties are: periodic thermal transmittance (Yie); internal heat capacity per unit area (Ki); phase shift (φ). These parameters are calculated by UNI EN ISO 13786:2008 [19]. The calculation was conducted in different condition for the cases studied (Table 4). For the “Sedile” building, they are measured for the old and new buildings; for the “Ridola” building we measured the thermal dynamic properties in rooms with different S/V ratio but, in this case, we obtained the same values; for the “Bronzini” building measurements were conducted in rooms with different emission terminal typologies (“Rota” room with radiant panels and Room 1 with radiators).
Regarding heating systems, condensing boilers were installed in these structures in 2010. The emission terminals are radiators. Heating system efficiency was calculated by using UNI/TS 11300-2:2014 [20]. In the “Sedile” building a thermal power of 280 kW it was installed, with a generator efficiency ηgn of 0.88. The average seasonal performance ηH is of 0.72. The “Ridola” building and “Bronzini” buildings have the same installed thermal power equal to 116 kW with a generator efficiency ηgn of 0.98. The average seasonal performance ηH is of 0.81.
In the following tables, we report the primary energy consumption calculated using the conversion factor of energy vectors defined in Italian Decree Attachment 1 [21]: the electricity grid conversion factor is 1.95, in terms of non-renewable primary energy, while the natural gas conversion factor is 1.05, in terms of non-renewable primary energy. The energy comparison was conducted in terms of primary energy, specifically fossil primary energy, because renewable energy sources are not present in this case.
The technical parameters and the thermo-physical parameters were used to create the numerical model by using the Design Builder software. After detecting the geometric characteristics of the building, the building was subdivided into thermal zones. This subdivision was carried out according to the different characteristics of the envelopes that characterize the building and on a different distribution and type of thermal system. Table 5 shows the activity parameters used for the three case studies.
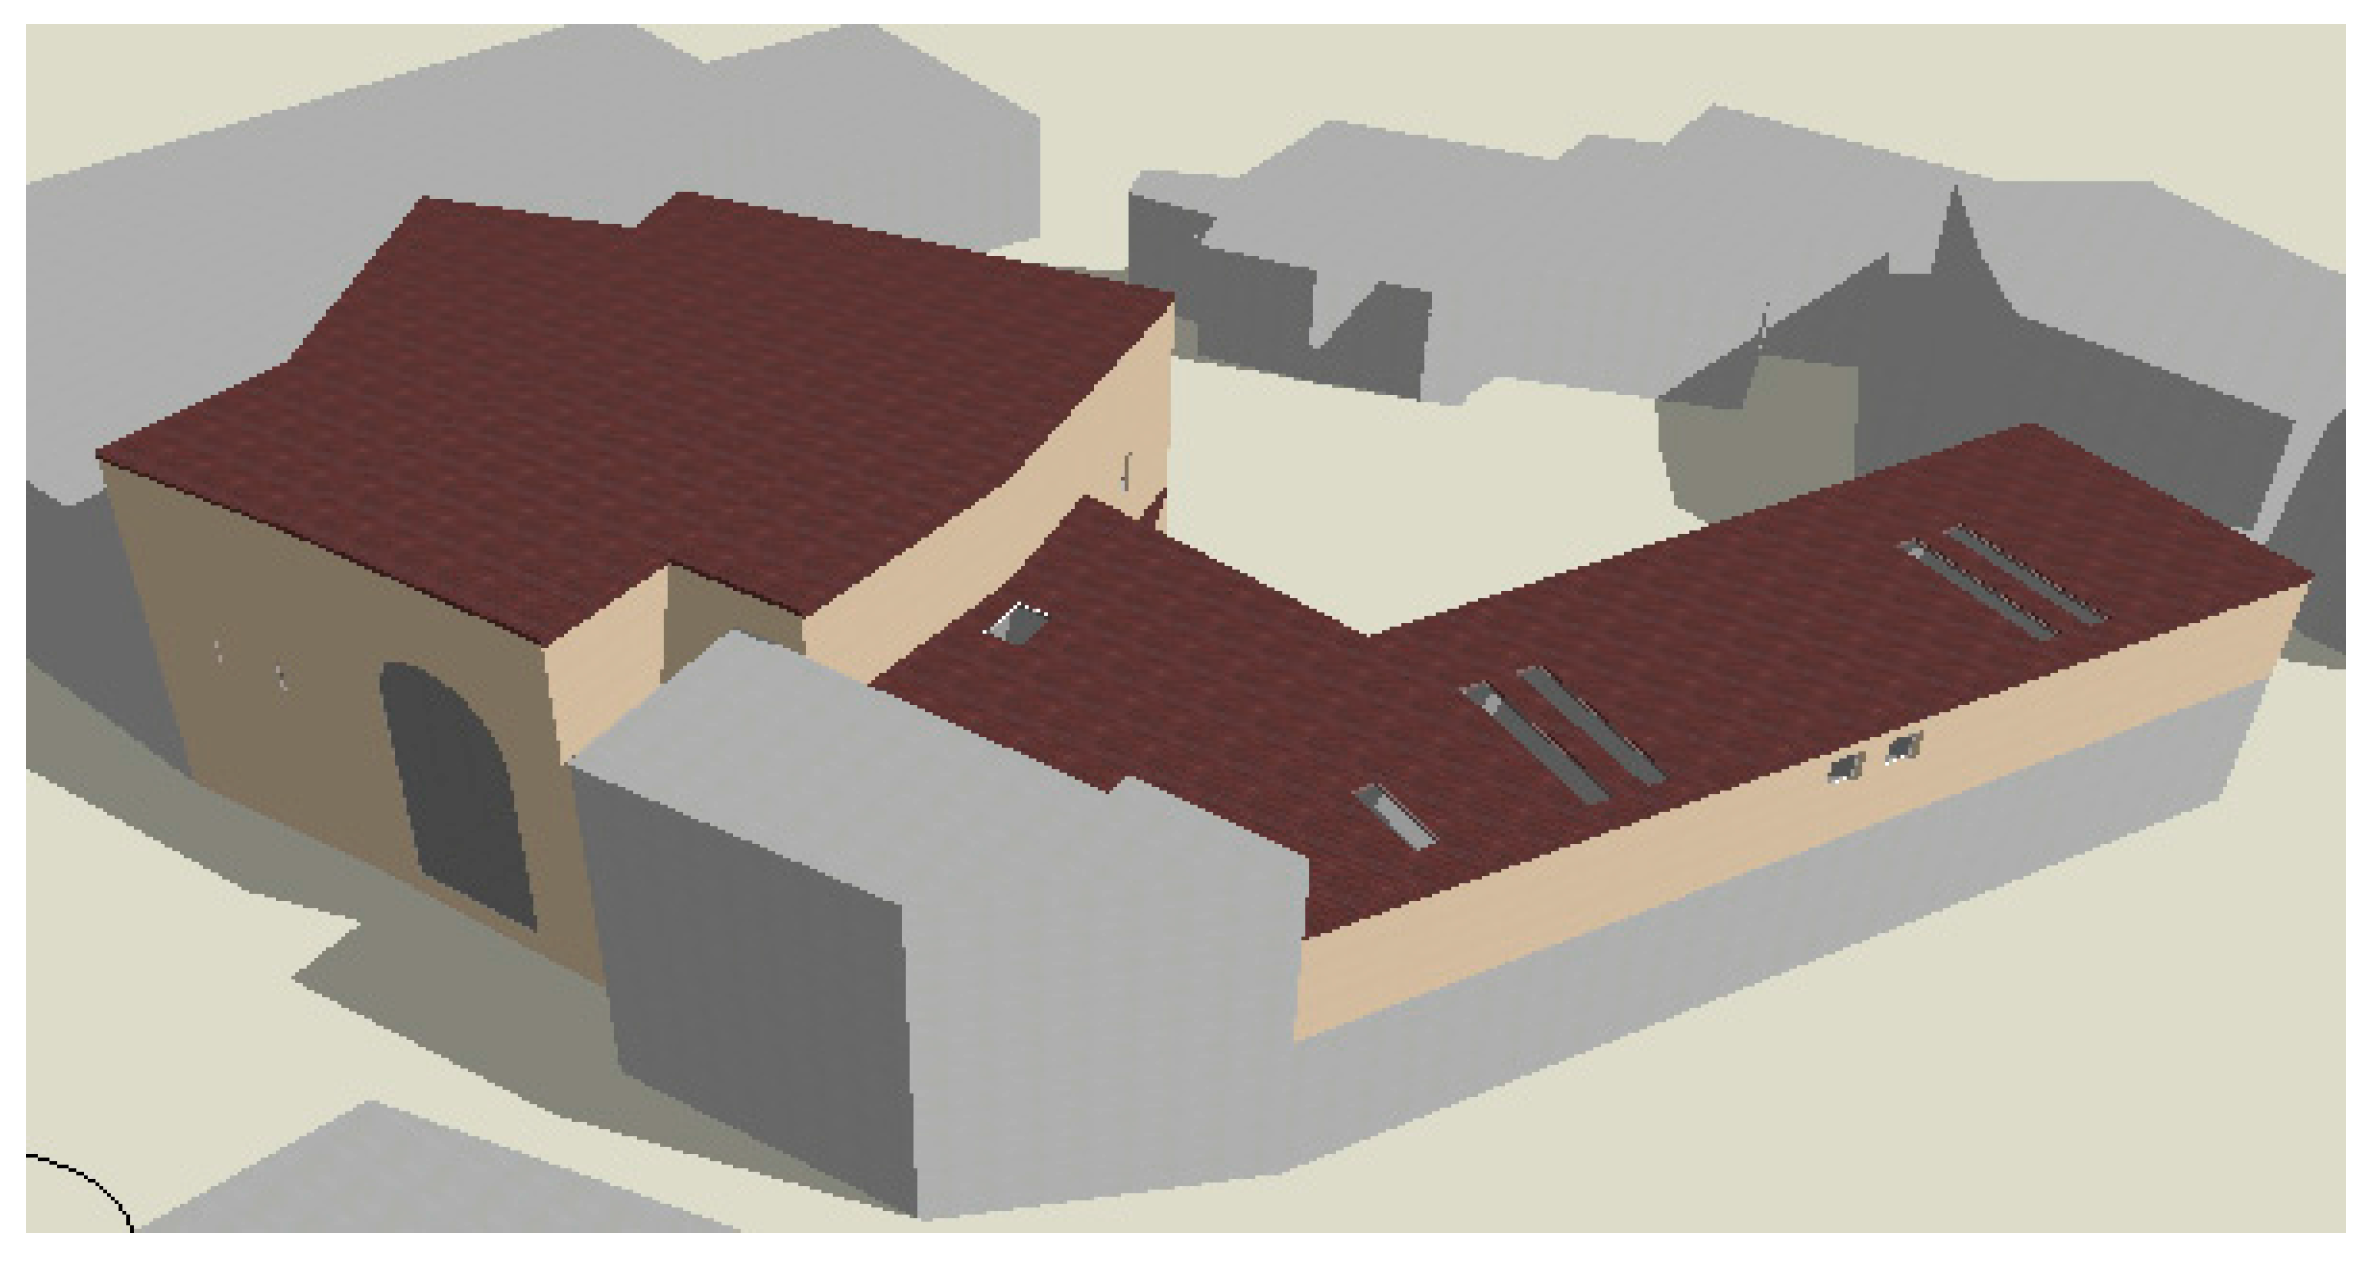
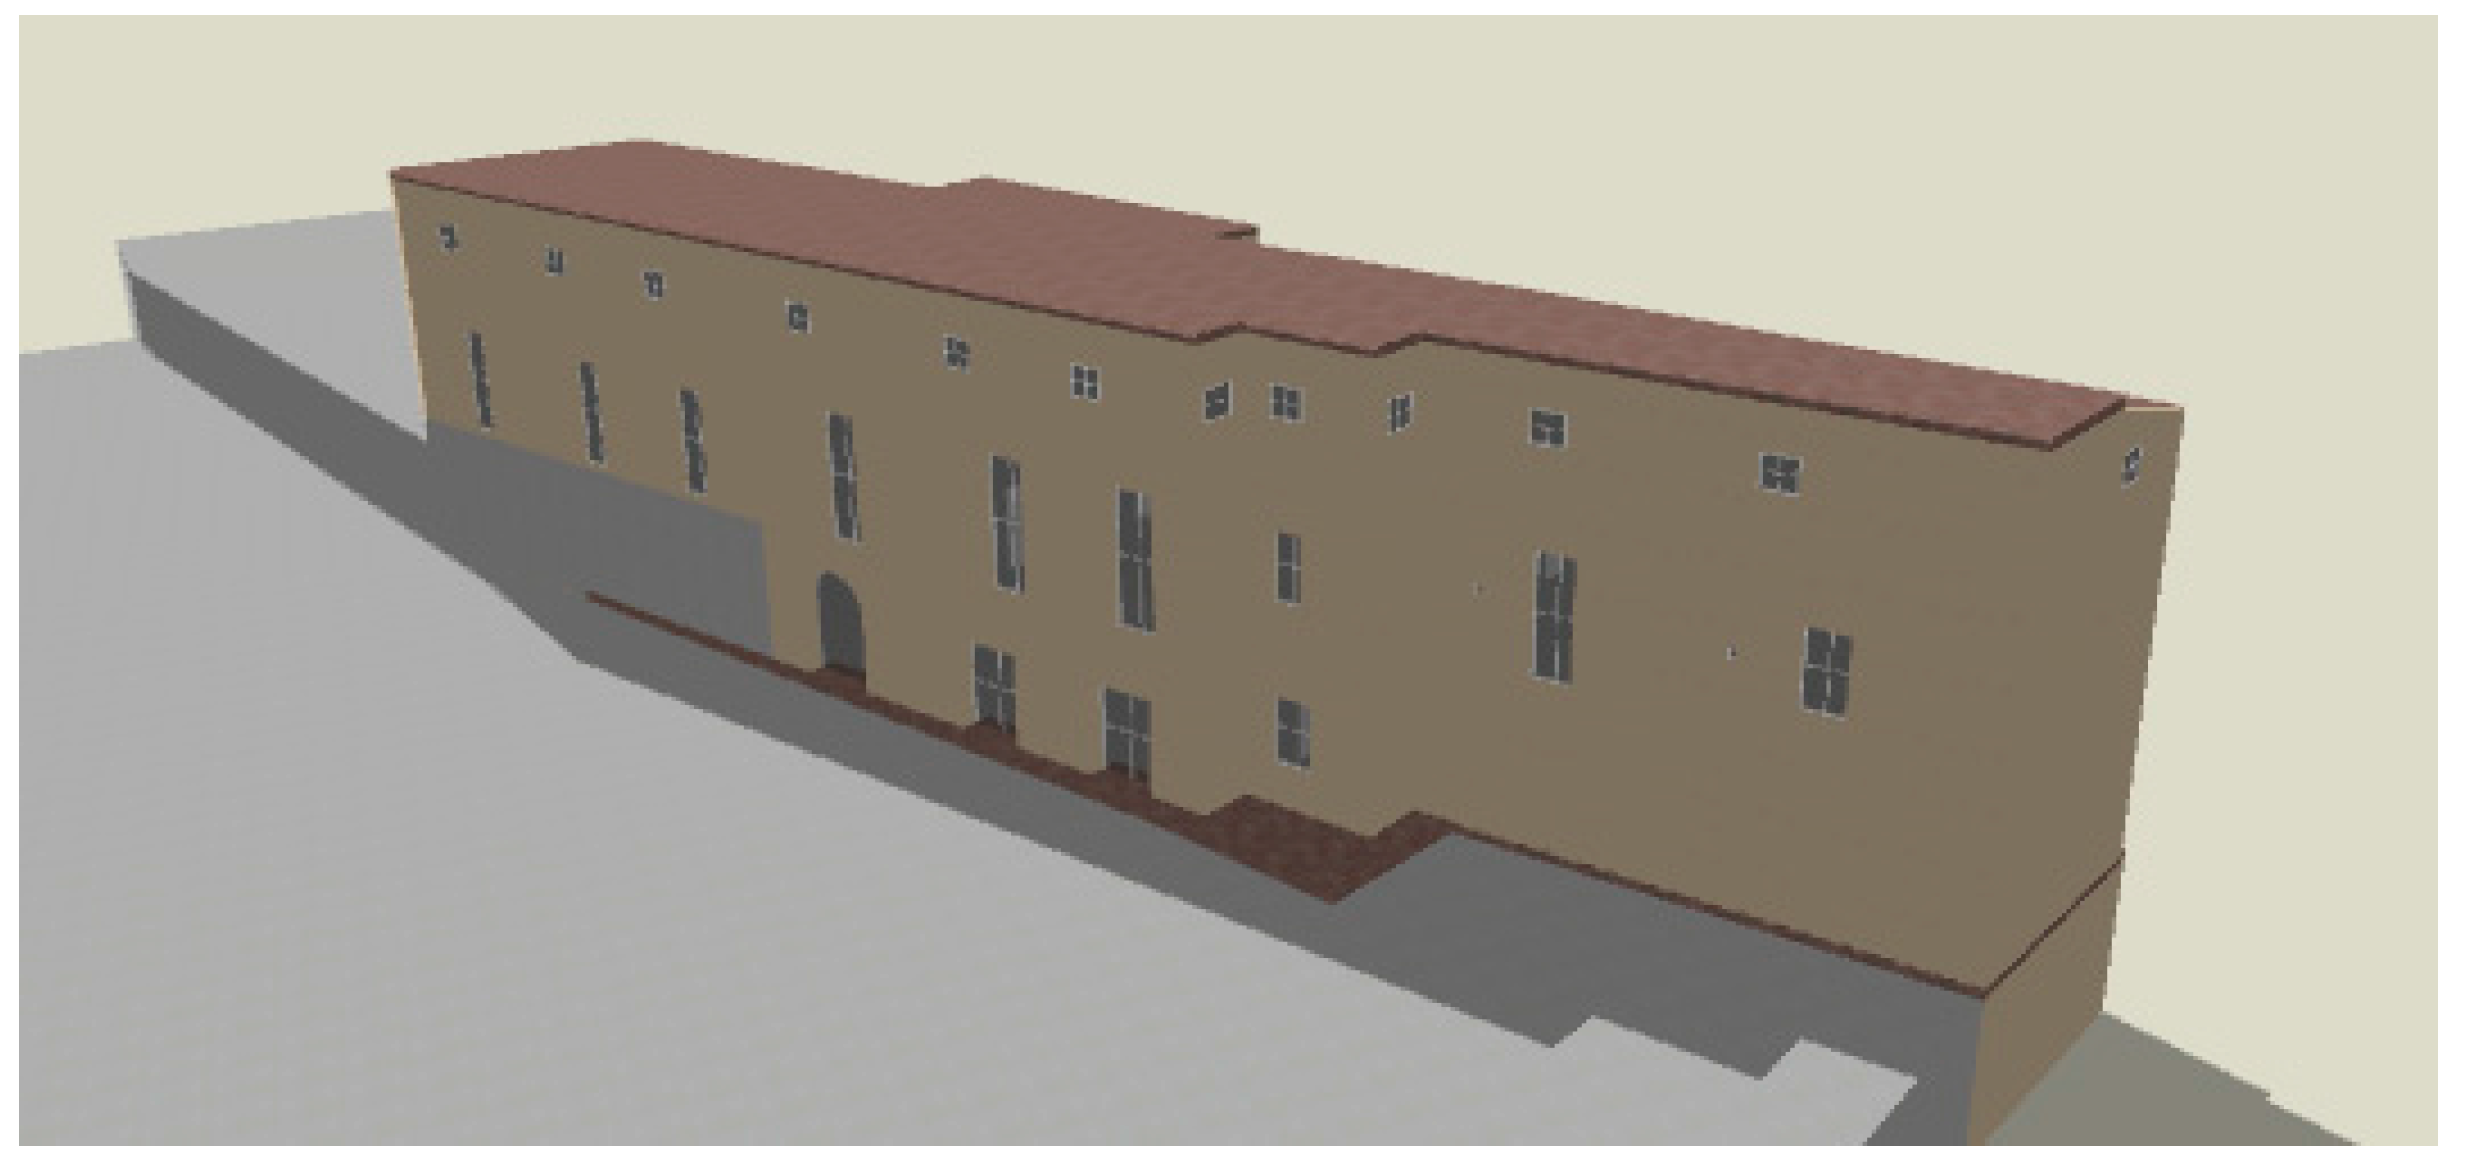
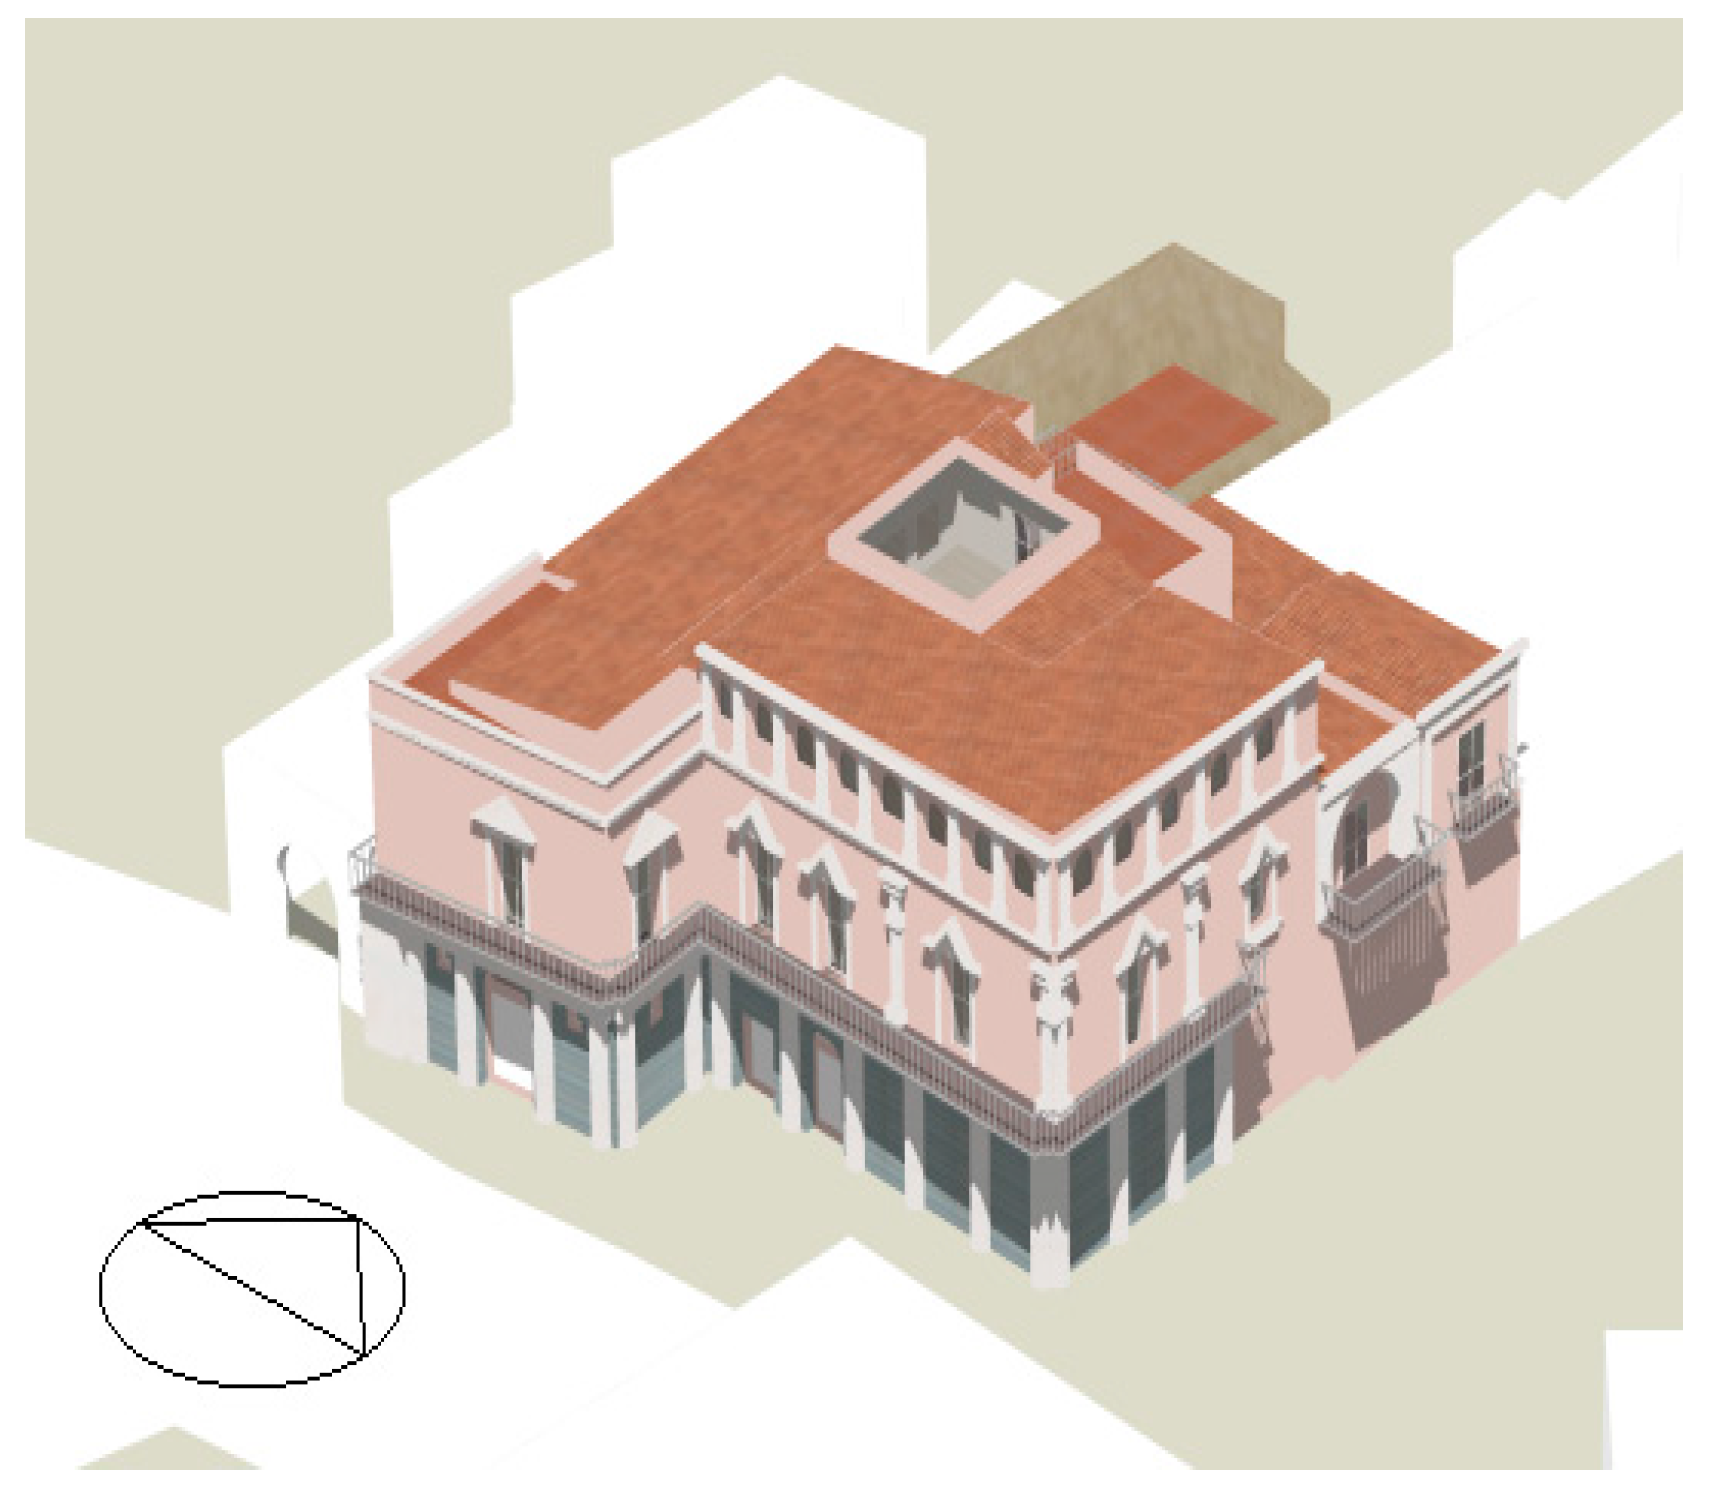
After creating the numerical model some energy dynamic analysis were performed. The time step of simulation used for the three case studies is an hourly step. To perform these analyses, it was necessary to have a detailed knowledge of the real used of these buildings and management of their thermal system. In Figure 5, Figure 6 and Figure 7 are shown the case studies model realized by Design Builder software.
It should be specified that cooling plants are not present in these buildings. In order to validate the simulation tool and model of the buildings, numerical results were compared with the experimental results.
The temperature differences measured (Dexp,t = (Tint,t − Text,t)exp) and simulated (Dsim,t = (Tint,t − Text,t)sim) were calculated and then, to obtain the goodness of the simulation model an Inequality Coefficient (IC) was computed [22]:
This coefficient indicates the magnitude domain due to unequal tendency (mean), unequal variation (variance), and imperfect co-variation (co-variance). IC can range in value between 0 and 1 (value of 0 indicates a perfect match and value of 1 indicates no match). This coefficient was calculated for different seasons and for different rooms.
In Table 6, Table 7 and Table 8 the different IC values for the three buildings investigated are shown. This coefficient was computed for different rooms in order to evaluate the model calibration in different season and in function of different S/V ratio and exposure. Where the S/V is the ratio between the envelope surfaces to total volume.
As is shown in Table 6, Table 7 and Table 8 there is a good match between the simulated and experimental data in all seasons and for this reason we can stated that the model done in Design Builder was validated.
We investigated dynamic thermal parameters even. The calculated values were: periodic thermal transmittance (Yie); internal heat capacity per unit area (Ki); thermal transmittance (U); attenuation factor (f); phase shift (Φ) (Table 9).
All case studies are characterized by a very good periodic thermal transmittance. This is a great advantage for structures situated in Mediterranean climate, where in summer season the high air temperature during the day is attenuated by the high thermal inertia of these massive structures.
4.2. Strategies for Energy Improvements
4.2.1. Energy Improvements, Energy Saving and Feasibility Analysis
To improve energy performance of buildings we can act on the building envelope or on thermal system. All energy actions adopted must be verified from the point view of the environmental and architectural sustainability. Furthermore, the buildings investigated are historical buildings and they have architectural restriction and therefore any proposed action must be the result of appropriate analyses.
In this paper, different improvement interventions were analysed: building envelope modifications, thermal systems improvements or both.
The opaque envelope improvement was performed with the application of an insulating natural fiber layer called Kenaf panel. This panel was attached on the inside wall surface, because in these structures the architectural restrictions prevent the application of the insulating panel on the outside wall surface. Kenaf panel is a panel composed by kenaf (Hibiscus cannabinus) fiber obtained from an herbaceous annual plant that grows very quickly under a wide range of weather condition. This is a natural material with a low environmental cost [23]. Kenaf is cultivated in Italy and other Mediterranean countries and mainly used in the thermal insulation field and pulp production. Kenaf exhibits low density (ρ = 100 kg/m3), non-abrasiveness during processing, high specific mechanical properties, conductivity of λ = 0.038 W/m2 [24] and biodegradability.
The improvement of the transparent envelope for the “Sedile” building was performed by using fixtures in wood-aluminum with double low-emissivity glass 4/8/4 with and an 8 mm argon gas cavity. The following improvement allows to lower the thermal transmittance of from 3.100 W/m2 K to 1.717 W/m2 K. Only for the “Ridola” building was a double low-emissivity glass 4/13/4 with a 13 mm argon gas cavity used. This improvement allowed us to lower the thermal transmittance from 3.100 W/m2 K to 1.492 W/m2 K.
Table 10 shows the energy performance due to interventions on envelope, also in terms of non-renewable primary energy with reference to floor area Epnren. The energy retrofit actions were applied in the created numerical model. The simulation results obtained are used to understand the energy saving related to the single retrofit action designed. The energy analysis is presented in terms of primary energy in order to compare different energy vectors, as gas or electricity, used in our systems.
The improvements to the buildings’ envelope allows an energy saving of 22%. In particular, with the opaque envelope improvements the following objectives were achieved: for the opaque horizontal envelope the energy saving is between 3% and 13% and for the opaque vertical envelope the energy saving is between 6% and 21%. These percentages increase to 27% in the case of a combined intervention on both the opaque and transparent envelope.
The thermal system actions were: (a) replacement of the old condensing boiler with a high-temperature absorption heat pump with a Gas Utilization Efficiency (GUE) of 1.5 and the installation of thermostatic radiator valves; (b) replacement of the old condensing boiler with an electric heat pump with Coefficient of Performance (COP) of 2.93 and installation of a fan coil unit. The primary energy savings are reported in Table 11.
The high temperature compression heat pump uses electricity from the grid as energy source with a very high conversion factor. In the case of the “Bronzini” building the primary energy required for the electrical heat pump exceeds the current primary energy consumption. A major advantage would occur in the case the compression heat pump were combined with a photovoltaic system to obtain a renewable share of over 50%. In the case of the buildings in question, subject to historical and architectural restrictions, it is not possible to install an adequate photovoltaic capacity to ensure the sustainability of the compression heat pump. Moreover, the electrical heat pump requires the replacement of the existing heating radiators with fan coil units and requires a high power consumption of the entire system. The absorption heat pump, however, guarantees a 39.4% share of renewable energy and combined with a solar thermal system, would guarantee a renewable share of over 55%, but in this case, because of the present constraints, it is not possible to install such a system.
4.2.2. Electric Consumption Improvements
The Basilicata region, as established by “Italian Statistical Data on Electricity—2015”, is characterised by an energy deficit of 25.1%. To solve this problem a reduction of electricity for the building sector is necessary. UNI 11300-2:2014 adds the calculation of the electricity needs in the determination of the primary energy requirements of a building. The calculation of the electric energy demand for lighting of a room or an inner area takes account of the control and emergency devices, electric power of the installed lighting fixtures, utilization factor of the power installed, availability natural light, length of day and night lighting operation and building occupancy (absence factor and factor depending on the type of lighting control linked to the occupation). We monitored the electric consumption for 2009–2012 and we calculated the electrical consumption due to lighting system. Table 12 shows the measured and simulated electrical consumptions for lighting.
We detected the consistency of the electrical system and, for the “Sedile” building, a remodelling of the plant was carried out due to oversizing of the lighting project. The “Sedile” building has a great energy consumption and high power metal halide lamps. Moreover, there are elevated lux values, these cause a high index glare. For this building we used an operational hour value of 4.5 h to day. The “Ridola” building has a moderate electric consumption and the lighting design is well done. For this building we used an operative hour value of 5.5 h to day because it has a bad exposure. Solar radiation is low due to the shading from the buildings around it. For this motive this building needs to keep the lights turned on more. Finally, the “Bronzini” building has a moderate electric consumption and the lighting design is well done. For this building we used an operative hour value of 5 h a day. For all buildings we assumed the substitution of old lamp with LED lamps. In Table 13 the present lighting typology and the design study are shown.
In all cases the replacement of lighting plant with LED technologies guarantees an energy saving of more than 60%.
5. Economic Feasibility Study
Another important analyses investigated was the economic feasibility of the different energy improvement strategies. The goal was to obtain a technical and economic convenience. In Italy there is a government economic incentives called “Thermal Bill 2.0” [25]. The Thermal Bill 2.0, promote energy efficiency interventions and the thermal energy production by renewable sources. By using the Thermal Bill 2.0 the energy improvement cost can be recovered partly.
In Table 14 we show the investment costs and pay-back time without and with economic incentives. Interventions on envelope have a high pay-back time. Through incentives of the “Thermal Bill 2.0” payback periods of less than 10 years can be obtained, except for all interventions of the “Sedile” building, improving the horizontal envelope of the “Ridola” building and the transparent envelope of the “Bronzini” building.
In Table 15 we report the economic feasibility of energy strategies on plant. From our economic analysis, for the final user, it would appear that the heat pump compression provides greater benefits than an absorption heat pump, despite its greater consumption of primary energy. This result is due to the lower cost of electricity than methane, a consequence of the greater value of the COP compared to the GUE. The compression heat pump used requires a power consumption for its compressor machines of 15.95 kW. This involves the switch from a low voltage contract to a medium voltage contract in some cases. In the investment costs we did not recognize the cost of this change as a result of increased power consumption of the machine.
6. Conclusions
With the energy dynamic simulation the buildings’ real behaviour was investigated. In fact, the energy stationary simulation method, widely used by Italian standards, has a high estimation error. All energy aspects of the buildings must be analysed at the same time: the energy features of the building envelope, the shading, the thermal system, the intended use of the rooms, the natural and artificial ventilation, etc. With the use of a dynamic simulation these aspects can be studied with an hourly time step.
This study has demonstrated that only with an integrated approach, based on in situ measurement campaigns and energy dynamic simulations, can one obtain a good energy audit. By using the Inequality Coefficient a high level estimate of the numerical model was performed, by analysing the energy consumption measured and simulated. IC values lower than 0.25 were obtained.
A first result obtained was a small indoor temperature variation compared to the outdoor temperature; this is caused by the high thermal mass of the walls. Moreover, different energy actions were performed: building envelope improvements (opaque envelope and windows), thermal system improvements and light system improvements. Then an economic feasibility study was performed.
The improvements on the buildings’ envelope allow a maximum energy savings of 21%. These percentages increase to 27% in the case of a combined intervention on opaque and transparent envelope.
Instead, heating system improvements were performed with the replacement of old boilers with an absorption heat pump or electric heat pump. The use of absorption heat pumps allows a primary energy saving of more 25% with respect to the electrical heat pump because in the Italian primary energy conversion model, this factor is, for electrical energy, 1.95 and, for natural gas, 1.05.
Another negative aspect is represented by the elevated cost of electric energy compared to gas in Italy. For this reason, this system has a high electrical consumption and if it is not possible to combine a photovoltaic system, the solution is not convenient for the environment, especially if when using high temperature heater terminals.
In these buildings both historical restrictions and a minimal coverage surface make the photovoltaic installation impossible, thus the installation of absorption heat pumps is more convenient in terms of non-renewable primary energy reduction.
The energy improvements on the building envelope and thermal system guarantee a primary energy savings for the absorption heat pump of between 57% and 71%, whereas for a compression heat pump these energy improvements guarantee a primary energy savings between 11% and 28%.
Regarding, the light system improvement, the replacement of the lighting plant with LED technologies guarantees an energy savings of more than 60%.
The economic feasibility study of the building envelope demonstrated that it has a payback time of close to 10 years. On the other hand, the payback time of the thermal system improvements is less than 5 years. Moreover, for the final user, it would appear that the compression heat pump option provides greater benefits than an absorption heat pump, despite its greater consumption of primary energy. This result is due to the lower cost of electricity than methane, a consequence of the greater value of the COP compared to the GUE.
By the conducted analysis we demonstrated that there is not a “best intervention” than others, but each intervention should be evaluated according to the building characteristics, its use and techno-economic feasibility of the various options hypothesized.
Supplementary Files
Supplementary File 1Author Contributions
Gianluca Rospi has designed and performed the experiments; moreover he has analysed the data, performed the energy audit, performed the dynamic simulations, validated the numerical model and analysed the energy Improvements. The Nicola Cardinale has directed and verified the experimental results. Instead Elisabetta Negro has performed the economic feasibility study with Gianluca Rospi. The paper was written by all authors.
Conflicts of Interest
The authors declare no conflict of interest.
Nomenclature
| PMV | The Predicted Mean Vote (PMV) Index predicts the mean response of a larger group of people according the ASHRAE thermal sensation scale (between −3 to +3), ND |
| PPD | The Predicted Percentage Dissatisfied—PPD—index is a quantitative measure of the thermal comfort of a group of people at a particular thermal environment, % |
| Icl | Clothing insulation, clo |
| M | Metabolic rate, W/m2 |
| ηH | Average seasonal performance, ND |
| ηgn | Generation efficiency, ND |
| EPnren | Non-renewable primary energy refers to the usable area of the building, kWh/(m2 year) |
References
- Italian Parliament. Standards for the Containment of Energy Consumption for Thermal Uses in Buildings; Italian Law No. 373/1976; Istituto Poligrafico e Zecca dello Stato: Rome, Italy, 7 June 1976.
- Italian Parliament. Standards for the Implementation of the National Energy Plan for National Use of Energy, Energy Saving and Development of Renewable Energy Sources; Italian Law No. 10/1991; Istituto Poligrafico e Zecca dello Stato: Rome, Italy, 16 January 1991.
- Italian Parliament. Implementation of Directive 2002/91/EC on Energy Performance in Construction; Italian Legislative Decree No. 192/2005; Istituto Poligrafico e Zecca dello Stato: Rome, Italy, 23 September 2005.
- European Commission Directive. Results of the Public Consultation on the Europe 2020 Strategy for Smart, Sustainable and Inclusive Growth; European Commission: Brussels, Belgium, 2015. [Google Scholar]
- Ministry of Cultural Heritage and Activities and Tourism (Italy). Guidelines Improving Energy Efficiency in Cultural Heritage; Italian Ministry of Cultural Heritage and Activities and Tourism: Roma, Italy, 2015.
- Ciulla, G.; Galatioto, A.; Ricciu, R. Energy and economic analysis and feasibility of retrofit action in Italian residential historical buildings. Energy Build. 2016, 128, 649–659. [Google Scholar] [CrossRef]
- Bellia, L.; Alfano, F.R.D.A.; Giordano, J.; Ianniello, E.; Riccio, G. Energy requalification of a historical building: A case study. Energy Build. 2015, 95, 184–189. [Google Scholar] [CrossRef]
- Cetiner, I.; Metin, B. Economic performance assessment of residential building retrofit: A case study of Istambul. Energy Effic. 2017, 11, 1–19. [Google Scholar] [CrossRef]
- Gasparella, A.; Pernigotto, G.; Cappelletti, F.; Romagnoli, P.; Baggio, P. Analysis and modelling of window and glazing systems energy performance for a well-insulated residential building. Energy Build. 2011, 43, 1030–1037. [Google Scholar] [CrossRef]
- Magrini, A.; Franco, G. The energy performance improvement of historic buildings and their environmental sustainability assessment. J. Cult. Heritage 2016, 21, 834–841. [Google Scholar] [CrossRef]
- Walker, R.; Pavia, S. Thermal performance of selection of insulation materials suitable for historic buildings. Build. Environ. 2015, 94, 155–165. [Google Scholar] [CrossRef]
- Salvadori, G.; Fantozzi, F.; Rocca, M.; Leccese, F. The Energy Audit Activity Focused on the lighting Systems in Historical Buildings. Energies 2016, 9, 998. [Google Scholar] [CrossRef]
- Rota, L.; Conese, F.; Tommaselli, M. Storia di Una Città; BMG Rights Management (Italy): Milan, Italy, 1990.
- Padula, M. Palazzi Antichi di Matera; Altrimedia: Milan, Italy, 2002. [Google Scholar]
- Energy Plus; version 8.3; Energy Open Source Software; U.S. Department of Energy’s (DOE) Building Technologies Office (BTO): Washington, DC, USA.
- International Organization for Standardization (ISO). ISO 9869-1:2014. Thermal Insulation—Building Elements—In-Situ Measurement of Thermal Resistance and Thermal Transmittance—Part 1: Heat Flow Meter Method; International Organization for Standardization: Geneva, Switzerland, 2014. [Google Scholar]
- UNI (Ente Italiano di Normazione). UNI EN ISO 6946:2008. Building Components and Building Elements—Thermal Resistance and Thermal Transmittance—Calculation Method; Italian Unification Body: Milan, Italy, 2008.
- UNI (Ente Italiano di Normazione). UNI EN ISO 10077-2:2012. Thermal Performance of Windows, Doors and Shutters—Calculation of Thermal Transmittance—Part 2: Numerical Method for Frames; Italian Unification Body: Milan, Italy, 2012.
- UNI (Ente Italiano di Normazione). UNI EN ISO 13786:2008. Thermal Performance of Building Components—Dynamic Thermal Characteristics—Calculation Methods; Italian Unification Body: Milan, Italy, 2008.
- UNI (Ente Italiano di Normazione). UNI/TS 11300-2:2014. Energy Performance of Buildings—Part 2: Evaluation of Primary Energy Need and of System Efficiencies for Space Heating, Domestic Hot Water Production, Ventilation and Lighting for Non-Residential Buildings; Italian Unification Body: Milan, Italy, 2014.
- Italian Government. Decree for Minimum Requirements: Application of the Calculation Methodology of the Energy Performance and Definition of Requirements and Minimum Requirements for Buildings; Italian Government Decrees; Istituto Poligrafico e Zecca dello Stato: Rome, Italy, 15 July 2015.
- Cardinale, N.; Stefanizzi, P.; Rospi, G.; Augenti, V. Thermal performance of a mobile home with light envelope. Build. Simul. 2010, 3, 331–338. [Google Scholar] [CrossRef]
- Nishino, T.; Hirao, K.; Kotera, M.; Nakamae, K.; Inagaki, H. Kenaf reinforced biodegradable composite. Compos. Sci. Technol. 2003, 63, 1281–1286. [Google Scholar] [CrossRef]
- Ardente, F.; Beccali, M.; Cellura, M.; Mistretta, M. Building energy performance: A LCA case study of kenaf-fibres insulation board. Energy Build. 2008, 40, 1–10. [Google Scholar] [CrossRef]
- Italian Government. Thermal Bill 2; Italian Government Decree; Istituto Poligrafico e Zecca dello Stato: Rome, Italy, 2 February 2016.
Figure 1.
The Sassi site.

Figure 2.
“Sedile” building.

Figure 3.
“Ridola” building.

Figure 4.
“Bronzini” building.

Figure 5.
Model of the “Sedile” building.

Figure 6.
Model of the “Ridola” building.

Figure 7.
Model of the “Bronzini” building.


Table 1.
Geometric characteristic of the case study.
| Building | Year | Construction Typology | N. Floors | Gross Volume | Total Area | Building Height | Number of Rooms |
|---|---|---|---|---|---|---|---|
| m3 | m2 | m | n | ||||
| “Sedile” building | 1540 | Bearing wall structure in limestone, and vaulted ceilings | 2 | 5550 | 1500 | 13.00 | 20 |
| “Ridola” building | 1842 | Bearing wall structure in limestone, and vaulted ceilings | 3 | 3904 | 1170 | 10.10 | 31 |
| “Bronzini” building | 1840 | Bearing wall structure in sandstone calcarenite, and vaulted ceilings | 4 | 5113 | 1352 | 14.00 | 12 |
Table 2.
Technical characteristics of the case studies.
| Building | Total Heat Loss Surface | Opaque Area | Windows Area | S/V 1 Ratio | Installed Thermal Power | Heating Terminals |
|---|---|---|---|---|---|---|
| m2 | m2 | m2 | kW | |||
| “Sedile” building | 2217 | 2150 | 67 | 0.17 | 280 | Radiators in classrooms and offices |
| “Ridola” building | 1206 | 1545 | 104 | 0.40 | 116 | Radiators in classrooms and offices |
| “Bronzini” building | 1416 | 1352 | 64 | 0.28 | 116 | Radiators in classrooms and offices |
1 S/V is the ratio between the envelope surfaces to total volume.
Table 3.
Thermo-physical parameters of opaque envelope of case studies.
| Building | Opaque Vertical Envelope | Horizontal Coverage Envelope | Transparent Envelope | ||||
|---|---|---|---|---|---|---|---|
| C | U | Law Limits | U | Law Limits | U | Law Limits | |
| W/(m2 K) | W/(m2 K) | W/(m2 K) | W/(m2 K) | W/(m2 K) | W/(m2 K) | W/(m2 K) | |
| “Sedile” building | 1.41 | 0.63 | 0.32 | 1.04 | 0.26 | 3.15 | 1.8 |
| “Ridola” building | 1.14 | 0.98 | 0.32 | 0.33 | 0.26 | 3.16 | 1.8 |
| “Bronzini” building | 1.31 | 1.01 | 0.32 | 1.56 | 0.26 | 3.16 | 1.8 |
Table 4.
Thermal dynamic properties.
| Buildings | Measures Condition | Yie | Ki | φ |
|---|---|---|---|---|
| W/(m2 K) | kJ/(m2 K) | h | ||
| “Sedile” building | Old buildings | 0.349 | 60.9 | 10.41 |
| New building | 0.003 | 56.1 | 29.11 | |
| “Ridola” building | Room 7 | 0.029 | 55.7 | 20.3 |
| Percussion Room | ||||
| “Bronzini” building | “Rota” Room | 0.0003 | 55.1 | 48.24 |
| Room 1 | 0.0009 | 55.1 | 35.52 |
Table 5.
Activity parameters.
| Activity Parameters | “Sedile” Building | “Ridola” Building | “Bronzini” Building |
|---|---|---|---|
| Occupacy schedule | 15/09–15/07 from 08:00 to 13:00 and from 15:00 to 17:00 | 15/09–15/07 from 7:00 to 19:00 | 01/09–30/07 from 8:00 to 18:00 |
| Minimum fresh air | 1 Litres/seconds to person | 1 Litres/seconds to person | 1 Litres/seconds to person |
| Occupacy | 0.015 people/m2 | 0.011 people/m2 | 0.30 people/m2 |
| Metabolic activity | 0.90 W/m2 | 0.90 W/m2 | 0.90 W/m2 |
| Heating set point | 20 °C | 18 °C | 20 °C |
| Cooling set point | 26 °C | 28 °C | 28 °C |
Table 6.
Inequality Coefficient for the “Sedile” building.
| Building | Season | Inequality Coefficient—IC | ||||||||
|---|---|---|---|---|---|---|---|---|---|---|
| Room 1 | Room 2 | Room 4 | Room 5 | Room 10 | Secretary | Administr. | Supply | Average | ||
| “Sedile” building | Summer season | 0.15 | 0.05 | 0.17 | 0.36 | 0.15 | 0.35 | 0.45 | 0.21 | 0.24 |
| Intermediate season | 0.24 | 0.21 | 0.12 | 0.26 | 0.14 | 0.34 | 0.12 | 0.37 | 0.22 | |
| Winter season | 0.25 | 0.11 | 0.11 | 0.18 | 0.27 | 0.18 | 0.05 | 0.01 | 0.14 | |
Table 7.
Inequality Coefficient for the “Ridola” building.
| Building | Season | Inequality Coefficient—IC | ||||
|---|---|---|---|---|---|---|
| Hall | Room 6 | Room 7 | Percussion Room | Average | ||
| “Ridola” building | Summer season | 0.13 | 0.31 | 0.49 | 0.30 | 0.31 |
| Intermediate season | 0.32 | 0.16 | 0.10 | 0.36 | 0.24 | |
| Winter season | 0.18 | 0.07 | 0.17 | 0.17 | 0.15 | |
Table 8.
Inequality Coefficient for the “Bronzini” building.
| Building | Season | Inequality Coefficient—IC | |||
|---|---|---|---|---|---|
| Nino Rota Room | Room 1 | Room 2 | Average | ||
| “Bronzini” building | Summer season | 0.34 | 0.14 | 0.25 | 0.25 |
| Intermediate season | 0.31 | 0.12 | 0.00 | 0.15 | |
| Winter season | 0.11 | 0.12 | 0.17 | 0.13 | |
Table 9.
Dynamic thermal parameters.
| “Sedile” Building | |||
| Yie | Ki | U | Φ |
| W/m2 K | kJ/m2 K | W/m2 K | h |
| 0.003 | 56.1 | 0.631 | 29.11 |
| “Ridola” Building | |||
| Yie | Ki | U | Φ |
| W/m2 K | kJ/m2 K | W/m2 K | h |
| 0.029 | 55.7 | 0.865 | 20.3 |
| “Bronzini” Buliding | |||
| Yie | Ki | U | Φ |
| W/m2 K | kJ/m2 K | W/m2 K | h |
| 0.0009 | 55.10 | 0.53 | 35.52 |
Table 10.
Energy savings of the envelope.
| Building | Energy Strategies | Primary Energy Consumption before Intervention | EPnren before Interventions | EPnren after Interventions | Primary Energy Savings | |
|---|---|---|---|---|---|---|
| kWh | kWh/(m2 year) | kWh/(m2 year) | kWh | % | ||
| “Sedile” building | Transparent envelope | 79,909 | 85 | 68 | 15,723 | 20 |
| Horizontal envelope | 74 | 10,011 | 13 | |||
| Vertical envelope | 80 | 4367 | 5 | |||
| Opaque and transparent envelope | 62 | 21,279 | 27 | |||
| “Ridola” building | Transparent envelope | 103,029 | 88 | 69 | 22,062 | 21 |
| Horizontal envelope | 86 | 2821 | 3 | |||
| Vertical envelope | 77 | 12,434 | 12 | |||
| Opaque and transparent envelope | 54 | 39,344 | 38 | |||
| “Bronzini” building | Transparent envelope | 58,269 | 43 | 34 | 11,810 | 20 |
| Horizontal envelope | 39 | 5864 | 10 | |||
| Vertical envelope | 34 | 12,349 | 21 | |||
| Opaque and transparent envelope | 20 | 31,835 | 55 | |||
Table 11.
Energy savings on plant.
| Buildings | Energy strategies | Primary Energy Consumption | EPnren before Interventions | Primary Energy after Interventions | EPnren after Interventions | Primary Energy Savings | |
|---|---|---|---|---|---|---|---|
| kWh | kWh/(m2 year) | kWh | kWh/(m2 year) | kWh | % | ||
| “Sedile” building | Absorption heat pump and thermostatic valves | 79,909 | 85 | 47,993 | 51 | 31,916 | 40 |
| Compression heat pump and fan coil unit | 70,116 | 75 | 9793 | 12 | |||
| “Ridola” building | Absorption heat pump and thermostatic valves | 103,029 | 88 | 58,912 | 50 | 44,117 | 43 |
| Compression heat pump and fan coil unit | 88,734 | 76 | 14,295 | 14 | |||
| “Bronzini” building | Absorption heat pump and thermostatic valves | 58,269 | 43 | 37,181 | 27 | 21,088 | 36 |
| Compression heat pump and fan coil unit | 71,639 | 53 | −13,370 | −23 | |||
Table 12.
Comparison between electricity consumption measured and simulated.
| Building | Electric Consumption | Average of Electric Consumption | Electric Needs for Lighting | Error | |||
|---|---|---|---|---|---|---|---|
| 2009 | 2010 | 2011 | 2012 | 2009–2012 | |||
| kWh | kWh | kWh | % | ||||
| Sedile building | 37,469 | 44,587 | 31,613 | 27,425 | 35,273 | 33,629 | 5% |
| Ridola building | 19,317 | 19,427 | 13,925 | 16,114 | 17,196 | 14,231 | 17% |
| Bronzini building | 9059 | 10139 | 12046 | 11,653 | 10,724 | 10,260 | 4% |
Table 13.
Energy analysis of present lighting and design lighting for the three buildings.
| Buildings | Present Lighting | Design Lighting | Energy Saving | ||||
|---|---|---|---|---|---|---|---|
| Technology | Global Power | Electric Consumption | Technology | Global Power | Electric Consumption | ||
| W | kWh | W | kWh | % | |||
| Sedile Building | Metal halide lamp and Neon lamp | 20,474 | 33,629 | Led | 1832 | 3010 | 91 |
| Ridola Building | Metal halide lamp and Neon lamp | 5198 | 10,038 | Led | 938 | 1095 | 89 |
| Bronzini building | Metal halide lamp and Neon lamp | 5622 | 10,260 | Led | 2246 | 4099 | 60 |
Table 14.
Economic feasibility study on envelope.
| Building | Energy Strategies | Investment Costs | Pay-Back Time | Investment Costs with Thermal Bill 2.0 Incentives | Pay-Back Time |
|---|---|---|---|---|---|
| € | Year | € | Year | ||
| “Sedile” building | Transparent envelope | 20,296 | 17 | 12,178 | 10 |
| Horizontal envelope | 14,418 | 18 | 8651 | 11 | |
| Vertical envelope | 15,725 | 45 | 9435 | 27 | |
| Opaque and transparent envelope | 50,439 | 31 | 30,263 | 11 | |
| “Ridola” building | Transparent envelope | 31,766 | 19 | 12,706 | 7 |
| Horizontal envelope | 7135 | 30 | 2854 | 12 | |
| Vertical envelope | 8307 | 9 | 3323 | 3 | |
| Opaque and transparent envelope | 47,208 | 16 | 18,883 | 6 | |
| “Bronzini” building | Transparent envelope | 19,381 | 21 | 7752 | 14 |
| Horizontal envelope | 8846 | 19 | 3539 | 8 | |
| Vertical envelope | 10,939 | 11 | 4376 | 5 | |
| Opaque and transparent envelope | 39,166 | 16 | 15,666 | 8 |
Table 15.
Economic feasibility study on plant.
| Building | Energy Strategies | Investment Costs [€] | Pay-Back Time [Year] | Investment Costs with Thermal Bill (TB) 2.0 Incentives [€] | Pay-Back Time Thermal Bill (TB) 2.0 Incentives [Year] |
|---|---|---|---|---|---|
| Palace of “Sedile” | Installation of absorption heat pump and thermostatic valves | 25,554 | 11 | 8944 | 4 |
| Installation of compression heat pump and fan coil unit | 32,932 | 2 | 11,526 | 1 | |
| Palace “Ridola” | Installation of absorption heat pump and thermostatic valves | 19,823 | 6 | 6938 | 4 |
| Installation of compression heat pump and fan coil unit | 37,032 | 3 | 12,961 | 1 | |
| Palace “Bronzini” | Installation of absorption heat pump and thermostatic valves | 13,492 | 8 | 4722 | 3 |
| Installation of compression heat pump and fan coil unit | 19,453 | 5 | 6809 | 2 |
Table 16.
Economic feasibility study on replacement of present lighting with LED technologies.
| Building | Energy Strategies | Investment Costs [€] | Pay-Back Time [Year] | Investment Costs with TB 2.0 Incentives [€] | Pay-Back Time TB 2.0 Incentives [Year] |
|---|---|---|---|---|---|
| “Sedile” building | Replacement of actual lighting system with LED technologies | 25784 | 3 | 9024 | 1 |
| “Ridola” building | Replacement of present lighting system with LED technologies | 4417 | 1 | 1546 | <1 |
| “Bronzini” building | Replacement of present lighting system with LED technologies | 2496 | 1 | 874 | <1 |
Table 17.
Energy saving and pay-back time for combined interventions.
| Building | Energy Strategies | EPnren before Improving | EPnren after Improving | Primary Energy Savings | Investiment Costs | Pay-Back Time | Investiment Costs (TB 2.0 Incentives) | Pay-Back Time (TB 2.0 Incentives) | |
|---|---|---|---|---|---|---|---|---|---|
| kWh/(m2 year) | kWh/(m2 year) | kWh | % | € | Year | € | Year | ||
| “Sedile“ building | Opaque and transparent envelope | 85 | 62 | 21,279 | 27 | 50,439 | 31 | 30,263 | 11 |
| Envelope and installation of absorption heat pump and thermostatic valves | 37 | 45,182 | 57 | 75,993 | 22 | 39,207 | 11 | ||
| Envelope, compression heat pump and fan coil unit | 61 | 57,401 | 28 | 83,371 | 2 | 41,789 | 1 | ||
| “Ridola” building | Opaque and transparent envelope | 88 | 54 | 39,344 | 38 | 19,823 | 16 | 18,883 | 6 |
| Envelope, absorption heat pump and thermostatic valves | 31 | 66,705 | 65 | 37,032 | 13 | 46,581 | 6 | ||
| Envelope, compression heat pump and fan coil unit | 55 | 38,974 | 38 | 47,208 | 6 | 41,286 | 2 | ||
| ”Bronzini” building | Opaque and transparent envelope | 43 | 20 | 31,835 | 55 | 39,166 | 16 | 15,666 | 8 |
| Envelope, absorption heat pump and thermostatic valves | 13 | 41,141 | 71 | 52,657 | 17 | 33,011 | 7 | ||
| Envelope, compression heat pump and fan coil unit | 38 | 6543 | 11 | 58,619 | 9 | 22,475 | 4 | ||
© 2017 by the authors. Licensee MDPI, Basel, Switzerland. This article is an open access article distributed under the terms and conditions of the Creative Commons Attribution (CC BY) license (http://creativecommons.org/licenses/by/4.0/).
Share and Cite
MDPI and ACS Style
Rospi, G.; Cardinale, N.; Negro, E. Energy Performance and Economic Feasibility Study of Historical Building in the City of Matera, Southern Italy. Energies 2017, 10, 2009. https://doi.org/10.3390/en10122009
AMA Style
Rospi G, Cardinale N, Negro E. Energy Performance and Economic Feasibility Study of Historical Building in the City of Matera, Southern Italy. Energies. 2017; 10(12):2009. https://doi.org/10.3390/en10122009
Chicago/Turabian StyleRospi, Gianluca, Nicola Cardinale, and Elisabetta Negro. 2017. "Energy Performance and Economic Feasibility Study of Historical Building in the City of Matera, Southern Italy" Energies 10, no. 12: 2009. https://doi.org/10.3390/en10122009
Note that from the first issue of 2016, this journal uses article numbers instead of page numbers. See further details here.