A Multicriteria GIS-Based Assessment to Optimize Biomass Facility Sites with Parallel Environment—A Case Study in Spain


Abstract
:1. Introduction
2. Materials and Methods
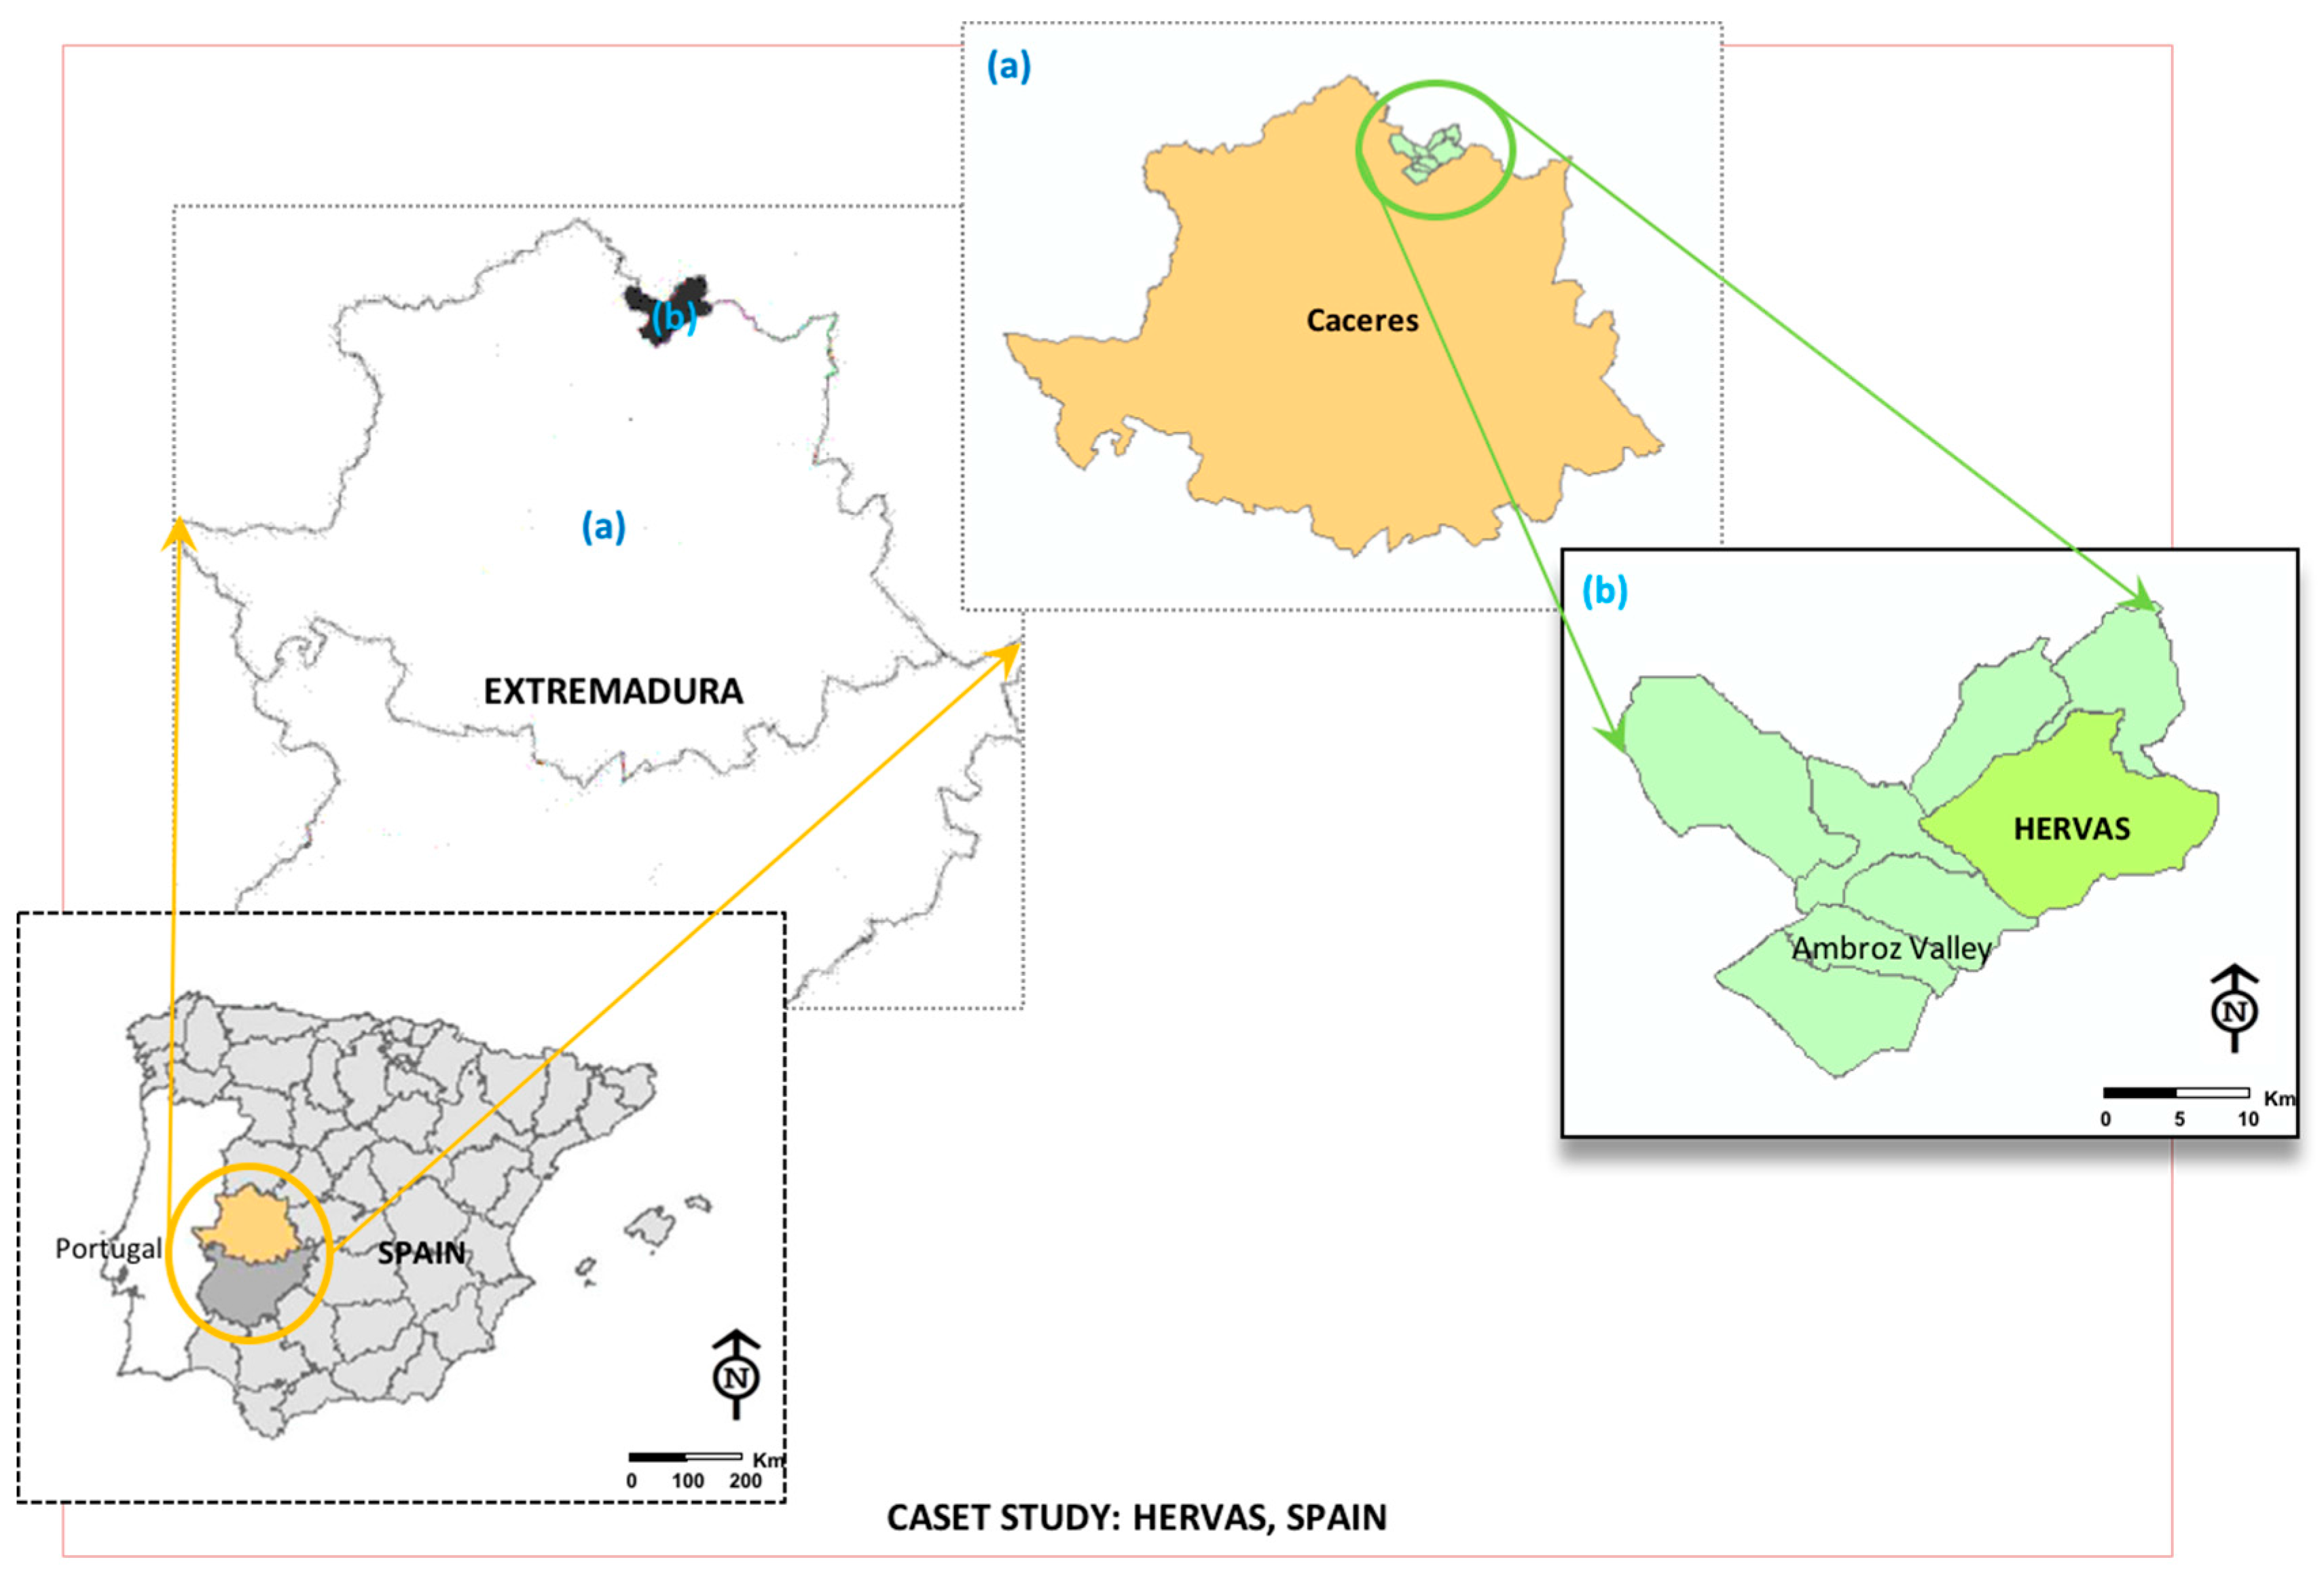
2.1. Proposed Case Study Area
2.2. Spatial Criteria and Constraints Selection and Description
2.2.1. Socio-Economic Criteria
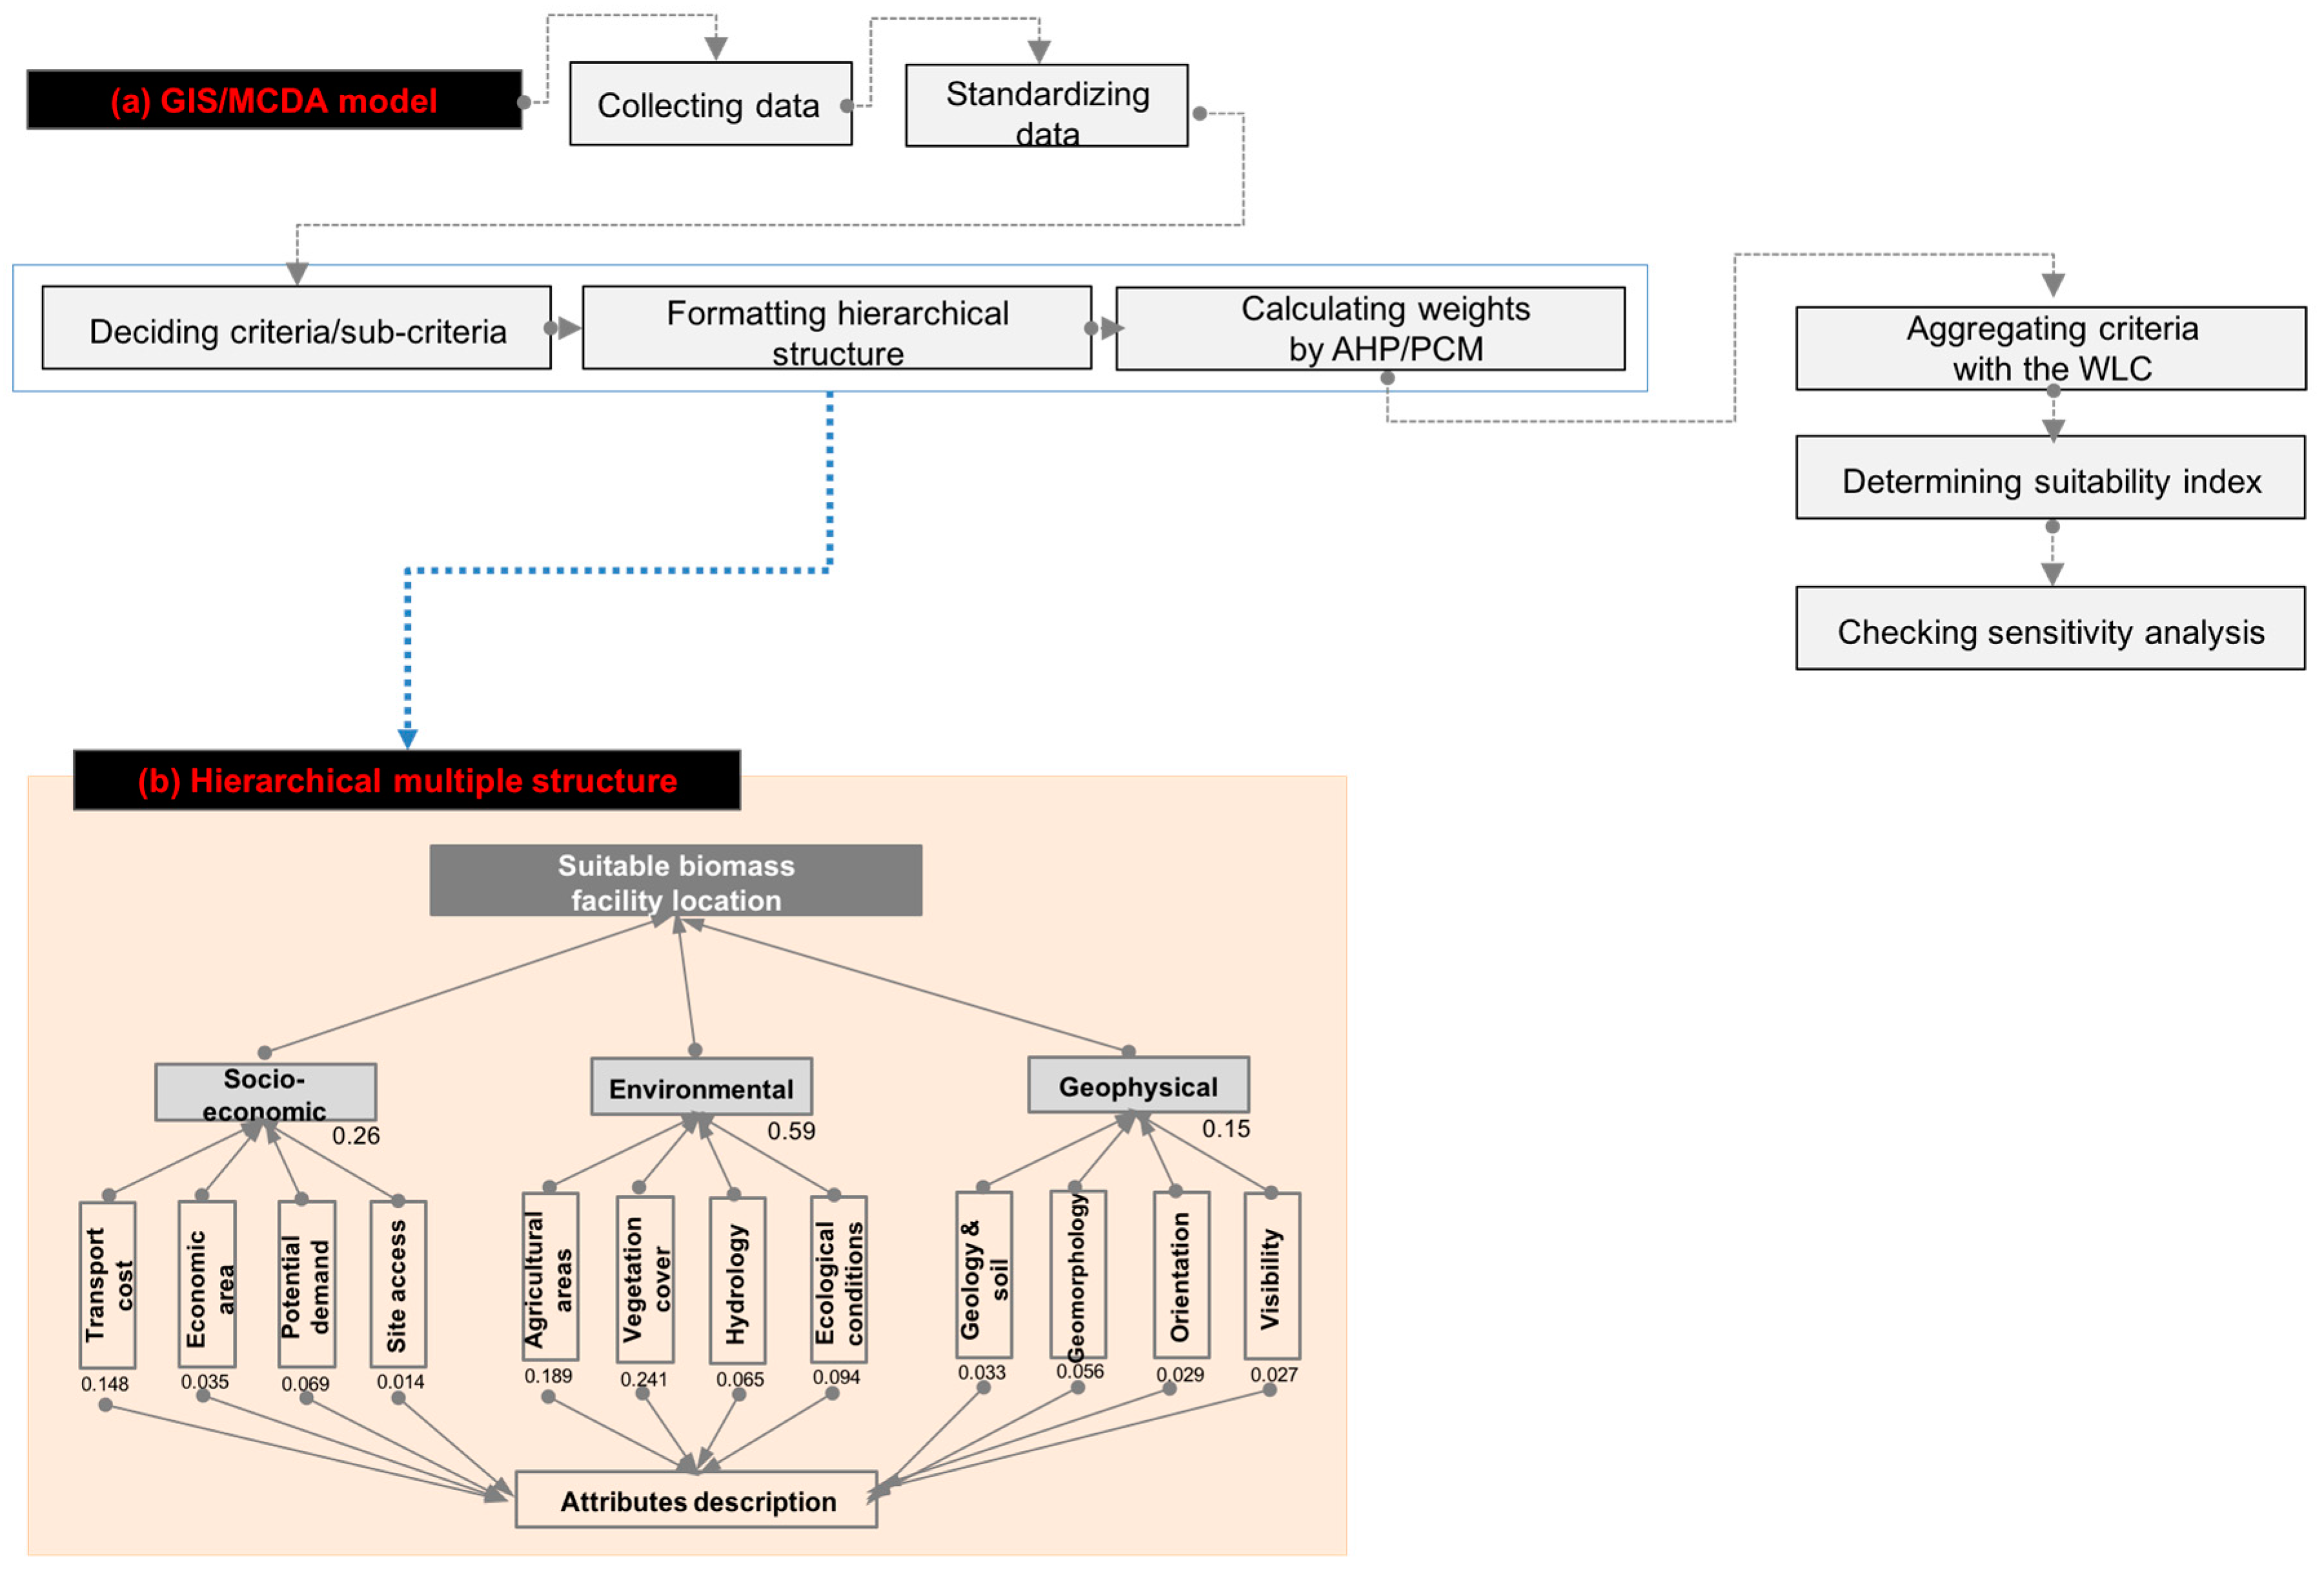
- Transport cost: Transport cost is spatial spread classification of biomass collection and distribution cost. The spatial representation of transport cost with the sub-criterion weight is 0.148.
- Economic area: Economic area is spatial spread classification of economic activities and population density. The spatial representation of economic area with the sub-criterion weight is 0.035.
- Potential demand: Potential demand is spatial spread classification of energy consumption and demand. The spatial representation of potential demand with the sub-criterion weight is 0.069.
- Site access: Site access is spatial spread classification of transport networks, highways, local roads and railways. The spatial representation of site access with the sub-criterion weight is 0.014.
2.2.2. Environmental Criteria
- Agricultural area: Agricultural area is spatial spread classification preserving certain land types. The spatial representation of agricultural area with the sub-criterion weight is 0.189.
- Vegetation cover: Vegetation cover is spatial spread classification conserving natural formations. The spatial representation of vegetation cover with the sub-criterion weight is 0.241.
- Hydrology: Hydrology is spatial spread classification of water bodies and main/second streams of water. The spatial representation of hydrology with the sub-criterion weight is 0.065.
- Ecological condition: Ecological condition is spatial spread classification based on NATURA 2000. The spatial representation of ecological condition with the sub-criterion weight is 0.094.
2.2.3. Geophysical Criteria
- Geology and soil: Geology and soil is spatial spread classification of earth components diversity. The spatial representation of geology and soil with the sub-criterion weight is 0.033.
- Geomorphology: Geomorphology is spatial spread classification of slope and elevation of land surface flow. The spatial representation of geomorphology with the sub-criterion weight is 0.056.
- Orientation: Orientation is spatial spread classification of better aspect for aesthetical reason. The spatial representation of orientation with the sub-criterion weight is 0.029.
- Visibility: Visibility is spatial spread classification of aesthetic protection and valuation. The spatial representation of visibility with the sub-criterion weight is 0.027.
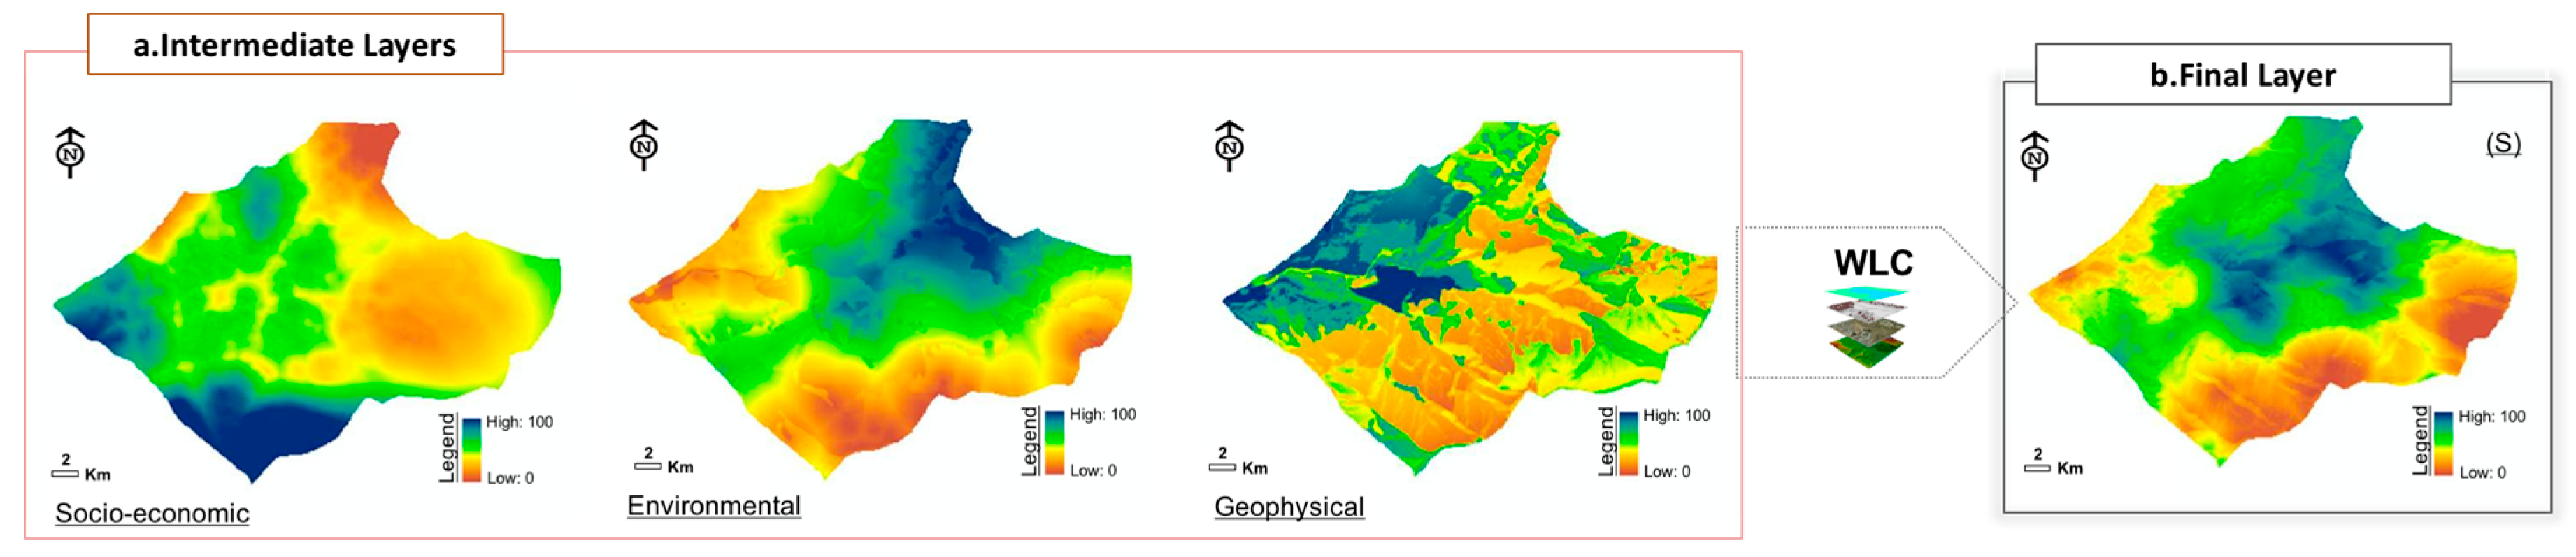
2.3. Multicriteria GIS-MCDA Approach
3. Results and Discussion
4. Conclusions
Acknowledgments
Author Contributions
Conflicts of Interest
References
- Schmidt, J.; Leduc, S.; Dotzauer, E.; Kindermann, G.; Schmid, E. Potential of biomass-fired combined heat and power plants considering the spatial distribution of biomass supply and heat demand. Int. J. Energy Res. 2009, 34, 970–985. [Google Scholar] [CrossRef]
- Vera, D.; Carabias, J.; Jurado, F.; Ruiz-Reyes, N. A honey bee foraging approach for optimal location of a biomass power plant. Appl. Energy 2010, 87, 2119–2127. [Google Scholar] [CrossRef]
- Leduc, S.; Starfelt, F.; Dotzauer, E.; Kindermann, G.; McCallum, I.; Obersteiner, M. Optimal location of lignocellulosic ethanol refineries with polygeneration in Sweden. Energy 2010, 36, 2709–2716. [Google Scholar] [CrossRef]
- Ramírez-Gómez, Á. Research needs on biomass characterization to prevent handling problems and hazards in industry. Part. Sci. Technol. 2016, 34, 4432–4441. [Google Scholar] [CrossRef]
- Hiloidhari, M.; Baruah, D.C. Crop residue biomass for decentralized electrical power generation in rural areas (part 1): Investigation of spatial availability. Renew. Sustain. Energy Rev. 2011, 16, 1885–1892. [Google Scholar] [CrossRef]
- Jeong, J.S.; García-Moruno, L.; Hernández-Blanco, J.; Sánchez-Ríos, A.; Ramírez-Gómez, Á. Identifying priority areas for rural housing development using the participatory multi-criteria and contingent valuation methods in Alange reservoir area, Central Extremadura (Spain). J. Rural Stud. 2017, 50, 117–128. [Google Scholar] [CrossRef]
- Daniela, S.; Stephen, W.; Searcy, W. GIS-based allocation of herbaceous biomass in biorefineries and depots. Biomass Bioenergy 2017, 97, 1–10. [Google Scholar]
- Hermann, S.; Osinski, E. Planning sustainable land use in rural areas at different spatial levels using GIS and modelling tools. Landsc. Urban Plan. 1999, 46, 93–101. [Google Scholar] [CrossRef]
- Wang, H.; Duanmu, L.; Lahdelma, R.; Li, X. Developing a multicriteria decision support framework for CHP based combined district heating systems. Appl. Energy 2017, 205, 345–368. [Google Scholar] [CrossRef]
- Garni, A.; Kassem, A.; Awasthi, A.; Komljenovic, D. A multicriteria decision making approach for evaluating renewable power generation sources in Saudi Arabia Hassan. Sustain. Energy Technol. Assess. 2016, 16, 137–150. [Google Scholar]
- Irfan, M.; Koj, A.; Sedighi, M.; Thomas, H. Design and development of a generic spatial decision support system, based on artificial intelligence and multicriteria decision analysis. GeoResJ 2017, 14, 47–58. [Google Scholar] [CrossRef]
- Blaschke, T. The role of the spatial dimension within the framework of sustainable landscapes and natural capital. Landsc. Urban Plan. 2006, 75, 198–226. [Google Scholar] [CrossRef]
- Jeong, J.S.; Ramírez-Gómez, A. Renewable energy management to identify suitable biomass facility location with GIS-based assessment for sustainable environment. Energy Procedia 2017, 136, 139–144. [Google Scholar] [CrossRef]
- Myllyviita, T.; Homa, A.; Antikainen, R.; Lähtinen, K.; Leskinen, P. Assessing environmental impacts of biomass production chains—Application of life cycle assessment (LCA) and multi-criteria decision analysis (MCDA). J. Clean. Prod. 2012, 29–30, 238–245. [Google Scholar] [CrossRef]
- Herrera-Seara, M.A.; Aznar Dols, F.; Zamorano, M.; Alameda-Hernandez, E. Optimal location of a biomass power plant in the province of Granada analyzed by multi-criteria evaluation using appropriate geographic information system according to the analytic hierarchy process. In Proceedings of the International Conference on Renewable Energies and Power Quality (ICREPQ ’10), Granada, Spain, 23–25 March 2010; European Association for the Development of Renewable Energies, Environment and Power Quality: Granada, Spain, 2010; pp. 484–485. [Google Scholar]
- Perpina, C.; Alfonso, D.; Perez-Navarro, A.; Penalvo, E.; Vargas, C.; Cardenas, R. Methodology based on geographic information systems for biomass logistics and transport optimization. Renew. Energy 2009, 34, 555–565. [Google Scholar] [CrossRef]
- Velazquez-Marti, B.; Fernandez-Gonzalez, E. Mathematical algorithms to locate factories to transform biomass in bioenergy focused on logistic network construction. Renew. Energy 2010, 36, 2136–2142. [Google Scholar] [CrossRef]
- Sahoo, K.; Hawkins, G.L.; Yao, X.A.; Samples, K.; Mani, S. GIS-based biomass assessment and supply logistics system for a sustainable biorefinery: A case study with cotton stalks in the Southeastern US. Appl. Energy 2016, 182, 260–273. [Google Scholar] [CrossRef]
- Ming, Z.; Song, X.; Mingjuan, M.; Xiaoli, Z. New energy bases and sustainable development in China: A review. Renew. Sustain. Energy Rev. 2013, 20, 169–185. [Google Scholar] [CrossRef]
- Mardani, A.; Zavadskas, E.K.; Streimikiene, D.; Jusoh, A.; Nor, K.M.; Khoshnoudi, M. Using fuzzy multiple criteria decision making approaches for evaluating energy saving technologies and solutions in five star hotels: A new hierarchical framework. Energy 2016, 117, 131–148. [Google Scholar] [CrossRef]
- Wang, J.J.; Jing, Y.Y.; Zhang, C.F.; Zhao, J.H. Review on multi-criteria decision analysis aid in sustainable energy decision-making. Renew. Sustain. Energy Rev. 2009, 13, 2263–2278. [Google Scholar] [CrossRef]
- Commission of the European Communities. Biomass Action Plan; Commission of the European Communities: Brussels, Belgium, 2005. [Google Scholar]
- Resch, G.; Gephart, M.; Steinhilber, S.; Klessmann, C.; del Rio, P.; Ragwitz, M. Coordination or harmonisation? Feasible pathways for a European RES strategy beyond 2020. Energy Environ. 2013, 24, 147–170. [Google Scholar] [CrossRef]
- Paredes-Sánchez, J.P.; García-Elcoro, V.E.; Rosillo-Calle, F.; Xiberta-Bernat, J. Assessment of forest bioenergy potential in a coal-producing area in Asturias (Spain) and recommendations for setting up a Biomass Logistic Centre (BLC). Appl. Energy 2016, 171, 133–141. [Google Scholar] [CrossRef]
- European Commission. 2020 by 2020, Europe’s Climate Change Opportunity; COM 30: Brussels, Belgium, 2008. [Google Scholar]
- Diversification and Energy Saving Institute. Biomasa: Climatización; Diversification and Energy Saving Institute: Madrid, Spain, 2008. [Google Scholar]
- Extremadura Energy Agency. Biomasa Para Proyectistas Curso Técnico de Sistemas de Biomasa y Sistemas Híbridos; Extremadura Energy Agency: Mérida, Spain, 2011. [Google Scholar]
- Extremadura Government. DOE 2011—N° 238.qxd; Merida, 2015. Available online: http://doe.gobex.es/pdfs/doe/2015/1140o/15081976.pdf (accessed on 12 December 2016).
- Sumathi, V.R.; Natesan, U.; Sarkar, C. GIS-based approach for optimized siting of municipal solid waste landfill. Waste Manag. 2008, 28, 2146–2160. [Google Scholar] [CrossRef] [PubMed]
- Mardani, A.; Zavadskas, E.K.; Khalifah, Z.; Zakuan, N.; Jusoh, A.; Nor, K.M.; Khoshnoudi, M. A review of multi-criteria decision-making applications to solve energy management problems: Two decades from 1995 to 2015. Renew. Sustain. Energy Rev. 2017, 71, 216–256. [Google Scholar] [CrossRef]
- Malczewski, J. GIS and Multicriteria Decision Analysis; John Wiley & Sons: New York, NY, USA, 1999. [Google Scholar]
- Jeong, J.S.; García-Moruno, L.; Hernández-Blanco, J.; Sánchez-Ríos, A. Planning of rural housings in reservoir areas under (mass) tourism based on a fuzzy DEMATEL-GIS/MCDA hybrid and participatory method for Alange, Spain. Habitat Int. 2016, 57, 143–153. [Google Scholar] [CrossRef]
- ArcGIS 10.2. Environmental Systems Research Institute (ESRI). 2016. Available online: http://desktop.arcgis.com/en/arcmap/10.3/analyze/modelbuilder/executingtools-in-modelbuilder-tutorial.htm (accessed on 23 November 2016).
- ESRI. About the ArcGIS Network Analyst Extension Tutorial. 2016. Available online: http://desktop.arcgis.com/en/arcmap/latest/extensions/network-analyst/about-the-networkanalyst-tutorial-exercises.htm (accessed on 23 November 2016).
- Extremadura Energy Agency. La Biomasa Forestal; Extremadura Energy Agency: Merida, Spain, 2016. [Google Scholar]
- Extremadura Energy Agency. Valorización de la producción de biomass en Extremadura. Proyecto BIOTERMI; Extremadura Energy Agency: Mérida, Spain, 2014. [Google Scholar]
- Akyuz, E.; Celik, E. A fuzzy DEMATEL method to evaluate critical operational hazards during gas freeing process in crude oil tankers. J. Loss Prev. Process Ind. 2015, 38, 243–253. [Google Scholar] [CrossRef]
- Zadeh, L.A. Fuzzy sets. Inf. Control 1965, 8, 338–353. [Google Scholar] [CrossRef]
- Pavlikakis, G.E.; Tsihrintzis, V.A. A quantitative method for accounting human opinion, preferences and perceptions in ecosystem management. J. Environ. Manag. 2003, 68, 193–205. [Google Scholar] [CrossRef]
- Saaty, T.L. A scaling method for priorities in hierarchical structures. J. Math. Psychol. 1977, 15, 234–281. [Google Scholar] [CrossRef]
- Meszaros, C.; Rapcsak, T. On sensitivity analysis for a class of decision systems. Decis. Support Syst. 1996, 16, 231–240. [Google Scholar] [CrossRef]
- Selçuk, L. An avalanche hazard model for Bitlis Province, Turkey, using GIS based multicriteria decision analysis. Turk. J. Earth Sci. 2013, 22, 523–535. [Google Scholar] [CrossRef]
- Chen, Y.; Yu, J.; Khan, S. Spatial sensitivity analysis of multi-criteria weights in GIS based land suitability evaluation. Environ. Model. Softw. 2010, 25, 1582–1591. [Google Scholar] [CrossRef]
- Jaraíz Cabanillas, F.J.; Mora Aliseda, J.; Gutiérrez Gallego, J.A.; Jeong, J.S. Comparison of regional planning strategies: Countywide general plans in USA and territorial plans in Spain. Land Use Policy 2013, 30, 758–773. [Google Scholar] [CrossRef]
- Jeong, J.S.; García-Moruno, L.; Hernández-Blanco, J.; Jaraíz-Cabanillas, F. An operational method to supporting siting decisions for sustainable rural second home planning in ecotourism sites. Land Use Policy 2014, 41, 550–560. [Google Scholar] [CrossRef]
- González-Gómez, D.; Jeong, J.S.; Cañada-Cañada, F. Performance and perception in the flipped learning model: An initial approach to evaluate the effectiveness of a new teaching methodology in a general science classroom. J. Sci. Educ. Technol. 2016, 25, 450–459. [Google Scholar] [CrossRef]
- Jeong, J.S.; González-Gómez, D.; Cañada-Cañada, F. Students’ perceptions and emotions toward learning in a flipped general science classroom. J. Sci. Educ. Technol. 2016, 25, 747–758. [Google Scholar] [CrossRef]


| Territorial Type | Surface (ha.) | Percentage (%) |
|---|---|---|
| Reservoir and urban area | 66,646 | 1.60 |
| Agricultural area | 938,368 | 22.54 |
| Peripheral agricultural area | 326,792 | 7.84 |
| Forest area | 2,831,651 | 68.02 |
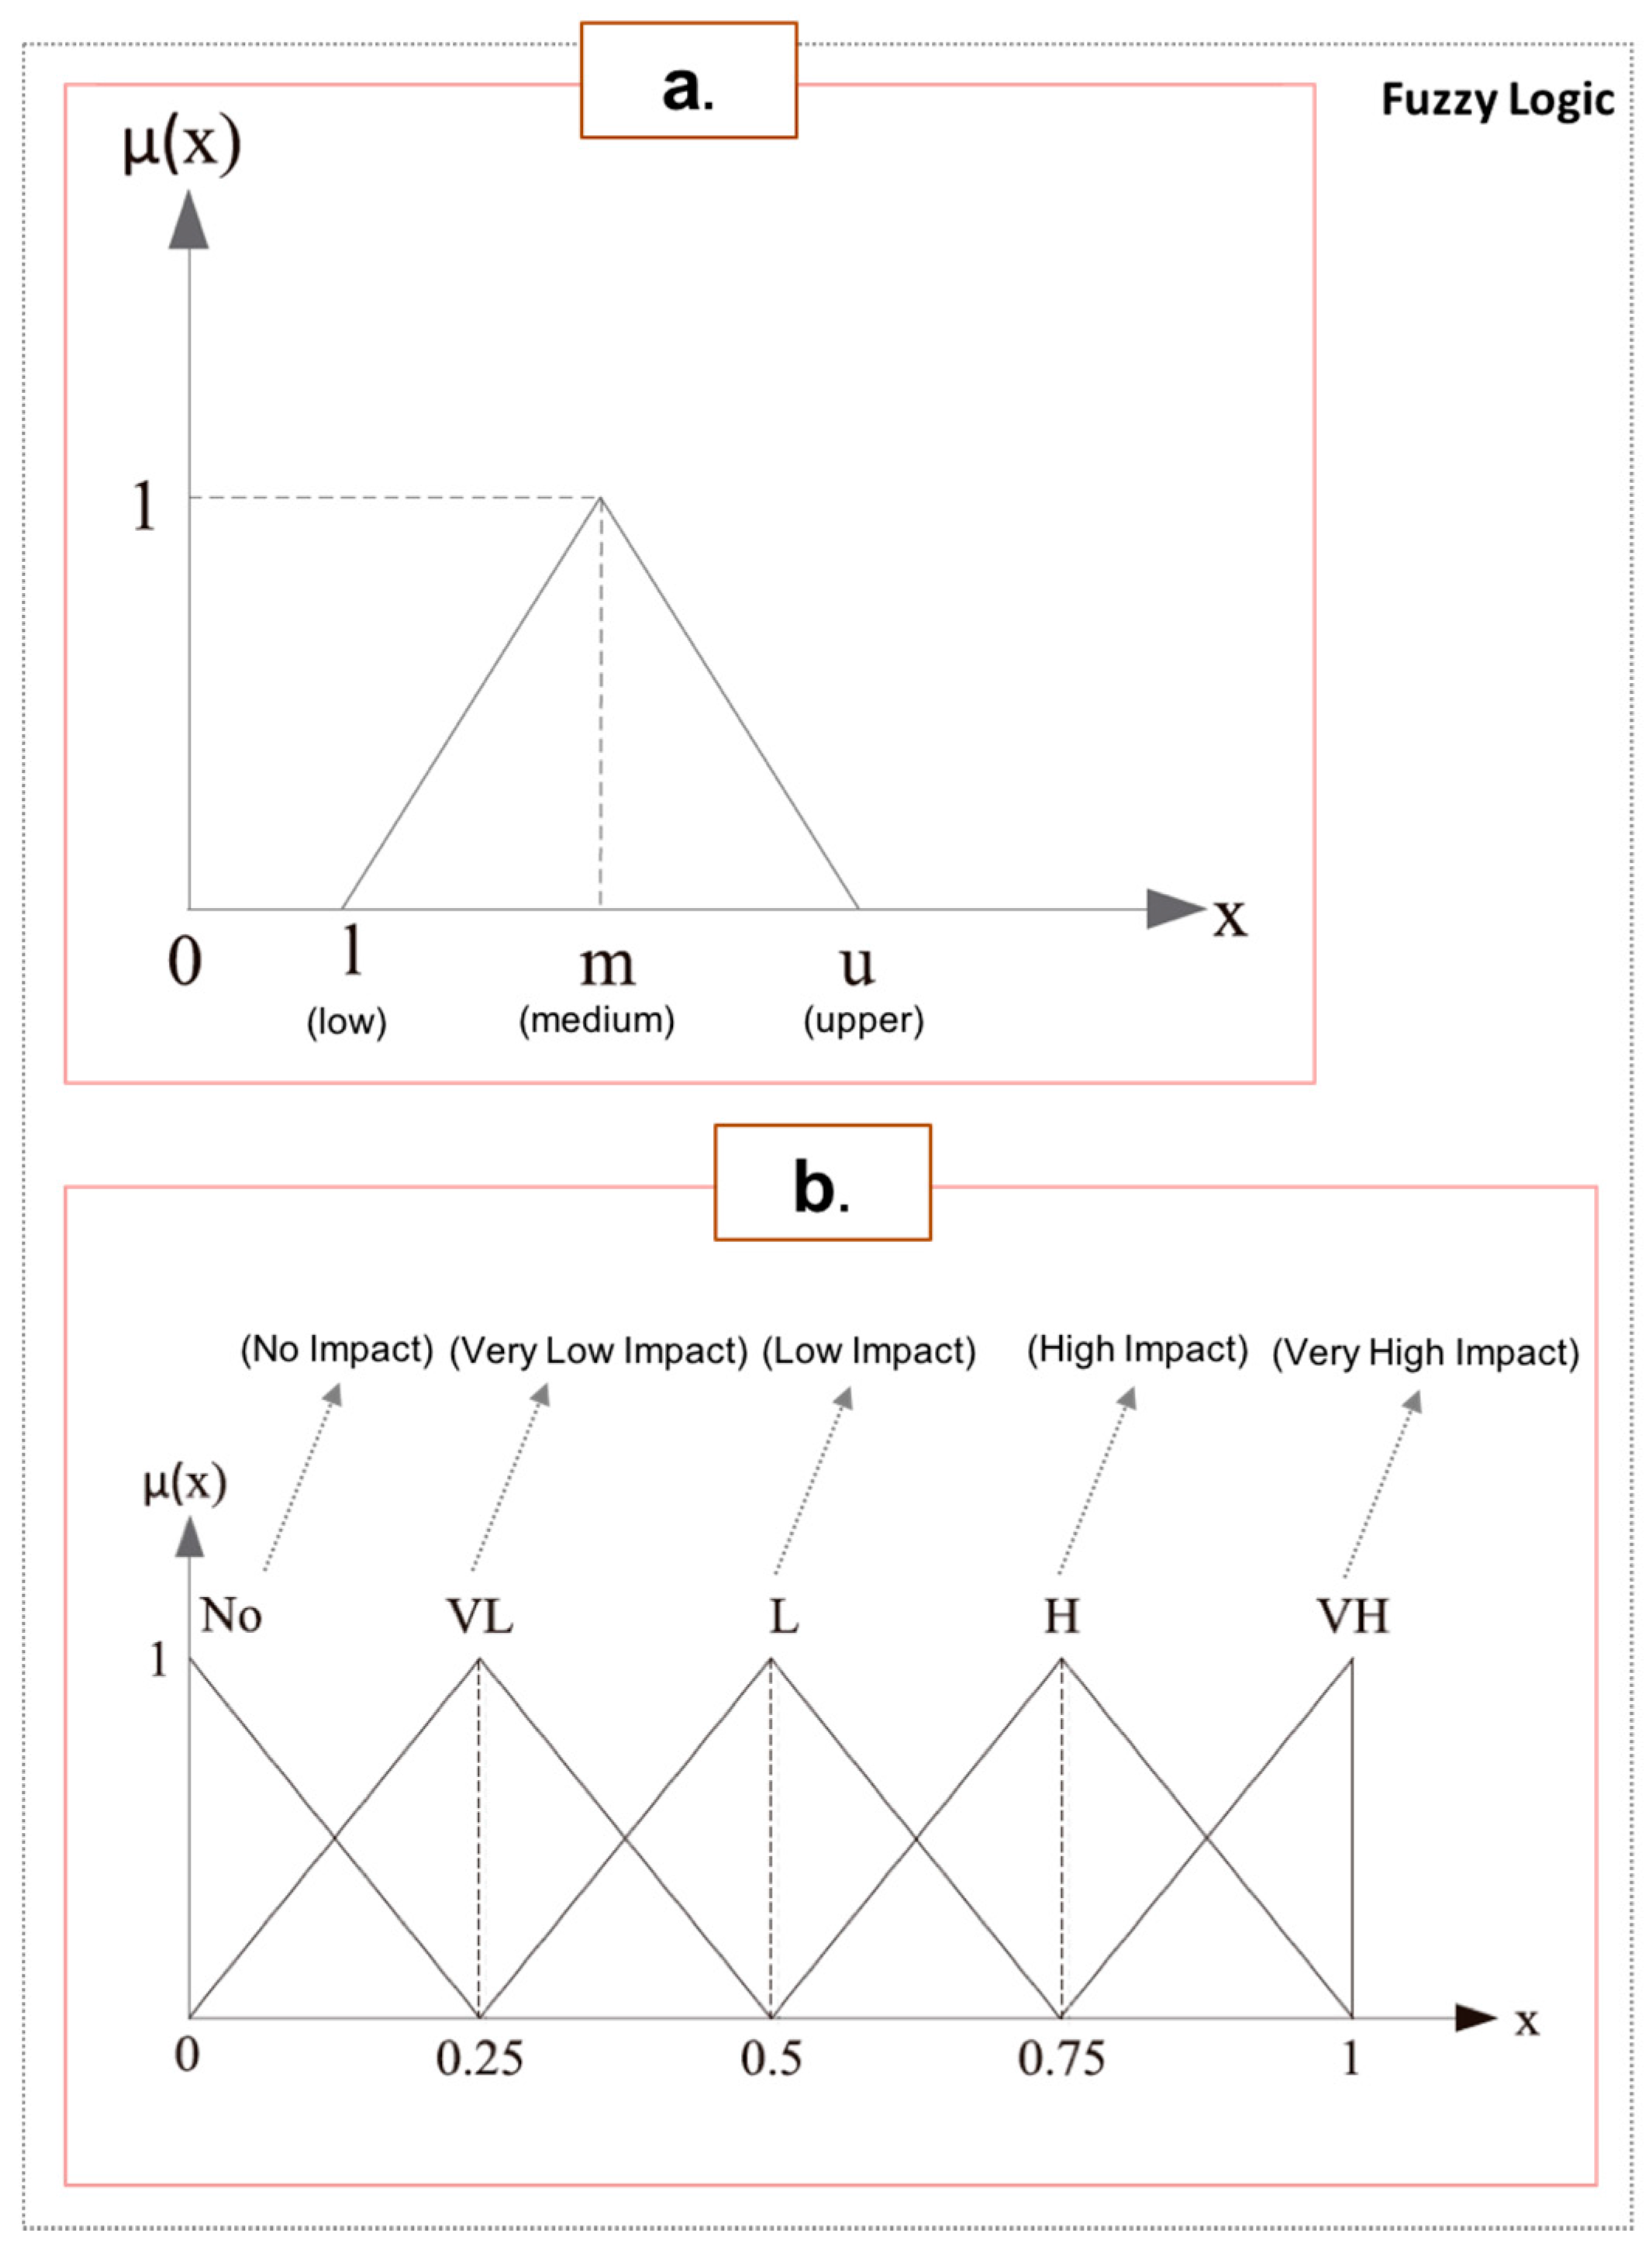
| Linguistic Terms | Linguistic Values | Triangular Fuzzy Numbers |
|---|---|---|
| No impact | 0.00 | (0.00, 0.00, 0.25) |
| Very low impact | 0.25 | (0.00, 0.25, 0.50) |
| Low impact | 0.50 | (0.25, 0.50, 0.75) |
| High impact | 0.75 | (0.50, 0.75, 1.00) |
| Very high impact | 1.00 | (0.75, 1.00, 1.00) |
| Suitability Value Index | Score | Description |
|---|---|---|
| Not suitable | 0–20 | Suitable location for biomass facility is not existed |
| Slightly suitable | 20–40 | Suitable location for biomass facility is low |
| Moderately suitable | 40–60 | Suitable location for biomass facility is medium |
| Suitable | 60–80 | Suitable location for biomass facility is high |
| Highly suitable | 80–100 | Suitable location for biomass facility is very high |
© 2017 by the authors. Licensee MDPI, Basel, Switzerland. This article is an open access article distributed under the terms and conditions of the Creative Commons Attribution (CC BY) license (http://creativecommons.org/licenses/by/4.0/).
Share and Cite
Jeong, J.S.; Ramírez-Gómez, Á. A Multicriteria GIS-Based Assessment to Optimize Biomass Facility Sites with Parallel Environment—A Case Study in Spain. Energies 2017, 10, 2095. https://doi.org/10.3390/en10122095
Jeong JS, Ramírez-Gómez Á. A Multicriteria GIS-Based Assessment to Optimize Biomass Facility Sites with Parallel Environment—A Case Study in Spain. Energies. 2017; 10(12):2095. https://doi.org/10.3390/en10122095
Chicago/Turabian StyleJeong, Jin Su, and Álvaro Ramírez-Gómez. 2017. "A Multicriteria GIS-Based Assessment to Optimize Biomass Facility Sites with Parallel Environment—A Case Study in Spain" Energies 10, no. 12: 2095. https://doi.org/10.3390/en10122095
APA StyleJeong, J. S., & Ramírez-Gómez, Á. (2017). A Multicriteria GIS-Based Assessment to Optimize Biomass Facility Sites with Parallel Environment—A Case Study in Spain. Energies, 10(12), 2095. https://doi.org/10.3390/en10122095