1. Introduction
The smart grid (SG) aims to address most of the shortcomings of the existing electrical grid by integrating information and communication technologies to improve its performance. SG implementation will involve a set of communication networks that allow SG sub-systems, such as the advanced metering infrastructure (AMI), to integrate a number of devices and technologies to enable improvement in the electric power system in terms of reliability, efficiency, economics and environment. This ambitious modernisation of the electrical grid is only feasible by dint of a seamless integration between devices and technologies, which include:
smart meters at the consumer end,
two-way communication networks at different infrastructures,
data management systems and
software application platforms to interface with utilities’ control end.
In terms of reference design, the IEEE-2030-2011 standard [
1] provides architectural perspectives to support interoperability among SG system components, which broadly includes power and Information and Communications Technology (ICT) domains. Within the communication domain, the standard further provides a set of guidelines on communication networks, protocols and media to interconnect functional blocks, such as generation, transmission and distribution in the power domain. From the implementation perspective, the Communications Technology (CT) specifies three levels of network, namely [
2]: Home Area Network (HAN), Neighbourhood Area Network (NAN) and Wide Area Network (WAN). In the NAN, traffic sources, such as smart meters, are required to collect time-based data for real-time, reliability-sensitive applications from consumers. This information is then transmitted through available communication networks to the data concentrator or utility control centre [
3]. The static multi-hop Wireless Mesh Network (WMN) is a promising communication technology for enabling AMI applications. However, due to the nature of SG and the challenges of interference and channel errors associated with IEEE 802.11 [
4] wireless channels, efficient routing protocols are necessary to drive optimal packet delivery in a bid to meet or surpass the traffic QoS of AMI applications over WMN.
Quality-of-service (QoS) is the capability of a network to provide certain features in terms of delay, reliability, bandwidth and availability. Due to the complexities of SG traffic and the constraints of wireless networks, it has become essential to retrofit QoS components in the conventional WMN to satisfy the high reliability requirement of SG applications [
5]. The varying SG application traffic types in NAN may have different constraints for QoS, such as latency, bandwidth and packet delivery. This raises the need for QoS-aware routing in smart meters that will be deployed as mesh nodes in WMN-based NANs. QoS differentiation in existing communication networks is normally achieved through resource reservation, traffic classification and prioritization. Specifically, various approaches can be employed to prioritize important delay-critical data over loss-critical data. For instance, many MAC layers (e.g., 802.11e and 802.16) support the specification of different traffic categories, and they use scheduling algorithms to provide bandwidth differentiation [
6,
7]. However, MAC-based solutions are generally limited to providing QoS guarantees on single communication links, which also requires further enhancement to be effective in multihop scenarios, such as WMN-based NANs [
8].
The multiple hop capability in WMN is achieved through routing protocols, which rely strictly on the link metrics to select the best paths to destinations. Packets for different applications may also be lost, altered or delayed during transmission as a result of congestion, protocol errors or link disruptions. Therefore, adopting suitable mechanisms to enforce QoS guarantees on different network flows based on the constraints and requirement of SG application traffic is crucial to achieving a high level of communication reliability. Given that an important factor in meeting these requirements in WMN-based NAN is the use of routing protocols, the objective of this article is to improve the Optimised Link State Routing (OLSR) Protocol in order to satisfy the required level of reliability in NAN. Existing routing protocols, such as OLSR, select paths to a destination using a single link metric that is calculated from a specific parameter (delay or packet loss) to provide precise link state information about the network. Though the use of multiple link metrics with routing protocols have been considered for reliability improvement in WMN, they have been non-trivial and turned out to be NP-complete (Nondeterministic Polynomial time-complete problems are problems for which it is difficult to estimate the steps or the time required to solve them). This article modifies the OLSR protocol by combining multiple link metrics with the Analytical Hierarchy Process (AHP) algorithm to route SG application traffic in NAN across multiple paths to a data concentrator. The multiple metrics OLSR developed in ns-2 is aimed at selecting optimal links to adaptively provide QoS routing to satisfy targeted SG application traffic. It is worth noting that this work is exploratory and aims to retrofit QoS in order to allow backward compatibility and non-disruptive integration with legacy protocols.
The remainder of this paper is organised as follows.
Section 2 presents a background and related research work on routing in WMN-based NAN.
Section 3 describes the proposed method of retrofitting QoS in NAN. The multiple metrics implementation using AHP is described in
Section 4, while the simulation study and results are presented in
Section 5. Finally,
Section 6 highlights the main findings of this work.
2. Background and Related Work on Routing in WMN-Based NAN
WMN-based NAN refers to a number of household smart meters that establish a cooperative connection of the IEEE 802.11 standard network and are fully meshed or able to send and forward household traffic across multiple intermediate smart meters to a destination with the aid of routing protocols. Although the IEEE 802.15.4g wireless standard has made outstanding progress in HAN, plans to extend its capabilities to the area of NAN are being explored. However, there are still various problems, one of which is its limited data rates, which will not provide the required bandwidth capacity for NAN. This section discusses IEEE 802.11 standards that can operate in NAN based on WMN and surveys the routing protocols that have been modified for data transfer in the NAN.
2.1. IEEE 802.11 Standards Built for WMN
The IEEE 802.11 (Wi-Fi) defines a set of Physical (PHY) and Media Access (MAC) layer specifications for implementing Wireless Local Area Networks (WLANs). Though the success of the standard has been attributed to the use of unlicensed operating frequency bands and flexible availability of low cost radio interfaces, the increasing physical layer bandwidth is another essential factor for its success. The IEEE 802.11 standard comprises the 802.11a/b/g/n and /ac technologies operating in frequency bands of 2.4 GHz and 5 GHz with PHY data rates and coverage distance up to 500 Mbps and 300 meters, respectively [
9]. Presently, the 802.11ad, also known as WiGig, is the latest addition to the IEEE 802.11 standards suite. 802.11ad-enabled devices operate in tri-band of 2.4 GHz, 5 GHz and 60 GHz and allow communication at multi-giga speeds up to 7 Gbps. Though it maintains compatibility with existing 802.11 devices, 60 GHz cannot penetrate walls. However, 802.11ad switches to make use of the lower band frequencies at a much lower rate to enable it to propagate through walls. The high throughput and PHY layer data rates of the IEEE 802.11 standard, as well as the extended coverage distance ability when deployed as ad hoc WMN can provide reliability and redundant paths for application traffic sent from smart meters to data concentrators in NAN; where a node can send information to a destination across multiple intermediate smart meters. However, reliability in 802.11 ad hoc WMN is not only dependent on the throughput and data rate capabilities, but also the ability of the routing protocols to find good and reliable paths to a destination.
Among the WMN options, the IEEE 802.11s [
10] is the standard wireless mesh deployment with WLANs. It extends the IEEE 802.11 standard by adding self-forming multi-hop mesh networking capability into the MAC layer of the IEEE 802.11. The IEEE 802.11s also incorporates routing at the MAC layer and uses the IEEE 802.11e [
10] MAC enhancement for QoS support. IEEE 802.11s uses the hybrid wireless mesh protocol (HWMP) as a default routing protocol; however, ad hoc link state routed protocols, such as OLSR, may also be supported [
10]. Although the IEEE 802.11s was approved in 2012, it is still being investigated to identify potential performance and QoS issues in large networks, such as NAN.
2.2. Routing in WMN-Based NAN
In WMN, routing protocols are responsible for finding paths whenever a packet is to be sent from a source node to a destination node with the help of intermediate nodes. Therefore, routing protocols for NAN-based WMN must have sufficient capabilities to support QoS routing and the different requirements of target applications. In [
11], a performance evaluation and comparison of OLSR and the WMN standard Protocol the HWMP in ns-3 are presented. This paper was used to highlight the use of the OLSR routing protocol in NAN. Since the performance of these applications has to be determined in objective terms against a set of pre-defined QoS attributes, such as delay and packet delivery ratio, in [
12], the conference paper “Multiple Metrics-OLSR in NAN for Advanced Metering Infrastructures” presented the possibility of using AHP and multiple metrics in OLSR for NAN-based WMN to support QoS for the different application traffic types. This was achieved by presenting a case study to show the application traffic best supported by a link metric type and a demonstration of how the AHP algorithm (Equations (3), (5) and (7)) can be used to map paths calculated by a link metric to an application traffic type. The improvement of this article compared with [
11,
12] is that this article presents an implementation of the AHP in ns-2 using a simulation topology that represents a worst case scenario of AMI activities (where all smart meter nodes are transmitting four different application traffic types simultaneously to a data concentrator) in a five by five grid size NAN-based WMN. Equations (3), (5) and (7) are a demonstration of how the AHP is calculated, and they reference the proposed methodology presented in the second conference paper.
A number of routing protocols have been modified to improve the reliability of routing in SG NAN. Instead of a detailed survey on routing protocol modification for NAN, we concentrate on the modifications related to our proposal. The Ad hoc On-Demand Routing protocol (AODV) is an on-demand routing protocol in which routes are established upon necessity. In [
13], the authors modified the AODV protocol, such that selected nodes were provided with more intelligence, which contributed to lower latency, compared to the original AODV and made it useful for demand response (DR) and electronic vehicle (EV) charging application traffic types. A table-driven AODV, which utilised multiple paths and HAN parameters to improve the reliability of traffic in HAN, is also presented in [
14].
Dynamic source routing (DSR) protocol is also an on-demand routing protocol that uses the concept of source routing; it requires a node to maintain a route cache, which contains source routes that are known by all other nodes. The route cache is continually updated as the nodes learn new routes to the source node. It is based on the RFC4728 [
15]. In [
16], an evaluation of AODV in a grid-based cluster was carried out. The study considered energy consumed in transmit, receive and idle modes, as well as residual battery capacity. Though the results show that AODV has a better consumption of energy than DSR, the residual battery capacity showed similar values for both protocols.
Distributed autonomous depth-first routing (DADR) is a proactive distance vector protocol that uses a control mechanism to provide at most k (if available) paths for each destination. In [
17], a simulation that involved 2000 smart meters was presented, and the results show that DADR learns new routes in large-scale indoor and outdoor networks with low overheads. The study also revealed that packet latency in a flat mesh network is affected by the several hops that data packets traverse to reach their destination.
HWMP is the default routing protocol for IEEE 802.11s WLAN mesh networking. It was developed to allow interoperability between devices from different vendors; HWMP serves as a common path selection protocol for every device that is compliant with the IEEE 802.11s standard. The authors in [
18,
19] considered the use of HWMP in an SG deployment by reducing the broadcast storm caused by Address Resolution Protocol (ARP) and utilizing the air cost metric (failure rate of each node calculated by the MAC re-transmission count of each packet) as a performance metric. The proposed method gives more priority to re-transmission of small packets, as they are likely to have fewer bit errors. As a consequence, the protocol becomes more adapted for the NAN domain and improves reliability for the applications that are part of the SG architecture.
Though these modifications have improved reliability in SG NAN to a certain extent, they do not guarantee QoS for targeted application traffic types. Furthermore, these protocols mostly utilize the Extended Transmission Count (ETX) as their link metric, which is deficient in certain aspects while calculating paths to a destination. Efforts have been made to enhance QoS features in 802.11 standards through the introduction of 802.11e standards; they are known to be suitable for only single hop communication. This article proposes to improve the OLSR routing protocol using multiple metrics to prioritise the application traffic, as well as to improve the reliability in NAN. There have been numerous QoS-based routing protocols proposed for multi-media applications; some of the routing protocols related to our proposal, that can also be used in the context of NAN, include the following:
The QUality Of service RoUting in wireless Mesh networks (QUORUM) proposed in [
20] integrates an end-to-end packet delay estimation mechanism with stability-aware routing policies, which allows it to accurately follow QoS requirements of streaming media, such as VOIP, while also minimising the misbehaviour of selfish nodes. The routing protocol provides QoS guarantees to media applications based on metrics of minimum bandwidth and maximum end-to-end delay.
The Hybrid QoS-based Routing Protocol for Wireless Mesh Environment (HQMR) proposed by Bargaoui et al. [
21] presented a QoS-based routing protocol that ensures forwarding real-time and streaming applications with QoS guarantee in a mesh wireless environment. This was achieved through the development of a clustering algorithm to enhance scalability issues within the mesh infrastructure and the use of two routing sub-protocols. The sub-protocols consist of a reactive routing protocol for intra-infrastructure communications and a proactive QoS-based multi-tree routing protocol for communications with external networks.
The Mesh Admission control and QoS Routing with Interference Awareness (MARIA) routing scheme was proposed in [
4]. MARIA uses a conflict graph to model both inter- and intra-flow interference in wireless networks. An on-demand routing scheme that explicitly incorporates the interference model in the route discovery process is implemented to direct routing message propagations and avoid paths with severe interference.
Implementing cross-layer QoS guarantees in NAN-based WMN using the techniques presented in the aforementioned routing schemes can improve reliability across multiple smart meter nodes equipped with the IEEE 802.11 radio in an SG NAN.
3. Proposed Method
Link state routing protocols such as OLSR update routing paths to a destination based on parameters’ calculation provided by a link metric. The selected paths are then used as the default routes for data flow to the destination in the network. In order for the routing decision to consider the parameters or priority of the application traffic types transmitted in NAN, a combination of ETX, Minimum Delay (MD) and Minimum Loss (ML) with OLSR is used to select the best route for a target application traffic type. The proposal by [
22,
23] is tailored for use in NAN based on WMN. The implementation procedure of the proposed routing protocol named OLSR
is discussed in the following subsections.
3.1. The Use of Multiple Link Metrics
The performance of routing protocols is dependent on the packet size and packet generation rate of the traffic being transmitted. Therefore, there are tendencies that different link metrics will perform differently when used to transmit variable application traffic types. Some of the link metrics that have already been implemented with OLSR are the ETX, MD and ML. The ETX measures the number of transmissions, including re-transmissions, needed to send a unicast packet over a wireless link. The expected number of transmissions necessary to deliver the data packet considering both its transmission and successful acknowledgement as required by the IEEE 802.11 protocol is evaluated as [
24]:
where
and
are the forward and reverse delivery ratio of broadcast probe packets of a fixed size transmitted periodically.
The ETX link metric used in OLSR is deficient in certain aspects, these include: (i) inability to model the transmission interference and channel errors [
25]; (ii) inability to model accurately the delivery rate of a network link since it does not consider the forwarding behaviour of nodes that have established such links [
24]; (iii) inability to distinguish between links with different capacities; and (iv) the loss probability of small probes differ from that of the data packets [
26]. The OLSR-ML (Minimum Loss) Passos et al. [
27], as the name implies, selects paths with minimum loss rates using the probability of successful transmission of forward and reverse link delivery ratios. Unlike ETX, the route probability in ML is given by the product of the link probabilities, instead of the sum of their inverse probabilities. ML has the advantage of eliminating high loss rate routes, but the disadvantage is that some low quality links may still be considered in choosing a given route. It is given as:
where
is the probability of the successful delivery of probe packets from the source to the destination and from the destination to the source (reverse direction).
OLSR-MD (Minimum Delay) [
28] proposed by Cordeiro et al. selects paths between nodes with the lowest sum of transmission delays to the destination. The transmission delay measurement comes from the ad hoc probe, which is a great advantage, because it takes into account the differences in clock synchronization. The different link metrics being studied trade off between different QoS parameters. For example, a routing protocol using a particular link metric can achieve high throughput values at the cost of increased end-to-end delay in the case of static networks like SG [
29].
Considering the problems with the single metric and the fact that AMI functionality is dependent on the ability of different application traffic to meet certain performance requirements, this work explores multiple metrics with OLSR to improve WMN’s ability to provide QoS guarantees to a variety of traffic types in the NAN.
3.2. Pruning Routing Tables
In the context of route link metric values, pruning is a process of eliminating links that have quality values greater than or equal to a given threshold. The threshold can be determined in different ways, such as calculating the median values of all available links to the destination and discarding links with values above or below this threshold. This is done to minimise the number of links to be considered, as well as to reduce the computational complexity of the AHP algorithm. In this article, pruning was carried out by selecting the best four values of each link metric and applying the decision making algorithm to calculate the best quality route to a destination.
3.3. Multi-Criteria Decision Making Technique
Though the selection of a route to destination in WMN based on a combination of multiplicative metrics has been proven to be NP-complete [
30], MCDM techniques, such as the AHP and pruning proposed in [
23], have been used to get around the NP-completeness. AHP is a robust and flexible multi-criteria decision analysis methodology of measurement and widely known in the field of decision-making when different qualitative and quantitative criteria must be applied [
31]. This methodology is already being used in a number of applications in the field of telecommunications [
22,
23], petroleum pipeline network [
32], project management [
33] and health services. By making minor changes to the original AHP methodology, it was used in [
23] to decide the best route for multimedia applications to a given destination. This approach is adapted to explore the possibility of providing good quality routes and QoS support for different traffic types characterized by various requirements in the NAN. These changes include pruning, which is applied before the first AHP step to eliminate the paths exceeding the desired threshold, thereby reducing AHP’s computations, and the use of weight assignment between zero and one; this is to better reflect the importance of one metric over another. Of all of the existing MCDM techniques that have been applied for decision-making in communication systems, the AHP is regarded as the best because it has support for multi-dimensional criteria. It has also been applied in OLSR and showed better routes compared to other metrics.
4. Multiple Metrics Implementation
The multiple metrics using AHP and OLSR are designed to use a cross-layer approach that will bridge the application layer and the network layer by making routing decisions based on the requirement of the application traffic and the link metrics provided by the network.
4.1. Implementation Overview and Description
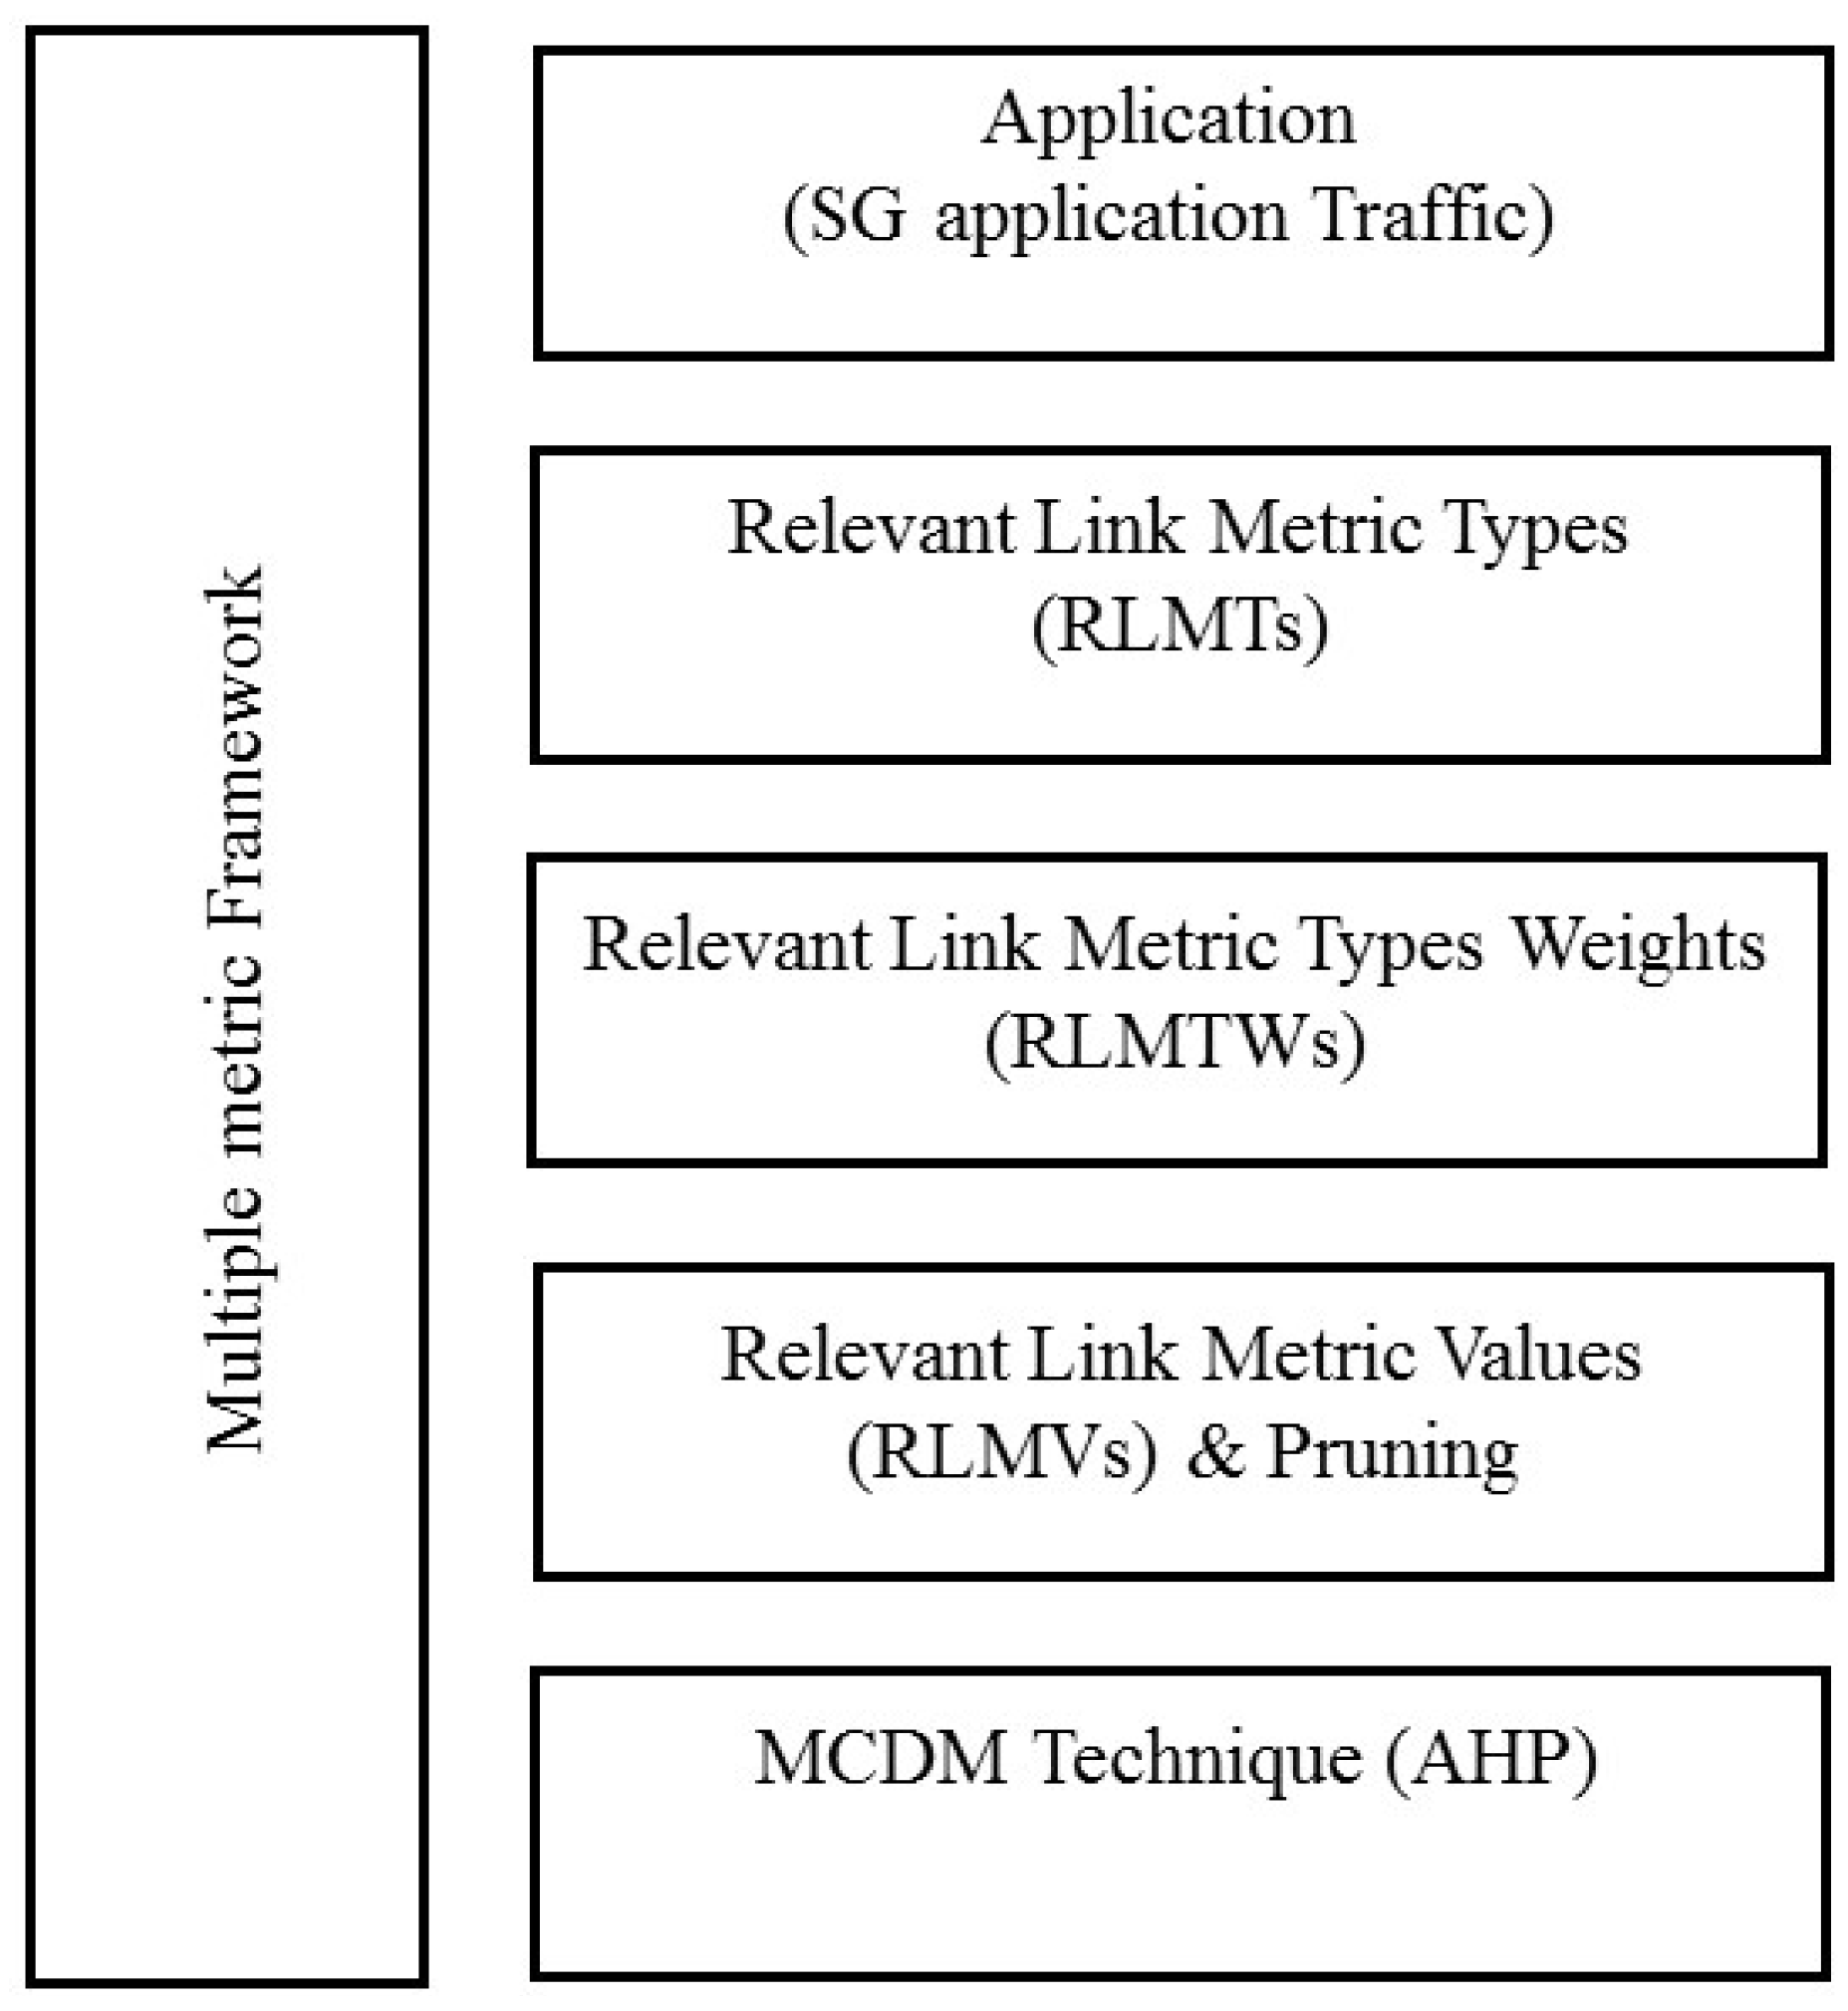
The multiple metrics framework is broken down into five components, which are presented in
Figure 1. These components include: the application traffic types, the Relevant Link Metric Type (RLMT) for the application traffic types, the weights assigned to the RLMT for a target application, pruning of RLMTs and the decision-making technique (AHP). A brief description of each component is given as follows.
4.1.1. Application
The application refers to an SG application traffic type that will use the functions provided by the multiple metrics framework. This is because an SG application may have different data types; each with unique QoS (reliability or delay) requirements. Examples of this application traffic types are: Demand Respond (DR), Electronic Vehicle (EV) charging, power quality and meter reading. Each of these application traffic types can be assigned an RLMT and Relative Link Metric Type Weight (RLMTW), which can be used to find the best route to the destination.
4.1.2. Relevant Link Metric Types
This refers to the link metric types chosen or assigned to a particular application. A link metric is assigned to application traffic, depending on which link metric provides a better PDR or delay. For example, a source smart meter node may be required to send two application traffic types, application Type 1 and application Type 2. If ETX and MD are the most important metrics that apply to application traffic Type 1, they are chosen as the metric types to support its requirements. On the other hand, for application traffic Type 2, ETX and ML may be the crucial metrics to support its requirements. Therefore, its RLMTs will be ETX and ML.
4.1.3. Relevant Link Metric Type Weights
The RLMTs used by application traffic types can be assigned different RLMTWs. These are the weights assigned to each RLMTs that will be used to transmit an application traffic type. The weights are used to indicate the importance of each RLMT. Weights were assigned to RLMTs such that the summation of all weights equals one, and the higher the weight, the more important the RLMT.
4.1.4. Relevant Link Metric Values and Pruning
RLMVs are link metric values obtained for each path to a destination. The values are derived from ETX, ML and MD link metric algorithms for different paths to a destination. The number of paths to a destination recorded by the routing table differs, depending on the size of the network. The pruning technique is used to trim the number of paths to a destination.
4.1.5. Multi-Criteria Decision Making Technique
The AHP technique is the main component of the multiple metrics algorithm, which takes the RLMTWs and RLMVs to make a routing decision. The procedure of the multiple metrics for deciding a good quality link involves the following: (1) link metric weighing; (2) assigning priority weights RLMTWs; and (3) making a route decision to select a path to destination.
Link Metric Weighing
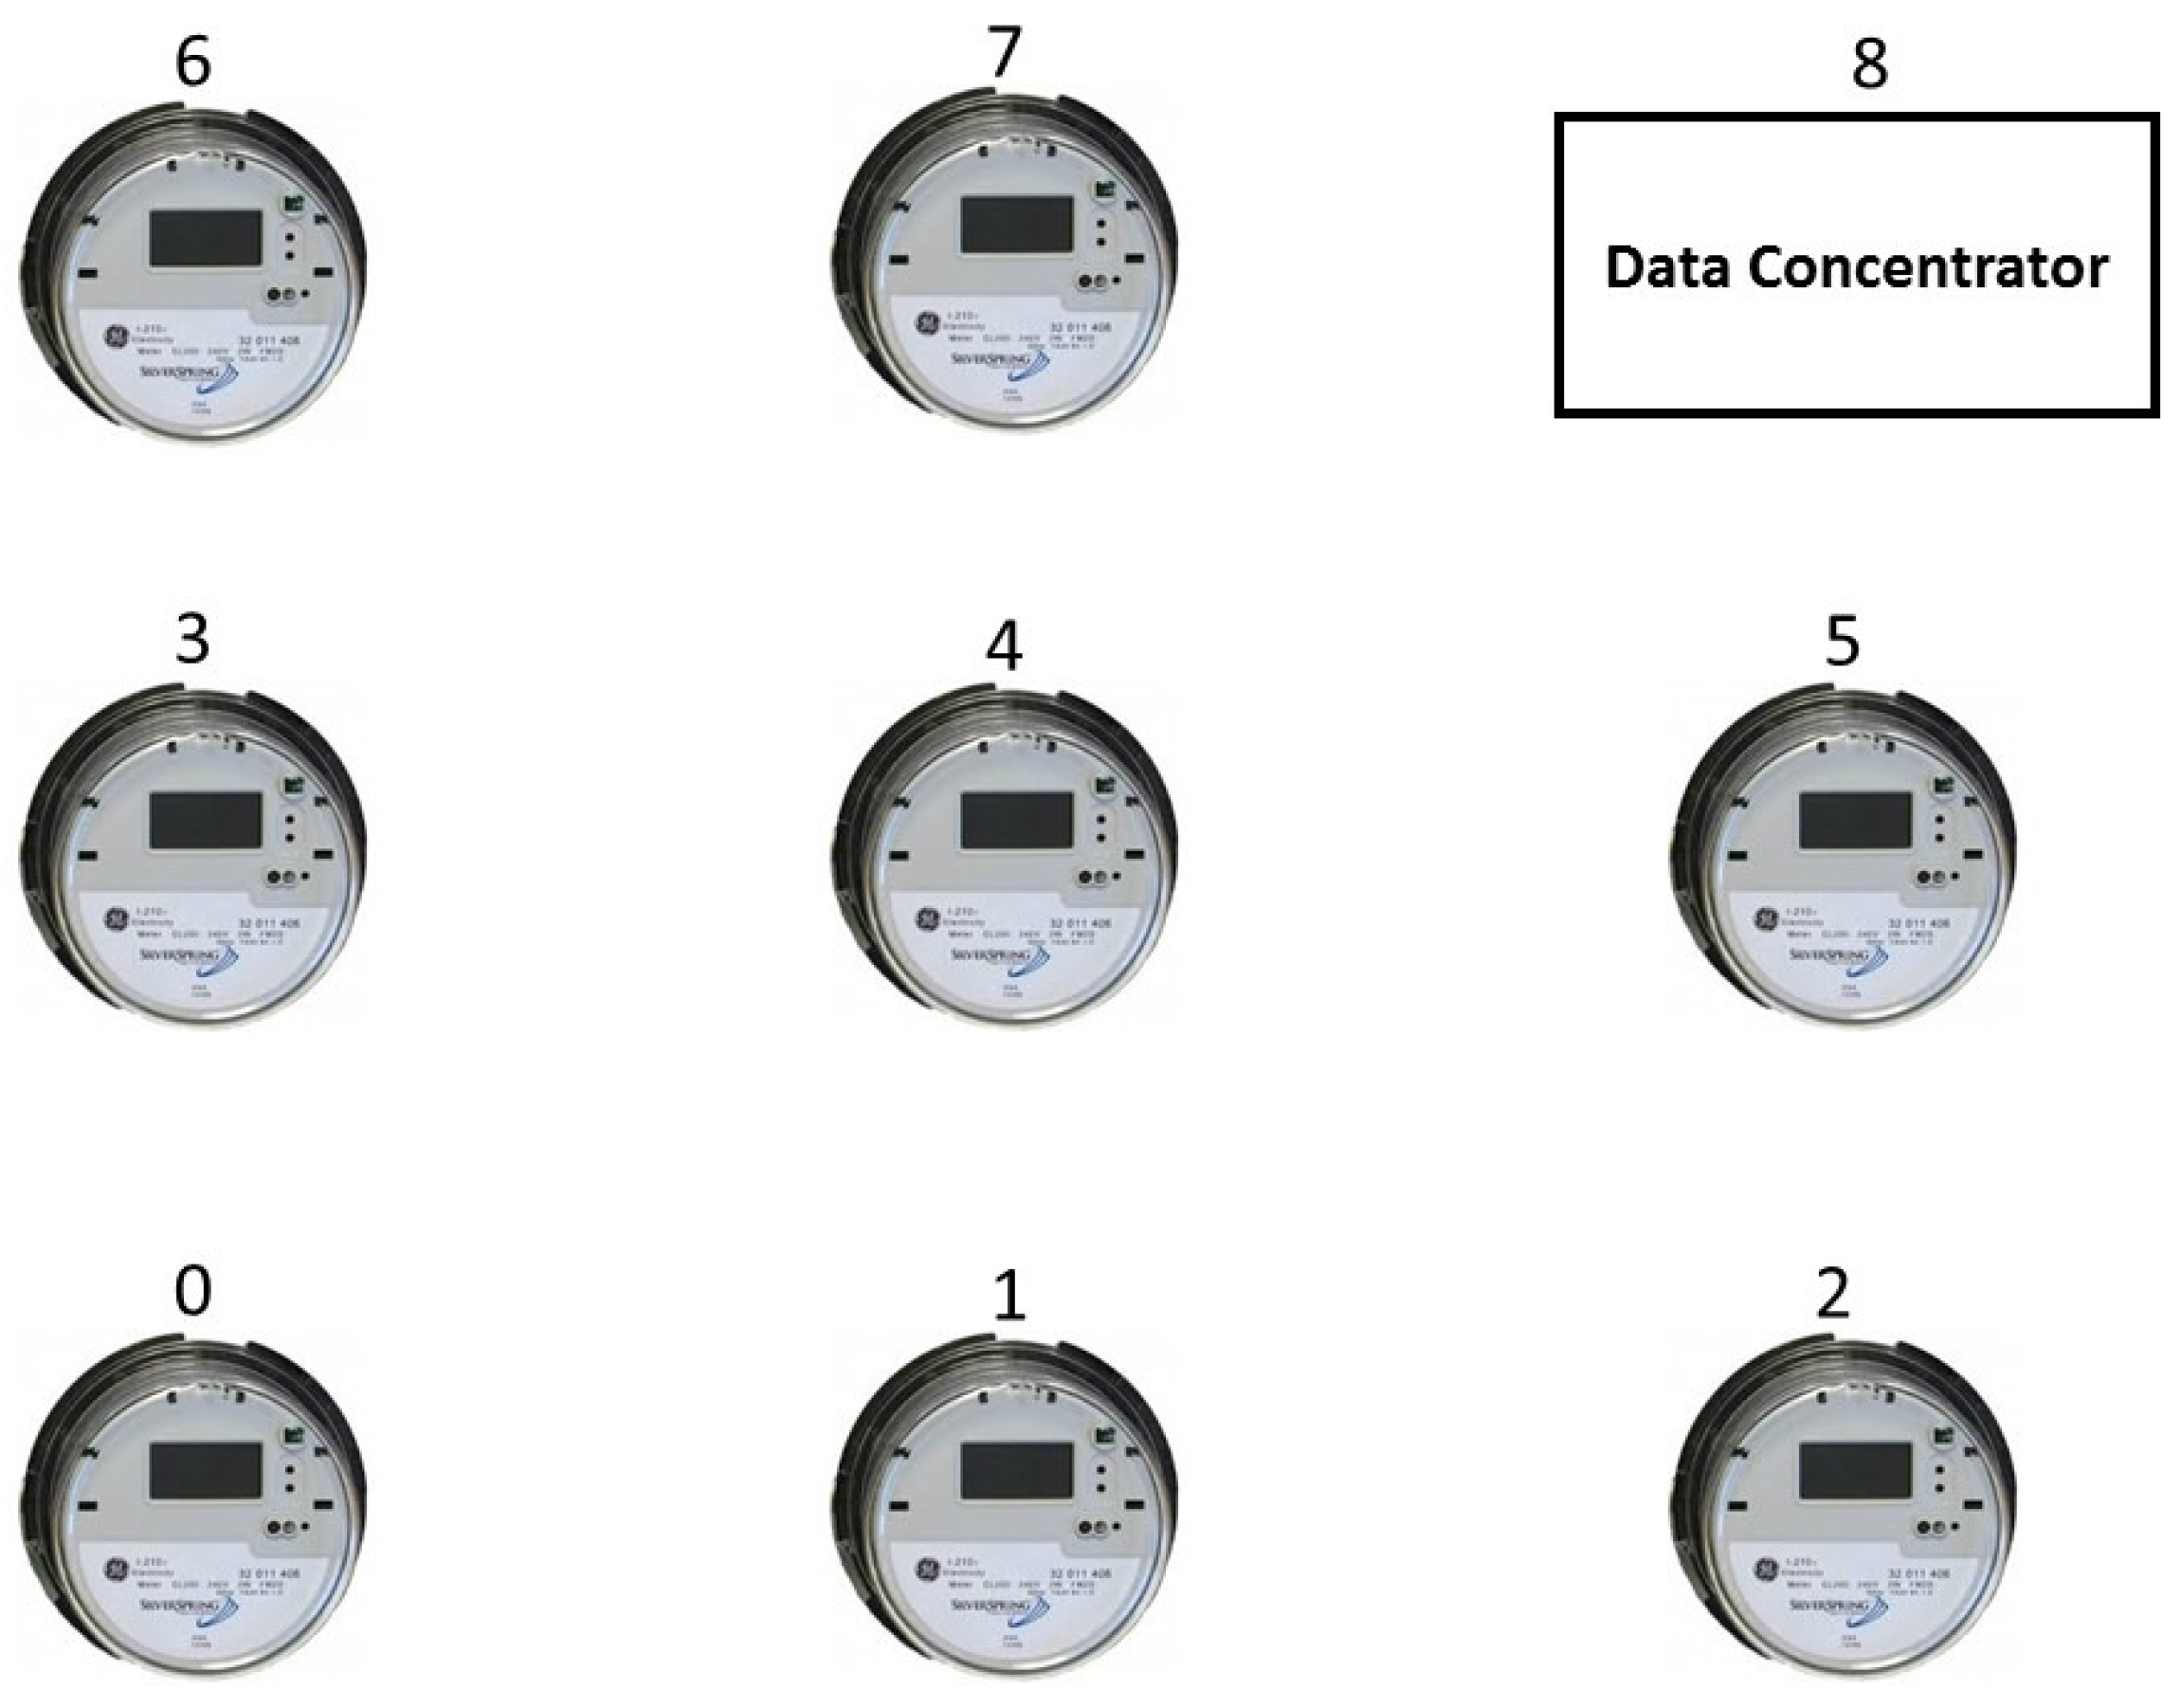
The link metric domain of OLSR on each node contains a set of RLMTs that will be selected based on the QoS requirements of the application traffic type. In order to map application traffic type to a specific path, the RLMT that will run on smart meter nodes to send a particular application data type must be decided. The decision on which link metric path an application traffic type takes to a data concentrator is determined using the AHP technique proposed in [
33] for WMN in NAN. For example, suppose the smart meter Node 0 in
Figure 2 transmits three application traffic types, A, B and C, to the data concentrator Node 8, and traffic Type A has two QoS requirements: high reliability (low loss rates) and low delay. On the other hand, suppose also that traffic Type B requires a high throughput and low loss rate and traffic Type C requires very low delay. The set of RLMTs chosen for traffic Type A are ETX (for reliability) and ML (for Low delay). On the other hand, for traffic Type B, which requires a high throughput and low loss, ETX is given priority. Finally, ML is chosen to fulfil the low latency requirement traffic Type C.
Table 1 illustrates the link metrics and possible paths to the data concentrator. Applying the metric weight to compare all of the possible paths involves the following steps:
Step 1. Find all possible paths to the destination.
Table 1 shows the link metric values for the best possible paths to the data concentrator.
Step 2. Compute a path-to-path pair-wise comparison matrix
for the values shown in
Table 1.
is used to determine how well a path scores on each metric (ETX and ML), by using a pair-wise comparison matrix with a size of
, where
N is the number of paths to the destination. The basic idea of the
is to compare the quantitative metric of ETX and ML of one path with that of all other paths. The matrix calculations are based on the following expression, where
i and
j are paths and
is the overall value of the metric for path
j.
= 1, when comparing the same path;
= 1/, for reciprocal paths; and
= , for min criterion.
Applying
to ETX paths in
Table 1 is given as:
Step 3. The normalized path-path pair-wise comparison matrix
is generated by dividing each entry in column
j of the
by the sum of the entries in that same column. This results in a normalized matrix in which the sum of the entries in each column is one. The formula for calculation is given as follows:
The nppcmmatrix for ETX is given as:
Step 4. The average
is calculated for each metric, based on the following equation:
The
is an
matrix, where
n is the number of metrics used (two for ML and ETX in this case) and
N is the number of paths. If Steps 2–4 are applied to ML, The complete
for ETX and ML is given as:
Each row of this matrix refers to the metrics ETX and ML, respectively.
Assigning Weights to All RLMTs
When the RLMTs are chosen for different application traffic types, assigning weights on each RLMT is used to determine the importance of the RLMT in each application. The RLMT Weight (RLMTW) should be a value between zero and one, and the weight sum of RLMTWs from each set of RLMTs must be equal to one, as proposed by [
22]. The process of assigning weights is achieved through priority weightings.
Priority weightings involve the calculation of the average normalised priority pair-wise comparison matrix
to determine the importance of each metric relative to others. The metrics are then assigned weights in the range of [0, 1], where the sum of all of the weights equals one. For example, if two RLMTs are considered and
is set as
(which means both metrics have equal priorities), then the total score for each path is expressed as:
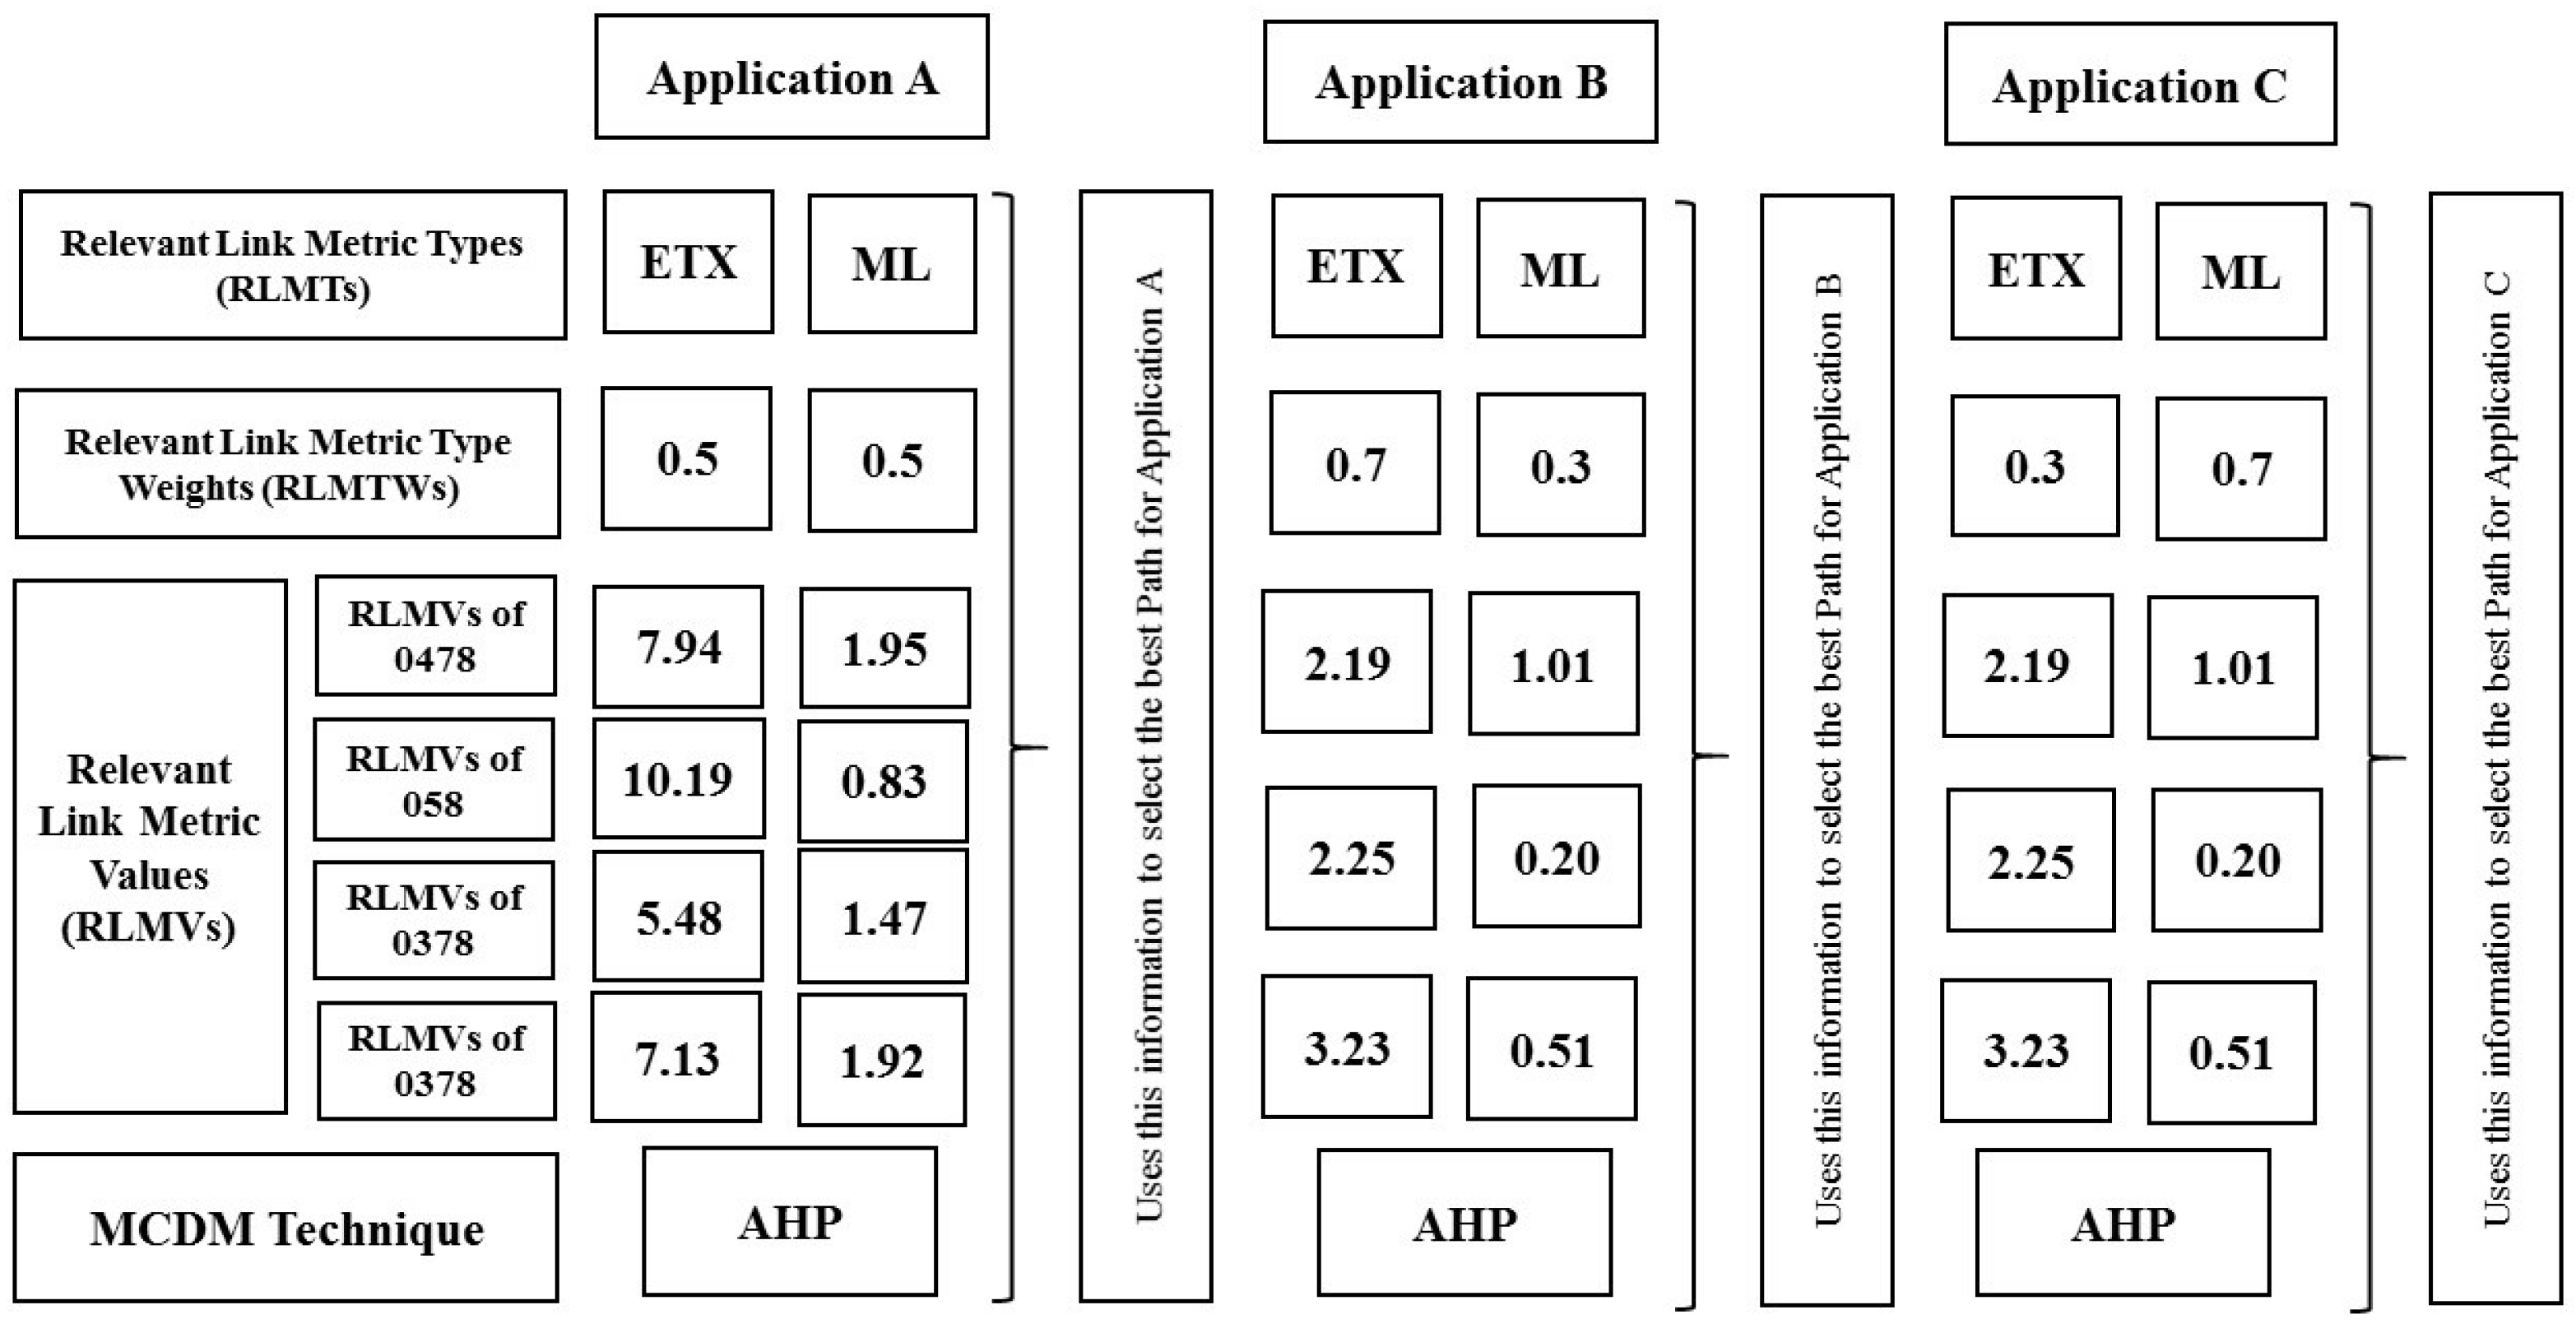
For application traffic Type A, the weights for ETX
and ML
are set as 0.5; while the weights of RLMTs for traffic Type B, which considers ETX as the most important RLMT, are set as
and
. For traffic Type C where ML is of higher priority, the weights of ETX and ML are set as
and
. The weights were decided through a case study on RLMTs to find the one best suited for each application traffic as presented in [
12]. The total normalised score of path
j used in the communication between Nodes 0 and 8 is presented in
Table 2. Path B has the best link quality when both metrics are given no priority. When ETX is assigned priority (i.e.,
= [0.7, 0.3]), Path C is the best link quality overall. While when ML is given priority (i.e.,
= [0.3, 0.7]), Path B has the best quality. In order to adaptively guarantee the QoS required for each of the application traffic, Path C can be used for loss-tolerant traffic, while Path B can be used for delay-sensitive traffic.
Making route decisions to select a path to destination
Following the selection of the RLMTs and RLMVs, the AHP algorithm is applied, and the RLMTWs are used to set priorities for different application traffic types. Each application traffic type is then transmitted using the best link calculated by AHP. This is achieved by modifying existing procedures in ns-2 run-time to map each link calculated by the AHP to a traffic type on all of the smart meters in the network. A representation of the multiple metric framework is presented in
Figure 3.
5. Simulation Study
Although the use of other network simulator tools such as ns-3, OMNeT++ or OPNET is possible, all of the designs and simulations in this work are done in ns-2. This is because the three OLSR link metrics, OLSR-ETX, OLSR-ML and OLSR-MD, are implemented in ns-2. The inclusion of these link metrics enabled the extension of OLSR to support multiple metrics during routing decisions, as well as to send traffic through multiple paths based on their QoS requirements. This scheme provides better reliability than a single path.
5.1. Simulation Scenario
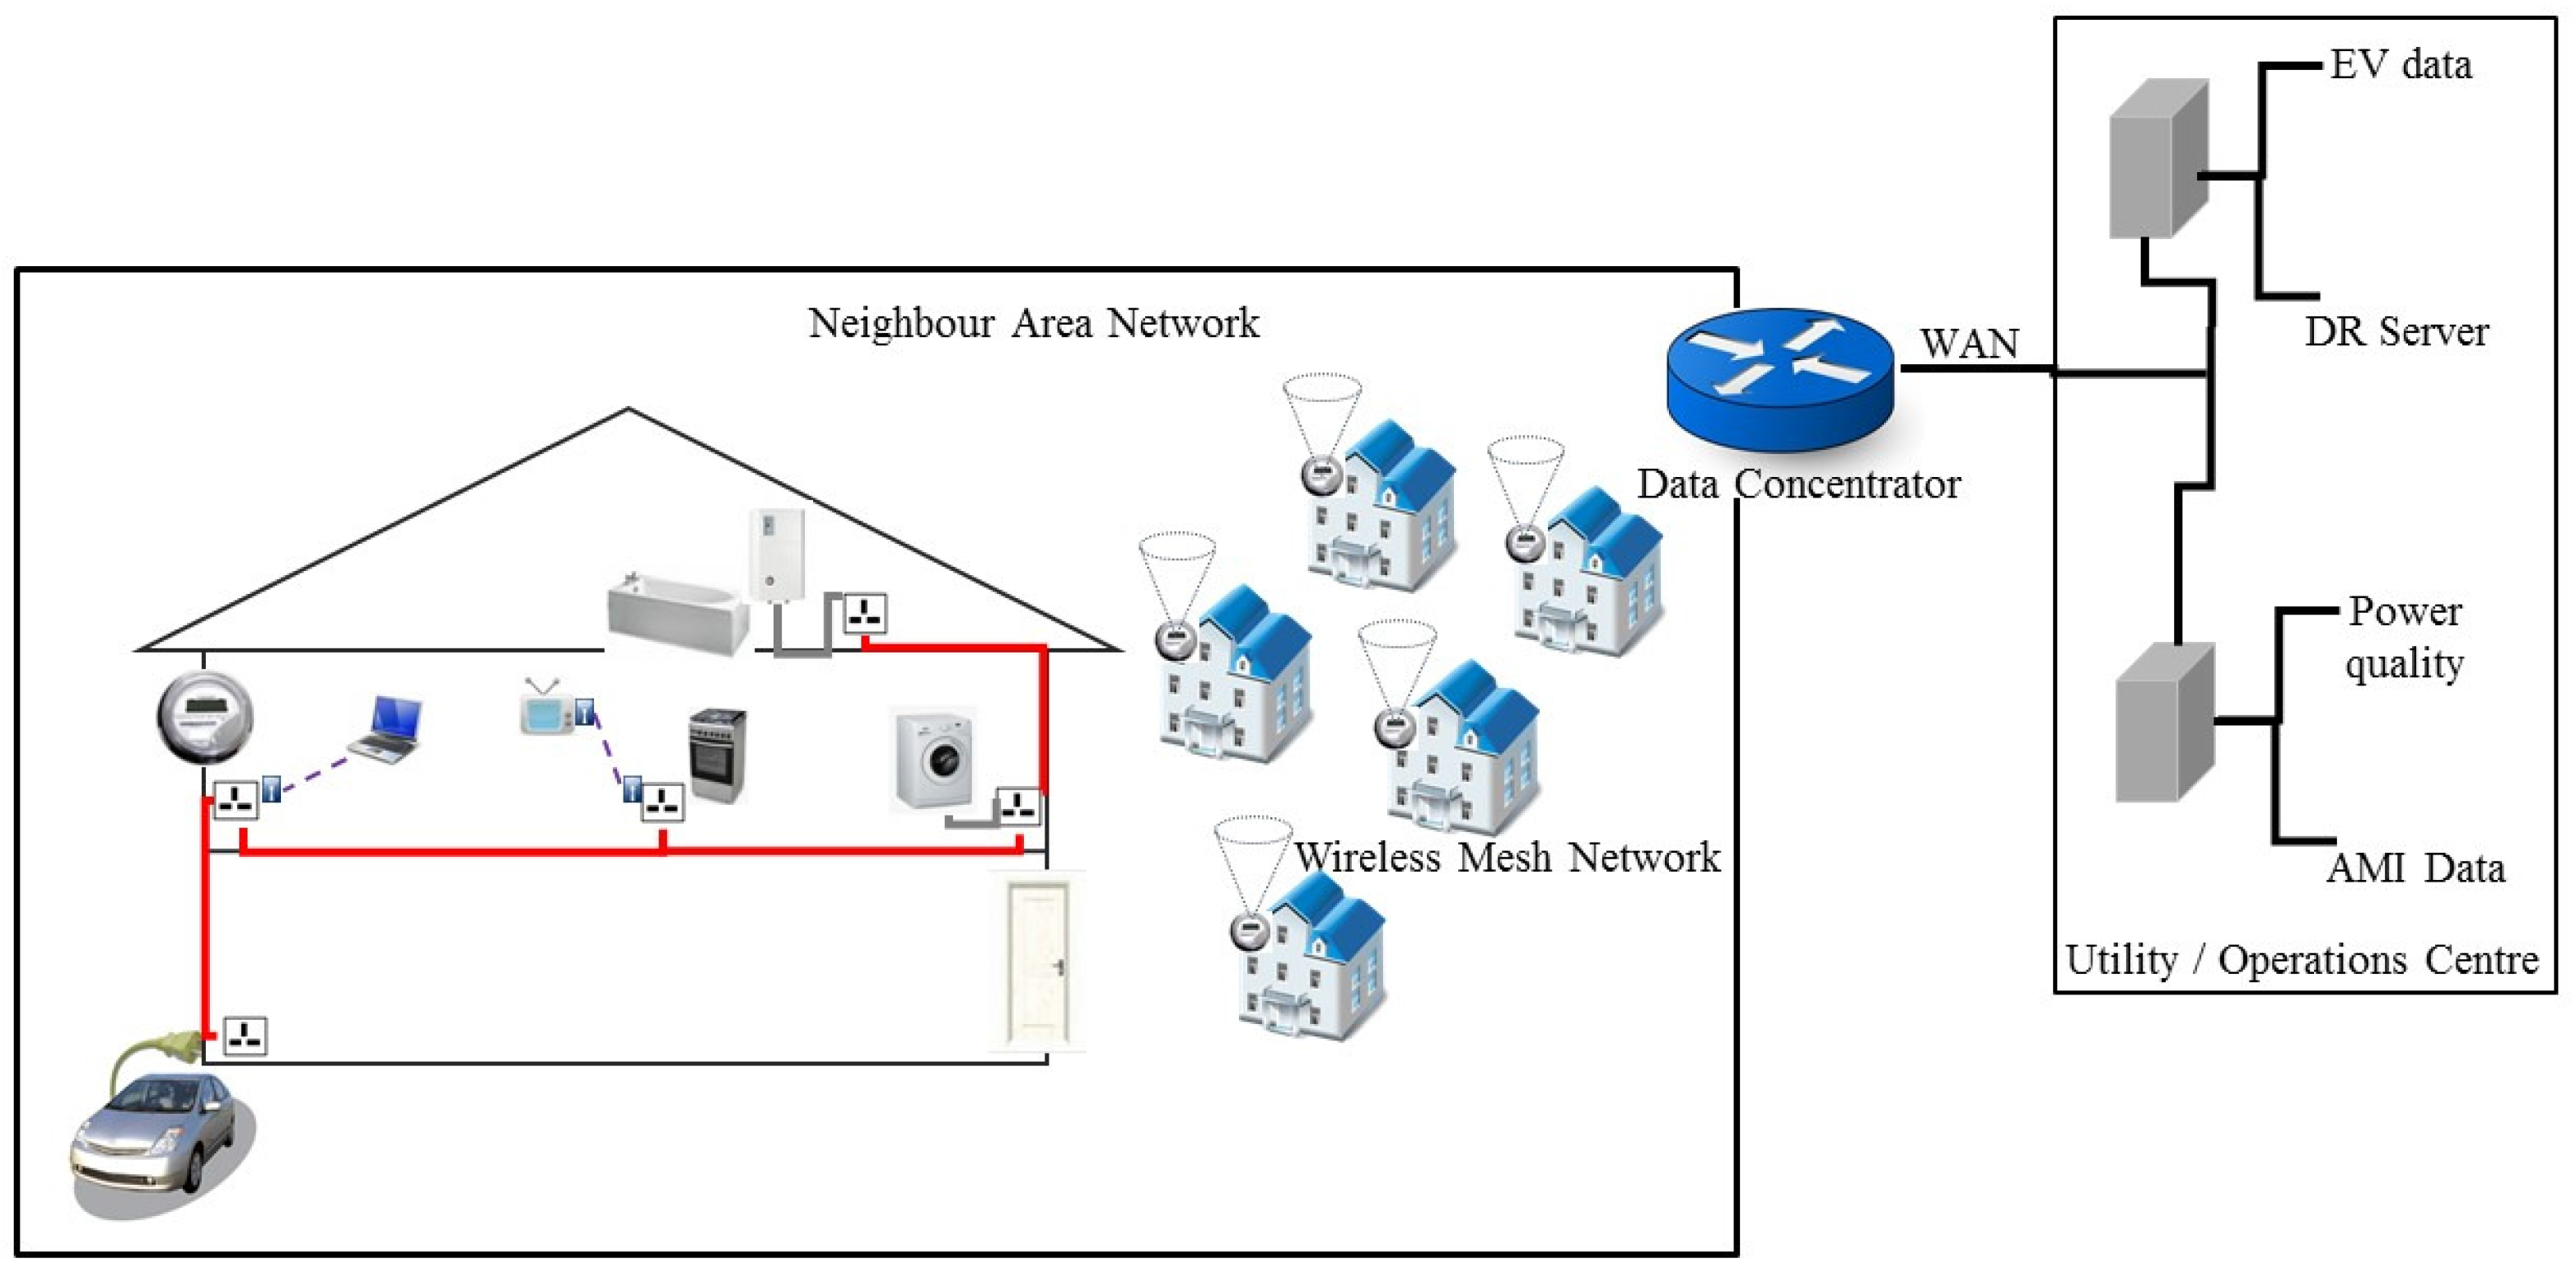
A typical evaluation of the functions of smart meter nodes in NAN for real-time AMI applications, where various traffic types are transmitted upstream towards the data concentrator and downstream towards the smart meters, is presented.
Figure 4 represents a scenario in which home users transmit their periodic billing data (meter reading) and EV charging information simultaneously. Concurrently, the utility measures power quality for all households and transmits DR information to the customers for peak pricing. For simplicity, our simulation assumes these events occur simultaneously on all smart meters in the neighbour area for a period of 50 s, five times a day, though this may differ in reality.
5.2. Simulation Setup
The network simulation parameters are presented in
Table 3. The shadowing propagation model is adopted, and the dimension of space in the NAN network is set as 400 × 400 m
. A grid size of 25 smart meter nodes, separated 100 m apart, is simulated, sending their meter readings to a data concentrator. The User Datagram Protocol (UDP) constant bit rate (CBR) traffic was used to represent the application traffic types generated from each smart meter node in the network. The simulation setup illustrates the bi-directional flow of information between smart meters and the data concentrator using the WMN as the communication medium.
Four application traffic models (EV charging data, meter reading, power quality and DR) are transmitted simultaneously between the smart meters and the data concentrator. A summary of the QoS requirements of the various AMI traffics types is presented in
Table 4.
Based on the traffic transmitted, the network is assessed for successful upload/download traffic in terms of latency and reliability. The packet size and data rate used for a particular traffic type is dependent on the SG application types. For example, EV charging information is treated as near real-time traffic, which strictly requires low latency (delay sensitive application traffic type). Therefore, a packet of size 40 bytes and data rate of 8 kbps (similar to Voice Over IP or VOIP traffic) is used to model the EV charging application traffic. In the case of DR, since peak price advertisement is a multicast traffic that does not elicit acknowledgement, it is simply modelled as UDP-based traffic, in which the data concentrator sends price signals to the UDP server installed on smart meter nodes. Meter reading traffic and power quality measurement data traffic are also modelled using UDP, and all of the nodes are connected to the data concentrator through the 802.11b WMN. The AHP multiple metrics implementation with OLSR is carried out only on the uplink (i.e., from smart meters to the data concentrator) and compared with other OLSR link metrics. This is because only a single traffic is transmitted in the downstream direction.
The topology is varied by increasing the cluster size of smart meter nodes in the area and changing the position of the data concentrator, to measure and compare the performance at different instances. Performance indices such as packet loss, PDR, throughput and average delay are also used to evaluate performance.
5.3. Results and Discussions
In this section, the simulation results of the WMN-based NAN under consideration are presented and discussed. In order to evaluate the performance of the proposed OLSR multiple metrics , the average PDR, average delay and blocking probability for all traffic types are measured and compared with other OLSR link metric types: ETX, ML and MD.
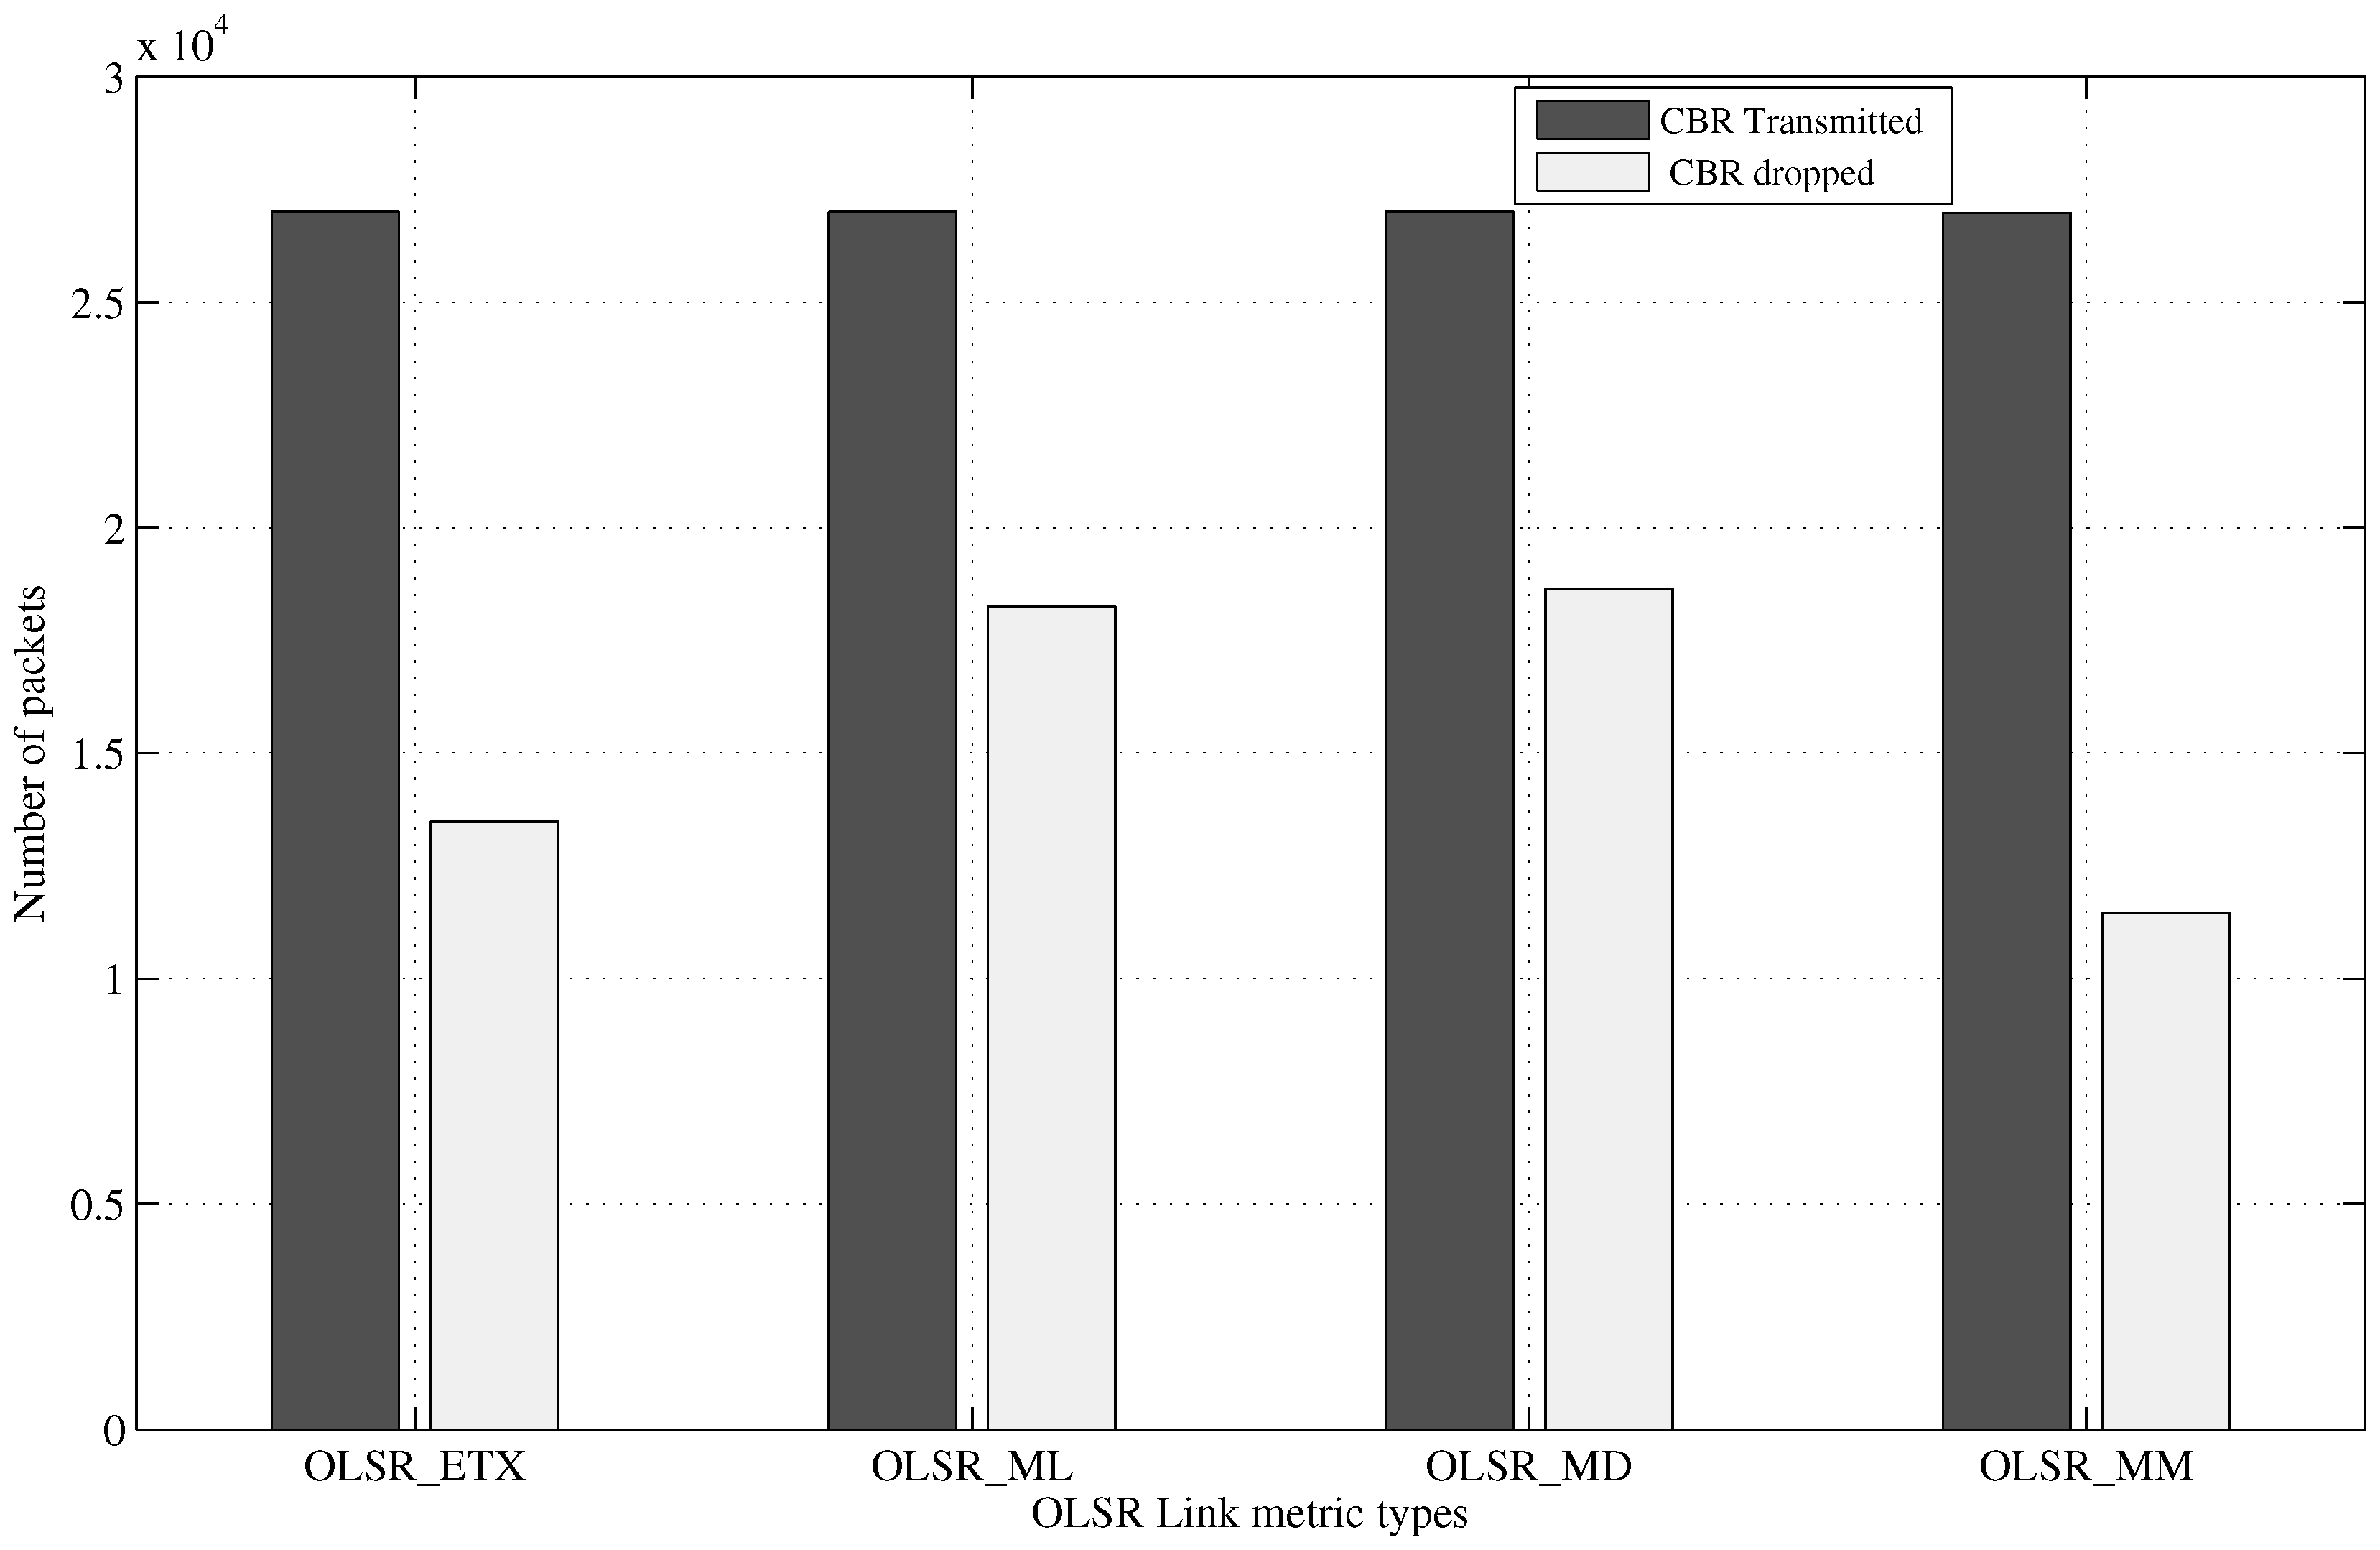
5.3.1. Dropped Packets
Whilst transmitting all application traffic types simultaneously,
Figure 5,
Figure 6,
Figure 7 and
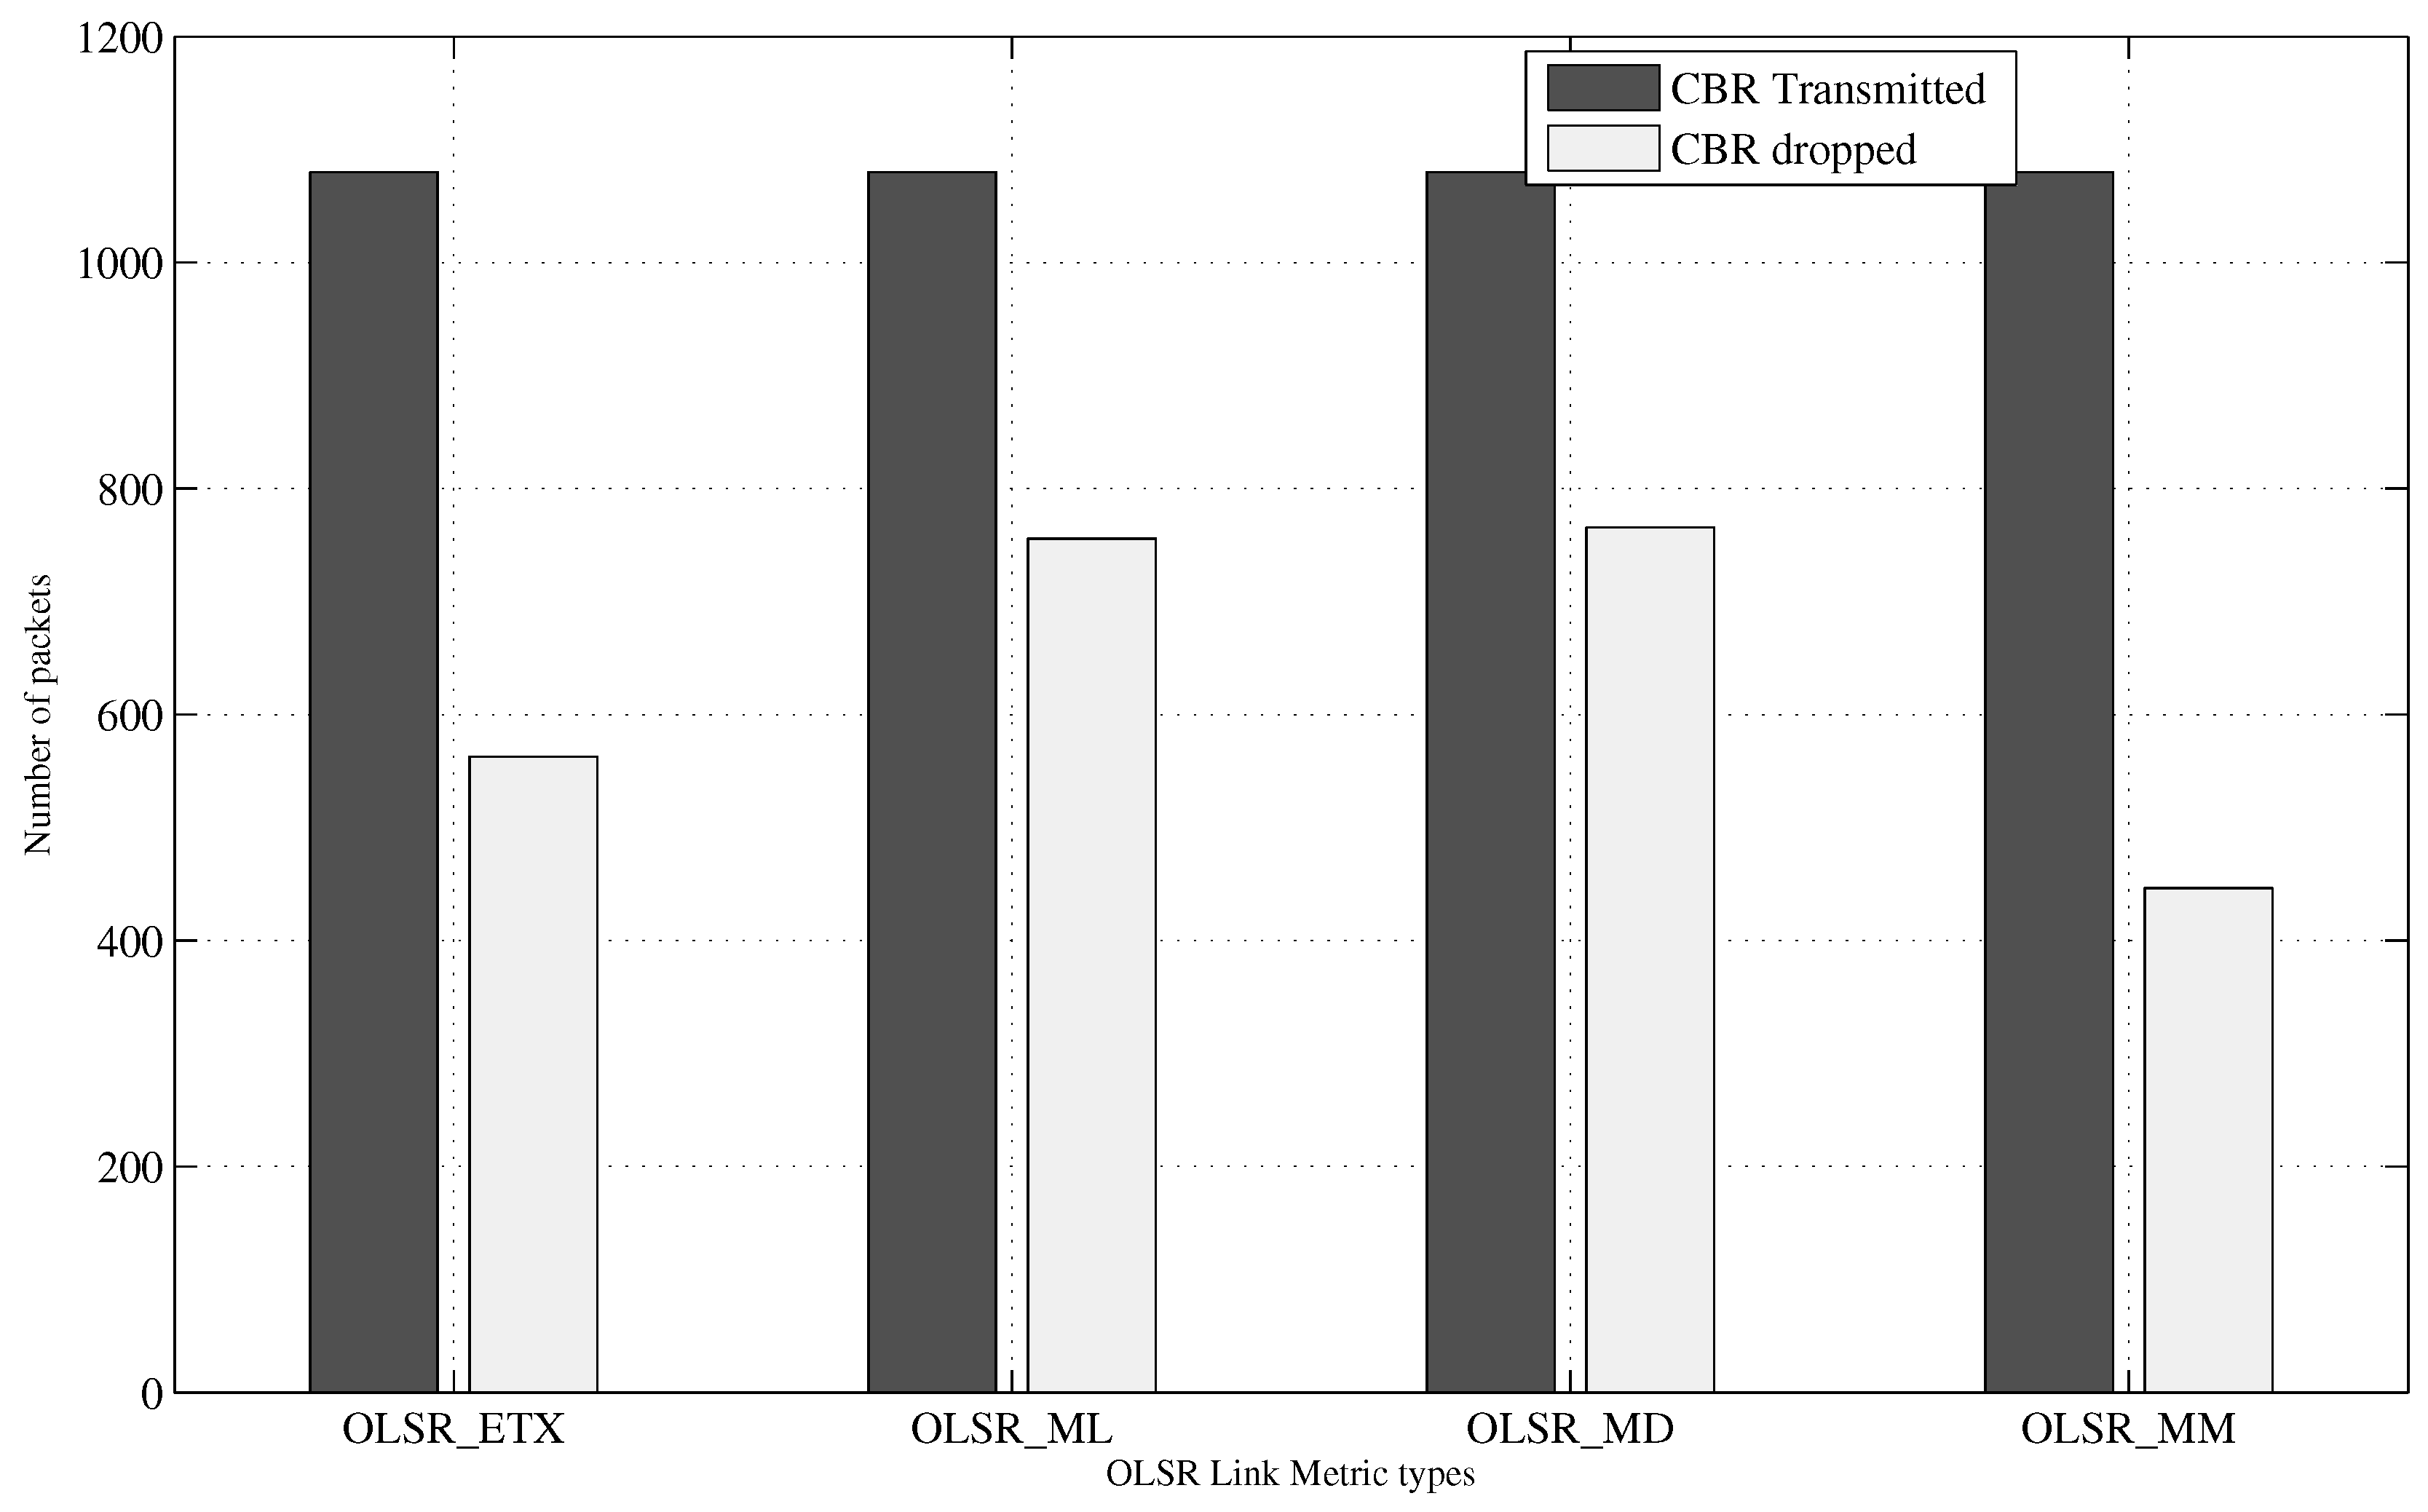
Figure 8 show the packets transmitted and dropped for each application traffic type: EV charging data, meter reading, power quality and DR. The OLSR multiple metrics managed to keep the number of dropped packets low when compared to other OLSR versions.
does not only reduce dropped packets, but also enables the transmission of a target traffic type that requires certain network parameters provided by a particular link metric.
Figure 5 shows the transmitted and dropped EV charging traffic, which transmitted the highest number of CBR traffic (about 25 packets per second) of all traffic. Though a high number of packets have been dropped, it did not replicate the number of losses incurred on other OLSR versions. This can be attributed to better path selection by the multiple metrics algorithm and the alternative paths it provides to other application traffic types to reduce congestion and bottle neck problems on specific intermediate nodes.
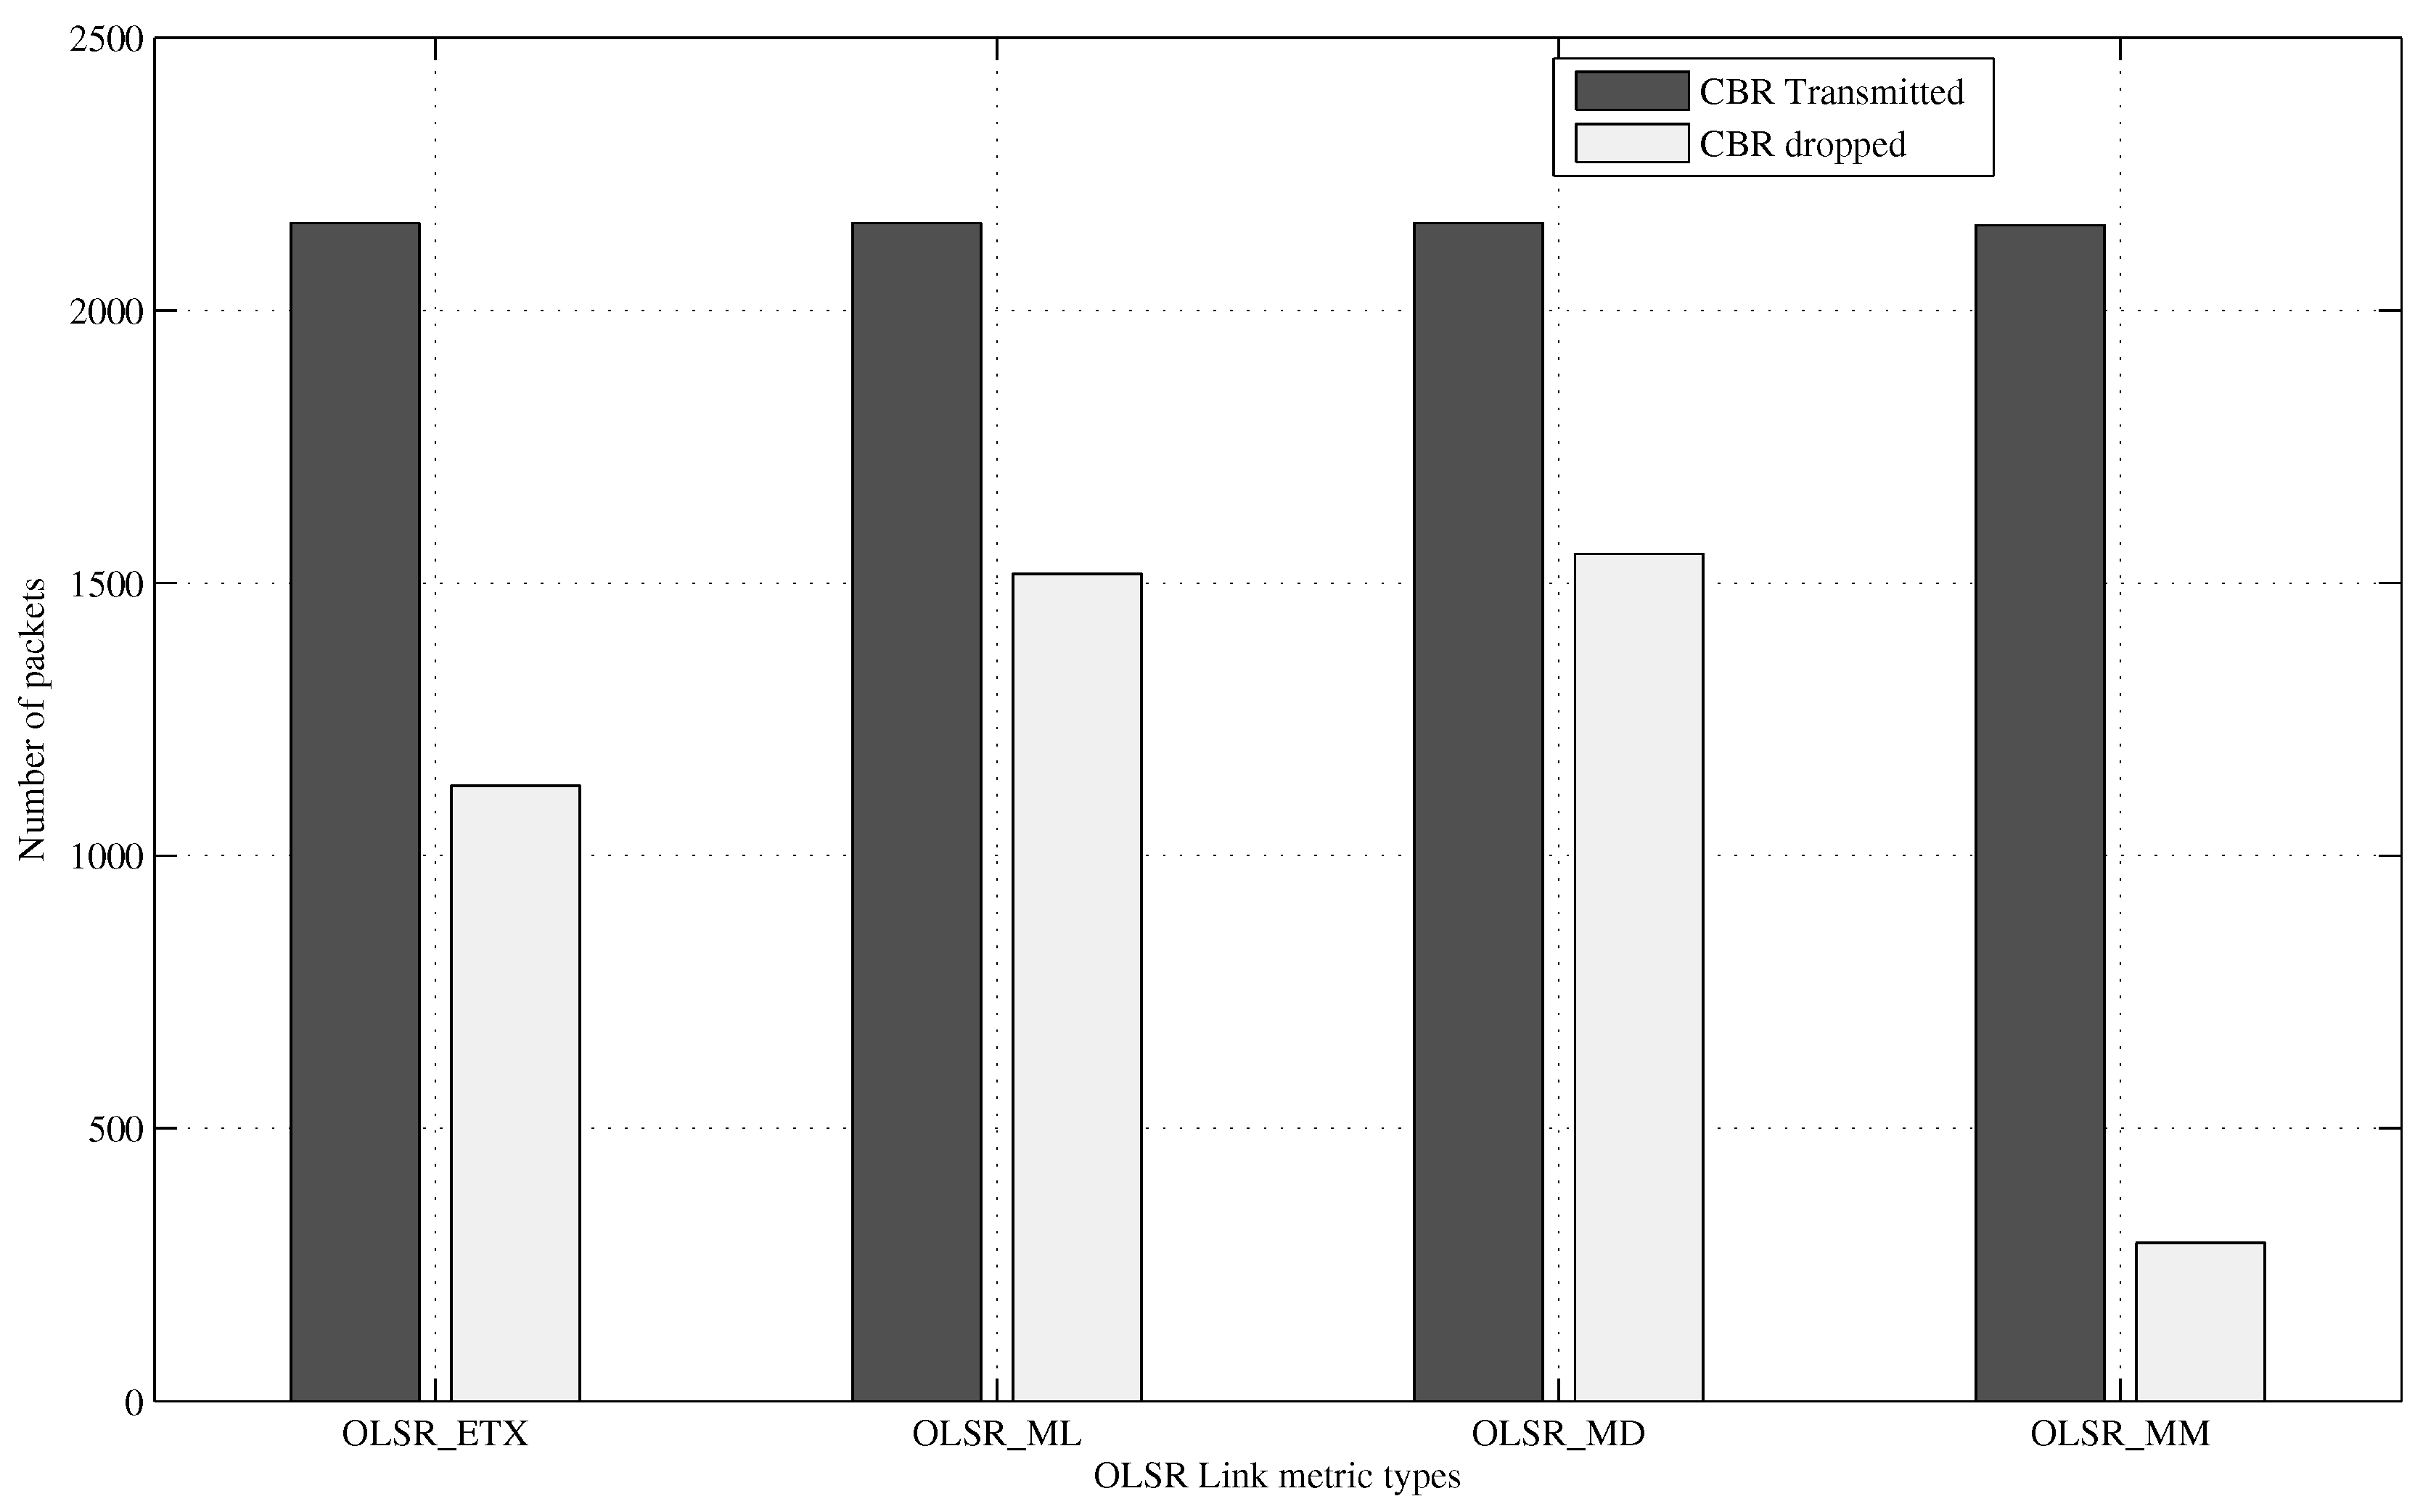
In
Figure 6, the transmitted and dropped CBR packets for the meter reading application are presented with the
recording the lowest number of packet losses. Compared to ETX, which has the lowest packet losses of all other conventional link metrics, a reduction of 20% in packet loses was achieved.
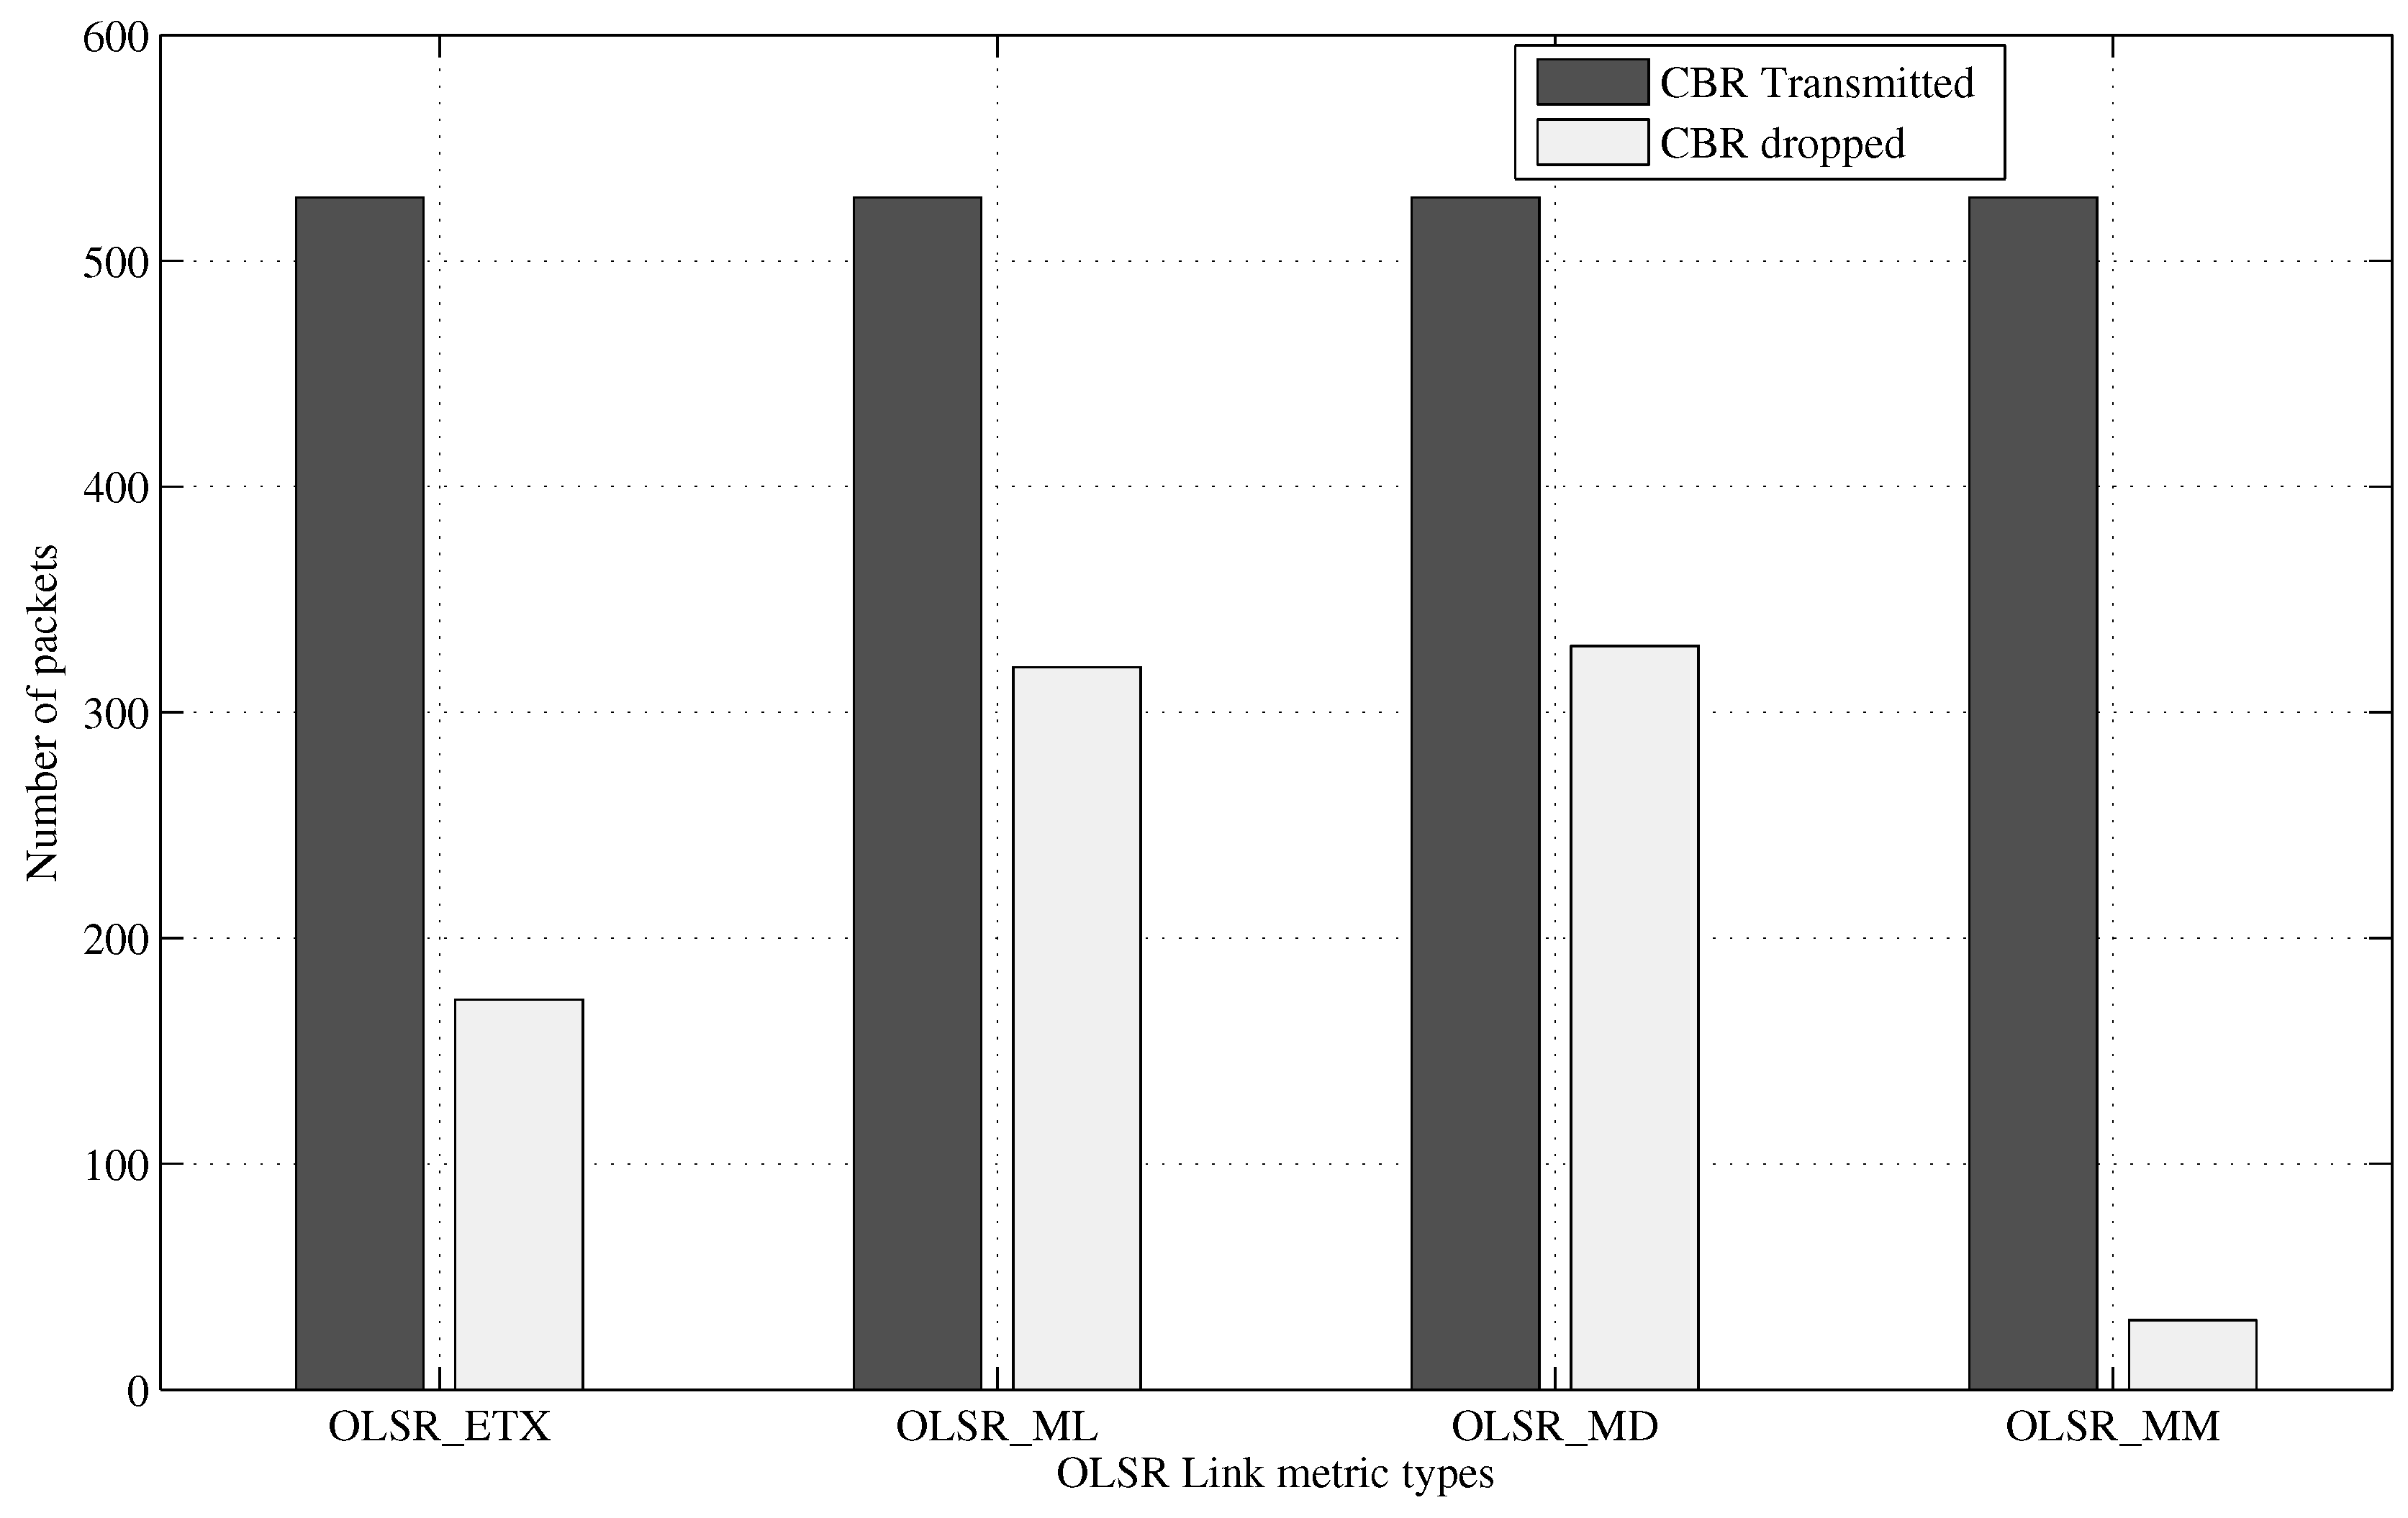
Figure 7 shows the CBR packets transmitted and dropped for the power quality measurement data. The packet losses recorded for this application are also lower than that of other OLSR versions. It shows that an improvement of about 13% of dropped packets is achieved by using
, compared to other versions of OLSR.
Contrary to the other application traffic types transmitted upstream towards a data concentrator, the DR traffic is multicast traffic, downstream towards the smart meter. While using the OLSR multiple metric to simultaneously transmit application traffic to the destination, in
Figure 8, the
also showed lower losses on the DR multicast compared to other OLSR versions.
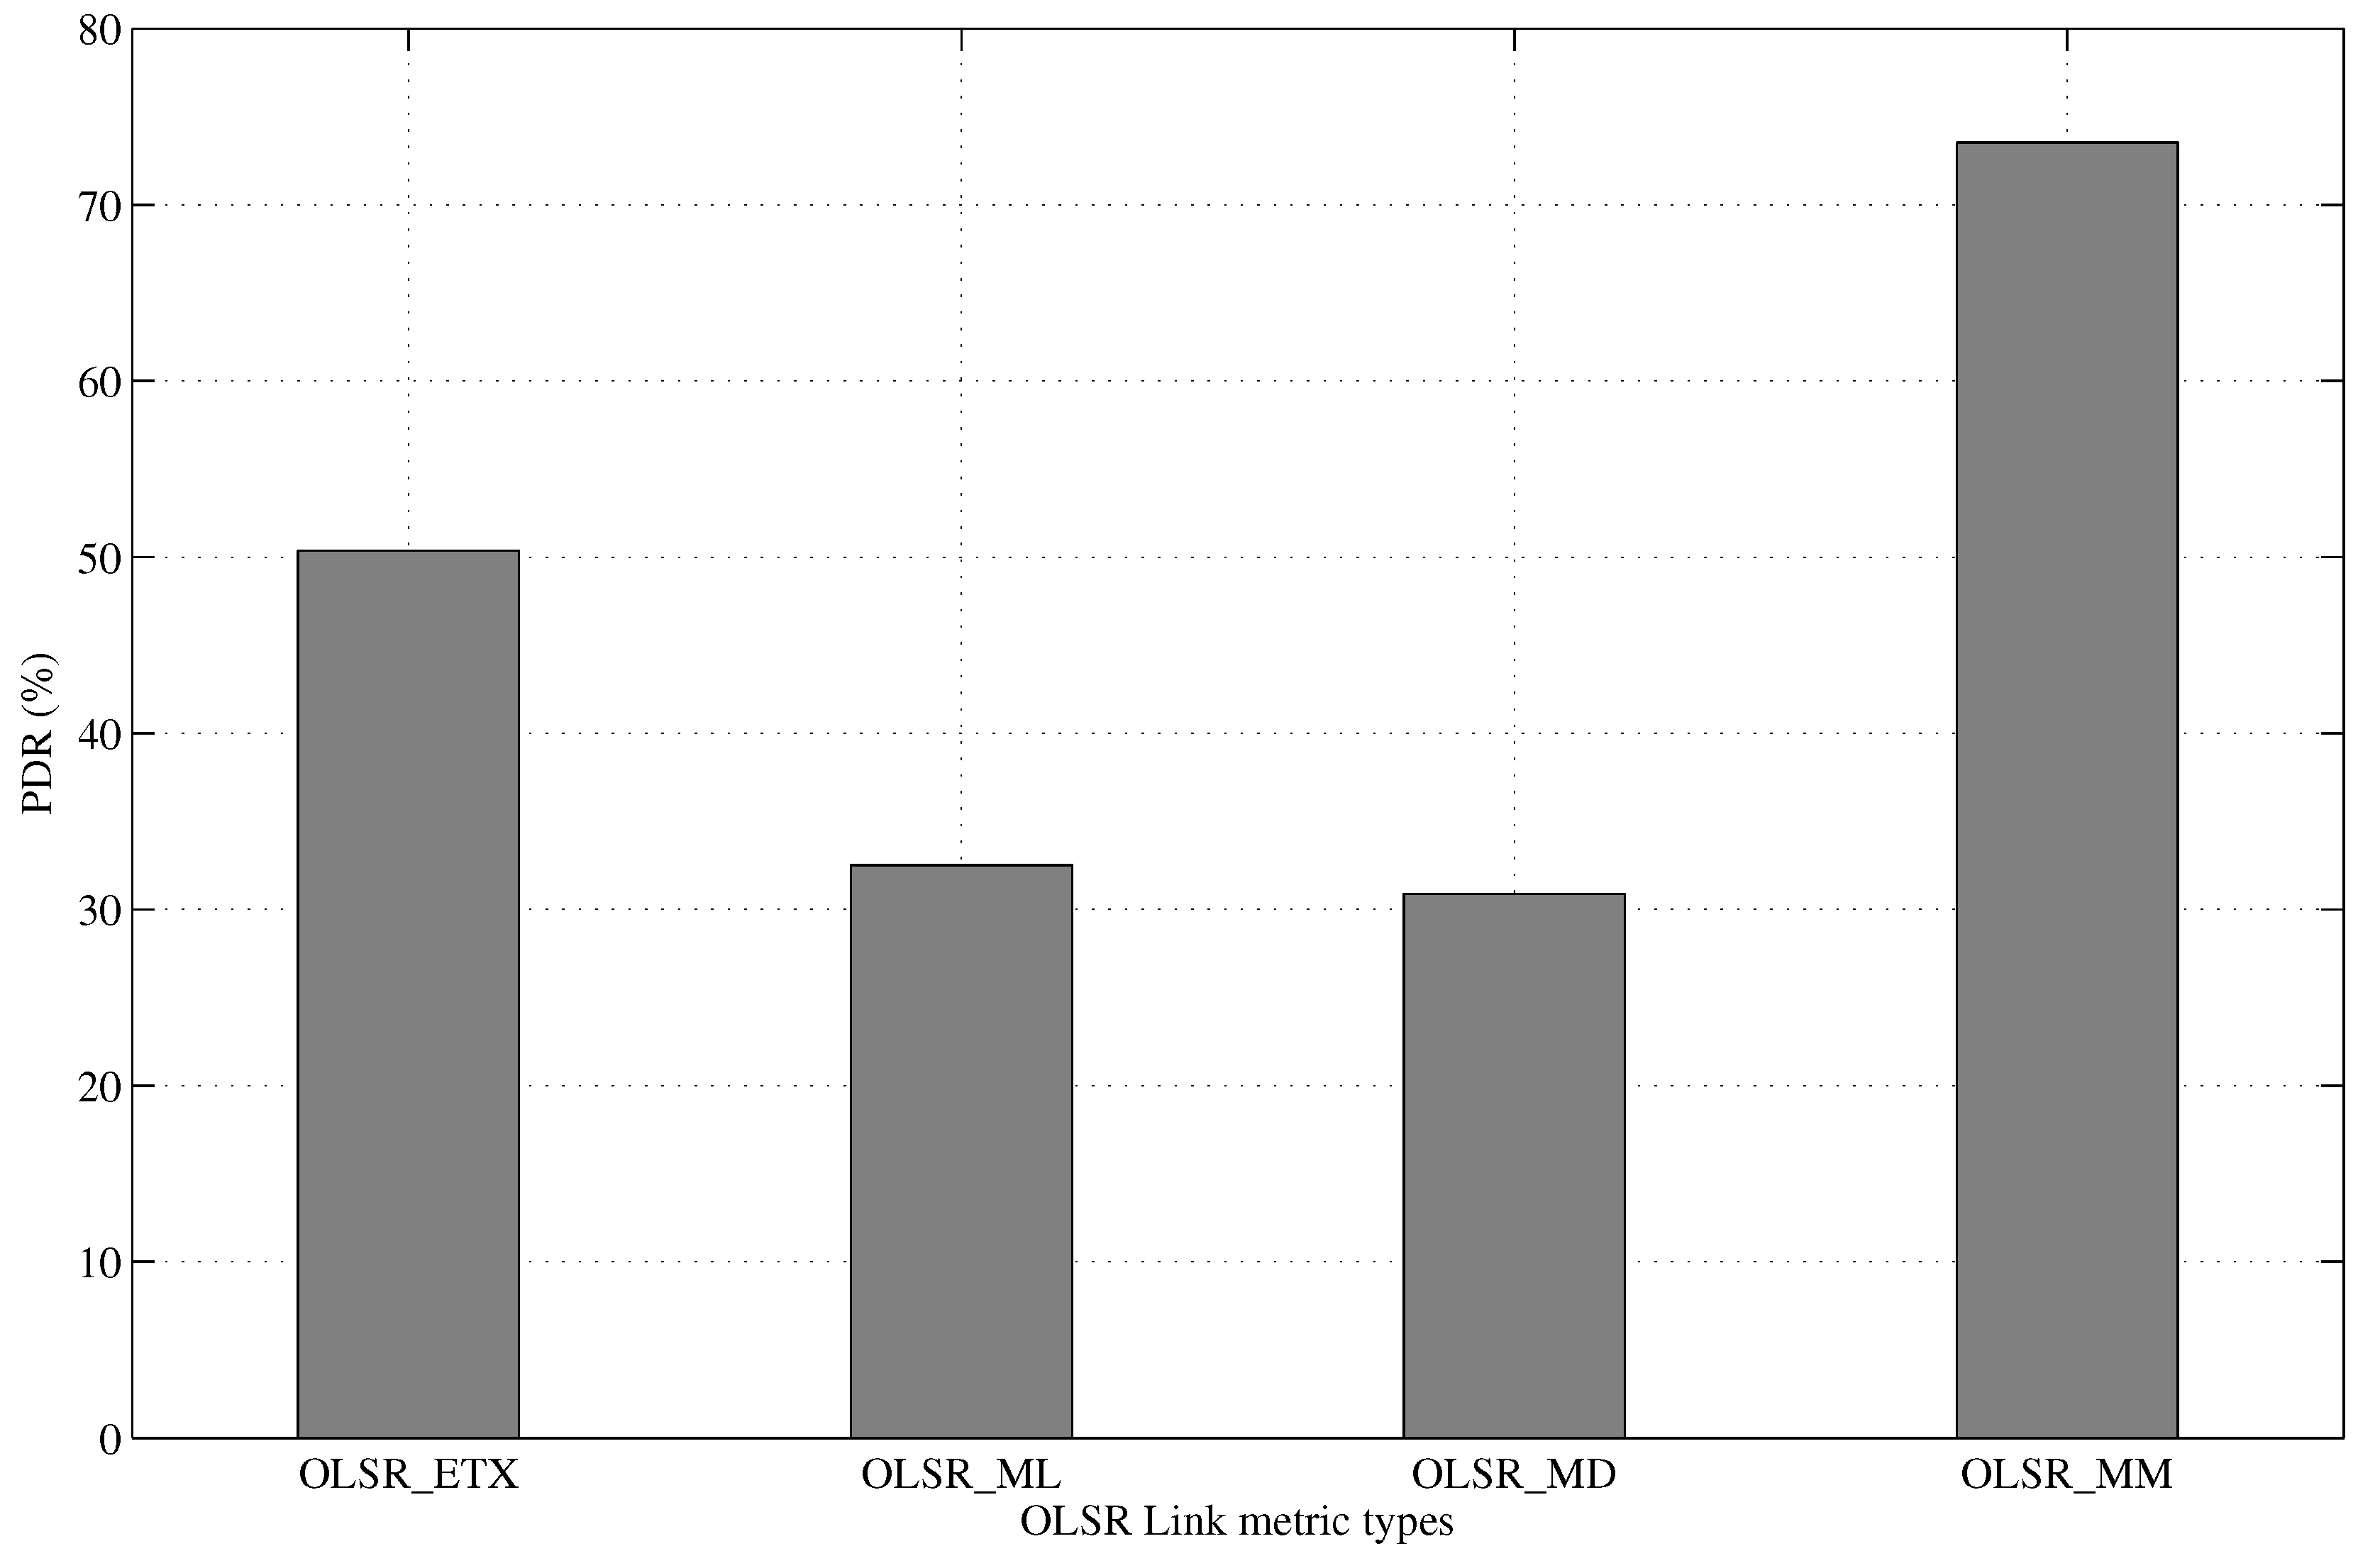
5.3.2. Network Reliability
The reliability of the network is measured by computing the average PDRs of successful transmission for all application traffic on each OLSR version. It is also important to reiterate that a successful upload of an application traffic type is considered as one in which 100% of transmitted packets is received and acknowledged at the data concentrator. The average PDR for simultaneously transmitting all SG application traffic across the WMN-based NAN on each OLSR version is presented in
Figure 9.
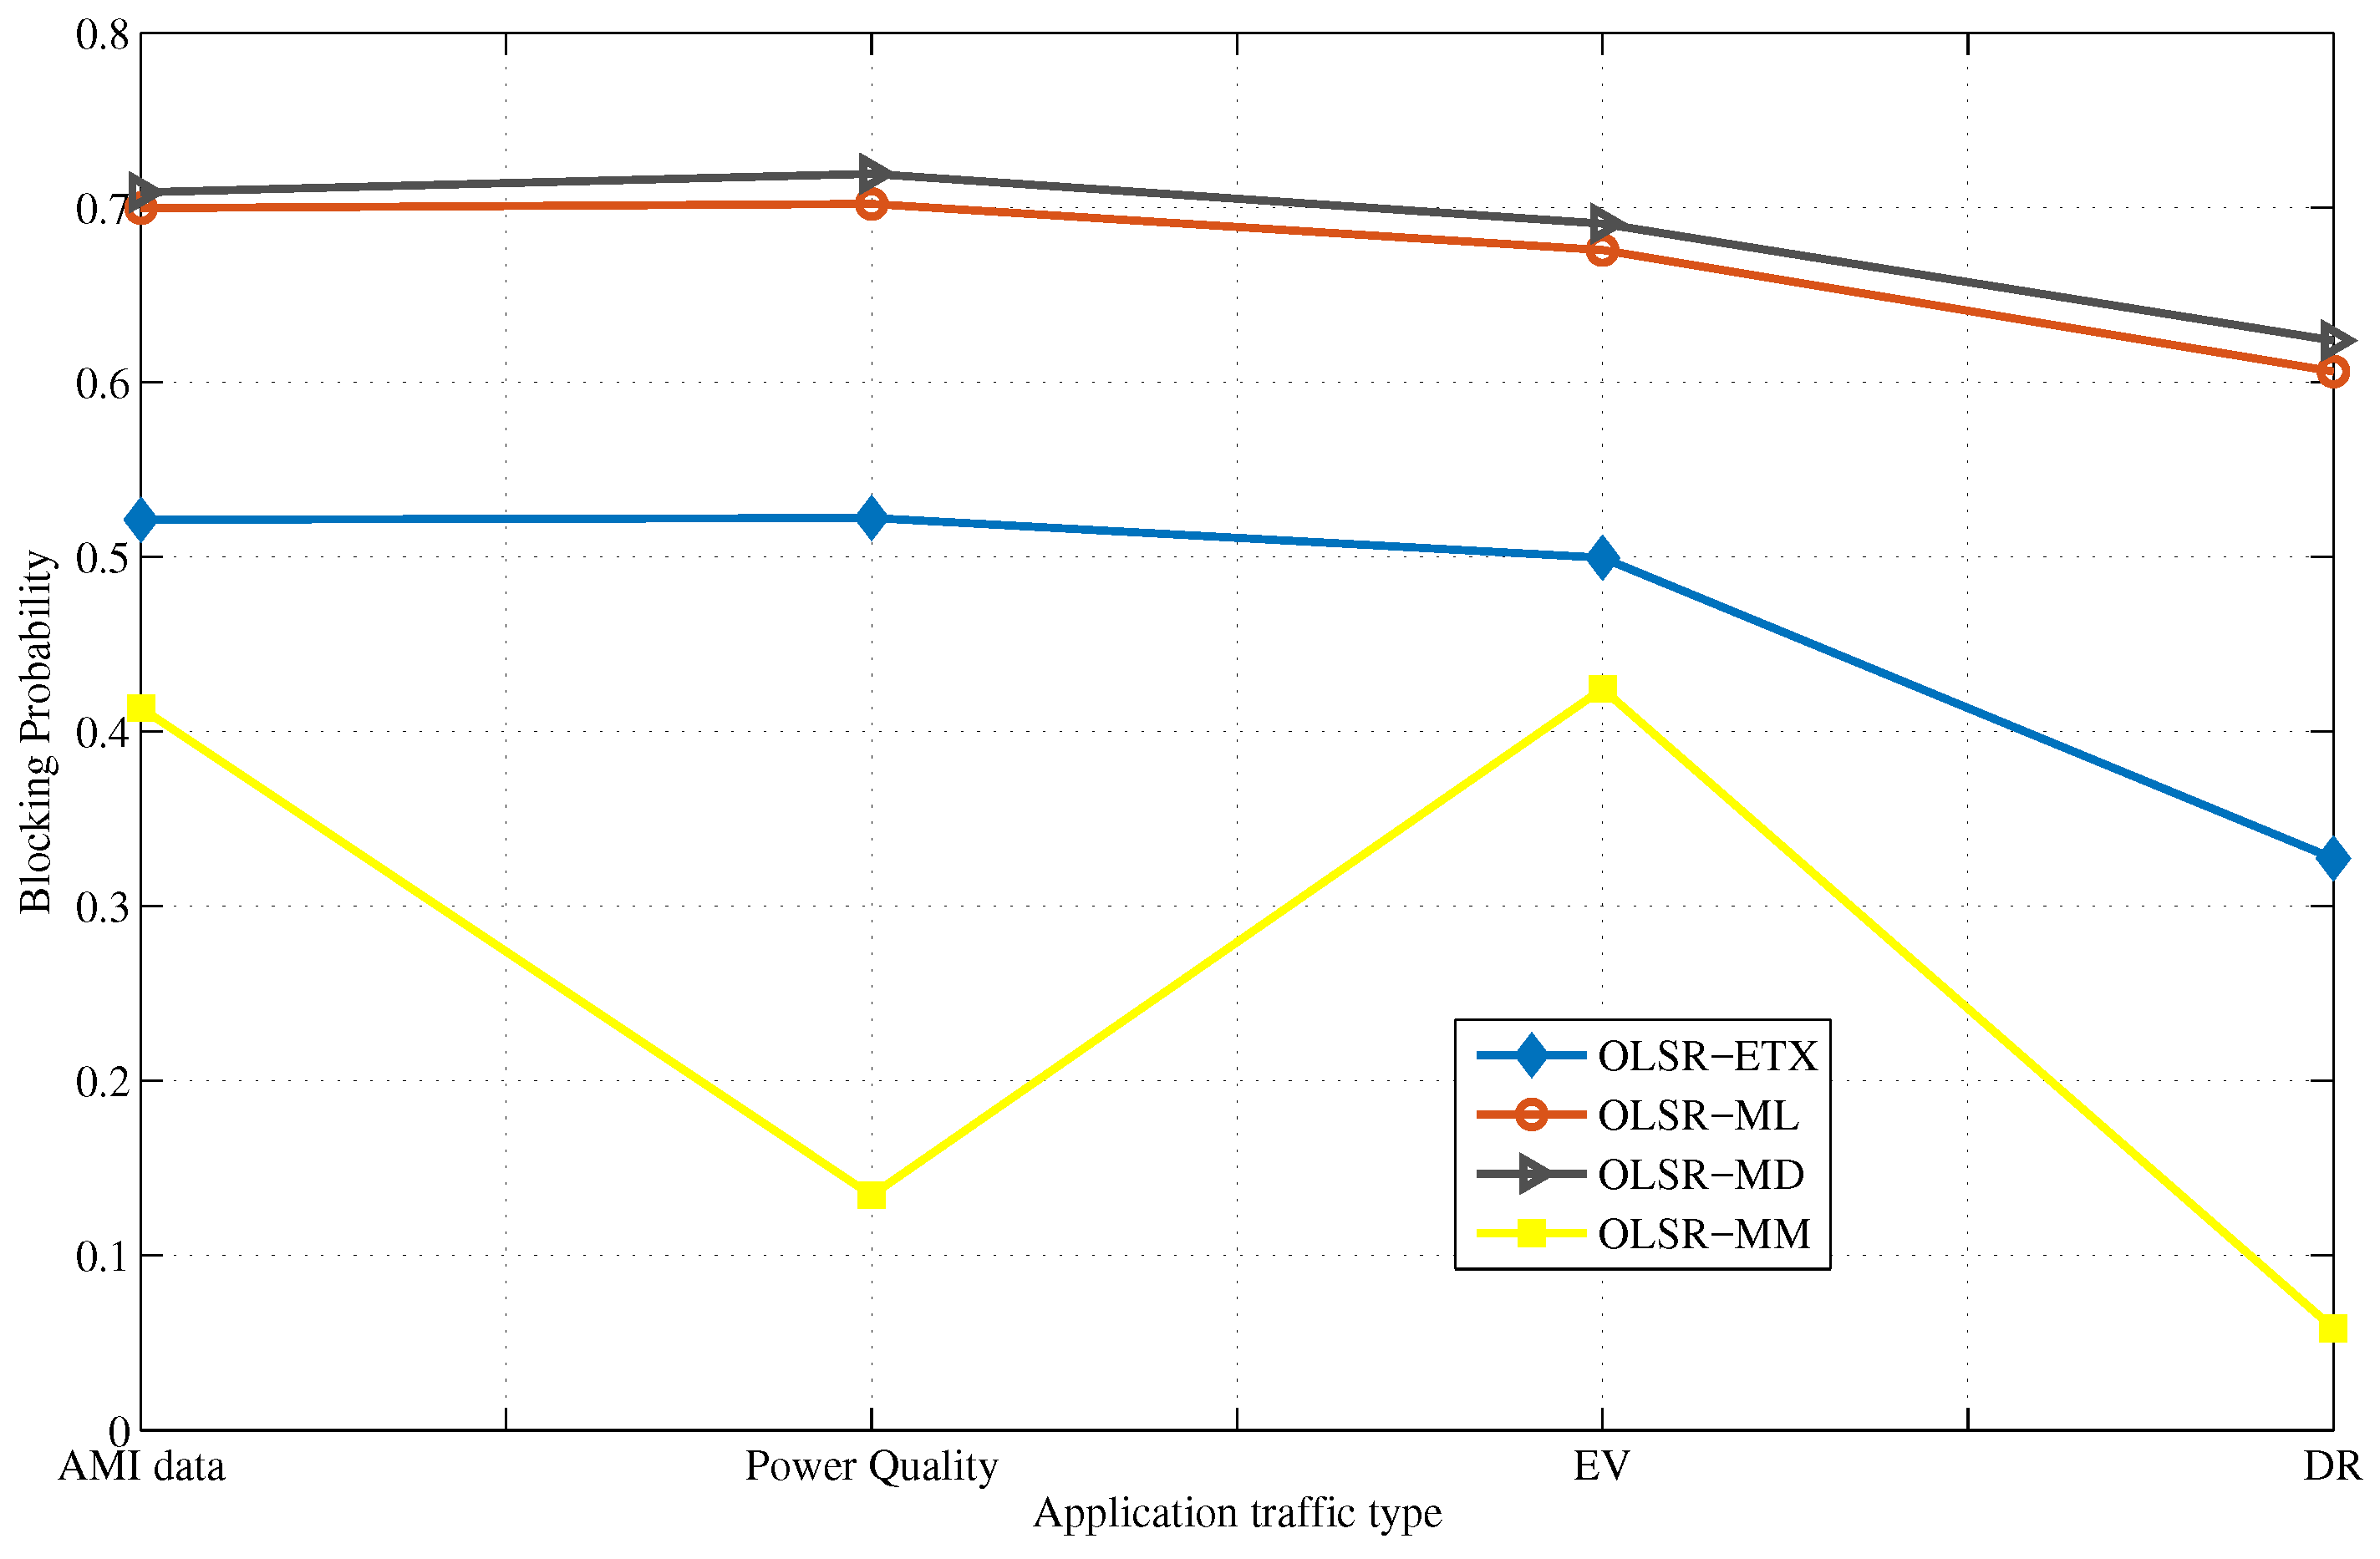
Another means of evaluating the reliability of the network is the blocking probability per application traffic flow. In this context, blocking probability is the probability of losses for a group of identical traffic. It is calculated as the ratio of dropped to transmitted packets.
Figure 10 shows the blocking probability of each application traffic type. It is clear that the blocking probability of the
is the lowest for all traffic types considered.
5.3.3. Average Delay
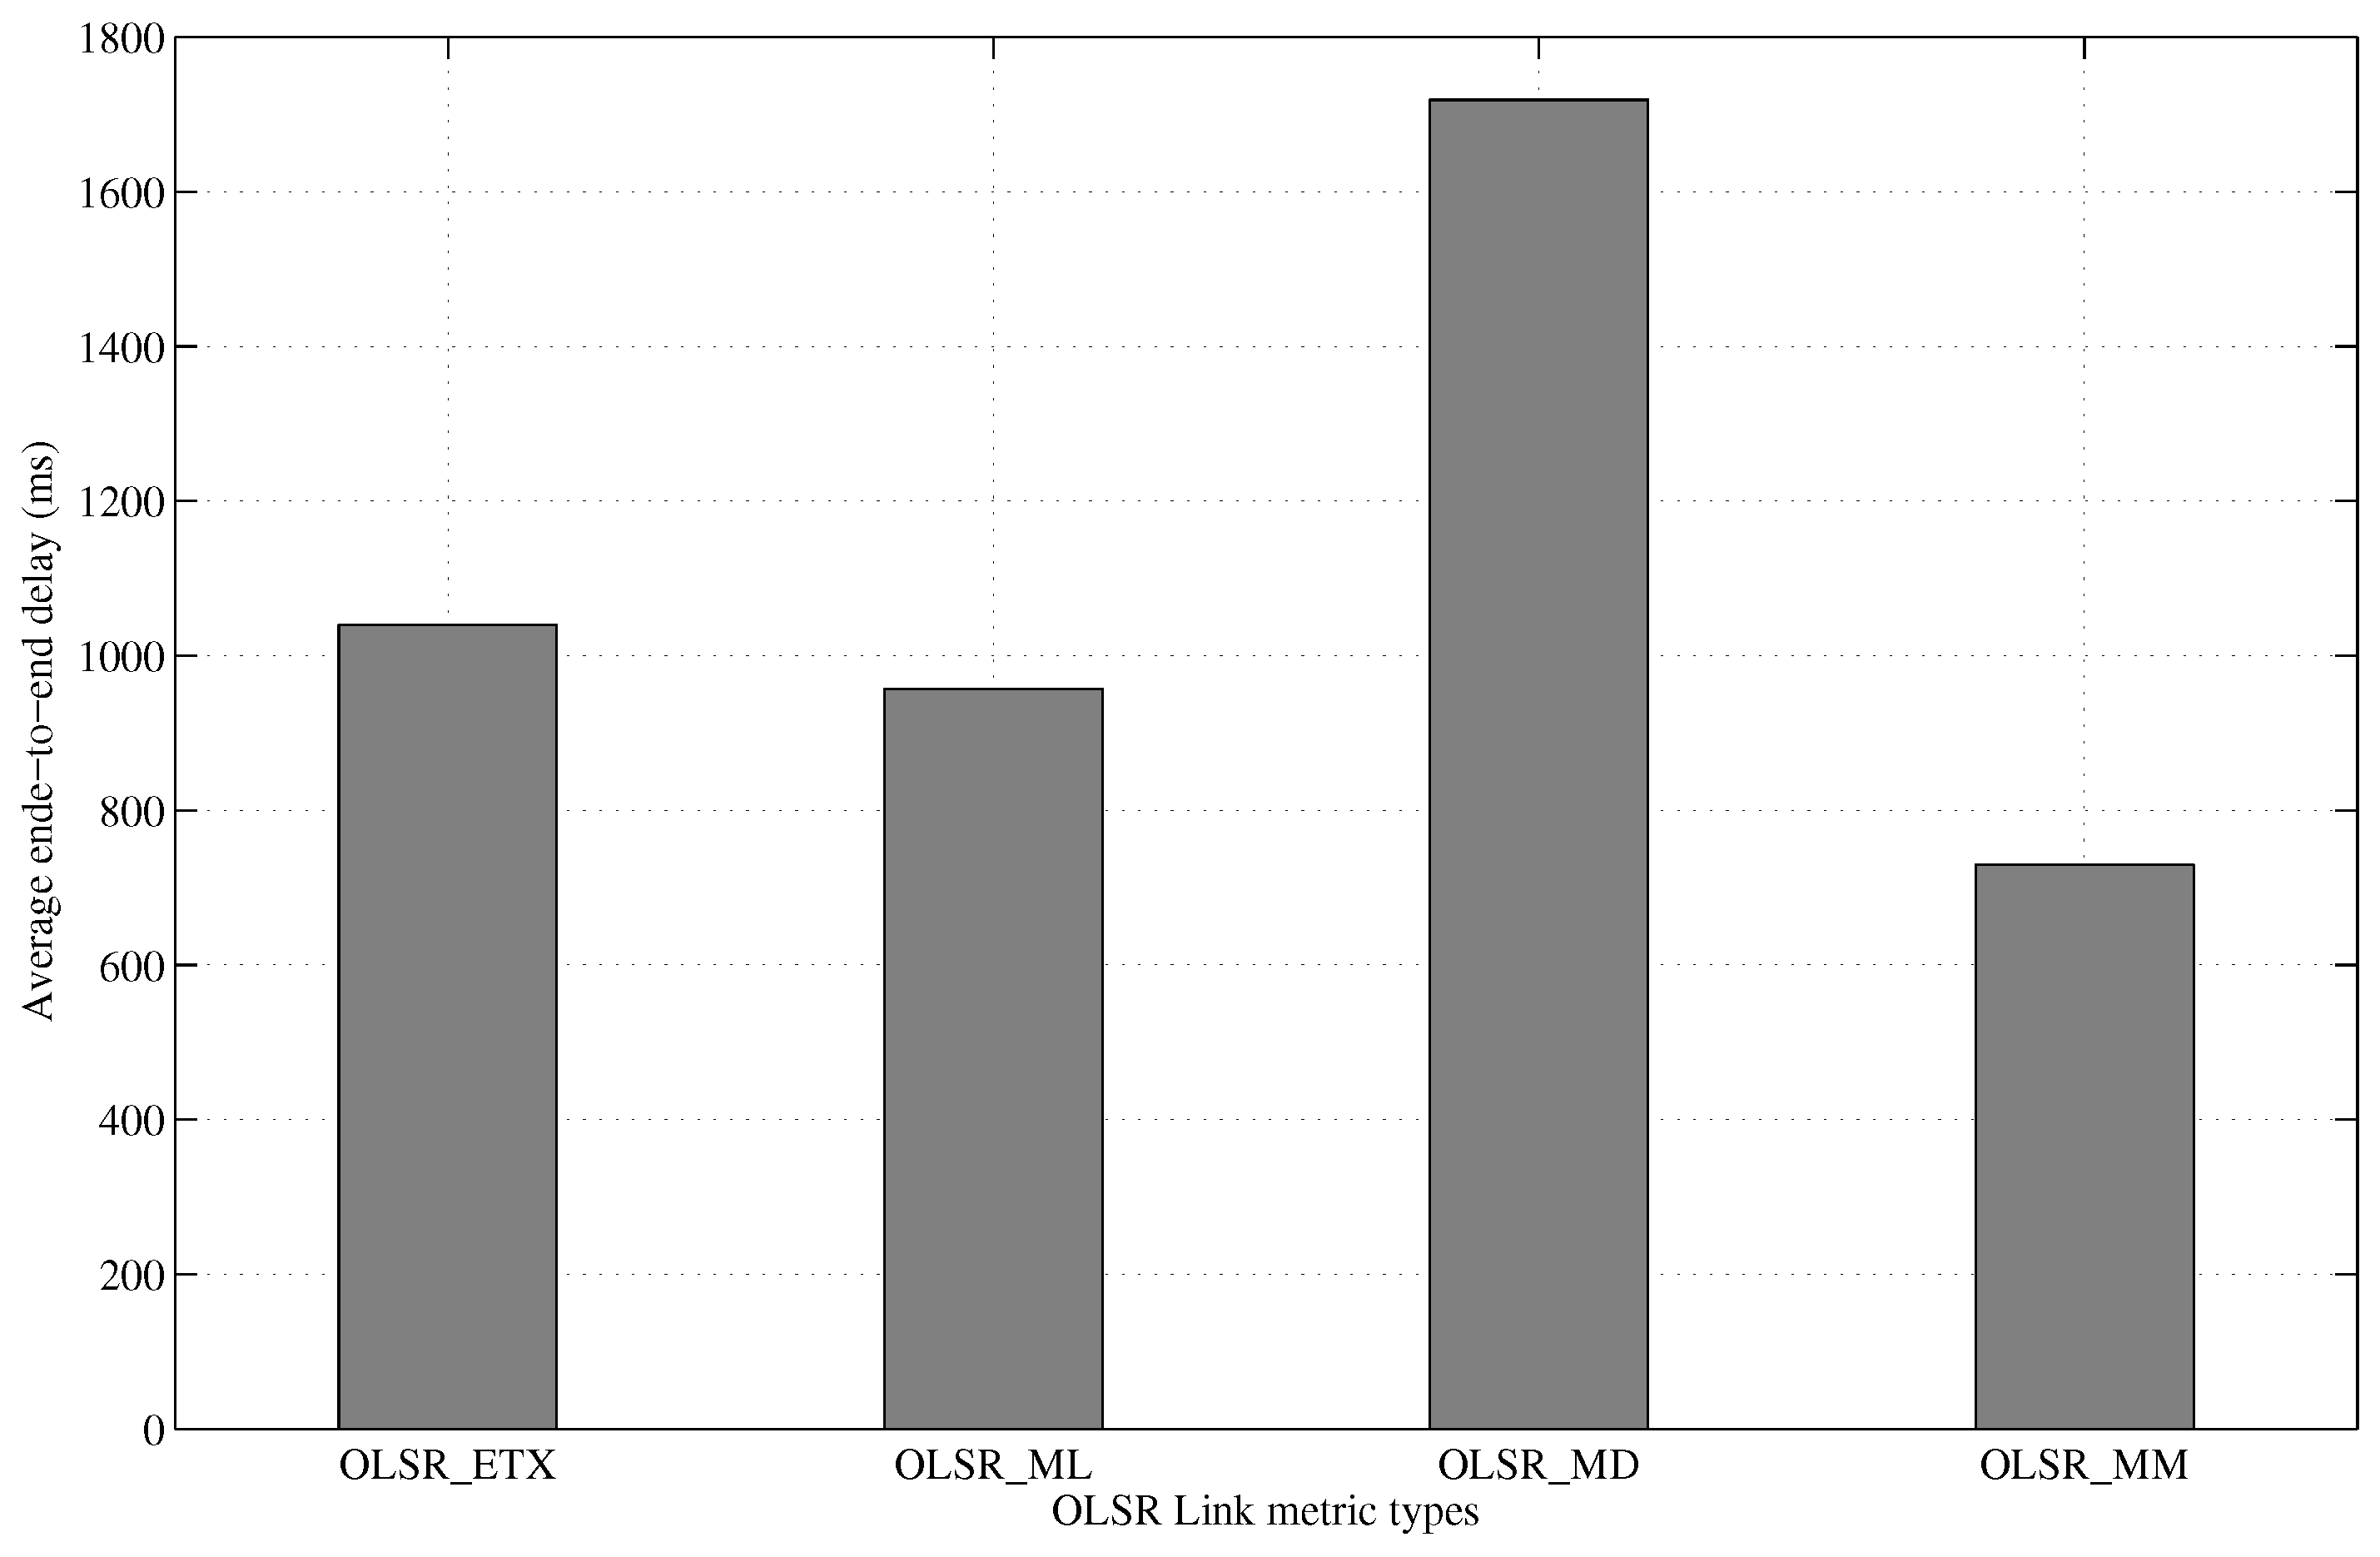
An evaluation of the average end-to-end delay is carried out for all application traffic from the smart meters to the data concentrator, as well as the DR traffic traversing from the data concentrator to the smart meters. As mentioned earlier, the IEEE 802.11b standard with a maximum data rate of 11 Mbps is employed in this study. Other standards with higher bandwidth and data rates may provide higher throughput and lower delay. The average end-to-end delay for all application traffic on the different OLSR versions is presented in
Figure 11.
It can be seen that ML has the lowest average end-to-end delay of all the existing OLSR versions. In addition, the results showed that average end-to-end delay can be further reduced by 23%.
5.4. Performance Evaluation on Different Grid Cluster Sizes
The performance of WMN responds differently to traffic characteristics such as packet generation rate and packet size. Similarly, the WMN responds differently to the number of nodes in the network topology and the position of the destination node. An evaluation of the performance of OLSR multiple metrics while increasing the number of smart meter nodes within the 400 × 400 m
area is carried out. The proposed
is compared to the other OLSR versions. The network scenarios considered are as follows:
A grid topology with smart meter nodes increased from 25 to 36, 49 and 64 grid clusters. This results in the distance between each smart meter node reduced from 100 m to 80 m, 66 m and 57 m for each grid cluster, respectively.
The grid topology network was also evaluated for the position of the data concentrator, which was positioned at the top right corner and the centre of the grid.
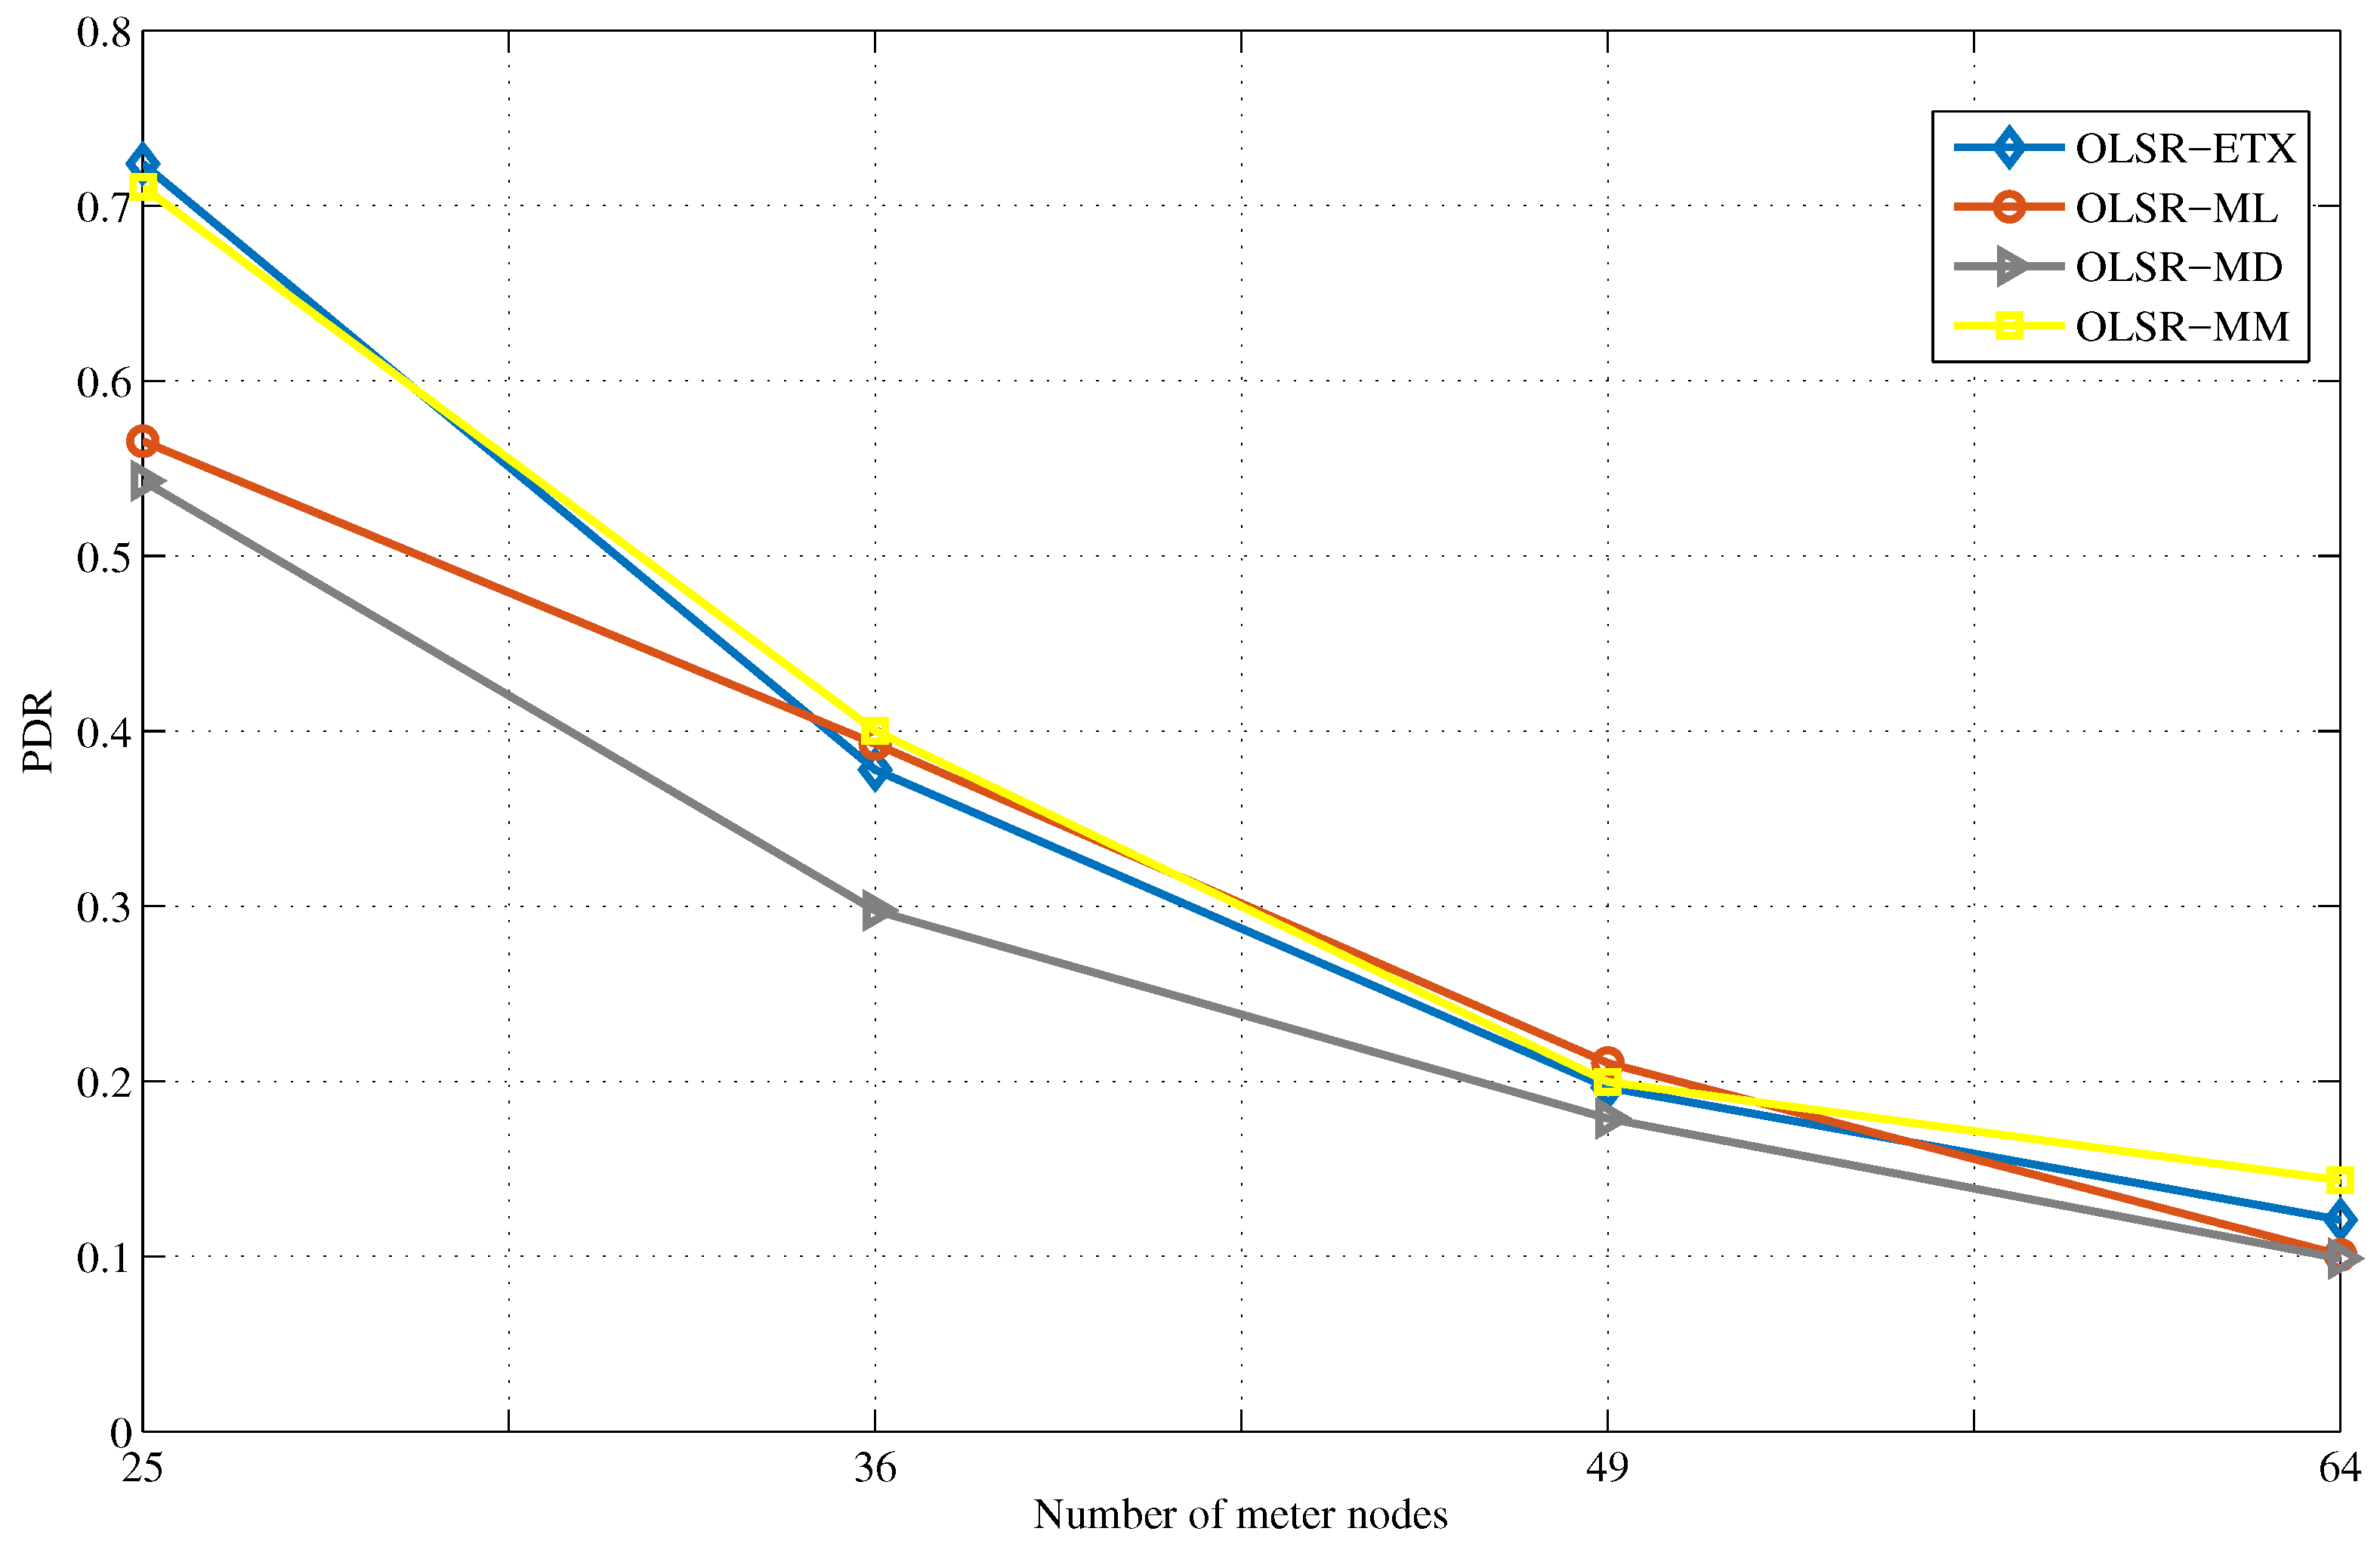
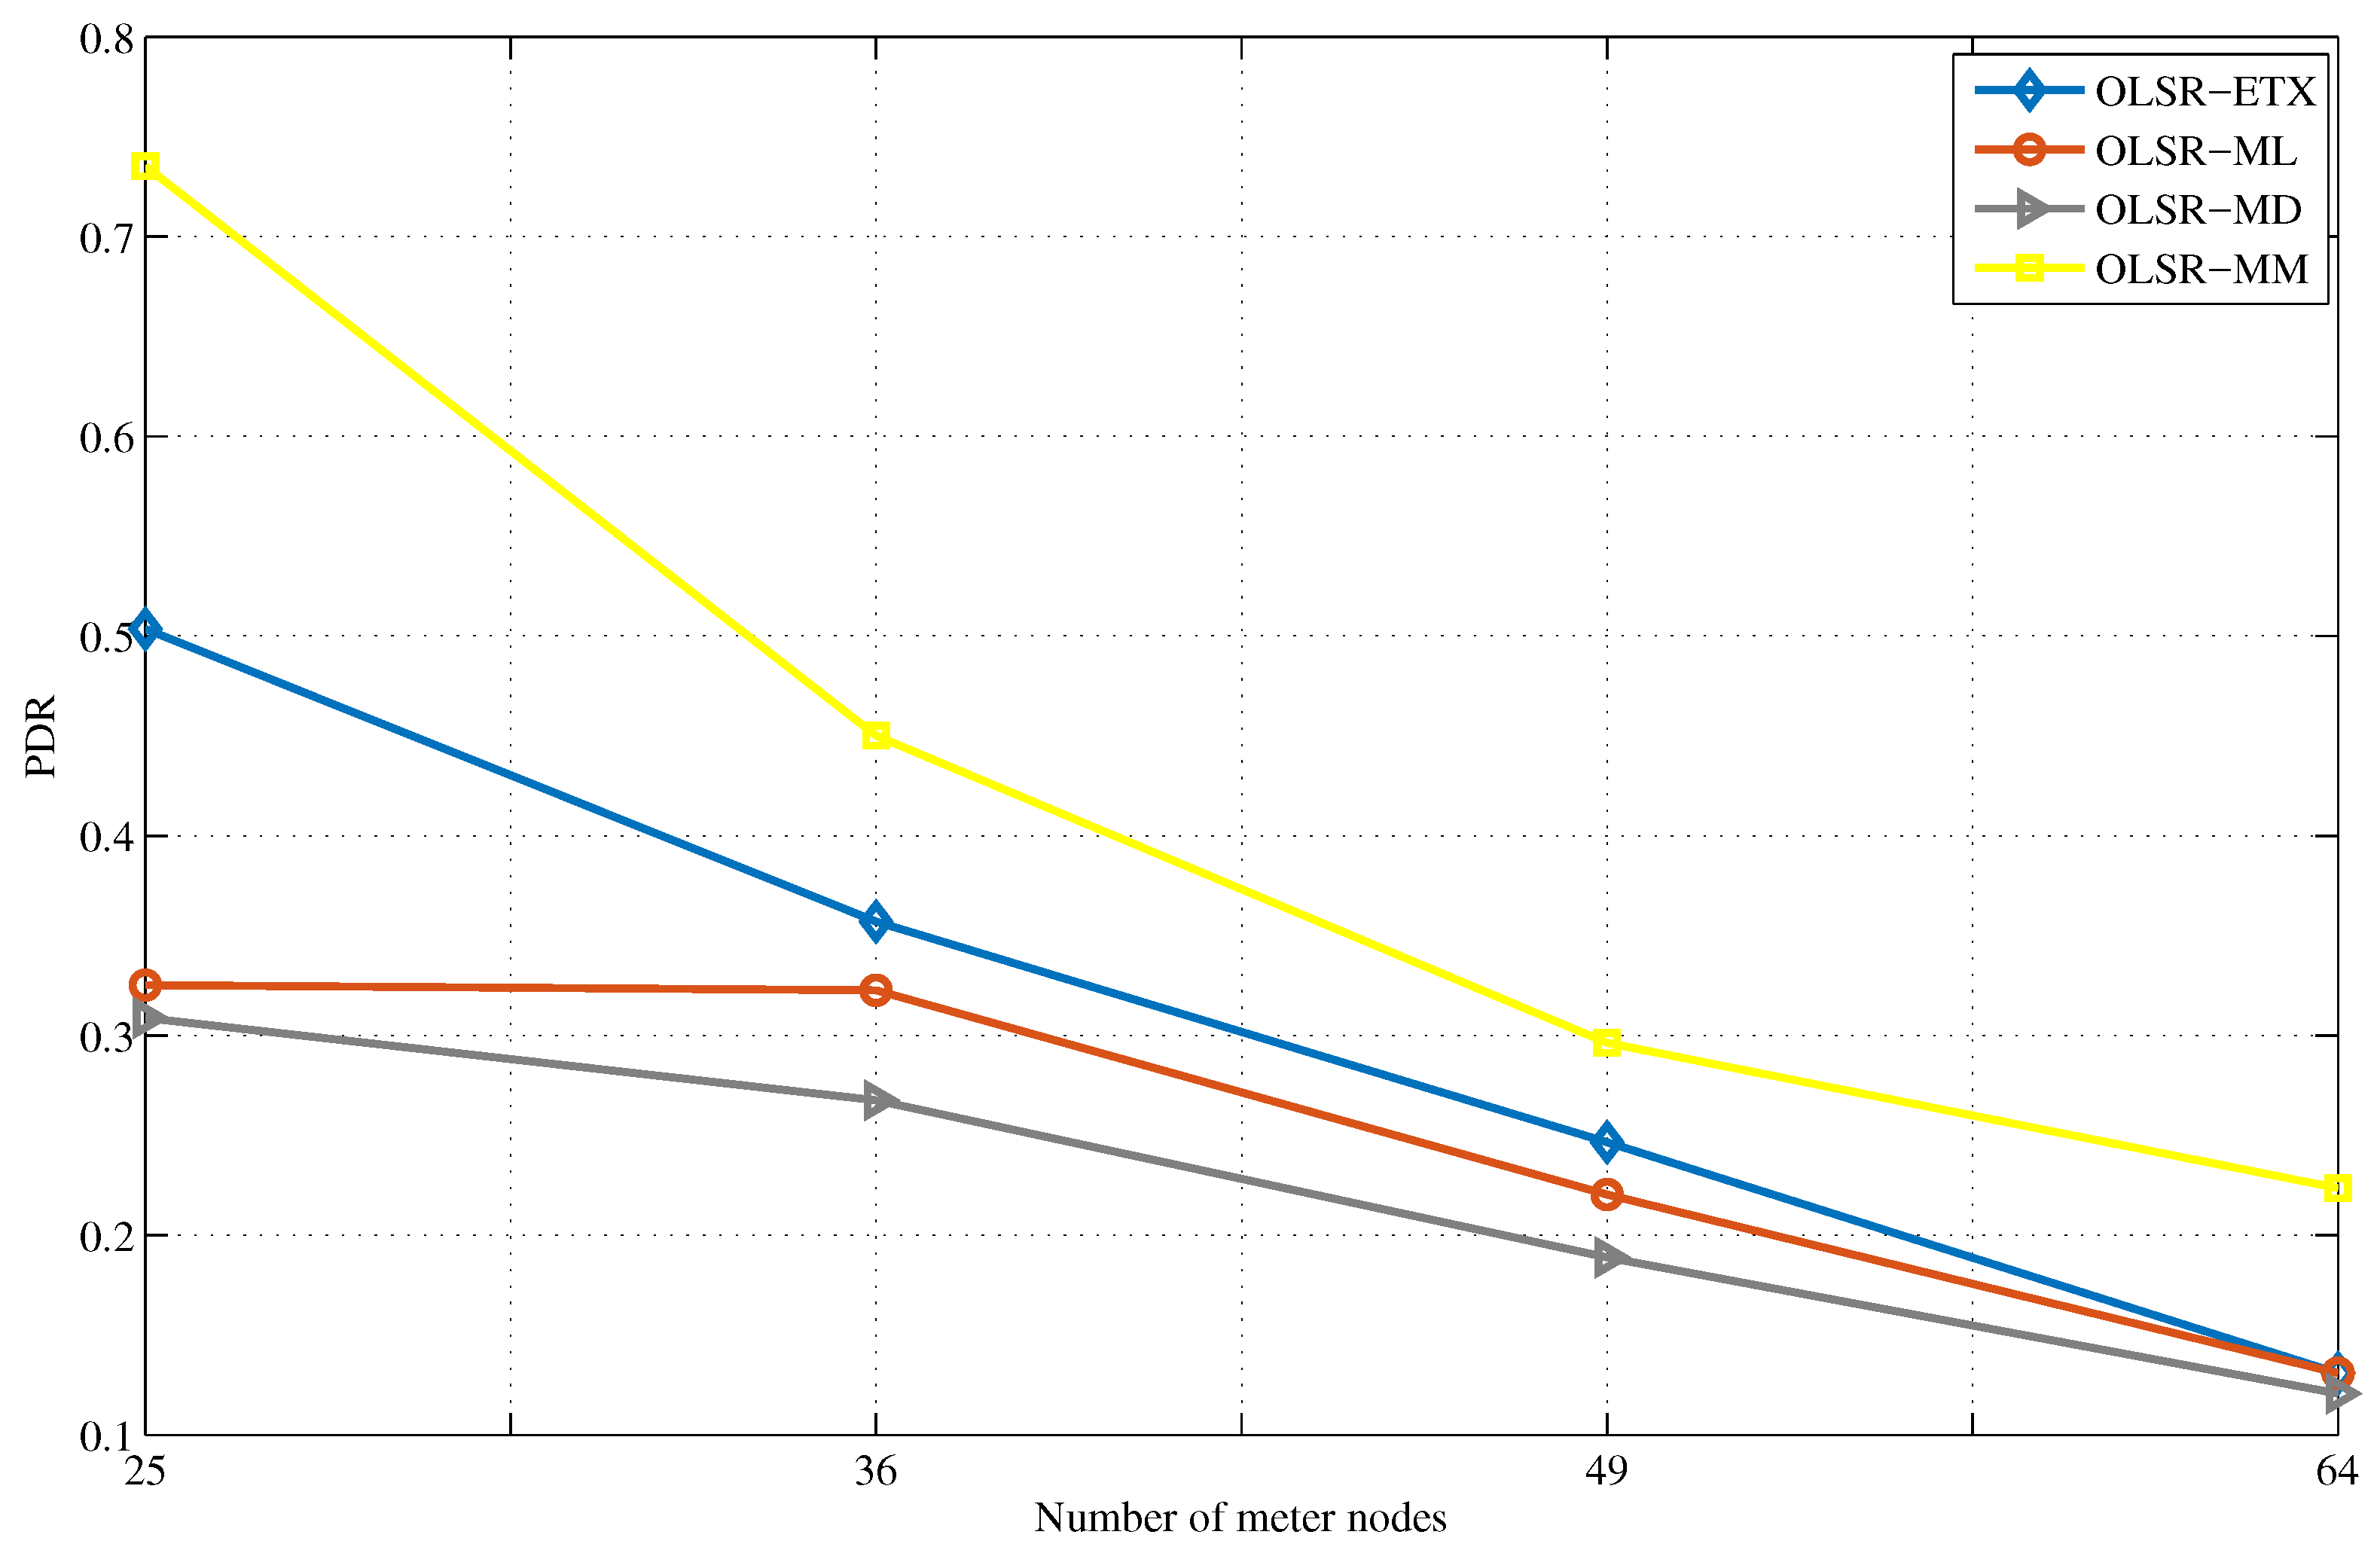
The average PDR on grid clusters of 25, 36, 49 and 64 smart meter nodes with the data concentrator placed at the centre and at the top corner is presented in
Figure 12 and
Figure 13. When the data concentrator is placed in the centre of the grid, the number of hops to the destination is reduced. However, the amount of data transmitted between the smart meter node and the data concentrator is not affected. It is observed in
Figure 12 and
Figure 13 that the
outperforms the other OLSR versions.
also improves the overall PDR of the application traffic in both the central and top corner placement of the data concentrator. The reliability improvement of
when the data concentrator is placed at the top corner is higher than that of central placement. It can be further concluded that sending traffic across multiple paths from the source to the destination using
is more effective at reducing packet drops and congestion over a higher number hops to a destination.
Overall, the grid clusters with the data concentrator placed at the centre of the grid achieved a higher reliability percentage than those with the data concentrator placed at the top corner. With respect to smart meter deployment in NAN, the placement of data concentrators closer to the smart meter nodes can improve reliability.
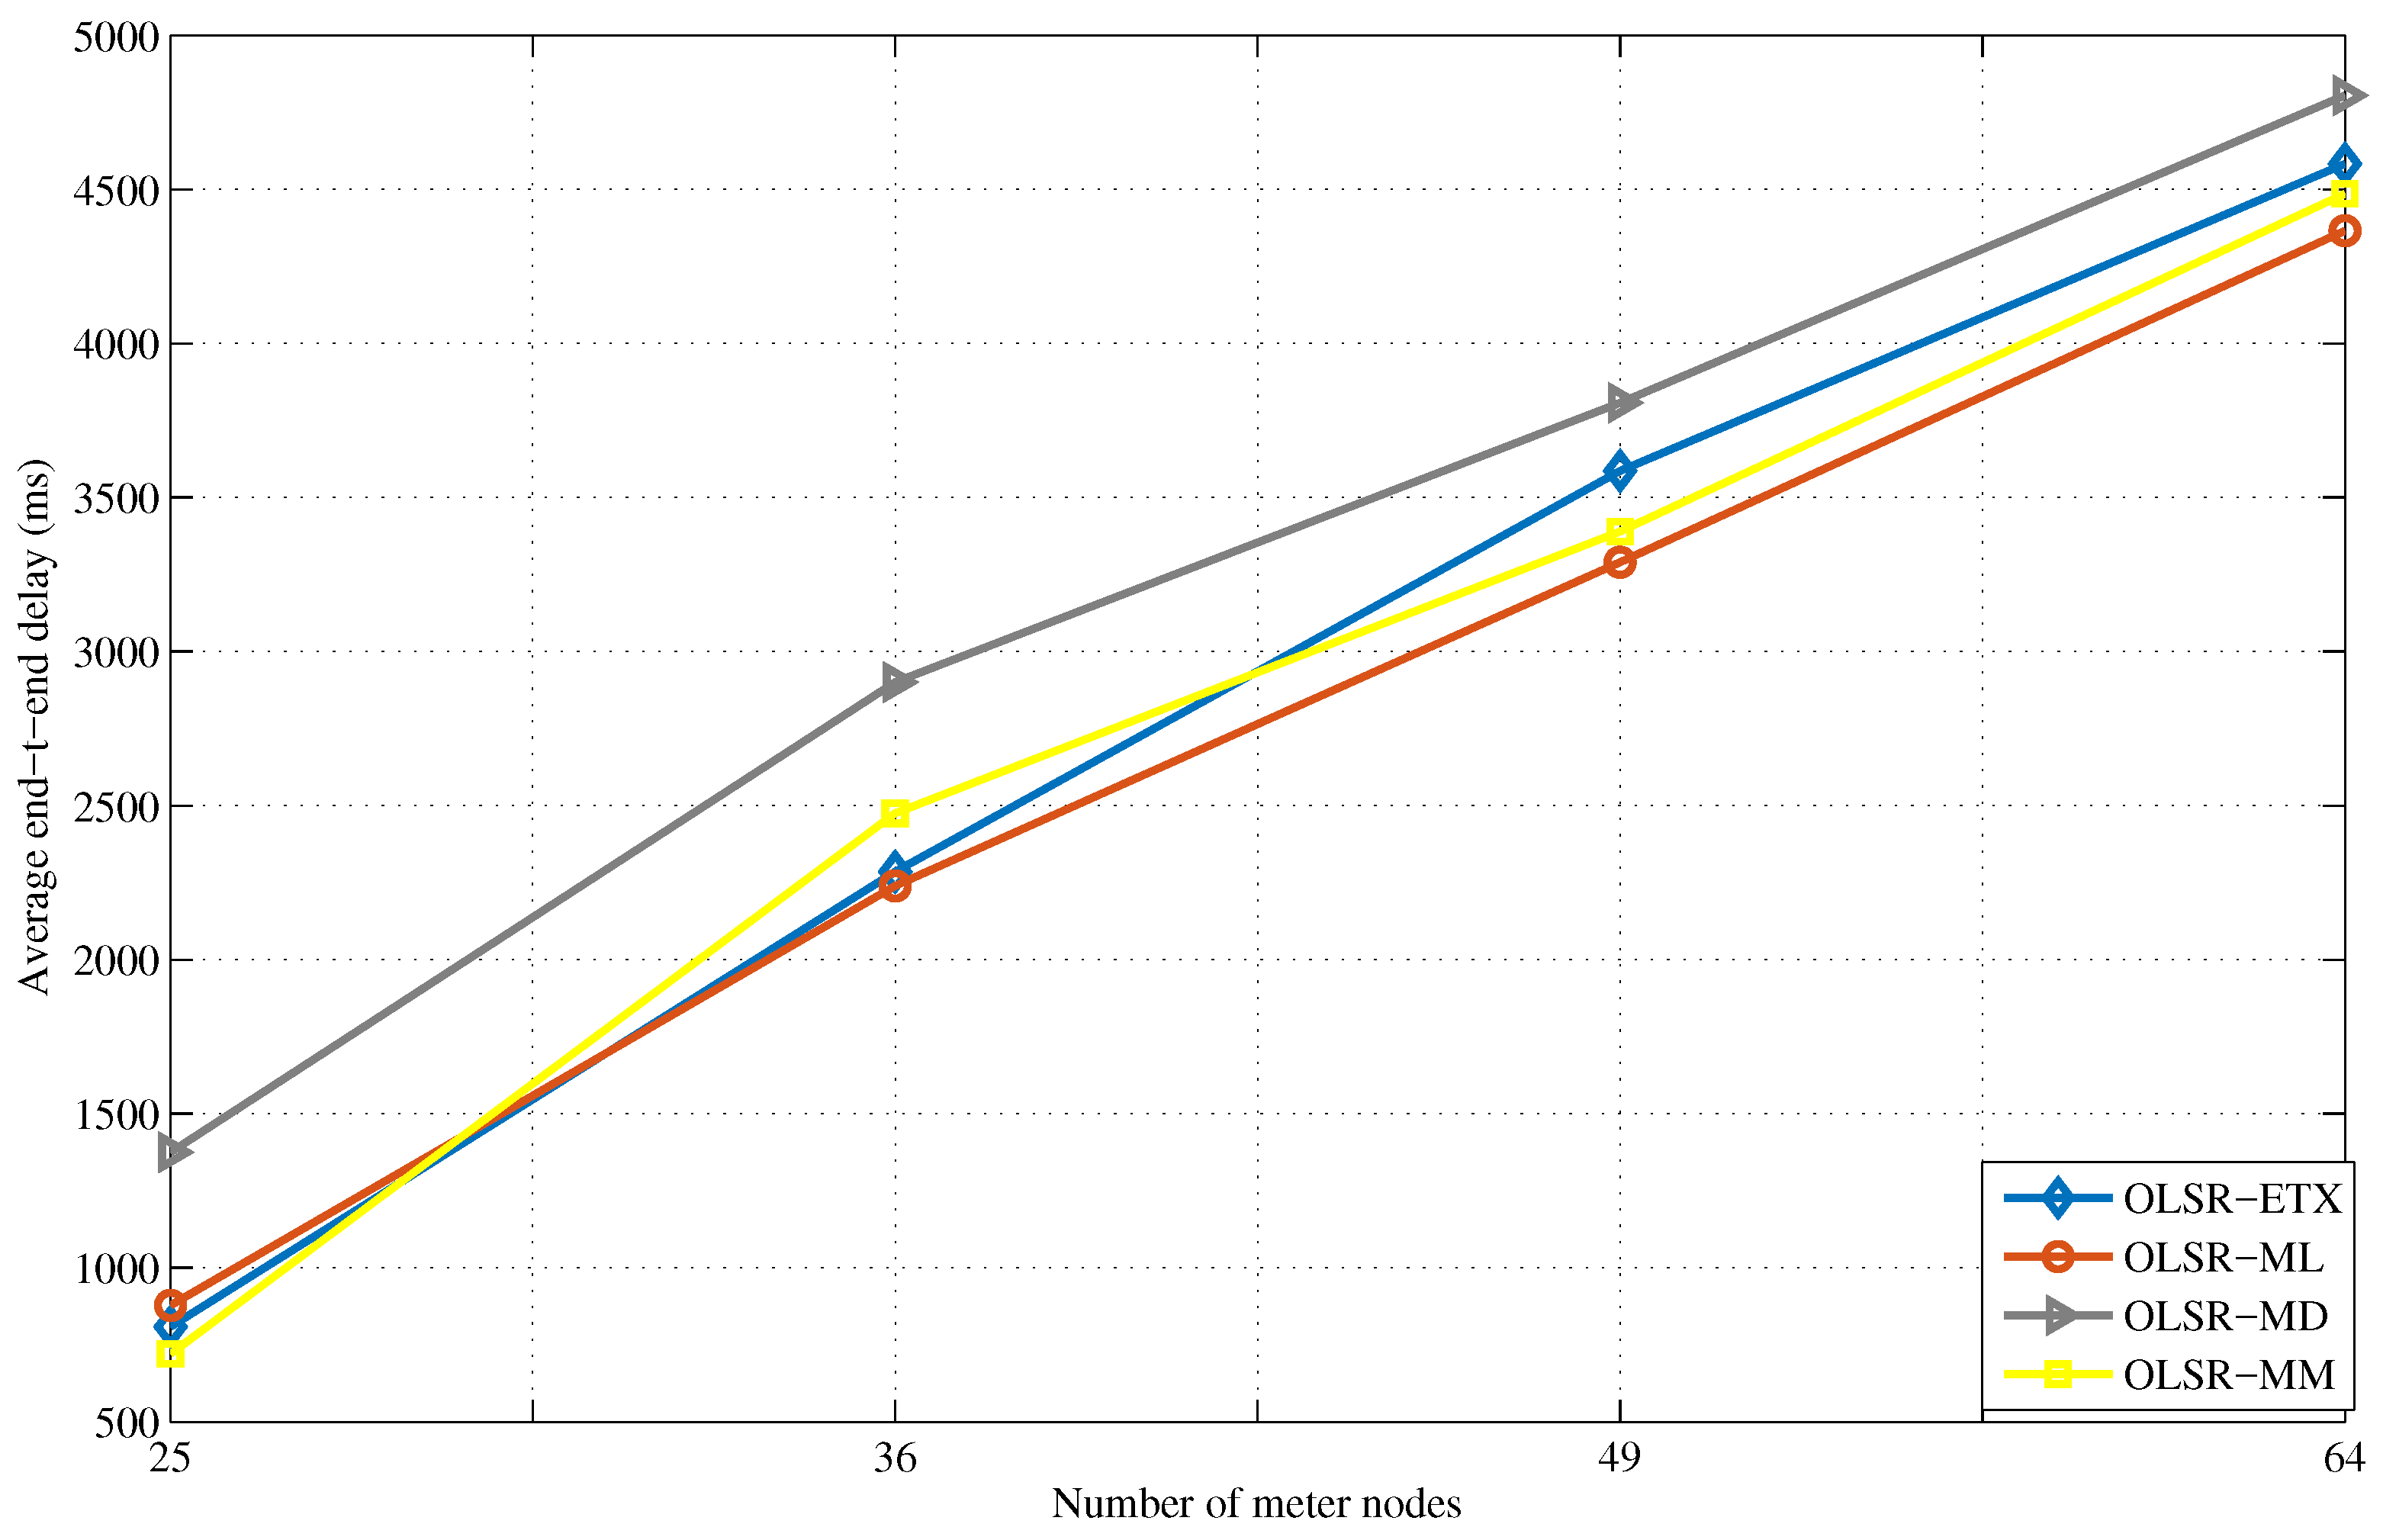
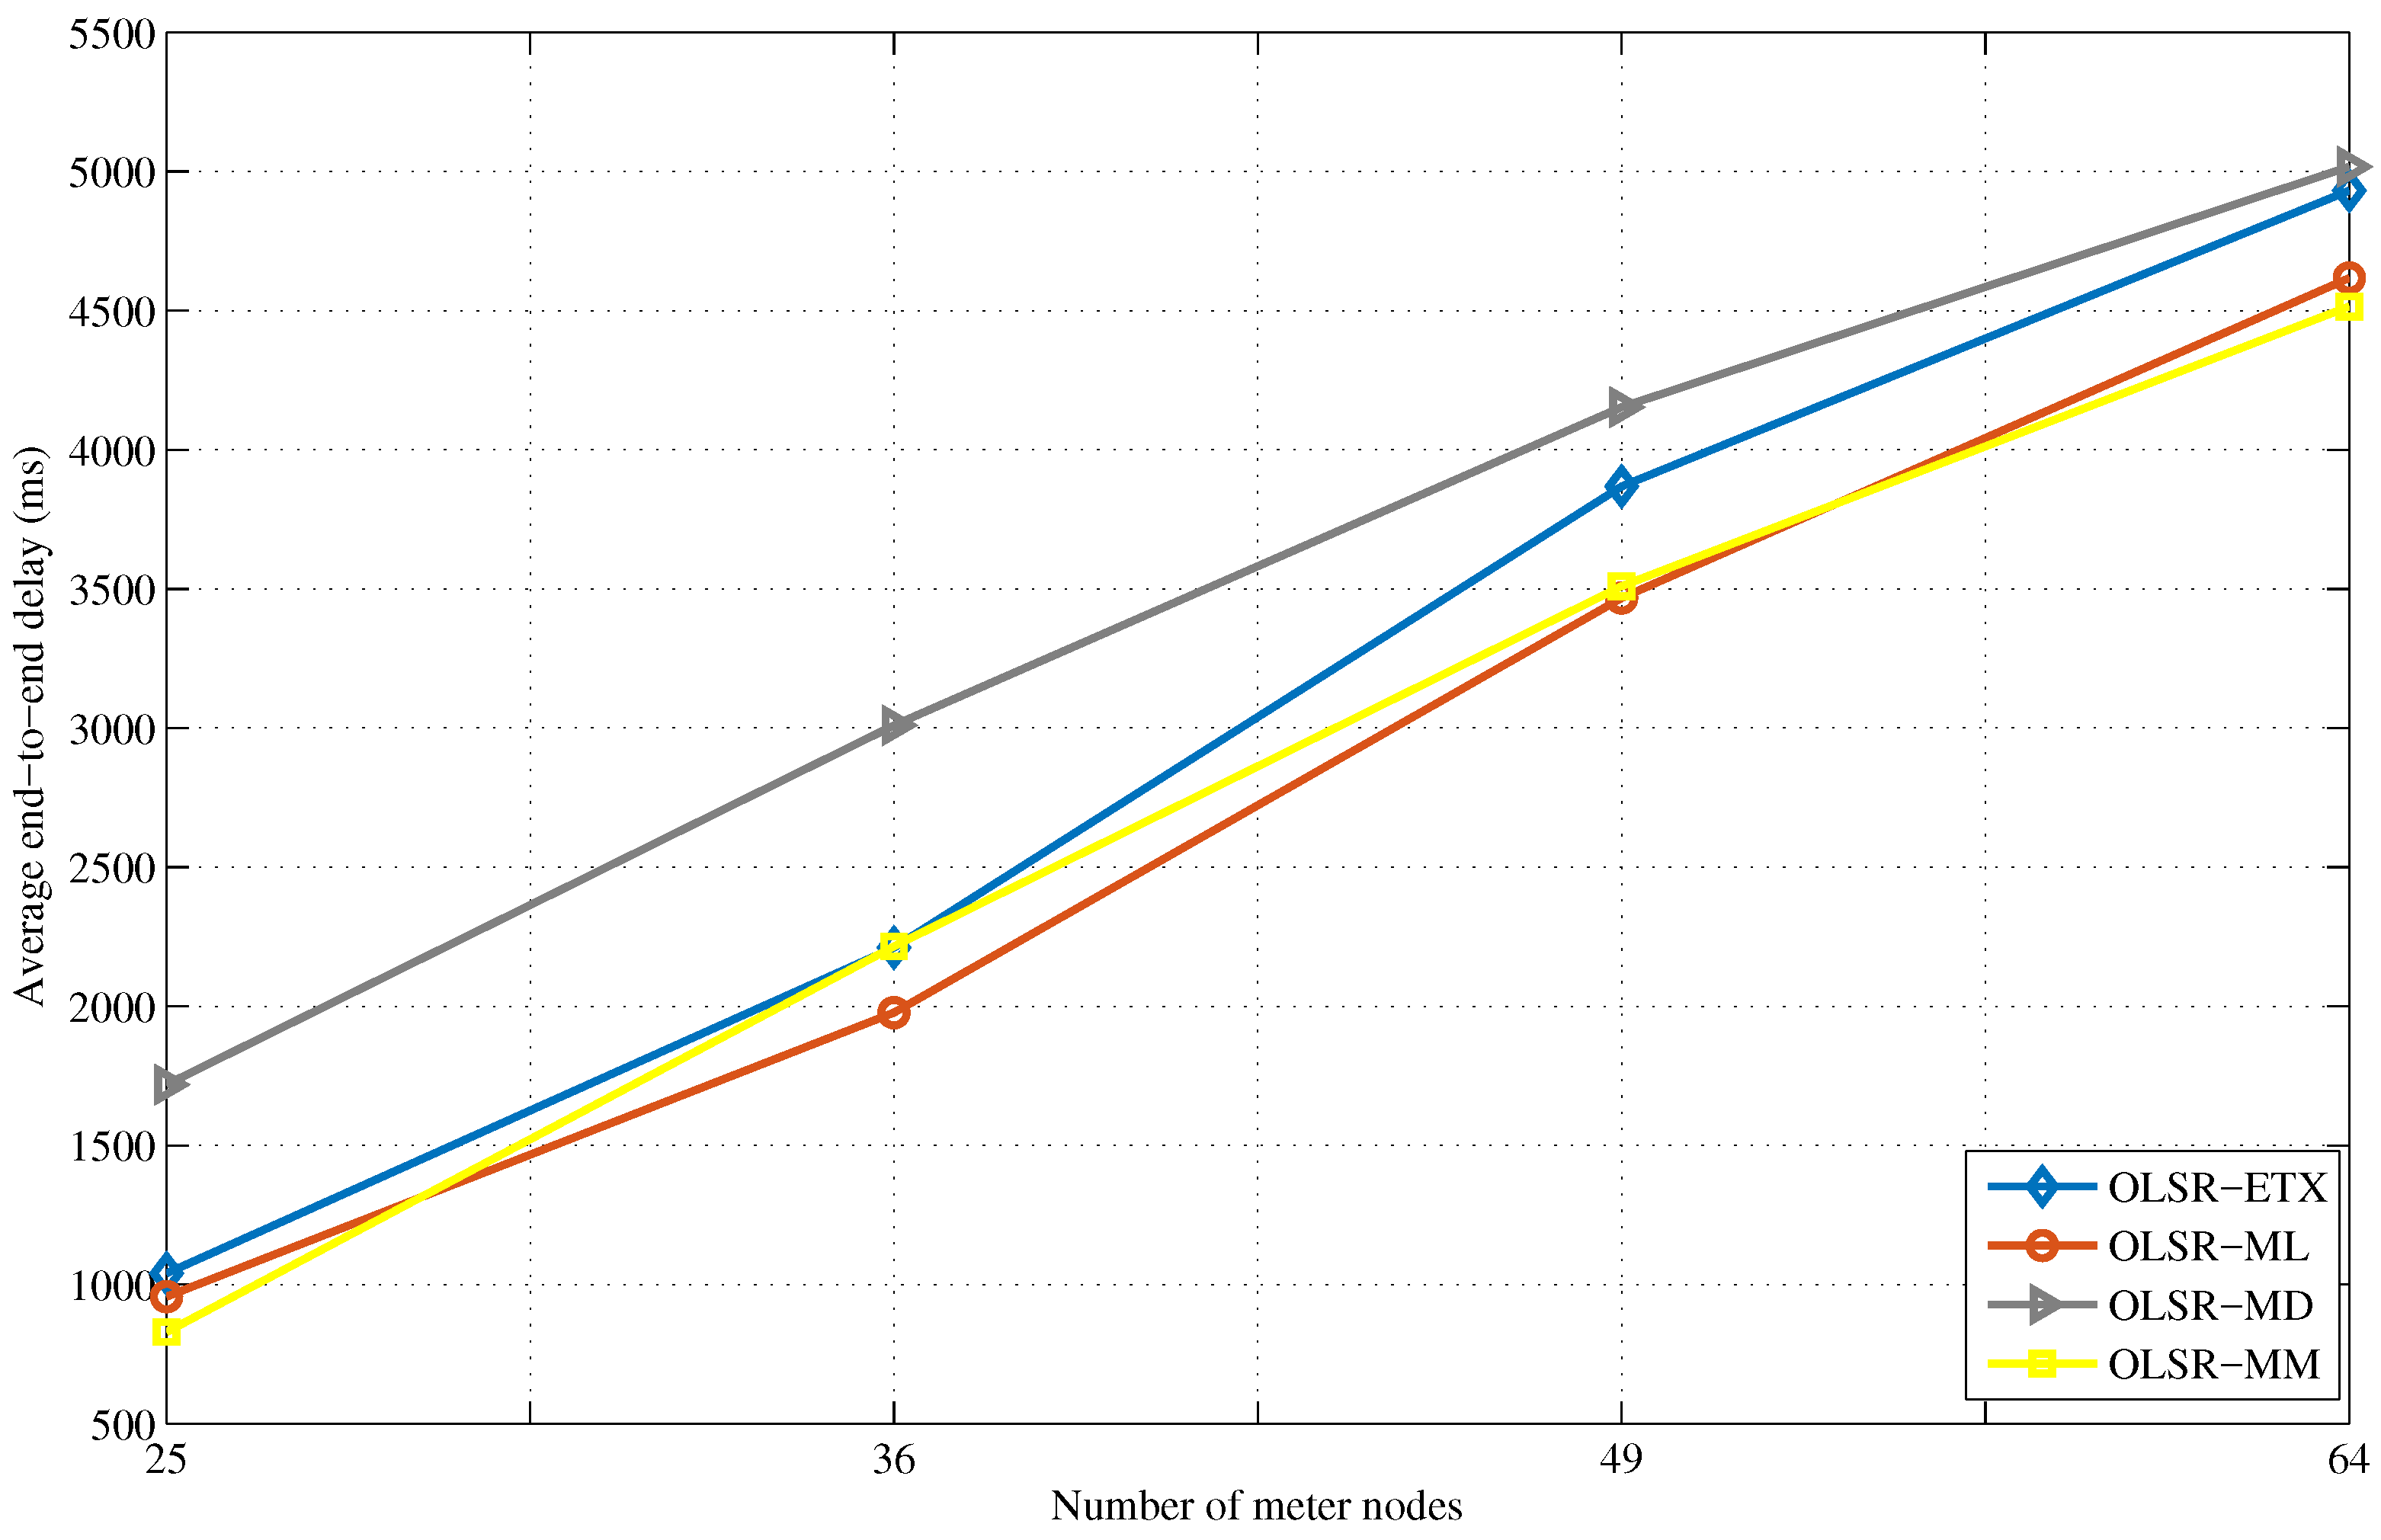
Figure 14 and
Figure 15 show the average end-to-end delay for both scenarios. For the 64-grid cluster, when the data concentrator is placed at the centre,
achieved maximum latency of 4500 ms and 4700 ms when it was paced at the top corner. The average end-to-end delay for grid clusters with the data concentrator placed at the top corner recorded higher delay than the grid clusters with the data concentrator placed at the centre. This is because of the distance to the data concentrator. The main advantage of our routing approach is that it has a better reliability performance, even more than ETX that has the best PDR performance among the conventional OLSR versions. The
also recorded an average end-to-end delay that is as low as OLSR-ML.
5.5. Key Findings
The simulation results presented in
Section 5.3 are summarised in
Table 5. For each application traffic type, the table shows the reliability and delay performance for each link metric version. The first set of results obtained are from a 25-node grid cluster NAN topology, which analyses the PDR of each application traffic type. The average PDR and average end-to-end delay of all applications in the 25-node grid cluster scenario is presented.
The following observations can be drawn from
Table 5:
- (1)
The routing decision made by OLSR-MM provided the highest PDR for reliability and delay-sensitive application traffic, such as EV and DR.
- (2)
Similarly, for power quality and periodic smart metering traffic types, the PDR for was highest.
- (3)
The average end-to-end delay was also improved in the case of , compared with other OLSR versions.
Additional WMN-based NAN scenarios were explored by using two other network topologies to evaluate the performance of the proposed
. The topologies evaluated are:
Different grid cluster topologies with 25, 36, 49 and 64 smart meter nodes.
Data concentrator placement, at the centre of the grid and at the top right corner of the grid.
The results show that data concentrator placement at the centre performed better in all grid clusters than data concentrator placement at the top right corner. This indicates that in future NAN deployments, placing the data concentrator closer to the smart meters will improve the network reliability and delay. However, there was no significant difference in the performance of in both scenarios. From the results presented in this paper, the outperformed the other OLSR versions. The proposed protocol can find a route that best improves the reliability of all of the application traffic types transmitted to the data concentrator simultaneously. The multipath routing provided by using multiple metrics and AHP has increased the PDR and reduced the delay of all of the application traffic types, compared with single-metric OLSR versions. Consequently, the multiple metrics routing approach can be used to provide QoS routing for different SG traffic types. All of the application traffic types transmitted in the simulation used a required parameter provided from the link metrics to make decisions on their path to the data concentrator. The simulation results have shown that with the use of multiple metrics, the QoS requirements of each traffic type can be better satisfied. It is also important to state that the use of multiple metrics is not only limited to the routing protocol and link metric types used in our simulations.
6. Conclusions
Within the NANs, applications present unique QoS requirements based on their traffic characteristics. However, in conventional OLSR protocols, routing decisions are based on a single metric, and all traffic types are forwarded on the same link irrespective of individual traffic requirements. By employing multiple metrics and integrating AHP into the routing decision process, the technique retrofits QoS in OLSR to improve network delay and reliability. The results from the NAN topologies investigated reveal that improved the performance of AMI traffic in terms of reliability and delay compared with conventional single-metric OLSR protocols. For example, in a 25-node WMN-based NAN, we showed that can improve the end-to-end delay and PDR by 23% and 45%, respectively, compared with conventional OLSR variants that are based on a single metric. Beyond the scenarios presented, the proposed technique is generally suitable for AMIs with heterogeneous wireless technologies or non-uniformly distributed loads on intermediary links between smart meters and the data concentrator. To facilitate the practical realisation of the proposed technique, future work will include the impact of OLSR probes on the performance and implementation complexity of . Furthermore, QoS routing protocols such as HQMR, QUORUM and MARIA will be another focus of our future research, which can give insightful results when compared to the schemes studied in the current work.
Acknowledgments
The authors would like to acknowledge the financial support of the European Regional Development Fund (ERDF) through the Centre for Global Eco-Innovation, Lancaster University and HW communications Ltd Lancaster, UK.
Author Contributions
All four authors contributed to the paper. Yakubu Tsado conceived of and designed the model. All of the other authors wrote, reviewed and commented on the manuscript. All of the authors have read and approved the final manuscript.
Conflicts of Interest
The authors declare no conflict of interest.
Abbreviations
The following abbreviations are used in this manuscript:
| AHP | Analytical Hierarchy Process |
| OLSR | Optimised Link State Routing Protocol |
| ETX | Expected Transmission Count |
| ML | Minimum Loss |
| MD | Minimum Delay |
| RLMT | Relative Link Metric Type |
| RLMV | Relative Link Metric Value |
| RLMTW | Relative Link Metric Weight |
| AMI | Advanced Metering Infrastructure |
| SG | Smart Grid |
| WMN | Wireless Mesh Network |
| PDR | Packet Delivery Ratio |
| MCDM | Multi-Criteria Decision-Making |
| EV | Electronic Vehicle |
References
- 2030-2011-IEEE Guide for Smart Grid Interoperability of Energy Technology and Information Technology Operation with the Electric Power System (EPS), End-Use Applications, and Loads; IEEE Standards Association: Piscataway, NJ, USA, 2011.
- Ikpehai, A.; Adebisi, B.; Rabie, K.M. Broadband PLC for clustered advanced metering infrastructure (AMI) architecture. Energies 2016, 9, 569. [Google Scholar] [CrossRef]
- Mohassel, R.R.; Fung, A.; Mohammadi, F.; Raahemifar, K. A survey on advanced metering infrastructure. Int. J. Electr. Power Energy Syst. 2014, 63, 473–484. [Google Scholar] [CrossRef]
- Cheng, X.; Mohapatra, P.; Lee, S.J.; Banerjee, S. MARIA: Interference-aware admission control and QoS routing in wireless mesh networks. In Proceedings of the 2008 IEEE International Conference on Communications (ICC’08), Beijing, China, 19–23 May 2008; pp. 2865–2870.
- Tsado, Y.; Lund, D.; Gamage, K.A. Resilient communication for smart grid ubiquitous sensor network: State of the art and prospects for next generation. Comput. Commun. 2015, 71, 34–49. [Google Scholar] [CrossRef]
- Wu, S.J.; Huang, S.Y.; Huang, K.F. Efficient Quality of Service scheduling mechanism for WiMAX networks. Comput. Commun. 2012, 35, 936–951. [Google Scholar] [CrossRef]
- Piro, G.; Grieco, L.A.; Boggia, G.; Camarda, P. QoS in wireless LAN: A comparison between feedback-based and earliest due-date approaches. Comput. Commun. 2012, 35, 298–308. [Google Scholar] [CrossRef]
- Cheng, H.T.; Zhuang, W. QoS-driven MAC-layer resource allocation for wireless mesh networks with non-altruistic node cooperation and service differentiation. IEEE Trans. Wirel. Commun. 2009, 8, 6089–6103. [Google Scholar] [CrossRef]
- Tsado, Y.; Lund, D.; Gamage, K. Resilient wireless communication networking for Smart grid BAN. In Proceedings of the 2014 IEEE International Energy Conference (ENERGYCON), Dubrovnik, Croatia, 13–16 May 2014; pp. 846–851.
- Saputro, N. Performance Optimization of Network Protocols for IEEE 802.11 s-Based Smart Grid Communications. Ph.D. Thesis, Florida International University, Miami, FL, USA, 2016. [Google Scholar]
- Tsado, Y.; Gamage, K.A.; Lund, D.; Adebisi, B. Performance analysis of variable smart grid traffic over ad hoc wireless mesh networks. In Proceedings of the IEEE International Conference on Smart Systems and Technologies (SST), Osijek, Croatia, 12–14 October 2016; pp. 81–86.
- Tsado, Y.; Gamage, K.A.; Lund, D.; Adebisi, B. Multiple metrics-OLSR in NAN for Advanced Metering Infrastructures. In Proceedings of the 2016 IEEE International Smart Cities Conference (ISC2), Trento, Italy, 12–15 September 2016.
- Toimoor, J.M. Study of the Scalability of Modified AODV-UU Routing Protocol for the Smart Grid Application. Master’s Thesis, University of Windsor, Windsor, ON, Canada, 2013. [Google Scholar]
- Pozveh, H.J.; Mohammadinejad, H.; Bateni, M. Improving the AODV Protocol to Satisfy the Required Level of Reliability for Home Area Networks. Int. J. Comput. Netw. Inform. Secur. 2016, 6, 22–28. [Google Scholar]
- Johnson, D.; Hu, Y.; Maltz, D. The Dynamic Source Routing Protocol (DSR) for Mobile Ad Hoc Networks for IPv4. 2007. Available online: https://www.rfc-editor.org/rfc/pdfrfc/rfc4728.txt.pdf (accessed on 25 February 2017).
- Kevre, P.; Shrivastava, L. Compare three reactive routing protocols in grid based cluster wireless sensor network using qualnet simulator. Int. J. Appl. Sci. Eng. Res. 2014, 3, 532–539. [Google Scholar]
- Iwao, T.; Yamada, K.; Yura, M.; Nakaya, Y.; Cárdenas, A.A.; Lee, S.; Masuoka, R. Dynamic data forwarding in wireless mesh networks. In Proceedings of the 2010 1st IEEE International Conference on Smart Grid Communications (SmartGridComm), Gaithersburg, MD, USA, 4–6 October 2010; pp. 385–390.
- Jung, J.S.; Lim, K.W.; Kim, J.B.; Ko, Y.B.; Kim, Y.; Lee, S.Y. Improving IEEE 802.11 s wireless mesh networks for reliable routing in the smart grid infrastructure. In Proceedings of the 2011 IEEE International Conference on Communications Workshops (ICC), Kyoto, Japan, 5–9 June 2011.
- Saputro, N.; Akkaya, K. PARP-S: A secure piggybacking-based ARP for IEEE 802.11 s-based Smart Grid AMI networks. Comput. Commun. 2015, 58, 16–28. [Google Scholar] [CrossRef]
- Kone, V.; Das, S.; Zhao, B.Y.; Zheng, H. QUORUM—quality of service routing in wireless mesh networks. In Proceedings of IEEE/ICST International Conference on Heterogeneous Networking for Quality, Reliability, Security and Robustness (QShine 2007), Vancouver, BC, Canada, 14–17 August 2007; p. 18.
- Bargaoui, H.; Mbarek, N.; Togni, O.; Frikha, M. HQMR: Hybrid QoS based Routing Protocol for Wireless Mesh Environment. Int. J. Adv. Netw. Serv. 2015, 8, 27–41. [Google Scholar]
- Alkahtani, A.M.; Woodward, M.E.; Al-Begain, K. Prioritised best effort routing with four quality of service metrics applying the concept of the analytic hierarchy process. Comput. Oper. Res. 2006, 33, 559–580. [Google Scholar] [CrossRef]
- Moreira, W.; Aguiar, E.; Abelém, A.; Stanton, M. Using multiple metrics with the optimized link state routing protocol for wireless mesh networks. In Proceedings of the 26th Simpósio Brasileiro de Redes de Computadores e Sistemas Distribuıdos, Porto Alegre, Brazil, 26–28 May 2008.
- Paris, S.; Nita-Rotaru, C.; Martignon, F.; Capone, A. Cross-layer metrics for reliable routing in wireless mesh networks. IEEE/ACM Trans. Netw. 2013, 21, 1003–1016. [Google Scholar] [CrossRef]
- Park, J.C. Channel-Error and Collision Aware, Secure Multihop Ad Hoc Wireless Networks; ProQuest: Ann Arbor, MI, USA, 2008. [Google Scholar]
- Campista, M.E.M.; Esposito, P.M.; Moraes, I.M.; Costa, L.H.M.; Duarte, O.C.M.; Passos, D.G.; De Albuquerque, C.V.N.; Saade, D.C.M.; Rubinstein, M.G. Routing metrics and protocols for wireless mesh networks. IEEE Netw. 2008, 22, 6–12. [Google Scholar] [CrossRef]
- Passos, D.; Teixeira, D.V.; Muchaluat-Saade, D.C.; Magalhães, L.C.S.; Albuquerque, C. Mesh network performance measurements. In Proceedings of the International Information and Telecommunicatios Technologies Symposium (I2TS), Cuiaba, Brazil, 6–8 December 2006; pp. 48–55.
- Cordeiro, W.; Aguiar, E.; Junior, W.M.; Abelem, A.; Stanton, M. Providing quality of service for mesh networks using link delay measurements. In Proceedings of the 16th International Conference on Computer Communications and Networks (ICCCN 2007), Honolulu, HI, USA, 13–16 August 2007; pp. 991–996.
- Javaid, N.; Ullah, M.; Djouani, K. Identifying design requirements for wireless routing link metrics. In Proceedings of the 2011 IEEE Global Telecommunications Conference (GLOBECOM 2011), Houston, TX, USA, 5–9 December 2011.
- Wang, Z.; Crowcroft, J. Quality-of-service routing for supporting multimedia applications. IEEE J. Sel. Areas Commun. 1996, 14, 1228–1234. [Google Scholar] [CrossRef]
- Golden, B.L.; Wasil, E.A.; Harker, P.T. The Analytic Hierarchy Process; Springier: New York, NY, USA, 1989. [Google Scholar]
- Dey, P.K. Decision support system for inspection and maintenance: A case study of oil pipelines. IEEE Trans. Eng. Manag. 2004, 51, 47–56. [Google Scholar] [CrossRef]
- Huang, C.C.; Chu, P.Y.; Chiang, Y.H. A fuzzy AHP application in government-sponsored R&D project selection. Omega 2008, 36, 1038–1052. [Google Scholar]
- Kim, J.; Kim, D.; Lim, K.W.; Ko, Y.B.; Lee, S.Y. Improving the reliability of IEEE 802.11 s based wireless mesh networks for smart grid systems. J. Commun. Netw. 2012, 14, 629–639. [Google Scholar] [CrossRef]
- Khan, R.H.; Khan, J.Y. A comprehensive review of the application characteristics and traffic requirements of a smart grid communications network. Comput. Netw. 2013, 57, 825–845. [Google Scholar] [CrossRef]
© 2017 by the authors. Licensee MDPI, Basel, Switzerland. This article is an open access article distributed under the terms and conditions of the Creative Commons Attribution (CC BY) license ( http://creativecommons.org/licenses/by/4.0/).


 ,
, 


