In this section we replicate the hedging of transmission risk in the Nordic electricity markets by using EPAD Combos as a proxy for FTRs. We perform an empirical analysis on historical market data (2006–2013) and estimate the forward risk premia in FTRs used for hedging locational price risk between twenty interconnected bidding areas on seven international and three intra-national Nordic grid interconnectors. By using established risk premia methodology, we are able to shed light on the accuracy of the current market to price the replicated FTRs. This section first presents the methodology behind risk premium calculations, including theoretical grounding and practical interpretation. Then, the data behind the empirical analysis is presented, including detailed background of the selected interconnectors. The section ends with results and discussion.
3.1. Risk Premium Methodology
One approach to investigate pricing accuracy of electricity futures contracts, in this case replicated FTRs, is to calculate risk premia, which are systematic differences between the trading prices of electricity derivative contract (
) and the contract’s expected (ex-ante) spot price when it is delivered
. We call this systematic difference a forward risk premium, in line with [
35,
36,
46,
47]. Forward risk premia can be understood as mark-ups or compensations in the derivatives contracts charged either by suppliers or consumers for bearing the price risk for the underlying commodity (electricity) ([
47], p. 1887). Initially [
48,
49,
50], research on risk premia has argued that the difference between the current futures price and the expected future spot price is negative, because producers are under greater hedging pressures, which puts a downward pressure on the current futures prices as compared to the expected spot prices. Nonetheless, the more recent studies [
30,
37,
51,
52] describe both, positive and negative relationships, indicating that consumers may also be under a greater hedging pressure, which puts an upward pressure on the current futures prices as compared to the expected spot prices.
In the forward and futures pricing literature (equity, foreign exchange, and fixed income derivatives) it is a common practice to calculate the ex-ante premium in the forward price as an ex-post differential between the futures prices and the realized delivery date spot prices [
53]. Longstaff and Wang [
47] suggested this ex-post approach to risk premia in electricity forward prices by using
as a proxy for
, and Marckhoff and Wimschulte [
35] applied this proxy to calculate the ex-post risk premium for EPADs. In our study, we too embrace the ex-post approach to risk premia which we calculate for replicated FTRs.
As a basis for our calculations we assume that the EPAD contracts used in the FTR replication are acquired on the last contract trading day at the last trading day closing price (expiration day fix ([
43], p. 9)). This also implies that we omit mark-to-market during the trading period, which is called the expiry market settlement [
43]. The last trading day closing price can arguably be said to contain the most information about the coming future for which the contract is made and therefore it is the markets’ best estimate (including risks) on the average area price difference between the two areas during the delivery of the contract.
From the above stated, the ex-ante risk premium is expressed by Equation (1) and the ex-post risk premium is expressed by Equation (2):
where:
is the average FTR risk premium;
is the last trading day (
t) closing price of FTR for the corresponding yearly, quarterly or monthly contract in a given direction
for the delivery in time
T;
is the expected FTR price at time
t for the delivery period in time
T,
T;
and
are equal to the start and end of the FTR’s delivery period, respectively;
and
are hourly (h) area spot prices for area A and B during the FTR contract delivery period; and
n is number of hours between the start (
T1) and end (
T2) of the FTR contract delivery period. Note that in markets with nodal pricing the FTR direction is often specified by using the terminology infection (POI) and point of withdrawal (POW).
FTR risk premium at time t for delivery at time
T is equal to the FTR price at time t for delivery at time
T minus the average realized difference between the interconnected area prices during the delivery period between times
T1 and
T2. The risk premium for each delivery period (year, quarter, and month) and area pairs is computed individually. Two ex-post approaches to risk premia can be applied: (1) Risk premium as difference between average futures prices (FTR) and the average spot price difference between the interconnected bidding areas during the delivery period [
34,
54]; and (2) Risk premium calculated on a daily basis instead of averaging over the entire delivery period [
35]. For the purpose of this study we have selected to study the average differences over the delivery period, according to the first approach.
The underlying question behind risk premia is whether they denote a natural behaviour of risk-averse market participants willing to pay (accept) a risk premium (discount) for transferring the risk of unfavourable spot price movements [
35], or whether they are a sign of market inefficiency, such as arbitrage [
55]. From the current data and empirical analysis we cannot disentangle the two directly, but we can study the magnitudes, persistency, and direction of risk premia, which then shed light on the accuracy of the market to price the replicated FTRs. Put differently, by studying risk premia we may assess, whether the theoretical FTRs are unbiased predictors of the future price differences between the interconnected areas.
3.2. Data
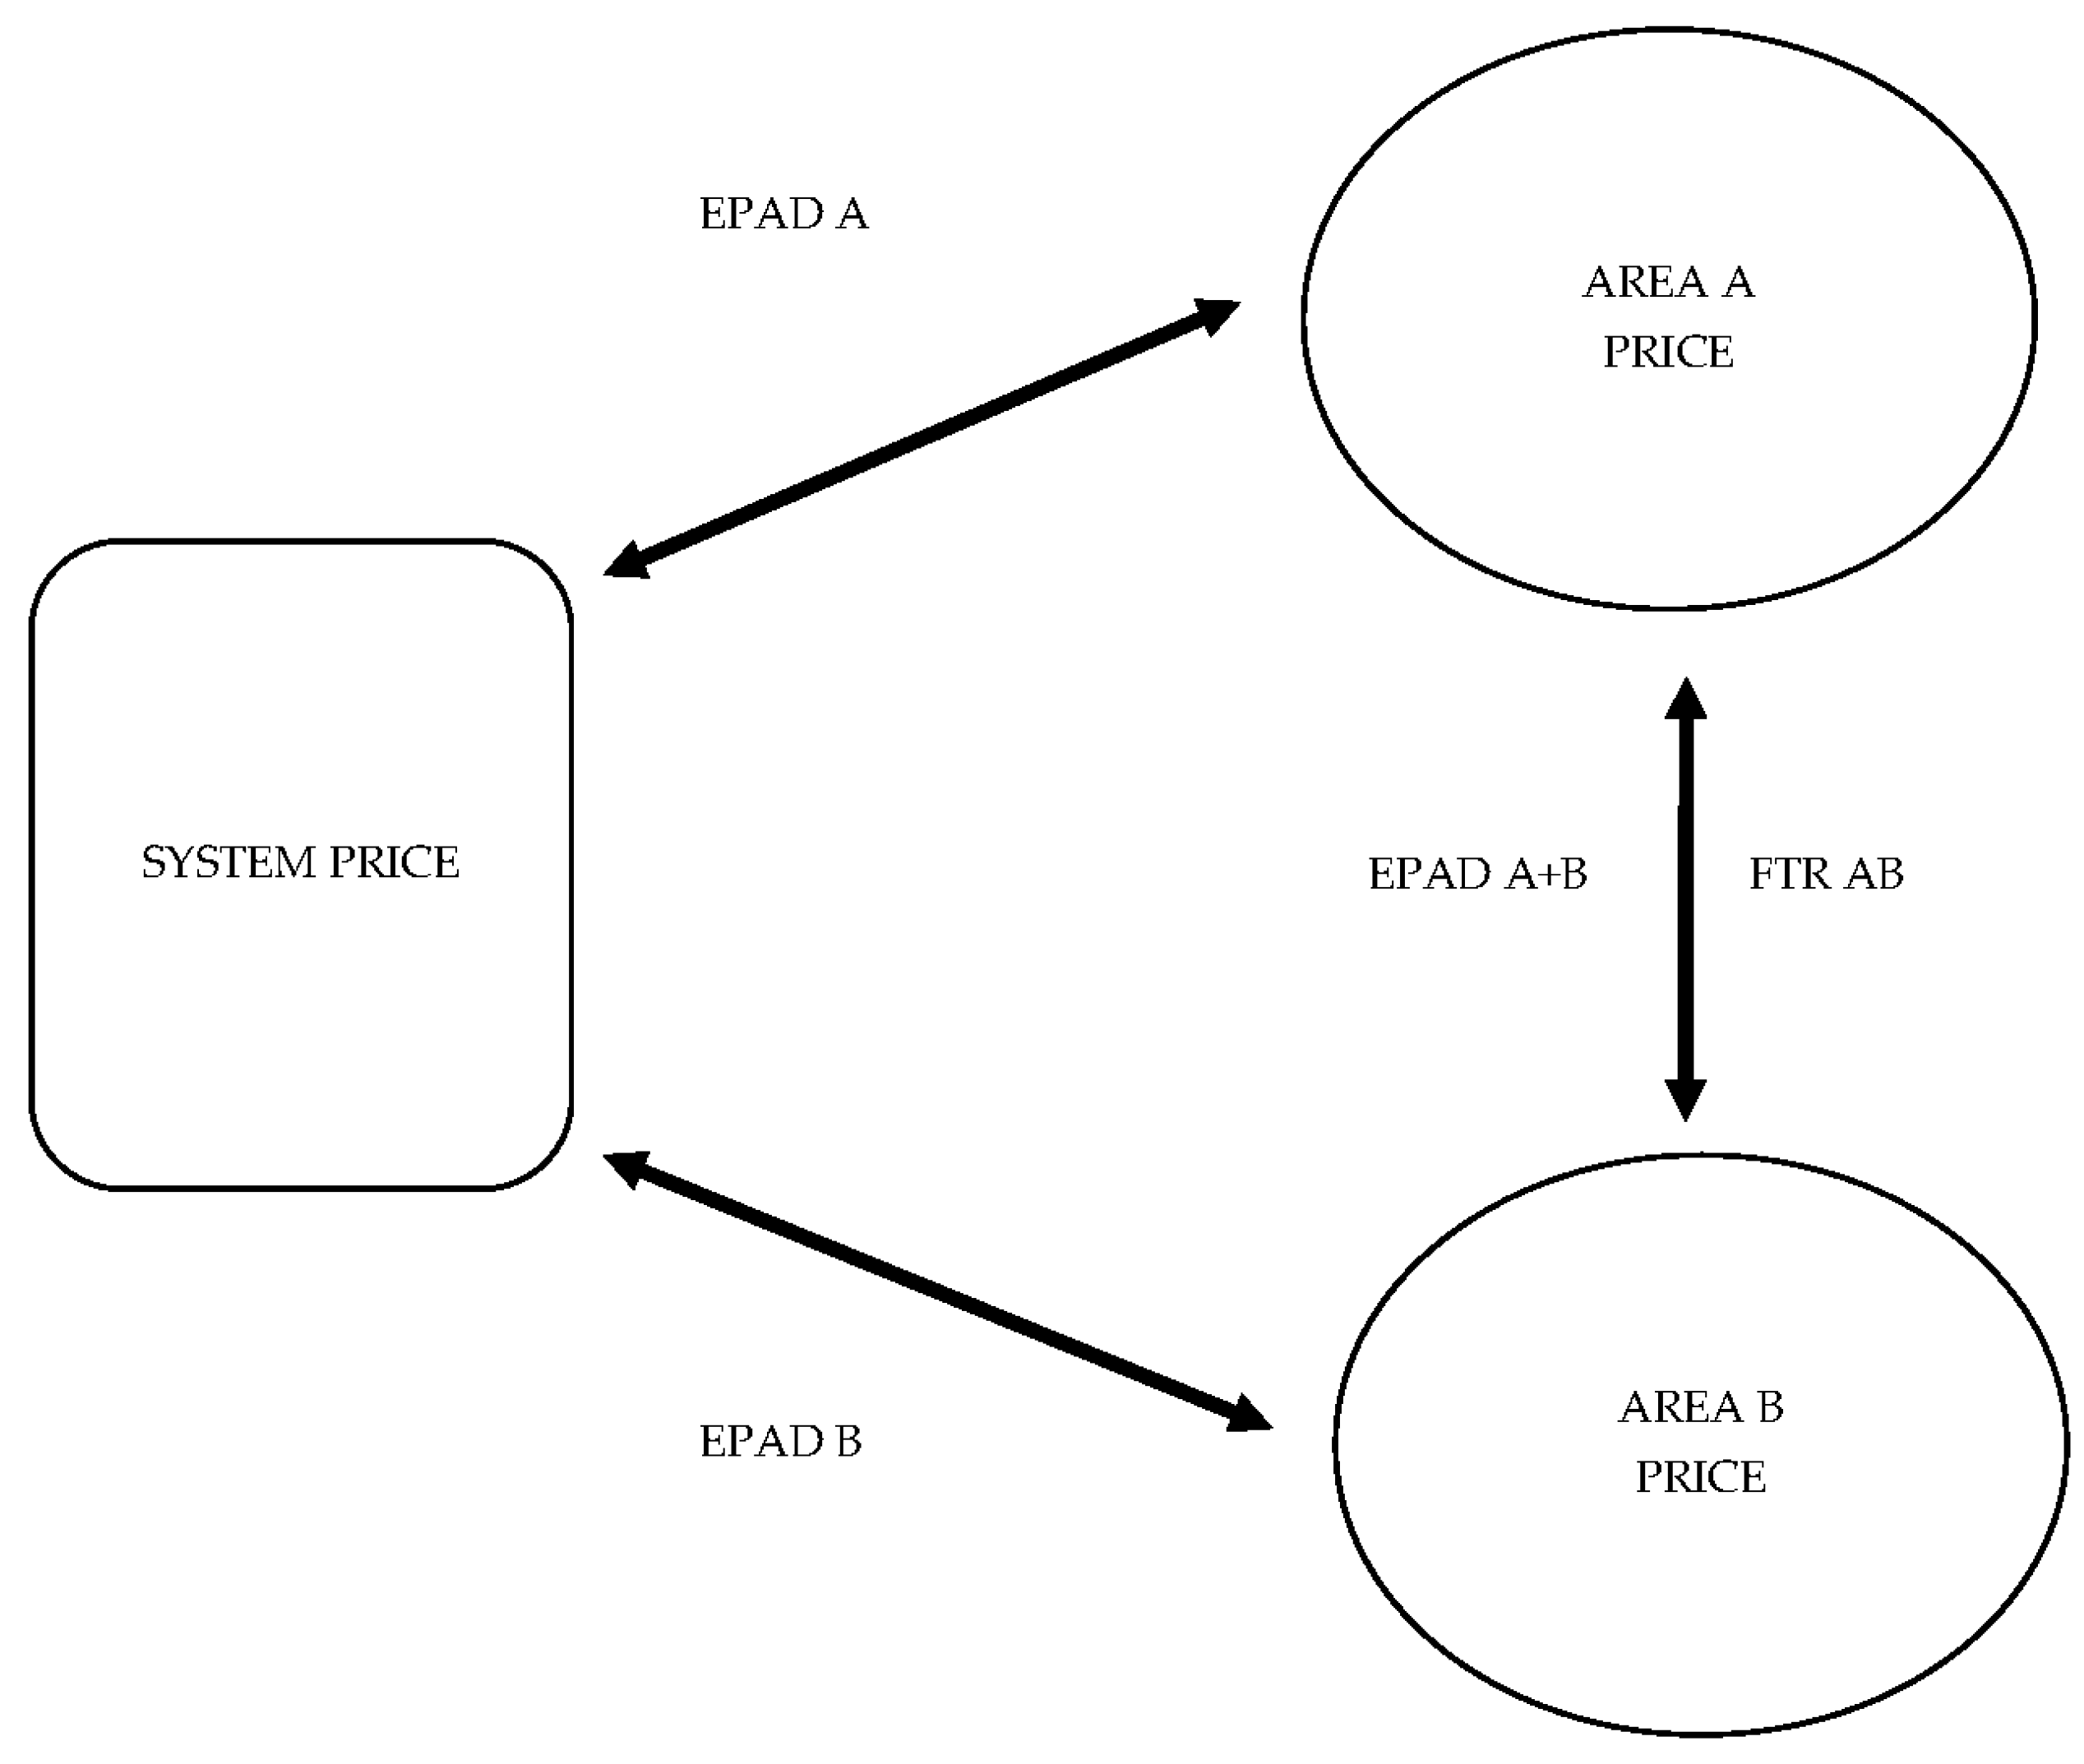
Our sample covers an eight-year period from 2006 to 2013 and includes a number of contracts for a selection of interconnectors and for the three contract durations. The maximum number of yearly, quarterly, and monthly contracts for each interconnector is 8, 32, and 96 respectively. The reason behind having fewer contracts (smaller sample size) for some of the selected interconnectors are changes in the number of bidding zones during the studied time period (e.g., bidding area “Sweden” was split into four separate bidding zones in November 2011) or delayed introduction of EPADs (e.g., Estonia joined the Nordic market in April 2010, but only introduced the first EPADs by the end of 2012). In total, our sample includes 49 yearly, 172 quarterly, and 487 monthly replicated FTRs. The data used to run the analyses consists of two datasets that represent the Nordic futures (EPAD) markets and spot markets. The futures market dataset was obtained from Nasdaq OMX Commodities and includes aggregated daily market outcomes (including, for instance, the bid-ask spreads and the volume traded) from EPAD trading. The main focus of interest here is the daily closing price (daily fix) of each contract and the last trading day closing price (expiration day fix). The spot market dataset was obtained from the Nord Pool Spot and consists of hourly system and area prices, based on the outcome of the day-ahead market auction (Elspot). The hourly spot price difference between area and system price is the underlying “asset” for EPADs during their delivery period. In the case of EPAD Combos used here for the replication of FTRs, the underlying asset is the hourly spot price difference between two interconnected bidding area prices. This is because the system price disappears from the underlying spot price calculation, i.e., (area price A − system price) − (area price B − system price) => area price A − area price B => underlying asset for FTR.
Ten interconnectors were chosen for the empirical analysis based on historical, technical and economic reasoning. Most of the interconnectors are important parts of security of supply in each country, have large transmission capacity, and due to congestion represent important locational price risk for trades across areas. See the summary of selected cases in
Table 2 and statistical summary of price distributions in
Appendix A.
3.3. Results and Discussion
Before presenting the final results, we illustrate the interpretation of outcomes under explicit assumptions in a more general context.
Table 3 presents eight scenarios leading to a specific sign of risk premia (positive + or negative −) depending on the sign of the underlying spot (S) and futures (F) prices (positive + or negative −) as well as their absolute sizes (S > F or S < F). We may split the table into two parts according to the market’s ability to price the futures (FTRs) correctly (naturally), or incorrectly (unnaturally).
Scenarios 1, 2, 7, and 8 represent a category, where the FTRs are, under our definitions, correctly priced with respect to the underlying spot price outcome, i.e., both price sets have equal sign which means that a buyer receives the FTR clearing price and pays the negative spot price outcome, which fixes his/her risk exposure. This is, if the market participants priced a futures contract negatively, the spot price outcome turned out to be also negative during the delivery period (scenarios 7 and 8). Assuming both FTR and spot positions, this may be a typical case for hedgers with production in lower price area and consumption (customers) in higher price area looking for a contract against the negative exposure to locational price risk. By the same token, scenarios 1 and 2 represent correctly priced futures, where positively priced FTRs match with the market participants’ expectations of positive price spread between the underlying bidding areas. This means that a buyer pays the positive FTR clearing price and receives the positive spot position, which again fixes his/her price spread exposure between the interconnected areas. In all the “correctly priced” scenarios, the positive and negative risk premia depend on the risk aversion, hedging needs, and market shares of the market participants, who are willing to pay (accept) a risk premium (discount) pushing prices above (+), or below (−) the risk-neutral expected spread.
Scenarios 3, 4, 5 and 6 represent a category of unnaturally (counter flow) priced FTRs, which do not offer any hedging value for the market participants. In scenarios 3 and 4 buyers expect and pay the positive FTR price (area price A > area price B), but the underlying spot (S) outcome turns out negative during the delivery period (A < B). This makes the buyers of positive FTRs pay the positive clearing price and additionally face the negative locational spot price spreads in the spot market. In scenarios 5 and 6 FTR buyers expect and receive the negative FTR price (area price A < area price B), but the underlying spot (S) outcome turns out positive during the delivery period (A > B). Assuming physical spot positions, this outcome means that sellers of negative FTRs paid the clearing price for the expected negative spot price outcome that they did not collect in the spot. Vice versa, the buyers of the negative FTR received the clearing price and additionally the positive spot difference. Briefly, in scenario 3–4 (5–6) FTR buyers (sellers) would be better off by simply trading spot across borders, than with the additional FTR derivative.
For the sake of brevity, we summarize the results for each interconnector and contract type (yearly, quarterly, and monthly) for the entire eight-year period studied (full and detailed results for each EPAD, FTR, bidding area, and time period are available upon request from the corresponding author).
Table 4 presents the average spot price, futures price, and risk premium for the theoretical FTRs during 2006–2013. The spot price refers to the average hourly spot price difference (EUR/MWh) between the interconnected bidding areas during the delivery of individual FTR contract. The futures price refers to the average last trading day closing price (EUR/MWh) of FTR for the corresponding yearly, quarterly, and monthly contract in a given direction. Risk premium is the average difference between the futures price (
) and the ex-post delivery date spot price difference between the underlying bidding areas (see Equation (2)).
From the aggregated results in
Table 4, it is visible that the interconnector pairs selected for the analysis are directed from low to high area price, as indicated by the negative average spot prices. One exception is the interconnector SE/SE3 > DK1, which exhibited a positive average spot price spread, i.e., DK1 was the lower area price on average. Using the terminology of “correctly” priced FTRs mentioned above we see that the replicated FTR contracts would give a correct (natural) price signal with respect to the direction of the price risk for eight out of ten interconnectors, as indicated by the same sign of the futures and spot prices. The two exceptions were SE/SE3 > DK1 and FI > EE interconnectors, where the market has unnaturally priced all the replicated FTRs (monthly, quarterly, and yearly) and gave the opposite price signal (reverse flow) for the futures and the spot outcomes.
Again, using the terminology from the illustrative scenarios linked to
Table 3, buying the transmission hedge on the SE/SE3 > DK1 interconnector in the given direction from Sweden/Stockholm (SE/SE3) to Århus (DK1) leads to a large negative average risk premium for buyers (scenario 6). This is because buyers (sellers) buy (sell) discounted FTRs (negative risk premium) and benefit from (lose out on) the positive spot price outcome. Likewise, buying an FTR on the FI > EE interconnector across all maturities in the direction from Finland to Estonia would lead to an increased price risk exposure to buyers and a large positive average risk premium (scenario 3). The reasons behind the counter flow pricing on these two interconnectors stem from the fact that there is not a natural flow direction which could be easily predicted ex-ante by the market participants. This is shown in
Appendix A, where the spot price differences are relatively equally distributed between positive and negative differences, i.e., 26% and 23% for SE/SE3 > DK1, and 31% and 21% for FI > EE.
Coming back to the eight correctly (naturally) priced risks on the respective interconnectors, we may observe the signs and magnitudes of risk premia in the replicated FTRs. Out of the eight interconnectors and twenty-four averaged contracts only five contain positive risk premia, of which four are for the yearly contracts (SE/SE3 > FI, NO1 > SE/SE3, SE4 > DK2, SE4 > DK2) and one is for the quarterly contract (SE4 > DK2). As a reminder from the above discussion, the positive risk premium indicates a buyer’s willingness to pay a mark-up for transferring the transmission risk (in this case more distant in time) to the counterparty. The magnitudes of the positive risk premia are strongly below, or close to 1, but because of the small and varying sample sizes in the yearly and quarterly contract maturities, we cannot test their statistical significance.
The finding of positive risk premia in longer-term contracts, see also [
44], seems contrary to the findings of earlier research [
59], which has typically associated positive forward risk premia with consumers’ higher desire to hedge especially short-term horizons (producers’ market power) and negative forward risk premia with producers’ higher desire to hedge especially longer-term horizons (consumers’ market power). However, the risk premia for the yearly and quarterly maturities in
Table 4 exhibit both, negative and positive values, which could be interpreted as neutral risk premium effect.
Nonetheless, it is worth looking closer at the interconnectors with positive risk premia. It can be observed that in three positive risk premia cases the “sink” area is DK2, which has the most of the Danish wind power capacity and the most volatility in area spot prices (see
Appendix A). This may explain the market participants’ willingness to pay a premium even for the longer-term contracts, implying producers’ market power in this case. Positive risk premium in the yearly FTRs for the NO1 > SE/SE3 interconnector with Stockholm (SE/SE3) as the “sink” area may imply a limited supply of such contracts, rather than a greater risk aversion of consumers in the long-term horizon. Magnitude of the yearly SE/SE3 > FI positive risk premium (0.04) is the smallest of all and does not seem to have a clear economic interpretation.
In general, majority of the replicated FTR contracts for the studied time period and interconnectors contain, on average, a negative risk premium. This is particularly true for the monthly FTRs which all contain statistically significant negative risk premium on average. This means that such replicated FTR contracts are, on average, sold at a discount. According to the hedging pressure theory [
36,
37,
60,
61] this would imply a market power of consumers, who are exerting greater hedging pressure on producers, who are more keen to sell futures as compared to the lower eagerness of the consumers to buy. This could possibly point out to a lacking demand for cross-border transmission hedging contracts, making the buyers less keen on managing the price difference exposure with FTRs even closer to delivery. However, the negative risk premium pattern has been clear and statistically significant mainly for the monthly FTRs, which are less traded than the quarterly and the yearly contracts. Hence, the ultimate answer on the effect of lacking demand for FTRs on their trading prices has to be left for further research.


