Article

Effect of Nanoparticles on Spontaneous Imbibition of Water into Ultraconfined Reservoir Capillary by Molecular Dynamics Simulation

NTNU Nanomechanical Lab, Department of Structural Engineering, Faculty of Engineering, Norwegian University of Science and Technology (NTNU), 7491 Trondheim, Norway
*
Author to whom correspondence should be addressed.
Energies 2017, 10(4), 506; https://doi.org/10.3390/en10040506
Submission received: 19 January 2017 / Revised: 17 March 2017 / Accepted: 6 April 2017 / Published: 8 April 2017
(This article belongs to the Special Issue Nanotechnology for Oil and Gas Applications)

Abstract

:
Imbibition is one of the key phenomena underlying processes such as oil recovery and others. In this paper, the influence of nanoparticles on spontaneous water imbibition into ultraconfined channels is investigated by molecular dynamics simulation. By combining the dynamic process of imbibition, the water contact angle in the capillary and the relationship of displacement (l) and time (t), a competitive mechanism of nanoparticle effects on spontaneous imbibition is proposed. The results indicate that the addition of nanoparticles decreases the displacement of fluids into the capillary dramatically, and the relationship between displacement and time can be described by l(t) ~ t1/2. Based on the analysis of the dynamic contact angle and motion behavior of nanoparticles, for water containing hydrophobic nanoparticles, the displacement decreases with the decrease of hydrophobicity, and the properties of fluids, such as viscosity and surface tension, play a major role. While for hydrophilic nanoparticles, the displacement of fluids increases slightly with the increase of hydrophilicity in the water-wet capillary and simulation time, which can be ascribed to disjoining pressure induced by “sticking nanoparticles”. This study provides new insights into the complex interactions between nanoparticles and other components in nanofluids in the spontaneous imbibition, which is crucially important to enhanced oil recovery.

1. Introduction

Imbibition in porous media is ubiquitous and has numerous applications in many natural and industrial processes, such as groundwater remediation, oil recovery, and nanofluidic devices [1,2,3,4,5,6,7]. For the imbibition phenomena, capillary action is the main transport mechanism for the spontaneous process, which results in the diffusing motion of fluid into porous solids or the capillary [8,9,10,11]. It is proven that the liquid’s behavior can be described by the Lucas–Washburn equation [12,13,14].
l = γ R cos θ 2 η t
where l and t are displacement distance and time, respectively. According to the Lucas–Washburn equation, imbibition dynamics is closely related to important factors of surface tension ( γ ), liquid viscosity ( η ), the contact angle of water on the capillary wall ( θ ) and the radius of the capillary (R) [15,16,17,18,19,20].
In applications, especially oil recovery, surfactants or polymers are often added for adjusting the contact angle θ , the fluid surface tension γ and the viscosity η to tune the fluid behavior [21,22,23,24]. Recently, studies suggest that suspended nanoparticles in fluids could modify the rheology [25], mobility, wettability [26], and other properties [27], which demonstrate huge economic potential in the oil field [28]. Lin et al. [29] reported that nanoparticles can transport and assemble at liquid interfaces, resulting in the change of interfacial tension driven by the reduction of the interfacial energy of fluids. Meanwhile, experimental results by Wasan and Nikolov [26] showed that the nanoparticles could form two-dimensional (2-D) layered structures in the confines of the three-phase (solid–oil–aqueous phase) contact region and produce disjoining pressure that leads to the wettability alteration of the solid phase. Therefore, it has been believed that nanoparticles can change the interfacial tension, viscosity and wettability of fluids, which are important to many applications ranging from electronics cooling to oil recovery [30,31,32,33,34]. However, due to the additional particle–particle, particle–capillary and particle–fluid interactions [32,35], the presence of nanoparticles leads to a much more complicated imbibition process compared with pure fluids.
In experimental studies, it is difficult to disentangle the specific role of different interfaces in the imbibition process. All the interfaces would be affected simultaneously upon applying a surfactant or nanoparticle. To cope with this, atomistic modeling and simulation are powerful and promising approaches [36,37,38,39,40,41,42,43], via which any interface in the system can be varied independently, and thus the mechanism of the imbibition process in the capillary can be unraveled in detail. For example, Blake and Coninck [44] employed large-scale molecular dynamics (MD) simulations to study the influence of pore wettability on imbibition dynamics. Their simulation results indicated that a reduction in the rate of penetration can be ascribed to the contact angle change of fluids on the pore wettability. However, most simulations about the imbibition process studied the base fluids influenced by roughness, wettability, and the shape of the capillary. To the best of our knowledge, there is no systematic simulation study on the involved interfacial properties and wettability influenced by nanoparticles for fluids into the capillary.
The purpose of this study is to explore the migration mechanism of nanofluids into porous media, and at the same time to identify the dominating driving force for the hydrophobic and hydrophilic nanoparticles in the imbibition process. In the present work, MD simulations are conducted to reveal the influence of the surface wettability of nanoparticles on imbibition into the water-wet capillary. The diffusion dynamics of nanofluids into the capillary is investigated at the molecular level, with results used for constructing the relationship between water displacement length (l) and imbibition time (t). Moreover, the dynamic contact angle and motion behavior of nanoparticles are analyzed for understanding the change of nanofluid displacement, and for revealing the involved microscale mechanism of imbibition dynamics.

2. Model and Simulation Details

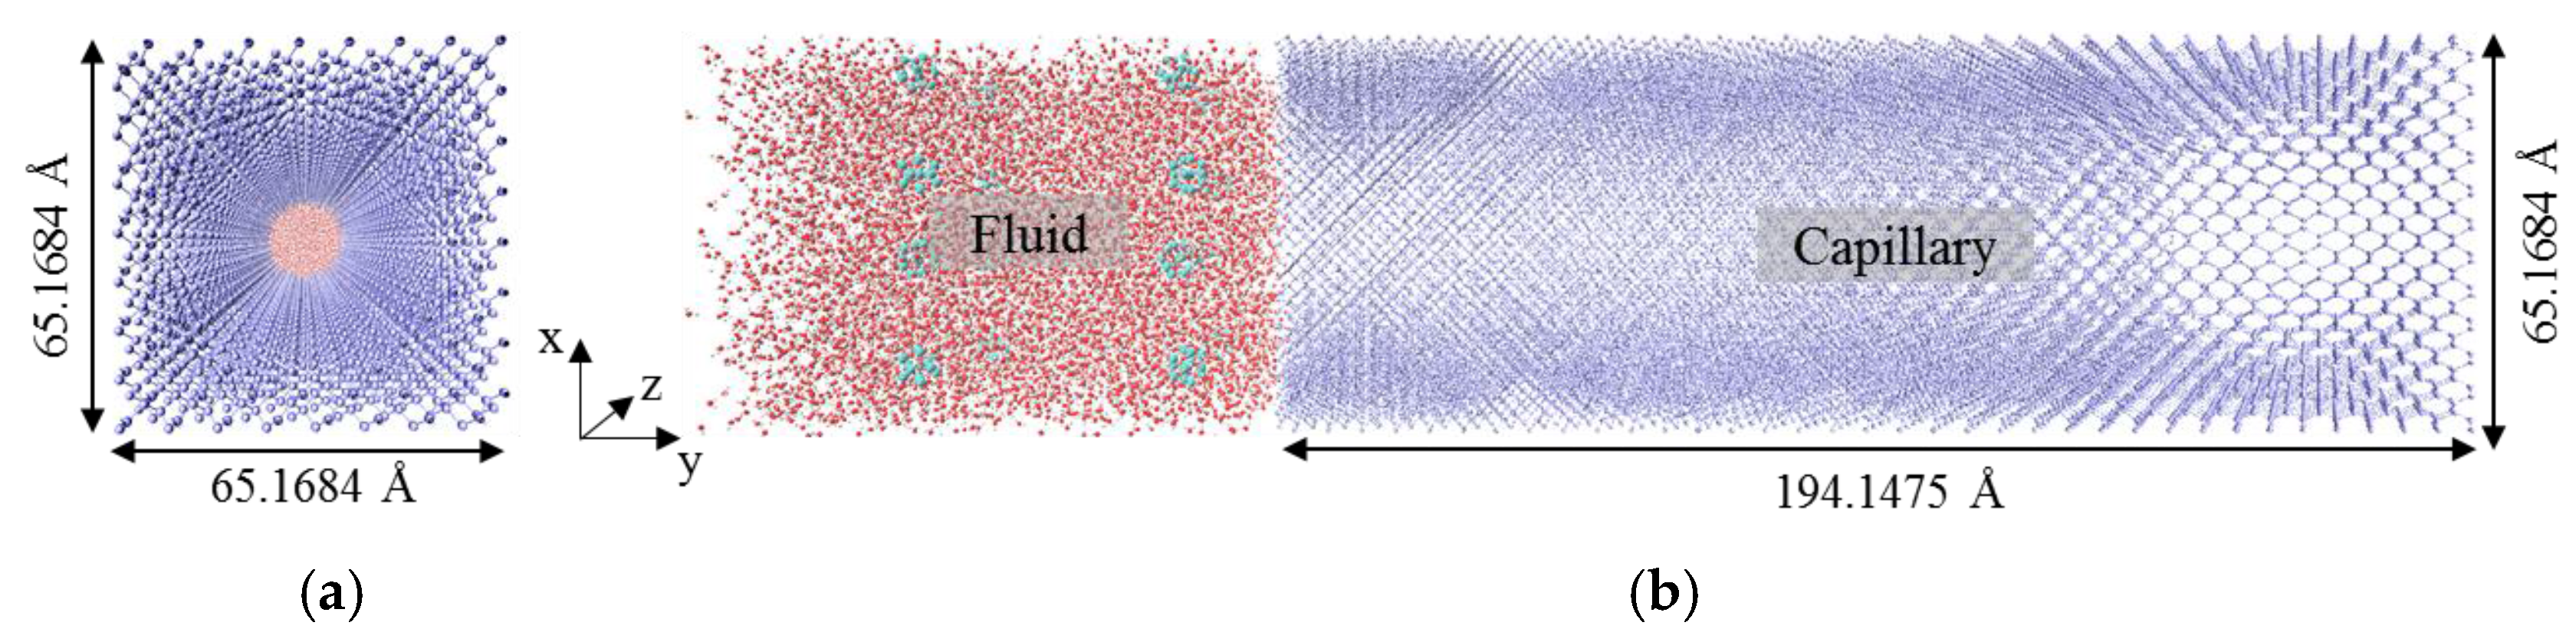
2.1. Modeling of Imbibition System

A series of all-atom MD simulations were conducted using the simulation package LAMMPS [45]. Following a similar approach, a simulation system containing a water-based fluid and well-distributed spherical nanoparticles and a capillary was built, as shown in Figure 1. The solid capillary used in the system was constructed based on the face-centered cubic (FCC) crystal lattice structure of silicon with the lattice constant of 5.43 Å. The cross-section of the capillary had dimensions of x = z = 65.1684 Å, and the axial direction of y = 194.1475 Å. In order to obtain the capillary pore, atoms within a radius R = 25 Å along the axial direction were removed.
The nanofluid in the simulation system consists of 10,000 water molecules and 16 nanoparticles. The nanoparticle volume fraction was ~5%, which results in nanofluid composition similar to previous studies [46,47,48]. Each nanoparticle contained 13 atoms in a gold lattice structure, forming a sphere with a diameter of 7.0 Å. The nanofluid was initially placed on the left entrance of the solid capillary (Figure 1). A vacuum buffer space was added at the left side of the nanofluid in order to enable spontaneous imbibition. All the simulations were conducted in a periodic orthorhombic box.

2.2. Potential Functions and Parameters

The standard pairwise 12-6 Lennard–Jones (L-J) potential was used as Equation (2) to describe the van der Waals interaction between liquid and nanoparticles, liquid and the capillary, and nanoparticles and the capillary. The coulomb interaction was used, Equation (3), to account for the electrostatic effect in the system.
U L J = 4 ε i j [ ( σ i j r i j ) 12 ( σ i j r i j ) 6 ]
U c o u l o m b = q i q j 4 π ε 0 r i j
In Equation (2), ε i j was the characteristic energy and σ i j was the finite distance between atom i and j at which the interatomic potential reached zero. In Equation (3), q i and q j were the charges on the two atoms, and ε 0 was the vacuum permittivity. For both equations, r i j was the distance between atom i and j. For interactions between different species, L-J parameters obeyed the arithmetic mixing rule represented in Equation (4).
ε i j = ε i ε j ;   σ i j = ( σ i + σ j ) 2
The SPC/E water model was used in the system. The characteristic energy values of oxygen ε O and hydrogen ε H in this water model were 0.1554 and 0 kcal/mol [49]. The hydrogen and oxygen atoms are charged with +0.4238e and −0.8476e, respectively. For establishing different interfacial energy, and thus hydrophobicity, on the solid capillary and the nanoparticles, atoms in the two were tuned through varying characteristic energy well depths ε i j , as discussed in the following paragraph.
For reference, a series of nanoparticle-free imbibition systems were constructed to obtain a suitable parameter of the solid capillary. The characteristic energy ε s o (energy between the oxygen atom in water and the atom in the solid capillary) was varied from 0.2 to 0.4 kcal/mol, which controls the wetting properties of the capillary. Other simulation parameters were kept the same as those of nanofluids. Detailed information is given in Supporting Information S1. It should be noted that when ε s o increased to 0.3 kcal/mol, the fluid started to penetrate into the capillary. The calculated contact angle was ~90°, indicating that the capillary with 0.3 kcal/mol was at the mix-wet critical point. When ε s o was set to 0.35 kcal/mol, water molecules would transport into the capillary spontaneously. Also, comparison between the simulation results and Lucas–Washburn equation results is shown in Supporting Information S2 to validate the reasonability of systems. The characteristic energy ε s o was chosen as 0.35 kcal/mol for modeling the water-wet capillary. The characteristic energies of nanoparticle–oxygen ε n o were set from 0.1 to 0.5 kcal/mol for different models to study the effect of the wetting properties of nanoparticles on the imbibition phenomena. Both nanoparticles and atoms in the capillary were charge free.
The bonding interaction between neighboring atoms was modeled by the harmonic potential:
U b o n d ( r ) = 1 2 K b o n d ( r 1 ) 2
The values of the force constants in Equation (5) were set to 1 2 K b o n d = 554.13149 kcal/mol/Å2 for water.
All the MD simulations were performed in NVT ensemble (constant number of particles, volume, and temperature). The cutoff values for L-J interactions and Coulomb interactions were both set to 10 Å. The long range electrostatic interactions were compensated for by using the particle–particle–particle–mesh algorithm [50], with a convergence parameter of 10−4. The Velocity Verlet algorithm with a time step of 1 fs was used to integrate Newton’s motion equations. The temperature of the nanofluid was kept constant at 298.15 K by employing a Nosé–Hoover thermostat with a temperature damping coefficient of 0.1 ps. During the simulation, the solid capillary was fixed. The interaction between atom pairs in the capillary was ignored, which can significantly reduce the simulation time. Similarly, the internal interaction of nanoparticles was ignored, and each nanoparticle moved and rotated as a single entity. After an energy minimization process, spontaneous imbibition of ~8.0 ns was carried out in each system.

3. Results and Discussions

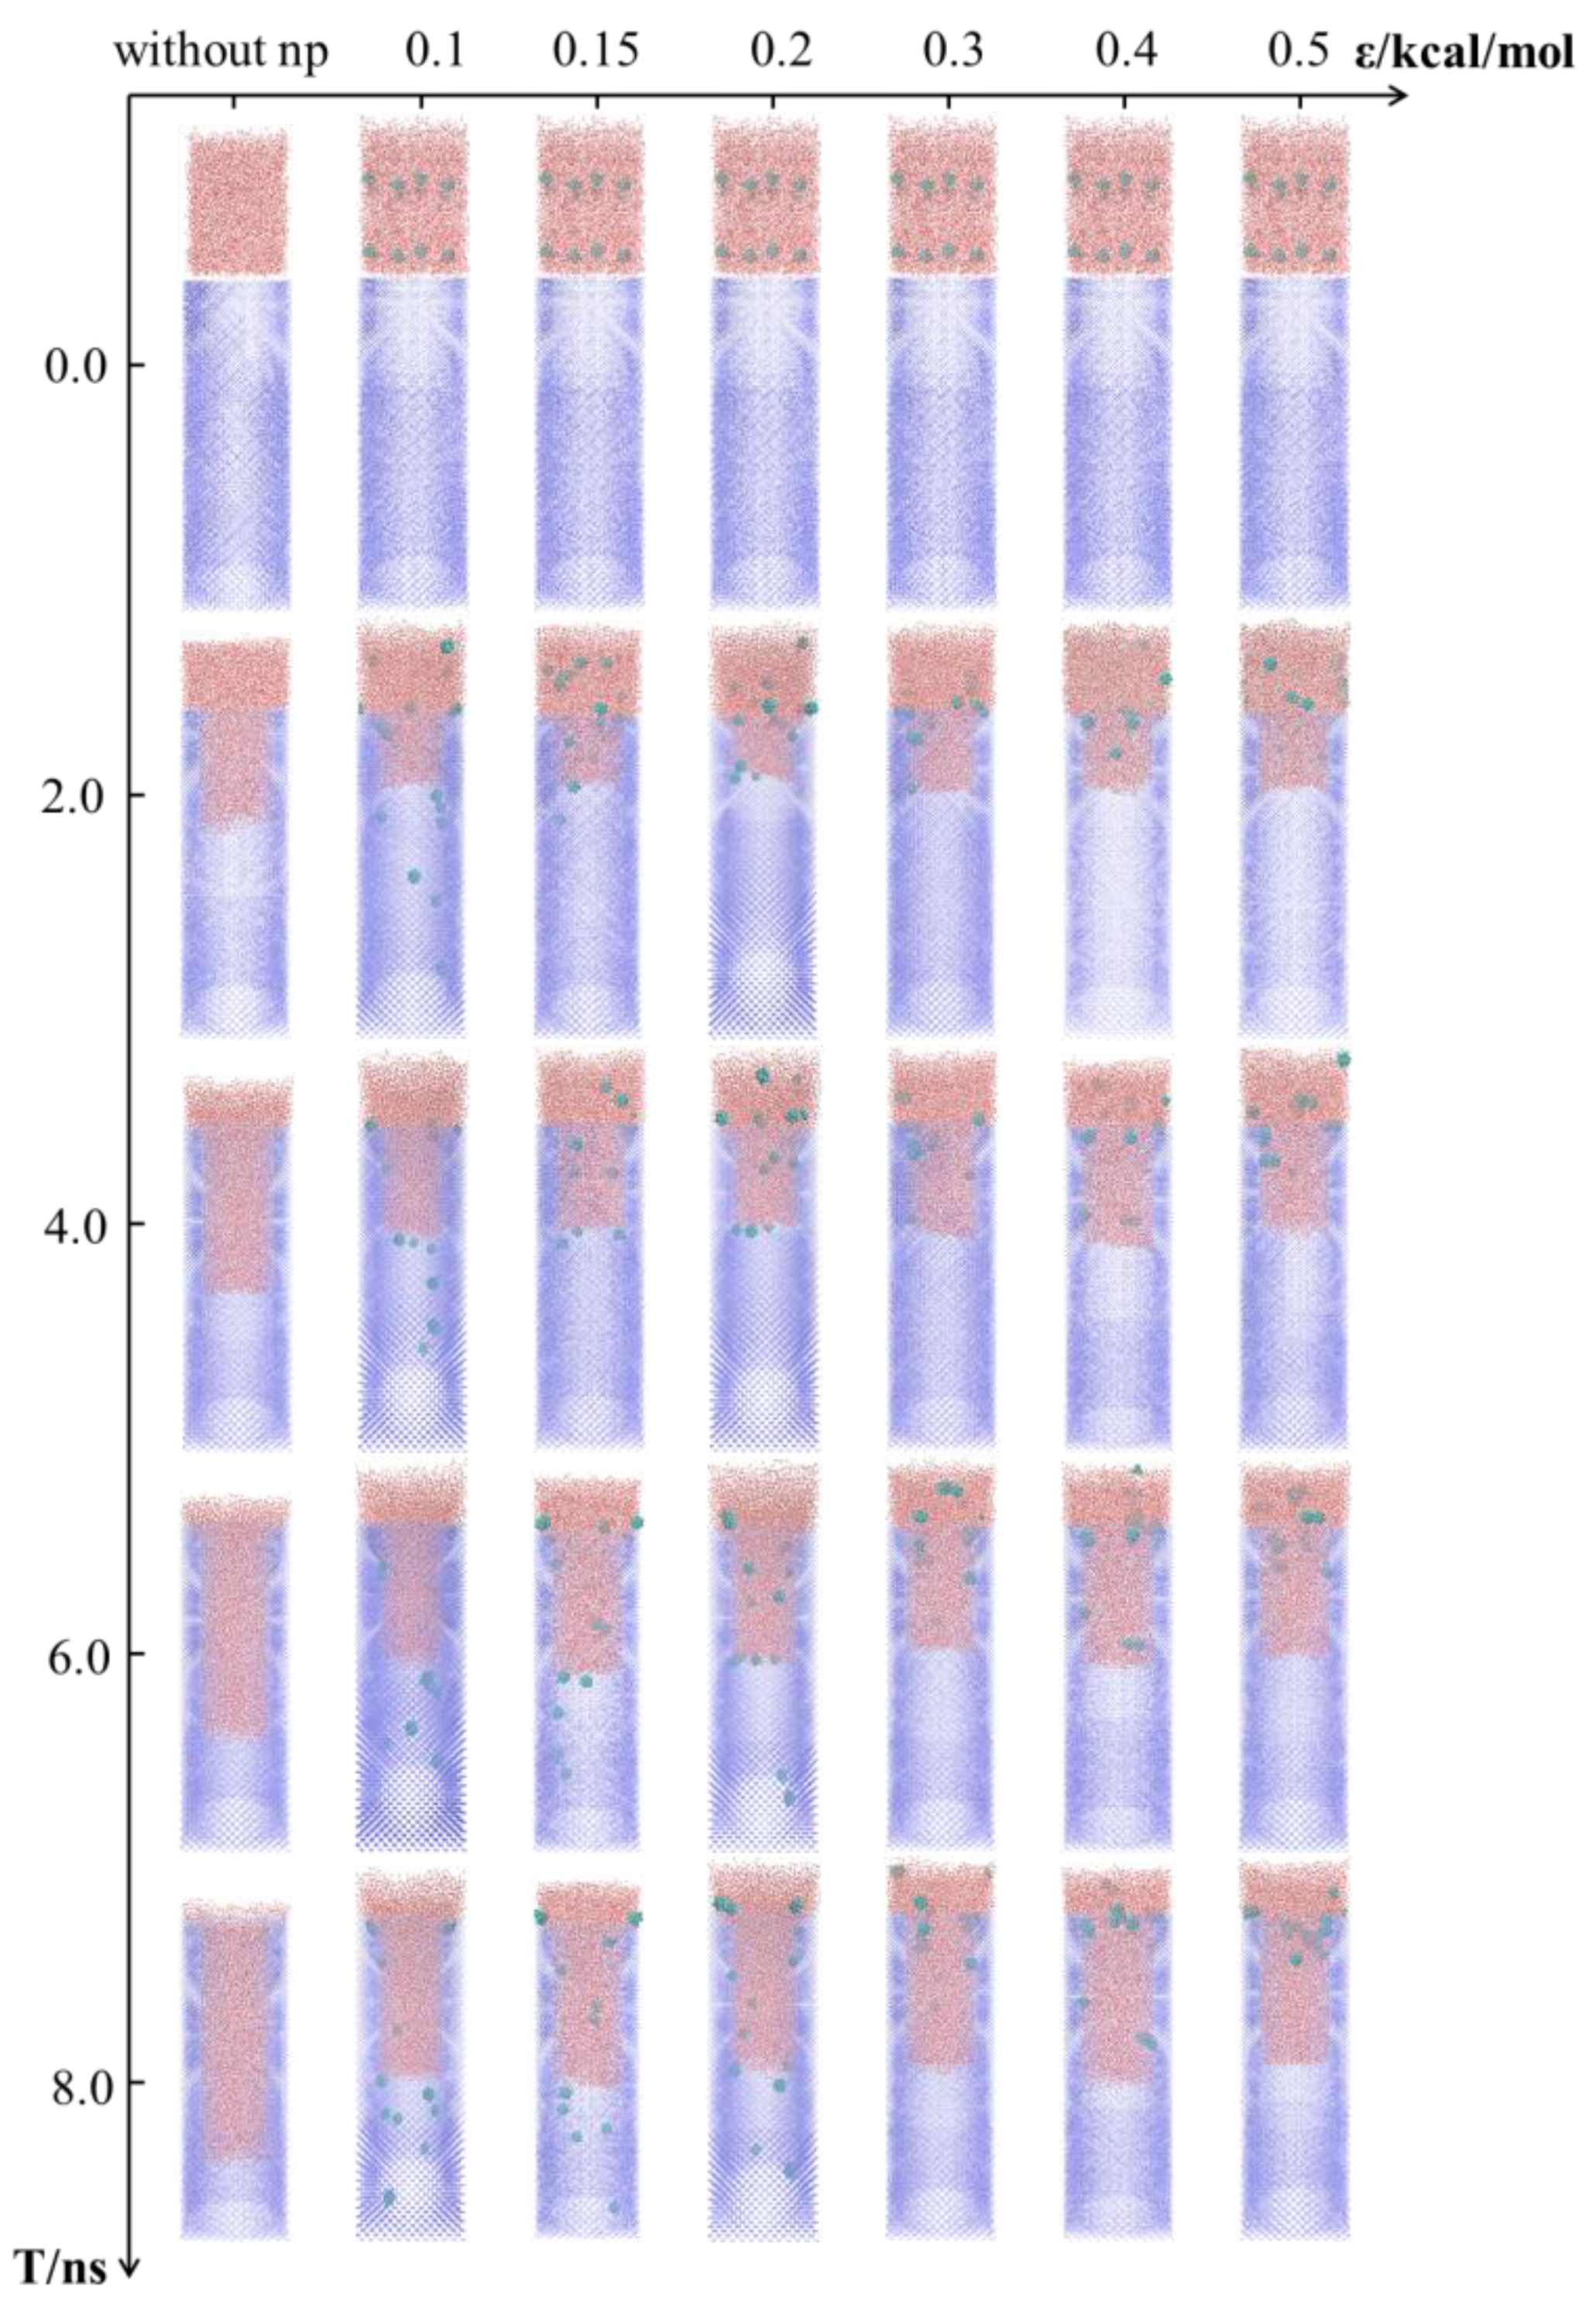
3.1. Imbibition Phenomena of Nanofluids in Reservior

The snapshots of the imbibition process of nanofluids into the reservoir as time evolutions are summarized in Figure 2, which reveals the influence of the wetting properties of nanoparticles on the imbibition behavior. It can be seen that for the system without nanoparticles, water molecules can spontaneously diffuse into the vacancy of the capillary. At the end of the imbibition simulation of 8 ns, almost all water molecules enter the capillary. Once nanoparticles are added into fluids, the transportation of fluids into the capillary is hindered. The displacement of nanofluids into the capillary decreases with the characteristic energy ε n o increasing from 0.1 to 0.2 kcal/mol (hydrophobic). Meanwhile, it is interesting to note that with further improvement of the characteristic energy ε n o to 0.3 kcal/mol (mix-wet), the displacement of nanofluids increases. When the nanoparticles are mainly hydrophilic, the displacement of nanofluids slightly increases compared to nanofluids with hydrophobic nanoparticles. The results indicate that the addition of nanoparticles will reduce the transportation of fluids into the capillary, and when the wettability of nanoparticles changes from hydrophobic to hydrophilic, there is an inflexion point in the imbibition displacement of nanofluids.
Using detailed information from Figure 2, the relationship between the displacement of nanofluids and simulation time is analyzed. Initially, the density distribution profiles of nanofluids along the axial direction of the y axis are calculated at simulation time 2.0 ns, as shown in Figure 3a. Herein, the left entrance of the solid capillary is set as the zero point.
From Figure 3a, it can be seen that the density profiles for all nanofluids can be divided into three parts in the simulation box: the first Part I is fluids with negative distance from the entrance of the capillary; the second Part II is fluids attached to the entrance of the capillary; and the last Part III is fluids inside the capillary. For Part I, the density is almost 1.0 g/cm3, which indicates that the fluids out of the capillary show the bulk property. The density for Part II has a much higher value of ~1.3 g/cm3, indicating the closest layer of structured water molecules in the radius distribution function from the wall of the capillary entrance. The detailed distribution of water molecules in Part I and Part II is shown Figure 3b. Such distribution is due to the strong adsorption energy between capillary and fluids. While for fluids inside the capillary (Part III), the density is about 0.93 g/cm3 for almost all the nanofluids, which is slightly lower compared with bulk fluids. Based on the density profile, the nanofluid migrating distance from the capillary entrance can be obtained at the location where the fluid density reached 50% of its bulk value inside the capillary. Such location is also considered as the liquid–vapor interface inside the capillary [51]. Detailed information was given in Supporting Information S3. From the density profiles, it can be seen that the addition of nanoparticles has significantly shortened the imbibition length.
In order to explore the imbibition phenomena in depth, displacement l of nanofluids inside the capillary as a function of time t is analyzed from the density profiles. Figure 4a and Figure 4b show the relations between displacement l and time t for fluids with hydrophobic and hydrophilic nanoparticles, respectively. In Figure 4a, displacement l for water increases with time and obeys the relationship of t scaling in time, similar to previous simulation studies and the theoretical relationship [10,52]. When nanoparticles are added into the fluid, all the displacement curves are also qualitatively parabolic and obey t scaling in time. The displacement values for all nanofluids are much lower than water, which indicates that the addition of nanoparticles reduces the velocity of the imbibition process of water. For fluids with hydrophobic nanoparticles ( ε 0.2   kcal / mol ) in Figure 4a, the displacement of nanofluids can be divided into two stages, Stage I (simulation time from 0 to 4.0 ns) and Stage II (simulation time 4.0–8.0 ns). During Stage I, the displacement for the nanofluid with characteristic energy 0.1 kcal/mol has the highest value compared with the other two nanofluid types. For example, when the simulation time is 2.0 ns, with increasing characteristic energy from 0.1 kcal/mol to 0.15 kcal/mol and 0.2 kcal/mol, the displacements for nanofluids are about 51 Å, 47 Å and 40 Å, respectively. These results imply that fluids with more hydrophobic nanoparticles would move relatively quicker in Stage I. However, displacements for nanofluids with 0.1 and 0.15 kcal/mol nanoparticles are nearly identical in Stage II. Similarly, as shown in Figure 4b, when the characteristic energy for hydrophilic nanoparticles increased from 0.3 to 0.5 kcal/mol, the displacement curves can also be divided into two stages but with different time intervals: Stage I (from 0.0 to 3.0 ns), and Stage II (from 3.0 to 8.0 ns). In Stage I, the displacement for 0.3 kcal/mol is larger than that of the other two types, which indicates that at the beginning of the simulation, the velocity of fluids with higher hydrophilicity is smaller. However, the fluid with characteristic energy 0.4 kcal/mol moves quickly and exceeds the displacement of the 0.3 kcal/mol case as time evolves in Stage II. A similar phenomenon is also observed for 0.5 kcal/mol in Stage II. These results suggest that during the imbibition process, the displacement velocity for fluids with higher hydrophilicity is relatively higher with longer simulation time.
Based on the above configuration analysis, the density distribution profiles of nanofluids, and the displacement vs time curves, it can be concluded that the addition of nanoparticles has a significant influence on the imbibition process of fluids. For hydrophobic nanoparticles, the displacement results indicate that the lower the hydrophobicity, the slower the imbibition of nanofluids into the capillary in Stage I, and then the displacement is almost the same for much more hydrophobic nanoparticles in Stage II. In the case of ε n o 0.3 kcal/mol, the displacement of nanoparticles with mixed wettability is relatively higher compared with other hydrophilic nanoparticles in the initial stage. In the ε n o range of 0.3 to 0.5 kcal/mol, nanoparticles with higher hydrophilicity have bigger displacement with longer simulation time.

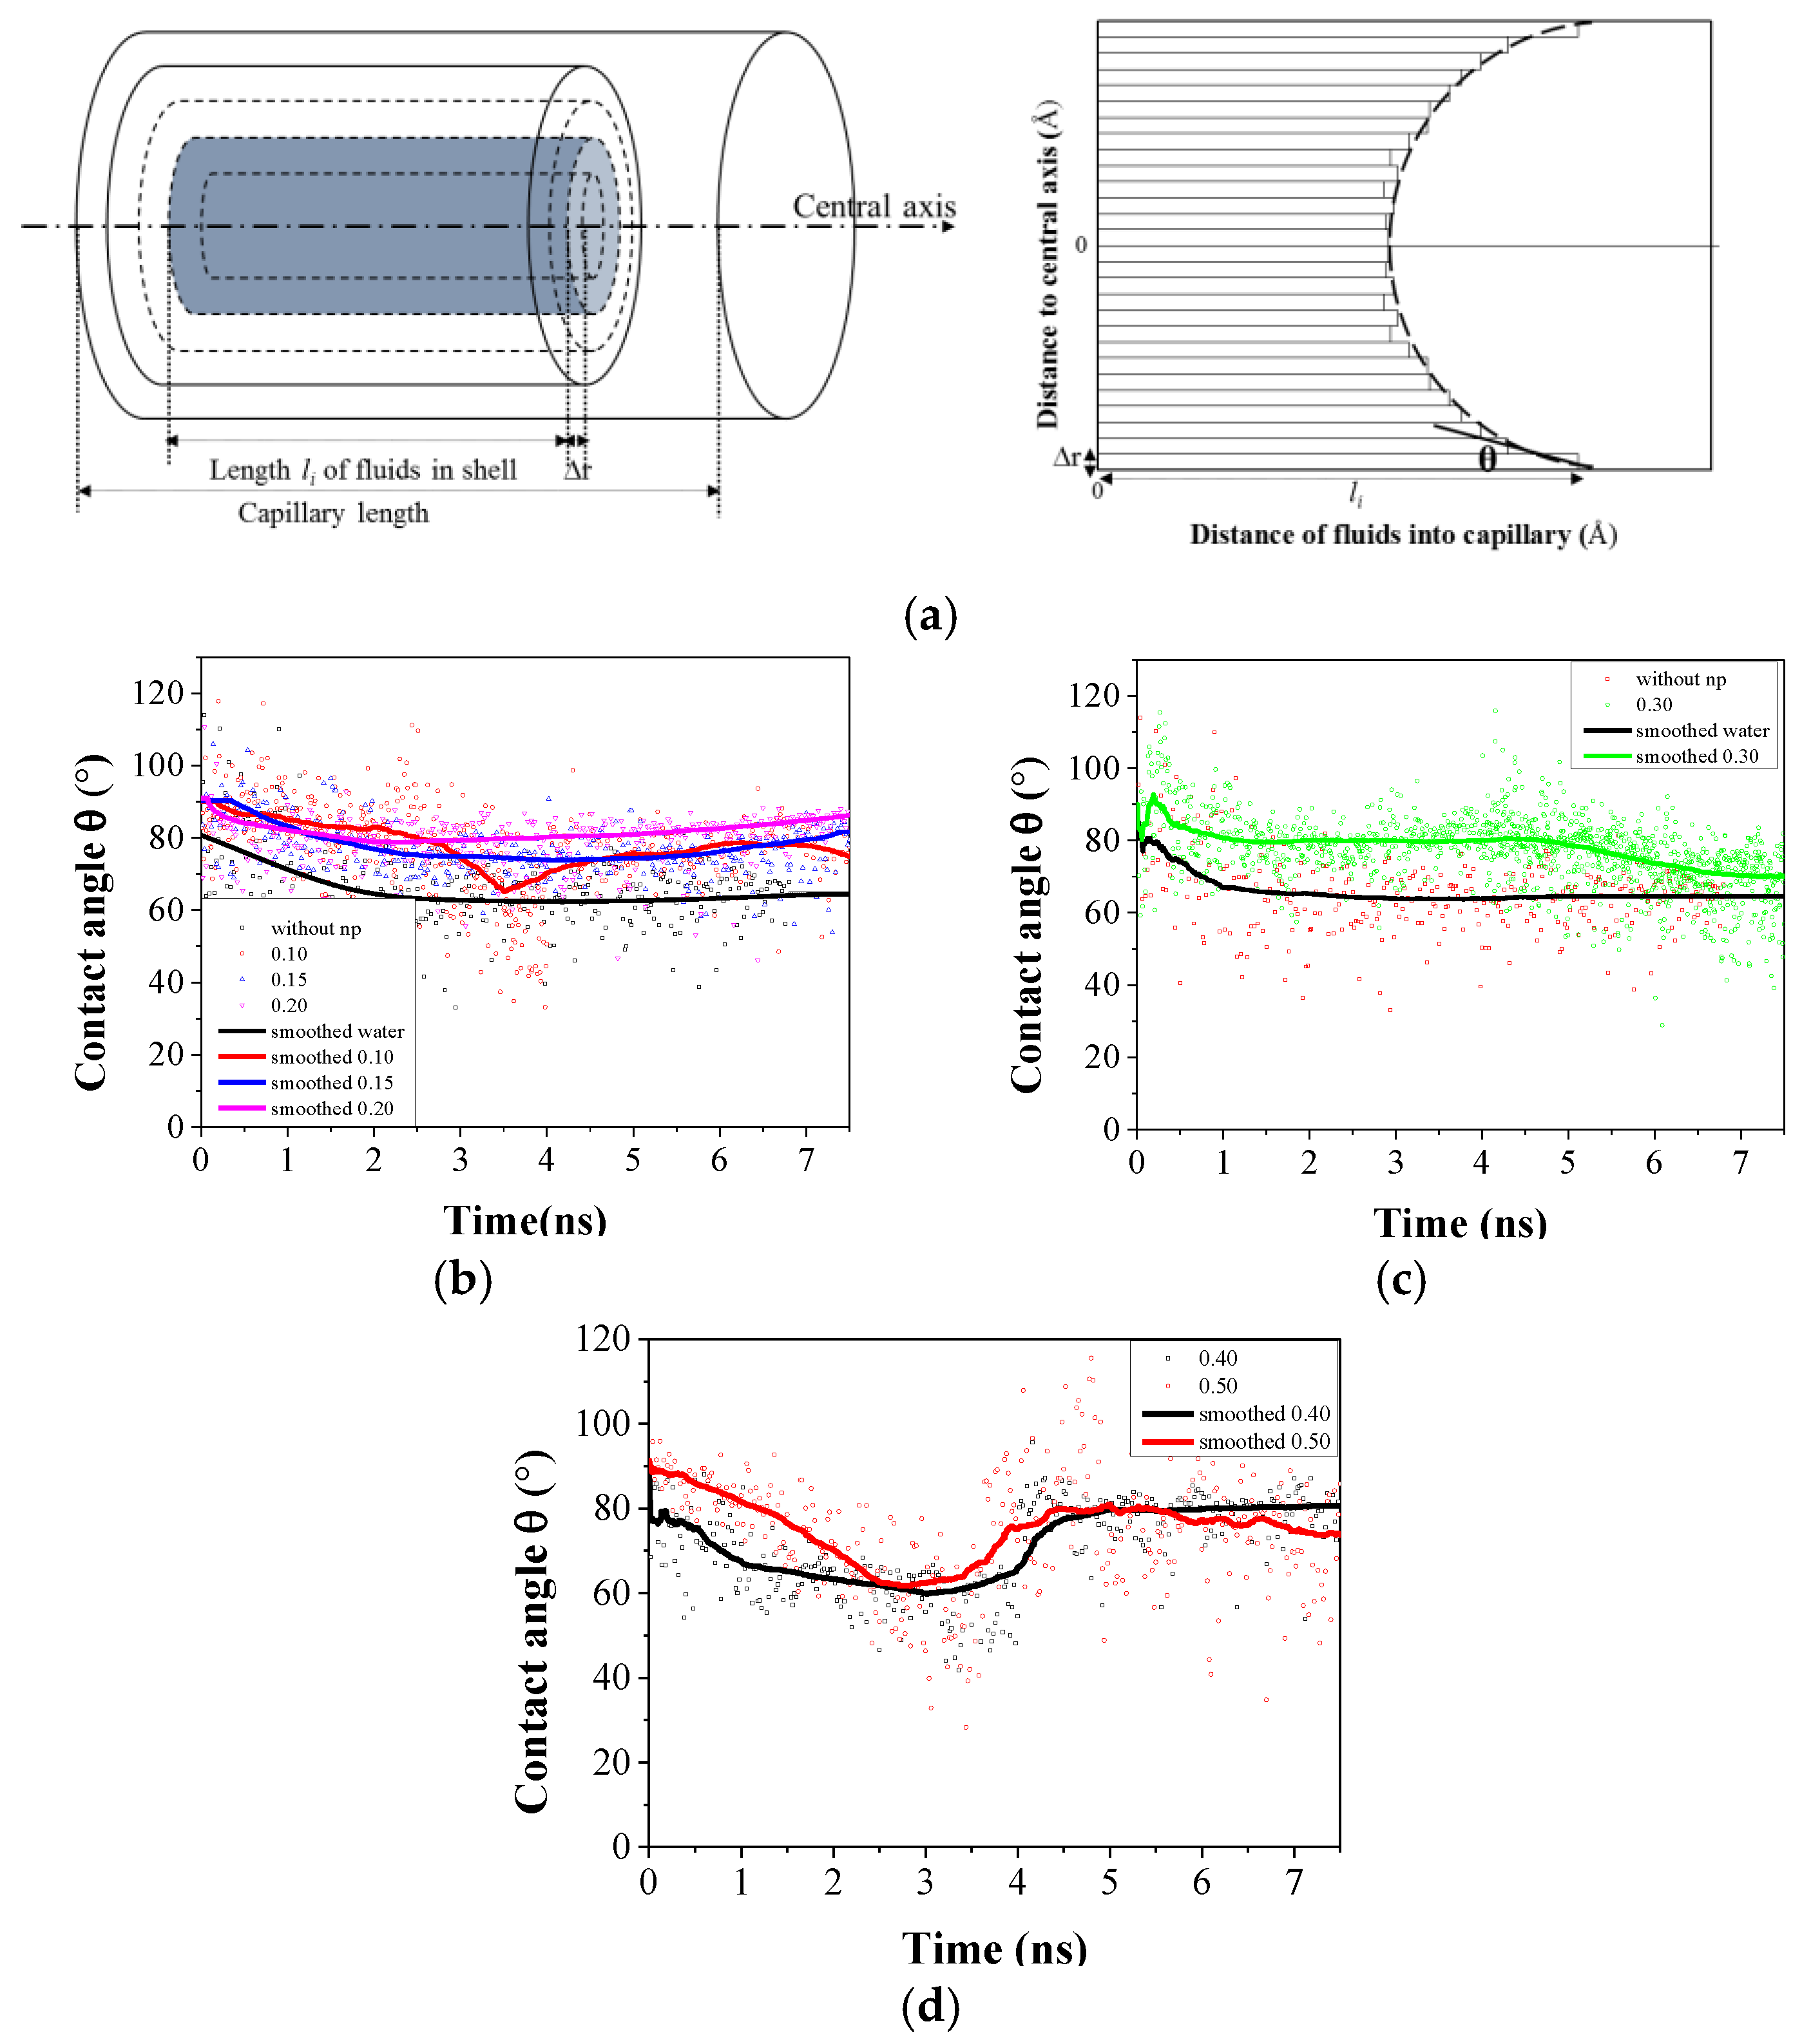
3.2. Wettability of Capillary Alterting by Nanofluids

The wettability of fluids in the capillary is one of the dominating factors in the imbibition process of fluids. Herein, the “wettability” shows an interaction between the ideal solid and fluids (either water or nanofluid). It is generally measured by the contact angle of fluids in the capillary [51]. According to the Lucas–Washburn equation in Equation (1) and previous studies [53], the contact angle is inversely proportional to the displacement of fluids, meaning that the higher contact angle of fluids may lead to less fluids entering into the capillary. Therefore, the dynamic contact angle of nanofluids against the simulation time is quantitatively analyzed in this section to explain the change of the displacement curve of nanofluids in the capillary.
To determine the contact angle, liquid divided into cylindrical shells is first subdivided by arbitrary thickness (Figure 5a). The number of shells should be constrained to ensure that each shell contains enough molecules to give a uniform density. The density of fluids in each shell as a function of the distance l into the pore is analyzed. The advancing end of each shell is located where the density is below a cutoff value of half the liquid density. The contact angle is then obtained from the tangent to a circular fit to the profile (Figure 5a). This method has been widely used in previous studies [42,54], and is proven to correctly show the wetting properties. Different shell thicknesses and density cutoff values are also used in this method to check the consistency of this method, which yields converged results.
The detailed schematic of obtaining the contact angle and dynamic contact angles as a function of simulation time for different nanofluids in the cylindrical capillary is shown in Figure 5. The simulation time point when fluids start to imbibe into the capillary is chosen as the initial time. As depicted in Figure 5b, the contact angle θ of nanoparticle-free fluid decreases rapidly at the initial stage of the spontaneous imbibition process and then decreases slowly to a dynamic balanced value at ~3.0 ns. The equilibrium contact angle for water is about 64.60°, showing the water-wet property. When nanoparticles are added into the capillary, all the equilibrium contact angles are found to be bigger than those of nanoparticle-free fluids, which indicates that the addition of nanoparticles alters the wettability of fluids in the solid capillary, and thus affects the imbibition of nanofluids.
For hydrophobic nanoparticles in Figure 5b, the contact angle θ decreases rapidly at the initial stage, and the curve can be divided into two parts. Within the simulation time of 4.0 ns, it can be seen that the contact angle for nanofluids with ε n o = 0.1 kcal/mol decreases markedly during this stage and has a relatively smaller value compared with the other two cases, thus leading to a quicker imbibition process. However, the dynamic contact angle for nanofluids with ε n o = 0.1 and 0.15 kcal/mol is almost identical with longer simulation time. The similar value of the contact angle is responsible for the similar displacement tendency during Stage II in Figure 4a. When the characteristic energy increases to 0.2 kcal/mol, the equilibrium contact angle is slightly higher than the others, showing smaller displacement. Comparing the equilibrium contact angle for fluids with hydrophobic nanoparticles, it can be summarized that the addition of hydrophobic nanoparticles could alter the wettability of the solid capillary, making it less hydrophilic, thus resulting in less fluids entering into the capillary.
When the characteristic energy ε n o for nanoparticles increases to 0.3 kcal/mol, the dynamic contact angle shows a similar trend to that of water. From Figure 5c, the equilibrium contact angle for 0.3 kcal/mol is about 72.23°, higher than that for water but smaller than that for fluids with hydrophobic nanoparticles. This indicates that fluids with mix-wettability nanoparticles can enter into the capillary relatively easier than fluids with hydrophobic nanoparticles, but more difficult than fluids with water.
Figure 5d displays the dynamic contact angle as a function of simulation time with hydrophilic nanoparticles, with increased characteristic energy (0.4 and 0.5 kcal/mol). It is interesting to note again that the dynamic contact angle has a turning point at the simulation time of about 3.0 ns, which shows a similar trend to the displacement curves of fluids with hydrophilic nanoparticles in Figure 4b. Before the turning point, the dynamic contact angle for 0.5 kcal/mol is higher than that of 0.4 kcal/mol, contributing to the slow movement of fluid in the capillary. Meanwhile, at the transition region of the contact angle, fluids with two types of hydrophilic nanoparticles have a smaller contact angle, suggesting a faster displacement than that with 0.3 kcal/mol in this region, in agreement with Figure 4b.
Based on the above analysis, the addition of nanoparticles into fluids alters the wettability of the capillary and the dynamic contact angle can be used to explain the imbibition phenomena of nanofluids quantitatively. For hydrophobic nanoparticles, with the increasing characteristic energy, the capillary becomes more hydrophobic, which results in less fluid entering into the capillary. In the case of hydrophilic nanoparticles, the wettability of the capillary has a turning point with time elapse, and the fluids tend to become more hydrophilic in the capillary with longer simulation time.

3.3. The Microscale Imbibition Mechanism

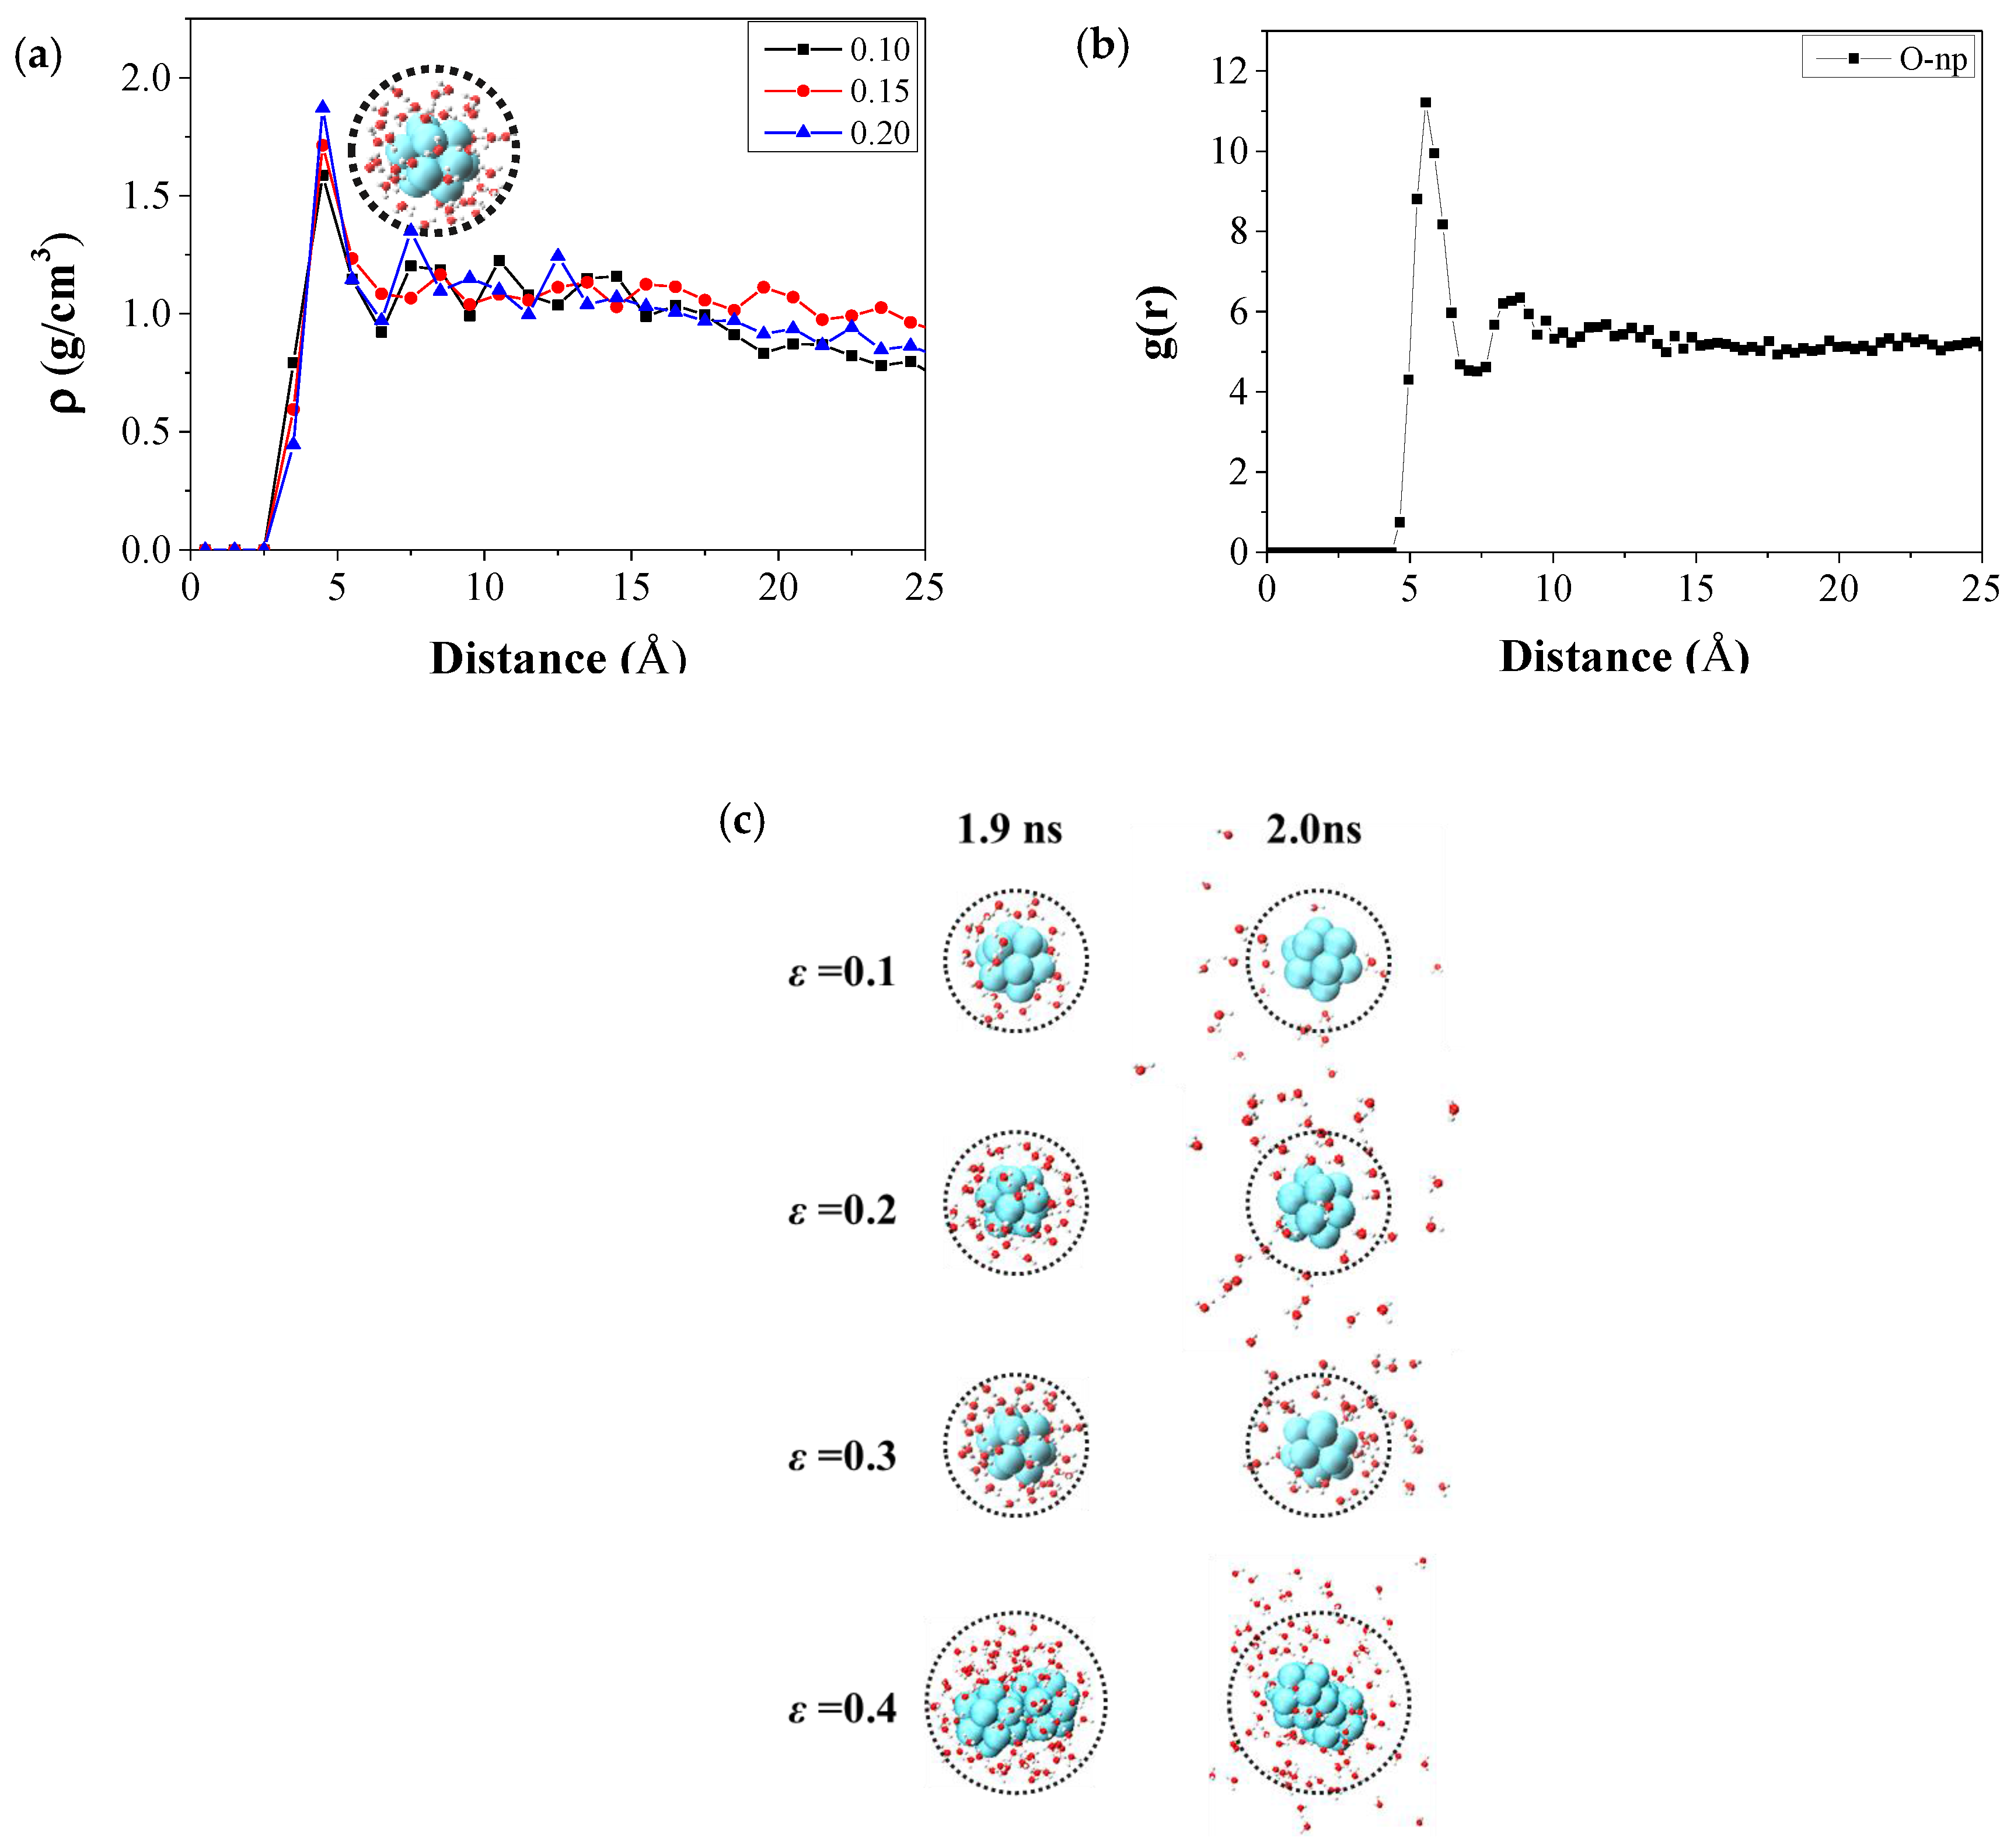
3.3.1. The Micro Behavior of Nanoparticles in Water-Wet Capillary

The migration dynamics of nanoparticles in the course of the simulation is analyzed to explore its dominating effects in the imbibition mechanism, the dynamic contact angle and the displacement curves observed. In order to obtain detailed information about nanoparticle motion behaviors, the system snapshots of nanofluids containing water molecules and hydrophobic (0.2 kcal/mol) and hydrophilic (0.4 kcal/mol) nanoparticles at simulation times 2.0 ns and 4.0 ns are shown in Figure 6a. The three representative configurations of hydrophilic nanoparticles in the nanofluids are given in Figure 6b. In Figure 6a, for hydrophobic nanoparticles, three main motion behaviors are observed: (i) the nanoparticles dispersed in fluids, (ii) the nanoparticles adsorbed on the capillary, and (iii) the nanoparticles escaped from fluids. The first two motions are the same as Type I and III for hydrophilic nanoparticles in Figure 6b. In the following part, these motion behaviors are discussed separately to study their influence on the imbibition mechanism.
Firstly, the nanoparticles dispersed in fluids are studied, as depicted in Type I in Figure 6b. The density distribution profiles and radial distribution function are calculated and plotted in Figure 7a,b to study the water molecules around the nanoparticles, both of which indicate that water molecules can be absorbed onto nanoparticles, forming a structured layer with a distance of ~5.5 Å to the central mass of nanoparticles. The number of water molecules in the first layer increases with the increasing characteristic energy for hydrophobic nanoparticles. The dynamics in the configuration of the first water layer (certain tracking area radius of about 5.5 Å to the center of nanoparticles) at simulation times 1.9 and 2.0 ns are shown in Figure 7c to show the stability of this water layer. It can be seen that in the next 100,000 simulation time steps, the first layer of water molecules for ε n o = 0.1 kcal/mol diffuses rapidly, indicating that the water molecules adsorbed on hydrophobic nanoparticles are not stable and exchanged frequently with surroundings. While for higher ε n o , the water molecules move together with nanoparticles due to the stronger interaction energy between them despite the Brownian motion of the nanoparticles.
Meanwhile, it can be seen that some hydrophobic nanoparticles with 0.1 and 0.15 kcal/mol escape from the liquid phase and diffuse into the vacuum phase in the capillary at the initial stage, owing to the weak interaction between these nanoparticles and the water molecules. This mitigates the effect of nanoparticles on the imbibition process. With longer imbibition time, the nanoparticles in fluids will reach a quasi-equilibrium state. That is the reason for the similar displacements for 0.1 and 0.15 kcal/mol nanoparticles in Stage II in Figure 4a.
One important behavior of hydrophilic nanoparticles is that two or three nanoparticles aggregate into bigger clusters and move together owing to the strong attraction capacity at the same concentration, as depicted in Type II in Figure 6b. The aggregated nanoparticles significantly influence the properties of nanofluids, especially interfacial tension. Generally, an increase in the hydrophilicity of nanoparticles at a given concentration results in a corresponding increase in the interfacial tension until a saturation status is reached.
All the nanoparticles of different hydrophobicity are found to adsorb onto the wall of the capillary during our simulation, as depicted in Type III in Figure 6c. While the adsorption of hydrophilic nanoparticles on the capillary is very strong and they are almost retained on the solid capillary, the adsorbed hydrophobic nanoparticles are not stable and often move quickly along the axial direction of the capillary. The mean square displacements of nanoparticles in the capillary along the radial and axial direction are calculated to qualitatively study the motion of nanoparticles in the capillary, as shown in Figure 8. Similarly, only two typical nanoparticles are considered to illustrate the phenomena. Figure 8a,b suggest that compared with hydrophilic nanoparticles which are almost stuck onto the surface, hydrophobic nanoparticles move faster along both the axial and the radial directions. These two motions can be called “sticking phenomenon” and “slipping phenomenon”, respectively. The “sticking phenomenon” formed by adsorption onto the solid surface is expected to generate the strong disjoining force, and can result in increasing wettability of the surface and the decreasing contact angle, as proposed by Wasan and Nikolov [26] and validated by other scientists [48,55]. According to our simulation results in Section 3.1, the fluid displacement in the case of more hydrophilic nanoparticles ( ε n o = 0.4 kcal/mol) has a turning point at about 3.0 ns. Such a result can be attributed to more nanoparticles entering into the capillary with time. With the influx of nanoparticles, more nanoparticles are observed to be stuck on the capillary, which leads to a smaller contact angle, and thus higher displacement. Therefore, the “sticking phenomenon” reduces the contact angle and promotes the displacement of fluids, and hence causes the turnover of the displacement in Figure 4b and the turning point of the dynamic contact angle in Figure 5c.

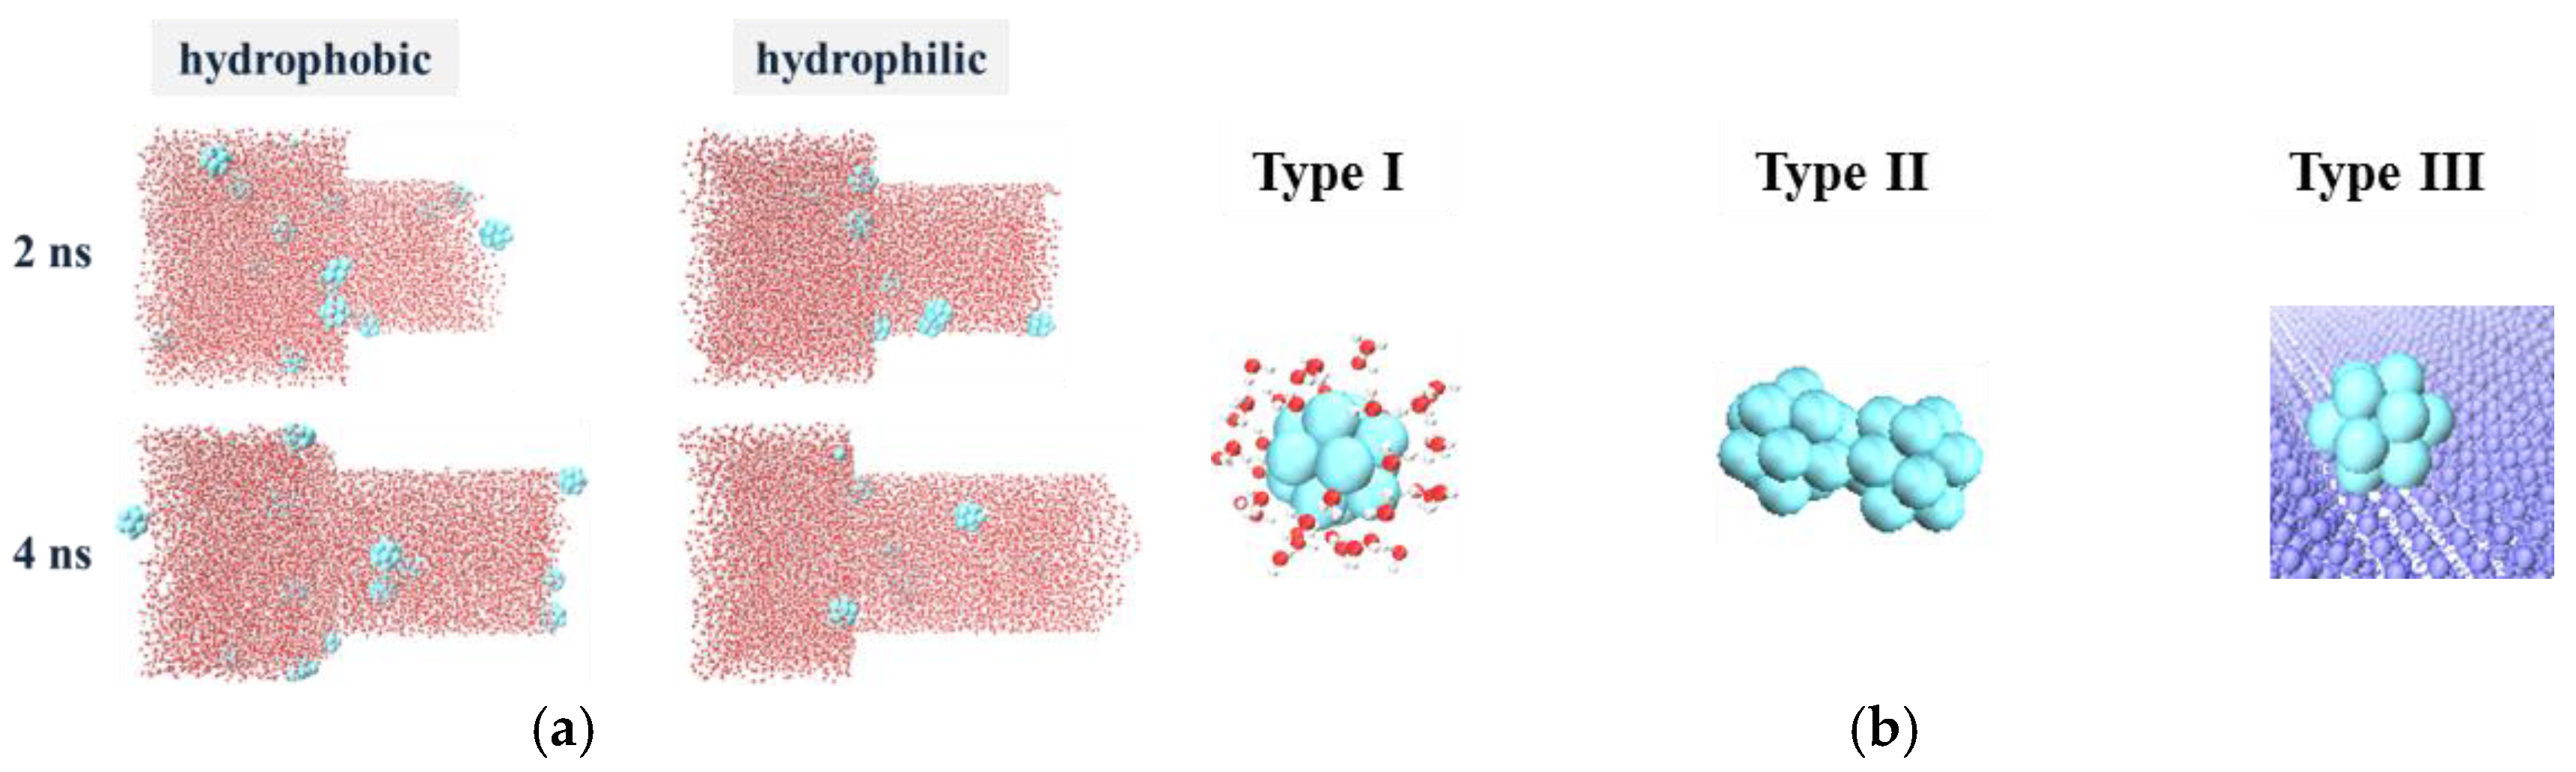
3.3.2. The Micro Imbibition Mechanism of Nanofluids in Water-Wet Capillary

The imbibition mechanism of nanofluids is highly linked to nanoparticles’ behavior from the microscopic perspective. The dispersed, escaped and aggregated nanoparticles greatly influence the properties of nanofluids, including viscosity and interfacial tension, and the adsorbed nanoparticles have the potential to alter the wettability of the capillary.
Combining all the dynamic behaviors of the nanoparticles observed in our simulation, an imbibition mechanism consisting of a competitive nanoparticle effect and fluid properties is proposed. For hydrophobic nanoparticles, the properties of nanofluids, such as viscous force and surface tension force, control the imbibition process; while for hydrophilic nanoparticles, apart from the influence of nanofluids’ properties, disjoining force induced by the “sticking phenomenon” dominates the imbibition process. For the mixed wettability of nanoparticles, the force balance between the properties of nanofluids and disjoining pressure contribute to the relatively high displacement during the imbibition process.

4. Conclusions

In this paper, MD simulation is adopted to investigate the imbibition process of nanofluids into the capillary influenced by the surface wettability of nanoparticles. Based on the analysis of the density distribution profiles, the addition of different types of nanoparticles is found to decrease the displacement of fluids into the capillary. The relationship between the displacement l of fluid into the capillary and time can be described by l(t) ~ t1/2. For hydrophobic nanoparticles, the displacement reduces with the decrease of hydrophobicity. The displacement of nanoparticles with mixed wettability is relatively higher compared with other hydrophobic nanoparticles in the initial stage. The displacement of fluids containing hydrophilic nanoparticles is slightly higher than hydrophobic nanofluids, and the increasing hydrophilicity of nanoparticles results in the even higher displacement with longer simulation time. The dynamic contact angle of fluids in the capillary suggests that the addition of nanoparticles can alter the wettability of the capillary. Furthermore, based on the motion behavior of nanoparticles, a competitive mechanism is proposed for the spontaneous imbibition of nanofluids in the capillary. For hydrophobic nanoparticles, the properties of nanofluids, such as viscous force and surface tension, are responsible for the imbibition process. For hydrophilic nanofluids, apart from the influence of nanofluids’ properties, disjoining force induced by the “sticking phenomenon” dominates the imbibition process. For the mixed wettability nanofluids, the relative high displacement in the imbibition process is attributed to the force balance between the properties of nanofluids and disjoining pressure. Our findings provide new physical insights into the roles of nanoparticles in fluid imbibition, which is the core process in a number of technologies, including enhanced oil recovery.

Supplementary Materials

The following are available online at www.mdpi.com/1996-1073/10/4/506/s1.

Acknowledgments

This work is supported by the Research Council of Norway, Det Norske Oljeselskap ASA, and Wintershall Norge AS via WINPA project (NANO2021 and PETROMAKS2 234626). The computational resources are provided by Norwegian Metacenter for Computational Science (NOTUR NN9110k and NN9391k).

Author Contributions

Jianying He conceived the research framework. Xiao Wang carried out all of the molecular dynamics simulations. All authors contributed to the analysis of data, discussed the results and co-wrote the paper.

Conflicts of Interest

The authors declare no conflict of interest.

References

  1. Ehtesabi, H.; Ahadian, M.M.; Taghikhani, V. Enhanced Heavy Oil Recovery Using TiO2 Nanoparticles: Investigation of Deposition during Transport in Core Plug. Energy Fuels 2015, 29, 1–8. [Google Scholar] [CrossRef]
  2. Wang, W.; Zhang, M.; Chu, L. Functional Polymeric Microparticles Engineered from Controllable Microfluidic Emulsions. Acc. Chem. Res. 2014, 47, 373–384. [Google Scholar] [CrossRef] [PubMed]
  3. Kondiparty, K.; Nikolov, A.D.; Wasan, D.; Liu, K.L. Dynamic spreading of nanofluids on solids. Part I: Experimental. Langmuir 2012, 28, 14618–14623. [Google Scholar] [CrossRef] [PubMed]
  4. Yanagihara, H.; Yamashita, K.; Endo, A.; Daiguji, H. Adsorption–Desorption and Transport of Water in Two-Dimensional Hexagonal Mesoporous Silica. J. Phys. Chem. C 2013, 117, 21795–21802. [Google Scholar] [CrossRef]
  5. Xu, X.; Vereecke, G.; Chen, C.; Pourtois, G.; Armini, S.; Verellen, N.; Tsai, W.; Kim, D.; Lee, E.; Lin, C.; et al. Capturing Wetting States in Nanopatterned Silicon. ACS Nano 2014, 8, 885–893. [Google Scholar] [CrossRef] [PubMed]
  6. Lei, W.; Fong, N.; Yin, Y.; Svehla, M.; McKenzie, D.R. Science of Water Leaks: Validated Theory for Moisture Flow in Microchannels and Nanochannels. Langmuir 2015, 31, 11740–11747. [Google Scholar] [CrossRef] [PubMed]
  7. Yoon, K.Y.; Son, H.A.; Choi, S.K.; Kim, J.W.; Sung, W.M.; Kim, H.T. Core Flooding of Complex Nanoscale Colloidal Dispersions for Enhanced Oil Recovery byin SituFormation of Stable Oil-in-Water Pickering Emulsions. Energy Fuels 2016, 30, 2628–2635. [Google Scholar] [CrossRef]
  8. Bakli, C.; Chakraborty, S. Capillary filling dynamics of water in nanopores. Appl. Phys. Lett. 2012, 101, 153112. [Google Scholar] [CrossRef]
  9. Cupelli, C.; Henrich, B.; Glatzel, T.; Zengerle, R.; Moseler, M.; Santer, M. Dynamic capillary wetting studied with dissipative particle dynamics. New J. Phys. 2008, 10, 043009. [Google Scholar] [CrossRef]
  10. Oyarzua, E.; Walther, J.H.; Mejia, A.; Zambrano, H.A. Early regimes of water capillary flow in slit silica nanochannels. Phys. Chem. Chem. Phys. 2015, 17, 14731–14739. [Google Scholar] [CrossRef] [PubMed]
  11. Berthier, J.; Gosselin, D.; Pham, A.; Delapierre, G.; Belgacem, N.; Chaussy, D. Capillary Flow Resistors: Local and Global Resistors. Langmuir 2016, 32, 915–921. [Google Scholar] [CrossRef] [PubMed]
  12. Hamraoui, A.; Nylander, T. Analytical approach for the Lucas-Washburn equation. J. Colloid Interface Sci. 2002, 250, 415–421. [Google Scholar] [CrossRef] [PubMed]
  13. Chen, C.; Lu, K.; Zhuang, L.; Li, X.; Dong, J.; Lu, J. Effective fluid front of the moving meniscus in capillary. Langmuir 2013, 29, 3269–3273. [Google Scholar] [CrossRef] [PubMed]
  14. Stroberg, W.; Keten, S.; Liu, W.K. Hydrodynamics of capillary imbibition under nanoconfinement. Langmuir 2012, 28, 14488–14495. [Google Scholar] [CrossRef] [PubMed]
  15. Dimitrov, D.I.; Klushin, L.I.; Milchev, A.; Binder, K. Flow and transport in brush-coated capillaries: A molecular dynamics simulation. Phys. Fluids 2008, 20, 092102. [Google Scholar] [CrossRef]
  16. Chibbaro, S.; Costa, E.; Dimitrov, D.I.; Diotallevi, F.; Milchev, A.; Palmieri, D.; Pontrelli, G.; Succi, S. Capillary filling in microchannels with wall corrugations: a comparative study of the Concus-Finn criterion by continuum, kinetic, and atomistic approaches. Langmuir 2009, 25, 12653–12660. [Google Scholar] [CrossRef] [PubMed]
  17. Dimitrov, D.I.; Milchev, A.; Binder, K. Method for wettability characterization based on contact line pinning. Phys. Rev. E 2010, 81, 041603. [Google Scholar] [CrossRef] [PubMed]
  18. Beu, T.A. Molecular dynamics simulations of ion transport through carbon nanotubes. I. Influence of geometry, ion specificity, and many-body interactions. J. Chem. Phys. 2010, 132, 164513. [Google Scholar] [CrossRef] [PubMed]
  19. Colosqui, C.E.; Teng, T.; Rahmani, A.M. Wetting Driven by Thermal Fluctuations on Terraced Nanostructures. Phys. Rev. Lett. 2015, 115, 154504. [Google Scholar] [CrossRef] [PubMed]
  20. Walls, P.L.; Dequidt, G.; Bird, J.C. Capillary Displacement of Viscous Liquids. Langmuir 2016, 32, 3186–3190. [Google Scholar] [CrossRef] [PubMed]
  21. Hammond, P.S.; Unsal, E. Spontaneous and forced imbibition of aqueous wettability altering surfactant solution into an initially oil-wet capillary. Langmuir 2009, 25, 12591–12603. [Google Scholar] [CrossRef] [PubMed]
  22. Hammond, P.S.; Unsal, E. Spontaneous imbibition of surfactant solution into an oil-wet capillary: wettability restoration by surfactant-contaminant complexation. Langmuir 2011, 27, 4412–4429. [Google Scholar] [CrossRef] [PubMed]
  23. Fletcher, P.D.; Savory, L.D.; Woods, F.; Clarke, A.; Howe, A.M. Model study of enhanced oil recovery by flooding with aqueous surfactant solution and comparison with theory. Langmuir 2015, 31, 3076–3085. [Google Scholar] [CrossRef] [PubMed]
  24. Clarke, A.; Howe, A.M.; Mitchell, J.; Staniland, J.; Hawkes, L.; Leeper, K. Mechanism of anomalously increased oil displacement with aqueous viscoelastic polymer solutions. Soft Matter 2015, 11, 3536–3541. [Google Scholar] [CrossRef] [PubMed]
  25. Peng, B.; Liu, Y.; Zhou, Y.; Yang, L.; Zhang, G.; Liu, Y. Modeling Nanoparticle Targeting to a Vascular Surface in Shear Flow Through Diffusive Particle Dynamics. Nanoscale Res. Lett. 2015, 10, 235. [Google Scholar] [CrossRef] [PubMed]
  26. Wasan, D.T.; Nikolov, A.D. Spreading of nanofluids on solids. Nature 2003, 423, 156–159. [Google Scholar] [CrossRef] [PubMed]
  27. El-Amin, M.F.; Salama, A.; Sun, S. Numerical and dimensional analysis of nanoparticles transport with two-phase flow in porous media. J. Pet. Sci. Eng. 2015, 128, 53–64. [Google Scholar] [CrossRef]
  28. Hu, Z.; Azmi, S.M.; Raza, G.; Glover, P.W.J.; Wen, D. Nanoparticle-Assisted Water-Flooding in Berea Sandstones. Energy Fuels 2016, 30, 2791–2804. [Google Scholar] [CrossRef]
  29. Lin, Y.; Skaff, H.; Emrick, T.; Dinsmore, A.D.; Russell, T.P. Nanoparticle Assembly and Transport at Liquid-Liquid Interfaces. Science 2003, 299, 226–229. [Google Scholar] [CrossRef] [PubMed]
  30. Wang, S.; Liu, K.; Yao, X.; Jiang, L. Bioinspired Surfaces with Superwettability: New Insight on Theory, Design, and Applications. Chem. Rev. 2015, 115, 8230–8293. [Google Scholar] [CrossRef] [PubMed]
  31. Yong, X. Modeling the Assembly of Polymer-Grafted Nanoparticles at Oil-Water Interfaces. Langmuir 2015, 31, 11458–11469. [Google Scholar] [CrossRef] [PubMed]
  32. Ma, Y.; Bhattacharya, A.; Kuksenok, O.; Perchak, D.; Balazs, A.C. Modeling the transport of nanoparticle-filled binary fluids through micropores. Langmuir 2012, 28, 11410–11421. [Google Scholar] [CrossRef] [PubMed]
  33. Joonaki, E.; Ghanaatian, S. The Application of Nanofluids for Enhanced Oil Recovery: Effects on Interfacial Tension and Coreflooding Process. Pet. Sci. Technol. 2014, 32, 2599–2607. [Google Scholar] [CrossRef]
  34. Hendraningrat, L.; Torsæter, O. Metal oxide-based nanoparticles: revealing their potential to enhance oil recovery in different wettability systems. Appl. Nanosci. 2014, 5, 181–199. [Google Scholar] [CrossRef]
  35. Wong, A.S.; Mann, S.K.; Czuba, E.; Sahut, A.; Liu, H.; Suekama, T.C.; Bickerton, T.; Johnston, A.P.; Such, G.K. Self-assembling dual component nanoparticles with endosomal escape capability. Soft Matter 2015, 11, 2993–3002. [Google Scholar] [CrossRef] [PubMed]
  36. Supple, S.; Quirke, N. Molecular dynamics of transient oil flows in nanopores I: Imbibition speeds for single wall carbon nanotubes. J. Chem. Phys. 2004, 121, 8571–8579. [Google Scholar] [CrossRef] [PubMed]
  37. Supple, S.; Quirke, N. Molecular dynamics of transient oil flows in nanopores. II. Density profiles and molecular structure for decane in carbon nanotubes. J. Chem. Phys. 2005, 122, 104706. [Google Scholar] [CrossRef] [PubMed]
  38. Sedghi, M.; Piri, M.; Goual, L. Atomistic Molecular Dynamics Simulations of Crude Oil/Brine Displacement in Calcite Mesopores. Langmuir 2016, 32, 3375–3384. [Google Scholar] [CrossRef] [PubMed]
  39. Giovambattista, N.; Almeida, A.B.; Alencar, A.M.; Buldyrev, S.V. Validation of Capillarity Theory at the Nanometer Scale by Atomistic Computer Simulations of Water Droplets and Bridges in Contact with Hydrophobic and Hydrophilic Surfaces. J. Phys. Chem. C 2016, 120, 1597–1608. [Google Scholar] [CrossRef]
  40. Yamashita, K.; Daiguji, H. Molecular Dynamics Simulations of Water Uptake into a Silica Nanopore. J. Phys. Chem. C 2015, 119, 3012–3023. [Google Scholar] [CrossRef]
  41. Zhong, J.; Wang, X.; Du, J.; Wang, L.; Yan, Y.; Zhang, J. Combined Molecular Dynamics and Quantum Mechanics Study of Oil Droplet Adsorption on Different Self-Assembly Monolayers in Aqueous Solution. J. Phys. Chem. C 2013, 117, 12510–12519. [Google Scholar] [CrossRef]
  42. Chen, C.; Gao, C.; Zhuang, L.; Li, X.; Wu, P.; Dong, J.; Lu, J. A many-body dissipative particle dynamics study of spontaneous capillary imbibition and drainage. Langmuir 2010, 26, 9533–9538. [Google Scholar] [CrossRef] [PubMed]
  43. Wu, J.; He, J.; Torsæter, O.; Zhang, Z. Effect of Nanoparticles on Oil-Water Flow in a Confined Nanochannel a Molecular Dynamics Study. In Proceedings of the SPE International Oilfield Nanotechnology Conference, Noordwijk, The Netherlands, 12–14 June 2012. [Google Scholar]
  44. Blake, T.D.; Coninck, J.D. The influence of pore wettability on the dynamics of imbibition and drainage. Colloids Surf. A 2004, 250, 395–402. [Google Scholar] [CrossRef]
  45. Plimpton, S. Fast Parallel Algorithms for Short-Range Molecular Dynamics. J. Comput. Phys. 1995, 117, 1–19. [Google Scholar] [CrossRef]
  46. Lim, S.; Horiuchi, H.; Nikolov, A.D.; Wasan, D. Nanofluids alter the surface wettability of solids. Langmuir 2015, 31, 5827–5835. [Google Scholar] [CrossRef] [PubMed]
  47. Esfandyari Bayat, A.; Junin, R.; Samsuri, A.; Piroozian, A.; Hokmabadi, M. Impact of Metal Oxide Nanoparticles on Enhanced Oil Recovery from Limestone Media at Several Temperatures. Energy Fuels 2014, 28, 6255–6266. [Google Scholar] [CrossRef]
  48. Wang, F.; Wu, H. Molecular dynamics studies on spreading of nanofluids promoted by nanoparticle adsorption on solid surface. Theor. Appl. Mech. Lett. 2013, 3, 054006. [Google Scholar] [CrossRef]
  49. Wang, F.; Wu, H. Enhanced oil droplet detachment from solid surfaces in charged nanoparticle suspensions. Soft Matter 2013, 9, 7974–7980. [Google Scholar] [CrossRef]
  50. Hockney, R.W.; Eastwood, J.W. Computer Simulation Using Particles; Adam Hilger: New York, NY, USA, 1989. [Google Scholar]
  51. Stukan, M.R.; Ligneul, P.; Crawshaw, J.P.; Boek, E.S. Spontaneous imbibition in nanopores of different roughness and wettability. Langmuir 2010, 26, 13342–13352. [Google Scholar] [CrossRef] [PubMed]
  52. Sedghi, M.; Piri, M.; Goual, L. Molecular dynamics of wetting layer formation and forced water invasion in angular nanopores with mixed wettability. J. Chem. Phys. 2014, 141, 194703. [Google Scholar] [CrossRef] [PubMed]
  53. Martic, G.; Gentner, F.; Seveno, D.; Coulon, D.; Coninck, J.D. A Molecular Dynamics Simulation of Capillary Imbibition. Langmuir 2002, 18, 7971–7976. [Google Scholar] [CrossRef]
  54. Wang, P.; Li, Z.; Ma, Y.; Sun, X.; Liu, Z.; Zhang, J. The coarse-grained model for a water/oil/solid system: based on the correlation of water/air and water/oil contact angles. RSC Adv. 2015, 5, 51135–51141. [Google Scholar] [CrossRef]
  55. Li, Y.; Wang, F.; Liu, H.; Wu, H. Nanoparticle-tuned spreading behavior of nanofluid droplets on the solid substrate. Microfluid. Nanofluid. 2014, 18, 111–120. [Google Scholar] [CrossRef]
Figure 1. The simulation system contains a water-based nanofluid (red) laden with well-distributed spherical nanoparticles (light green) and a capillary (blue): (a) the 3D perspective of the top view; and (b) the side view.
Energies 10 00506 g001
Figure 2. The snapshots of nanofluids with different types of nanoparticles as time evolutions. Here, the x-axis shows the wettability of nanoparticles changing via characteristic energy and the y-axis is the simulation time.
Energies 10 00506 g002
Figure 3. (a) The density distribution profiles of the nanofluids along the capillary at simulation time 2.0 ns. Different types of nanoparticles (characteristic energy increases from 0.15 to 0.50) are used in the nanofluids. Here, the x axis is the distance from the entrance of the capillary, and the y axis is the density of the fluids. Different background colors show different regions: (green) Part I; (pink) Part II; (yellow) Part III. (b) Water configuration in different regions: (blue) Part I; (pink) Part II. The yellow atoms are the capillary, while the red and white atoms are oxygen and hydrogen, respectively.
Energies 10 00506 g003aEnergies 10 00506 g003b
Figure 4. The nanofluid displacement as a function of time in the capillary: (a) for water and hydrophobic nanoparticles; and (b) for hydrophilic nanoparticles.
Energies 10 00506 g004
Figure 5. (a) Schematic of the extremity of the shell and fitting the contact angle; dynamic contact angles of different nanofluids in the cylindrical pore from (b) to (d): (b) water and hydrophobic nanoparticles; (c) water and mix-wettability nanoparticles; and (d) hydrophilic nanoparticles, where the smoothed lines are the running average of the scattered data points.
Energies 10 00506 g005
Figure 6. (a) The configuration of fluids containing water molecules and hydrophobic and hydrophilic nanoparticles in imbibition simulation systems at 2.0 ns and 4.0 ns; and (b) Three types of behaviors of hydrophilic nanoparticles in fluids.
Energies 10 00506 g006
Figure 7. (a) The density distribution profiles and (b) the radial distribution function for water molecules around nanoparticles; and (c) tracked movement configuration of the selected first water layer (black dashed line shows a certain tracking area radius of about 5.5 Å to the center of nanoparticles except for ε = 0.4) around nanoparticles at 1.9 ns and 2.0 ns. For ε = 0.4, the black circle is only shown for guidance as two nanoparticles are included.
Energies 10 00506 g007
Figure 8. The mean square displacement of nanoparticles in the capillary: (a) along the radial direction; and (b) along the axial direction.
Energies 10 00506 g008

