1. Introduction
As the main dielectric media in oil-immersed transformers, the oil and oil impregnated paper will degrade with time, under thermal, electrical, chemical stresses and other factors [
1,
2,
3,
4]. Oil in transformers can be replaced after serious deterioration, because of its mobility. On the contrary, the replacement of oil impregnated paper is rather difficult when it degrades seriously, especially the paper covering windings. Hence, the operation of a transformer is dependent on the condition of the paper insulation [
5,
6,
7,
8,
9,
10] and assessing the condition of paper insulation is vital to the security and economy of the transformer’s operation and even the entire power system.
Cellulose is the main component of paper. The mechanical properties of cellulose will deteriorate during its aging process. Determining the degree of polymerization (DP) value of cellulose is a standard method of quantifying cellulose degradation [
4,
11]. Many researches on the elapsed life estimation of power transformers were based on the regularity of DP change [
12,
13,
14]. However, DP of paper inside a transformer is not easily assessable, and even destructive.
The degradation by-products of cellulose, such as hydrocarbons, acids, carbon monoxide, carbon dioxide and furfurals remain dissolved in the oil [
15,
16,
17,
18]. The contents of these by-products in oil can provide some information on cellulose ageing. Accordingly, dissolved gas analysis (DGA), furanic compound analysis and other by-products analysis methods have been developed and widely accepted [
11,
17,
19,
20]. To increase the efficiency and accuracy of diagnosis, modern technologies such as Fourier transform infrared (FTIR) spectroscopy, UV-visible spectroscopy, artificial intelligence techniques, etc. have been applied in recent years [
21,
22,
23,
24,
25]. The major limitation of the by-product analysis methods is that they are affected by any oil replacement or oil reconditioning progress [
25,
26].
In recent years, electrical diagnostic methods also drew the attention of many researchers. Dielectric response methods were developed as complements to the classical insulation resistance, dielectric loss factor and polarization index measurements. There are three notable methods to measure the transformer dielectric response, namely frequency domain spectroscopy (FDS), polarization and depolarization current (PDC) and return voltage measurement (RVM) [
2,
27,
28,
29,
30]. The first method is based on frequency domain analysis and the other two methods are based on time domain analysis. Expert systems, grey correlation analysis, and other data analysis techniques were also applied to improve the diagnostic accuracy [
31]. At the present stage, the electrical diagnostic methods mainly rely on the comparison between measured data and historical data, and may be influenced by the geometry [
32]. Among these methods, there is no unified assessment index currently available for different types of transformers.
Actually, the ageing of cellulose paper is not uniform due to the existence of temperature gradients and electric gradients. Generally speaking, the above non-destructive chemical-based diagnostic techniques and electrical-based diagnostic techniques regard the solid insulation in transformers as a whole. The returned information of these methods reflects the “mean” condition of paper. From this point of view, if the spatial distribution characteristics of paper ageing were considered, the sensitivity and accuracy of paper condition assessment would be improved.
During aging processes, the reduction in the polymer chain length of cellulose contributes to the changes in the dielectric properties of cellulose paper [
33,
34]. Changes in the moisture and oil contents during the aging process also lead to changes in the dielectric properties of paper. These changes are the fundamental basis of all electrical diagnostic methods [
28,
32,
35,
36]. The basic dielectric properties for insulation are permittivity and resistivity. The resistivity of paper will decrease over time as the moisture content and aging increase [
28,
34], hence the resistivity of paper can be used to assess the insulation condition of oil impregnated paper.
In this paper, the resistivity of paper is used as the assessment index for the condition assessment of paper insulation in a power transformer. As resistivity is the intrinsic property of material, it is independent from the geometry or the structure of insulation. Hence a new quantitative condition assessment method based on paper resistivity can be realized, to diagnose the paper insulation condition in different transformers. It deserves to be mentioned that, considering the similar influence of ageing and moisture on paper resistivity, the presented work in this paper will not distinguish between these two factors.
According to the idea of taking paper resistivity as an assessment index, the feasibility is discussed firstly in this paper. Thereafter, calculation methods to obtain the resistivity value of paper are proposed, in order to avoid destructive sampling. The basic idea of the calculation method is as following: firstly we build the relationship between insulation resistance and paper resistivity through finite element simulation. Secondly, we iteratively calculate the paper resistivity using the measured insulation resistance. Non-uniform ageing was also considered in the iterative method to improve the accuracy of the resistivity calculations.
2. Feasibility Analysis
2.1. The Ageing Condition and Resistivity of Paper
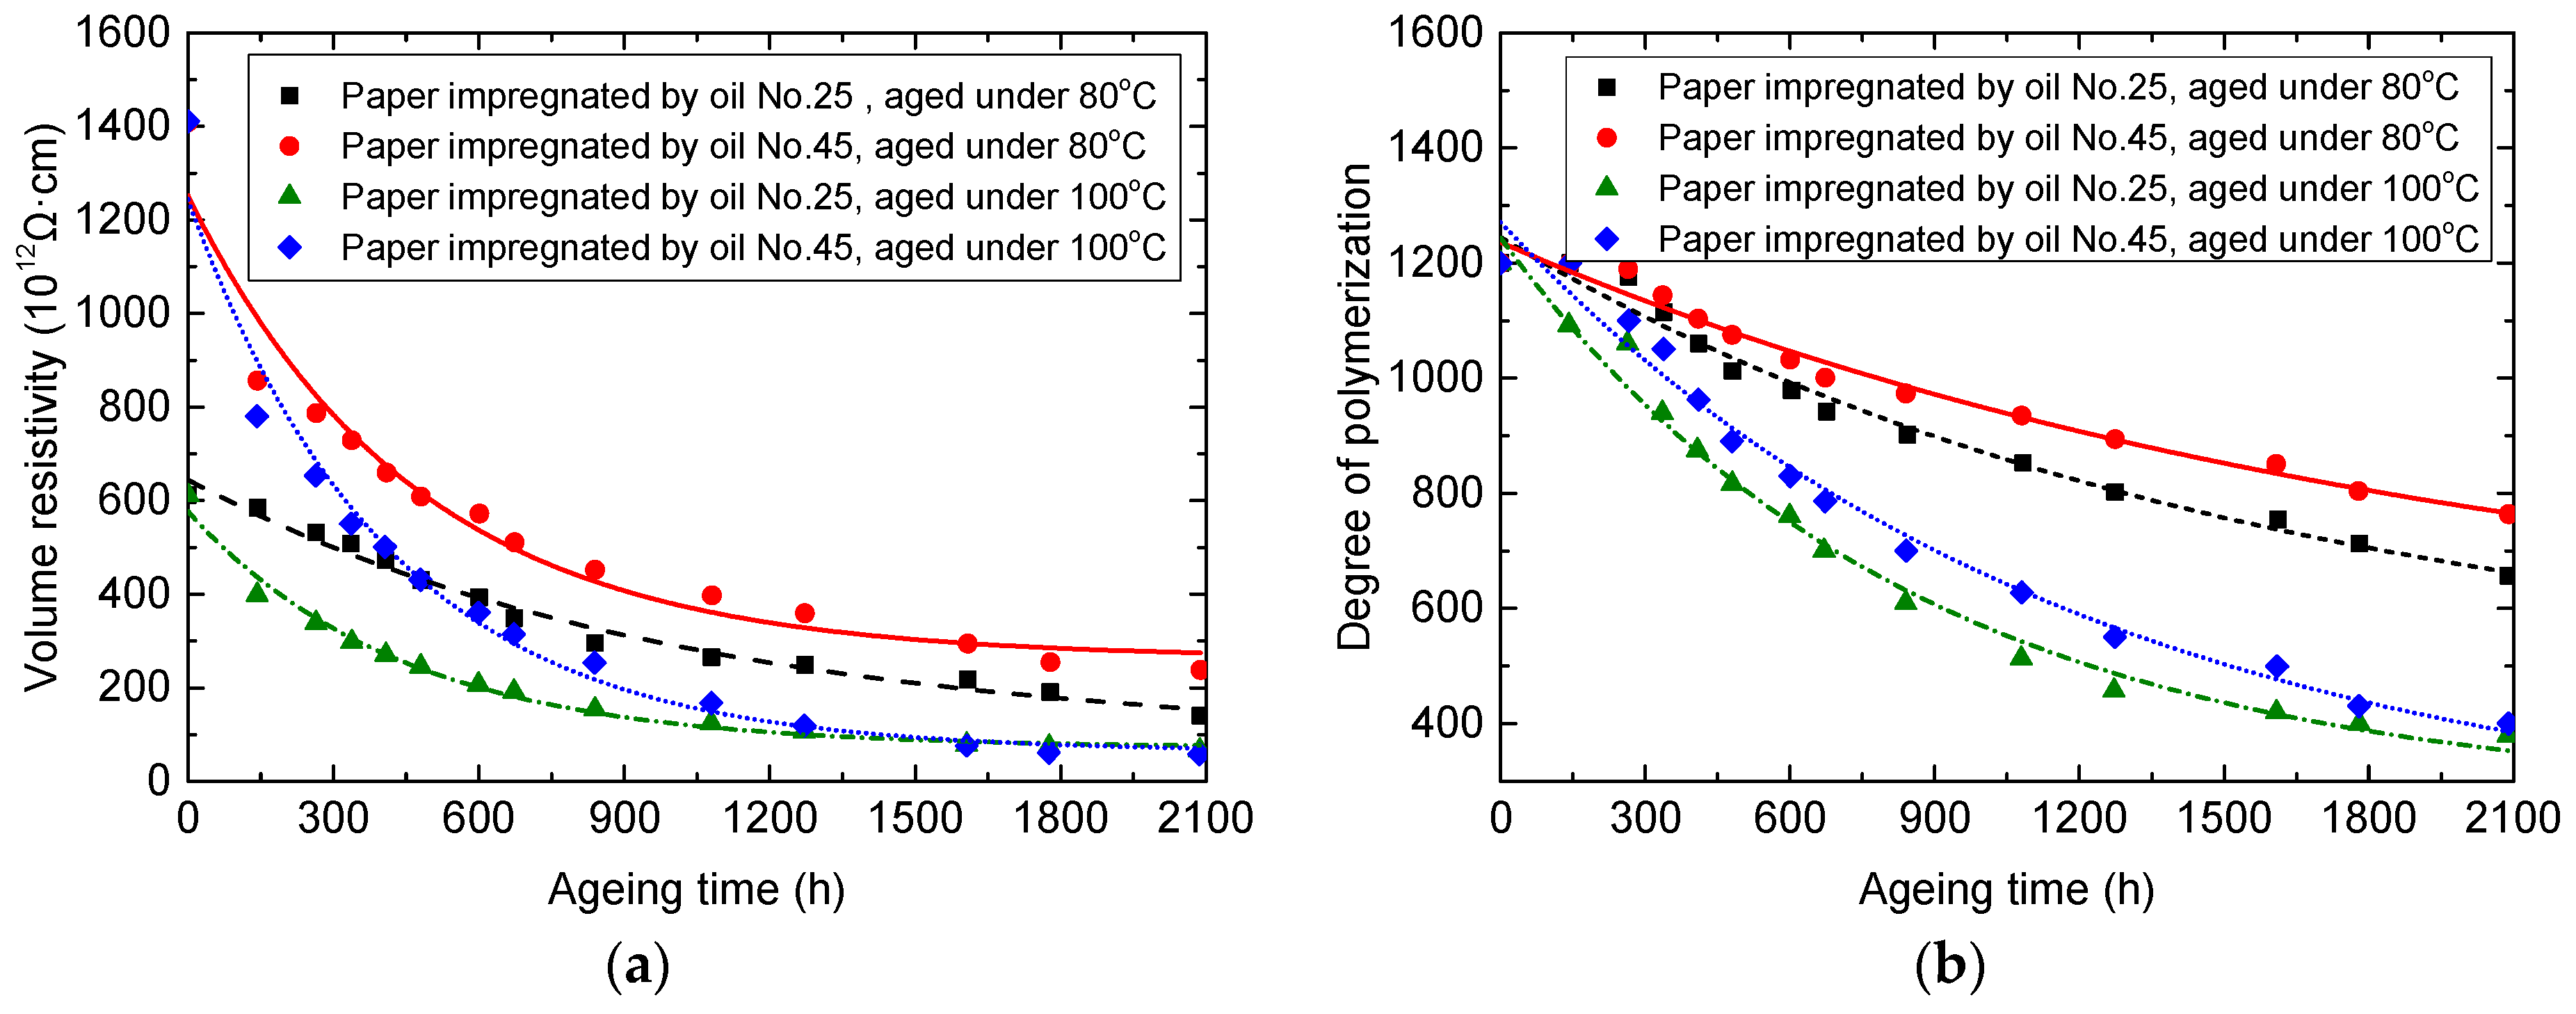
During the aging process, the physical and chemical properties of paper will change. As a result, the resistivity of oil impregnated paper will decrease. In [
37], the author provided measured resistivities and DP values of paper samples impregnated with different kinds of oil under different ageing temperatures, as shown in
Figure 1. Oil No. 25 and oil No. 45 are two kinds of commonly used transformer oils with different melting points. The two kinds of oil have different electric characteristics. Generally speaking, oil No. 25 has lower resistivity than oil No. 45, for its higher content of aromatic hydrocarbon.
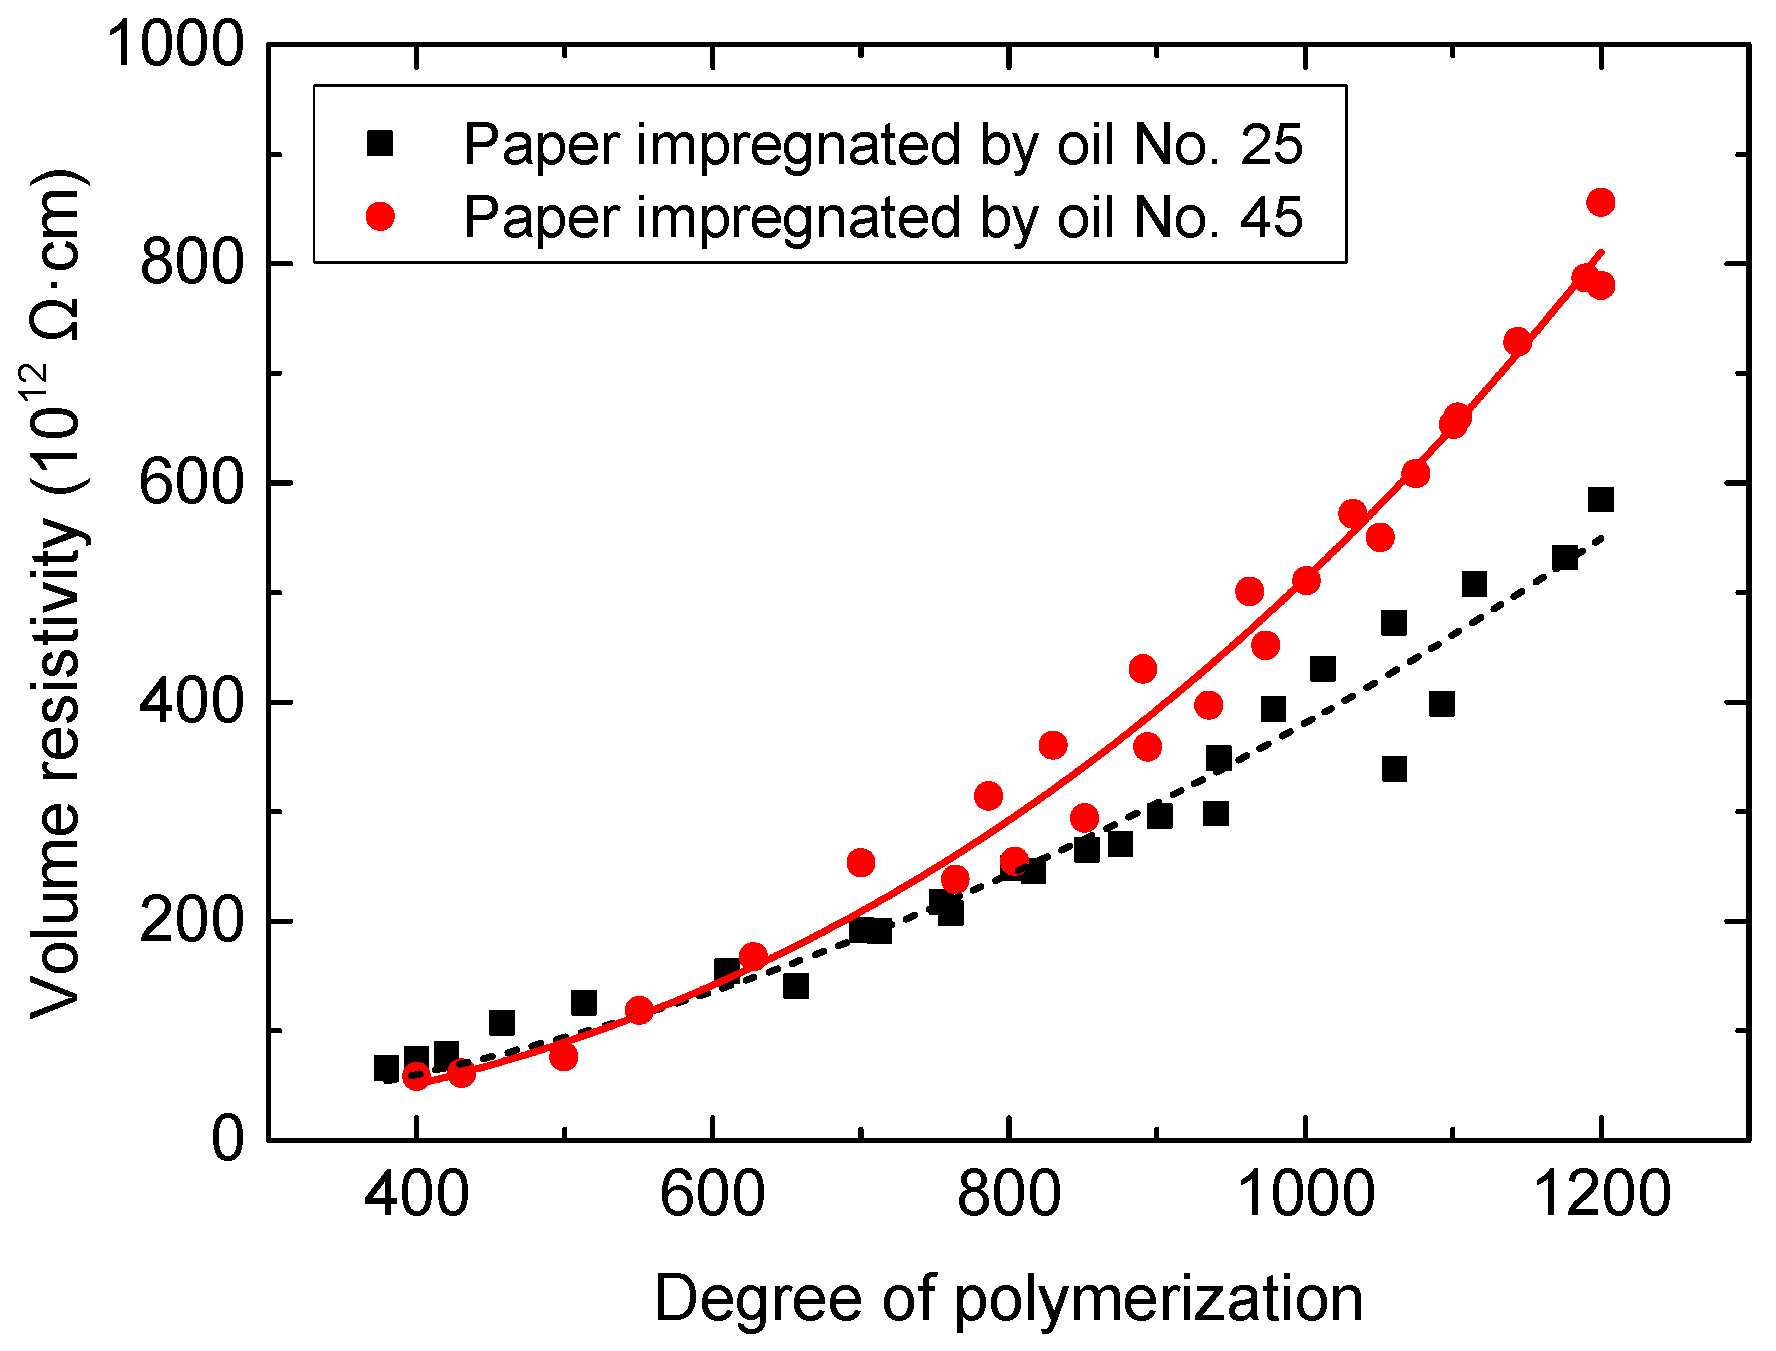
With the measured data in
Figure 1, relationships between degree of polymerization and volume resistivity of oil impregnated paper were built, as shown in
Figure 2. There are good power function relationships between the degree of polymerization and volume resistivity for different kinds of paper.
Table 1 provided the parameters of the power fitting curves.
Currently, DP is the most reliable parameter for the ageing condition assessment of oil impregnated paper. In
Table 1, it is shown that volume resistivity has a good power function relationship with DP, hence volume resistivity could also efficiently reflect the ageing condition of paper.
2.2. The Sensitivity of Resistivity as an Assessment Index
Under normal conditions, the permittivity of paper is one or two times larger than the permittivity of oil. Under a relatively high frequency AC voltage, the electric field in oil is stronger [
38]. On the contrary, the resistivity of paper is larger than the resistivity of oil by almost two orders of magnitude. The electric field in oil impregnated paper is much stronger than that in oil under DC voltage conditions, hence, the change of paper resistivity value will induce obvious changes in measured voltages or currents under a DC electric field.
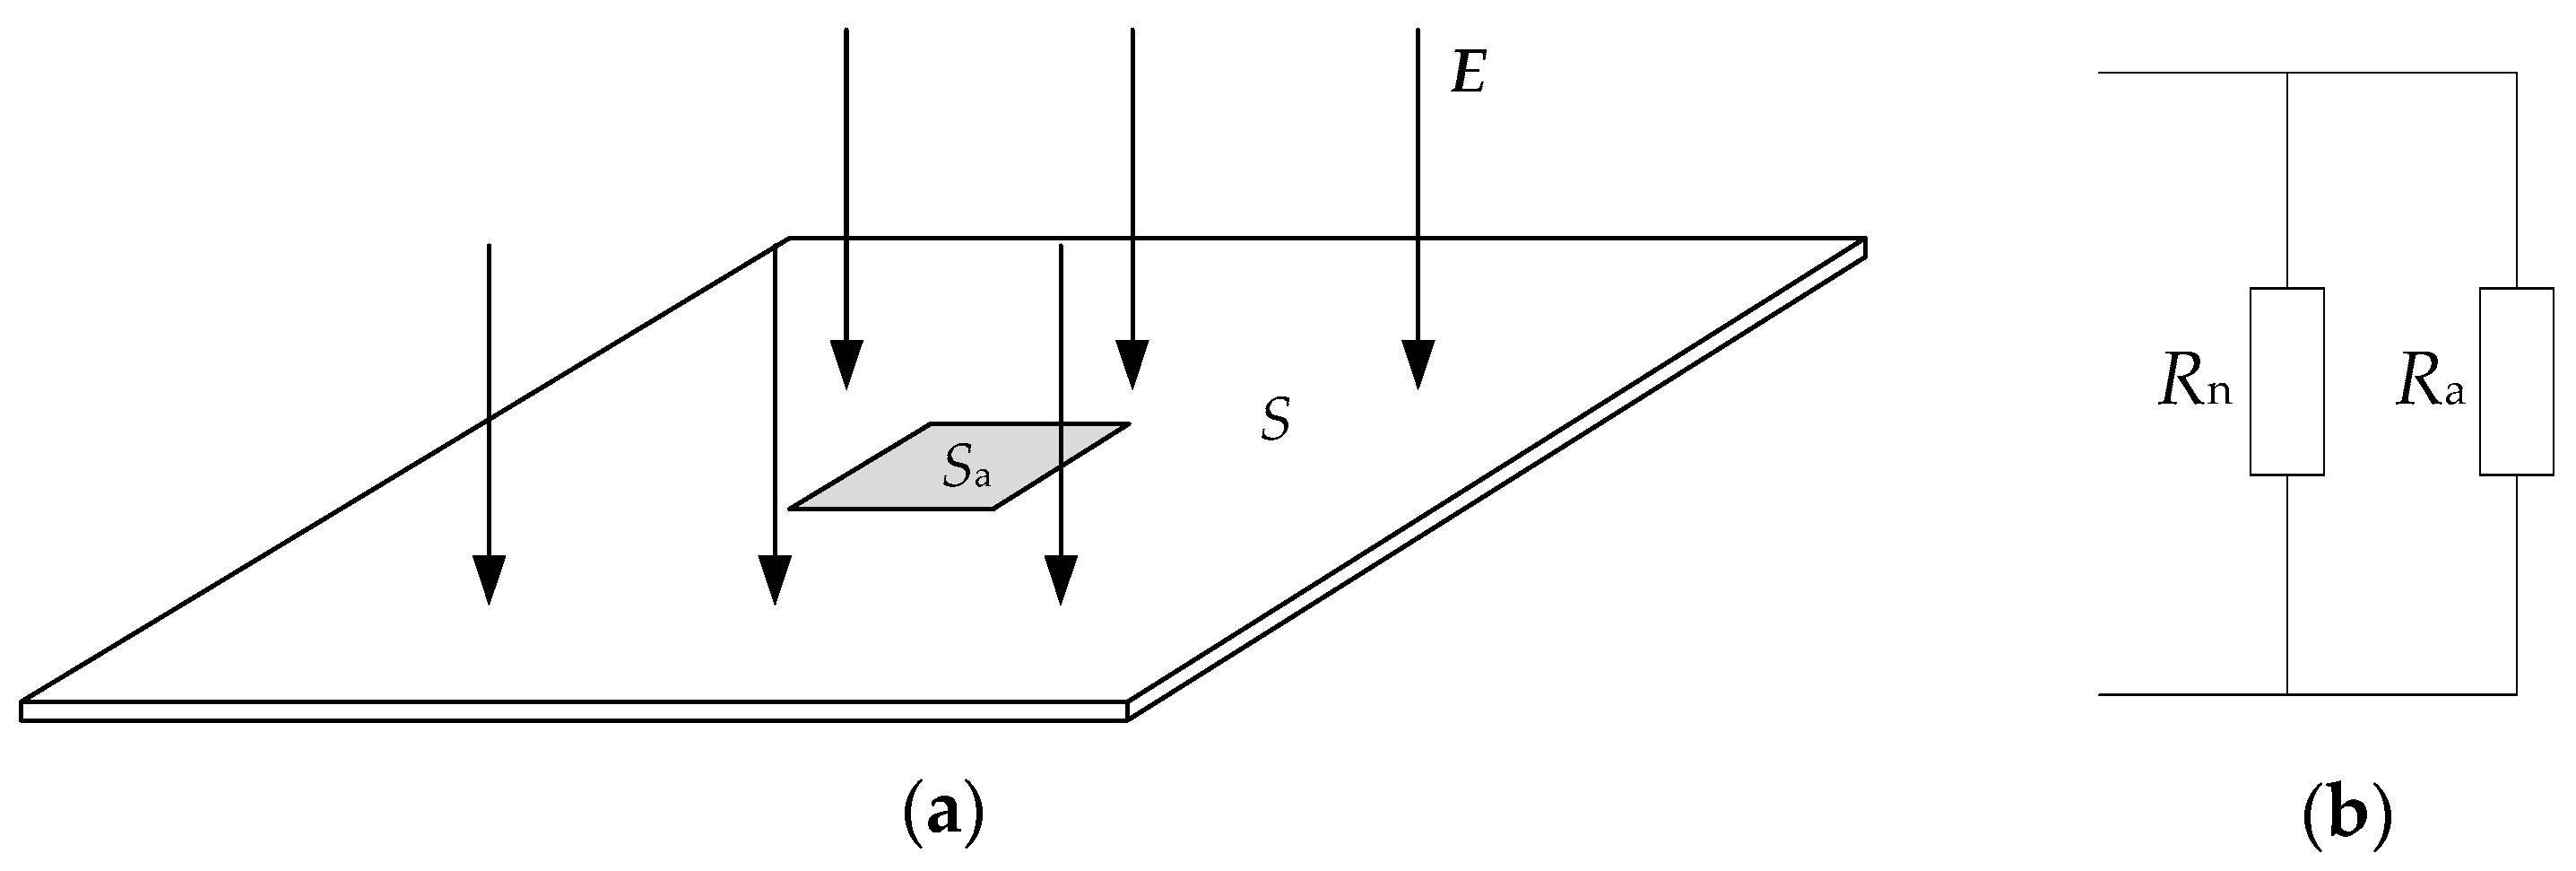
In a transformer, the main electric field component applied on the oil impregnated paper is perpendicular to its surface. Besides, in most areas of each piece of paper, the electric field distribution is relatively uniform. Therefore, a certain area of each paper can be regarded as some smaller areas of paper connected in parallel with each other. The resistivity change of a small local area will lead to an obvious change in the average resistivity of a relatively larger area.
Figure 3a is an idealized model of this condition. In this model, a piece of paper with an area of
S is under a uniform electric field. The resistivity of this paper under normal conditions is
ρn. In this piece of paper, there is a partial ageing region with an area of
Sa. The resistivity of the ageing area is
ρa. Under an electric field perpendicular to the surface, the normal area and ageing area are arranged in parallel, as shown in
Figure 3b. The resistance expressions of each area are shown by Equations (1) and (2).
where
d is the thickness of this piece of paper.
Hence, the total resistance
Rtotal can be expressed as:
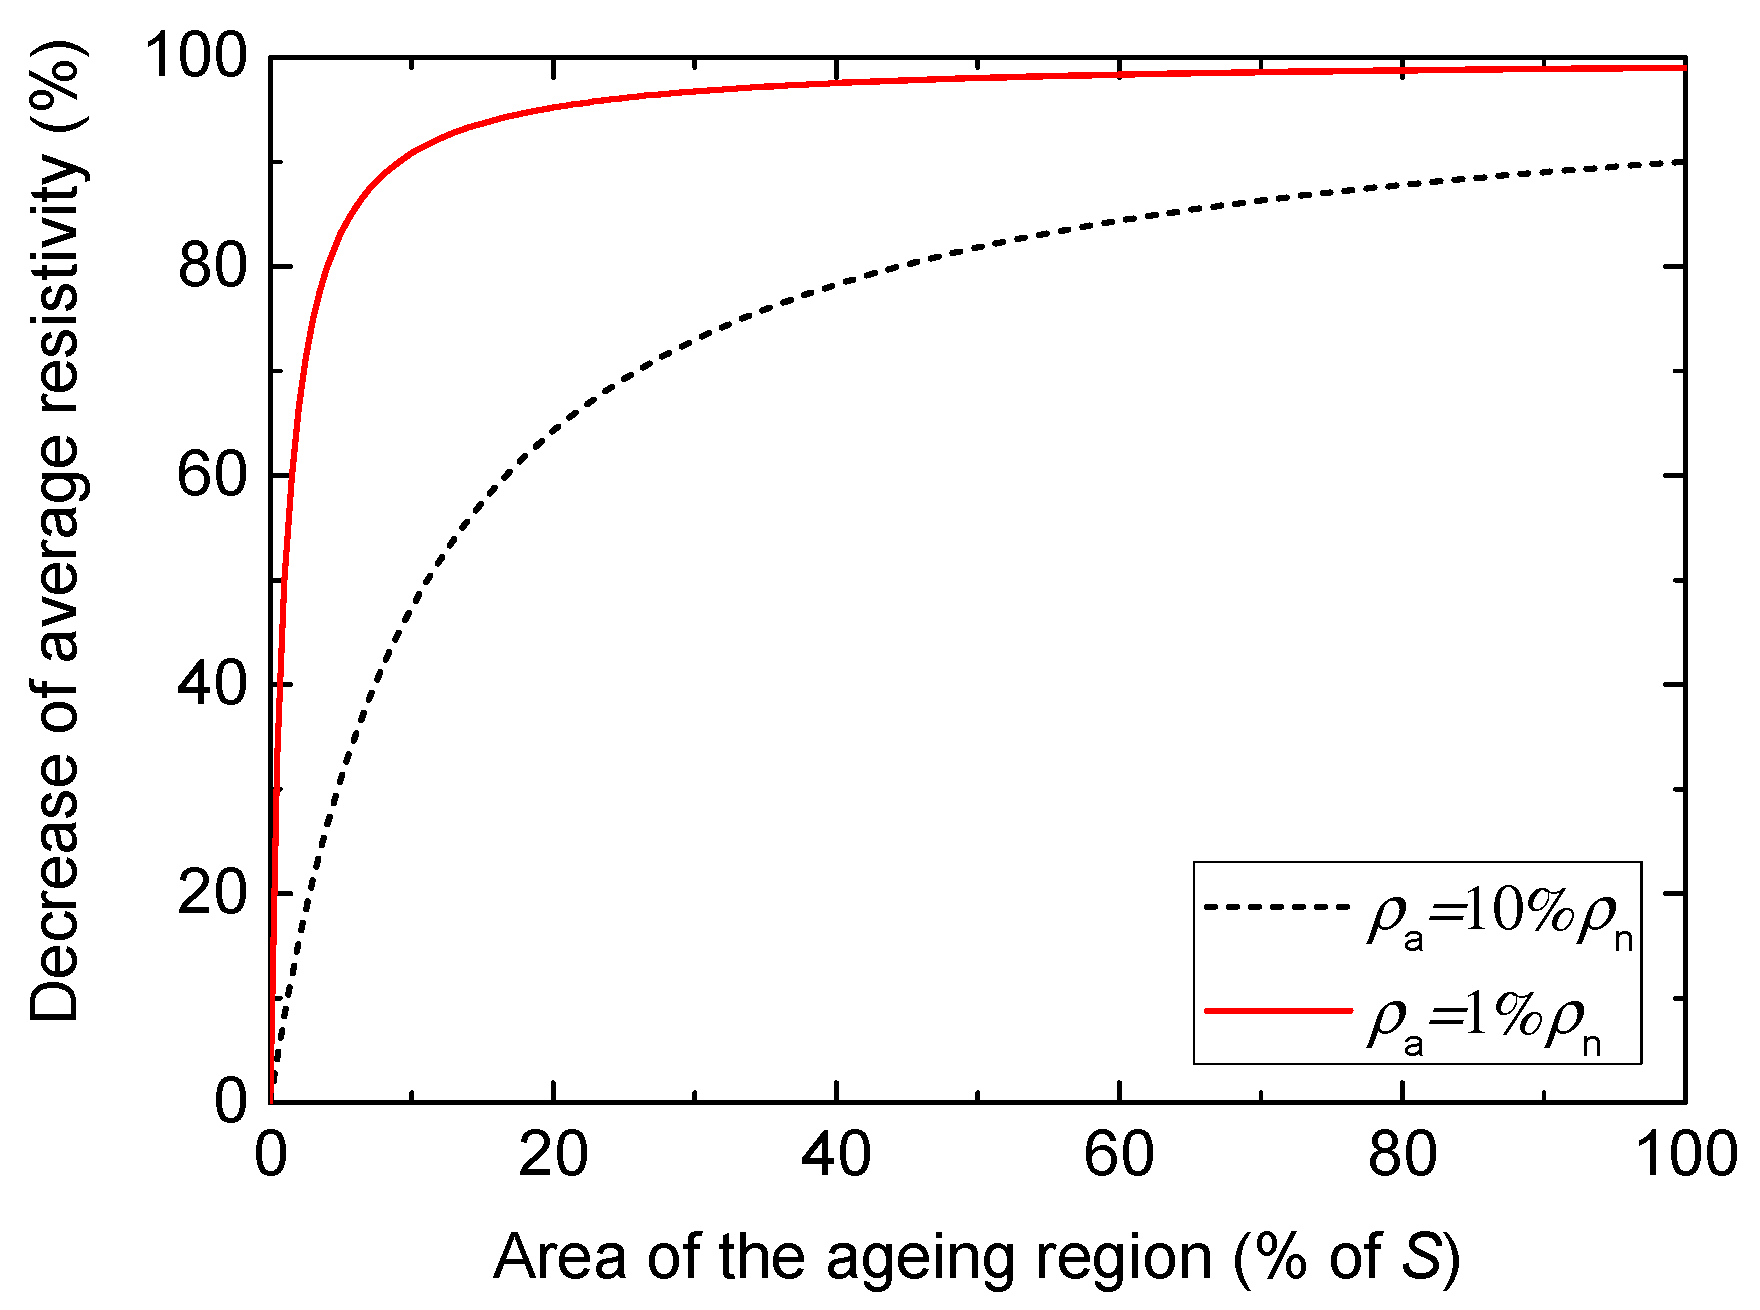
Therefore, the average resistivity of the whole piece of paper can be expressed as:
Figure 4 shows the decrease of the average resistivity with different percentages of the partial ageing region according to (4). It is obvious in
Figure 4 that when
ρa dropped to 1% of
ρn, ageing region with only 10% of the area of the whole piece of paper can reduce the average resistivity by more than 90%. Therefore, even the average resistivity can sensitively reflect partial ageing in a relative larger piece of paper.
Actually, if the electric field applied on the ageing area is stronger than on other regions of paper, the change of average resistivity will be more obvious. Hence, it is even more sensitive for the ageing condition assessment of paper induced by electrical ageing.
3. Iterative Inversion of Paper Resistivity
Like DP measurements, it is destructive to take paper samples from transformers and measure their resistivities. Besides, the taken sample may not from the ageing region, according to the spatial distribution characteristic of paper ageing. Hence it is necessary to obtain the comprehensive resistivity through a non-destructive way.
With known resistivity values of oil and paper, the insulation resistances of transformer under different voltage applying method can be obtained through finite element simulation. When the resistivity of oil has a constant value, there is a fixed functional relationship between the resistivity of paper and insulation resistance:
where
R is the insulation resistance,
ρ is the paper resistivity, and
f is the functional relationship between them.
As mentioned in
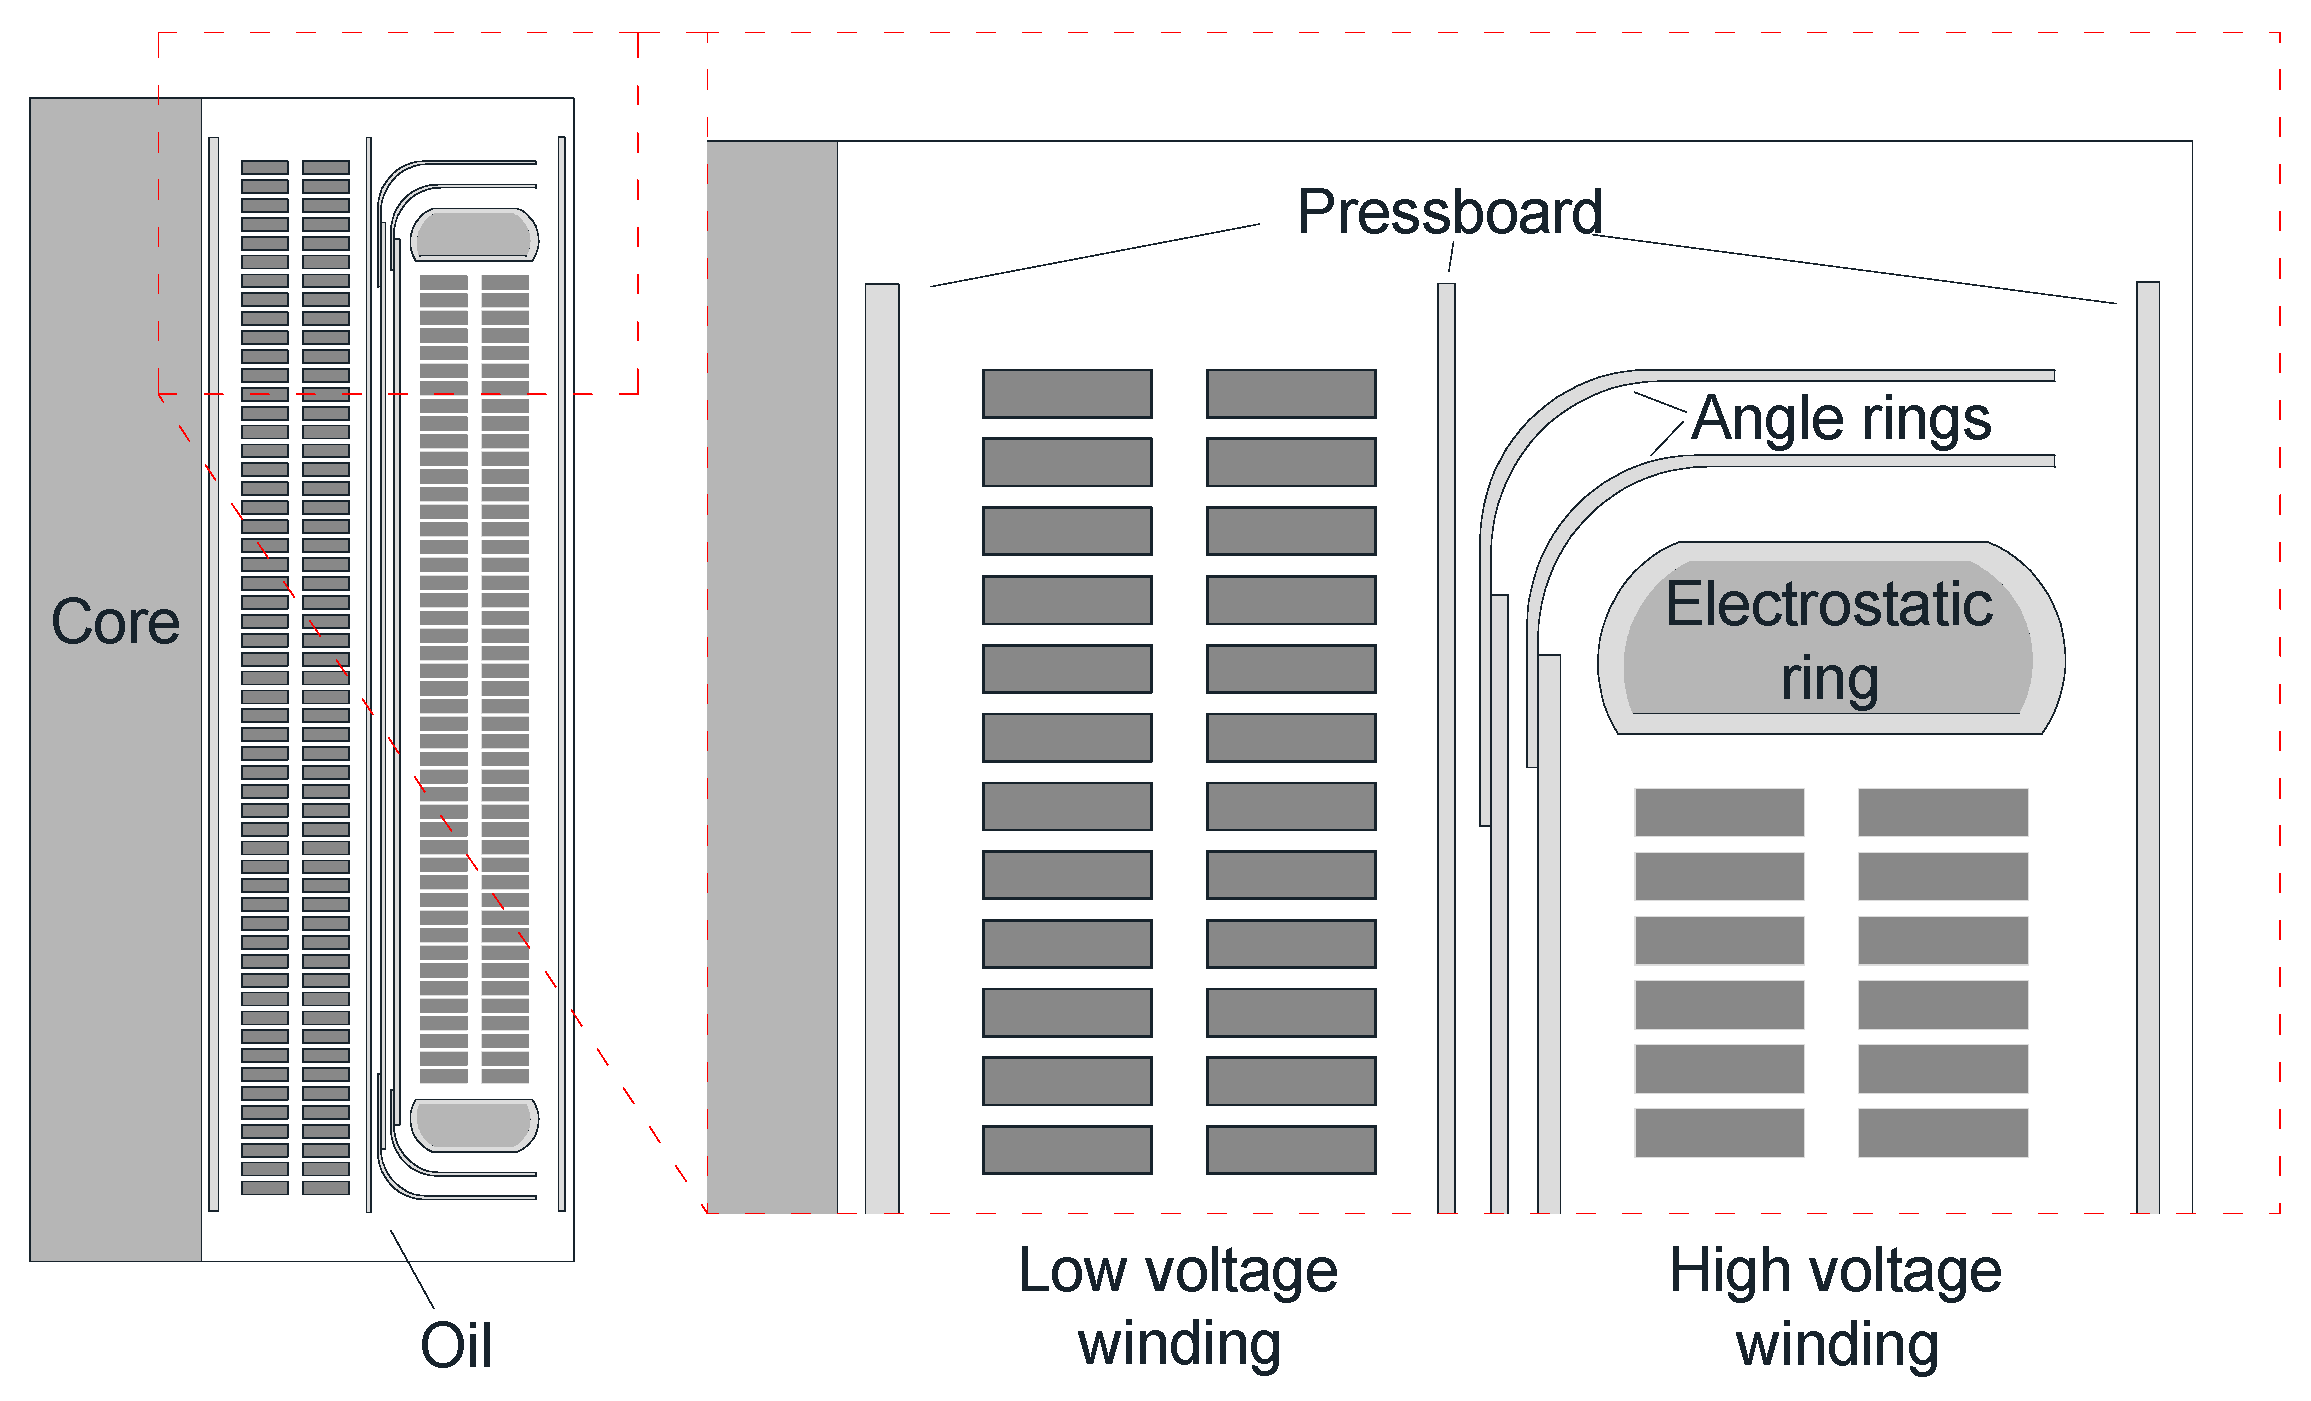
Section 2.2, a change of paper resistivity will induce obvious changes in the measured voltage or current under a DC electric field. Conversely, the electrical quantities of transformer measured under a DC voltage can provide a good reflection of the paper resistivity. To illustrate this regulation, an axisymmetric model of transformer inner insulation structure was built as shown in
Figure 5. The paper covering the windings and electrostatic rings were also considered in this model. By adopting different paper resistivity values, the corresponding insulation resistance results of this model obtained by finite element simulation were determined. During the simulation, the resistivity of oil was set as 10
12 Ω·m. Two typical voltage application methods are considered.
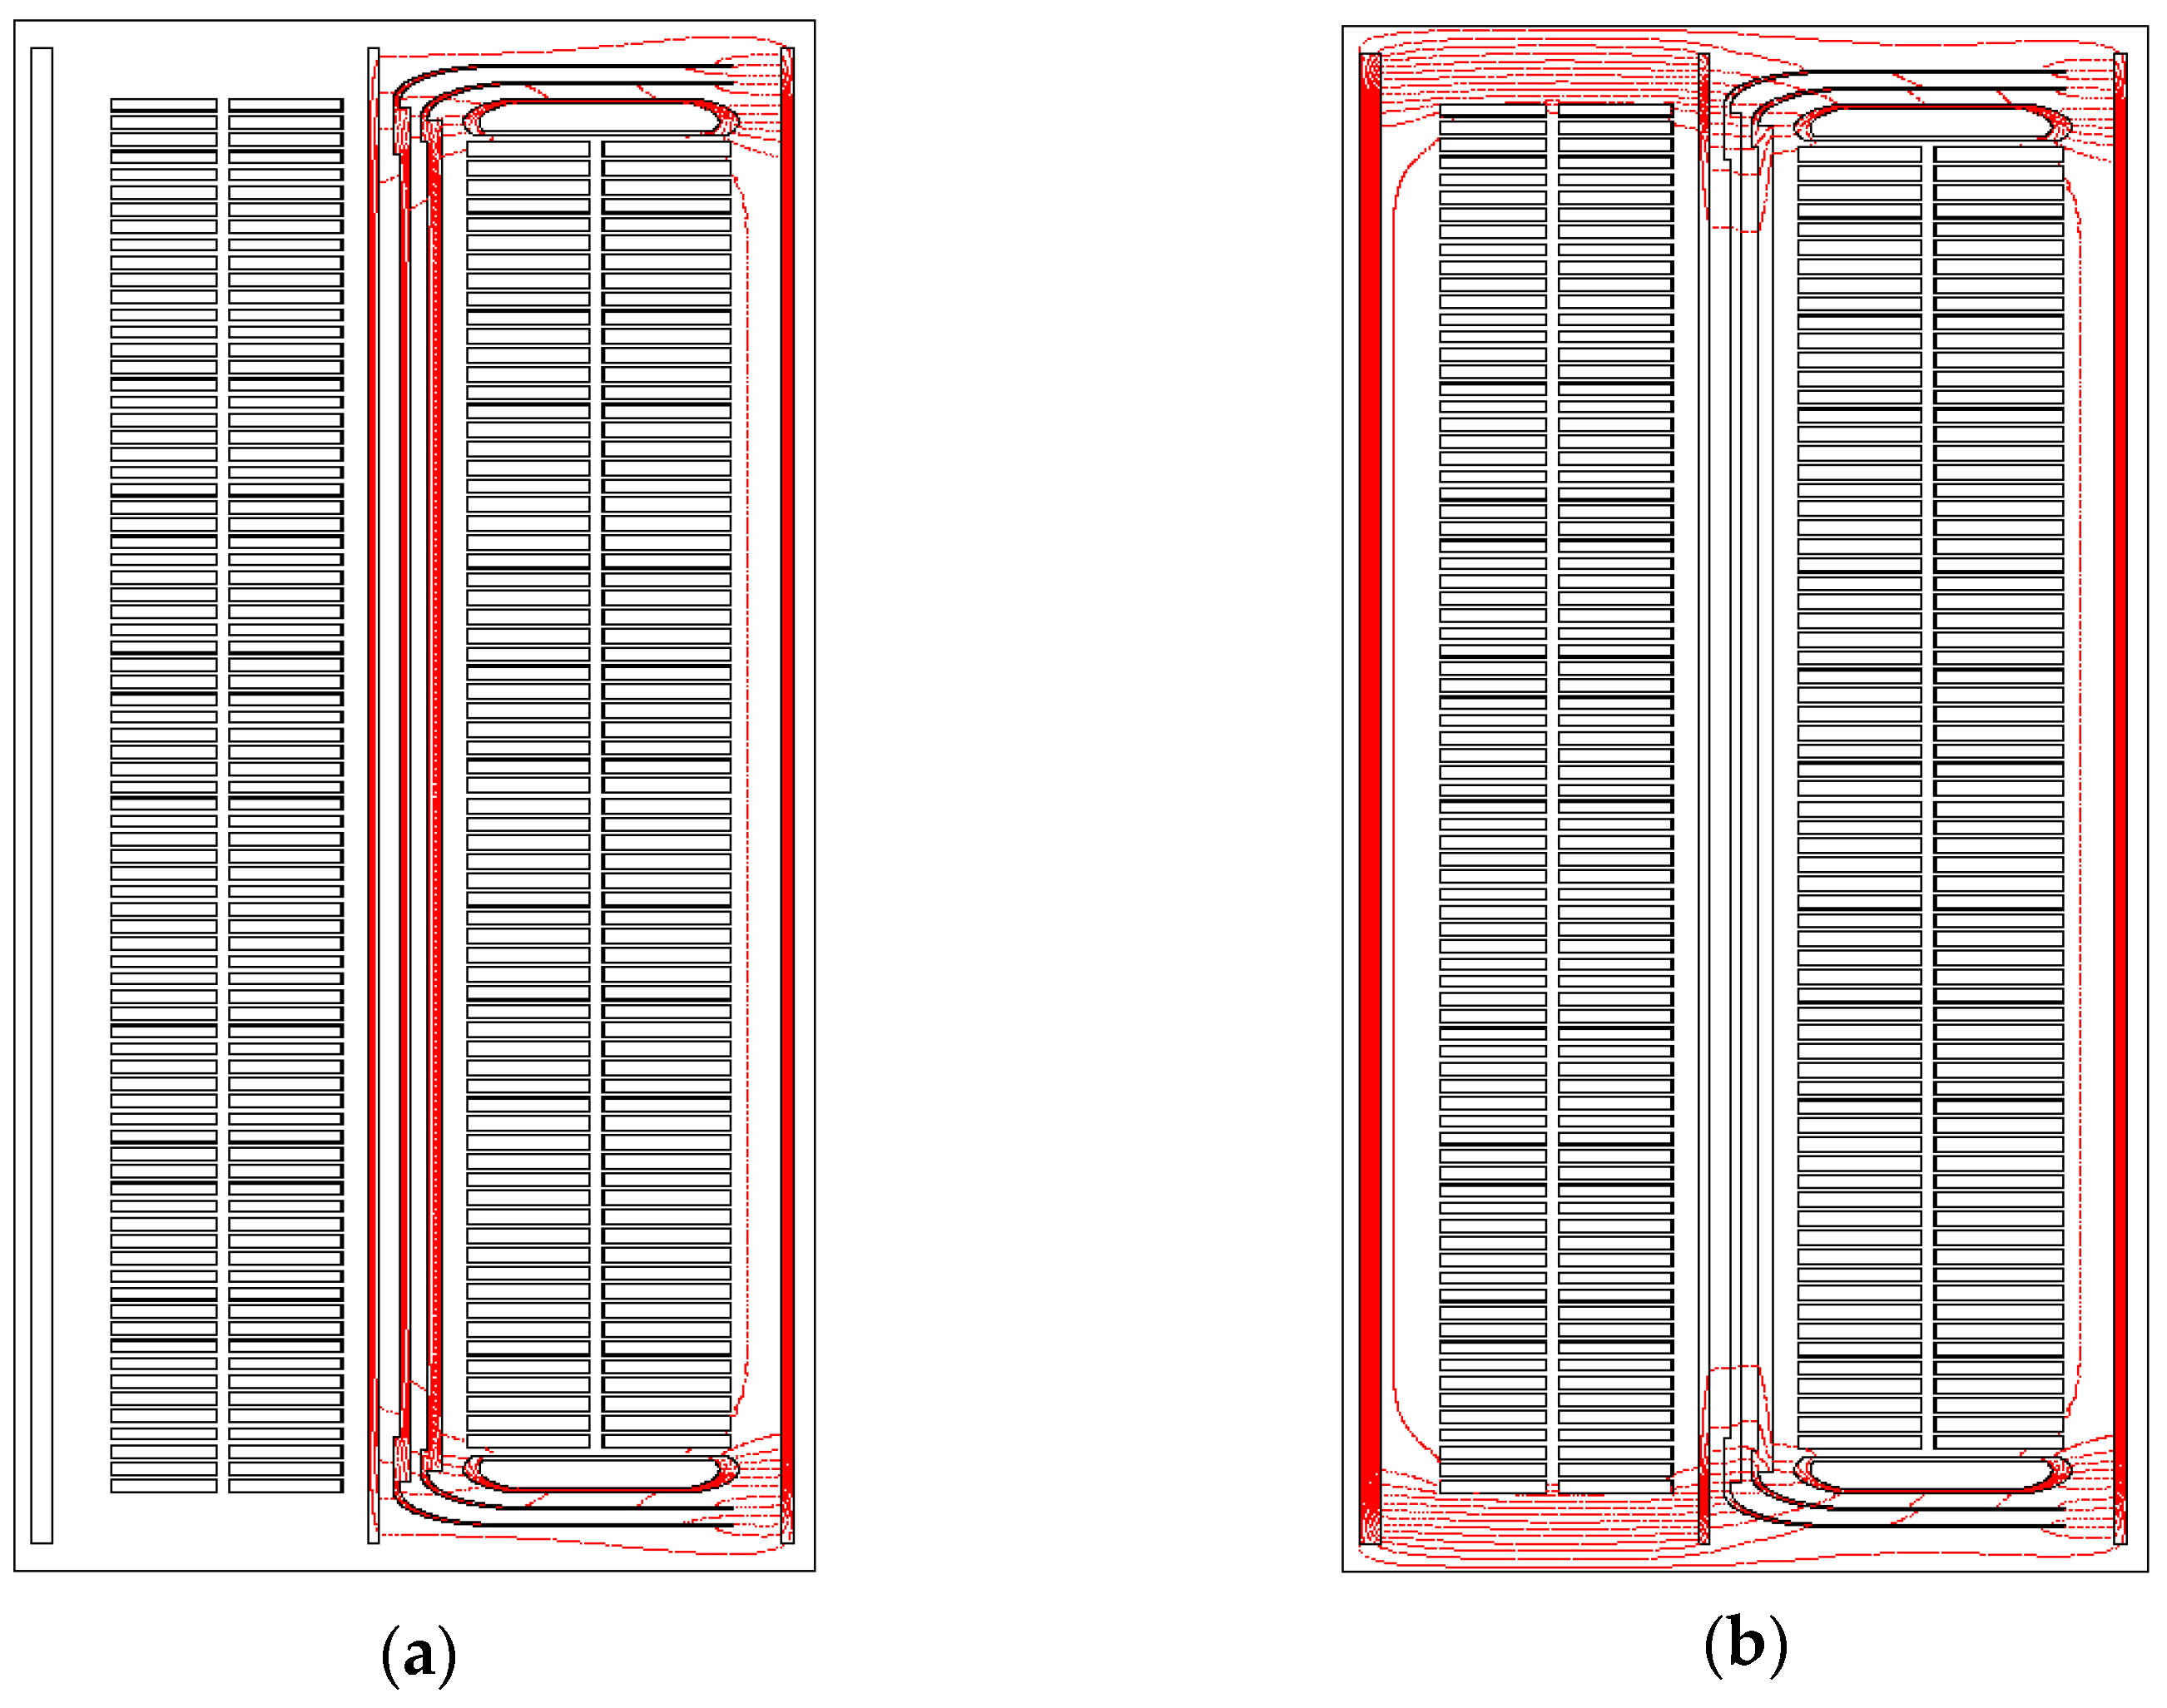
The equipotential lines obtained under the two typical voltage applying methods are shown as red lines in
Figure 6. Most of the equipotential lines gathered inside the oil-impregnated paper. This distribution characteristic of equipotential lines proves the preceding analysis that the electric field in oil impregnated paper is much stronger than that in oil under DC voltage. Besides, the main parts of oil-impregnated paper surfaces were parallel to the equipotential lines, which verified the theory that certain area of oil impregnated paper can be regarded as some smaller areas of paper connected in parallel with each other, as stated in
Section 2.2.
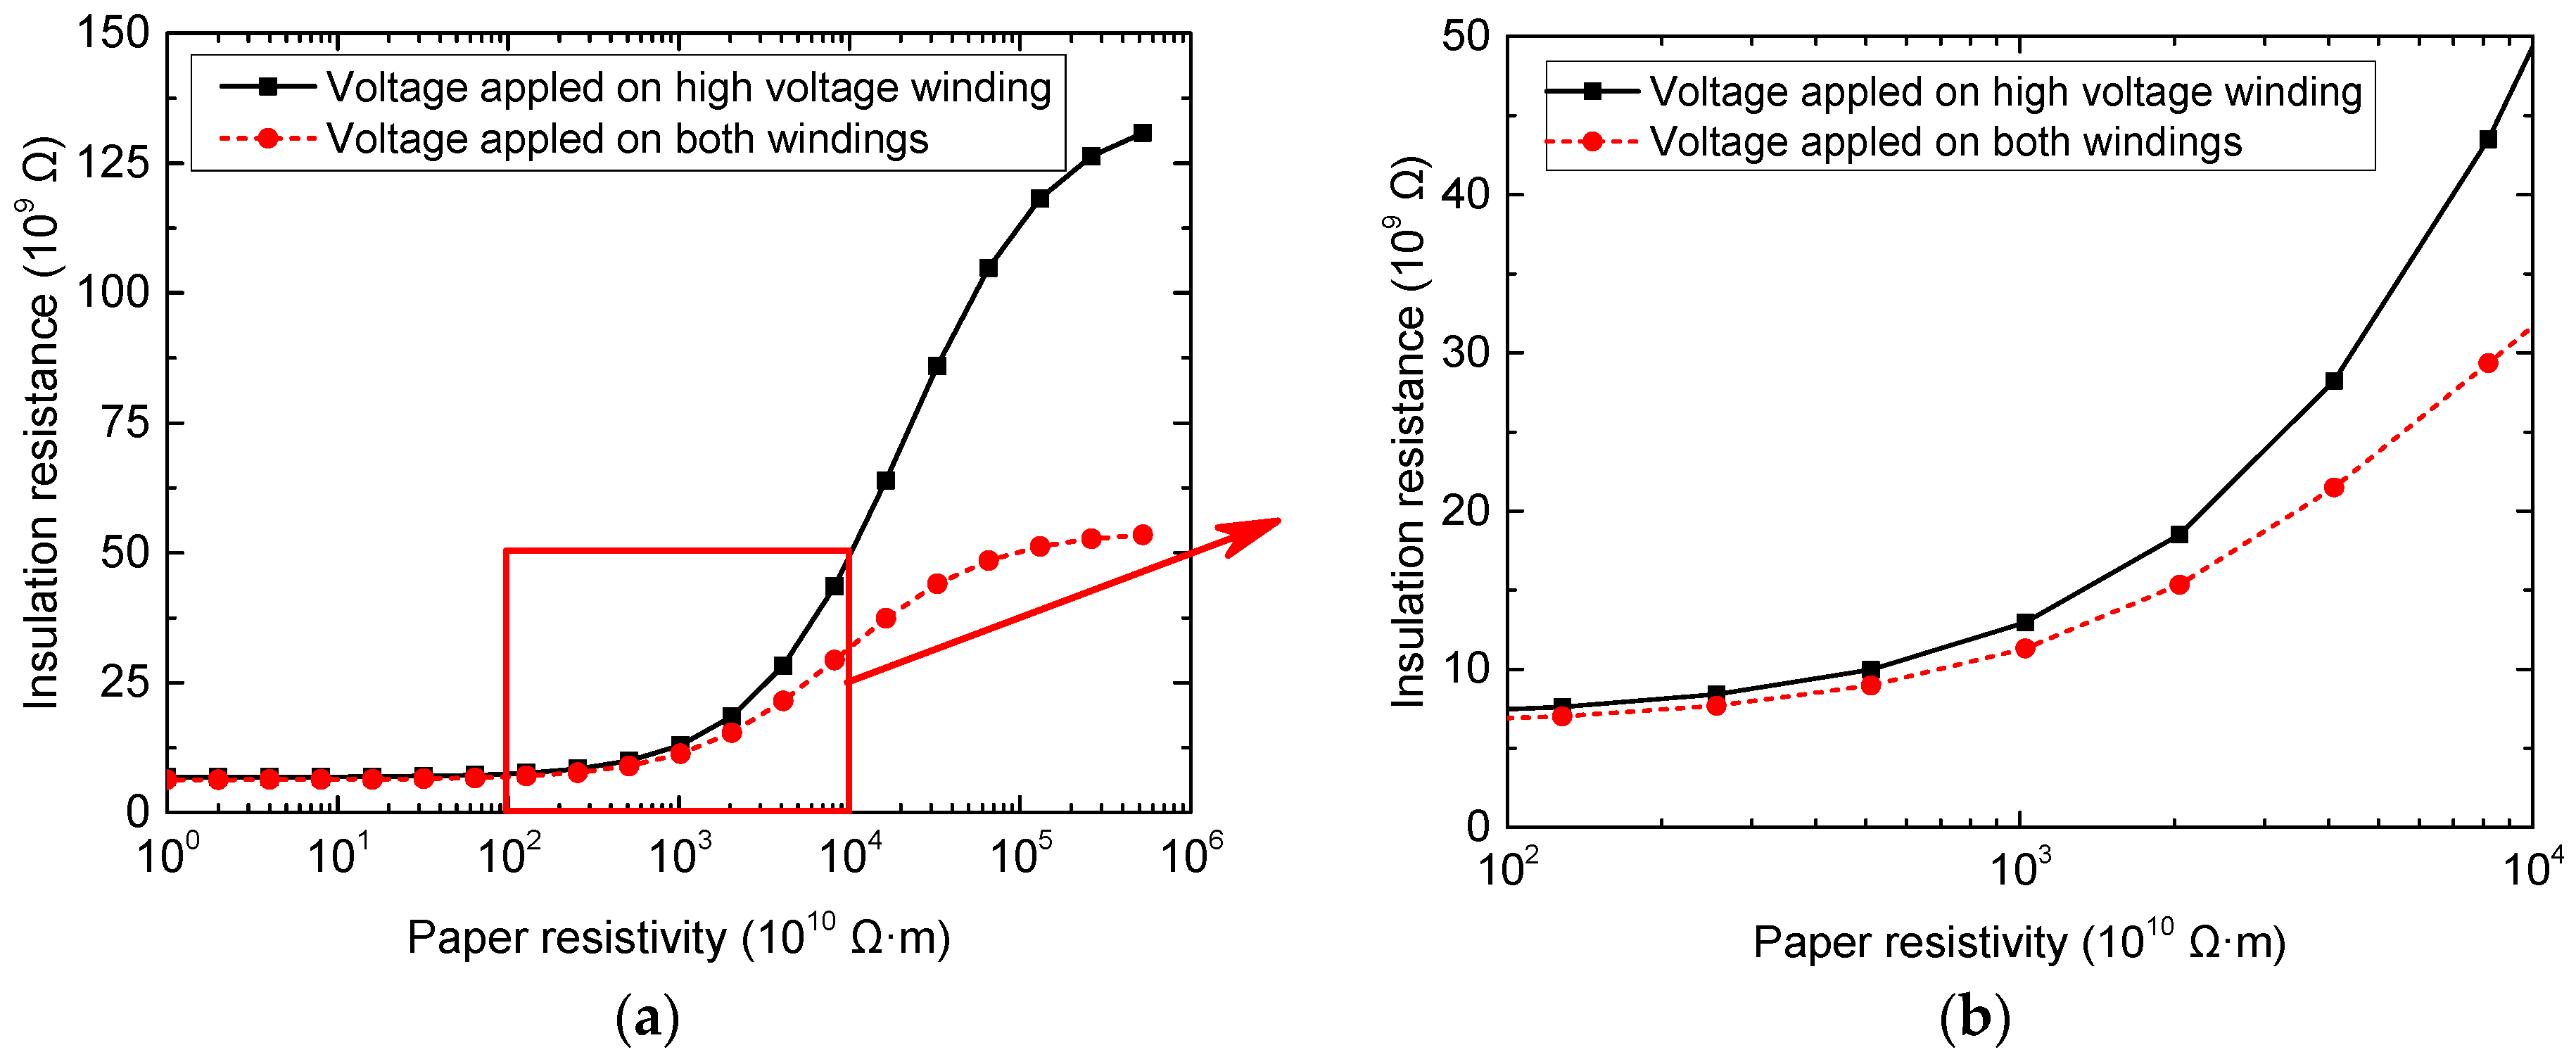
Figure 7 shows the calculated insulation resistance results with different paper resistivity values. It is demonstrated that the relationship between
R and
ρ is nonlinear. As the function
f is monotonically continuous, as shown in
Figure 7, an approximate value of
ρ can be obtained through iterative calculation. Although the analytic expression of
f is hard to obtain because of the complex insulation structure, this calculation process can be conducted through numerical simulation.
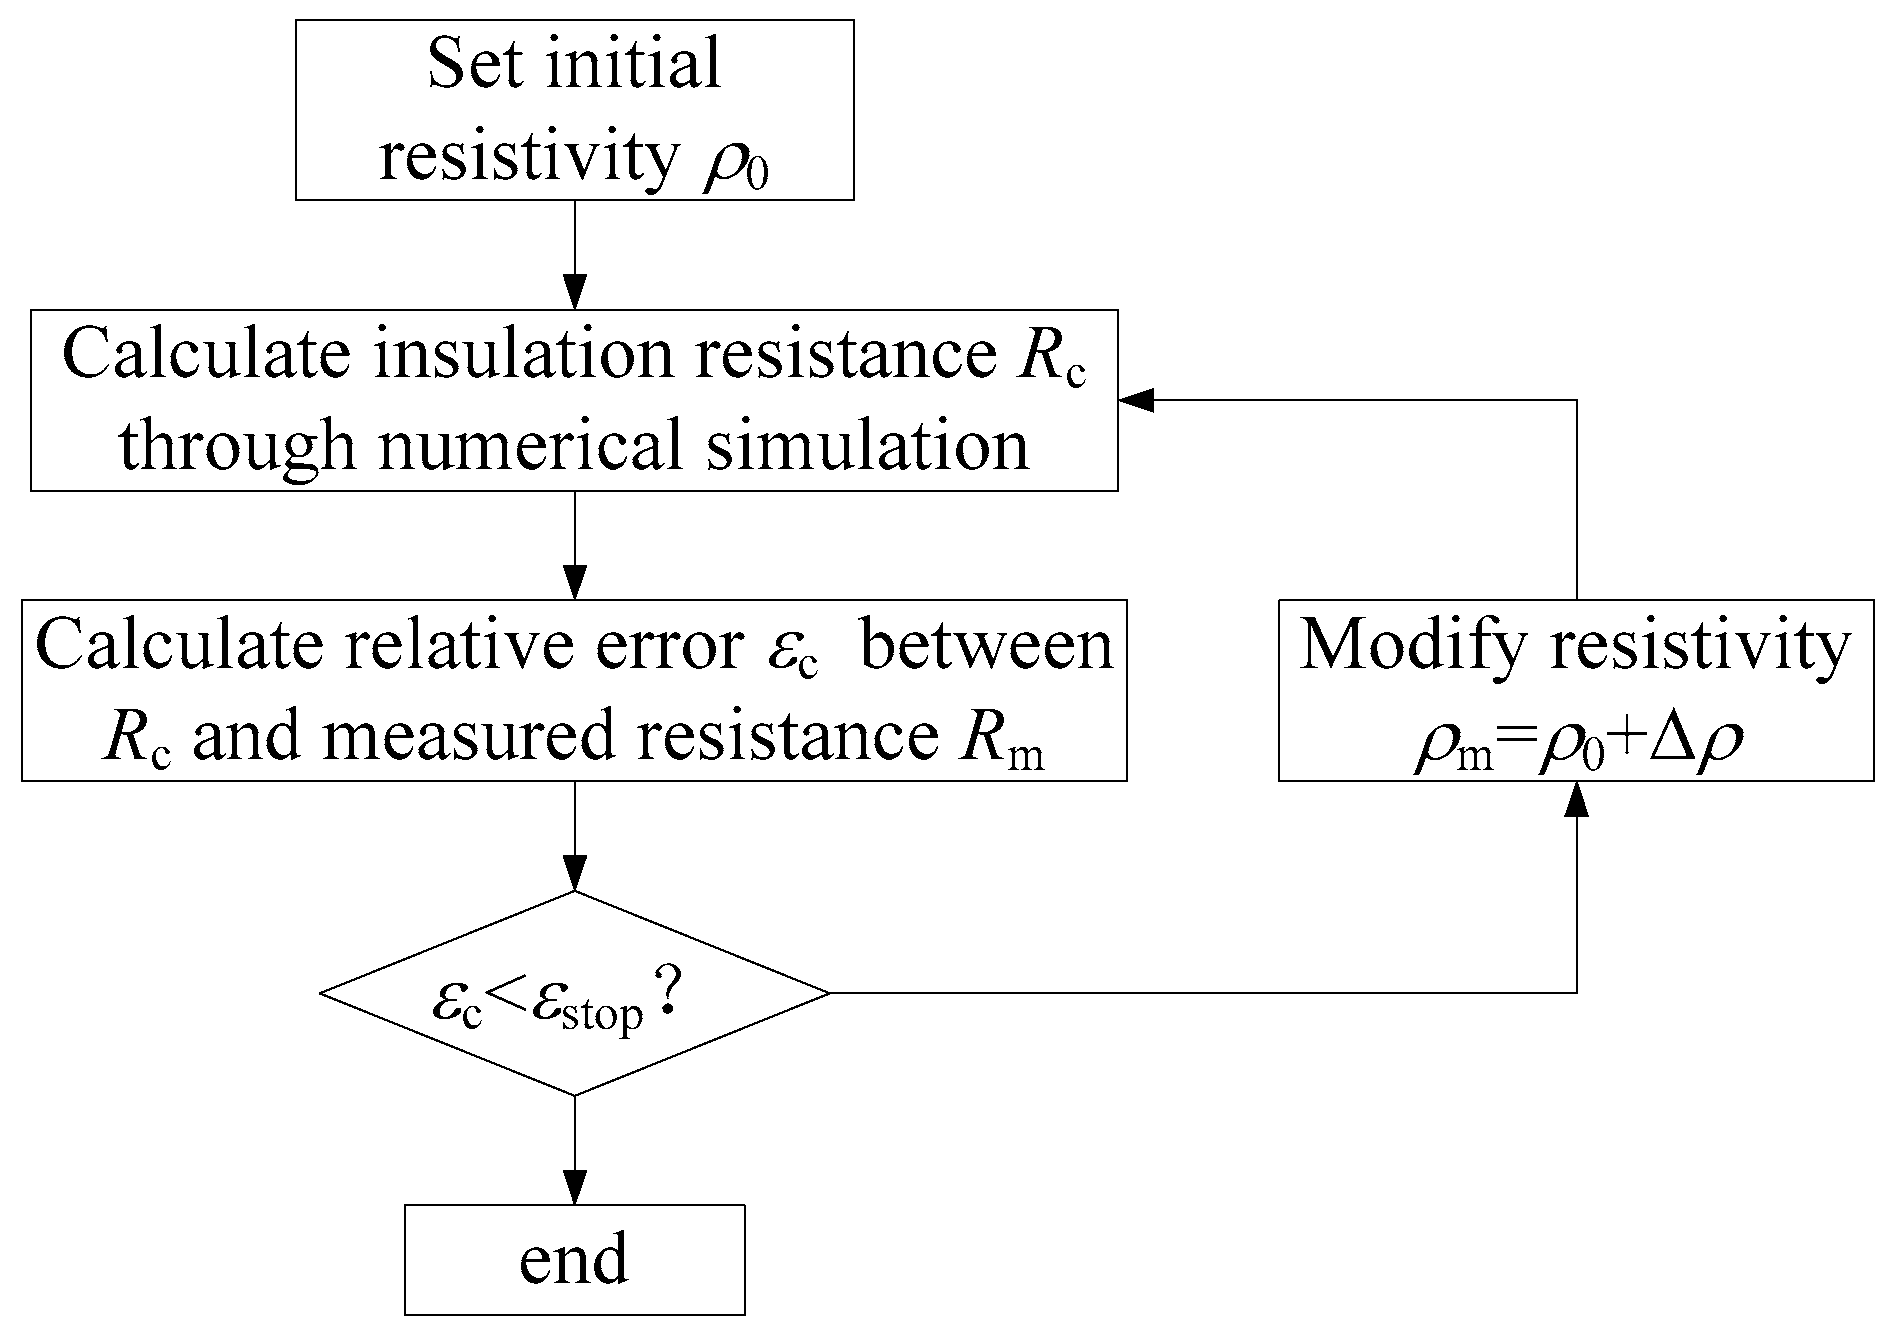
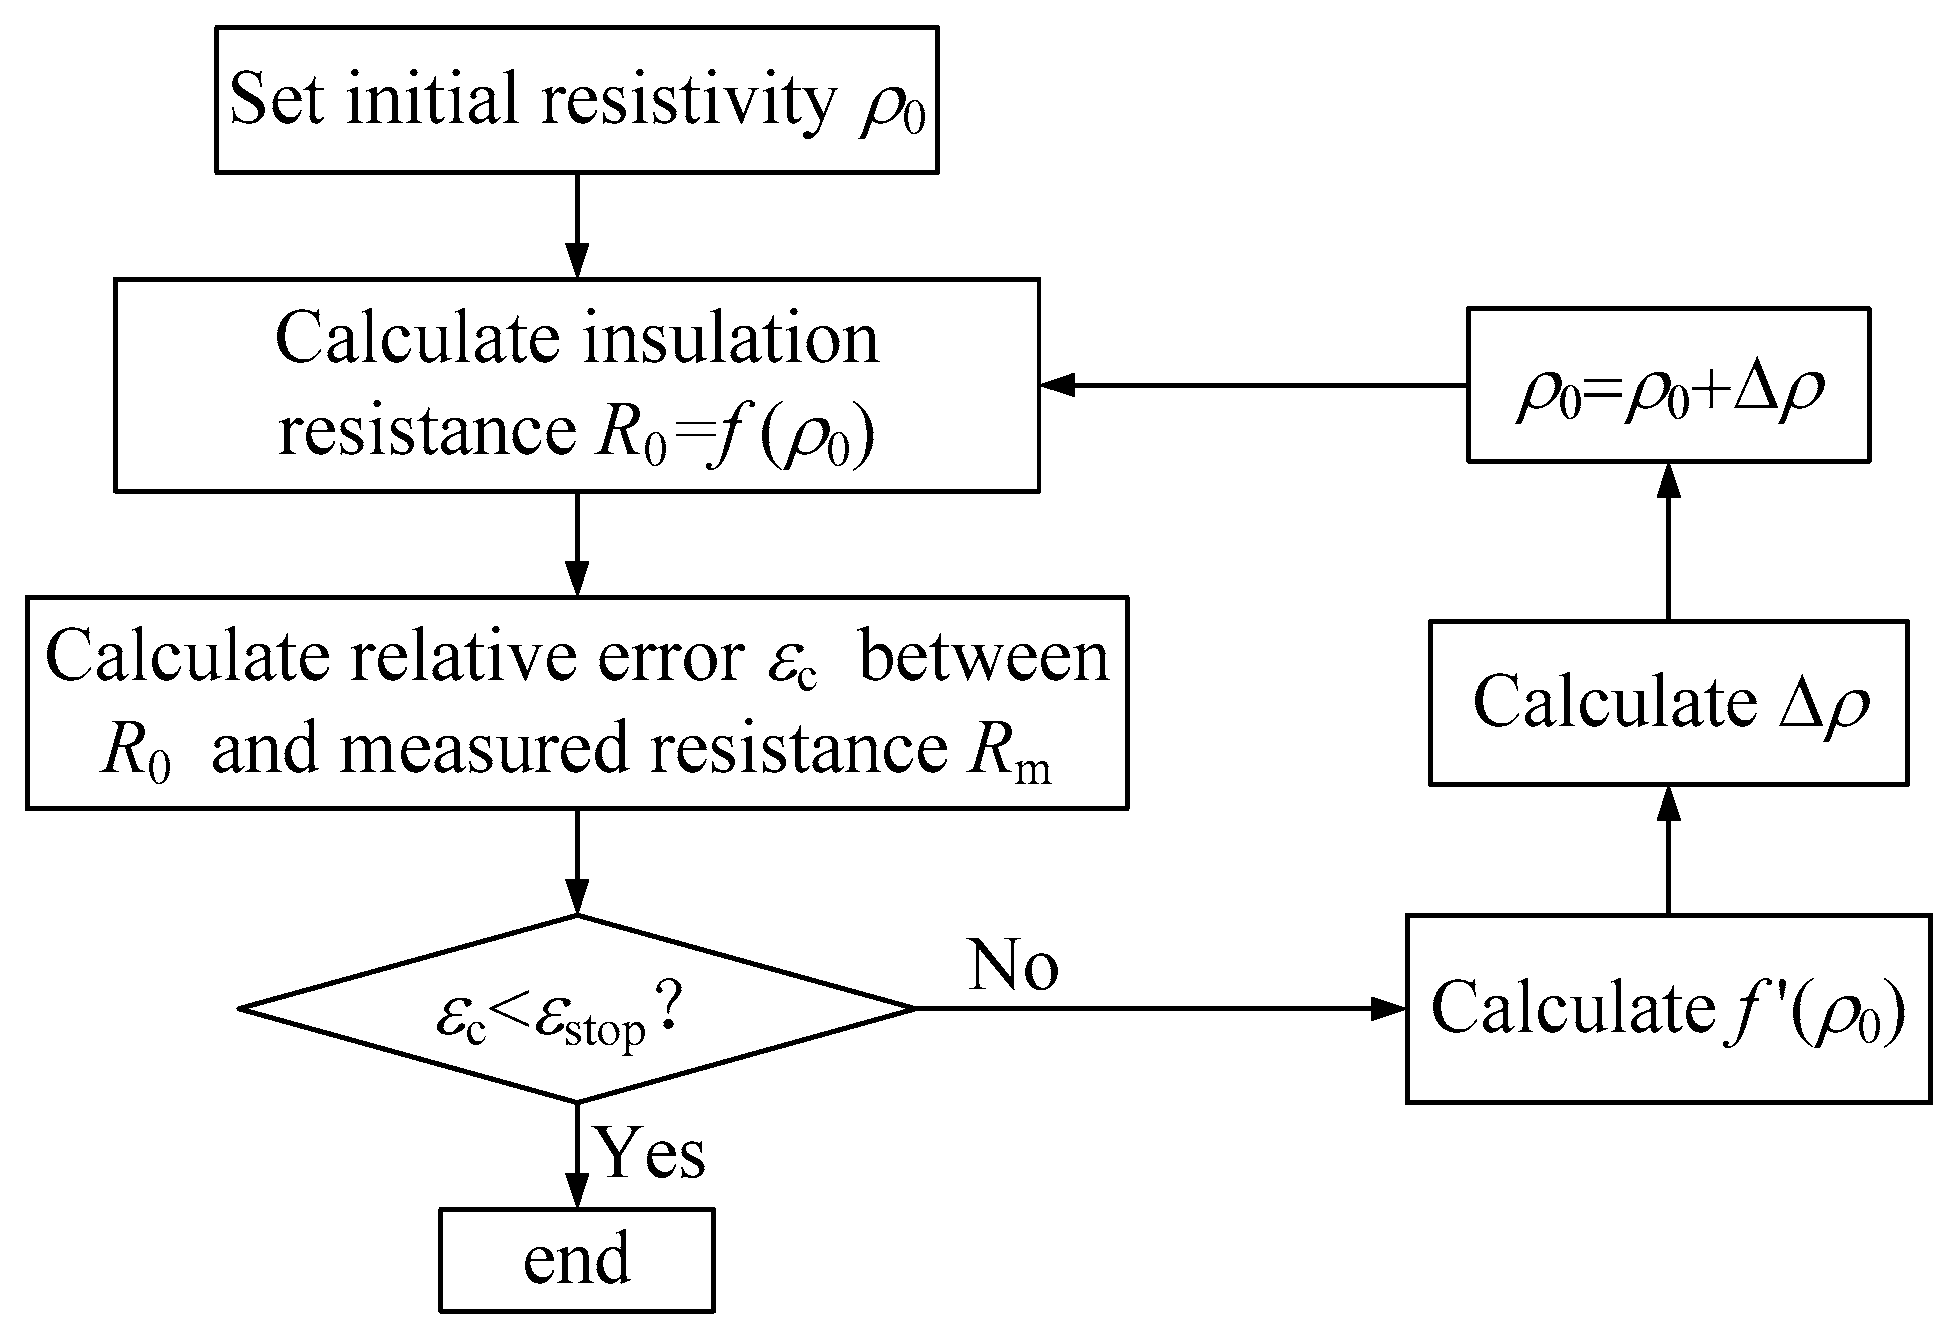
Figure 8 shows the basic idea of this iterative calculation.
Figure 6 also demonstrates that the function between
R and
ρ is also differentiable. For the iterative calculation of this kind of function, there are two typical methods, namely the bisection method and Newton’s method.
3.1. Bisection Method
The bisection method is a solution-finding method that repeatedly bisects an interval and then selects the subinterval in which the solution must lies. The basic idea of this method is to minimize the interval which contains the solution.
For a transformer with known inner insulation structure, as well as the measured insulation resistance Rm and oil resistivity, the iteration of its paper resistivity follows the steps below:
- (1)
Set the initial interval [ρmin, ρmax];
To ensure the actual paper resistivity ρ belongs to this interval, Insulation resistance Rmax and Rmin are calculated using ρmax and ρmin separately. According to the monotone increasing relationship between paper resistivity and insulation resistance, ρ [ρmin, ρmax] is equivalent to Rm [Rmin, Rmax]. Hence, if Rm [Rmin, Rmax], then the initial interval [ρmin, ρmax] is proper. Otherwise, enlarge the interval [ρmin, ρmax] until [Rmin, Rmax] meets the requirement.
- (2)
Calculate the middle point ρa of [ρmin, ρmax]. ρa = (ρmax + ρmin)/2.
Firstly, calculate corresponding insulation Ra, using ρa. Then, calculate the relative error εc between Ra and Rm. If εc is smaller than the preset termination error εstop, then return ρa and stop iterating. Otherwise, turn to next step.
- (3)
Compare Ra and Rm.
According to the compare result between Ra and Rm, if Ra is larger than Rm, set ρmax equal to ρa and turn to Step 2, else, set ρmin equal to ρa and turn to Step 2. A sufficiently precise value of ρ will be obtained by performing the above steps until εc is smaller than εstop.
3.2. Newton’s Method
When
f is differentiable, it can be expanded by Taylor series at
ρ0 as:
When ignoring the infinitesimal of higher order
o[(
ρ − ρ0)
2], the correction value Δ
ρ of
ρ0 can be calculated according to the following equation:
Hence, with known insulation resistance
R =
Rm, the corrected paper resistivity
ρc can be obtained by:
Sufficiently precise value will be obtained by repeatedly calculating the corrected value according to (5). This is the main idea of Newton’s method.
For a transformer, the analytic expression of
f is hard to obtain. Hence differential calculation process is approximately substitute by difference calculation process as follows:
where
δρ is a tiny increase of
ρ. The flowchart of Newton’s method is shown as
Figure 9.
3.3. Comparison of Iterative Methods
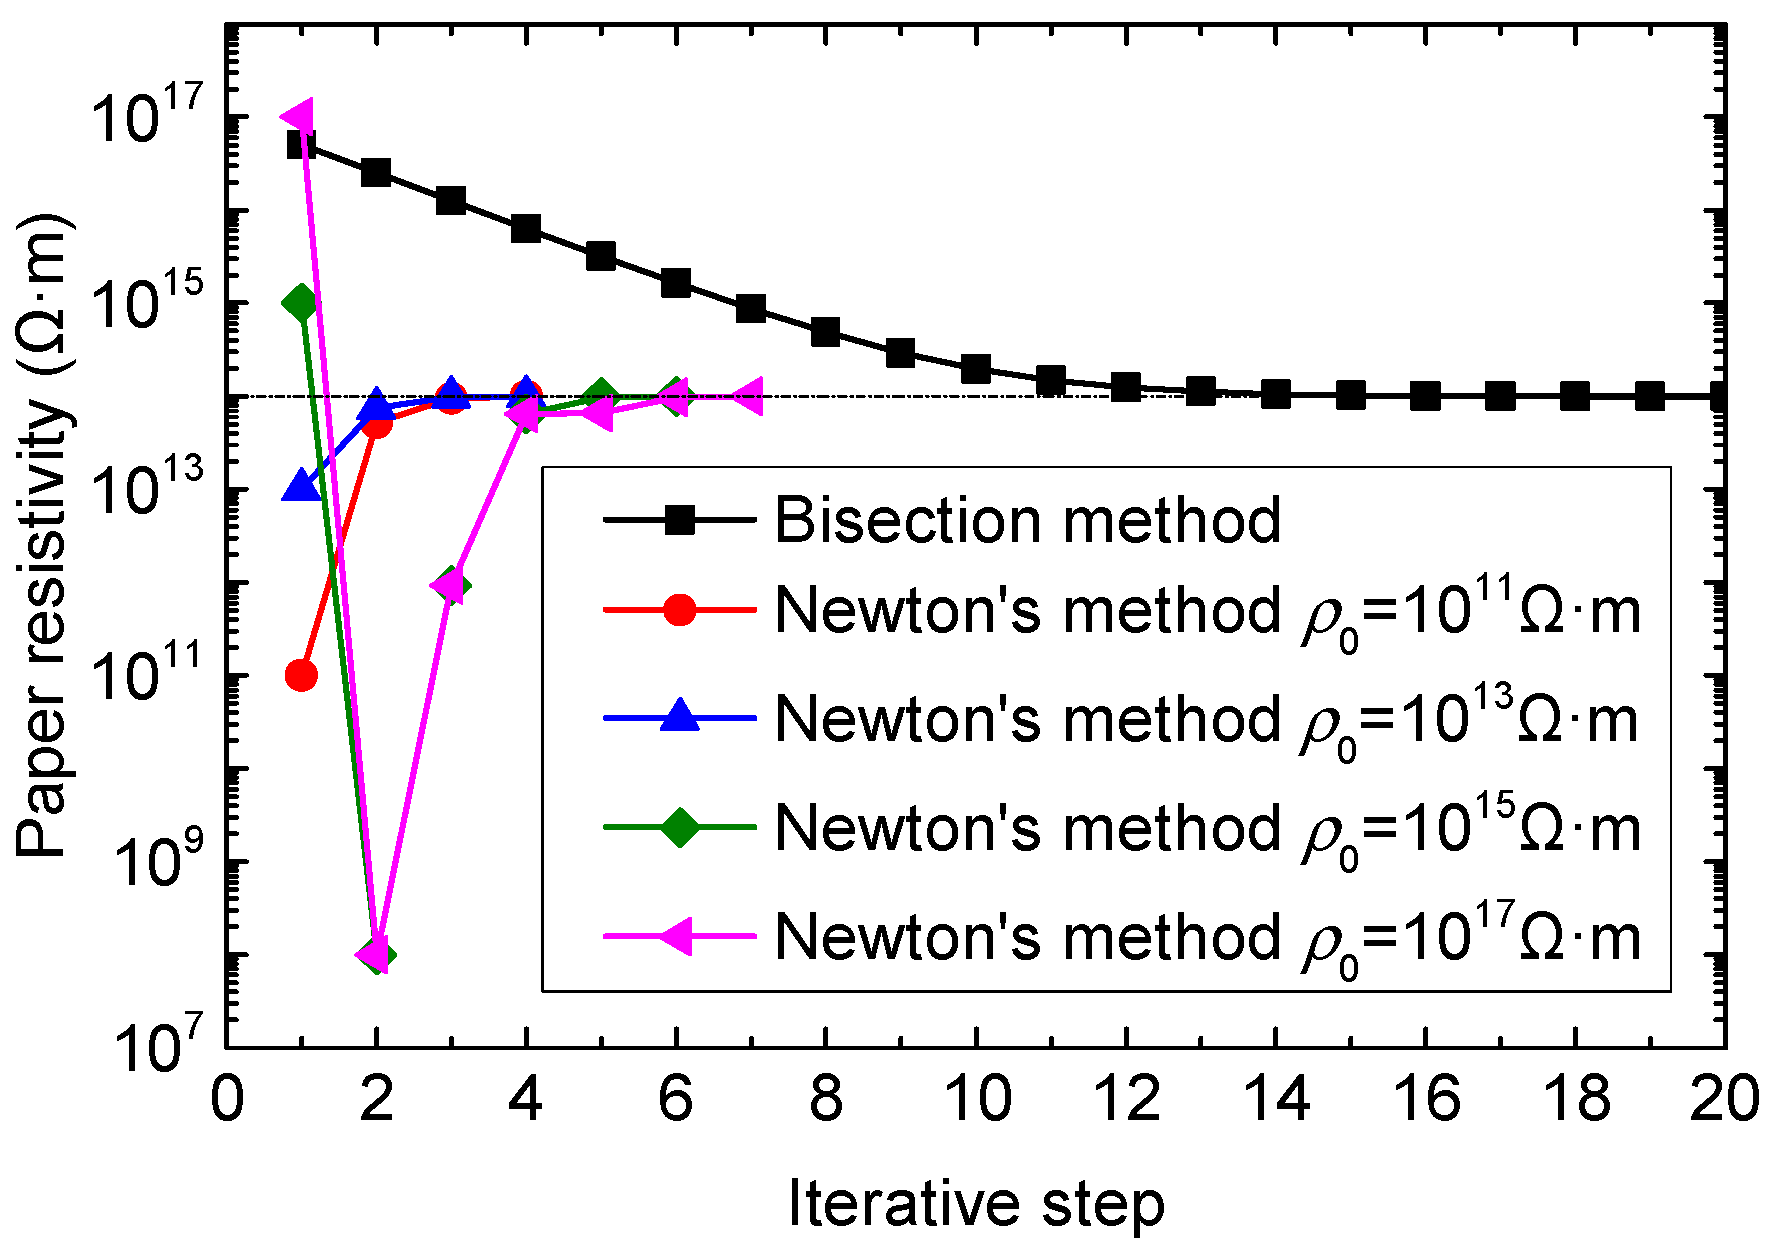
Figure 10 demonstrates the calculation results of each iterative step by using the bisection method and Newton’s method separately. The axisymmetric model of a transformer in
Figure 4 is taken as the object. The oil resistivity is 1 × 10
12 Ω·m, paper resistivity is 1 × 10
14 Ω·m. Both windings are connected and loaded with a high voltage while the core and the shell of the transformer are grounded, when obtaining the insulation resistance. The corresponding insulation resistance is 3.175 × 10
10 Ω. This value is taken as input during the iterative calculation. In the bisection method, the initial interval of paper resistivity is [1 × 10
11 Ω·m, 1 × 10
17 Ω·m]. In Newton's method, the values of initial resistivity
ρ0 are set as 10
11 Ω·m, 10
13 Ω·m, 10
15 Ω·m, 10
17 Ω·m. The termination errors of both methods are all 0.1%.
For the iterative process, the bisection method converges more stably, while the results of Newton’s method oscillate strongly. Besides, the iterative process of Newton’s method is significantly influenced by the initial value of the iteration. Nevertheless, Newton’s method has a much higher convergence speed than the bisection method. In
Figure 10, it takes only 4 or 5 steps to reach a relative error lower than the termination error, while it takes as many as 20 steps for the bisection method.
According to the comparison, Newton’s method is the first option for paper resistivity iteration for a transformer, in order to minimize the calculation time. Bisection can be regard as a complementary way to find a better initial value when Newton’s method does not converge.
4. Iterative Inversion of Paper Resistivity in Different Regions
As mentioned before, the ageing of cellulose paper is not uniform. Hence, if the paper in transformer is divided into different regions, and corresponding paper resistivities are calculated separately, the accuracy will be improved to a considerable extent.
Usually more than one insulation resistance value can be obtained in practice. These insulation resistance values are obtained under different voltage application methods according to the structure of the transformer. These voltage application methods include: (i) High voltage windings are loaded with high voltage, while low voltage windings, core and shell of the transformer are grounded; (ii) low voltage windings are loaded with a high voltage, while the high voltage windings, core and shell of the transformer are grounded; (iii) both windings are connected and loaded with a high voltage while the core and shell of the transformer are grounded; etc.
With these different voltage application methods, the corresponding relationships between paper resistivity and insulation resistance can be built according to numerical simulation:
In (10) R1, R2, ..., Rn are the insulation resistance values obtained using different voltage application methods, and f1, f2, ..., fn, are the corresponding relationships between the paper resistivity and insulation resistance.
In a transformer, paper resistivity and insulation resistance increase monotonically, as demonstrated before. Besides, the paper resistivity values in different regions have different contributions to the insulation resistance values, under different voltage application methods. Hence with
n insulation resistance values obtained from different voltage applying methods,
n paper resistivity values in different regions can be obtained from the following equations in theory. In each region, the resistivity of paper is assumed to be uniform:
For the iterative solution of nonlinear equations, the bisection method is too complicated and the advantage of Newton’s method is more obvious. After expanding (11) by Taylor series at preset initial paper resistivity values (
ρ10,
ρ20, ···,
ρn0), ignoring the infinitesimals of higher order, and transforming it into matrix form, the following equation can be obtained:
where:
Δρ1 = ρ1 − ρ10; Δρ2 = ρ2 − ρ20; ...; Δρn = ρn − ρn0;
ΔR1 = R1m − f1(ρ10, ρ20, ..., ρn0); ΔR2 = R2m − f2(ρ10, ρ20, ..., ρn0); ...; ΔRn = Rnm − fn(ρ10, ρ20, ..., ρn0).
J is the Jacobian matrix expressed as:
Like (9), each element of
J is approximately obtained by a difference calculation process. For example:
where
δρ1 is a tiny increase of
ρ1.
By solving (13), the correction values Δρ1, Δρ2, ..., Δρn for the preset paper resistivity values (ρ10, ρ20, ..., ρn0) can be obtained. Hence, the paper resistivity of each region is updated. Based on these updated paper resistivity values, corresponding insulation resistance values can be calculated, to compare with the measured values. Accurate paper resistivity values of each region can be reached by repeatedly updating the paper resistivity of each region until all the corresponding insulation resistance values are close enough to the given values.
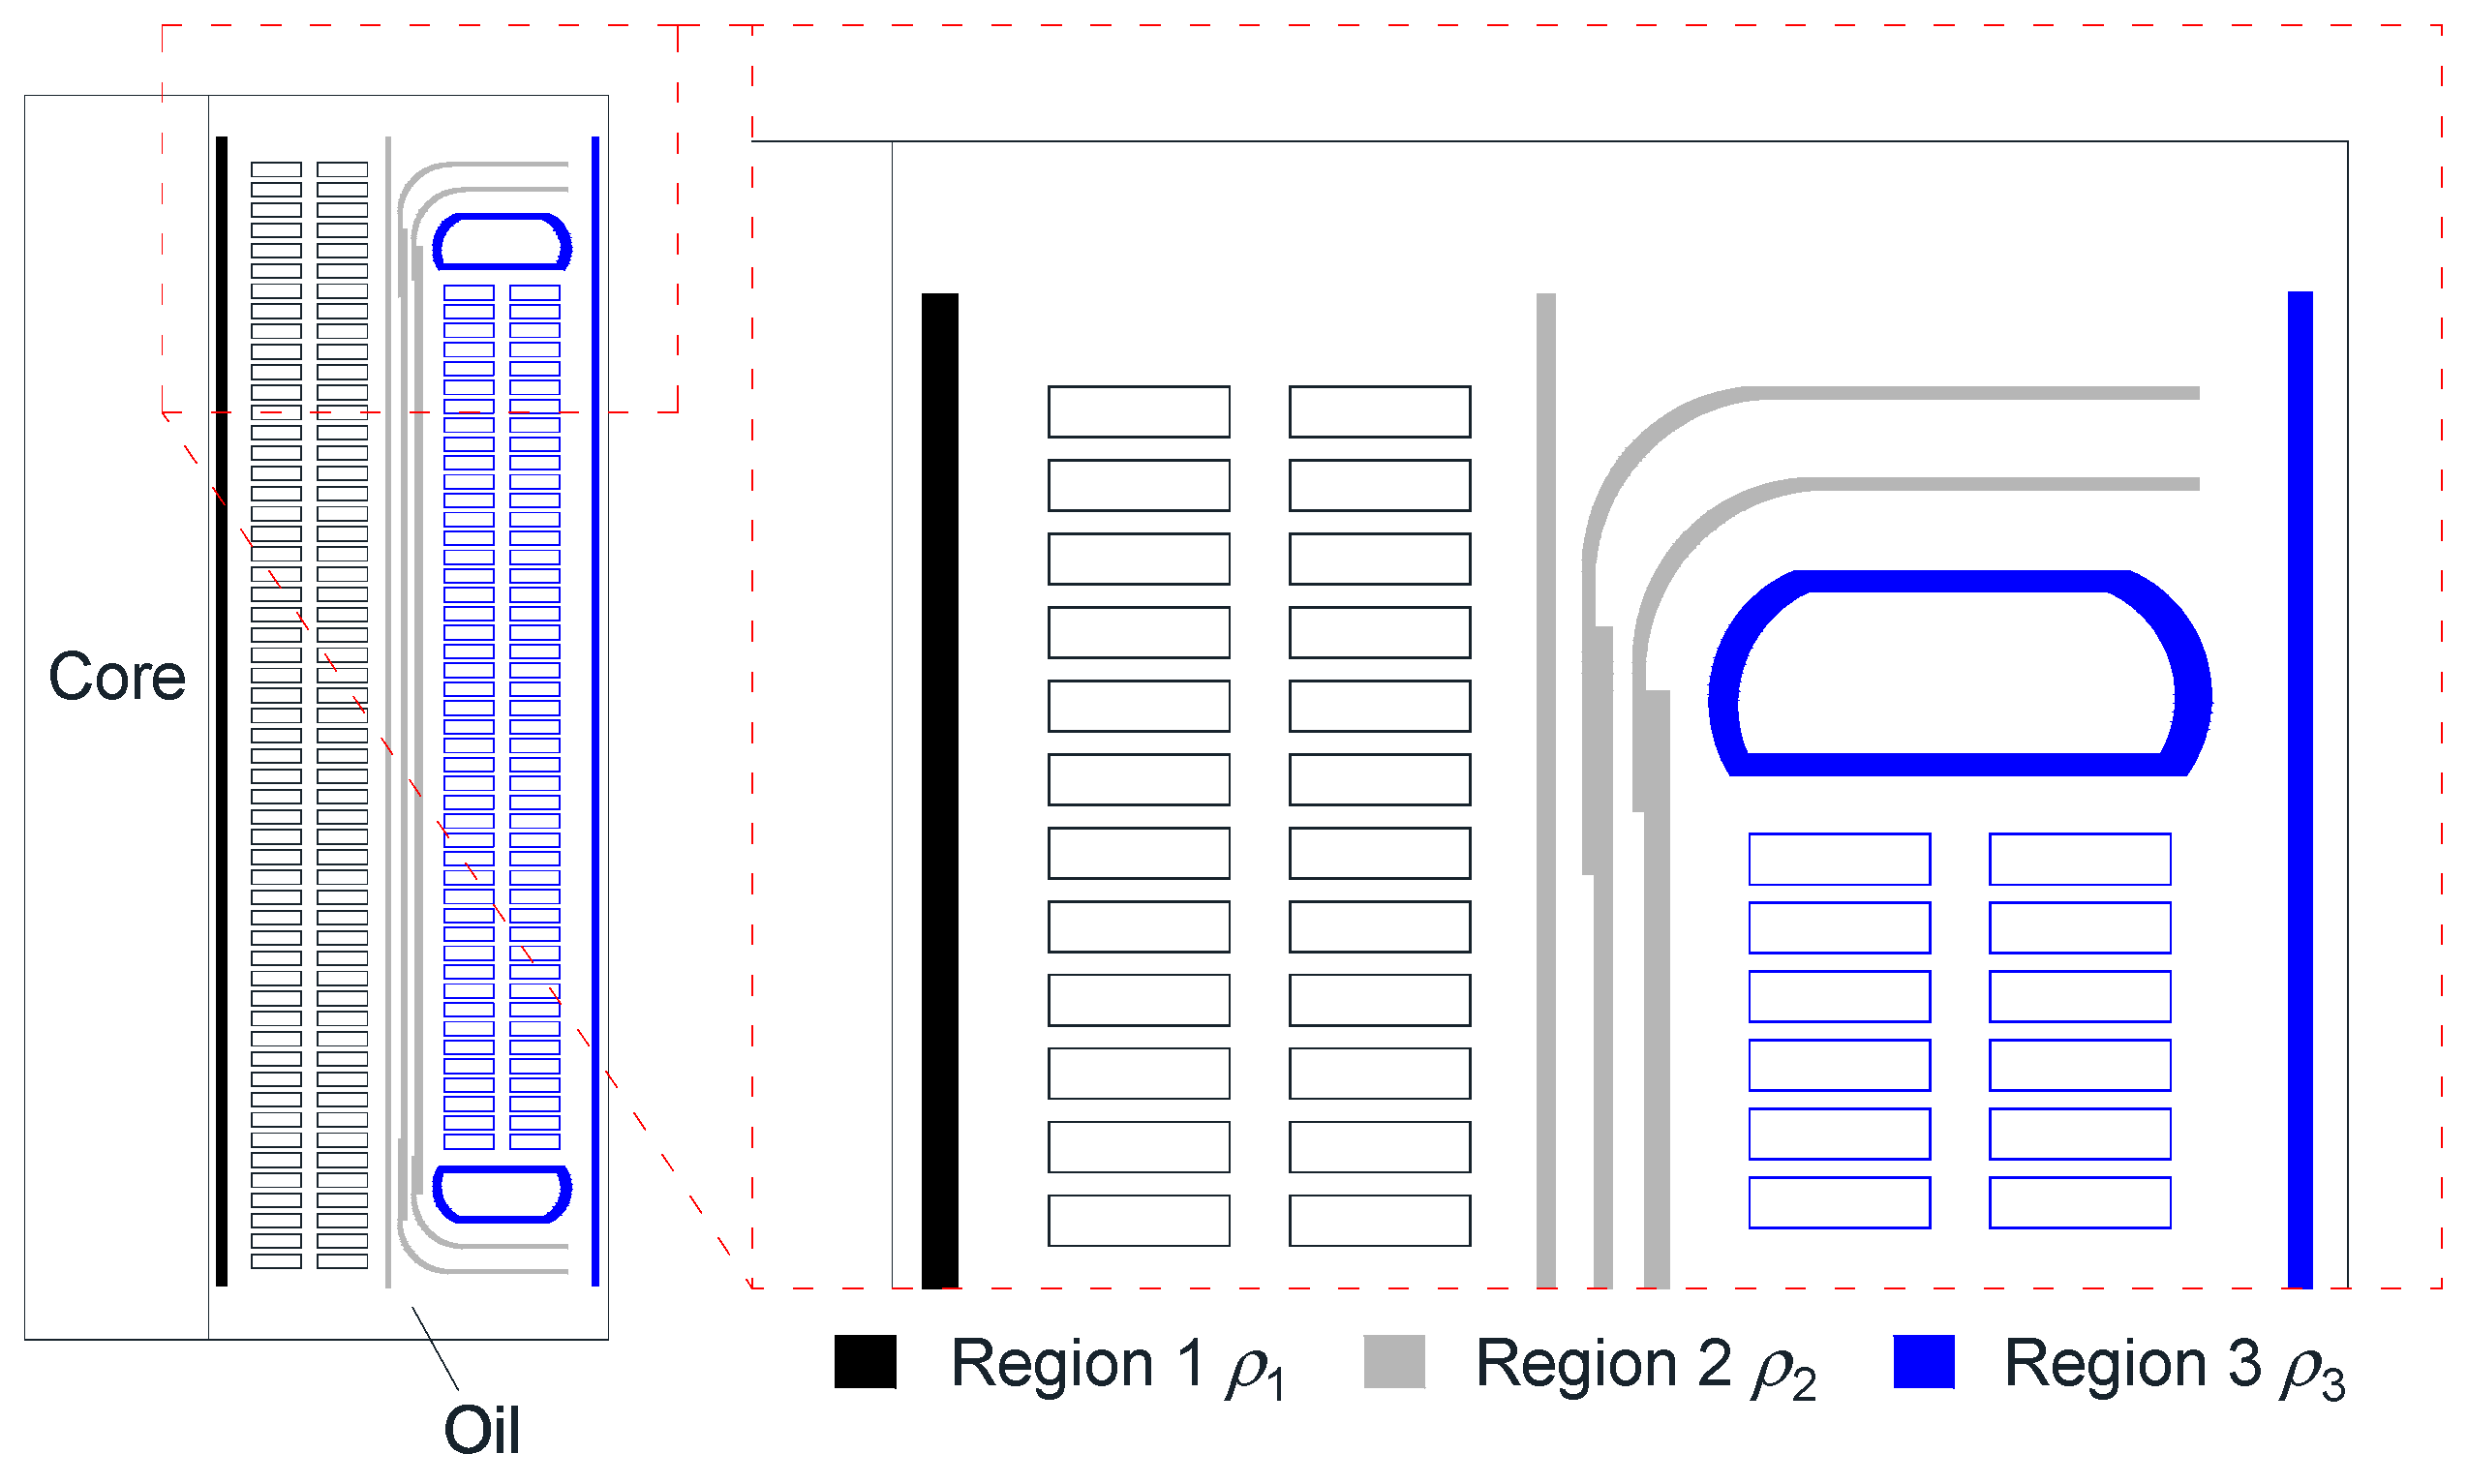
5. Application
For simplicity, the axisymmetric model of a transformer illustrated in
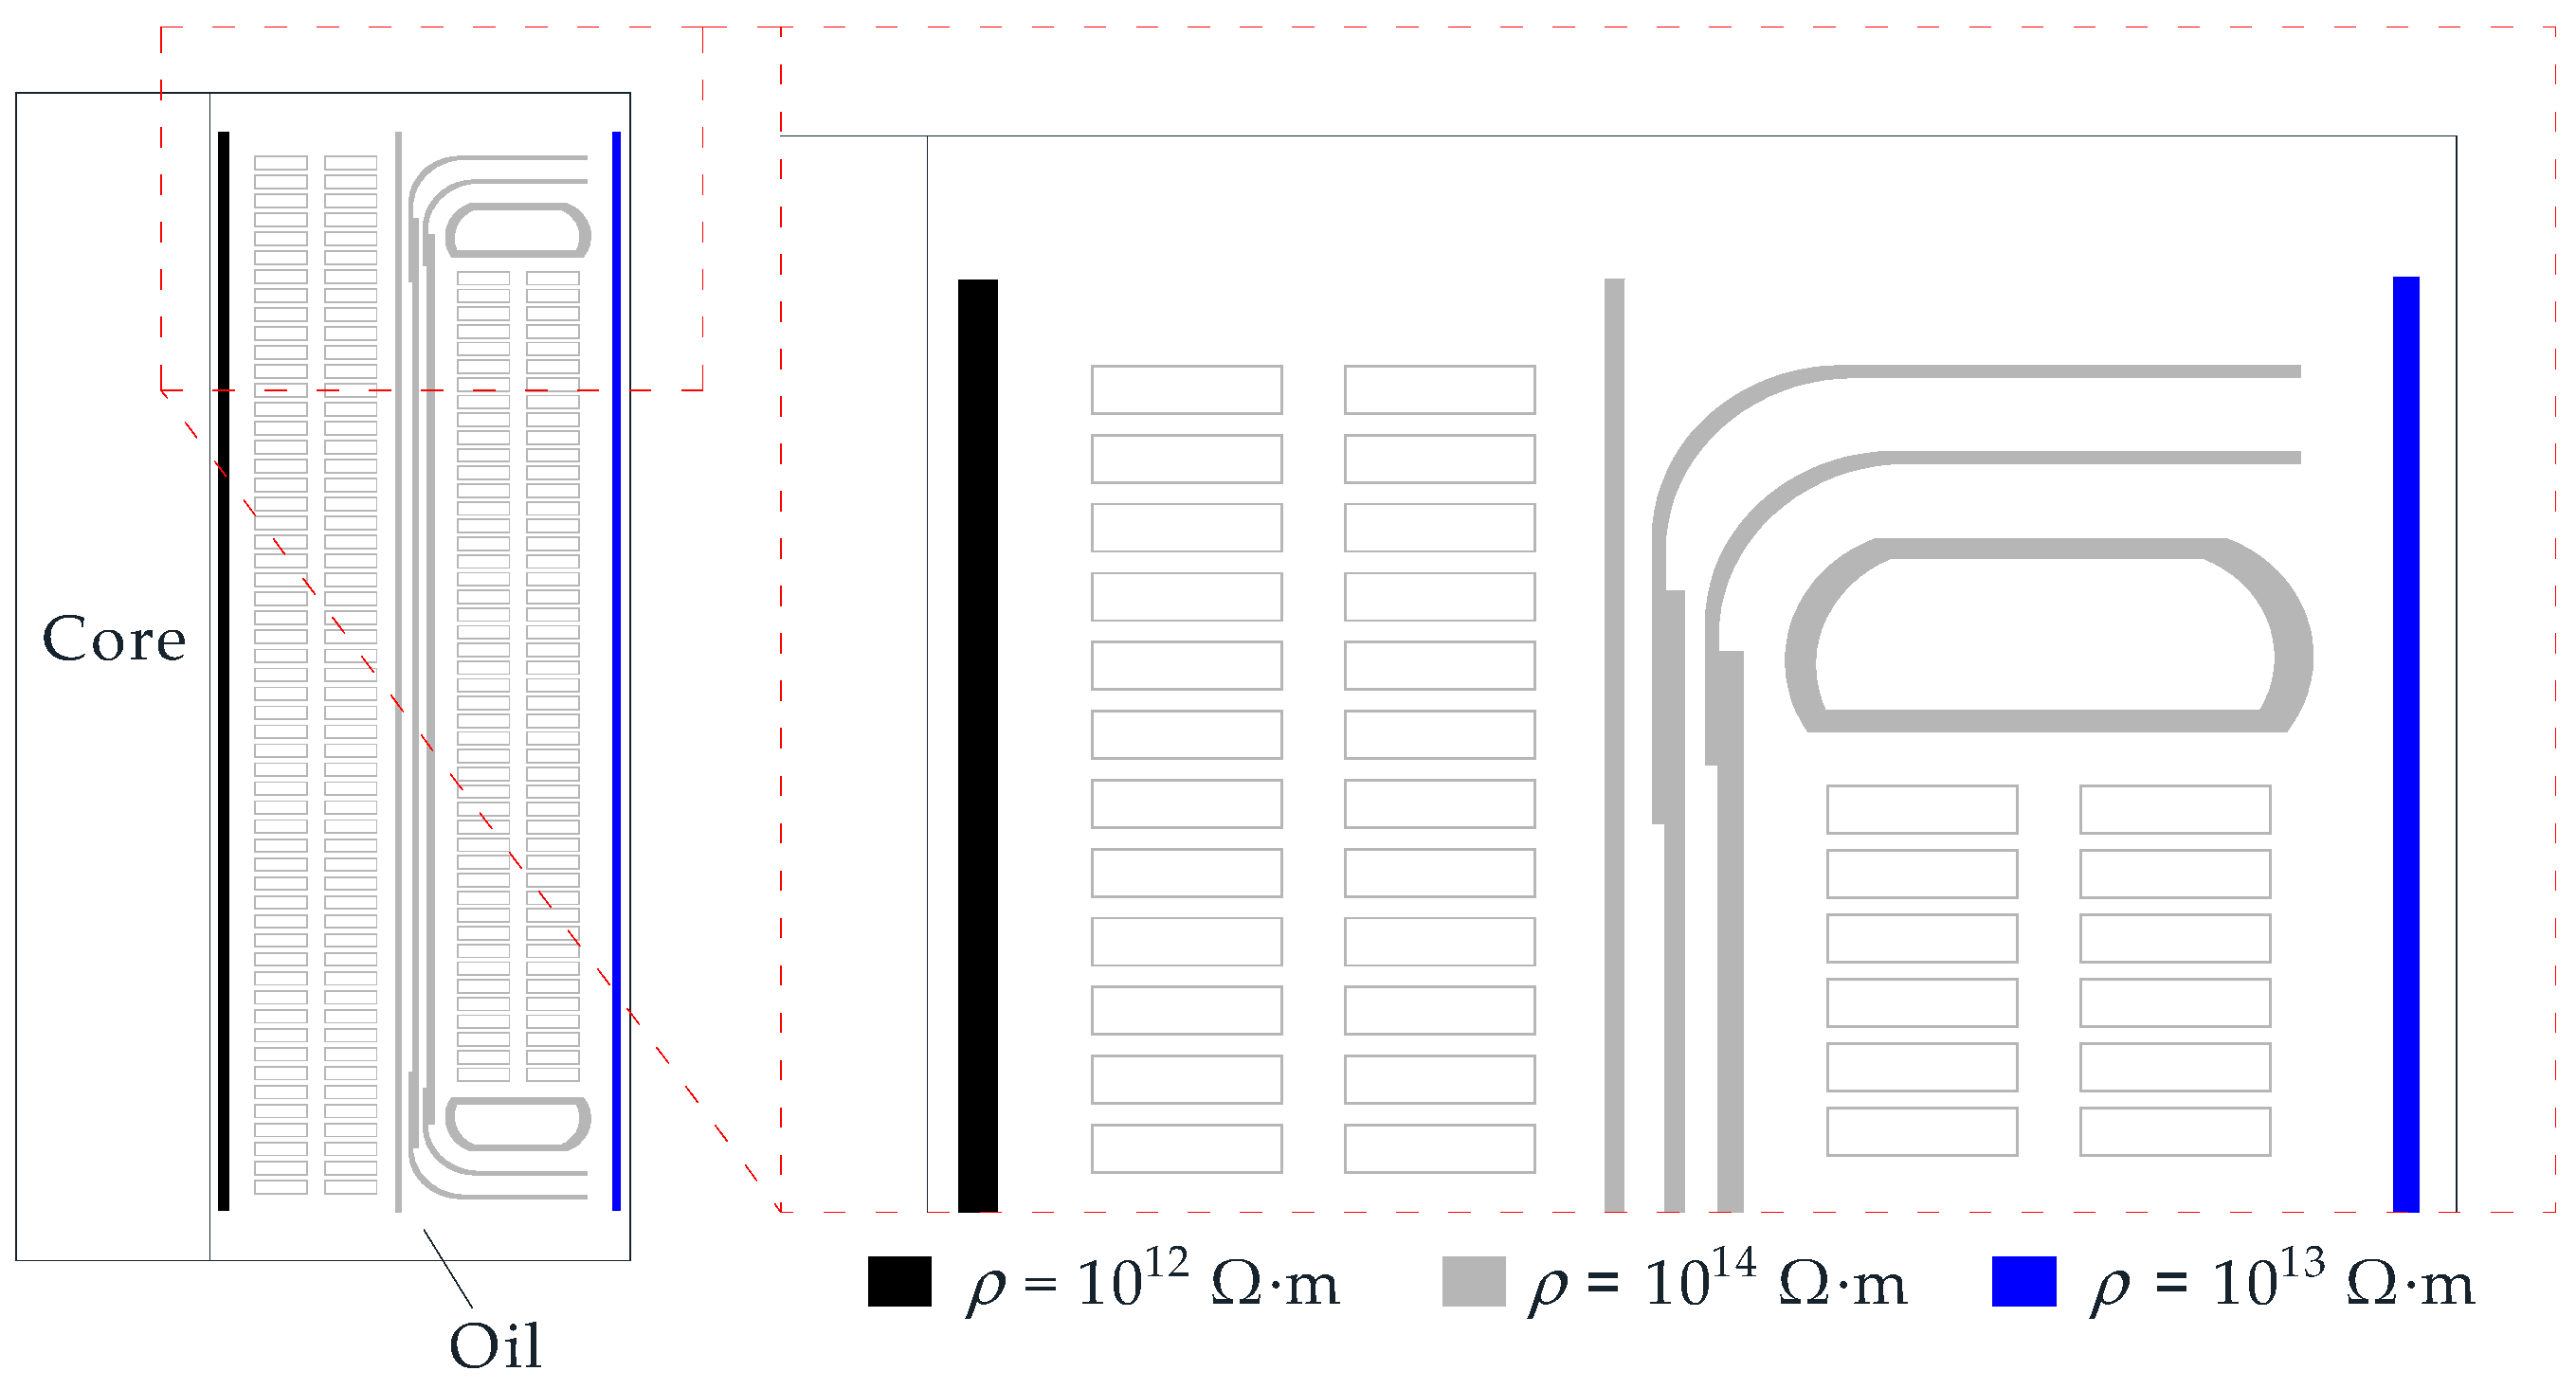
Figure 5 is still taken as the object in this section. Different paper resistivity values are applied to paper at different positions as shown in
Figure 11 and
Table 2. The pressboard at different locations is set with different resistivity values, in order to represent different insulation conditions. The papers with different resistivity values were filled with different colors, as shown in
Figure 11.
Three insulation resistance values under different voltage application methods were obtained through finite element analysis, with a fixed oil resistivity value of 10
12 Ω·m. The obtained insulation resistance values are shown in
Table 3.
During the iterative inversion of paper resistivity, the oil resistivity and insulation resistance values in
Table 3 are taken as the known quantities. The region division of paper is shown in
Figure 12, where the oil impregnated papers in different regions were filled with different colors. It is obvious that papers in different regions have different contributions to the insulation resistances obtained under different voltage application methods. This is the main basis of the region division in this method.
It should be noted that there are differences between the region division in
Figure 12 and the location of paper with different resistivities in
Figure 11. In
Figure 11, only the resistivities of some pressboards are changed. In
Figure 12, all the papers in each region, including pressboard, paper covering the windings and electrostatic rings, and angle rings are considered to have the same resistivity. This difference is set to consider the actual situation, in which the specific locations of aged papers are unknown.
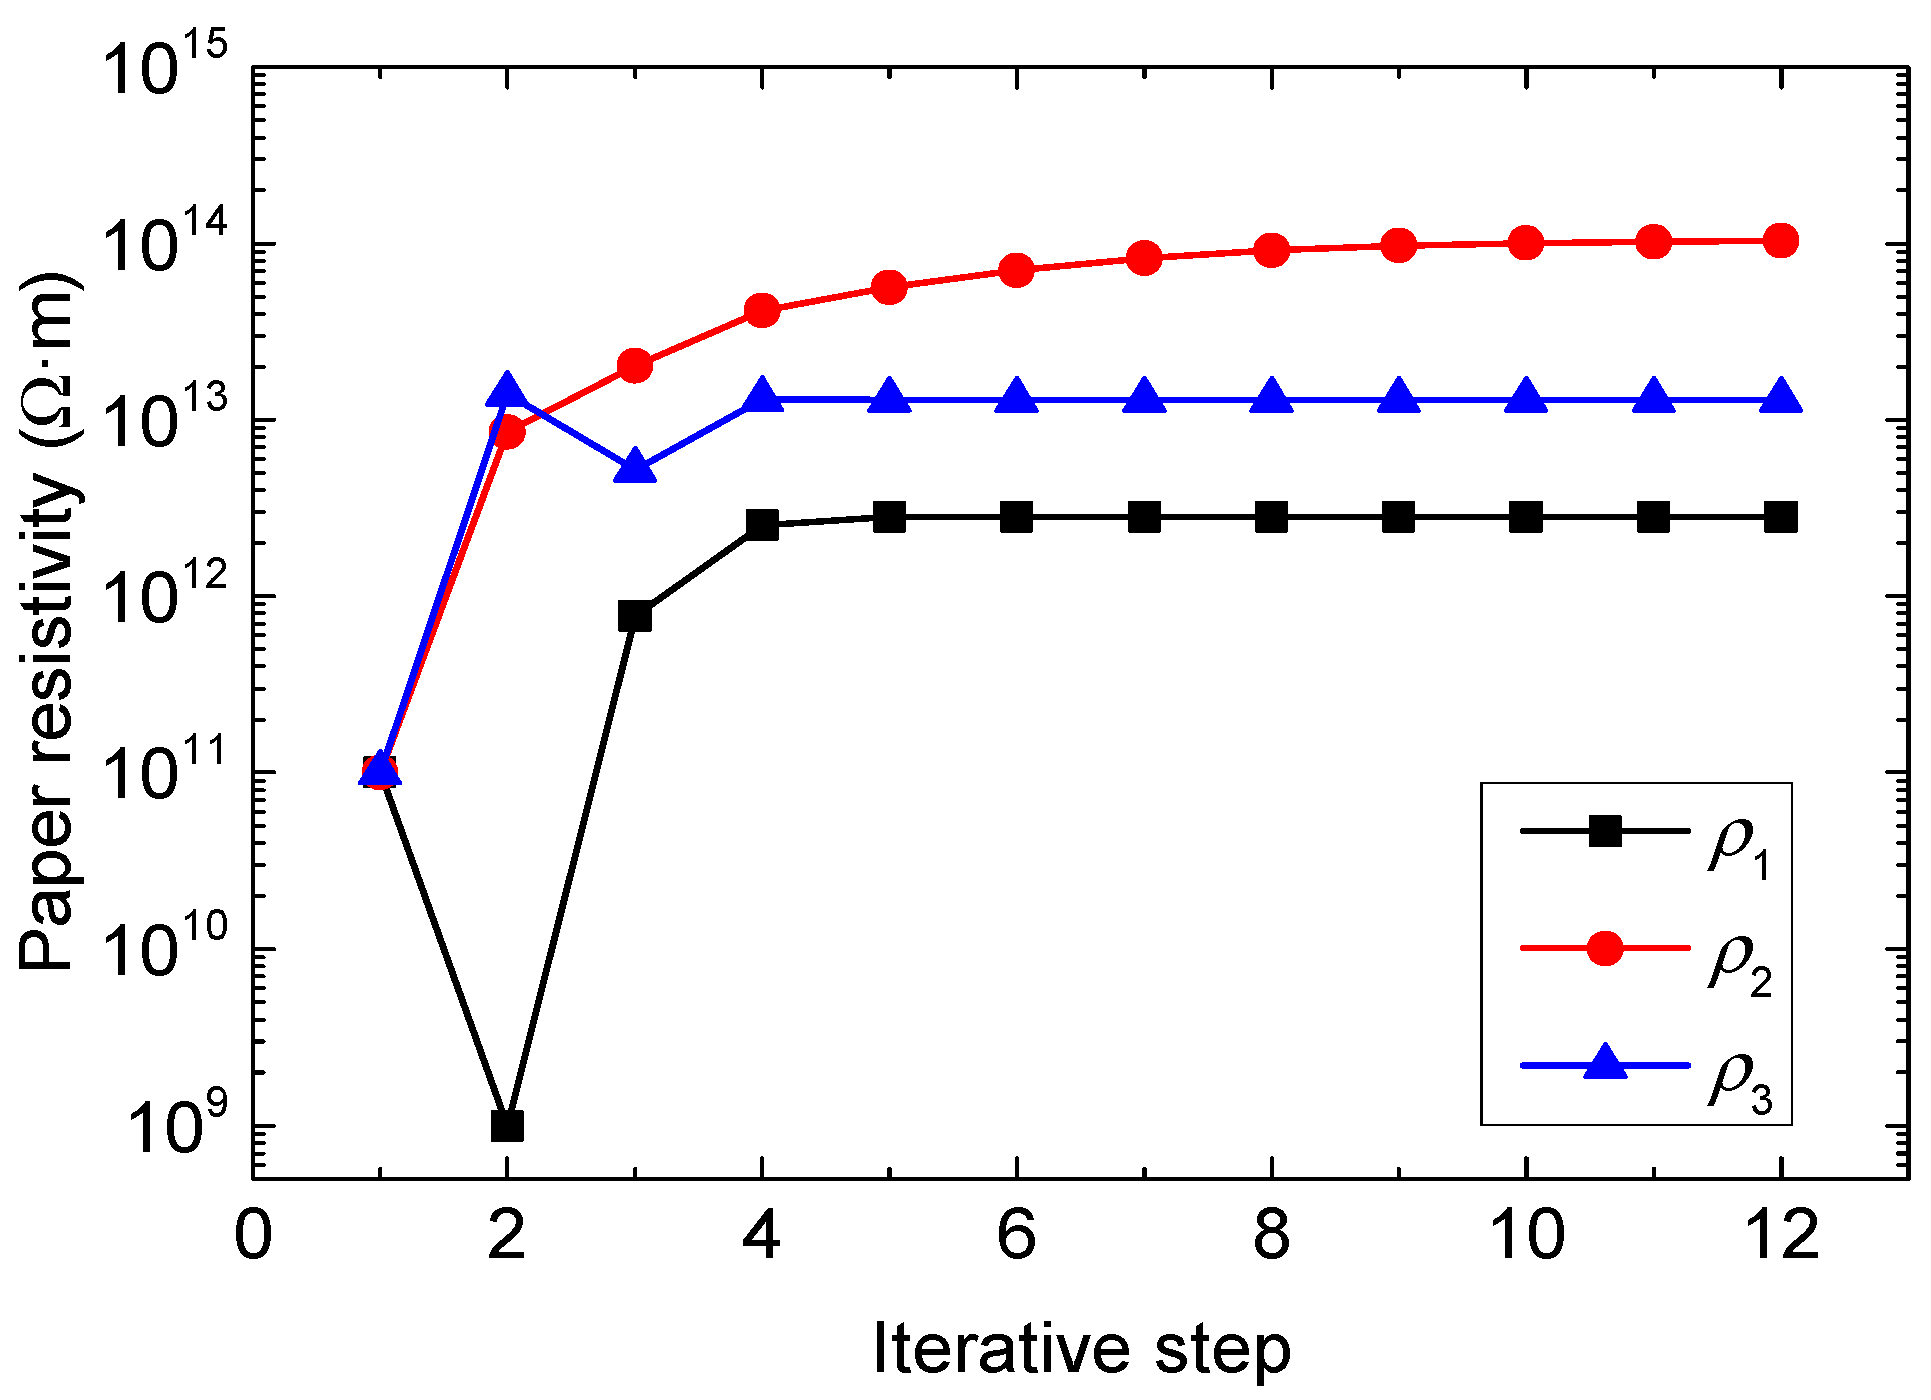
The iterative results of paper resistivity values for each region are shown in
Figure 13. The termination error is also set as 0.1%. In
Figure 13, it takes 12 steps to reach the final results. The obtained paper resistivity values after iterative inversion are shown in
Table 4.
The iterative results listed in
Table 4 are slightly different from the preset values in
Table 2. Since the region division in
Figure 12 is not exactly the same as the paper resistivity set in
Figure 11, as a result, the obtained iterative results are “average” values. This “averaging” effect is the primary cause of the differences between the iterative results and the preset paper resistivity values.
The actual paper resistivity values (represented by the preset resistivities in
Table 2) determine the insulation resistances of transformer (represented by the calculated insulation resistances in
Table 3). Under fixed region division, the insulation resistances determine the calculated paper resistivities. Hence the results in
Table 4 have the same variation tendency with the resistivity values in
Table 2. The more consistent the region division and actual location of paper with different resistivities are, the weaker the “averaging” effect is, and as a result, the closer the calculated resistivity values will be to the actual paper resistivity values.
In spite of these differences, the iterative results can still obviously demonstrate the change of paper resistivities in different region. Hence, the iterative method can not only help to obtain the aging condition of paper, but also demonstrate the aging distribution of paper to some extent.
In practice, the measured resistance values may not as precise as the data in
Table 3. To discuss the uncertainty in the resistance values, data in
Table 4 were rounded off, and only one digit after the decimal point was kept, as shown in
Table 5. Based on the same region division as shown in
Figure 12, corresponding iterative results of paper resisitivities are obtained, as shown in
Table 6. The results in
Table 6 do not have remarkable change compared with the data in
Table 4, which demonstrates that the proposed iterative method is acceptable for practical application.
6. Conclusions and Discussion
The resistivity of oil impregnated paper will decrease during its aging process. According to this feature, this paper proposed a condition assessment method based on the changes of paper resistivity. Good power function relationships between DP and paper resistivity was found by analyzing the corresponding published experiment data, which proved the feasibility of this method. After analyzing the electric field distribution characteristic in transformer, the sensitivity of this method was discussed based on an idealized model.
This paper proposed a calculation method to obtain the resistivity value of paper in order to avoid direct sampling. This method was based on the idea of iterative inversion. Parameters such as oil resistivity and insulation resistance, which could be obtained without disassembling the transformer, were taken as the calculation input. Finite element simulation was used to build the relationship between insulation resistance and paper resistivity. Bisection method and Newton’s method were compared, and Newton’s method was selected as the first option of paper resistivity iteration for its faster convergence speed.
To promote the accuracy of paper resistivity calculation, this paper expanded the resistivity calculation method to multivariate iteration, based on Newton’s method. The spatial distribution characteristic of paper aging were considered by dividing the oil impregnated paper in the transformer into different regions. The paper resistivities in different regions were obtained with insulation resistance values measured under different voltage application methods. After applying this multivariate iterative method to an axisymmetric model of a transformer, the sensitivity of the result was demonstrated, even if the region divisions were not exactly the same as the actual aging distribution.
Commonly, there are three kinds of insulation resistance values that can be obtained. This means that there can be as many as three regions and only three resistivity values can be obtained through multivariate iterative calculation. As a result, through three regions can consider the fact of non-uniform ageing and promote the accuracy of insulation condition assessment, the accuracy improvement is still somehow limited, hence, more input data are need to further improve this method. Generally speaking, resistivity has shown its potential in condition assessment of paper insulation. In the future, two work aspects will be done to improve this method. On the one hand, other non-destructive electrical measurement data, such as polarization loss under low frequency, will be used as an input of the multivariate iterative calculation, in order to further refine the region division and increase the calculation accuracy. On the other hand, a relationship between paper resistivity and insulation life will also be built to provide more guidance for the operation and maintenance of power transformers.


 ,
, 


