Article

Developing an Input-Output Based Method to Estimate a National-Level Energy Return on Investment (EROI)

1
Sustainability Research Institute, School of Earth and Environment, University of Leeds, Leeds LS2 9JT, UK
2
Science Policy Research Unit, University of Sussex, Falmer, Brighton BN1 9QE, UK
3
Centre on Innovation and Energy Demand and Sussex Energy Group, Science Policy Research Unit, University of Sussex, Falmer, Brighton BN1 9QE, UK
4
Low Carbon Energy Research Group, School of Chemical and Process Engineering; University of Leeds, Leeds LS2 9JT, UK
*
Author to whom correspondence should be addressed.
Energies 2017, 10(4), 534; https://doi.org/10.3390/en10040534
Submission received: 10 February 2017 / Revised: 31 March 2017 / Accepted: 8 April 2017 / Published: 14 April 2017
(This article belongs to the Special Issue Low Carbon Economy)

Abstract

:
Concerns have been raised that declining energy return on energy investment (EROI) from fossil fuels, and low levels of EROI for alternative energy sources, could constrain the ability of national economies to continue to deliver economic growth and improvements in social wellbeing while undertaking a low-carbon transition. However, in order to test these concerns on a national scale, there is a conceptual and methodological gap in relation to calculating a national-level EROI and analysing its policy implications. We address this by developing a novel application of an Input-Output methodology to calculate a national-level indirect energy investment, one of the components needed for calculating a national-level EROI. This is a mixed physical and monetary approach using Multi-Regional Input-Output data and an energy extension. We discuss some conceptual and methodological issues relating to defining EROI for a national economy, and describe in detail the methodology and data requirements for the approach. We obtain initial results for the UK for the period 1997–2012, which show that the country’s EROI has been declining since the beginning of the 21st Century. We discuss the policy relevance of measuring national-level EROI and propose avenues for future research.

1. Introduction

The concept of energy return on energy investment (EROI) is part of the field of study of net energy analysis (NEA), and is one way of measuring and comparing the net energy availability to the economy from different energy sources and processes. In broad terms, it can be understood as “the ratio of energy returned from an energy-gathering activity compared to the energy invested in that process” [1]. Building on a long history of ideas in biophysical economics (see, for example, [2]), this concept has been used by e.g., Hall and Kiltgaard [1] as a basis for further developing an energy-focused approach to the economy.
This approach is driven by concerns around a decline in the EROI of fossil fuels and low levels of EROI for alternative energy sources. In the case of fossil fuels, it is argued that the depletion of easily recoverable fossil fuel reserves is outpacing technological advancements for the improvement of fossil fuel extraction, leading to decreasing values of EROI for these fossil energy sources (see e.g., [3,4,5]). Moreover, some authors [6,7] have argued that the EROIs of many renewable energy technologies necessary to decarbonise global energy supply are currently lower than the fossil fuels that they need to replace. However, it should be recognized that the EROI of renewable energy sources varies hugely depending on the technology and location. For instance, Raugei et al. [8] and Kubiszewski et al. [9] calculate that, for electricity generation, the latest solar and wind technologies respectively have EROI values comparable to gas- or coal-fired power plants. The future trends in the EROI of renewable energy systems are also very uncertain—being dependent both on the pace of technological innovation (which may increase EROI) and the need for increased back-up generation and storage (which may decrease EROI from a full energy system perspective).
The higher the EROI of an energy supply technology, the more “valuable” it is in terms of producing (economically) useful energy output. In other words, a higher EROI allows for more net energy to be available to the economy, which is valuable in the sense that all economic activity relies on energy use to a greater or lesser extent. Analyses of the EROI of different energy sources and extraction/capture processes using particular technologies are relatively common, e.g., [6,10,11]. These are important in terms of presenting a picture of the potential contribution of individual energy sources to the energetic needs of the economy. However, less attention has so far been paid to determining EROI values for national economies, which requires a different methodological approach to traditional EROI analyses due to the mix of particular resource locations, exploitation times and technologies applied to “produce” energy, i.e., to extract fossil fuels and capture flows of renewable energy in a given national territory.
This paper aims to help with the need to develop a method for measuring EROI for national economies, in particular for calculating indirect energy investment, and thus contribute to the growing field of NEA. It does so by proposing a novel application of an Input-Output methodology using Multi-Regional Input-Output data for the UK for the period 1997–2012. This approach is described in detail in Section 3, followed by the presentation and discussion of results in Section 4, and some conclusions and policy recommendations in Section 5. But firstly we explain the importance of a national-level EROI in Section 2, as well as describe how it differs from other types of EROI, and discuss some of the methodological issues associated with EROI calculations in general.

2. A National-Level EROI: The Concept

Our aim in this paper is to develop an Input-Output based methodology to calculate a national-level EROI ( EROI nat ). We start with a succinct background of the EROI concept and its different types. We then follow by putting forward some arguments on the conceptual relevance of a EROI nat as we have defined here. Finally, this section discusses persistent conceptual issues in the EROI literature and describes the conceptual choices we made.

2.1. Background

EROI (or EROEI) is a key metric in NEA. The concept of net energy (i.e., amount of usable energy after extraction and processing) dates back to the second half of the 20th Century [12,13,14]. The term (EROI) however, was first used in 1984 by Cleveland et al. [15]. It is a dimensionless number (also often expressed as a ratio) that expresses the result of energy returns over energy invested.
Most EROI studies consider an energy supply technology for a particular resource type and in a particular location. Such studies typically have the “mine-mouth” (or “well-head” or “farm-gate”) as the boundary drawn for evaluating the energy return in relation to the energy required to get it, without further transformation processing [16]. These EROI calculations are often referred to as “standard” EROI ( EROI stnd ) [17]:
EROI stnd = energy   output   from   extraction   direct   and   indirect   energy   inputs
A simple graphical description can be found in Figure 1, showing how EROI stnd for a particular energy resource (oil) compares to EROI calculations with extended system boundaries. Other, less common, types of EROI calculations for a single energy source vary depending on the chosen system boundary (e.g.,   EROI pou and EROI ext ) and thus include more or fewer stages along the energy transformation chain. EROI stnd is more commonly used to compare different fuels or energy carriers, or when analysing changes in EROI of a specific fuel over time and the consequences for the wider economy (see for example [6,18,19]).
When a number of energy resources are examined within certain geographical limits, such as a country, then another type of EROI is needed: a societal or national-level EROI. Earlier attempts to calculate the net energy for a country include Leach [20] and Peet et al. [21], however they did not include trade in their calculations, a key element in a globalised world. A recent attempt to calculate a societal EROI ( EROI soc ) was undertaken by Lambert et al. [5,22]. They estimate the average EROI for all energy supply technologies deployed by a nation. EROI soc is calculated by dividing the average energy obtained per dollar of spending (summed over different fuel inputs to the economy) by the primary energy needed to obtain one dollar’s worth of economic production. Their results suggest that countries with higher societal EROIs have higher standards of living, as measured by the Human Development Index (HDI). Their calculations are based on price and energy intensity information, which may have some drawbacks. Prices might be influenced by factors other than physical resource scarcity, particularly in non-competitive markets. Thus, high prices do not necessarily correspond to scarce resources and vice versa, so a price-based approach may introduce distortions to the calculated EROI.
More recent studies that attempted national-level net energy estimations include the studies by King et al. [23,24], King [25], Fizaine and Court [26], Herendeen [27] and Raugei and Leccisi [28]. However, these studies diverge from our own in that they have either not accounted for energy trade (both direct and embodied) in calculating indirect energy [23,24,25,26], they have focused on a single year [27] or they have focused on single energy sources rather than the aggregate production of energy by a nation [28]. Our approach represents a contribution to these efforts in that it combines three aspects of net energy analysis at a country level that have been pursued separately up to now: accounting for international energy trade in the calculation of indirect energy (in our case using an Input-Output framework), using data for a more than one year, and taking a national perspective. We will compare and discuss their results in more detail when presenting our results from this first application.

2.2. The Benefits of a National-Level EROI

There are three key reasons why a national-level EROI is important. Firstly, traditional energy analyses (i.e., mainstream energy-economic analyses that are widely used for decision-making purposes) do not usually address directly the issue of resource depletion or reduced accessibility (i.e., resources that are more difficult to extract/capture). In traditional energy analyses this might be addressed indirectly through prices and price projections, or perhaps through data and projections on reserves. However, we believe that EROI gives a better picture of resource depletion and accessibility, one that is based on energy accounting of extraction/capture processes. This is important because if a country is understood to require a given level of net energy input to support its economic activity, a declining EROI trend would imply that the total gross energy requirements of the economy could rise, even without economic growth. In this case, a national-level EROI becomes relevant for energy-economy analysis and national energy planning.
Secondly, when measured over time to take account of dynamic effects, EROI can provide valuable information about the relative resource depletion and technological change in resource extraction/capture. A declining EROI over time indicates that resource depletion is outpacing technological change [17] (i.e., the quantity of output of a certain energy resource, or its accessibility [29], is declining faster than the advancements in technology to harvest it more efficiently). Here the system boundary for EROI is established at the resource extraction/capture level, rather than including downstream transformation processes (we use the terms extraction and capture in order to include both the extraction of energy resource stocks, e.g. coal, oil and gas, and the capture of energy flows through its conversion to electricity, e.g. wind and solar). Therefore, a national-level EROI time series can be analysed together with other national-level energy-economic studies. This would provide additional information to improve our understanding as to how the dynamics of resource depletion (or accessibility) and technological change relate to energy quality and the dynamics of conversion efficiencies. In particular, the development of a national-level EROI provides net energy analysis and insights at the same (national) scale as that required by policy-makers. For example, policy-relevant findings may include a better understanding of a country’s overall resource depletion or reduced resource accessibility, and the energy investment requirements versus technological advancements of resource extraction/capture.
Thirdly, EROI has economic relevance since large energy returns in excess of the corresponding energy investments facilitate increasingly diverse economic activities. This is the case as the physical energy cost of energy supply is likely to have a larger economic impact than might be expected from its cost share. Assuming that firms are profit maximizing, markets are perfectly competitive and the economy is in equilibrium (as in neoclassical economic growth models), it is a mathematical result from the Cobb-Douglas production function that the partial output elasticity of the factors of production equal their respective cost shares of aggregate output [30]. However, the cost share principle does not apply when using other production functions (e.g., CES function) [31], and perhaps more importantly, it is theoretically contested by insights from ecological economics that highlight the vital importance of energy for economic growth compared to its historically low cost [32,33]. This is because if the physical cost of energy production rises then this might severely impact the productive resources available to the rest of the economy (in terms of labour, physical infrastructure and investment capital, for instance). A national-level EROI can help understand the potential for growth or change of a national economy in relation to the physical energy cost of extracting/capturing the energy it requires.

2.3. Conceptual Issues and Choices

The main persistent conceptual issues in the EROI literature are: how to define the boundary of analysis (as shown in Figure 1), how to account for embodied energy inputs (i.e., all the energy that went into a process; this is different from embedded energy, which relates to the energy content of specific materials or infrastructures), how to deal with temporality and how to account for energy quality. These issues are still being identified in recent EROI publications [17,34], but are largely the same as those that Leach [20] identified and were discussed in a NEA workshop held in August 1975 at Stanford, California. We will discuss each of them in turn, providing our own conceptual choices for this specific definition of EROI nat and an explanation of the reasoning behind our choices (which were sometimes conceptual and sometimes practical). However, our choices are not necessarily intended to point towards final solutions to these methodological issues, but rather should be seen as contributing to the discussion of defining EROI at a national level.

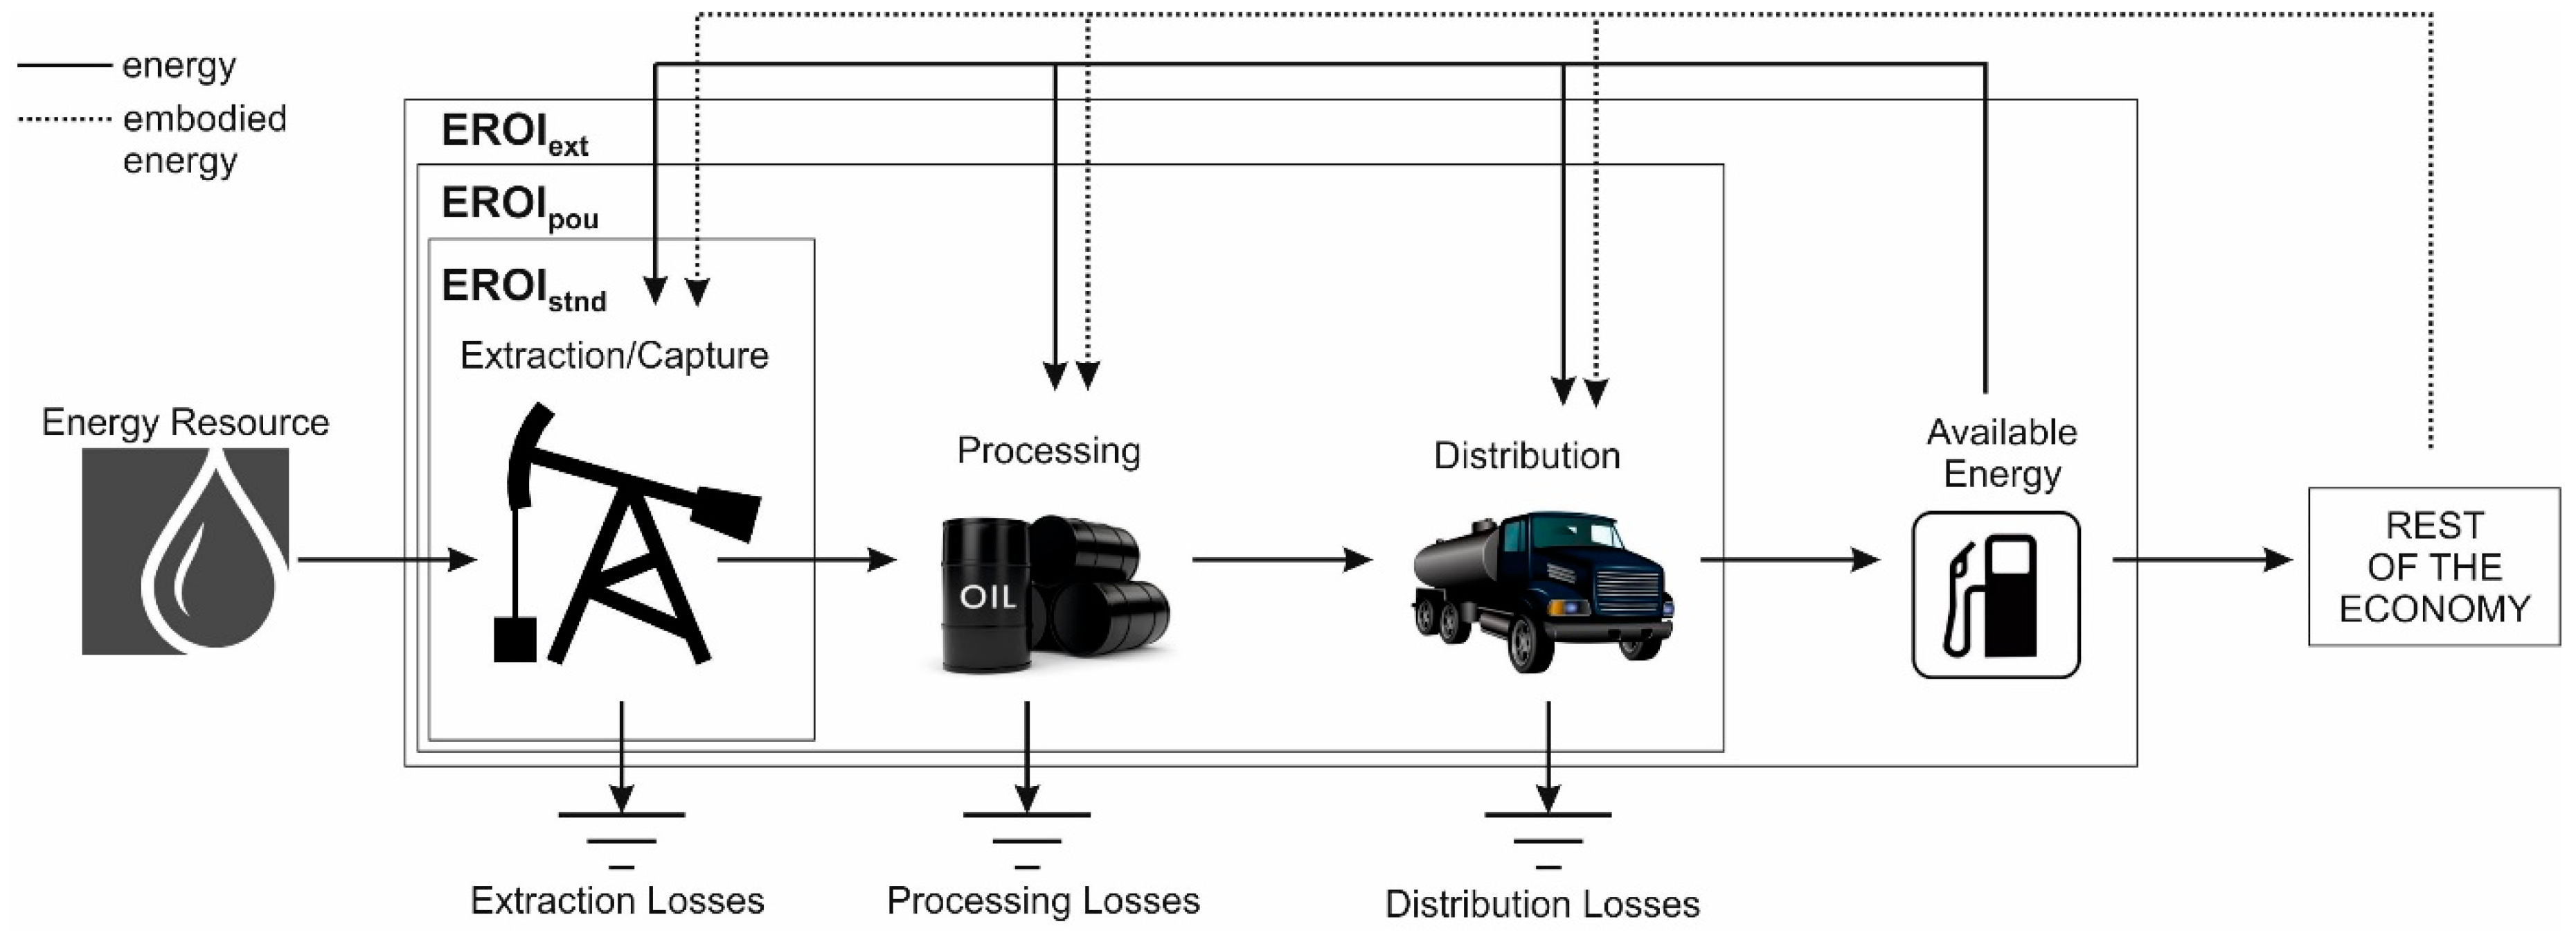
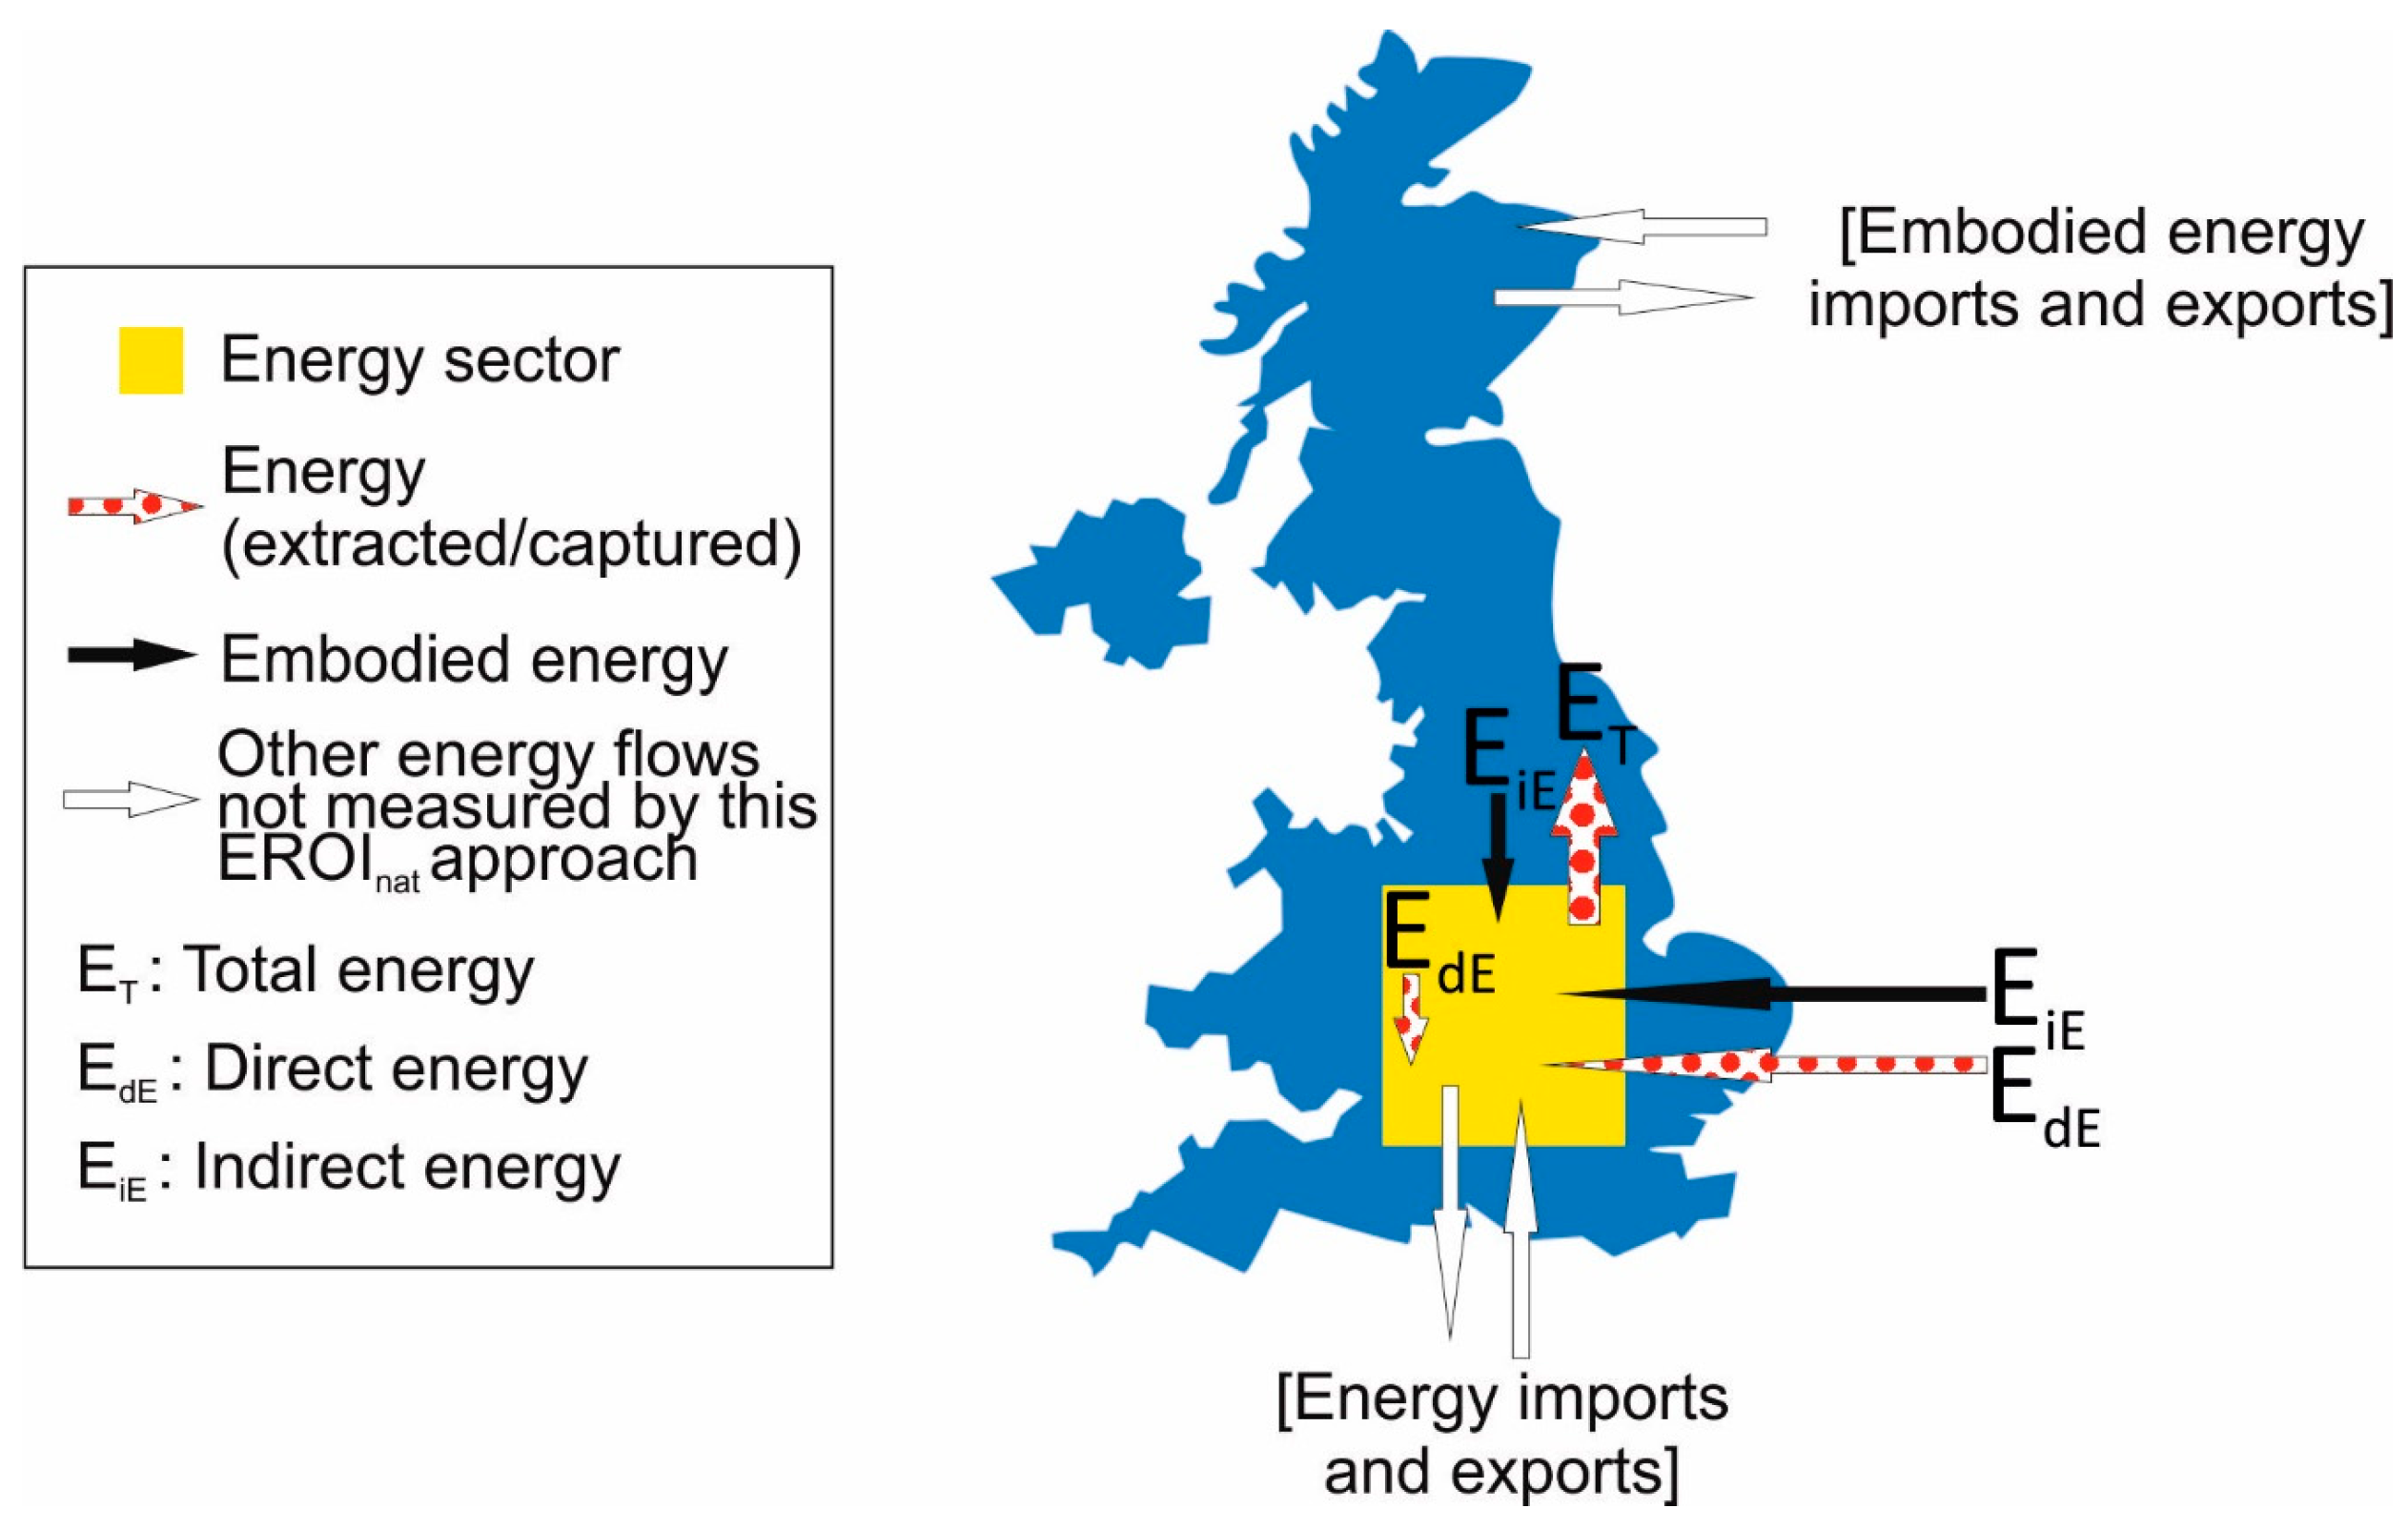
2.3.1. Boundary of Analysis

There is a consensus around the accounting starting point for EROI in general, regardless of the type. EROI “assumes that the energy in the ground (or coming from the sun) is not to be counted as an input” [35]. Therefore, EROI accounts for energy inputs once they have been either extracted or harnessed for human purposes, but not the energy content of the resource that is being extracted/harnessed (note that this start point of accounting for energy contrasts with the approach of another assessment tool: Life Cycle Analysis—LCA. In LCA the energy that is present in the environment or the energy source is the start point for accounting in measures of, for instance, cumulative energy demand).
However, there are three main considerations when assessing boundaries for EROI. Firstly, how many energy processing and transformation stages to take into account: primary energy, final consumption (of energy carriers) or useful energy. Primary energy generally refers to the energy extracted or captured from the natural environment (e.g., crude oil, coal, hydropower, etc.) [36]. Final energy (also called secondary energy) generally refers to energy as it is delivered to the final economic consumer, after undergoing transportation and transformation processes (e.g., gasoline, diesel, electricity, etc.) [36]. At the point of use, final energy undergoes one last transformation process as it passes through an end-use conversion device, for example furnaces, electric appliances or light bulbs. End-use devices transform energy into a form that is useful for human purposes, hence the term “useful energy” as the outcome of this last conversion process. Secondly, a decision is required as to the inclusion of energy inputs at each of the energy stages under analysis, i.e., should these inputs include embodied energy in capital equipment, operation and maintenance energy, energy consumed by the labour force, etc.? Thirdly, a consideration is required as to the range of energy sources that will be analysed, the geographical limits to be applied and the time frame to be considered.
In relation to the first consideration, how far to go along the energy chain in order to include more processing and transformation stages depends on the type of EROI (see Figure 1). Our definition of EROI nat establishes this boundary at the first stage of extraction/capture of energy sources. We have chosen this stage for practical reasons, as it provides a well-defined starting point for a novel methodology that can be further built upon. In terms of most energy reporting (e.g., International Energy Agency—IEA—Energy Balances), this means energy “production”. Energy “production” does not include energy imports but it does include energy exports. In other words, we are assessing the energy extracted/captured in a country (energy returned), regardless of whether or not is then exported and without accounting for energy imports (see Figure 2). This means that a country that imports all of its primary energy will not have an EROI value when using this methodology.
In relation to the second consideration, on the extent of energy inputs included at each energy processing and transformation stage, it depends on the specific EROI study. Most EROI studies include the direct energy and material (as embodied energy) inputs as well as the indirect energy and material inputs, i.e., the inputs required to make the initial inputs. We have decided to adopt this commonly used boundary in the calculation of EROI nat in order to make our results comparable to other results found in the literature.
Brandt et al. [37] have developed a framework for tracking direct energy inputs as well as different number of indirect energy inputs. Further expansion of the boundary that determines the energy inputs can be made. For example, indirect labour consumption can be included, as well as the consumption of auxiliary services and the environmental impacts of the production of direct and indirect energy and materials. Hall et al. [38] calculate EROI ext for US oil using an expanded boundary for the inputs. However, we consider these expansions to be an area suitable for further research, as an Input-Output framework is ideally suited to overcoming a key hurdle in national-level EROI analysis: allocating indirect energy use from different stages of the supply chain to the energy producing sectors.
Third, there is the consideration of how many energy sources are being analysed, within which geographical limits and in which time frame. Many EROI studies focus on a single energy source in a single location at a particular point in time. Hall et al. [6] and Murphy et al. [17] have undertaken detailed reviews of published EROI values for single energy sources and regions. There are very few time-series EROI studies. Two exceptions are Brandt [11], who conducted an EROI investigation of oil in California over the period 1955 to 2005 and Brandt et al. [39] investigating EROI for oil sands in Alberta over the period 1970 to 2010. For it to be consistent with a national-level calculation, in our EROI nat the geographical limits correspond to a national territory, the number of energy sources analysed correspond to all the energy sources extracted/captured within that territory and the time frame is only constrained by data availability. Our proposed approach attempts to calculate EROI nat from a territorial production perspective (as opposed to a consumption perspective).

2.3.2. Accounting for Embodied Energy Inputs
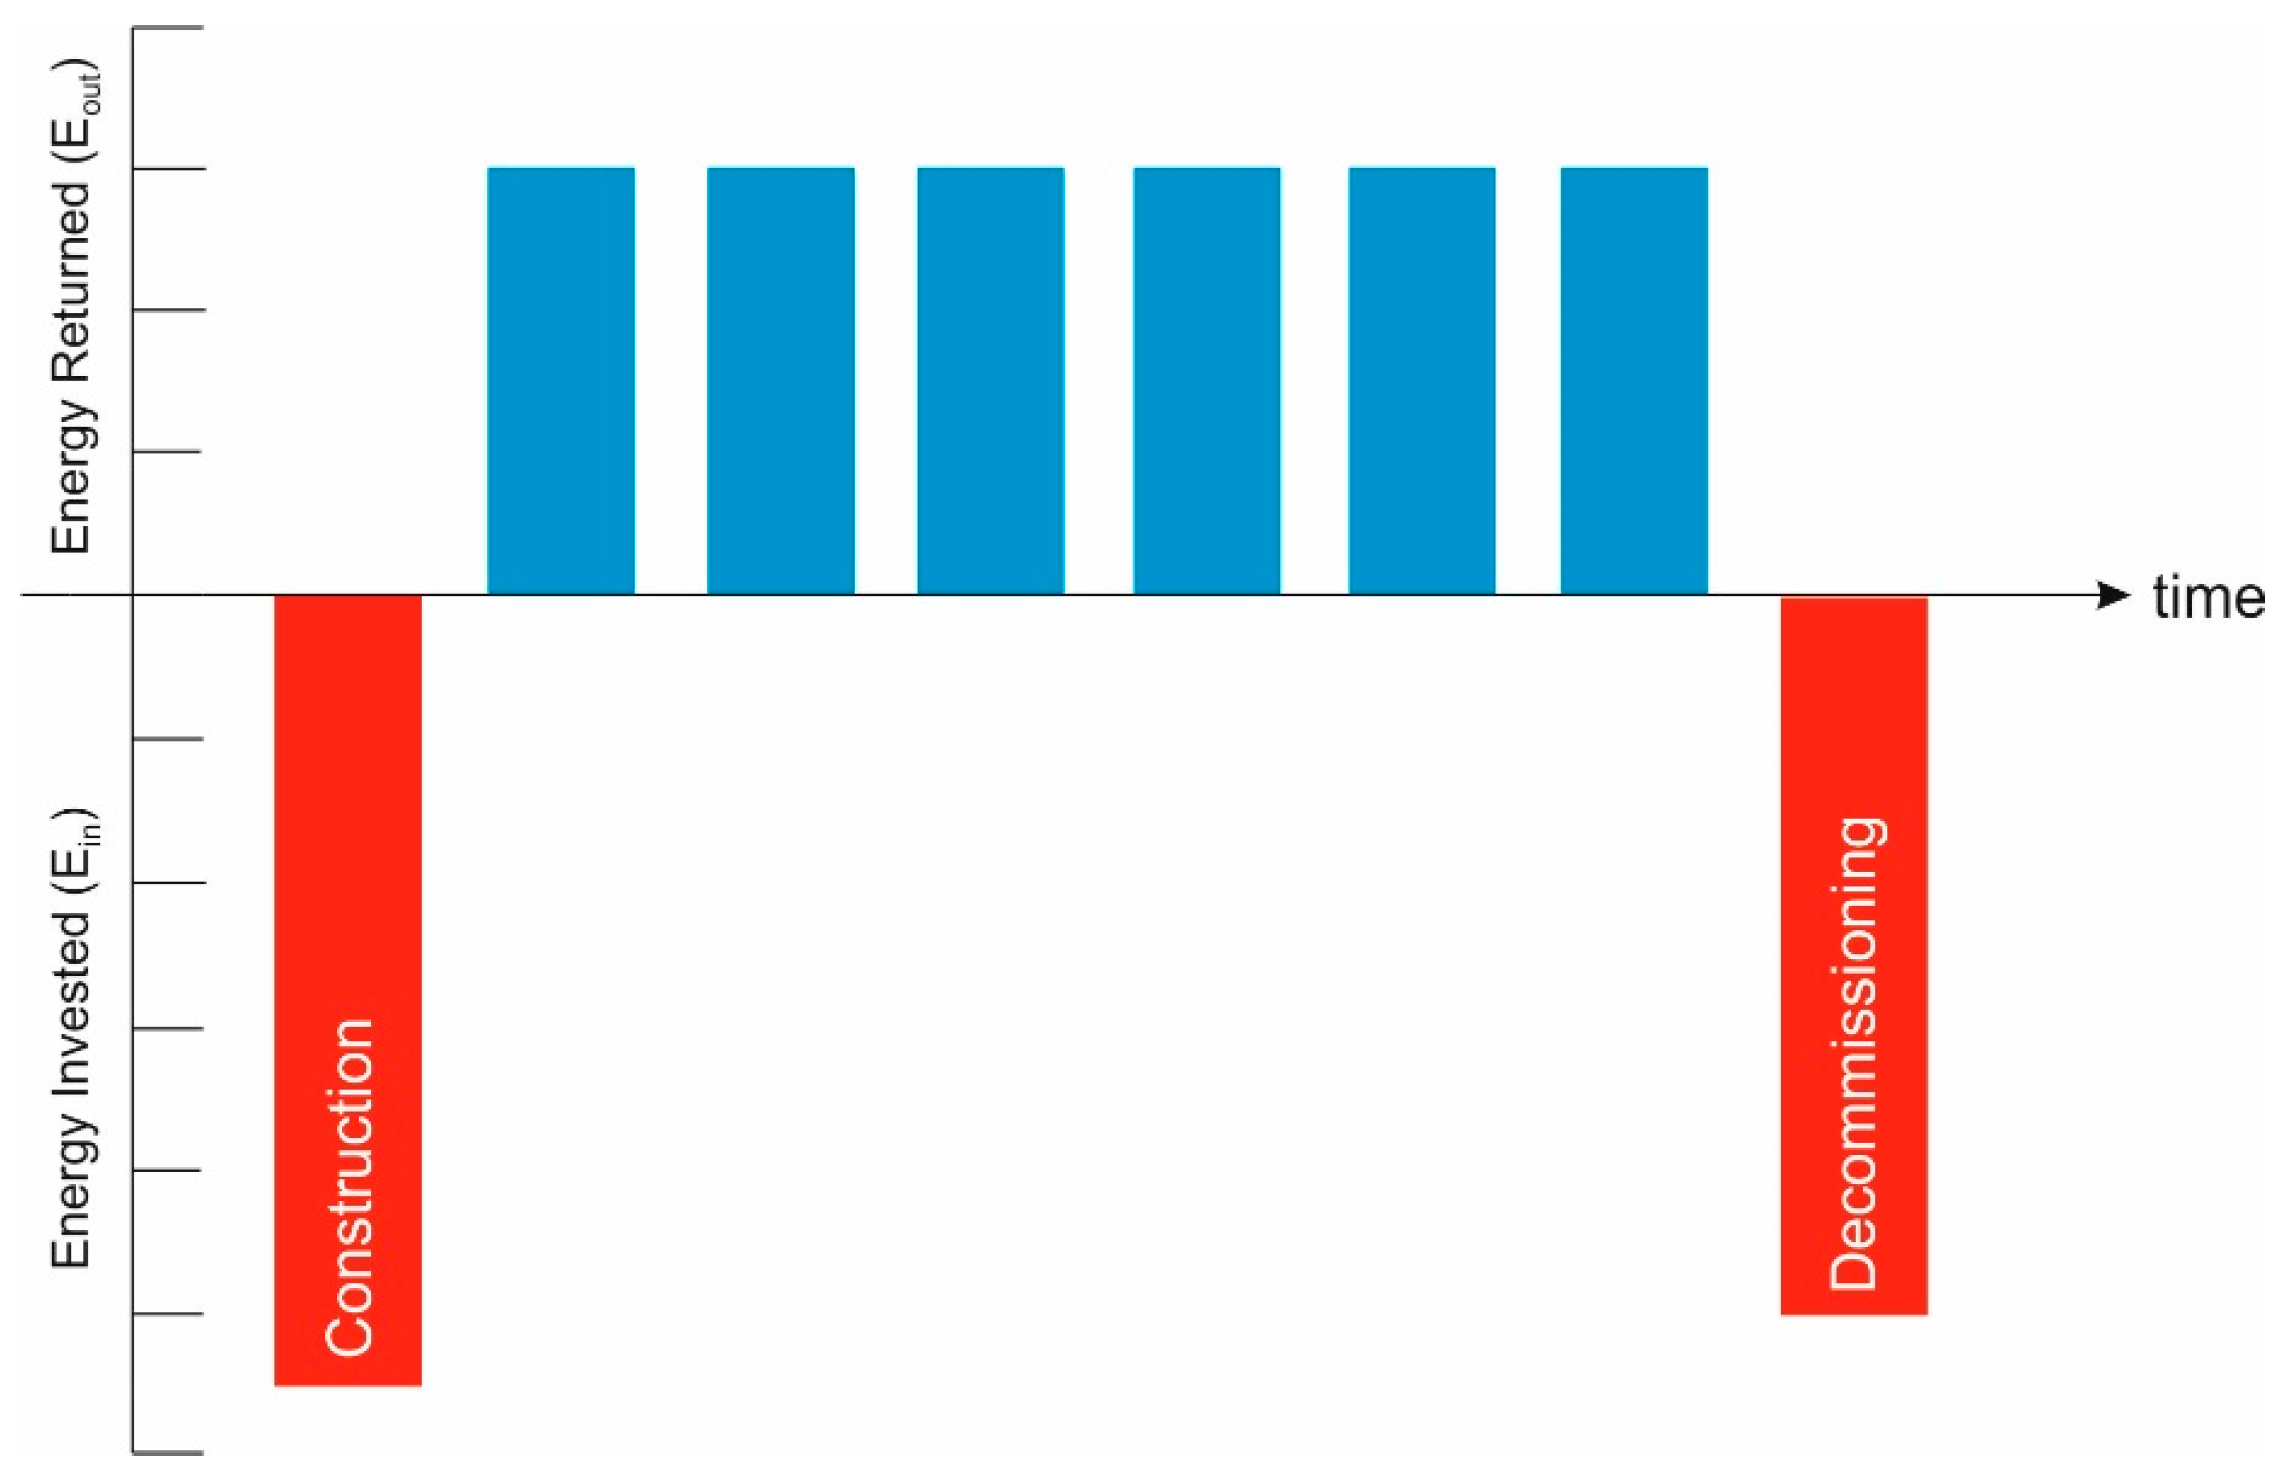
Depending on the chosen boundaries for the calculation of EROI, and data availability, a particular methodology can be applied for the accounting of embodied energy inputs. The two main methodologies used are process analysis and Input-Output (IO) [17]. The former is commonly used; it is a bottom-up approach most appropriate when assessing a single energy source through clearly defined processing stages [17]. As data collection can be problematic and time consuming when undertaking process analysis “from scratch”, established LCA data sets are sometimes used (see for example Harmsen et al. [40]). Although, as Arvesen and Hertwich [41] note, care is needed to ensure that LCA boundary conditions are consistent with the EROI calculation.
Given the boundary definition of our EROI nat , we have chosen to use IO; a top-down approach that is more appropriate when the boundary is expanded to multiple processes [17], e.g., when considering activities at a national level. This is due to it being able to quantify interrelationships across economic sectors [17], and even enable the attribution of embodied energy inputs to traded goods and services. Physical flows are estimated from monetary economic data in this approach, which is based on an economic transactions matrix (a table where all inter-industry transactions within a year are recorded in monetary terms) combined with an energy extension vector (which contains the amount of energy used by each industry in energy units). Matrix algebra calculations are used to determine the energy “footprint” or energy requirements of each industry’s products, in our case energy production. This methodology is explained in detail in Section 3.

2.3.3. Temporality

The timing of energy inputs and energy outputs over the functional life of the supply technology is important, since there are typically high energy inputs at the beginning (construction) and at the end (decommissioning) of the life of the energy extraction or capture location (see Figure 3). The issue of temporality does not, however, involve any sort of discounting of time (as it does in other types of metrics such as cost-benefit analysis). This is discussed in detail for the case of photovoltaic panels by Dale and Benson [7], King et al. [25] and Dale [42].
However, when the boundary is expanded over larger geographical spaces and several energy sources, obtaining such data for all energy sources is impractical, therefore a pragmatic approach is required. For our EROI nat we assume that the temporal patterns of energy inputs will balance out, since not all energy extraction or capture projects will be at the same stage of development. Therefore accounting for EROI nat in any given year broadly reflects the whole country’s EROI across all energy sources irrespective of the stage of development of specific energy extraction and capture projects. However, as Murphy et al. [17] point out “this assumption would be accurate only if the system is in ‘steady state’, i.e., not growing or shrinking”. An example of a recent study that assumed the energy system to be in a steady state is that of Herendeen [27].
Note that this pragmatic assumption may fail to capture shortfalls in energy available to the economy for an interim period. For example, in the context of rapid mitigation to address climate change, there is a need to invest heavily in capture or extraction technology for particular energy sources in a short period of time. In these sorts of periods, EROI nat values would be lower, and would be followed by periods of higher EROI nat once the technologies are in place [7]. However, as longer time-series EROI nat values become available, the effect on temporality of low/high energy investment will become clearer, which in itself will be a valuable finding. Therefore, EROI nat results should always be analysed in conjunction with energy investments and energy production data for the country being analysed. That way the assumption of the energy system being in a steady state can be determined to be true or not for the period under study, and the results can be interpreted accordingly.

2.3.4. Accounting for Energy Quality

How to account for the differences in energy quality of the different energy sources has been a persistent methodological issue in energy analysis, and hence also for conducting NEA. It is important to account for energy quality because thermal energy and electricity, for example, are very different in terms of their capacity to do work, but also in their density, cleanliness, ease of storage, safety, flexibility of use, etc. These differences should be accounted for since they are relevant for societies and economies. However, and despite its importance, most EROI studies do not undertake any form of energy quality adjustment. At a national-level, where different energy sources are being studied together, it becomes very significant to make energy quality adjustments in order to be able to compare “apples to apples”.
There are, in general, two approaches for accounting for differences in energy quality: price-based and physical units [17]. The price-based approach is used more often when accounting for energy inputs using a top-down approach given the extent of economic data [22]. However, this approach rests on contentious assumptions of competitive markets and lack of accounting for externalities [43]. The physical units approach on the other hand, is used more often in process analysis, where detailed physical data are available. Moreover, there is recent work that has been using physical units, in particular exergy, to account for thermodynamic energy quality at a national-level [44,45,46,47]. Exergy can be defined as “the maximum possible work that may be obtained from a system by bringing it to the equilibrium in a process with reference surroundings” [48]. As Gaggioli and Wepfer [49] state, exergy “is synonymous with what the layman calls ‘energy’. It is exergy, not energy, that is the resource of value, and it this commodity, that ‘fuels’ processes, which the layman is willing to pay for” (for further details on exergy see Wall [50,51,52], Kanoglu et al. [53], Dincer [54], Rosen [55,56], Sciubba and Wall [57]). Nonetheless, it is important to acknowledge that exergy does not account for certain aspects of energy quality that are important for economic purposes (e.g., capacity for storage, cleanliness, transportability, density, and so on) [17,43].
We have not made a specific quality adjustment for the calculation of EROI nat , and we consider this to be a key avenue for future research, ideally using useful exergy, particularly taking into account the social and economic importance of being able to compare fairly different energy sources based on their usefulness. For consistency purposes we have relied on the physical content method used by most international energy agencies, by which the primary energy equivalent of any renewable energy source is its physical energy content [58]. Given that our boundary of analysis is taken at the production stage, this correction is less important than if we chose final consumption or useful energy as the boundary of analysis.

3. A national-Level EROI: The Data and the Methodology

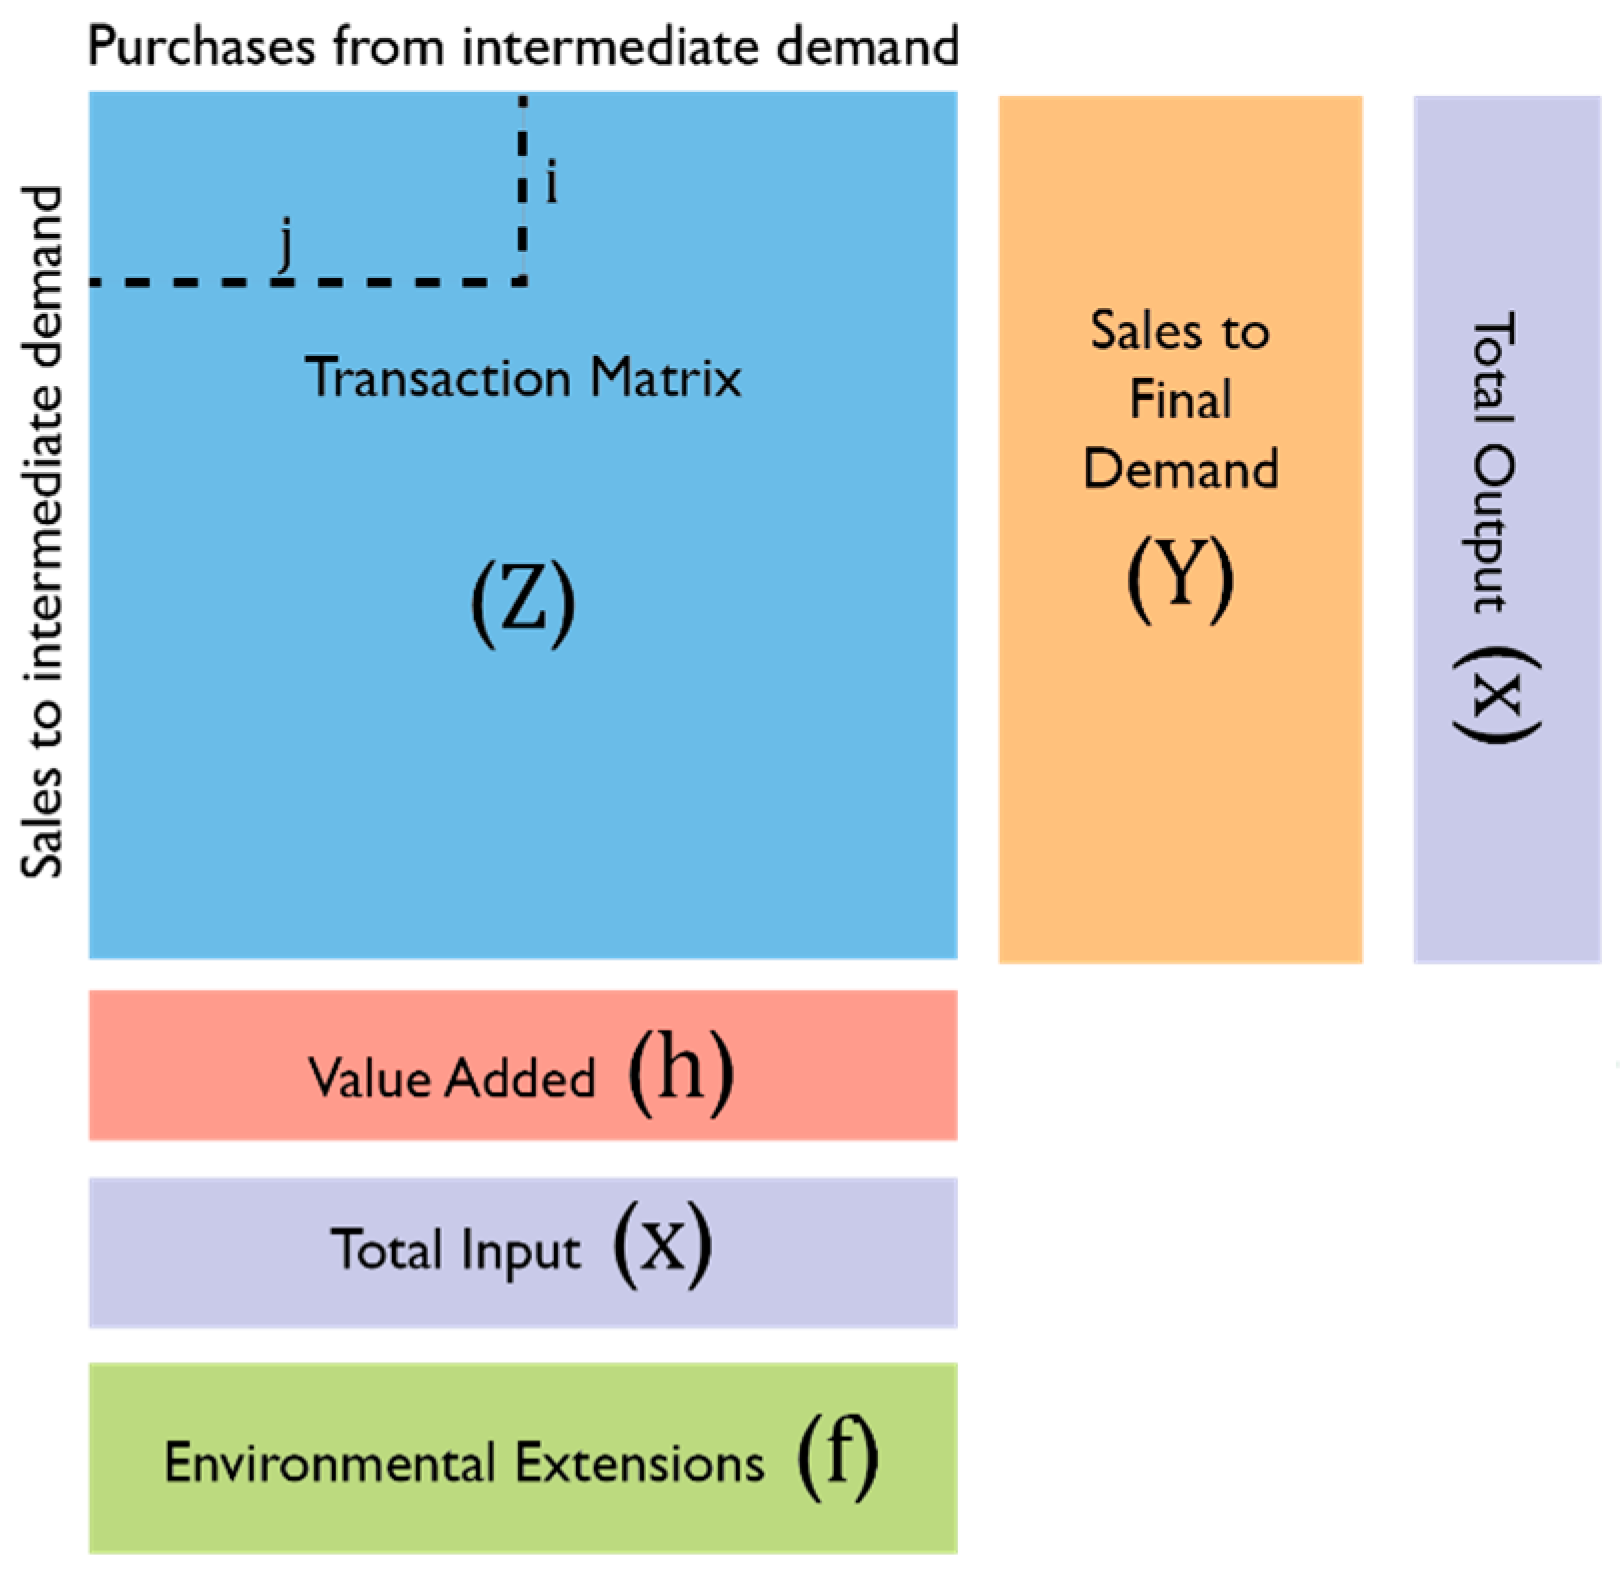
3.1. Input-Output and Energy

Like many other energy analysis techniques, energy IO analysis was developed in the 1970s driven by the oil price shock of the time [59]. It has been mainly used to quantify energy flows through the different economic sectors (see for example [60,61,62]). However, to the best of our knowledge, it has not been used to directly calculate an empirically-based national-level EROI value using an MRIO modelling approach. Following a similar line of enquiry, Brandt [63] recently developed a mathematical Input-Output framework for assessing the mechanisms by which EROI affects a country’s prosperity. We will now describe the data that we use to calculate EROI nat for the UK ( EROI nat ( UK ) ) for 1997–2012, followed by a detailed description of the IO methodology.

3.2. EROInat(UK): Data

We use IEA data [64] and a Multi-Regional Input-Output (MRIO) model to construct a Multi-Regional Input-Output model for the UK (UKMRIO), using IO data produced by the UK’s Office of National Statistics [65]. This data is supplemented with additional data on UK trade with other nations and how these other nations trade between themselves from the University of Sydney’s Eora MRIO database. The Eora MRIO database [66,67] is used to disaggregate the UK’s import and export data to further sectors from other world regions. Since Eora contains data from almost 200 countries, we are able to select the most appropriate regional grouping for the trade data. For this study, we construct six regions: the UK, the Rest of Europe, the Middle East, China, the Rest of the OECD, and the Rest of the World. We consider these regions to be the most appropriate ones for our analysis, since they group major economies as well as separating by key energy producers. The UKMRIO is based on 106 sectors, two of which are energy industries/sectors relevant to our boundary definition (i.e., extraction/capture industries). A basic structure of an Input-Output model is shown in Figure 4. Following a standard procedure in IO modelling, an environmental extension for energy production relating to each transaction is added in physical units (MJ), though the main IO table is based on monetary units [68]. This could be considered a drawback of this dataset, which uses a direct impact coefficient approach (or energy intensity approach). However, its use is justified by data availability and unit consistency. There are no MRIO energy extended databases that we know of that use a hybrid-unit approach, although a single region IO hybrid-unit matrix with an energy extension was constructed by Guevara [69] for Portugal using IEA (International Energy Agency) data.

3.3. EROInat(UK): Methodology

Our approach aims to track all indirect energy investment requirements of the energy sector. It does so by using a whole economy’s transaction matrix to allocate energy sales and purchases to every industry, and then track down the paths that lead to the energy industry itself. In this case, EROI nat ( UK ) attempts to trace the indirect energy flows used by the UK’s own energy sector in order to extract/capture energy (represented by black arrows in Figure 2). By using a MRIO model, we can take into account indirect energy investments that originate overseas (see Figure 2). We consider it to be a novel application of a well-established methodology in the field of emissions accounting.
As described in Section 2.3.1, the system boundary is drawn at the extraction/capture stage; therefore Equation (2) is consistent with Equation (1):
EROI nat ( UK ) = E out   E in
where: E out = net energy outputs from extraction/capture from the UK’s energy sectors (or energy output from extraction in Equation (1)); E in = direct and indirect energy inputs (from the UK and abroad) to the UK’s energy sectors (as in Equation (1)).
The energy return at a national level, E out is calculated using Equation (3):
E out = E T   E dE
where: E T = total primary energy produced in the UK. This is taken from “production” in IEA energy balances; E dE = total UK energy sector’s direct energy use used to extract/capture UK’s energy. This is taken from “energy industry own use” in IEA energy balances.
Similarly, the energy invested in producing this, E in is calculated from Equation (4):
E in = E dE +   E iE
where: E iE = total indirect energy use (both from the UK and the other 5 regions) used to extract/capture UK’s energy. In other words, this is the embodied energy used by the UK’s energy extracting/capture sectors in order to produce energy.
Having constructed the UKMRIO model, E iE can be calculated, following the detailed matrix algebra IO procedure described in Appendix A, together with a simple numerical example (see Appendix B).
Finally, the EROI at a national level for the UK is calculated by substituting these expressions into Equation (2), leading to Equation (5):
EROI nat ( UK ) = E T   E dE   E dE +   E iE

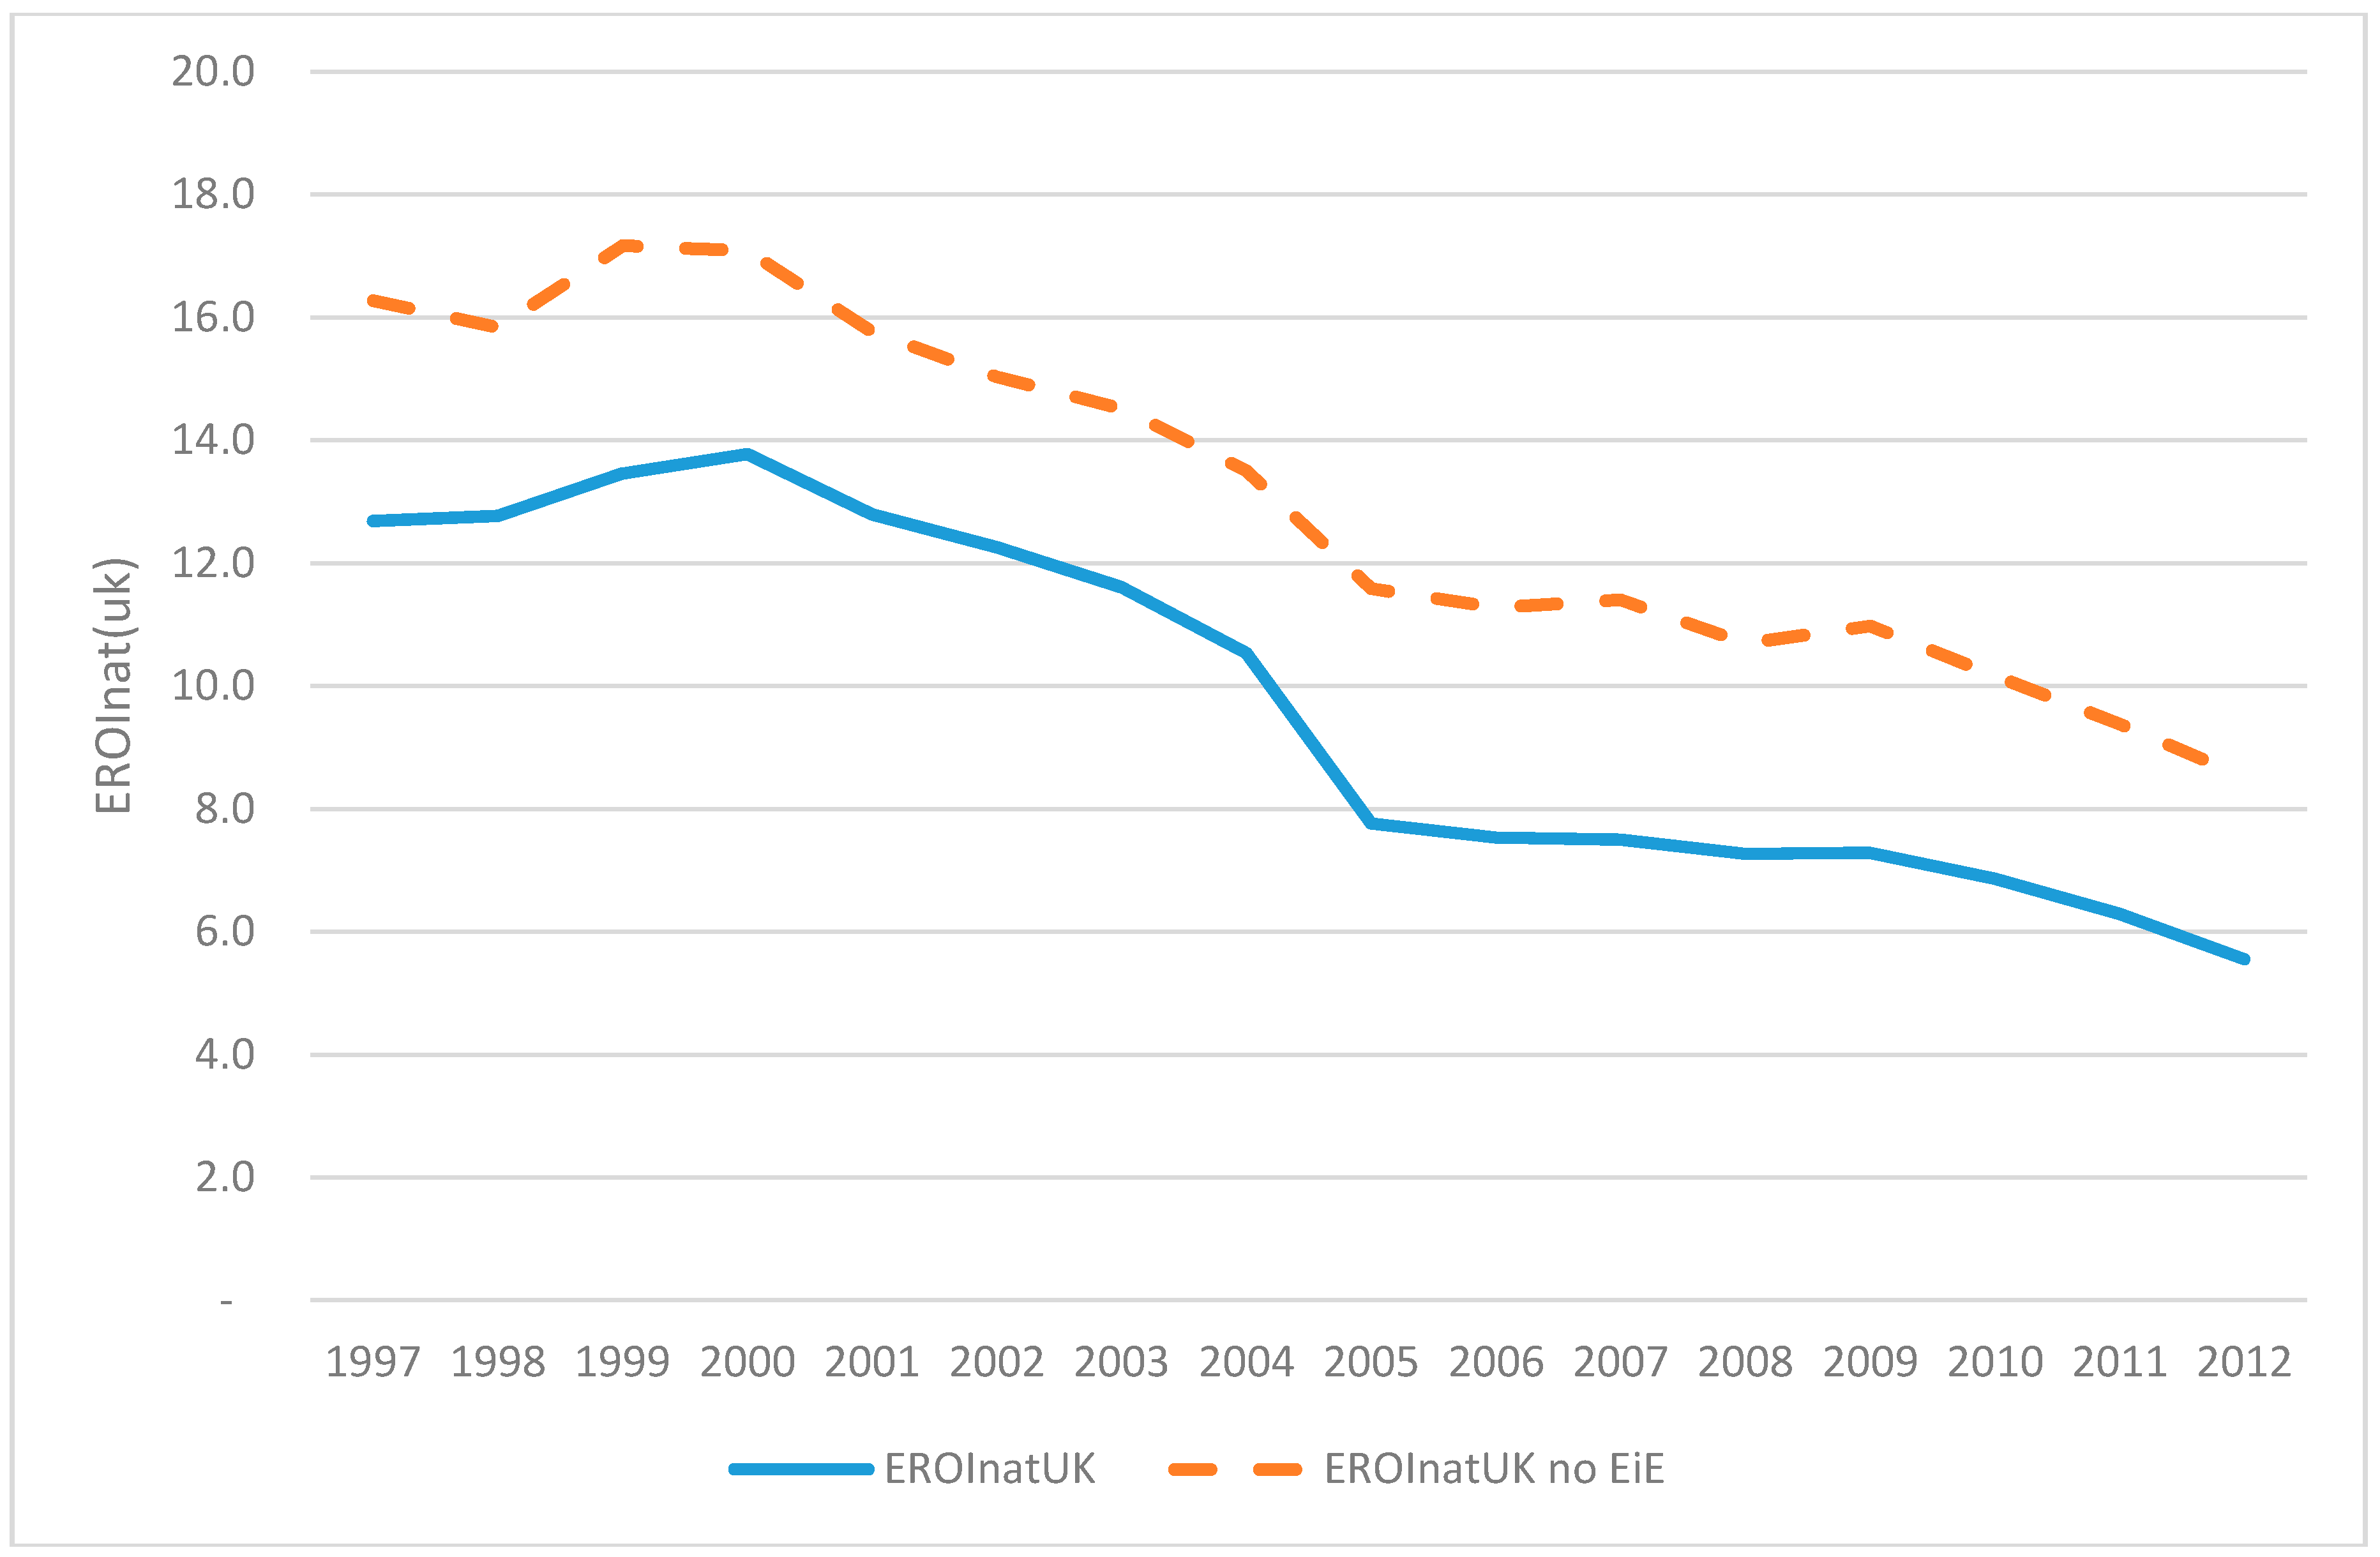
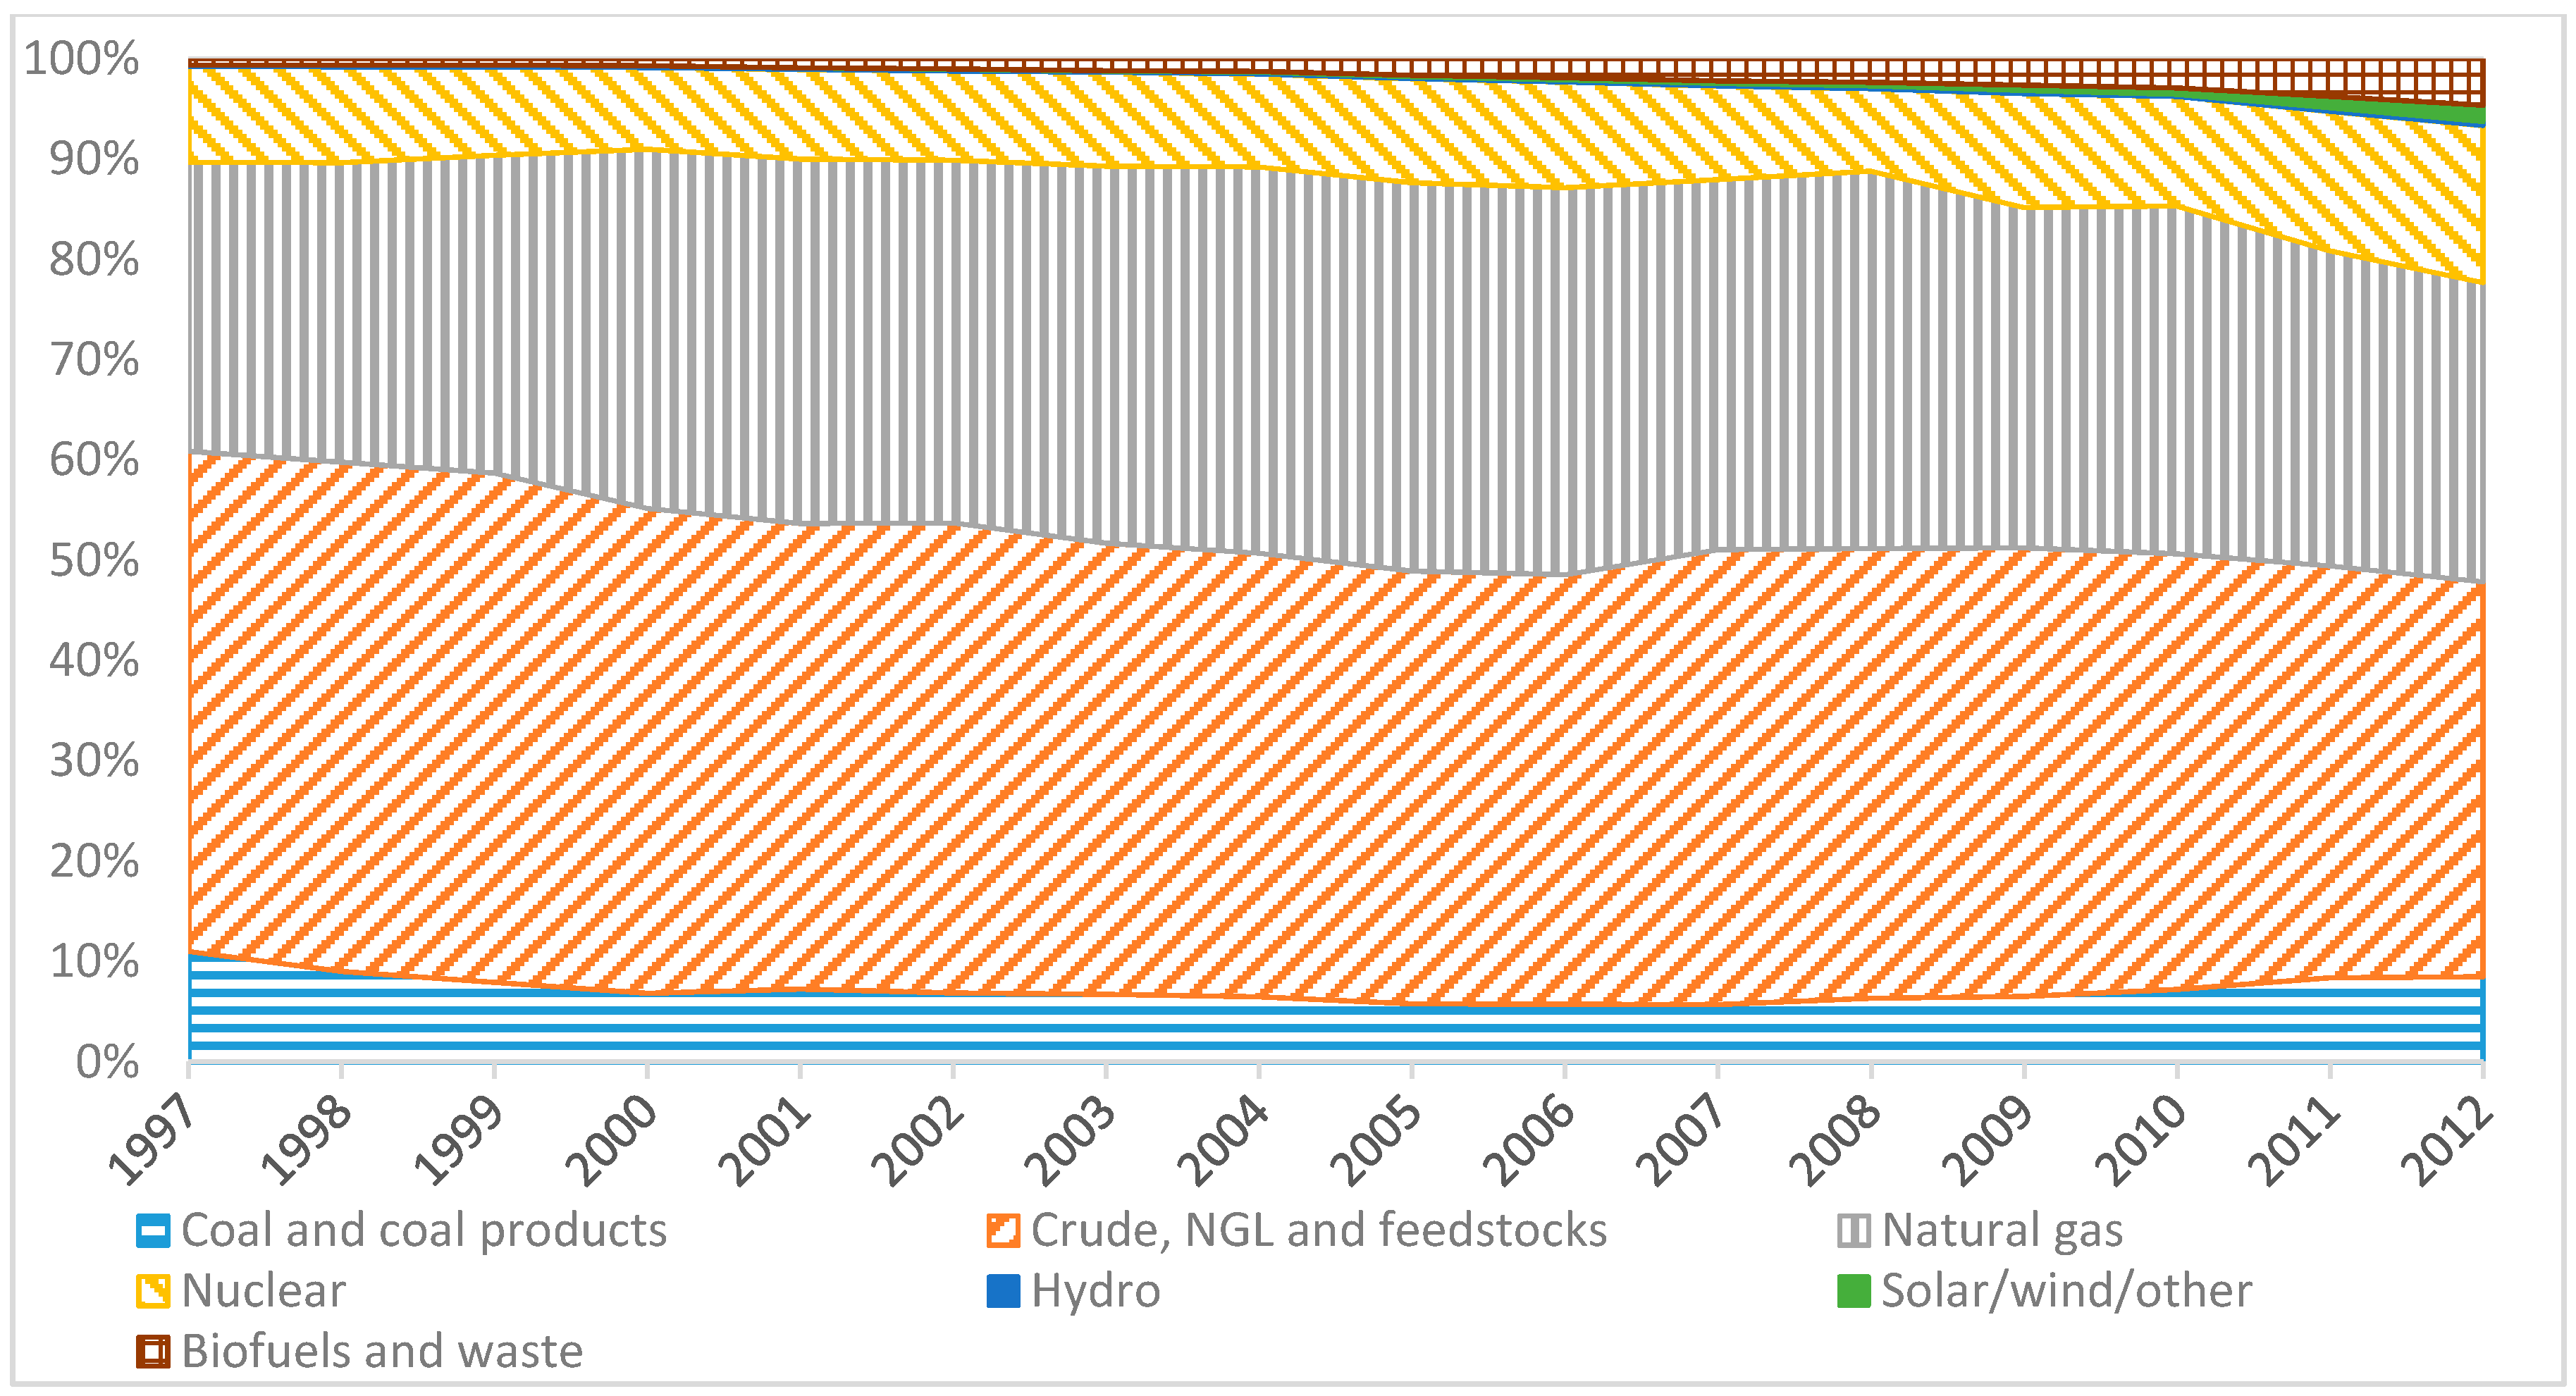
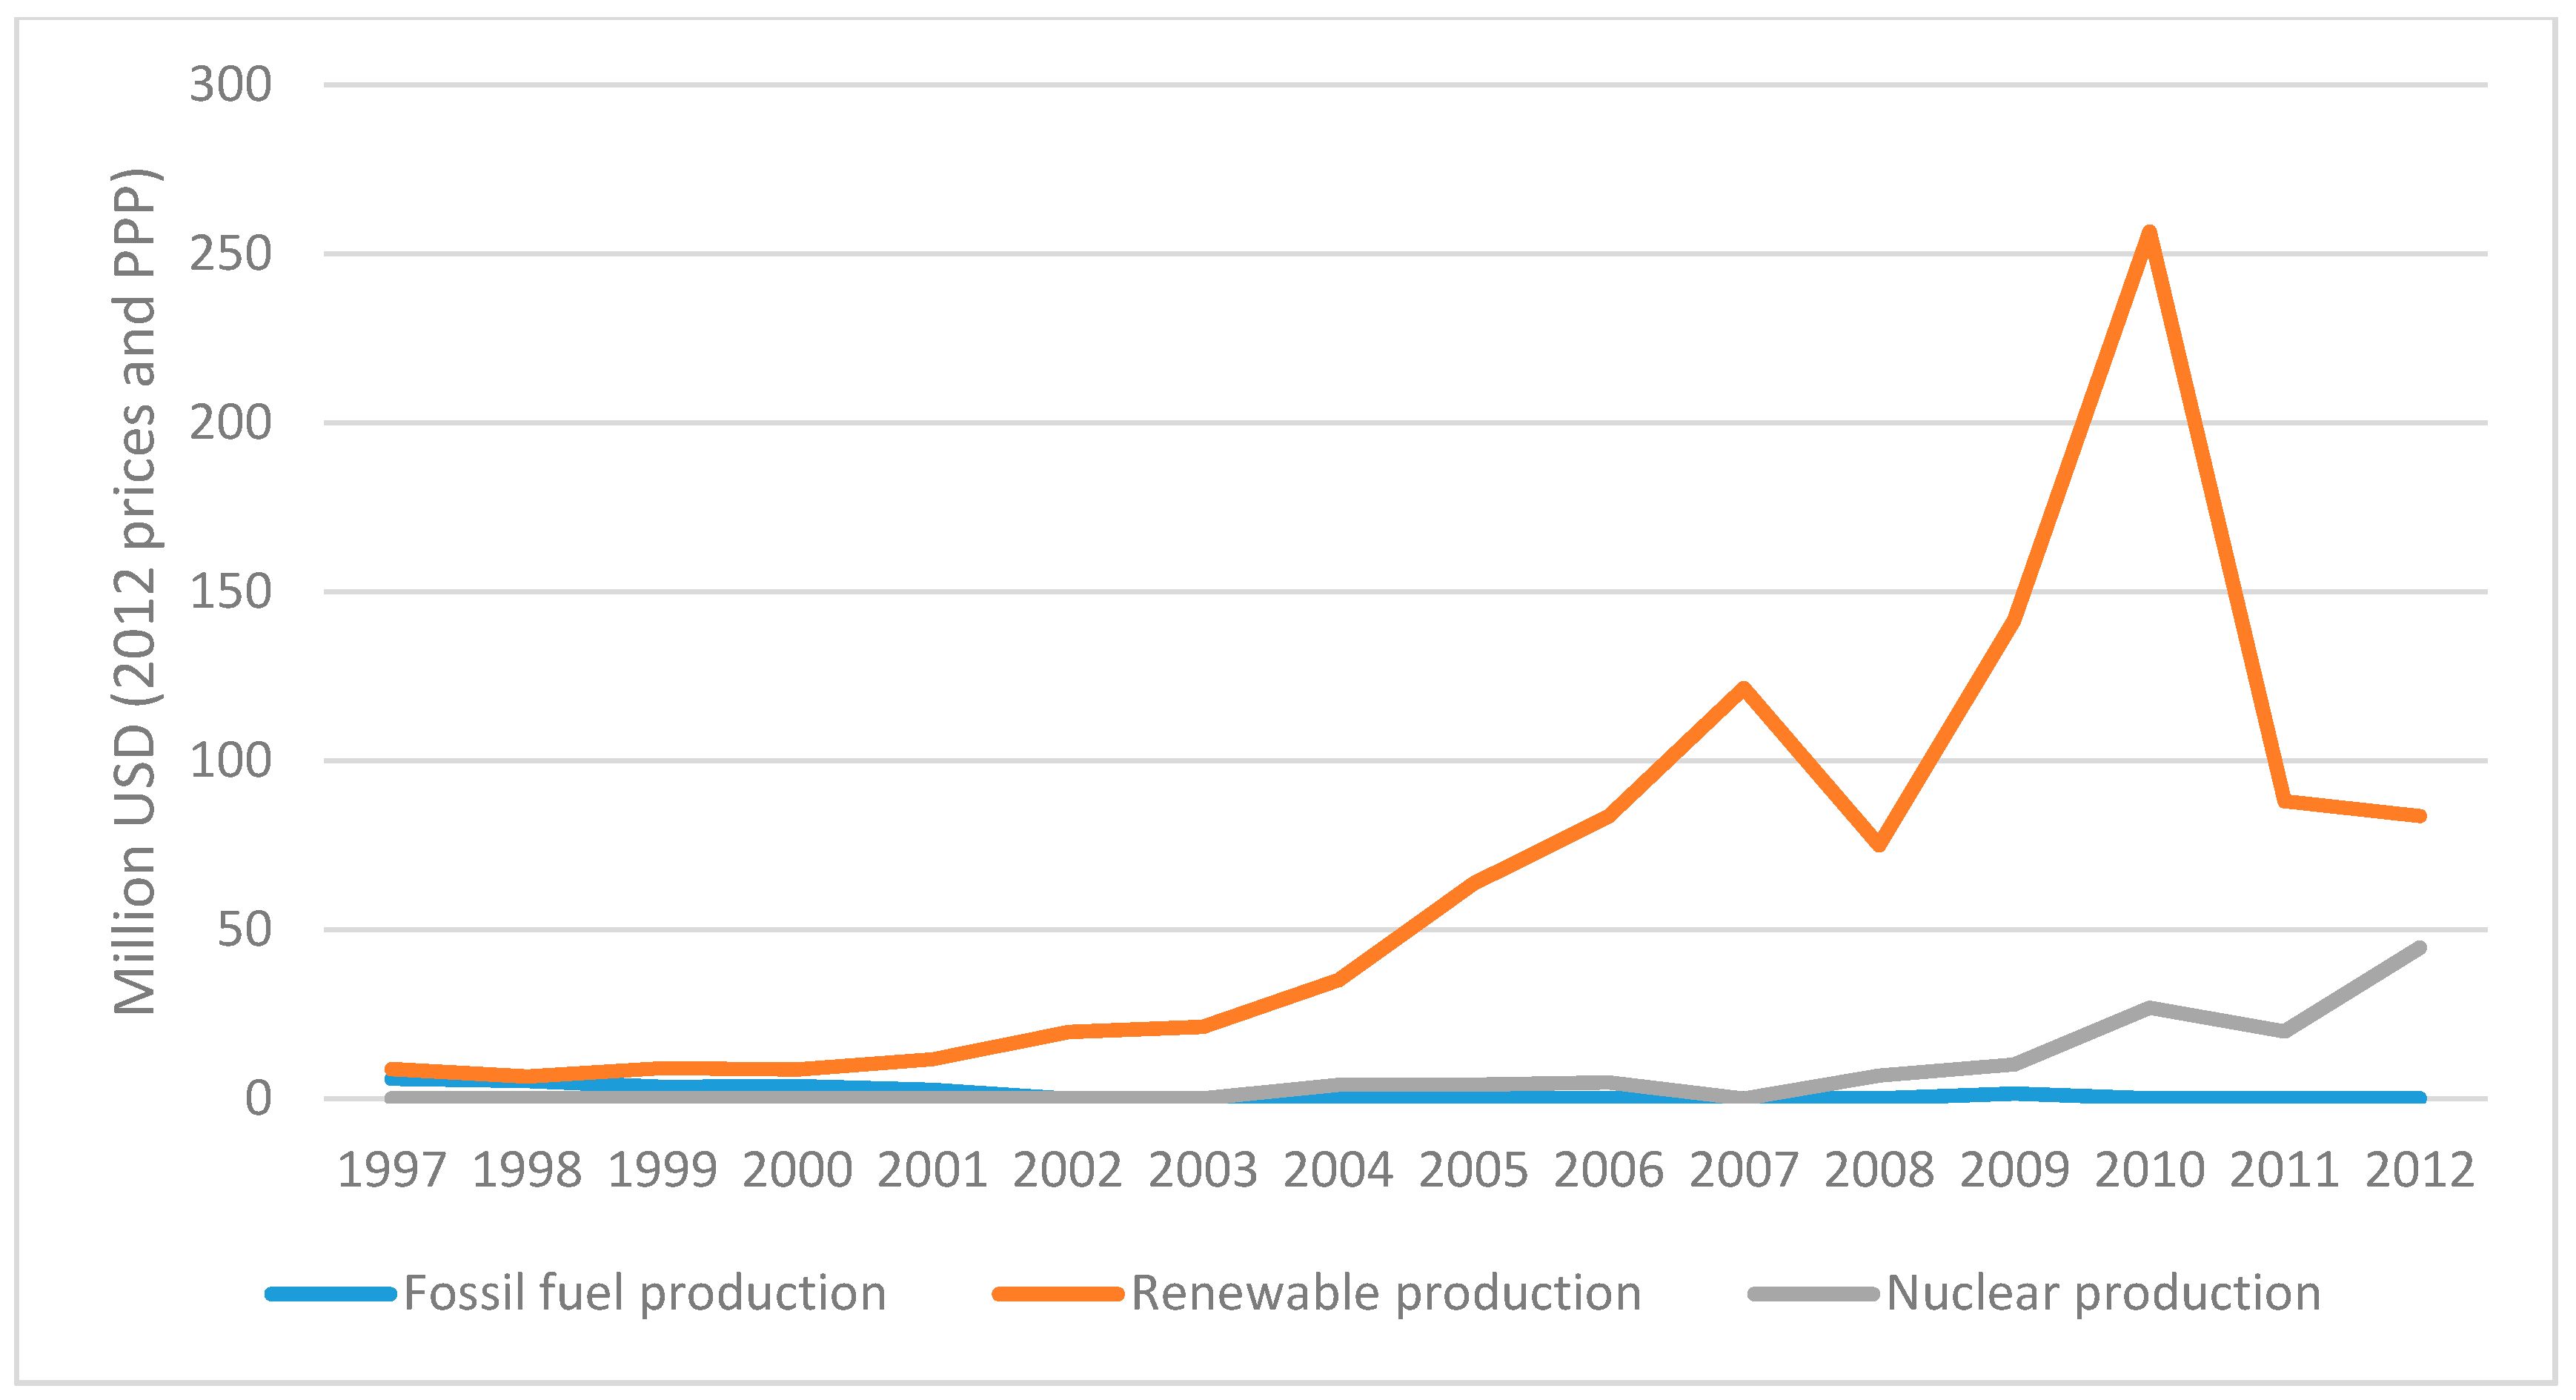
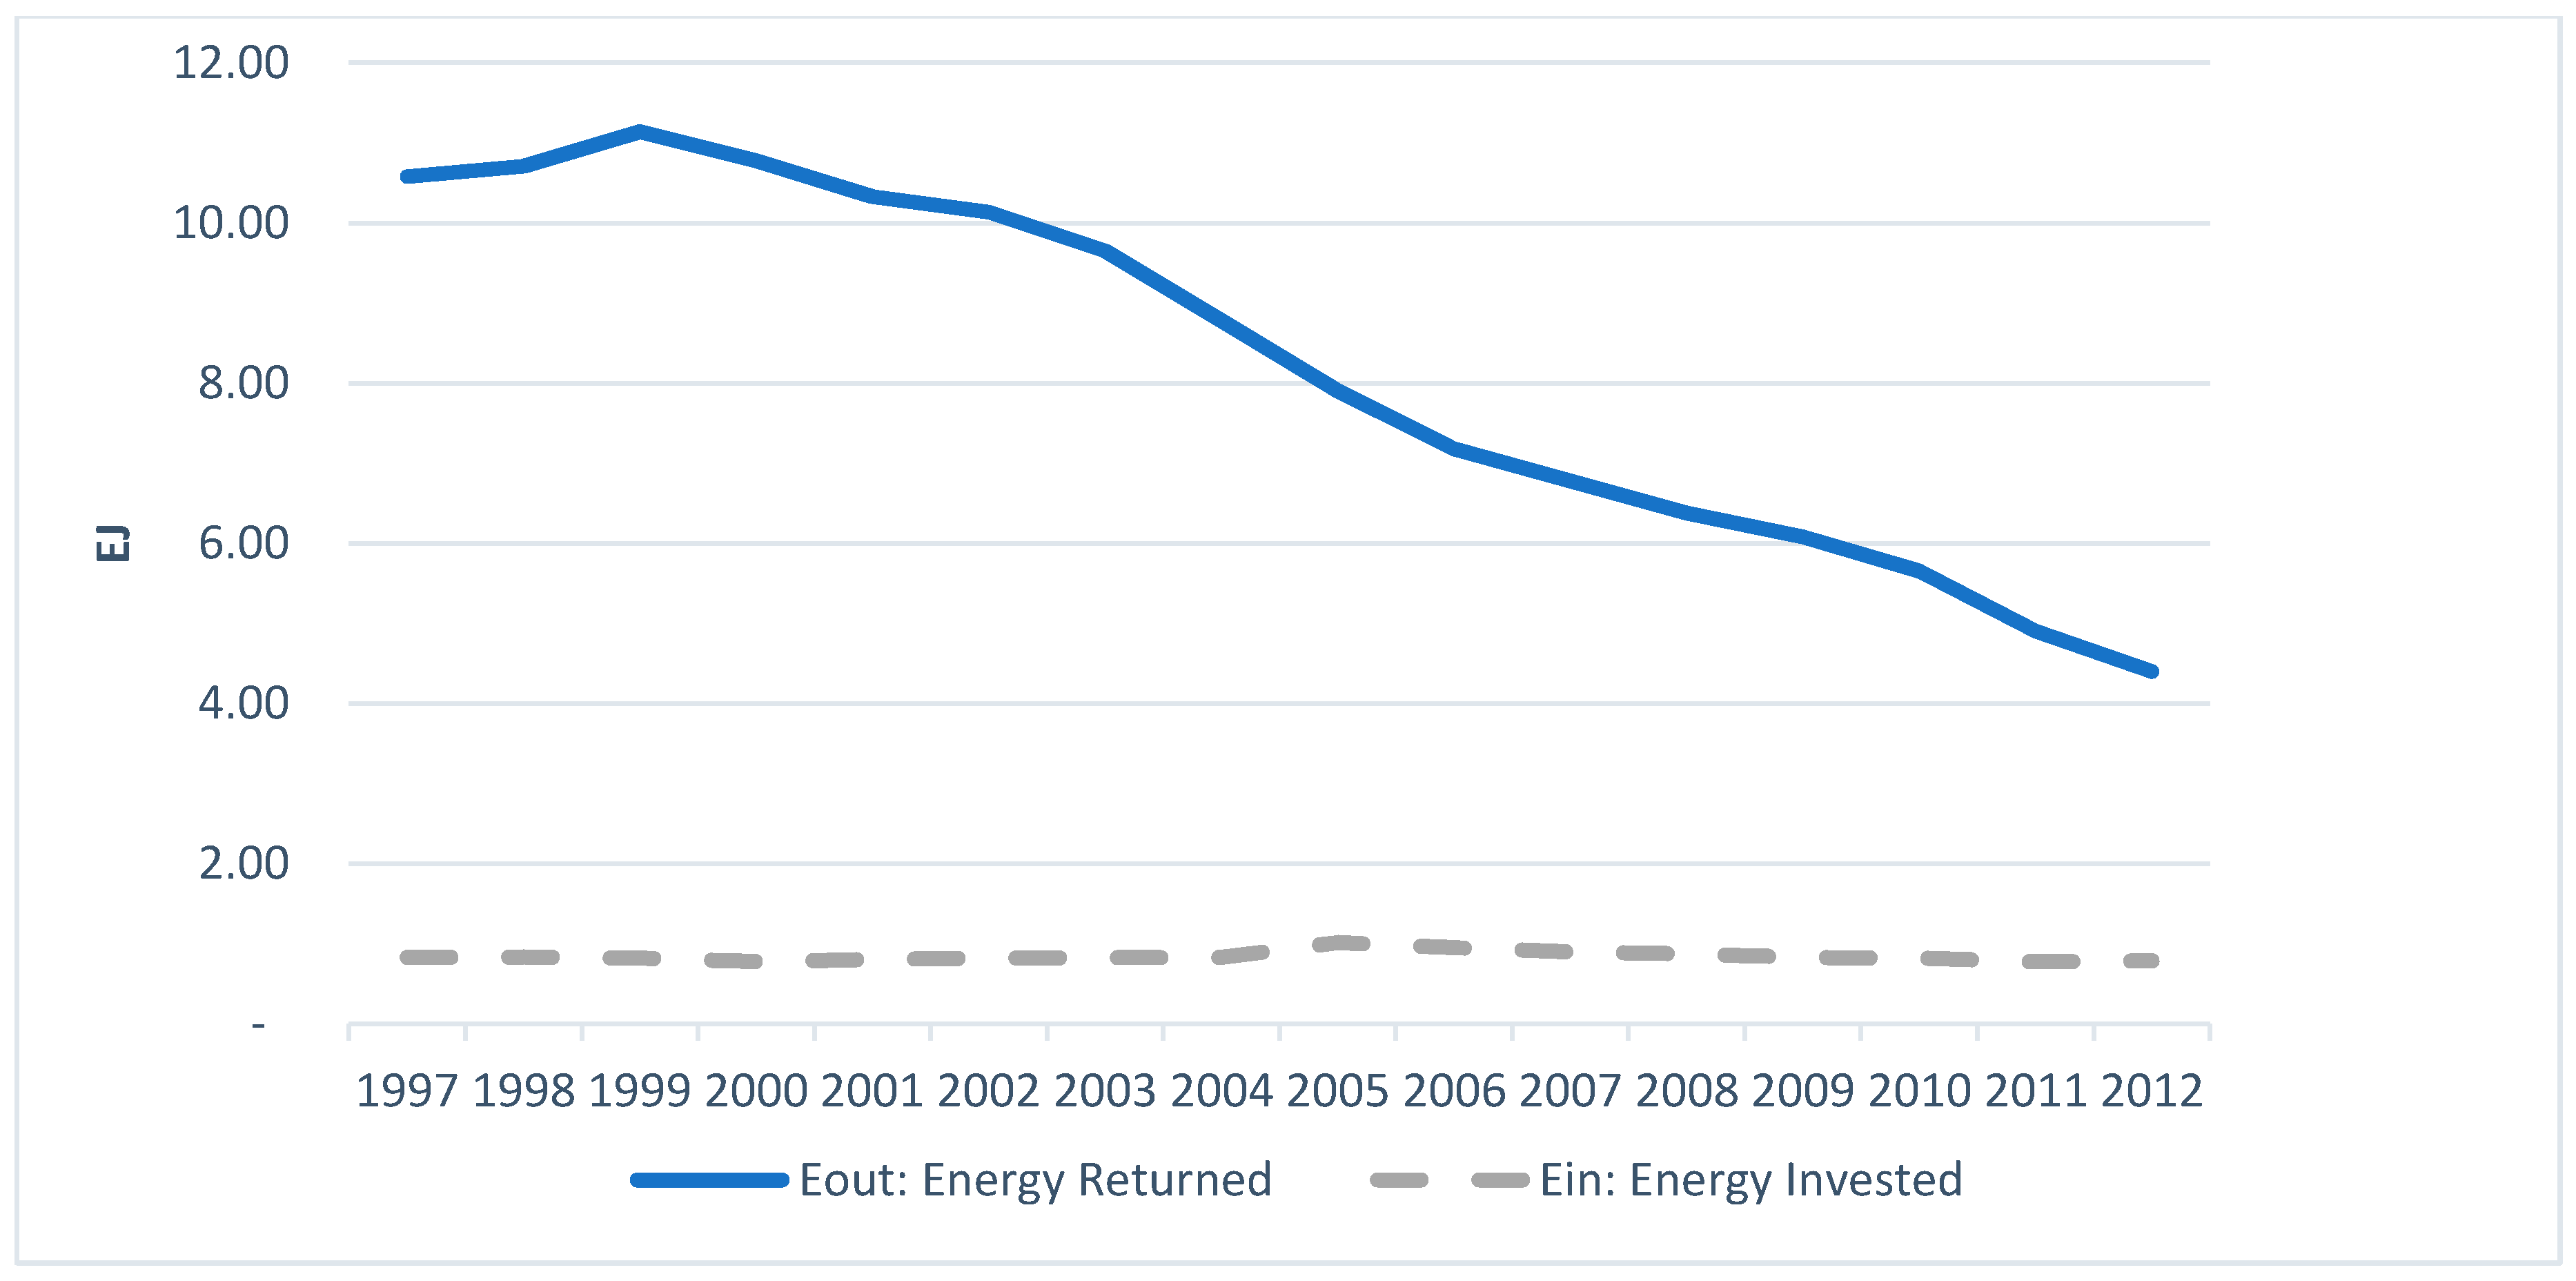
4. Results and Discussion

Applying the UK IO data, IEA data and MRIO model to Equation (5), we calculated the   EROI nat   for   the   UK     for the period 1997–2012. We found that the EROI nat ( UK ) for the period increased from 12.7 in 1997 to a maximum value of 13.8 in 2000, before gradually falling back to a value of 5.6 in 2012 (Figure 5). This means that for every unit of energy the UK energy extracting/capture sectors have invested, they have obtained an average of 10.2 units of energy during the period 1997–2012. In other words, on average, 9.8% of the UK’s extracted/captured energy does not go into the economy or into society for productive or well-being purposes, but rather needs to be reinvested by the energy sectors to produce more energy.
This of course has implications for the energy sector, for resource management and technology development, and for the economy, as described in Section 2.2. If Fizaine and Court [26] are right in their assessment, where a minimum societal EROI of 11 is required for continuous economic growth (assuming the current energy intensity of the US economy), the UK is below that benchmark. It is important to note that although Fizaine and Court [26] use a completely different methodology to ours (econometric techniques), their boundary of analysis is set at the same national-level. However, since we are not accounting for energy imports, the EROI associated to the 84% of total primary energy supply that came from imports in 2012 into the UK [64] might move the UK’s consumption-based EROI above Fizaine and Court’s benchmark. Nonetheless we consider their results useful in terms of showing certain consistency in the range of values for national-level EROIs and as a good contribution to the discussion.
Figure 5 also shows the relevance of including indirect energy (EiE) in the calculation of EROI nat ( UK ) .   An EROI nat calculation, using only energy industry’s own use as the energy inputs gives higher values because there is an element missing in the denominator. By including indirect energy use (EiE), using the IO methodology described in Section 3.3, we obtain a more complete view of the energy invested into the energy producing sectors. This is the key contribution of the methodology we outline here and a step forwards in the EROI literature. Our calculations for the UK without including indirect energy (EiE) are the same order of magnitude to King et al.’s [23] calculations of EROI (or net power ratio—NPR as they call it).
The evolution of the energy returned (numerator Eout) and the energy invested (denominator Ein) are shown in Figure 6. Since 1999 the UK’s production of energy has been declining steadily (compensated by increased imports that are not included in EROI nat ( UK ) ). For a national-level EROI from a production perspective, this means that we are extracting/capturing less energy by using a relatively stable stream of energy inputs. Thus the steady decline of EROI nat ( UK ) from 2003 onwards.
Furthermore, considering that oil and gas dominate the UK’s energy production mix (see Figure 7), changes in the EROI values of these particular fuels are likely to dominate the changes in the UK’s EROI nat . From literature reviews on the EROI of different energy sources, there seems to be a consensus that on average coal has the highest EROI, followed by oil and then gas [16,29]. Therefore, the steeper decline of EROI nat ( UK ) from 2010 onwards is partially explained by a reduction in the proportion of those three fossil fuels in the UK’s total production (see Table 1).
One drawback of our current approach to calculating a national-level EROI is that it cannot provide energy source specific information about in which years energy investments are made and energy returns are obtained (we would see this as part of an extended future methodology). Therefore, the validity of our current results rests in the assumption the UK’s energy system was in a steady state in terms of energy production between 1997 and 2012. We are aware that this is a very stringent assumption to make. As we suggested in Section 2.3.3, these results should be analysed in conjunction with energy investment and production data, to assess how steady the system has been. We present in Figure 8 the financial investment data in the UK’s energy production by source, where we can see that the system has been very stable in terms of fossil fuel and nuclear production. There have been significant investments in renewable sources, but since they only represent a small fraction of total UK production (see Figure 7), their effect should not be too big on our EROI data. However, in terms of energy production data, we can see from Figure 6 that the UK’s energy production has been declining for most of the period under analysis.
We believe that there is value in this type of calculation in that by providing a time-series, our proposed approach offers an important long-term dynamic view of the evolution of EROI at a national scale, where periods of high energy investments in one energy source can be compensated with periods of high energy returned in other energy sources. The greater availability of IO data would allow for time-series to be constructed for other countries, and we suggest this to be undertaken as future research. In this sense, we present our results to the research community in the hopes of opening a constructive discussion.

5. Conclusions and Policy Implications

This paper developed and applied a new approach to quantify EROI for national economies, particularly when it comes to calculating indirect energy inputs. It contributes to the growing literature on net energy analysis. The approach is based on Input-Output analysis and is, to the best of our knowledge, a novel application of MRIO datasets which has been enabled by the advances in IO data gathering and computing power. Its key contribution is to provide an estimation of indirect energy investments at a national level. Hence, we consider it a step forwards towards the called made by Murphy and Hall [16] for improved “quantity and quality on the data on ‘energy costs of energy generating industries’”.
The relevance of a national-level EROI lies in its potential to inform national-level energy policy making: in general, countries should aim to have high levels of EROI nat , since this means more net energy is available for use in the productive economy. The trends in EROI nat ( UK ) over time provide information on the relative resource depletion and technological change in the UK’s energy sector. We found that the UK as a whole has had a declining EROI in the first decade of the 21st century, going from 9.6 in 2000 to 6.2 in 2012. This information is important, particularly for a country that is aiming to transition to a low-carbon economy. Low levels of EROI nat for a country investing heavily in renewables are to be expected initially. Our results show that towards the end of our period of analysis more energy was having to be used in the extraction of energy compared to the beginning of the century. This may be explained by a declining production of primary energy within the UK as well as more investments in renewable energy sources. This trend should be closely monitored by energy policy-makers, in order to ensure that, as renewable energy capture technologies improve, the EROI nat ( UK ) trend also improves.
Other authors [25,27] have attempted to connect EROI values to the price of energy and other services in order to give them more policy relevance. We argue that the methodology described here has the potential to inform national and international energy policy. Once developed further, for more countries and more years, the results can answer important questions such as: Which countries are extracting and capturing energy with a better return to their energy invested? Which countries are doing better in terms of technological development and/or resource conservation? How do EROI nat values for different countries relate to their energy imports and exports? Therefore, we suggest two avenues for future research: first, apply this methodology for more countries and more years; and second, extend the methodology to develop a national-level EROI from a consumption perspective, i.e., expanding the boundary of analysis (an effort that would complement the work of Herendeen [27]).
As a final thought, in 1974 the US passed a law such that “all prospective energy supply technologies considered for commercial application must be assessed and evaluated in terms of their ‘potential for production of net energy’” [71]. This was triggered by the 1973–1974 oil crisis, where high energy prices led to a greater focus on energy efficiency and net energy returns. Once oil supply issues had returned to normal the law was abandoned as the additional calculations were regarded as unnecessary. Given the emerging interest in alternative tools for energy analysis and the pressing need of a transition to a low carbon economy, perhaps it is time to reinstate the importance of undertaking such analysis. Even if the EROI values of renewables may increase in future from current relatively low values—there is contrasting evidence on current values [8,9]—we need to better understand what that would imply for our economies and societies. For the guidance of national energy policy, EROI at a national level could help inform policy decisions that aim to manage an energy transition [72].

Supplementary Materials

The MatLab code we used for the calculations in this paper has been stored with the University of Leeds Data Repository at https://doi.org/10.5518/185.

Acknowledgments

We would like to thank Michael Carbajales-Dale for very useful comments on a previous version of this paper. Additionally, we would like to thank Charles Hall and Jessica Lambert for their contributions to the original abstract for this paper. We gratefully acknowledge the support of the Engineering and Physical Sciences Research Council (EPSRC) and Arup for contributing to the Ph.D. CASE (Collaborative Award in Science and Engineering) scholarship under grant reference EP/K504440/1 of Paul Brockway. Anne Owen’s time (and Paul Brockway’s time in the latter stages of this paper) was funded as part of the research programme of the UK Energy Research Centre (UKERC), supported by the UK Research Councils under EPSRC award EP/L024756/1. The support of the Economic and Social Research Council (ESRC) is also gratefully acknowledged in contributing to the Ph.D. of Claire Copeland. The work contributes to the research programme of the ESRC Centre for Climate Change Economics and Policy. Finally, we acknowledge the support of Colciencias for contributing to the PhD of Lina I. Brand Correa.

Author Contributions

The research was conceived by Lina I. Brand-Correa, Timothy J. Foxon, Paul E. Brockway, Peter G. Taylor and Claire L. Copeland; the design of the research was undertaken by Lina I. Brand-Correa and Anne Owen, with significant contributions from Paul E. Brockway; Anne Owen and Paul Brockway provided the data; Lina I. Brand-Correa, Paul Brockway and Anne Owen analyzed the data; Lina I. Brand-Correa wrote the paper with contributions from all the authors; Timothy J. Foxon, Peter G. Taylor and Claire L. Copeland provided conceptual and analytical feedback throughout the duration of the research.

Conflicts of Interest

The authors declare no conflict of interest.

Appendix A

Appendix A.1. A Note on Notation

A bold lower case letter represents a vector. A bold capital letter represents a matrix. Non-bold lower case and capital letter represent scalars. A vector with a “hat” (   ^ ) represents a diagonal matrix, whose diagonal elements are the elements of the vector. I is the identity matrix, and is a matrix of zeros whose diagonal is made of ones.

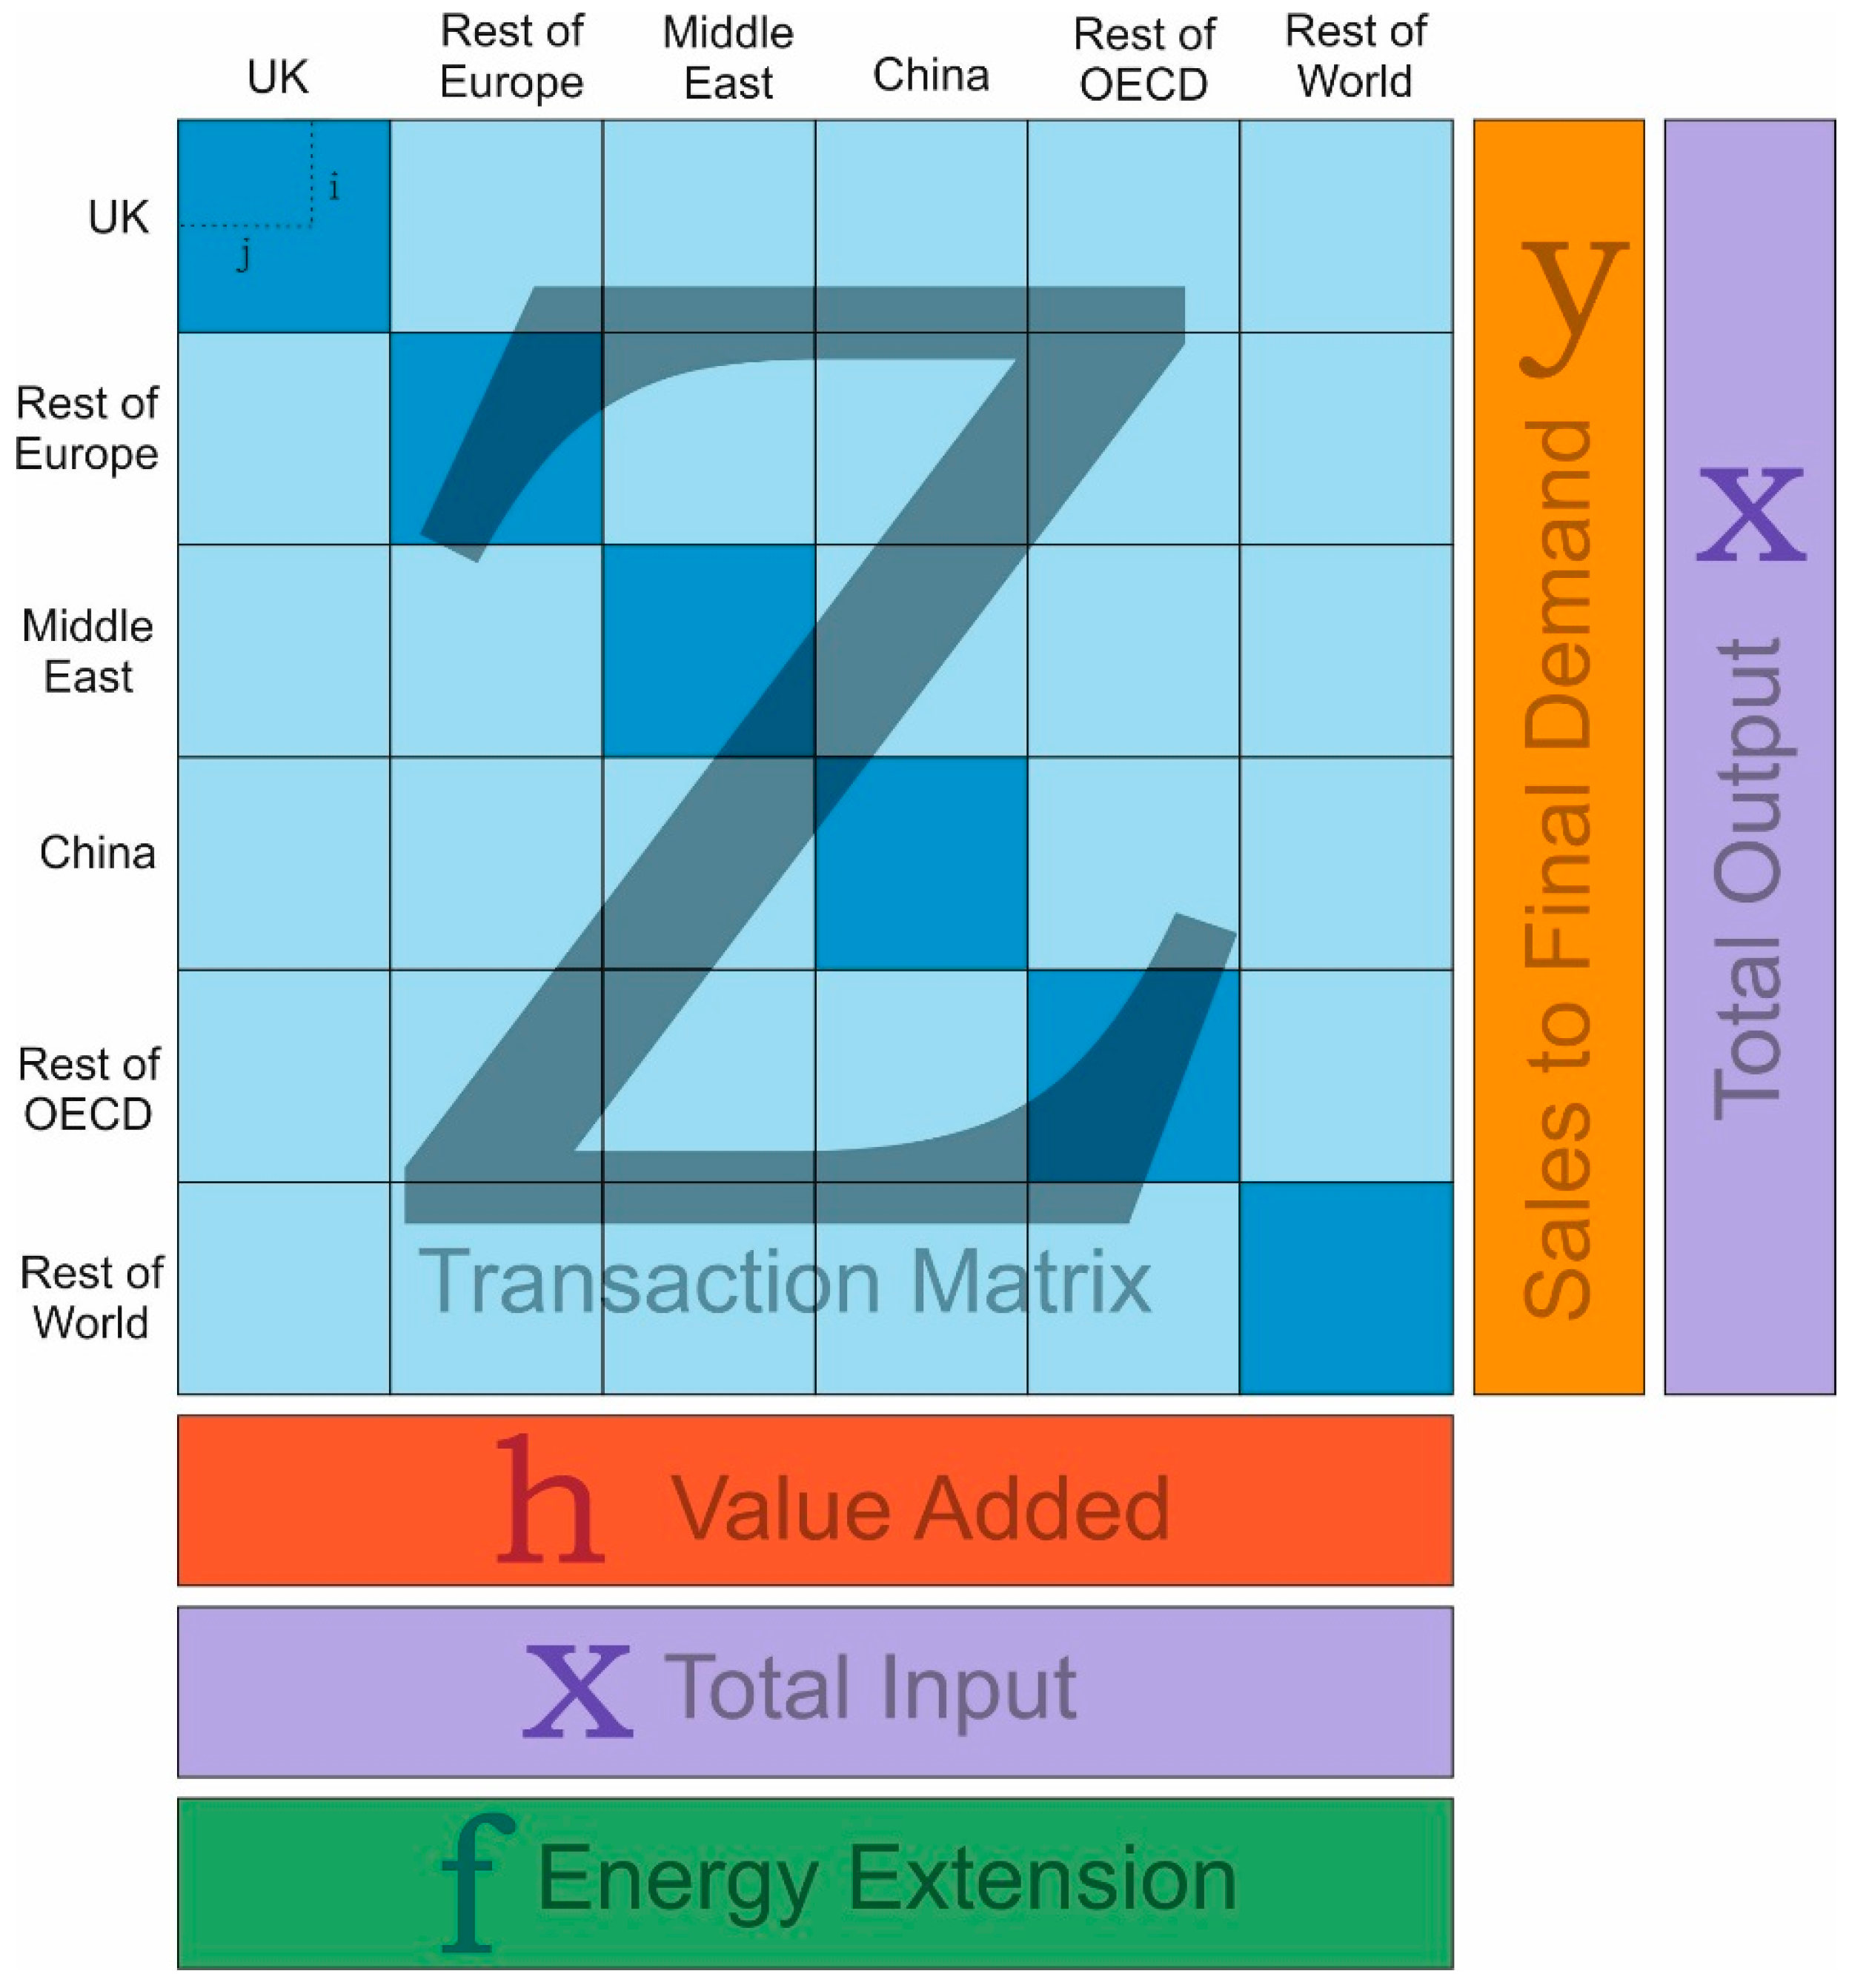
Appendix A.2. Multi-Regional Input-Output Matrix Structure, with an Energy Extension

Consider the transaction matrix Z (Figure A1). In the top left hand corner of Z is the UK data, followed by 5 world regions (the Rest of Europe, the Middle East, China, the Rest of the OECD, and the Rest of the World). Each region contains 106 industry sectors. Z displays sales by each industry in rows and the columns represent purchases by each industry. In other words, reading across a row reveals which other industries a single industry sells to and reading down a column reveals who a single industry buys from in order to make its product output. A single element, z ij , within Z represents the contributions from the ith supplying sector to the jth producing sector in an economy. The Z matrix is in monetary units.
Reading across the table, the total output ( x i ) of sector i can be expressed as in Equation (A1):
x i = z i 1 + z i 2 + + z in + y i
where y i is the final demand for the product produced by the particular sector. Essentially, the IO framework shows that the total output of a sector can be shown to be the result of its intermediate and final demand. Similarly if a column of the IO table is considered, the total input of a sector is shown to be the result of its intermediate demand and the value added in profits and wages ( h ). The sum across total output ( x ) and total input ( x ) will be equal.
Figure A1. Basic Structure of the UK MRIO.
Energies 10 00534 g009

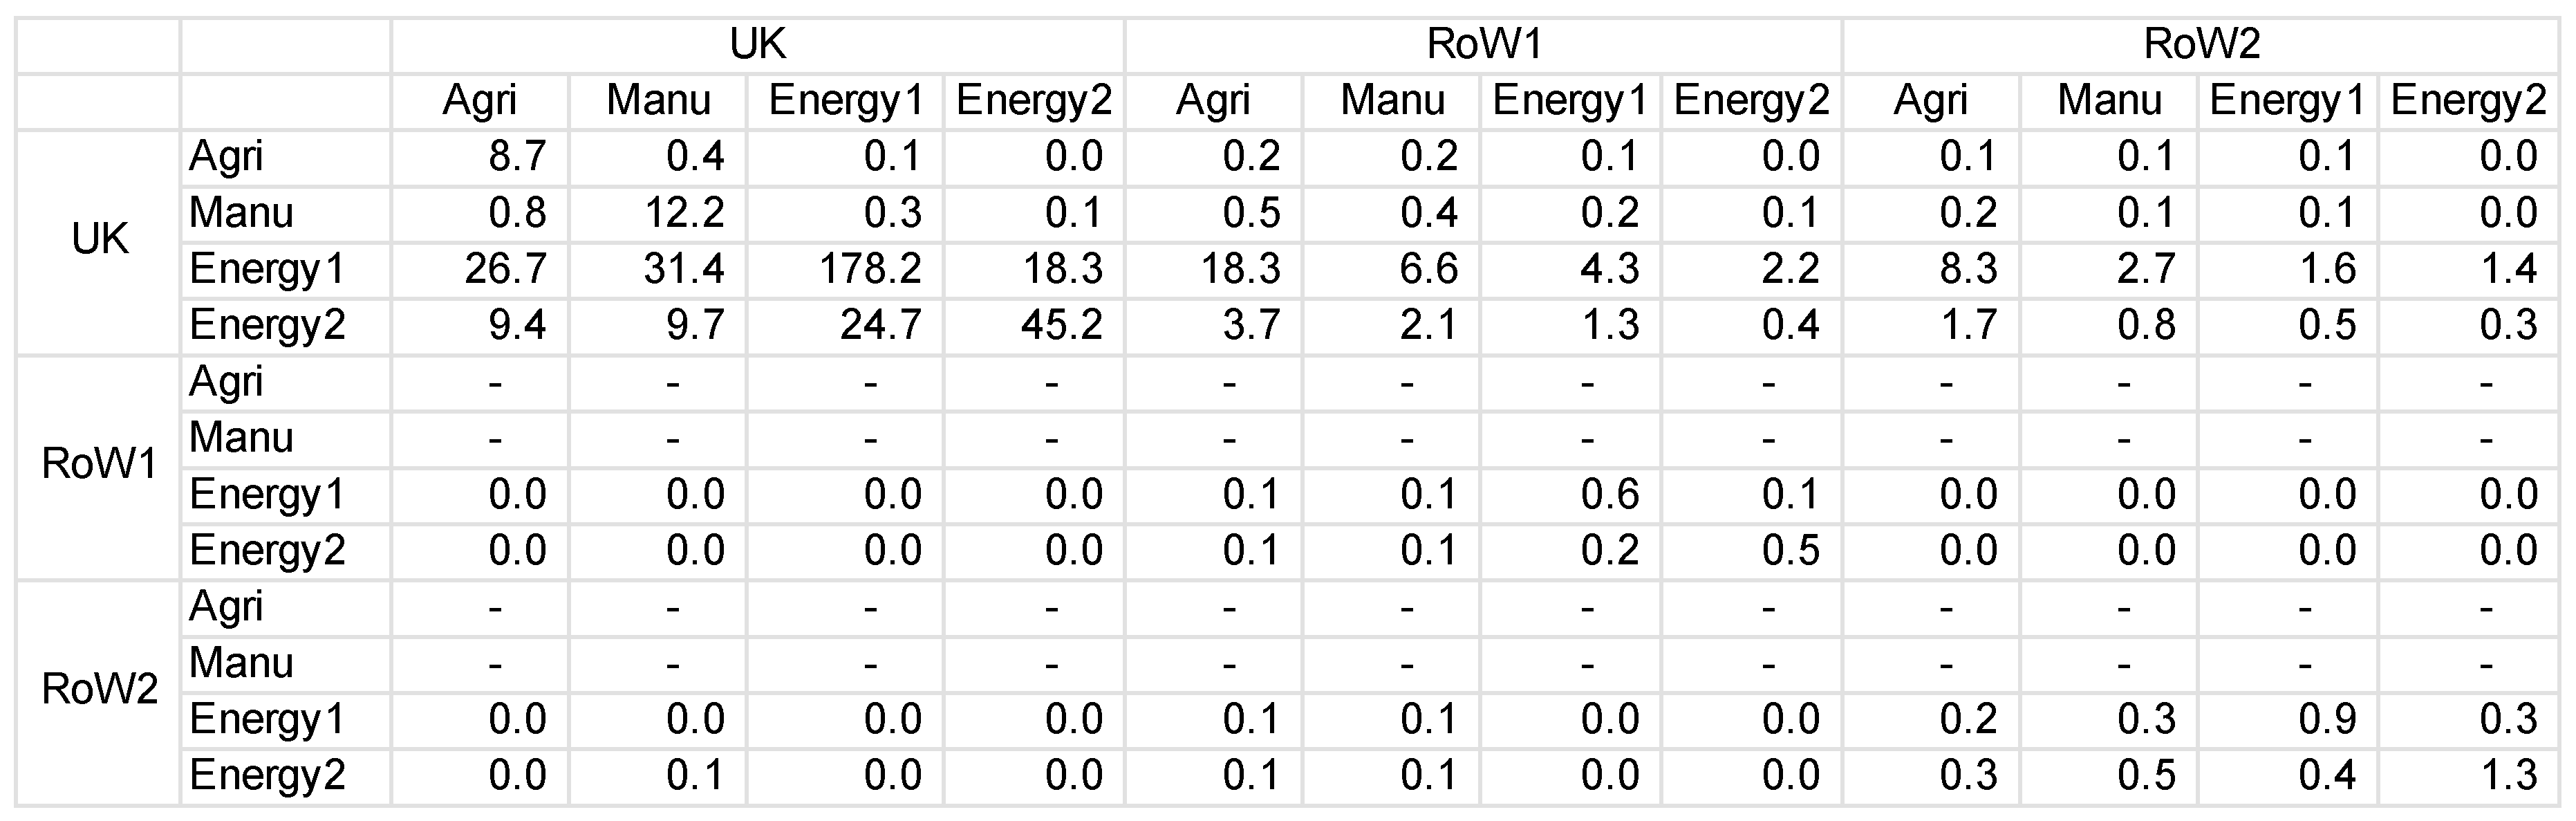
Appendix A.3. Basic Calculations: Obtaining the A, L and F Matrices

If each element, z ij , along row i is divided by the output x j , associated with the corresponding column j it is found in, then each element z ij in Z can be replaced with:
a ij = z ij x j
forming a new matrix A , known as the direct requirements matrix. Element a ij is therefore the input as a proportion of all the inputs in the production recipe of that product.
Equation (A2) can be re-written as:
z ij = a ij x j
Substituting for Equation (A3) in Equation (A1) forms:
x i = a i 1 x 1 + a i 2 x 2 + + a in x n + y i
Which, if written in matrix notation is = A x   +   y . Solving for x gives:
x = ( I A ) 1 y
Equation (A5) is known as the Leontief equation and describes output x as a function of final demand. ( I A ) 1 is known as the Leontief inverse (denoted hereafter as L ). Therefore Equation (A5) can be re-written as:
x = L y
Consider a row vector f of annual energy produced required by each industrial sector (an environmental extension in Figure 4). Then it is possible to calculate the energy intensity ( e ) by dividing the total energy input of each sector by total sector output ( x ), in terms of joules per pound for example, as follows:
e = f x ^ 1
In other words, e is the coefficient vector representing energy per unit of output.
Multiplying both sides of Equation (A6) by e   gives:
e x   =   e L y
and from Equation (A7) we simplify Equation (A8) to:
f   =   e L y
However, we need the result ( f ) as a flow matrix ( F ), rather than a scalar, and so we use the diagonalised e ^ and y ^ as shown in Equation (A10):
F   =   e ^ L y ^
F is produced energy in matrix form, allowing the UK’s use of energy from the full supply chain of extraction/capture to be determined. F is calculated by pre-multiplying L by energy per unit of output and post-multiplying by final demand. Energy is reallocated from extraction/capture sectors to the sectors that use this produced energy.

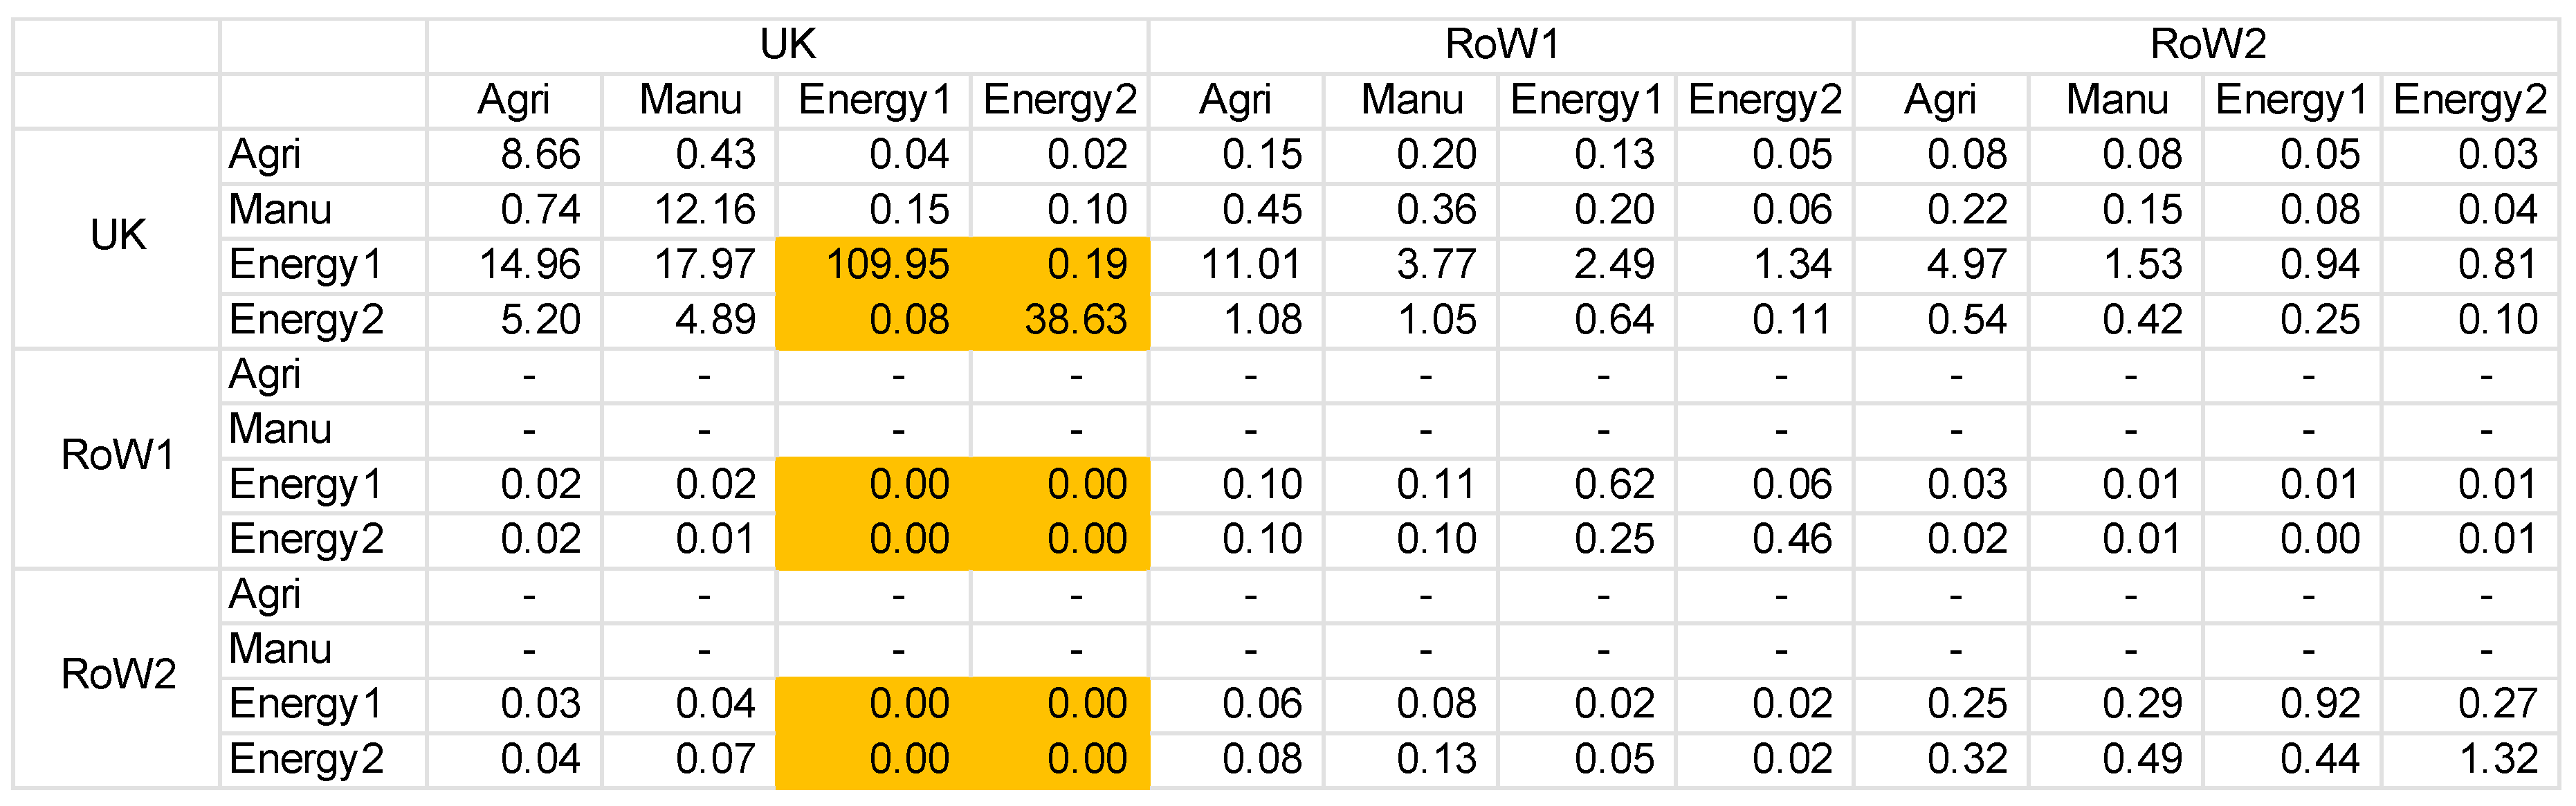
Appendix A.4. EROInat Specific Calculations: Obtaining Indirect Energy

We will use input-output analysis techniques to calculate total indirect energy use (both from the UK and the RoW) used to extract/capture UK’s energy. This is E iE in Equation (5) from the main text. To calculate E iE we calculate a new flow matrix F 0 which shows the UK’s total use of energy from the full supply chain if there was no flow to the energy sectors. The indirect energy use is therefore the difference between F and F 0 .
To calculate F 0 , we generate a new version of the transactions matrix, Z 0 , which is exactly the same as Z apart from the fact that Z 0 has zeros in the cells that represent the UK energy sector’s expenditure on all other energy products.
Let Z 0 contain n regions and m sectors. Sectors c to g are the energy sectors and region k is the UK. An element of Z 0 is z ij rs 0 which represents the monetary flow from sector i in country r to sector j in country s . We know that z ij rs 0 = 0 if i and j belong to the set of energy sectors ( c to g ) and if region s   =   k (the UK). In other words:
Z 0 =   z ij rs 0 = { 0   if   i , j     { c , , g }   and   s = k z ij rs 0   otherwise }
Then
F 0 =   e ^ ( I Z 0 x 1 ^ ) 1   y ^
and:
E iE =   r , s n i     { c , , g } , j m F ij rs F ij rs 0
Essentially, r n i     { c , , g } , j m F ij rs is the sum of all the direct and indirect energy that forms energy sector inputs to make UK energy products.
r n i     { c , , g } , j m F ij rs 0 is the sum of the direct energy that forms energy sector inputs to make UK energy products.
And the difference is the sum of the indirect energy that forms energy sector inputs to make UK energy products.
Finally, we do this for each of the 16 years (1997–2012) we have data for.

Appendix B

We present here a simple numerical example. Let’s assume we have a 3 region model (UK, rest of the world 1—RoW1 and rest of the world 2—RoW2). Each region has 4 sectors, two of which are energy producing sectors.
Z, y, h, x, f and e are presented in Figure A2.
Figure A2. Numerical example: Z, y, h, x, f and e.
Energies 10 00534 g010
After applying Equations (A1) to (A10) we obtain F , shown in Figure A3.
Figure A3. Numerical example: F.
Energies 10 00534 g011
In order to calculate E iE , following Equations (A11) and (A12), we create F 0 from Z 0 . The latter is shown in Figure A4 and the former is shown in Figure A5.
Figure A4. Numerical example: Z0.
Energies 10 00534 g012
Figure A5. Numerical example: F0.
Energies 10 00534 g013
Finally, we apply Equation (A13) and obtain E iE of 177.21.
Assuming we obtain from the IEA for our numerical example E T = 425 and E dE = 250 , we can insert these components in Equation (5) and obtain EROI nat ( UK ) = 0.4
EROI nat ( UK ) = 425 250   250 +   177.21

References

  1. Hall, C.A.S.; Kiltgaard, K.A. Energy and the Wealth of Nations. Understanding the Biophysical Economy; Springer: New York, NY, USA, 2012. [Google Scholar]
  2. Cleveland, C.J. Biophysical Economics: Historical Perspective and Current Research Trends. Ecol. Modell. 1987, 38, 47–73. [Google Scholar] [CrossRef]
  3. Dale, M.; Krumdieck, S.; Bodger, P. Net energy yield from production of conventional oil. Energy Policy 2011, 39, 7095–7102. [Google Scholar] [CrossRef]
  4. Gagnon, N.; Hall, C.A.S.; Brinker, L. A preliminary investigation of energy return on energy investment for global oil and gas production. Energies 2009, 2, 490–503. [Google Scholar] [CrossRef]
  5. Lambert, J.G.; Hall, C.A.S.; Balogh, S.B. EROI of Global Energy Resources. Status, Trends and Social Implications; Department for International Development: London, UK, 2013. [Google Scholar]
  6. Hall, C.A.S.; Lambert, J.G.; Balogh, S.B. EROI of different fuels and the implications for society. Energy Policy 2014, 64, 141–152. [Google Scholar] [CrossRef]
  7. Dale, M.; Benson, S.M. Energy Balance of the Global Photovoltaic (PV) Industry—Is the PV Industry a Net Electricity Producer? Environ. Sci. Technol. 2013, 47, 3482–3489. [Google Scholar] [CrossRef] [PubMed]
  8. Raugei, M.; Fullana-i-Palmer, P.; Fthenakis, V. The energy return on energy investment (EROI) of photovoltaics: Methodology and comparisons with fossil fuel life cycles. Energy Policy 2012, 45, 576–582. [Google Scholar] [CrossRef]
  9. Kubiszewski, I.; Cleveland, C.J.; Endres, P.K. Meta-analysis of net energy return for wind power systems. Renew. Energy 2010, 35, 218–225. [Google Scholar] [CrossRef]
  10. Cleveland, C.J. Net energy from the extraction of oil and gas in the United States. Energy 2005, 30, 769–782. [Google Scholar] [CrossRef]
  11. Brandt, A.R. Oil depletion and the energy efficiency of oil production: The case of California. Sustainability 2011, 3, 1833–1854. [Google Scholar] [CrossRef]
  12. Smith, D.M. The yield and energy content of milk and the energetic efficiency of sows on different levels of nutrition during gestation and lactation. New Zeal. J. Agric. Res. 1960, 3, 745–763. [Google Scholar] [CrossRef]
  13. Hall, C.A.S. Migration and metabolism in a temperate stream ecosystem. Ecology 1972, 53, 585–604. [Google Scholar] [CrossRef]
  14. Hall, C.A.S.; Lavine, M.; Sloane, J. Efficiency of energy delivery systems: I. An economic and energy analysis. Environ. Manag. 1979, 3, 493–504. [Google Scholar]
  15. Cleveland, C.J.; Costanza, R.; Hall, C.A.S.; Kaufmann, R.K. Energy and the U.S. Economy: A Biophysical Perspective. Science 1984, 225, 890–897. [Google Scholar] [CrossRef] [PubMed]
  16. Murphy, D.J.; Hall, C.A.S. Year in review—EROI or energy return on (energy) invested. Ann. N. Y. Acad. Sci. 2010, 1185, 102–118. [Google Scholar] [CrossRef] [PubMed]
  17. Murphy, D.J.; Hall, C.A.S.; Dale, M.; Cleveland, C.J. Order from Chaos: A Preliminary Protocol for Determining the EROI of Fuels. Sustainability 2011, 3, 1888–1907. [Google Scholar] [CrossRef]
  18. Murphy, D.J.; Hall, C.A.S. Energy return on investment, peak oil, and the end of economic growth. Ann. N. Y. Acad. Sci. 2011, 52–72. [Google Scholar] [CrossRef] [PubMed]
  19. Poisson, A.; Hall, C.A.S. Time series EROI for Canadian oil and gas. Energies 2013, 6, 5940–5959. [Google Scholar] [CrossRef]
  20. Leach, G. Net energy analysis—Is it any use? Energy Policy 1975, 3, 332–344. [Google Scholar] [CrossRef]
  21. Peet, N.J.; Baines, J.T.; Macdonald, M.G.; Tohili, J.C.; Bassett, R.M. Energy supply and net energy in New Zealand. Energy Policy 1987, 15, 239–248. [Google Scholar] [CrossRef]
  22. Lambert, J.G.; Hall, C.A.S.; Balogh, S.B.; Gupta, A.; Arnold, M. Energy, EROI and quality of life. Energy Policy 2014, 64, 153–167. [Google Scholar] [CrossRef]
  23. King, C.W.; Maxwell, J.P.; Donovan, A. ComparingWorld Economic and Net Energy Metrics, Part 2: Total Economy Expenditure Perspective. Energies 2015, 8, 12975–12996. [Google Scholar] [CrossRef]
  24. King, C.W. Comparing World Economic and Net Energy Metrics, Part 3: Macroeconomic Historical and Future Perspectives. Energies 2015, 8, 12997–13020. [Google Scholar] [CrossRef]
  25. King, C.W.; Maxwell, J.P.; Donovan, A. ComparingWorld Economic and Net Energy Metrics, Part 1: Single Technology and Commodity Perspective. Energies 2015, 8, 12949–12974. [Google Scholar] [CrossRef]
  26. Fizaine, F.; Court, V. Energy expenditure, economic growth, and the minimum EROI of society. Energy Policy 2016, 95, 172–186. [Google Scholar] [CrossRef]
  27. Herendeen, R.A. Connecting net energy with the price of energy and other goods and services. Ecol. Econ. 2015, 109, 142–149. [Google Scholar] [CrossRef]
  28. Raugei, M.; Leccisi, E. A comprehensive assessment of the energy performance of the full range of electricity generation technologies deployed in the United Kingdom. Energy Policy 2016, 90, 46–59. [Google Scholar] [CrossRef]
  29. Dale, M.; Krumdieck, S.; Bodger, P. Global energy modelling—A biophysical approach (GEMBA) Part 1: An overview of biophysical economics. Ecol. Econ. 2012, 73, 152–157. [Google Scholar] [CrossRef]
  30. Heun, M.K.; Santos, J.; Brockway, P.E.; Pruim, R.; Domingos, T.; Sakai, M. From Theory to Econometrics to Energy Policy: Cautionary Tales for Policymaking Using Aggregate Production Functions. Energies 2017, 10, 203. [Google Scholar] [CrossRef]
  31. Brockway, P.E.; Heun, M.K.; Santos, J.; Barrett, J.R. Energy-Extended CES Aggregate Production : Current Aspects of Their Specification and Econometric Estimation. Energies 2017, 10, 202. [Google Scholar] [CrossRef]
  32. Kümmel, R. Why energy’s economic weight is much larger than its cost share. Environ. Innov. Soc. Transit. 2013, 9, 33–37. [Google Scholar] [CrossRef]
  33. Ayres, R.U.; van den Bergh, J.C.J.M.; Lindenberger, D.; Warr, B. The underestimated contribution of energy to economic growth. Struct. Chang. Econ. Dyn. 2013, 27, 79–88. [Google Scholar] [CrossRef]
  34. Brandt, A.R.; Dale, M. A General Mathematical Framework for Calculating Systems-Scale Efficiency of Energy Extraction and Conversion: Energy Return on Investment (EROI) and Other Energy Return Ratios. Energies 2011, 4, 1211–1245. [Google Scholar] [CrossRef]
  35. Herendeen, R.A. Net Energy Analysis: Concepts and Methods. Encycl. Energy 2004, 4, 283–289. [Google Scholar]
  36. International Energy Agency (IEA). Energy Statistics Manual; IEA: Paris, France, 2005. [Google Scholar]
  37. Brandt, A.R.; Dale, M.; Barnhart, C.J. Calculating systems-scale energy efficiency and net energy returns: A bottom-up matrix-based approach. Energy 2013, 62, 235–247. [Google Scholar] [CrossRef]
  38. Hall, C.A.S.; Balogh, S.B.; Murphy, D.J. What is the Minimum EROI that a Sustainable Society Must Have? Energies 2009, 2, 25–47. [Google Scholar] [CrossRef]
  39. Brandt, A.R.; Englander, J.; Bharadwaj, S. The energy efficiency of oil sands extraction: Energy return ratios from 1970 to 2010. Energy 2013, 55, 693–702. [Google Scholar] [CrossRef]
  40. Harmsen, J.H.M.; Roes, A.L.; Patel, M.K. The impact of copper scarcity on the efficiency of 2050 global renewable energy scenarios. Energy 2013, 50, 62–73. [Google Scholar] [CrossRef]
  41. Arvesen, A.; Hertwich, E.G. More caution is needed when using life cycle assessment to determine energy return on investment (EROI). Energy Policy 2015, 76, 1–6. [Google Scholar] [CrossRef]
  42. Dale, M. The Energy Balance of the Photovoltaic (PV) Industry: Is the PV industry a net electricity producer? Environ. Sci. Technol. 2013, 47, 3482–3489. [Google Scholar] [CrossRef] [PubMed]
  43. Cleveland, C.J.; Kaufmann, R.K.; Stern, D.I. Aggregation and the role of energy in the economy. Ecol. Econ. 2000, 32, 301–317. [Google Scholar] [CrossRef]
  44. Brockway, P.E.; Barrett, J.R.; Foxon, T.J.; Steinberger, J.K. Divergence of trends in US and UK Aggregate Exergy Efficiencies 1960–2010. Environ. Sci. Technol. 2014, 48, 9874–9881. [Google Scholar] [CrossRef] [PubMed]
  45. Warr, B.; Ayres, R.U.; Eisenmenger, N.; Krausmann, F.; Schandl, H. Energy use and economic development: A comparative analysis of useful work supply in Austria, Japan, the United Kingdom and the US during 100years of economic growth. Ecol. Econ. 2010, 69, 1904–1917. [Google Scholar] [CrossRef]
  46. Brockway, P.E.; Steinberger, J.K.; Barrett, J.R.; Foxon, T.J. Understanding China’s past and future energy demand: An exergy efficiency and decomposition analysis. Appl. Energy 2015, 155, 892–903. [Google Scholar] [CrossRef]
  47. Williams, E.; Warr, B.; Ayres, R.U. Efficiency dilution: Long-term exergy conversion trends in Japan. Environ. Sci. Technol. 2008, 42, 4964–4970. [Google Scholar] [CrossRef] [PubMed]
  48. Kostic, M.M. Energy: Physics. Encycl. Energy Eng. Technol. 2012, 2, 808–823. [Google Scholar]
  49. Gaggioli, R.A.; Wepfer, W.J. Exergy economics. Energy 1980, 5, 823–837. [Google Scholar] [CrossRef]
  50. Wall, G. Exergy—A Useful Concept; Chalmers University of Technology: Göteborg, Sweden, 1986. [Google Scholar]
  51. Wall, G. Exergy—A Useful Concept within Resource Accounting; Chalmers University of Technology and University of Göteborg: Göteborg, Sweden, 1977. [Google Scholar]
  52. Wall, G. Exergy tools. Proc. Inst. Mech. Eng. Part A J. Power Energy 2003, 217, 125–136. [Google Scholar] [CrossRef]
  53. Kanoglu, M.; Cengel, Y.A.; Dincer, I. Efficiency Evaluation of Energy Systems; Springer: London, UK, 2012. [Google Scholar]
  54. Dincer, I. The role of exergy in energy policy making. Energy Policy 2002, 30, 137–149. [Google Scholar] [CrossRef]
  55. Rosen, M.A. Benefits of exergy and needs for increased education and public understanding and applications in industry and policy—Part I: Benefits. Int. J. Exergy 2006, 3, 202–218. [Google Scholar] [CrossRef]
  56. Rosen, M.A. Energy crisis or exergy crisis? Exergy Int. J. 2002, 2, 125–127. [Google Scholar] [CrossRef]
  57. Sciubba, E.; Wall, G. A brief Commented History of Exergy From the Beginnings to 2004. Int. J. Thermodyn. 2007, 10, 1–26. [Google Scholar]
  58. IEA. Statistics: Frequently Asked Questions. Available online: http://www.iea.org/statistics/resources/questionnaires/faq/#one (accessed on 2 February 2017).
  59. Casler, S.; Wilbur, S. Energy Input-Output Analysis. A Simple Guide. Resour. Energy 1984, 6, 187–201. [Google Scholar] [CrossRef]
  60. Bullard, C.W.; Penner, P.S.; Pilati, D.A. Net energy analysis. Handbook for combining process and input-output analysis. Resour. Energy 1978, 1, 267–313. [Google Scholar] [CrossRef]
  61. Bullard, C.W.; Herendeen, R.A. The energy cost of goods and services. Energy Policy 1975, 3, 268–278. [Google Scholar] [CrossRef]
  62. Wright, D.J. Goods and services: An input-output analysis. Energy Policy 1974, 2, 307–315. [Google Scholar] [CrossRef]
  63. Brandt, A.R. How Does Energy Resource Depletion Affect Prosperity? Mathematics of a Minimum Energy Return on Investment (EROI). Biophys. Econ. Resour. Qual. 2017, 2, 2. [Google Scholar] [CrossRef]
  64. IEA. World Energy Balances: Extended Energy Balances, 1960–2014. Available online: http://dx.doi.org/10.5257/iea/web/2015 (accessed on 15 October 2015).
  65. ONS Supply and Use Tables. Available online: http://www.ons.gov.uk/ons/taxonomy/index.html?nscl=Supply+and+Use+Tables (accessed on 6 October 2016).
  66. Lenzen, M.; Moran, D.; Kanemoto, K.; Geschke, A. Building Eora: A Global Multi-Region Input-Output Database At High Country And Sector Resolution. Econ. Syst. Res. 2013, 25, 20–49. [Google Scholar] [CrossRef]
  67. Lenzen, M.; Kanemoto, K.; Moran, D.; Geschke, A. Mapping the structure of the world economy. Environ. Sci. Technol. 2012, 46, 8374–8381. [Google Scholar] [CrossRef] [PubMed]
  68. Roberts, F. The aims, methods and uses of energy accounting. Appl. Energy 1978, 4, 199–217. [Google Scholar] [CrossRef]
  69. Guevara, Z.H.Z. Three-Level Energy Decoupling: Energy Decoupling at the Primary, Final and Useful Levels of Energy Use; Universidade de Lisboa: Lisboa, Portuguese, 2014. [Google Scholar]
  70. International Energy Agency (IEA). World Energy Investment Outlook 2014; IEA: Paris, France, 2014. [Google Scholar]
  71. Berndt, E.R. From Technocracy to Net Energy Analysis: Engineers, Economists and Recurring Energy Theories of Value; Sloan School of Management, Masachusetts Institute of Technology: Cambridge, MA, USA, 1982. [Google Scholar]
  72. Carbajales-Dale, M.; Barnhart, C.J.; Brandt, A.R.; Benson, S.M. A better currency for investing in a sustainable future. Nat. Clim. Chang. 2014, 4, 524–527. [Google Scholar] [CrossRef]
Figure 1. Types of EROI. EROI stnd : standard EROI. EROI pou : EROI at the point of use. EROI ext : extended EROI.
Energies 10 00534 g001
Figure 2. National level EROI—UK case. Black and dotted arrows represent what we measure, while white arrows represent flows that occur but that are not included in this approach to EROInat given its boundary of analysis.
Energies 10 00534 g002
Figure 3. EROI inputs over time.
Energies 10 00534 g003
Figure 4. Basic structure of an Input-Output framework with and environmental extension.
Energies 10 00534 g004
Figure 5. EROI nat ( UK ) (1997–2012): Comparison of results with and without indirect energy (EiE).
Energies 10 00534 g005
Figure 6. Energy Returned (Eout) and Energy Invested (Ein) in the UK (1997–2012).
Energies 10 00534 g006
Figure 7. UK energy production: share of energy sources 1997–2012. Data taken from IEA [64].
Energies 10 00534 g007
Figure 8. Financial investments in the production of UK’s energy by source (1974–2012). Data taken from IEA [70].
Energies 10 00534 g008
Table 1. UK’s rate of production of different energy sources (1997–2010 and 2010–2012).
Energy SourceChange in Production (%)
1997–20102010–2012
Coal and coal products−0.60.0
Crude, NGL and feedstocks−0.5−0.1
Natural gas−0.3−0.2
Nuclear−0.40.1
Hydro−0.10.4
Solar/wind/other13.514.2
Biofuels and waste1.60.7
Data taken from IEA [64].

