Article

Energy Recovery from Waste Incineration—The Importance of Technology Data and System Boundaries on CO2 Emissions

1
Faculty of Engineering and Sustainable Development, Department of Building, Energy and Environmental Engineering, University of Gävle, SE 801 76 Gävle, Sweden
2
Division of Environmental Strategies Research–fms, Department of Sustainable Development, Environmental Sciences and Engineering (SEED), School of Architecture and the Built Environment, KTH Royal Institute of Technology, SE 100 44 Stockholm, Sweden
*
Author to whom correspondence should be addressed.
Energies 2017, 10(4), 539; https://doi.org/10.3390/en10040539
Submission received: 19 October 2016 / Revised: 10 April 2017 / Accepted: 12 April 2017 / Published: 15 April 2017
(This article belongs to the Special Issue Energy and Waste Management)

Abstract

:
Previous studies on waste incineration as part of the energy system show that waste management and energy supply are highly dependent on each other, and that the preconditions for the energy system setup affects the avoided emissions and thereby even sometimes the total outcome of an environmental assessment. However, it has not been previously shown explicitly which key parameters are most crucial, how much each parameter affects results and conclusions and how different aspects depend on each other. The interconnection between waste incineration and the energy system is elaborated by testing parameters potentially crucial to the result: design of the incineration plant, avoided energy generation, degree of efficiency, electricity efficiency in combined heat and power plants (CHP), avoided fuel, emission level of the avoided electricity generation and avoided waste management. CO2 emissions have been calculated for incineration of 1 kWh mixed combustible waste. The results indicate that one of the most important factors is the electricity efficiency in CHP plants in combination with the emission level of the avoided electricity generation. A novel aspect of this study is the plant by plant comparison showing how different electricity efficiencies associated with different types of fuels and plants influence results. Since waste incineration typically have lower power to fuel ratios, this has implications for further analyses of waste incineration compared to other waste management practises and heat and power production technologies. New incineration capacity should substitute mixed landfill disposal and recovered energy should replace energy from inefficient high polluting plants. Electricity generation must not be lost, as it has to be compensated for by electricity production affecting the overall results.

1. Introduction

In the EU, political actions have been taken to avoid landfilling [1], which in turn has caused an expansion of waste incineration with energy recovery. In EU28 the amount of waste being incinerated has increased from 74 kg/capita in 1999 to 127 kg/capita in 2014 [2]. Even if waste amounts will level out or even decline (a wanted decoupling of waste generation and economic growth with the aim to reach a circular economy) there is much waste currently being subject to landfill disposal that has to be moved upwards the waste hierarchy. It is not realistic to think that all waste currently being sent to landfill can be avoided; hence material recycling and incineration can be expected to increase. In the Nordic countries, residential heating is often made with district heating systems. Incineration of waste, often as combined heat and power plants (CHP), is one of several fuels for district heating. If incineration will continue to increase, at the same time as the need for heat decreases due to increased energy efficiency in the residential sector, the share of heat from waste incineration in the district heating systems will most likely increase. In other parts of Europe, where district heating systems are absent, most new incinerators will probably be as “condense” power plants. Another possible development is if individual or small-scale space heating is replaced by new or expanded district heating systems, including large-scale waste incineration (CHP). Waste incineration, in different scales and types, can increase in the future and therefore it is important to explore the potential environmental consequences of such an expansion.
Previous studies on waste incineration and connections to the energy system [3,4,5,6,7,8,9,10,11,12,13,14,15,16,17,18,19,20] show that the systems for waste management and energy supply are highly dependent on each other, and that the preconditions for the setup of the energy system affects the avoided emissions and thereby even sometimes the total outcome of an assessment. Without going into a comprehensive review of all these studies some observations can be made. Some of these focus on financial relations e.g., [3,4], some studies are detailed including many different aspects e.g., [8,14,16,17] while some focus on single questions or waste fractions e.g., [5,6,7,9,10,20]. Other studies focus on the importance of the energy system [11,12,15] without going into detail of incineration plant characteristics, some focus on optimisation [13,18] and also on long term effects [19]. Three studies are reviews of different Life Cycle Assessments (LCAs) in the area [14,16,19].
Even if many studies points out the strong importance of how the waste management system is linked to the energy system, it has not been shown explicitly which key parameters are crucial and also how much they affect the results and conclusions. For example, the avoided fuel consumption is known to be important. Also electricity generation efficiencies can play an important role. There are in fact a number of parameters or preconditions that in combination reveal whether a substitution with waste incineration is positive or negative from an environmental point of view. These parameters are further explored in this paper.

1.1. Problem

Learning from previous studies there is still a lack in understanding how different technology parameters affect the interconnection between incineration (in this paper incineration always means waste incineration with energy recovery) and the energy system with respect to environmental performance. Although several parameters have been identified as relevant, a systematic analysis of them combined is lacking. The parameters cover the incineration plant, different heat and/or power plants that are to be substituted in the energy system and type of electricity generation.

1.2. Aim and Scope

The interconnection between waste incineration and the energy system is elaborated by testing several parameters crucial to the total emissions of CO2. Many of these are known to be important, but it has not been previously shown for all included parameters explicitly how much. This study will provide a better understanding to what extent different preconditions and assumptions affect the results and the conclusions. More explicitly, the investigation focuses on the importance of:
  • The design of the incineration plant; whether it is a heat only boiler (HOB), generates only electricity (condensing plant—CP), or a combined heat and power (CHP) plant.
  • The design of the avoided energy generation; HOB, CP or CHP.
  • The degree of efficiency expressed as overall efficiency (energy-to-fuel ratio, see Section 2.1).
  • The electricity efficiency (power-to-fuel ratio) in CHP plants.
  • The type of avoided fuel (e.g., biomass, natural gas etc.).
  • The CO2 emission level of the avoided electricity generation.
  • The avoided waste management; whether material recycling or landfill disposal is being replaced by incineration.
As mentioned above some of the factors assessed in this study have been analysed in previous studies, but so far there is no paper covering all these relevant factors. Besides, we base our conclusions on explicit figures, not just on rough assumptions for certain waste fractions. This study is one consistent assessment, which actually tests the factors above with more “extreme” values. The paper is important in the way that the interaction between a waste-to-energy technology and the energy system is illustrated.
The waste composition is an important parameter that is not taken into consideration in this study. Including such an investigation would be complicated, as the number of possible combinations would increase vastly given the many properties that could be altered (moisture content, fossil content, ash content etc.). The dependence on waste properties may be strong but that can mainly be affected by activities upstream the waste incinerator. In this study, focus is set on the technicalities at the incineration plants and their connection to the energy system. Changing parameters for the technologies on a more detailed level (such as grate furnace or fluidised bed etc.) have not been made due to data availability and to be able to evaluate the results. Such detailed assessments could possibly complete this study.

2. Materials and Methods

The method used is a thorough sensitivity analysis including a CO2-assessment for the operation phase of different energy plants. Environmental impacts from building of the facilities have been left out since CO2-emission from capital goods account for approximately 2%–3% of the total [21]. However, for other impact categories infrastructure may be highly relevant, e.g., for toxicity related to use of metals and alloys [21]. Since electricity and or/heat will be produced in all scenarios, there will facilities in all scenarios compared, making the difference between scenarios smaller. The primary aim to fulfill a complete life cycle assessment (LCA) [22] was restrained to calculations of CO
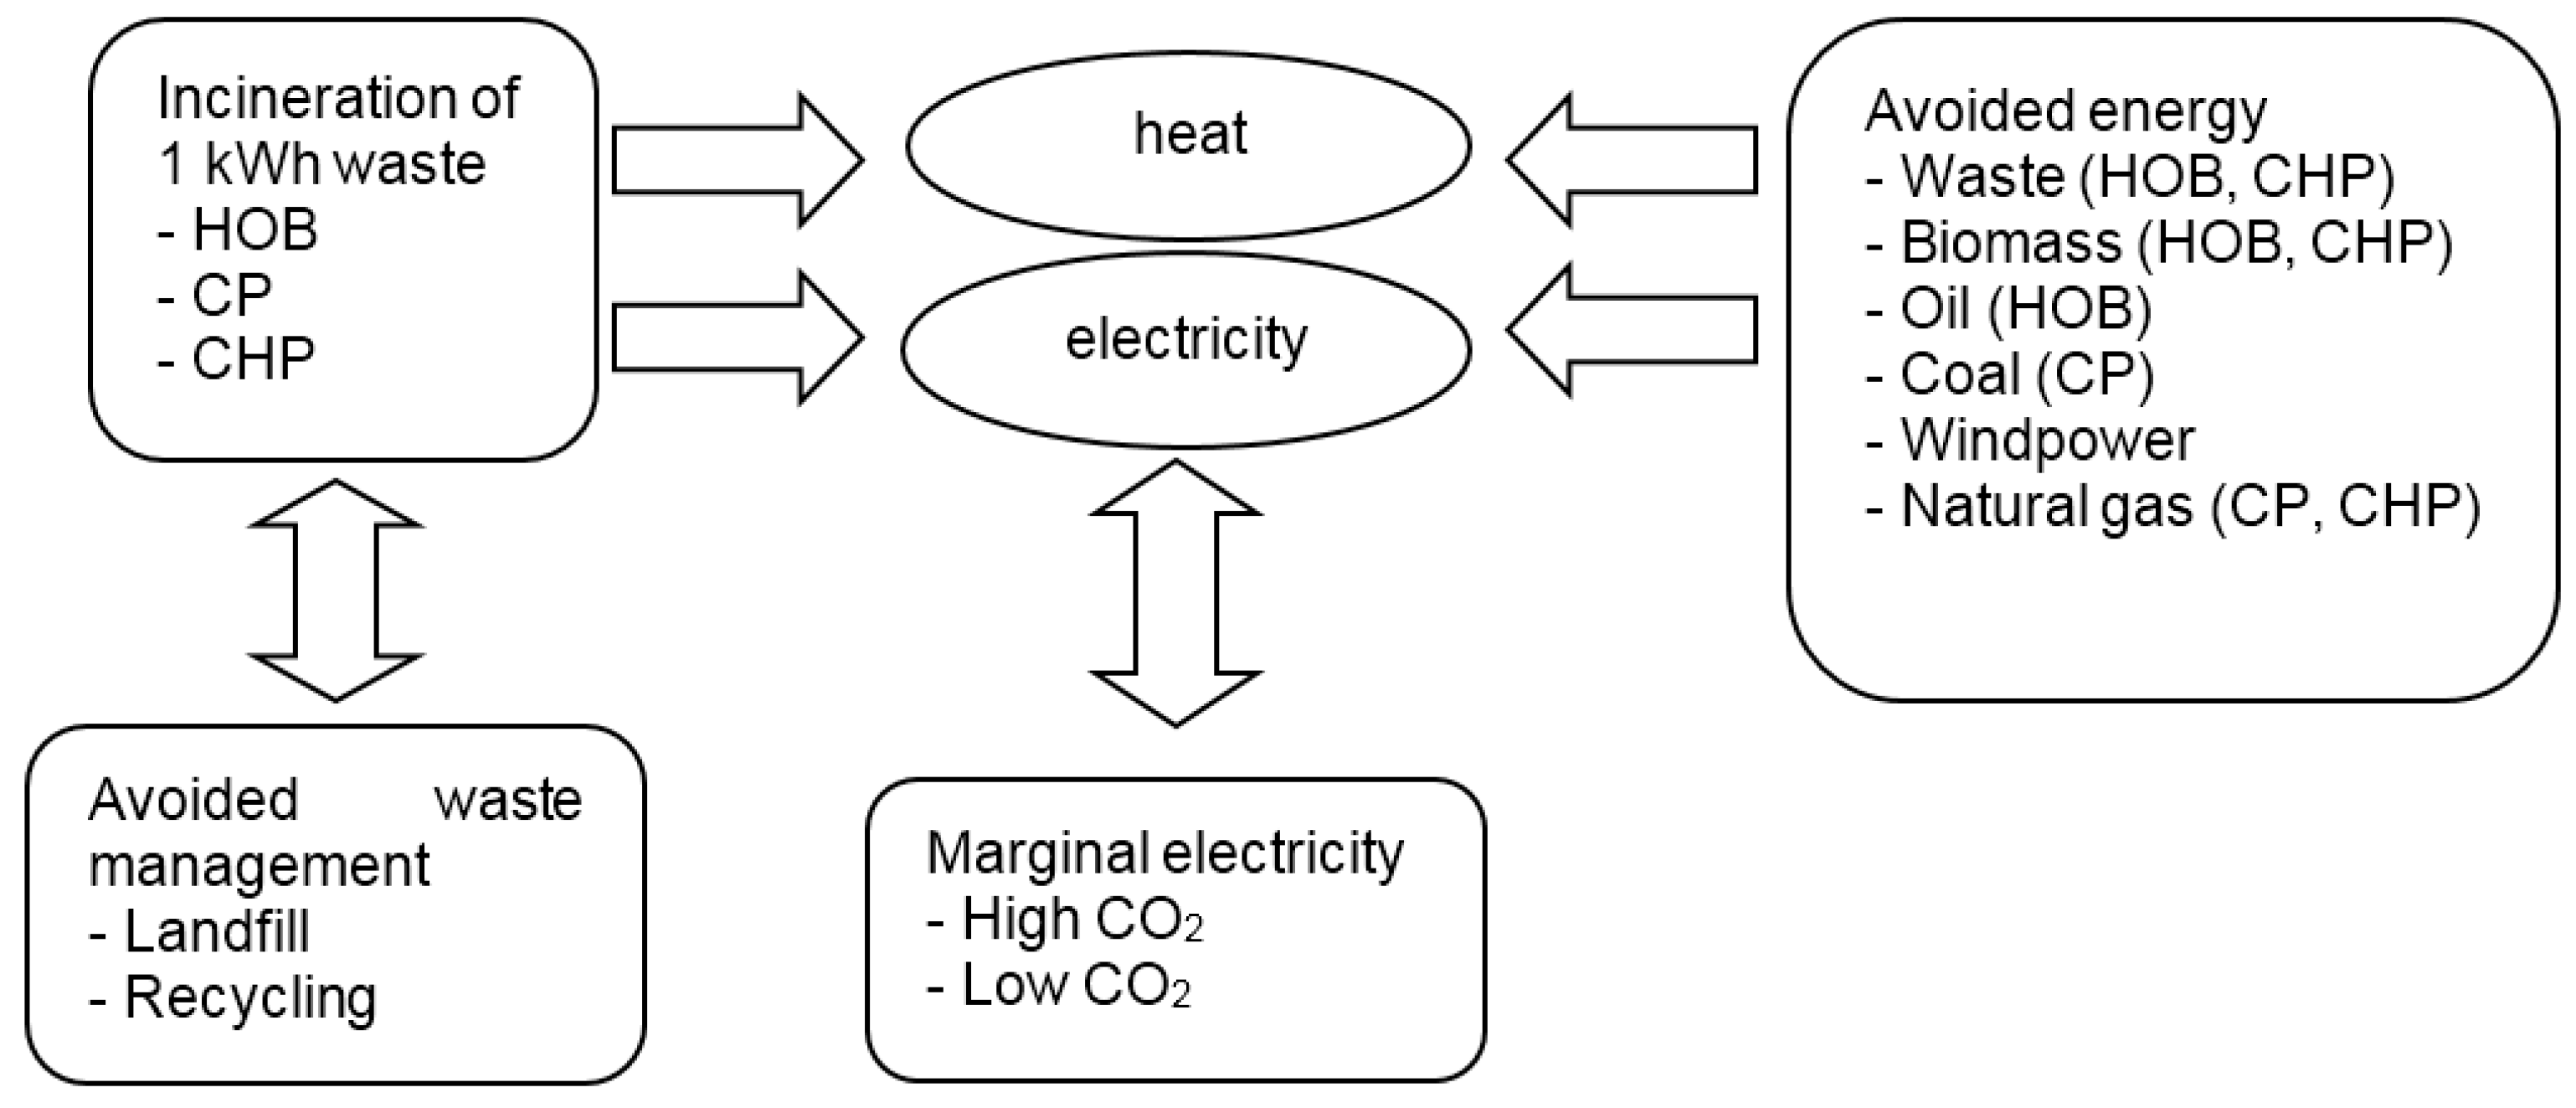
2-emissions as the assessment else would be too complex. The functional unit is incineration of 1 kWh mixed combustible waste (after sorting out metals at plant but still containing plastics that result in emissions of fossil carbon dioxide when combusted) which corresponds to 3.6 MJ or appr. 0.4 kg mixed solid waste (HHV ≈ 10 MJ/kg). The unit may seem unconventional but fulfills its purpose. A change to 1 kg waste would change the scale, but not the assessment as such. It is not the actual figures that are interesting, but the differences between alternatives.
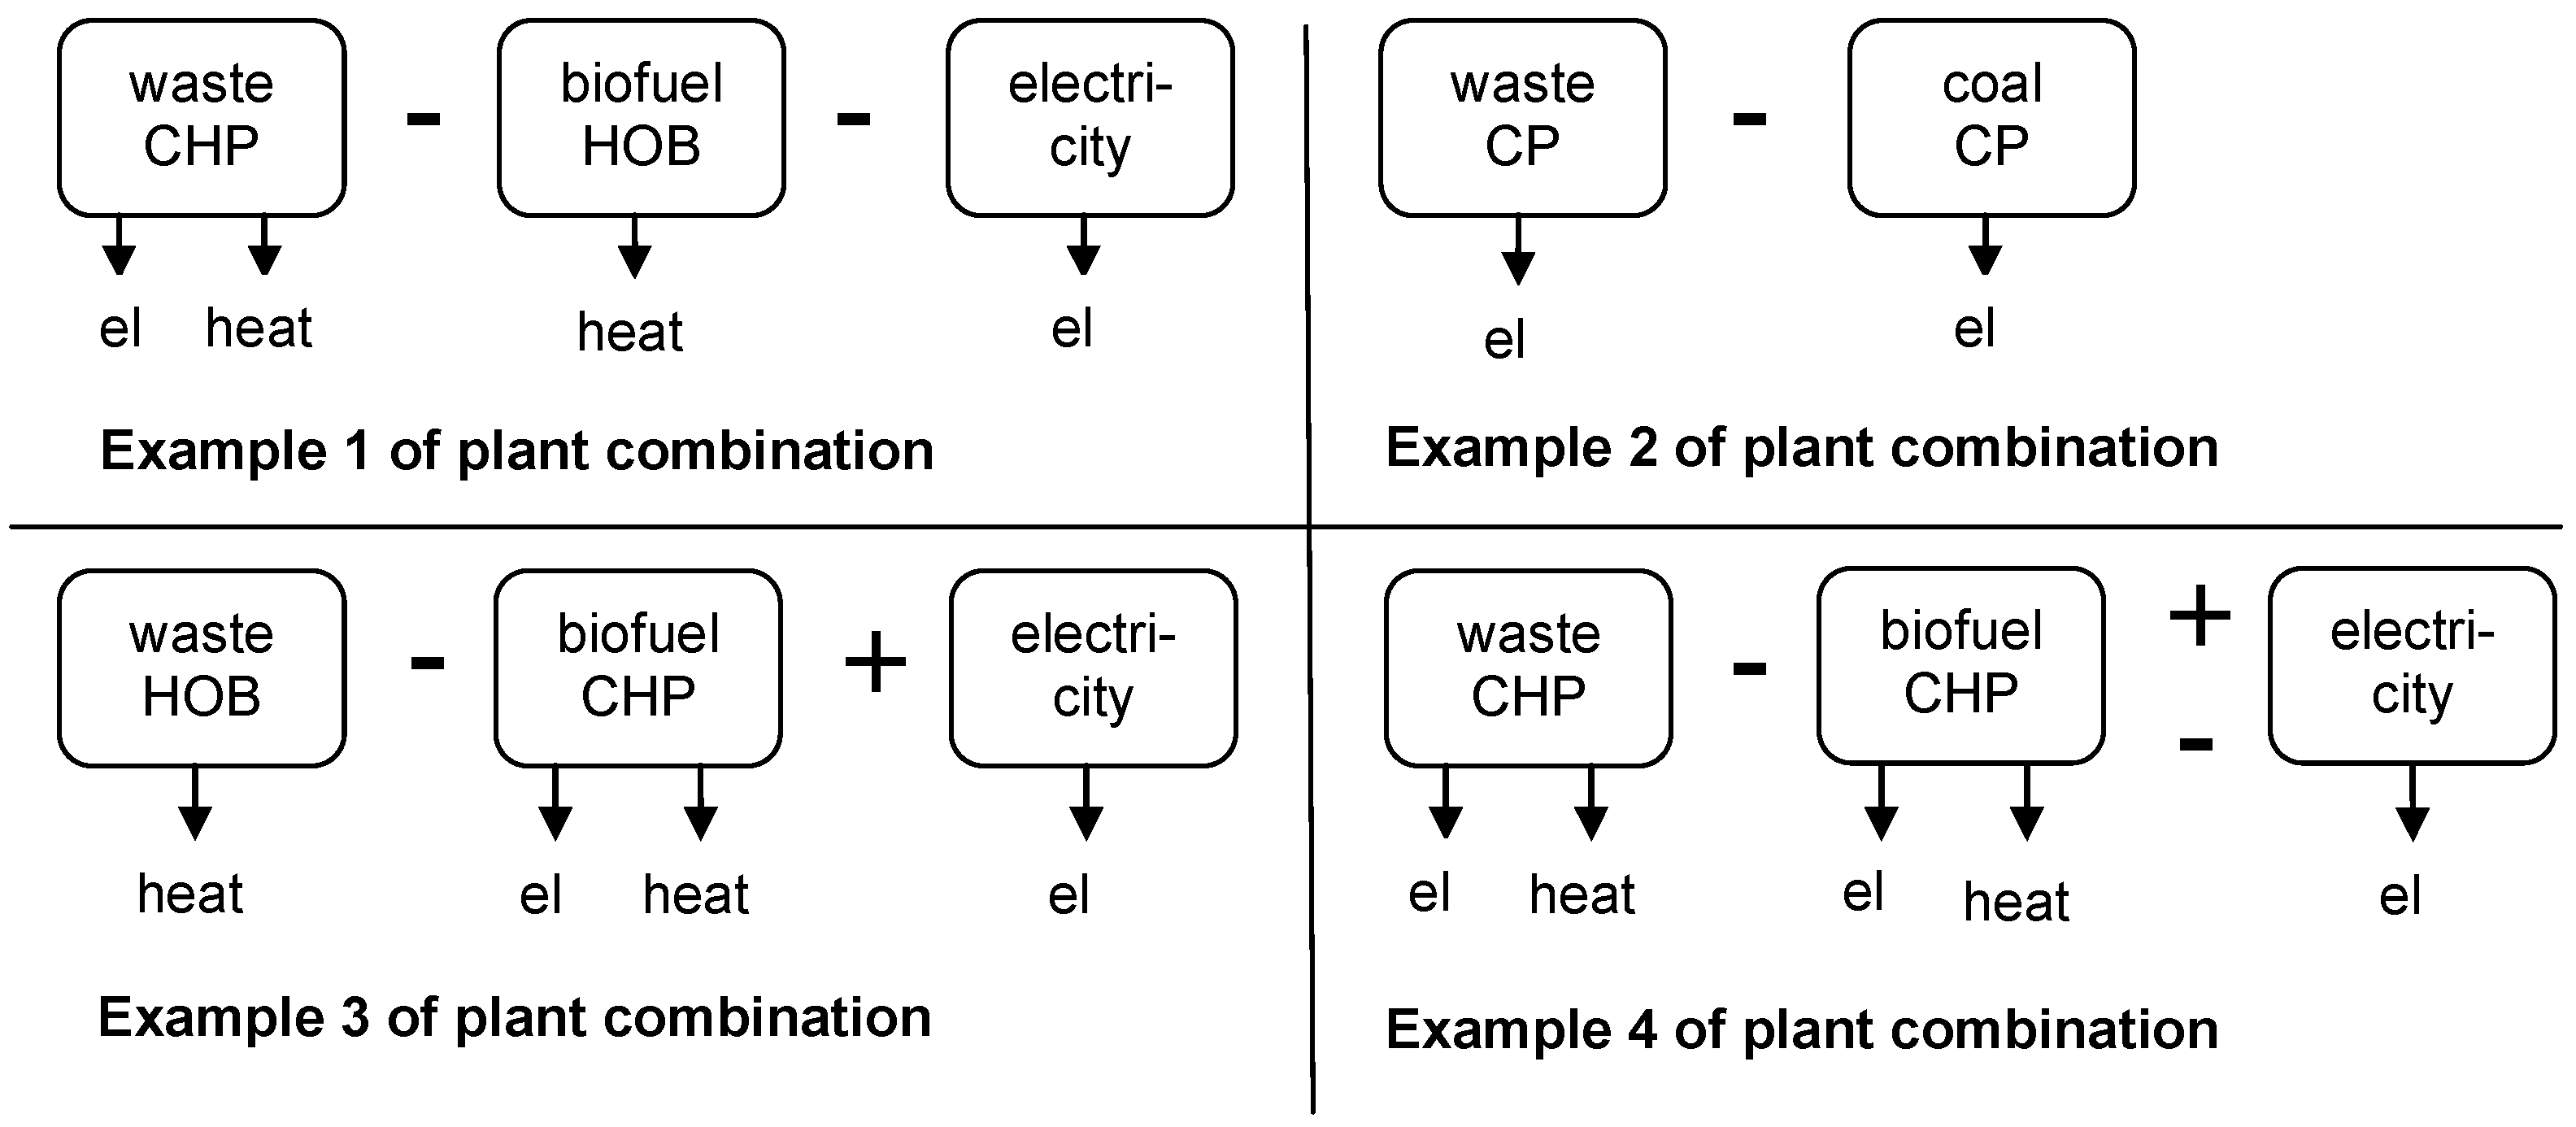
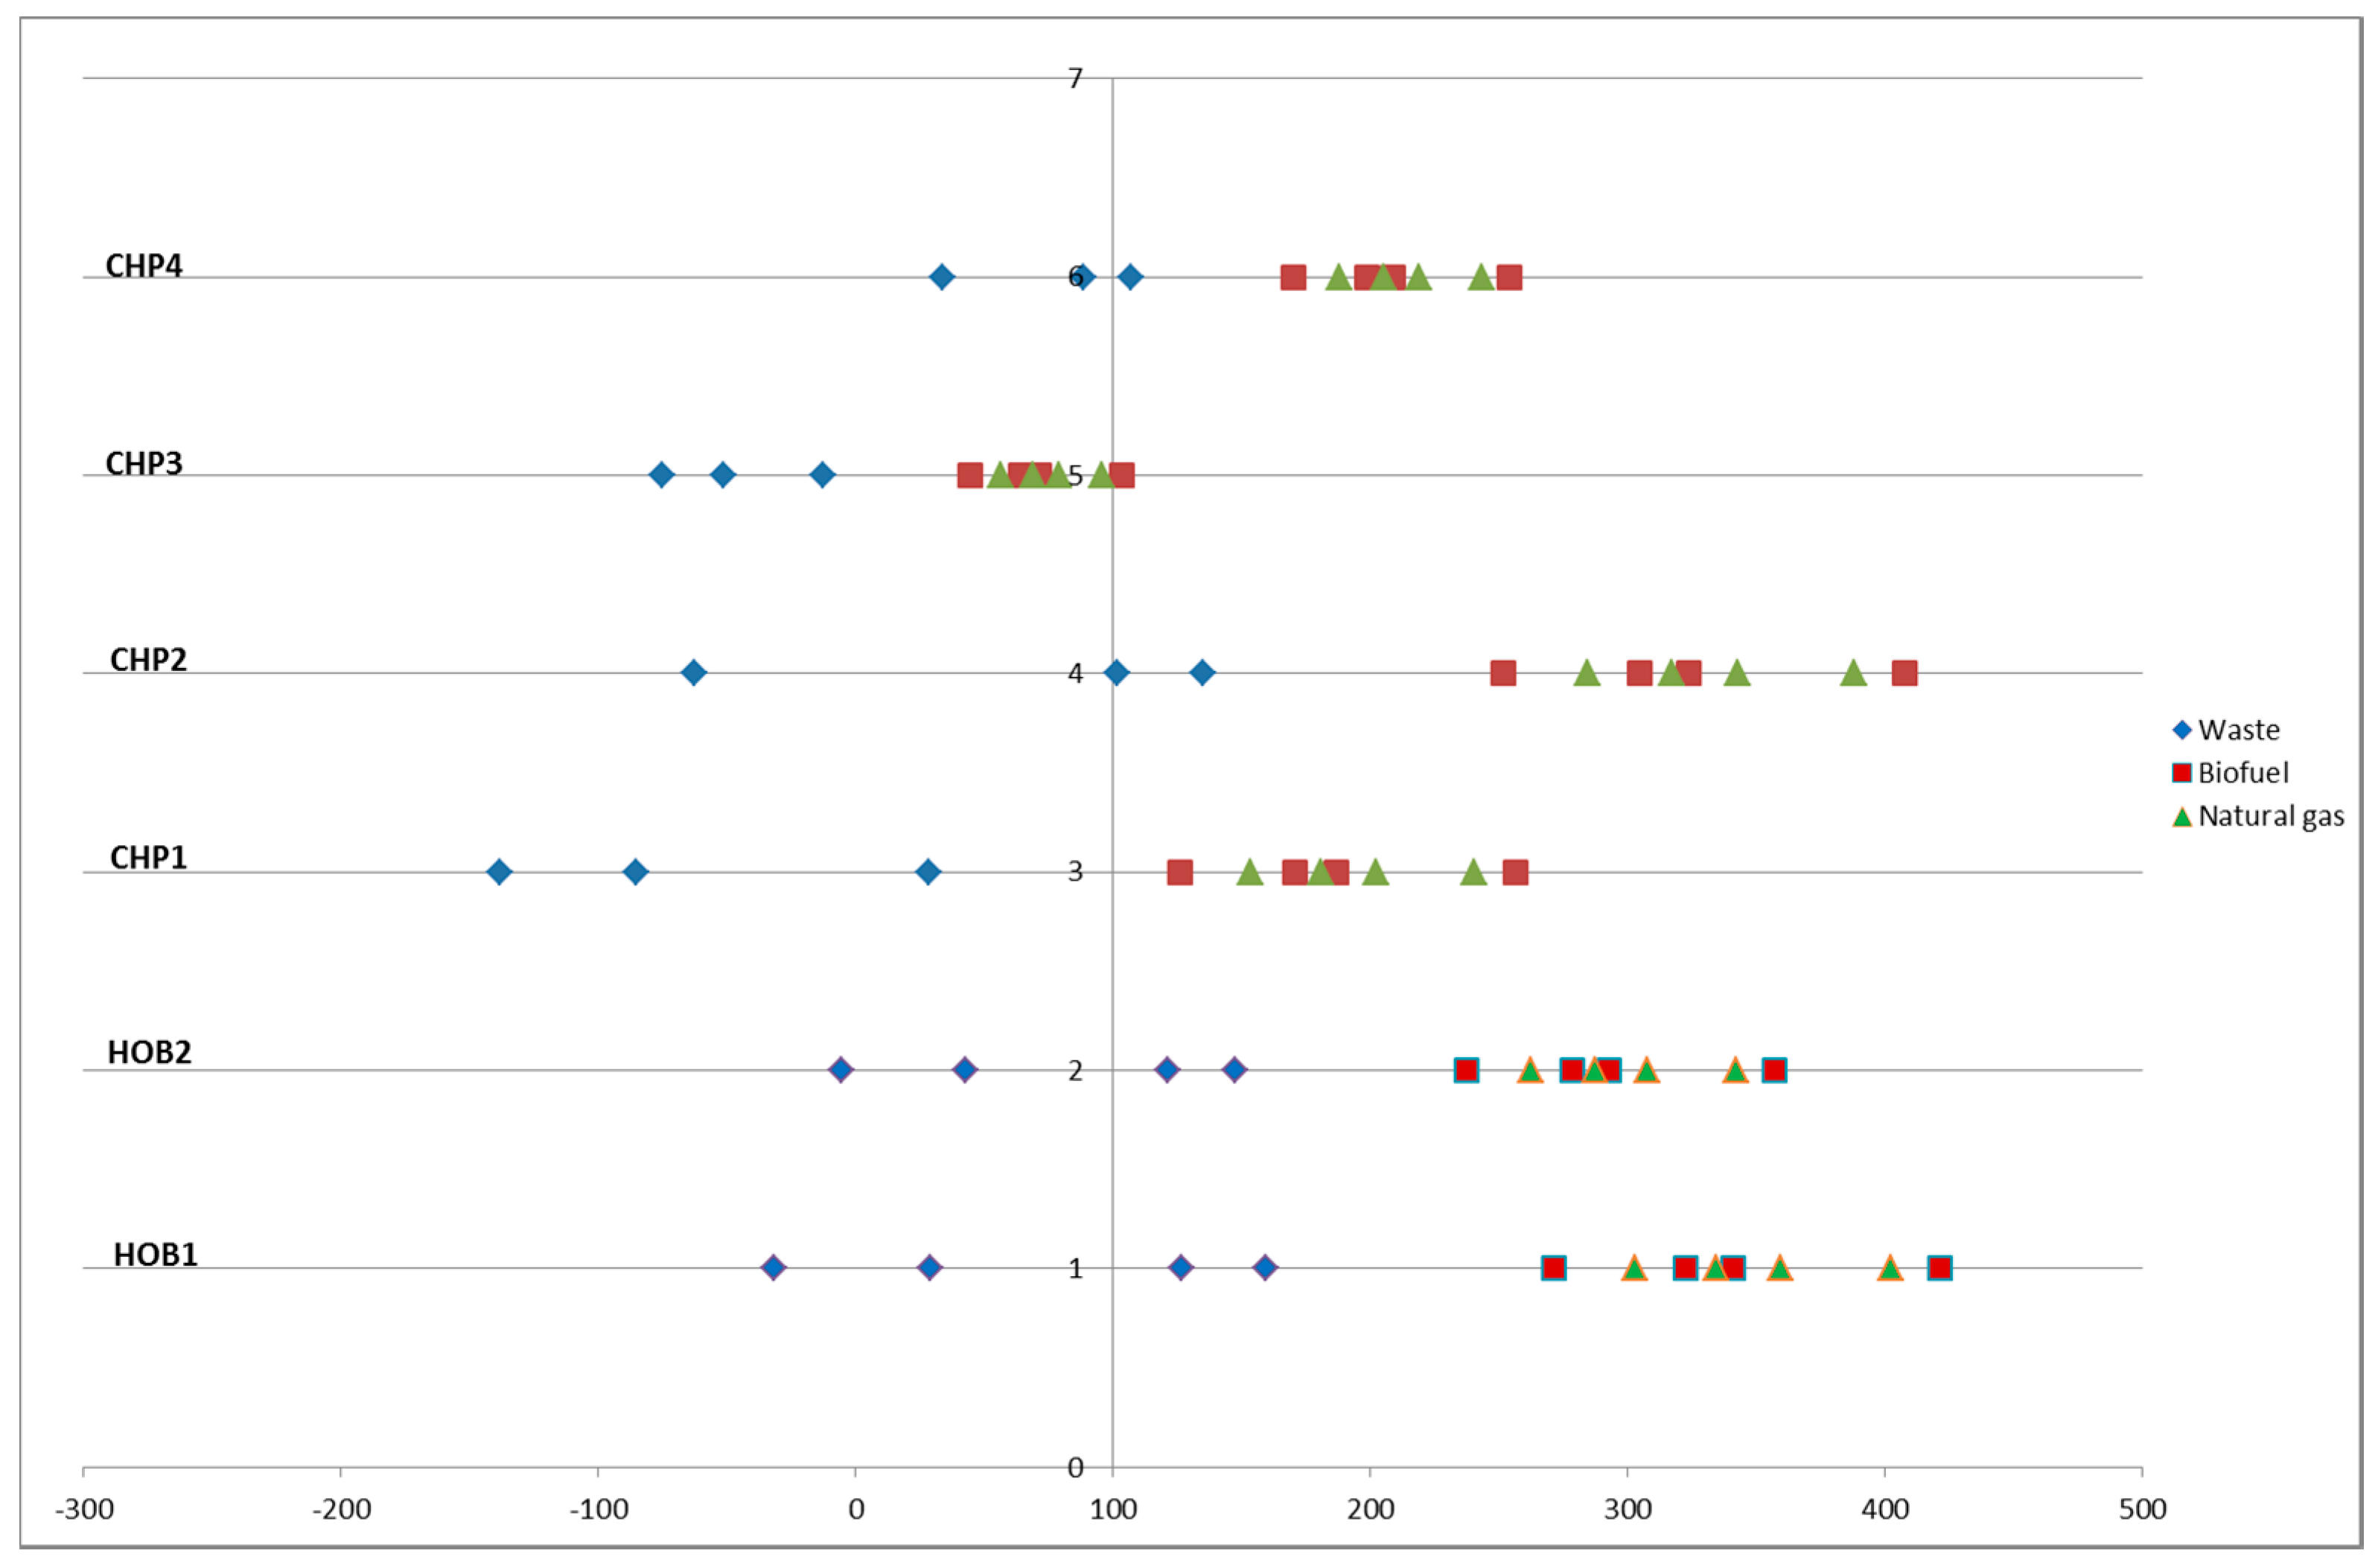
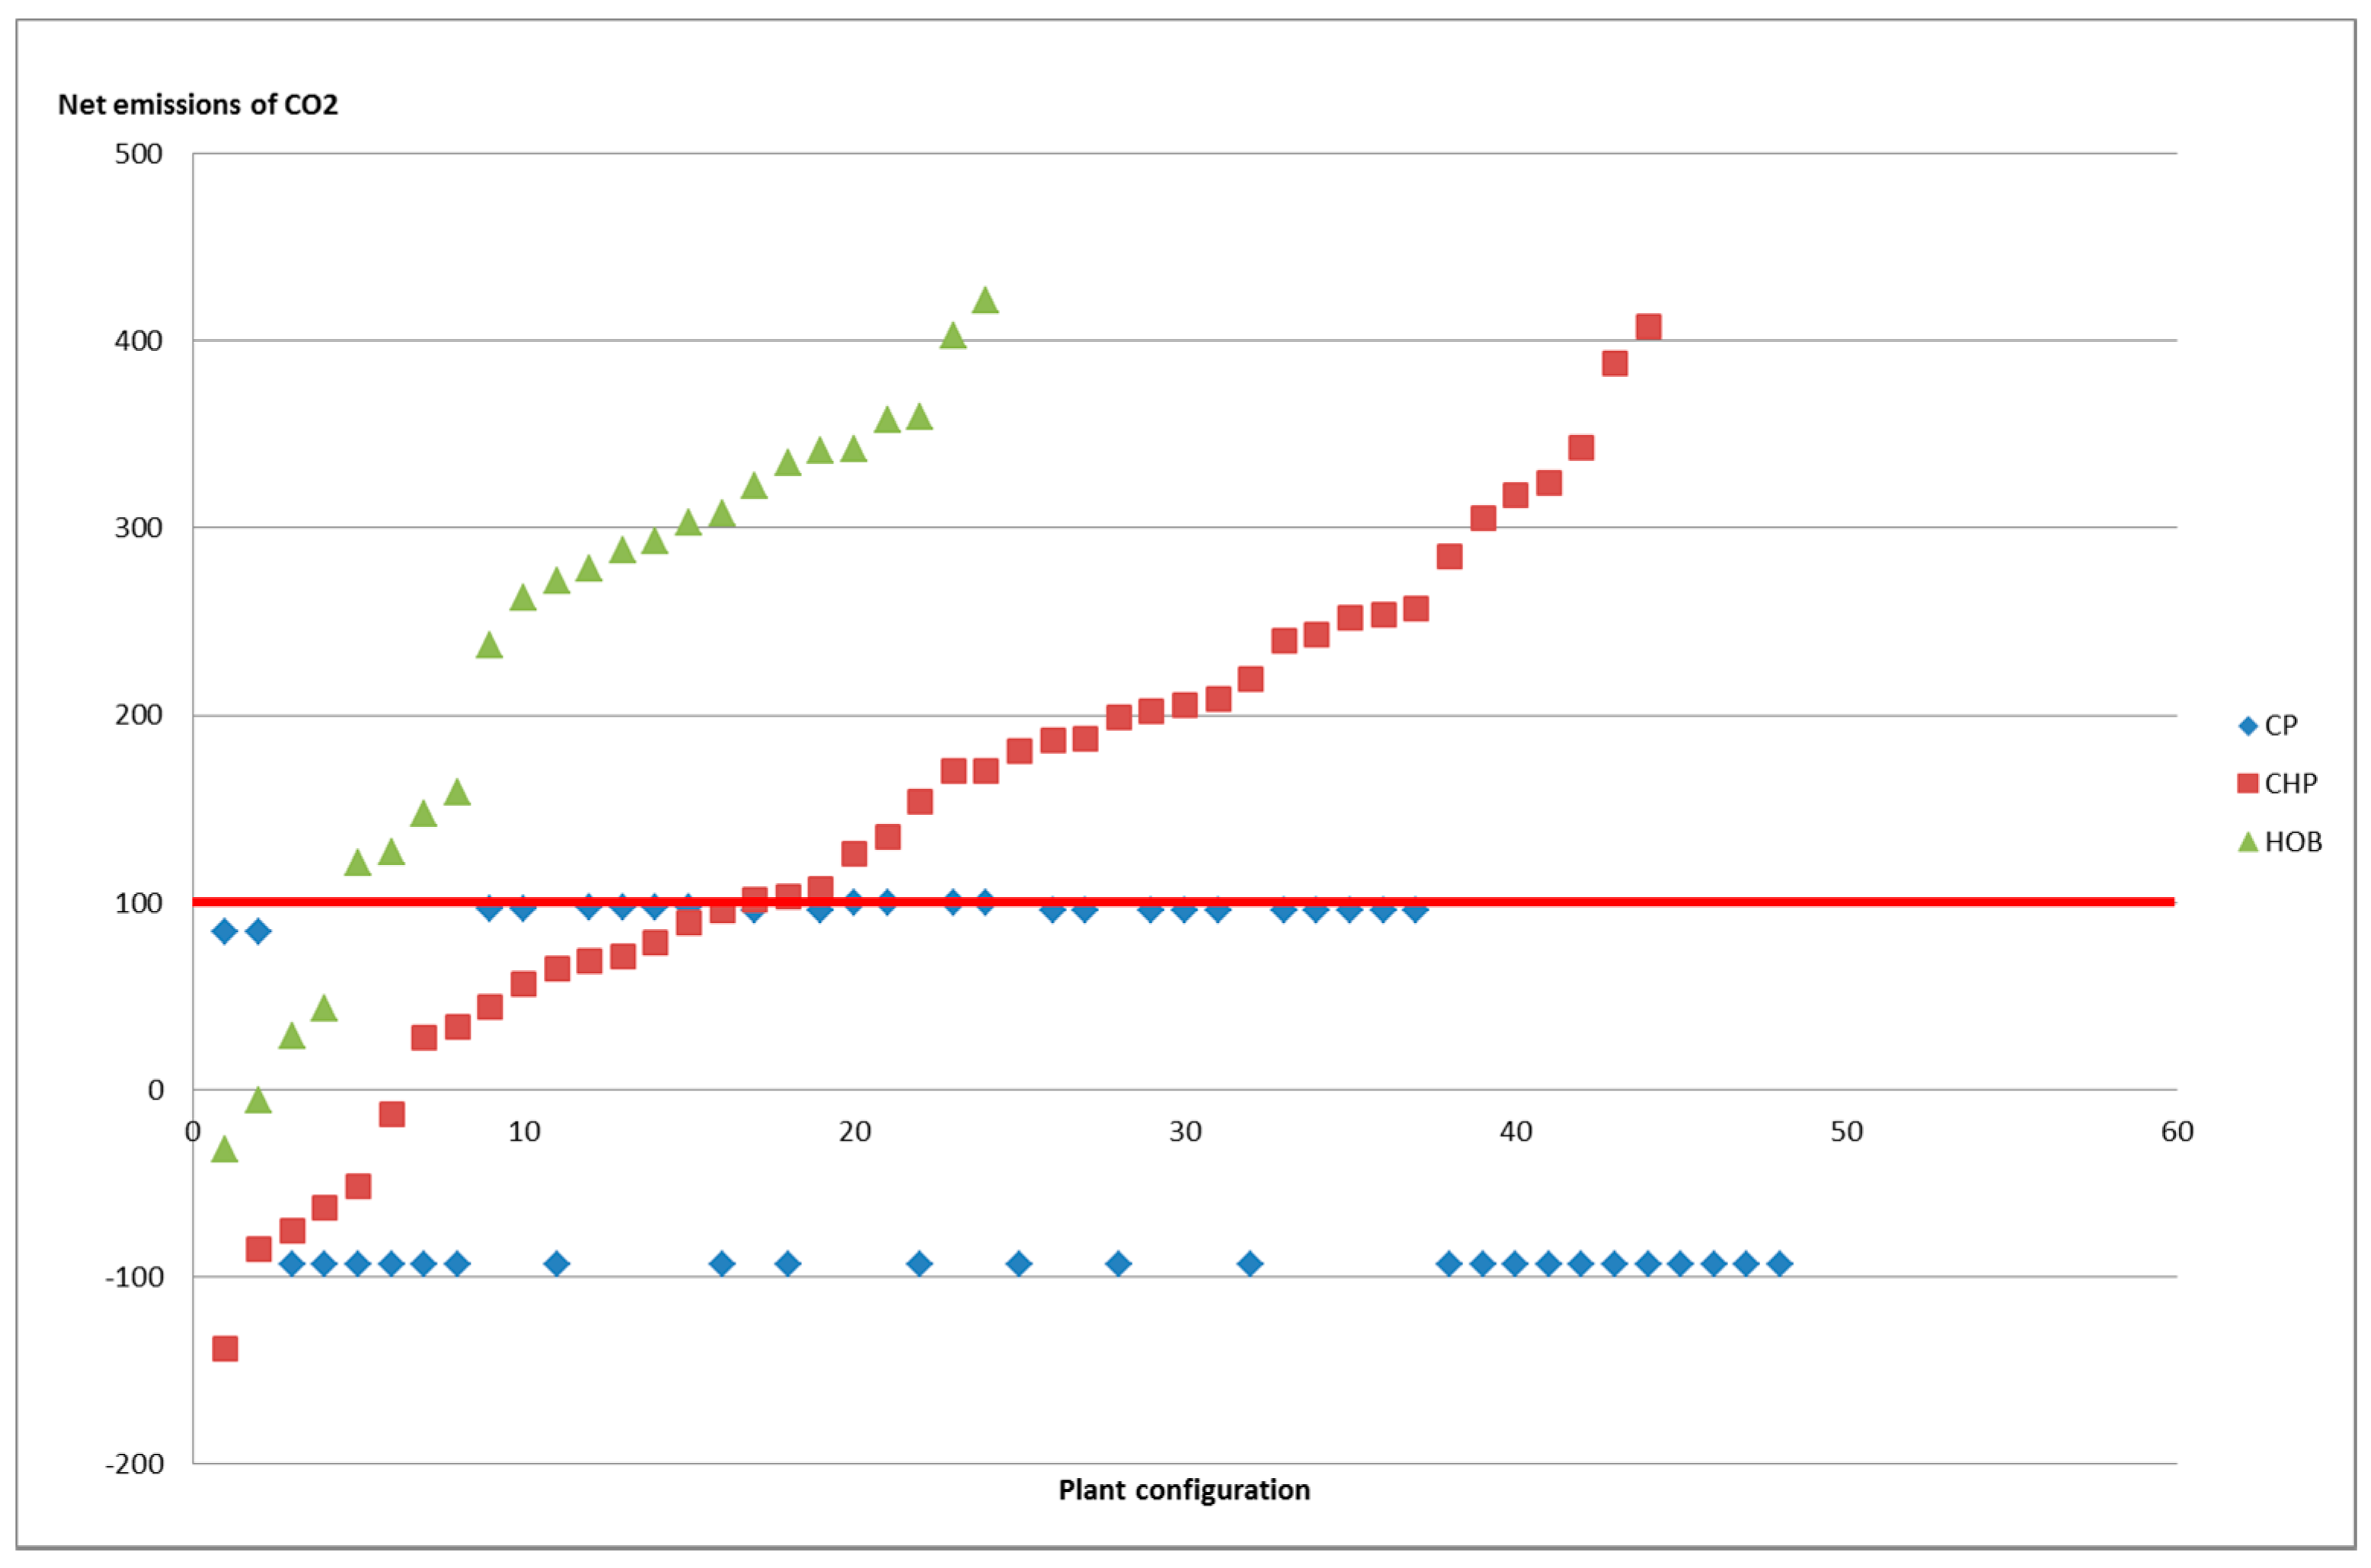
The sensitivity analysis is made by comparing different types of heat sources one by one, which means that heat from incineration is repeatedly substituted by a single technology. This is somewhat untraditional compared to most LCAs where heat from incineration is substituted either by a single technology or a mix of technologies which are given for a certain energy system using average or marginal data. This study is however a sensitivity analysis, meaning that the relative importance of different factors is interesting. The test setup reminds of a Monte Carlo simulation, but as probability distributions are unknown, only min and max values for each plant type/technology are tested. This plant type-to-plant type comparison enables a deeper insight on system dynamics than a conventional setup. Plant types are chosen to represent a wide variety of technologies and fuels in order to capture all extremes in contrast to similar studies that aim to look at the most common or probable situations.
Different design of an incineration plant has been examined. The comparison covers three types of energy recovery from incineration: heat only boiler (HOB), condense power (CP) and combined heat and power (CHP). The degree of efficiency for each plant type is varied (high and low) and for CHP plants the electricity efficiency is also varied. In total ten different types of plants were included in the assessment.
In addition, different design of the avoided energy generation is analysed. As for incineration, the comparison covers three types of plants: only heat generation, only electricity generation and CHP. Within each type different fuels are examined with corresponding degrees of efficiency and also electricity efficiency for CHP plants. The number of different types of plants is summing up to 23 in total.
Each type of incineration plant is then matched to all other types of plants for avoided energy generation. For HOB and CHP incinerators the substitution is based on heat generation with exchange ratio 1:1. Incineration plants with electricity generation only cannot substitute HOBs or CHPs.
In many plant-to-plant substitutions there will be a gap in the electricity generation, either a surplus or a deficit. This is solved by adding or subtracting electricity from the grid. In order to illustrate geographical differences as well as uncertainties about future electricity mixes, both average and marginal, two datasets with different levels of CO2 emissions have been applied.
When incineration CHP is replacing plants with electricity generation only there will be a surplus of heat. It would then be possible to address this gap with one or several types of heat generation, but that would expand the number of possible combinations even more. Such a combination has thus been excluded from the assessment (see Section 2.2 Assessing combinations). The studied system as described above is displayed in Figure 1.

2.1. Data Inventory

In this part, discrete choices like fuel selection as well as choice of technological data are described. First of all the alternative fuels in the energy system have to be identified. Based on previous studies (see Introduction), and with the aim to cover both renewable and non-renewable fuels, following fuels were selected:
  • Biomass (HOB, CHP);
  • Oil (HOB);
  • Coal (CP);
  • Wind power;
  • Natural gas (NGCC, CHP);
  • Waste (HOB, CHP).
It may look contradictory to substitute waste incineration with waste incineration, but it actually reflects the situation when an old waste incinerator is replaced with a new and also when a waste HOB is rebuilt into a CHP.
Next step is to find data on degree of efficiency and power-to-heat ratio for all plants including also waste incineration with backpressure (condense power). There are several types of degrees of efficiency available. In this context, we use the overall efficiency, also called energy-to-fuel ratio, which is expressed as:
η = el + heat fuel
A factor describing how much electricity that is generated from a CHP can be derived in multiple ways. The electricity efficiency, also called power-to-energy ratio is calculated as:
α 3 = el el + heat
This type of efficiency does not take into account the efficiency of the combustion process and may therefore not be of use in the assessment. The term has been further developed by multiplying the power-to-energy ration with the overall efficiency, which gives the power-to-fuel ratio:
α 2 = el fuel
In this assessment, a third option is also used, the power-to-heat ratio:
α 1 = el heat
For waste incineration, data represent the actual deliveries from existing plants, thereby constituting annual efficiencies. For the other fuels, technical efficiencies have been applied. The guiding principle for choice of data in the assessment has been easy accessible data from literature, including “grey literature”, i.e., different reports and data sets reflecting both inefficient, state-of-the-art and contemporary data. Data based on statistics for many plants have been prioritized when possible. The idea is not be exact but rather to find “extreme”, but still valid, values as this is a sensitivity analysis. For incineration with HOB and CHP, data has been taken from [23], Sections 8.3.2 and 8.4.2. These data are for Swedish plants and mainly reflect plants constructed 1990–2006 when incineration was expanded in Sweden. These plants (a mix of grate furnaces and fluidized beds) have been designed to be efficient in terms of heat delivery to a district heating system. More recent data for the Swedish incineration plants have not been found, but efficiencies used are consistent, they still reflect fairly “good” plants in a European perspective and are actually based on data from real plants. For incineration CP data has been taken from [24] in combination with personal communication with author Dr-Ing Dieter O Reimann. There is a more recent CEWEP Energy report from 2012 reporting status in 2007–2010 for 314 WtE plants all over Europe, but the previous report [24] was chosen as to comply with values comparable to the 2006 situation. Waste CP does not exist in Sweden but is quite common in Europe. The investigation covers 231 European waste-to-energy plants from 16 countries (15 EU countries and Switzerland) with data from operation years 2004–2007. The mixed municipal solid waste (MSW) incinerated by these investigated plants represent a share of 76% of the incinerated MSW in EU27 in 2006. The calculations are made in accordance with the Waste Framework Directive 2008/98/EC and refers to the R1 efficiency. R1 is calculated as the energy produced as heat or electricity minus the sum of energy from other fuels and imported energy and finally this delivered energy is divided by the sum of net calorific value of treated waste and energy from other fuels including a reduction by 3% due to energy losses from bottom ash and radiation. Some of the figures on overall and electricity efficiency may seem low as these figures do not reflect what the incinerator can generate but what is really exported, taking into account all internal use of energy.
For biomass, (HOB and CHP) data on overall efficiency is taken from two sources. Low efficiency comes from [25] and high efficiency from [26]. Both reports are frequently used in LCA of waste management in Sweden and represents state-of-the-art data. Data on power-to-fuel ratios are also from [26]. For oil (HOB) high efficiency is taken from [25] and low efficiency from [27]. Efficiencies for coal condense power plant is taken from [28].
As wind power is not a combustion technology, data on energy generation is not applicable. Overall efficiency for combustion of natural gas in a NGCC is taken from [26]. Several references report 0.58 [25,28] and contacts with experts confirm most NGCC to be around 60% why no interval is suggested. Low efficiency for natural gas CHP is from [27] and high efficiency from [25]. Power-to-fuel ratio is from [26]. All figures on efficiency and power-to-fuel ratio are displayed in Table 1.
Using different combinations of the efficiencies for waste incineration (Table 1) 8 different setups for incineration plants can be derived, see Table 2. The values for power-to-heat ratio have been calculated with Equation (4) using that the energy in the fuel is transformed to electricity, heat and losses (e.g., CHP1: losses are (1 − 0.941 = 0.059), electricity 0.184 and heat is (1 − 0.059 − 0.184 = 0.757), thus α1 = 0.184/0.757 = 0.24). Avoided energy generation (Table 1) can be expressed in 23 different setups (district heating (6), condense power (4), wind power (1), CHP (12)).
Emission factors for CO2 have mainly been taken from literature, given as g/kWh fuel, and presented in Table 3. In line with established LCA methodology biogenic CO2-emissions are treated as carbon-neutral [29] as well as the CO2 that is produced from oxidized biogenic methane [30].
The emission factor for waste incineration has been estimated by a qualitative analysis of values between 118 ton/GWh [27], 83 g/kWh [25] and model results with the ORWARE model for a Swedish large scale incineration plant (Sävenäs CHP) with 130 g/kWh. Biomass combustion is set to 17 g/kWh [28]. For coal condense power different sources suggest the emission in g/kWh el to be 750–985. Here the value of 335 g/kWh of fuel (equals 838 g/kWh el at a 40% degree of efficiency) is used [31]. For natural gas two emission factors are used, for NGCC and CHP. When expressed as g/kWh fuel they should be identical but we have chosen to use the data found in the reference. The difference is small and should not affect the results to any great extent.
The assessment is looking at short-term consequences, i.e., what the impact would be if the substitution took place in the near future (appr. 10 years). To illustrate the importance of the assumption made concerning electricity, two different emission factors have been used. In LCA, a difference is often made between attributional studies, typically using average data, and consequential studies using marginal data e.g., [32,33]. Depending on geographical differences, the emission factors for the average grid mix can differ a lot in different parts of Europe as well as globally. In addition, the marginal electricity production can vary a lot depending on assumption about future energy markets and policies including assumption about the cap and trade system for CO2-emissions in Europe (c.f. [26,34,35]). Here we use one high and one low emission factor (670 g/kWh electricity and 160 g/kWh electricity) which could correspond both to different average mixtures as well as marginal data depending on assumptions on cap and trade systems.
The function of waste incineration is not only to produce heat and electricity but of course also to manage the waste. This means that if the waste is not incinerated, it has to be treated in some other way. Some waste may have recycling as alternative treatment whereas some waste is currently disposed of in a landfill. It has been shown in a previous study [8] that assumptions on avoided waste management can be crucial. Two options for avoided waste management are considered, landfill disposal or recycling (material recycling and biological treatment of organic waste). The emission factors are dependent on the current emission factor for electricity (as electricity is being used in the recycling processes) and landfills are assumed to have gas extraction with energy recovery. The emissions will also depend on the waste composition and details about the treatment processes. The waste composition used here corresponds to Swedish average of fractions that can be incinerated, landfilled or recycled as described in Eriksson et al. [8]. For other countries or another temporal scope, the emission factors in Table 4 could be different due to different waste composition. The emission factors used are recalculated (by applying the current CO2 emissions factors for electricity) from [8] and are displayed in Table 4.
The recycling figures emanate from a comprehensive assessment of material recycling of the recyclable parts of MSW such as different plastics, paper, cardboard and organic waste [8]. Many recycled materials were assumed to replace an equivalent amount of virgin material, some were modelled as replacing other types of material, and in some cases the replacement ratio recycled:virgin material was less than 1:1 [8]. In the assessment emissions from the avoided waste management are subtracted which means that emissions of CO2 will increase for recycling (recycling saves emissions, hence avoided recycling leads to increased emissions) and avoided landfill disposal means decreased emissions (avoided emissions from current landfill disposal). In contrast to waste, biomass and fossil fuels that are not used are assumed to be saved.

2.2. Assessing Combinations

The results for CO2 emissions are net emissions based on a simple calculation. When 1 kWh of waste is incinerated, 100 g of CO2 is released to the atmosphere, equal for all incineration plant types in the study. The CO2 emissions from the avoided heat generation are then subtracted. After that the emissions from external electricity generation is included: for a net production, emissions are avoided, and if electricity generation is lost, it will be replaced and corresponding emissions are added. The calculation principle is illustrated in Figure 2.
Note that this study is neither attributional, nor consequential. It aims to illustrate the importance of plant configurations, hence combinations from both attributional and consequential studies can be found.
The different configurations (Table 1) end up in 230 potential combinations. However, many of these combinations can be omitted for different reasons:
  • Heat plants and power plants cannot replace each other, which lead to 34 omitted combinations.
  • In six combinations similar plants replace each other.
  • As mentioned earlier some combinations (waste CHP substitutes only electricity generation) will give a surplus of heat. These 20 combinations are not examined, as the corresponding heat substitution is undefined.
  • In 10 combinations (waste HOB substitutes other HOBs) there is a trivial substitution (fuel by fuel) and will therefore not be examined.
As a result, there are 128 combinations left to analyse (see Table A1, Table A2, Table A3, Table A4 and Table A5):
  • 24 solutions for waste CHP replacing HOB (Table A1);
  • 8 solutions for waste CP replacing CP and wind power (Table A2);
  • 32 solutions for waste incineration replacing waste CHP (Table A3);
  • 32 solutions for waste incineration replacing biofuel CHP (Table A4);
  • 32 solutions for waste incineration replacing natural gas CHP (Table A5).

3. Results

Figures relate to a high CO2 emission for electricity (670 g/kWh). The implications of (1) less polluting electricity generation and (2) avoided waste management are elaborated in a sensitivity analysis.

3.1. Waste CHP Replacing HOB

Detailed results are found in Appendix A, Table A1. When HOBs are replaced most combinations lead to overall negative emissions, i.e., savings in emissions. The largest savings are reached when a waste CHP-plant, with high overall and electricity efficiencies, replaces oil HOB. In addition, the least efficient CHP plant results in net CO2 savings as long as oil is substituted. For substitution of biofuels a change in the degree of efficiency for the biofuels combustion has almost no impact on the results, which makes sense as the CO2 emissions from biofuels combustion is low and the difference in degree of efficiency is modest. For the waste CHPs a high power-to-fuel ratio give net reductions while a low power-to-fuel ratio give net contributions except for oil HOB replacement. Replacing waste HOB gives net savings in CO2 as long as the CHP is efficient.

3.2. Waste CP Replacing Plants with Electricity Generation Only

Detailed results are found in Appendix A, Table A2. When waste CP replaces wind power there is no emission reduction, as wind power has no CO2 emissions. Replacing NGCC give net contribution (98 g), unless the incineration condense plant has high efficiency (net emission close to zero). If the waste CP has a low power-to-fuel ratio, the net emission is app. 100 g for all types of avoided energy generation. This emission comes from the incinerator itself, as almost no electricity is generated and hence not substituted either.

3.3. Waste CHP Replacing Other CHP

There are in total 96 combinations for avoided CHP (waste, biofuel, natural gas). The results have been plotted in two diagrams (Figure 3 and Figure 4). A more detailed evaluation made fuel wise is found in Appendix A, Table A3, Table A4 and Table A5. In Figure 3 each incineration plant type (HOB1, HOB2 etc.) has its own row plotted with the resulting CO2 emission from the substituted plants. Each data point is characterized by the type of fuel avoided. The y-axis is set to 100 g CO2 corresponding to the emission from each investigated incineration plant. This implicates that data points with resulting emission less than 100 g mean a saving in relation to incineration only (emission factor is 100 g/kWh) and data points with negative values mean overall savings of CO2.
For all setups, there is a large interval for the emissions, from CO2 savings of 150 g to positive net emissions of 400 g and more. The average CO2 emission is 150 g, which means that most combinations lead to higher emissions after substitution. Reading from Figure 3 waste-CHP (blue squares) is the best substitute compared to bio-CHP and natural gas-CHP independent of type of incineration plant. This is explained by that power generation from waste CHP is much lower than for biofuel CHP or natural gas CHP, which leads to smaller losses of electricity that have to be compensated for by other electricity. When natural gas CHP is compared to biomass CHP it is somewhat surprising that the fossil alternative is comparable to the renewable one (red squares and green triangles are nested). The CHP3 does not end up in higher emissions than from the incinerator itself for any of the investigated alternatives.

3.4. Plant Configuration

The final step of this part of the evaluation is if there is any systematic difference between the incineration plant types, irrespective of avoided fuel. In Figure 4 the plant types have been plotted as a function of net CO2 emissions. In relation to Figure 3 labelling of substituted fuel has been omitted to preserve focus on plant configurations. Resulting emission of CO2 is displayed on the y-axis while plant configurations have been plotted in ascending order from left to right on the x-axis. CP plants end up in two positions (±100 g).
Considering HOB plants there are only four combinations (out of 24) below the limit of 100 g. These four have in common that the most inefficient waste CHPs are substituted. In common for the waste CHP with net emissions <100 g is that all substitutions with other waste incineration are included and all CHP3 substitutions for biofuel and natural gas (this can be observed in Table A3, Table A4 and Table A5). Else waste CHP is not a favorable option. This comes from that all other waste CHP configurations have a lower power-to-heat ratio than any CHP for biofuels or natural gas. With the high emission factor from electricity (670 g/kWh) many of the incineration condense power plants have negative net emissions when replacing waste incineration CHP.

3.5. Sensitivity Analysis

Two sensitivity analyses have been performed which investigate (1) the importance of CO2 emission for the marginal electricity and (2) the importance of including avoided waste management.
When CO2-emissions of 160 g/kWh for marginal electricity are applied, the CO2 emissions for waste CHP replacing HOB plants increase as the generated electricity now substitutes electricity with lower CO2 emissions. Plants with low electricity efficiency (CHP2 and CHP4) show minor changes whereas plants with high electricity efficiency (CHP1 and CHP3) show significant increase of emissions. The internal ranking for each CHP is however constant. Results for waste CHP replacing other CHP are depicted in Figure 5, which repeats the information in Figure 3 with the lower emission factor.
Most combinations end up in significantly lower emissions. The interval shrinks between the best and the worst combination for both biofuel and natural gas. As biofuel CHP has low specific CO2 emissions, the emission decrease can be explained almost entirely by the lower emission factors from electricity production. As the overall efficiencies do not differ that much between the different biofuel CHPs, internal differences among biofuel CHPs can be explained by the difference in power-to-heat ratio. Natural gas substitution is on the contrary most affected and becomes the best option for all plant types
When adding emissions for avoided waste management most combinations will just have an addition or subtraction of emissions corresponding to the emission factors for avoided waste management. This means that when incineration is replacing landfilling, the results will be lower, making the results for incineration better. When incineration is replacing recycling, results will be higher, making incineration less beneficial.
When waste incineration substitutes other waste incineration, the net impact can shift due to differences in the degree of efficiency leading to a surplus of deficit of waste. Table 5 illustrates the contribution for avoided landfill disposal and Table 6 is a similar table for avoided recycling.
The HOBs (HOB1-2) will treat a smaller amount of waste than substituted plants with lower efficiency. The waste amount surplus created is directed to landfill disposal which increases the net emissions quite substantially.
For CHPs with low power-to-fuel ratio more waste is needed to generate the same amount of electricity. If such incineration is avoided, the waste is instead directed for landfill disposal leading to increased net emissions.
CHP3-4 have low overall efficiency and replaces incineration plants where the efficiencies often are higher. This means that more waste now has to be combusted to generate the same amount of heat. This waste is taken from landfill and net emissions will decrease accordingly. In one combination for CHP4 the emissions are increasing (+220 g). Here the avoided CHP plant has a high share of electricity generation, which in turn means that more waste has to be combusted to generate the same amount of heat. In this case, less fuel is needed as an incineration plant with lower heat efficiency is avoided. Waste not subject to incineration is disposed of in landfill and the net emissions will be positive. Finally, CHP1-2 has higher degree of efficiency. As plants with lower efficiency are replaced, the result explanation is analogue to HOB1-2. As plants with the same degree of efficiency but another power-to-fuel ratio is replaced, the fuel addressed for electricity generation decides if landfill disposal is avoided or needed (note the shift between −84 g (Table 5: column CHP2, row CHP1) and +100 g (Table 5: column CHP1, row CHP2).
The results for avoided recycling do not add much information on system dynamics; compared to Table 5 all signs are shifted and all numbers are a bit lower as the emission factor now has been changed.

4. Discussion

A result from this study is that waste incineration cannot be regarded as one technology. Instead, it is clear that the results can differ substantially depending on the technology for waste incineration. Simple comparisons between incineration and other waste management technologies (e.g., [16]) can therefore be misleading.
The first issue regards the design of the incineration plant (HOB, CP, CHP). As can be seen in Figure 4, waste HOB usually leads to higher emissions than CP or CHP. This is because there is no saving in electricity. In general a waste HOB will not decrease the emissions as much as waste CP or waste CHP due to that there are no savings in electricity generation.
When looking at the results in Figure 3 and Figure 5 an impression is that in many cases, increased waste incineration using CHP will not decrease emissions. The major exception is when efficient waste incineration replaces inefficient waste incineration. The figures indicate the advantages of the waste incinerators with high electricity efficiencies (CHP1 and CHP3) underlining the importance of electricity production.
When looking at Figure 3, Figure 4 and Figure 5, it should however be remembered that avoided waste management is not included. If waste incineration is assumed to replace landfilling, all the dots for biofuels and natural gas would move significantly to the left making waste incineration look more attractive. For the cases when waste incineration replaces waste incineration, the situation is more complex depending on relative efficiencies as presented in Section 3. On the other hand, if waste incineration is replacing recycling, all the biofuel and natural gas dots would move to the right making waste incineration less attractive. This underlines the importance of including avoided waste management when different fuels are compared. Data for recycling in this study assumes efficient recycling processes. If less efficient recycling processes would be assumed, the results would fall somewhere in between the current recycling and incineration alternatives. This could be further explored in future studies.
The importance of the avoided waste management also introduces a time aspect. Currently in many countries, waste is being landfilled although there are clear policy targets to get away from landfilling of organic waste. This means that in the future, in many countries, it may not be possible for waste incineration to replace landfilling, if there is no waste going to landfills.
In this study, waste is considered as one fraction. In practise, waste consists of a number of different fractions with different emissions factors in incineration, landfilling and recycling. For example, easily degradable bio-waste (e.g., food waste) can if landfilled generate significant emissions of methane, whereas if it is incinerated, the emissions will be regarded as zero since they are of biological origin. For this fraction, incineration has thus clear advantages over landfilling. In contrast, for plastics of a fossil origin, landfilling causes very limited emissions in a short time perspective, whereas incineration causes significant emissions [36]. For this fraction, waste incineration will therefore typically increase emissions of greenhouse gases. If increased source separation would be possible, different fraction could be treated in different ways leading to reduced emissions.
When it comes to the design of the avoided energy generation (HOB, CP, CHP) substituting condense power with incineration CP will in most cases not result in lower emissions (c.f. Table A2). It is worth noticing that in many cases the type of energy has no impact on the results. In general, the emissions will decrease if inefficient plants using fossil fuels are replaced by incineration, in particular when landfill disposal is avoided.
The degree of efficiency is important, but large variations are only observed for waste CP and waste CHP while the others have smaller intervals. In general, plants with high degrees of efficiency should replace plants with low efficiency, but there are exemptions e.g., when waste CHP replaces biofuel HOB (Table A1) or when waste CP with low electricity generation replaces other CP (Table A2).
The electricity efficiency in CHP plants is one of the most important factors. The power-to-fuel ratio is in general much lower for waste CHP than for other CHP, which means that only the most efficient waste CHP can compete when replacing inefficient existing CHP using other fuels. The avoided fuel is important when replacing HOB, but for CHP substitution this is not important as the effect of the electricity efficiency is much larger. The emission level of the avoided electricity generation has no or limited influence when incineration plants are replaced with each other, but as the electricity efficiency in CHP plants is crucial, this factor also is. The highest implication of this occurs when waste CHP substitutes natural gas. Avoided landfill disposal has a large impact in favour of incineration replacing biofuel or natural gas. New efficient incinerators should however not replace old inefficient CHP plants on energy basis only if waste incineration is replacing landfilling. This is because it will render a surplus of waste (the new plant uses less waste to generate the same amount of heat) which, if directed to landfill, will lead to increased emissions. If new efficient incinerators replace old inefficient ones this could potentially happen, but if new plants with higher fuel capacity can treat more waste than before and all energy is recovered this deficit in treatment capacity can be overcome. If the avoided waste management is recycling, more efficient waste incinerators will release more waste to be recycled, leading to lower emissions. This again underlines the importance of looking at waste management and energy systems in a holistic perspective to avoid sub optimisation.
This study has focused on CO2-emissions and other gases contributing to climate change. This is however not the only environmental problem of significance. If also other types of emissions would have been included, other results could have been attained and different types of flue-gas cleaning technologies would have come more into focus. Data uncertainty is an issue of concern, in this study Swedish and European data have been used. Data sets on global scale are hard to retrieve, but as incineration is a substantial part of Swedish and European energy systems, the data choice works as a good approximation for a generic study. By presenting data used in the assessment, readers from other parts of the world can determine the applicability to their own case. Data may sometimes be considered as old, but as they often constitute a mean value for vast amounts of plants, they may still be used as such mean values will not change rapidly over time. Another issue of concern regards the completeness of the study and system boundaries. For example, emissions from the construction of the plants, from treatment of ashes, and production of fuels, etc. are not included. It is expected however, that these will only have a limited influence on the results, and can thus be neglected in this sensitivity analysis focusing on aspects which potentially can have much larger influence on the results. Recycling of metals from ashes can reduce emissions of greenhouse gases (e.g., [37]) and this could be an important aspect of further studies.
The study can also have implications on life-cycle assessment methodology. When waste incineration is compared to other waste management practises it is normally assumed that the electricity and/or heat produced is replacing some specific fuel and fuel mix. In this study, we are however assuming that the waste incineration is replacing a specific type of plant with specific efficiencies and this is a novelty of this study. This means that in some cases, there are not only avoided energy, but also avoided-avoided electricity production in some cases (c.f. Figure 2). As shown in this study this can have implications since the electricity efficiencies can vary between different waste incinerators, and also is often lower for waste incineration compared to incineration of other fuels.

5. Conclusions

This study provides quantitative results on the implications of different technological data for waste incineration and competing technologies for heat and power production. Based on the results from this assessment the power-to-fuel ratio in combination with the emission level of the avoided electricity generation and the avoided waste management are identified as the most important factors. It is vital that new efficient incineration is designed as CHP. If current waste incineration is replaced, the most inefficient plants should be substituted. In case there is a surplus of waste, due to the higher efficiency as described above, it should not be subject to landfill disposal but recycled. New efficient waste incineration should primarily substitute current inefficient CHP production. This is because the influence of power production can be substantial. It is also clear from the assessment that avoided waste management is as important as what type of electricity production the CHP plants can replace. The emissions factors for landfill disposal are of the same magnitude as the emission factors for high polluting electricity. It is also noted that the emission factor for material recycling (which is an average value for a mix of recycling processes) are negative since recycling includes avoided virgin production and constitute a saving in emissions. In a short time perspective, all these arguments are in favour of exporting waste from countries where waste is subject to landfill disposal, to be efficiently incinerated in CHP plants in countries with district heating systems, especially if it can avoid use of fossil fuels. However, gradually landfill disposal must be replaced by treatment found higher up in the waste hierarchy where transports are minimised. This means that on a long term each country must develop a more sustainable management of its own waste. A novel aspect of this study is the plant-by-plant comparison showing how different electricity efficiencies associated with different types of fuels and plants influence results. Since waste incineration typically have lower power to fuel ratios, this has implications for further analyses of waste incineration compared to other waste management practises and heat and power production technologies.

Acknowledgments

Thanks to Thomas Unger and Dieter Reimann for help with data inventory. We would also like to thank Swedish EPA (Naturvårdsverket) which to some extent has funded our time to perform the assessment. Thanks also to anonymous reviewer for helpful comments.

Author Contributions

Ola Eriksson and Göran Finnveden conceived and designed the calculations; Ola Eriksson performed the inventory and calculations; Ola Eriksson and Göran Finnveden analysed the results; Ola Eriksson wrote most of the paper with contributions from Göran Finnveden.

Conflicts of Interest

The authors declare no conflict of interest.

Appendix A

α1 = power-to-heat ratio; α2 = power-to-fuel ratio.

A.1. Waste CHP Replacing HOB (Detailed Results for Section 3.1)

Table A1. CO2 emissions (g/kWh), plants with HOB being substituted.
Plantηα1α2WasteWasteBiofuelBiofuelOilOil
η---0.870.701.100.910.910.85
CHP10.9410.240.184−110−132−35−37−251−267
CHP20.9410.040.039−30−566057−198−217
CHP30.5260.540.184−63−72−29−30−126−134
CHP40.5260.080.0391846665−73−83

A.2. Waste CP Replacing Plants with Electricity Generation Only (Detailed Results for Section 3.2)

Table A2. CO2 emissions (g/kWh), plants for electricity production only being substituted (NA = Not Applicable).
Plantηα1α2CoalCoalWindpowerNGCC
η---0.450.351.000.58
CP10.288NA0.288−114−176100−1
CP20.006NA0.006969410098

A.3. Waste CHP Replacing Other CHP (Detailed Results for Section 3.3)

Table A3. CO2 emissions (g/kWh), waste-CHP plants being substituted (NA = Not Applicable).
Plantηα1α2CHP1CHP2CHP3CHP4
HOB10.869NANA12729159−32
HOB20.696NANA12143147−6
CP10.288NA0.288−93−93−93−93
CP20.006NA0.00696969696
CHP10.9410.240.184-−8528−138
CHP20.9410.040.039102-135−63
CHP30.5260.540.184−13−51-−75
CHP40.5260.080.0398934107-
From Table A3 the best results are achieved when a plant with low overall efficiency and low power-to-fuel ratio (column 4) is substituted. In fact, this plant results in the lowest net emissions of all CHPs (c.f. biofuel (Table A4) and natural gas (Table A5)). In particular when waste is incinerated in a condense plant with high overall and electricity efficiency (CP1) there are large negative net emissions for all combinations. In this case, the electricity efficiency is most important as CP2 have similar results or at least net emissions above 100 g.
As expected efficiencies have a large impact on the results. If a CHP with high overall efficiency but low power-to-heat ratio (CHP2) substitutes a CHP with low overall efficiency and a high power-to-heat ratio (column 3) the net emissions are 135 g. Given same overall efficiencies but with a shift in electrical efficiency (CHP1 with a high power-to-heat ratio substitutes a plant with a low power-to-heat ratio (column 4)) can save just as much (−138).
With few exceptions, net emissions are equal or higher than 100 g/kWh which is the emission from waste incineration without any substitution (Table A4). The highest net emissions are for waste incineration in plants with no electricity generation such as HOB (HOB1-2) and CHPs with high overall efficiency and low electricity efficiency (CHP2). The power-to-fuel ratio is most important (compare CP1-2, CHP1-2 and CHP3-4), with a factor 2–3 between the alternatives. It can also be concluded that when bio-CHP with lower degree of efficiency and a high power-to-heat ratio (column 3) is substituted, the net emissions reaches the maximum of the entire study. In other words, they are the highest for all types of incineration plants, also when compared to other alternative fuels as waste CHP and natural gas CHP.
Table A4. CO2 emissions (g/kWh), bio-CHP plants being substituted (NA = Not Applicable).
Plantηα1α2BiofuelBiofuelBiofuelBiofuel
η---1.101.100.910.91
α1---0.450.330.600.42
HOB10.869NANA341272421323
HOB20.696NANA293237357278
CP10.288NA0.288−93−93−93−93
CP20. 006NA0.00696969696
CHP10.9410.240.184187126257171
CHP20.9410.040.039324252407305
CHP30.5260.540.184724410364
CHP40.5260.080.039209170254199
If natural gas CHP is substituted (Table A5), the least polluting alternatives are found for a waste CP with a high power-to-fuel ratio (CP1). A change in power-to-fuel ratio flips the results from −93 to +96. Again, HOB plants result in high emissions for all natural gas CHP and consequently a very efficient waste CHP (CHP3) is considerably better than the other CHP options. It seems that both types of efficiencies are important. There are moderate differences between the different natural gas CHP plants, in particular when comparing results in the first and the last column. The interval for degree of efficiency for natural gas CHP is quite narrow meanwhile the power-to-heat ratio can vary considerably making it more crucial to the result (comparing middle columns). Finally, CP1-2 and CHP3 are the only plant configurations leading to emissions below 100 g for all combinations, i.e., reductions compared to the emission from incineration.
Table A5. CO2 emissions (g), natural gas-CHP plants being substituted (NA = Not Applicable).
Plantηα1α2Nat. GasNat. GasNat. GasNat. Gas
η---0.910.910.850.85
α1---1.171.021.361.18
HOB10.869NANA359303402334
HOB20.696NANA308263342288
CP10.288NA0.288−93−93−93−93
CP20.288NA0.00696969696
CHP10.9410.240.184203154240181
CHP20.9410.040.039343285388317
CHP30.5260.540.18479579669
CHP40.5260.080.039219188243205

References

  1. EU. Council Directive 1999/31/EC of 26 April 1999 on the Landfill of Waste; Official journal of the European Communities: Brussels, Belgium, 1999. [Google Scholar]
  2. Eurostat Tables, Graphs and Maps Interface Table. Available online: http://ec.europa.eu/eurostat/tgm/table.do?tab=table&plugin=1&language=en&pcode=tsdpc240 (accessed on 19 October 2016).
  3. Ljunggren-Söderman, M. Recovering energy from waste in Sweden—A systems engineering study. Resour. Conserv. Recycl. 2003, 38, 89–121. [Google Scholar] [CrossRef]
  4. Sahlin, J.; Knutsson, D.; Ekvall, T. Effects of planned expansion of waste incineration in the Swedish district heating systems. Resour. Conserv. Recycl. 2004, 41, 279–292. [Google Scholar] [CrossRef]
  5. Eriksson, O.; Frostell, B.; Björklund, A.; Assefa, G.; Sundqvist, J.-O.; Granath, J.; Carlsson Reich, M.; Baky, A.; Thyselius, L. Municipal Solid Waste Management from a Systems Perspective. J. Clean. Prod. 2005, 13, 241–252. [Google Scholar] [CrossRef]
  6. Finnveden, G.; Johansson, J.; Lind, P.; Moberg, Å. Life cycle assessment of energy from solid waste—Part 1: General methodology and results. J. Clean. Prod. 2005, 13, 213–229. [Google Scholar] [CrossRef]
  7. Holmgren, K. Role of a district heating network as a user of waste-heat supply from various sources—The case of Göteborg. Appl. Energy 2006, 83, 1351–1367. [Google Scholar] [CrossRef]
  8. Eriksson, O.; Finnveden, G.; Ekvall, T.; Björklund, A. Life Cycle Assessment of fuels for district heating—A comparison of waste incineration, biomass- and natural gas combustion. Energy Policy 2007, 35, 1346–1362. [Google Scholar] [CrossRef]
  9. Luoranen, M.; Horttanainen, M. Co-generation based energy recovery from municipal solid waste integrated with the existing energy supply system. Waste Manag. 2008, 28, 30–38. [Google Scholar] [CrossRef] [PubMed]
  10. Merrild, H.; Damgaard, A.; Christensen, T.H. Life cycle assessment of waste paper management: The importance of technology data and system boundaries in assessing recycling and incineration. Resour. Conserv. Recycl. 2008, 52, 1391–1398. [Google Scholar] [CrossRef]
  11. Münster, M.; Meibom, P. Long-term affected energy production of waste to energy technologies affected by use of energy system analysis. Waste Manag. 2010, 30, 2510–2519. [Google Scholar] [CrossRef] [PubMed]
  12. Fruergaard, T.; Christensen, T.H.; Astrup, T. Energy recovery from waste incineration: Assessing the importance of district heating networks. Waste Manag. 2010, 30, 1264–1272. [Google Scholar] [CrossRef] [PubMed]
  13. Fruergaard, T.; Astrup, T. Optimal utilization of waste-to-energy in an LCA perspective. Waste Manag. 2011, 31, 572–582. [Google Scholar] [CrossRef] [PubMed]
  14. Laurent, A.; Bakas, I.; Bernstad, A.; Niero, M.; Gentil, E.; Hauschild, M.Z.; Christensen, T.H. Review of LCA studies of solid waste management systems—Part I: Lessons learned and perspectives. Waste Manag. 2013, 34, 573–588. [Google Scholar] [CrossRef] [PubMed]
  15. Münster, M.; Finnveden, G.; Wenzel, H. Future waste treatment and energy systems—Examples of joint scenarios. Waste Manag. 2013, 33, 2457–2464. [Google Scholar] [CrossRef] [PubMed]
  16. Laurent, A.; Clavreul, J.; Bernstad, A.; Bakas, I.; Niero, M.; Gentil, E.; Christensen, T.H.; Hauschild, M.Z. Review of LCA studies of solid waste management systems—Part II: Methodological guidance for a better practice. Waste Manag. 2014, 34, 589–606. [Google Scholar] [CrossRef] [PubMed]
  17. Astrup, T.F.; Tonini, D.; Turconi, R.; Boldrin, A. Life cycle assessment of thermal waste-to-energy technologies: Review and recommendations. Waste Manag. 2015, 37, 104–115. [Google Scholar] [CrossRef] [PubMed]
  18. Münster, M.; Ravn, H.; Hedegaard, K.; Juul, N.; Ljunggreen Söderman, M. Economic and environmental optimization of waste treatment. Waste Manag. 2015, 38, 486–495. [Google Scholar] [CrossRef] [PubMed]
  19. Persson, U.; Münster, M. Current and future prospects for heat recovery from waste in European district heating systems: A literature and data review. Energy 2016, 110, 116–128. [Google Scholar] [CrossRef]
  20. Lausselet, C.; Cherubini, F.; del Alamo Serrano, G.; Becidan, M.; Stromman, A.H. Life-cycle assessment of a Waste-to-Energy plant in central Norway: Current situation and effects of changes in waste fraction composition. Waste Manag. 2016, 58, 191–201. [Google Scholar] [CrossRef] [PubMed]
  21. Brogaard, L.K.; Riber, C.; Christensen, T.H. Quantifying capital goods for waste incineration. Waste Manag. 2013, 33, 1390–1396. [Google Scholar] [CrossRef] [PubMed]
  22. International Standard (2006) Environmental Management—Life Cycle Assessment—Principles and Framework; ISO 14040; International Organisation for Standardization: Geneva, Switzerland, 2006.
  23. Avfall Sverige. Energy Report (Status 2006); Rapport F2008:06, ISSN 1103-4092; Avfall Sverige: Malmö, Sweden, 2008. [Google Scholar]
  24. Confederation of European Waste-to-Energy Plants (CEWEP). Energy Report II (Status 2004–2007); Confederation of European Waste-to-Energy Plants (CEWEP): Bamberg, Germany, 2009. [Google Scholar]
  25. Uppenberg, S.; Brandel, M.; Lindfors, L.-G.; Marcus, H.-O.; Wachtmeister, A.; Zetterberg, L. Miljöfaktabok för Bränslen Del 2. Bakgrundsinformation och Teknisk Bilaga [Book on Environmental Facts for Fuels Part 2 Backgound Information and Technical Appendix]; IVL Report B 1334 B-2; Swedish Environmental Research Institute (IVL): Stockholm, Sweden, 2001. [Google Scholar]
  26. Elforsk. El från Nya Anläggningar [Electricity from New Plants]; Rapport 07:50; Elforsk: Stockholm, Sweden, 2009. [Google Scholar]
  27. Knutsson, D.; Sahlin, J.; Werner, S.; Ahlgren, E.O.; Ekvall, T. HEATSPOT—A simulation tool for national district heating analyses. Energy 2006, 31, 278–293. [Google Scholar] [CrossRef]
  28. Engström, R.; Gode, J.; Axelsson, U. Vägledning till Metodval vid Beräkning av Påverkan från Förändrad Energianvändning på de Svenska Miljömålen [Guide to the Choice of Method for Calculating the Impact on Swedish Environmental Objectives due to Changing Energy Consumption]; IVL Report B 1822; Swedish Environmental Research Institute (IVL): Stockholm, Sweden, 2009. [Google Scholar]
  29. Christensen, T.H.; Gentil, E.; Boldrin, A.; Larsen, A.W.; Weidema, B.P.; Hauschild, M. C balance, carbon dioxide emissions, and global warming potentials, in LCA-modelling of waste management systems. Waste Manag. Res. 2009, 27, 707–715. [Google Scholar] [CrossRef] [PubMed]
  30. Levasseur, A.; de Schryver, A.; Hauschild, M.; Kabe, Y.; Sahnoune, A.; Tanaka, K.; Cherubini, F. Greenhouse gas emissions and climate change impacts. In Global Guidance for Life Cycle Assessment Indicators; Frischknecht, R., Jolliet, O., Eds.; United Nations Environmental Programme: Paris, France, 2016; pp. 58–75. [Google Scholar]
  31. Unger, T.; Profu AB, Göteborg, Sweden. Personal communication, 2009.
  32. Finnveden, G.; Hauschild, M.; Ekvall, T.; Guinée, J.; Heijungs, R.; Hellweg, S.; Koehler, A.; Pennington, D.; Suh, S. Recent developments in Life Cycle Assessment. J. Environ. Manag. 2009, 91, 1–21. [Google Scholar] [CrossRef] [PubMed]
  33. Elforsk. Effekter av Förändrad Elanvändning/Elproduktion—Modellberäkningar [Effects of Changed Electricity Use/Electricity Production—Model Calculations]; Rapport 08:30 (in Swedish). Elforsk: Stockholm, Sweden, 2008. [Google Scholar]
  34. Finnveden, G. A world with CO2-caps. Electricity production in consequential assessments. Int. J. Life Cycle Assess. 2008, 13, 365–367. [Google Scholar] [CrossRef]
  35. Mathiesen, B.V.; Münster, M.; Fruergaard, T. Uncertainties related to the identification of the marginal energy technology in consequential life cycle assessments. J. Clean. Prod. 2009, 17, 1331–1338. [Google Scholar] [CrossRef]
  36. Eriksson, O.; Finnveden, G. Plastic waste as a fuel—CO2-neutral or not? Energy Environ. Sci. 2009, 2, 907–914. [Google Scholar] [CrossRef]
  37. Allegrini, E.; Vadenbo, C.; Boldrin, A.; Astrup, T.F. Life cycle assessment of resource recovery from municipal solid waste incineration bottom ash. J. Environ. Manag. 2015, 151, 132–143. [Google Scholar] [CrossRef] [PubMed]
Figure 1. System under study.
Energies 10 00539 g001
Figure 2. Illustration of plant combinations.
Energies 10 00539 g002
Figure 3. Emissions of CO2 (g/kWh) from different CHP combinations (670 g/kWh). Waste, biofuel and natural gas refer to substituted fuels due to energy recovery from waste incineration.
Energies 10 00539 g003
Figure 4. Emissions of CO2 (g/kWh) from incineration replacing CHPs.
Energies 10 00539 g004
Figure 5. Emissions of CO2 (g/kWh) from different CHP combinations (160 g/kWh).
Energies 10 00539 g005
Table 1. Overall and electricity efficiencies for the plants included (NA = Not Applicable).
Plant DesignEnergy-to-Fuel RatioPower-to-Fuel Ratio
HighLowHighLow
Incineration of waste
a Heat Only Boiler0.8690.696NANA
b Condense Power0.2880.0060.2880.006
c Combined Heat and Power0.9410.5260.1840.039
Avoided energy generation
A1 Heat Only Boiler, waste0.8690.696NANA
A2 Heat Only Boiler, biomass1.100.91NANA
A3 Heat Only Boiler, oil0.910.85NANA
B1 Condense Power, coal0.450.350.450.35
B2 WindpowerNANANANA
B3 Condense Power, NGCC0.580.580.580.58
C1 Combined Heat and Power, waste0.9410.5260.1840.039
C2 Combined Heat and Power, biomass1.100.910.340.27
C3 Combined Heat and Power, natural gas 0.910.850.490.46
Table 2. Overall and electricity efficiencies for the waste incineration plants included (NA = Not Applicable).
Plantηα1α2
HOB10.869NANA
HOB20.696NANA
CP10.288NA0.288
CP20.006NA0.006
CHP10.9410.240.184
CHP20.9410.040.039
CHP30.5260.540.184
CHP40.5260.080.039
α1 = power-to-heat ratio; α2 = power-to-fuel ratio.
Table 3. Emission factors for CO2 (g/kWh fuel).
Plant DesignSpecific CO2 EmissionReference
Incineration
a Heat Only Boiler100See text
b Condense Power100See text
c Combined Heat and Power100See text
Avoided energy generation
A1 Heat Only Boiler, waste100See text
A2 Heat Only Boiler, biomass17[28]
A3 Heat Only Boiler, oil274[27]
B1 Condense Power, coal335[31]
B2 Windpower0-
B3 Condense Power, NGCC203[26]
C1 Combined Heat and Power, waste100See text
C2 Combined Heat and Power, biomass17[28]
C3 Combined Heat and Power, natural gas 212[26]
Table 4. Emission factors for CO2 (g/kWh waste).
Electricity670 g CO2/kWh el160 g CO2/kWh el
Recycling−185−134
Landfill520582
Table 5. Change in CO2 emissions (g/kWh) compared to baseline scenario, waste incineration replaced by waste incineration, surplus of waste means avoided landfill disposal (−520 g/kWh) (NA = Not Applicable).
Plantηα1α2HOB1HOB2CHP1CHP2CHP3CHP4
HOB10.869NANA--+77−19+801+408
HOB20.696NANA--−42−119+538+223
CHP10.9410.240.184−67+46-−84+631+288
CHP20.9410.040.039+20+154+100-+851+443
CHP30.5260.540.184−315−264−285−323-−155
CHP40.5260.080.039−229−156−185−239+220-
α1 = power-to-heat ratio; α2 = power-to-fuel ratio.
Table 6. Change in CO2 emissions (g/kWh) compared to baseline scenario, waste incineration replaced by waste incineration, surplus of waste means avoided recycling (+185 g/kWh) (NA = Not Applicable).
Plantηα1α2HOB1HOB2CHP1CHP2CHP3CHP4
HOB10.869NANA--−27+7−285−145
HOB20.696NANA--+15+42−191−79
CHP10.9410.240.184+24−16-+30−224−103
CHP20.9410.040.039−7−55−35-−303−158
CHP30.5260.540.184+112+94+101+115-+55
CHP40.5260.080.039+81+56+66+85−78-
α1 = power-to-heat ratio; α2 = power-to-fuel ratio.

