1. Introduction
The burgeoning world population and the associated energy and water requirements along with the ongoing decrease in natural resources’ availability pose enormous challenges for future generations. Energy is vital for most human processes and for social advancement; it is fundamental to innumerable commercial and productive activities. To sustain our current quality of life and to meet the demands of a more resource-efficient future, innovative solutions are needed to generate sustainable processes and energy conversion technologies. One of the most important aspects of this innovation is the development of energy-efficient processes and conversions. In particular, the increase of the global population and living standards over the last few decades is directly related to higher cooling and heating demand, causing an ever-increasing demand for energy resources, resulting in environmental pollution issues. Renewable energies offer a viable and potent solution to counter the effects of this problem, with impact not only on the energy sector, but also the economy and public interest [
1]. The cooling/heating (CH) systems are usually designed to handle the total maximum expected load, without taking the dynamics of the building’s load into consideration [
2,
3]. This approach frequently results in energy wastage and inefficiencies. Very few design strategies can be adopted in an overcrowded building with no storage system because surplus energy cannot be accumulated. Moreover, a non-storage system has to anticipate the building’s CH load, always working with the same maximum start-up parameters even under part-load conditions. Therefore, an efficient storage system must be applied to increase the total efficiency, improving energy management or to bridge the mismatch between energy production and demand, common in renewable systems [
4,
5]. Several technologies are available depending on the kind of energy that needs to be stored [
6,
7,
8,
9,
10].
Thermal energy storage has developed rapidly in recent years, especially latent heat storage systems [
11,
12,
13,
14], taking advantage of the solid/liquid phase change in order to store large amounts of energy within small volumes of material. Suitable materials for accomplishing this task are phase-change materials (PCM) that can be integrated into short-term thermal energy storage units as part of CH systems. PCM, contained in differently-shaped containers (e.g., spherical capsules), are able to store latent heat and can thus be used to improve energy efficiency in the building sector [
15,
16]. This technology will significantly reduce carbon emissions and produce economic and environmental benefits for local populations in the form of heat management; lowering energy and thus water consumption (needed in all phases of energy production and electricity generation) for CH systems in all types of buildings. A suitable PCM has to be selected for each application. Much effort has gone into developing and testing different PCM storage systems, since quantitative information about heat transfer and phase-change processes in PCM is required. Heat transfer is usually the main limitation in the design process, and moreover, common design methodologies for heat exchangers are not always applicable due to the complex dynamic behavior of PCMs. Consequently, new design methods are necessary. Current state-of-the-art techniques for covering CH demand in the building sector mainly include conventional installations, renewable-based systems with sensible heat storage units or passive strategies. Few reports exist, to our knowledge, regarding hybrid systems that use PCM-based tanks or high thermal mass walls, coupled to building air-conditioning systems [
11,
15,
16]. Thus, in this work, the advantages of encapsulated solid-liquid PCM that can be employed as a high thermal wall or storage will be drawn upon, providing a large heat transfer area while reducing the PCM’s reactivity towards the outside environment, allowing volume control of the storage materials as phase change occurs.
Several works have studied the kinetics of melting or freezing of a single PCM-capsule in a thermostated bath, numerically and experimentally. Simulations have typically used the finite volume method or finite difference approximation, including both conduction and convection [
17,
18,
19,
20,
21], typically with a constant temperature in the external surface of the capsule. The volume change has been typically considered in different forms, e.g., placed in an external reservoir [
19,
22,
23,
24] or in contact with an external opening [
25], and the effect of its initial position has been studied [
26]. In the simulations, the volume of fluid and the enthalpy-porosity methods are used to tackle the phase change and the interface [
27,
28]. The mechanical stress in the capsule provoked by the different density has been also considered, although no volume change is considered in this case [
29,
30]. Experimental studies, on the other hand, have used transparent capsules to monitor the solid fraction of PCM [
19,
25,
31,
32], as well as temperature probes in different positions within the capsule [
18,
33,
34]. The results typically show good agreement between simulations and experiments [
20,
35,
36,
37], albeit in ideal conditions. However, these studies consider a capsule in a thermostated fluid, either at flowing [
22,
26,
34] or (almost) at rest [
18,
19].
In this work, we present a simulation study of the melting of a selected PCM (CaCl2·6H2O) as an example of a methodology to perform the thermo-physical analysis of encapsulated PCM. The interior radius of the capsule is fixed at mm, and the exterior is varied between 9 and 16 mm. This PCM and capsule size are considered, since it is an inexpensive locally-available salt hydrate and because of its possible application into high thermal mass building walls or storage. We focus here on the application of PCM for cooling and thermal protection, where the PCM is used as the heat sink, keeping the temperature of its surroundings as low and constant as possible, with a heat source far from the capsule. This geometry allows us to correlate the temperature in the external surface of the capsule with the melting kinetics of the PCM; This is the major novelty of our analysis, with the explicit consideration of the increase of the volume upon melting.
In the present model, it is assumed that the solid phase is denser than the liquid one, and the difference in density is taken into account by considering a void in the solid dense phase. The simulations are based on the finite difference approximations in two dimensions with a square grid, considering only heat conduction. Convection both in the bath and in the liquid PCM are neglected, but we study its effect by an effective conductivity. Furthermore, all of the materials are assumed to be homogeneous and their physical properties constant. The capsule is circular, representing a section of a 3D cylindrical PCM. The PCM, which is initially frozen, melts, and temperature profile and the fraction and distribution of the (remaining) solid PCM are monitored as a function of time. The effects of using different temperature gradients, capsule thickness and material properties are studied. The results are also compared with solutions of the heat equation for the geometry of the system, in the steady state. The temperatures at the initial and final stages of the PCM melting, as well as the time elapsed, are correctly predicted, with high accuracy when the conditions of the model are fulfilled. In the final section, the effect of natural convection in the bath is included.
The results presented in this study will contribute not only to a better understanding of the phase-change process in the studied PCM and geometry, but will be particularly useful for those wishing to model the performance of thermal storage units or high thermal mass walls applied in building CH systems. Consequently, this research contributes to the state-of-the-art in PCM-based storage systems by developing appropriate methods and tools that feasibly provide thermal storage optimization. The general framework constitutes a set of soft computing approaches that exploit areas of thermal engineering.
2. Simulation Details
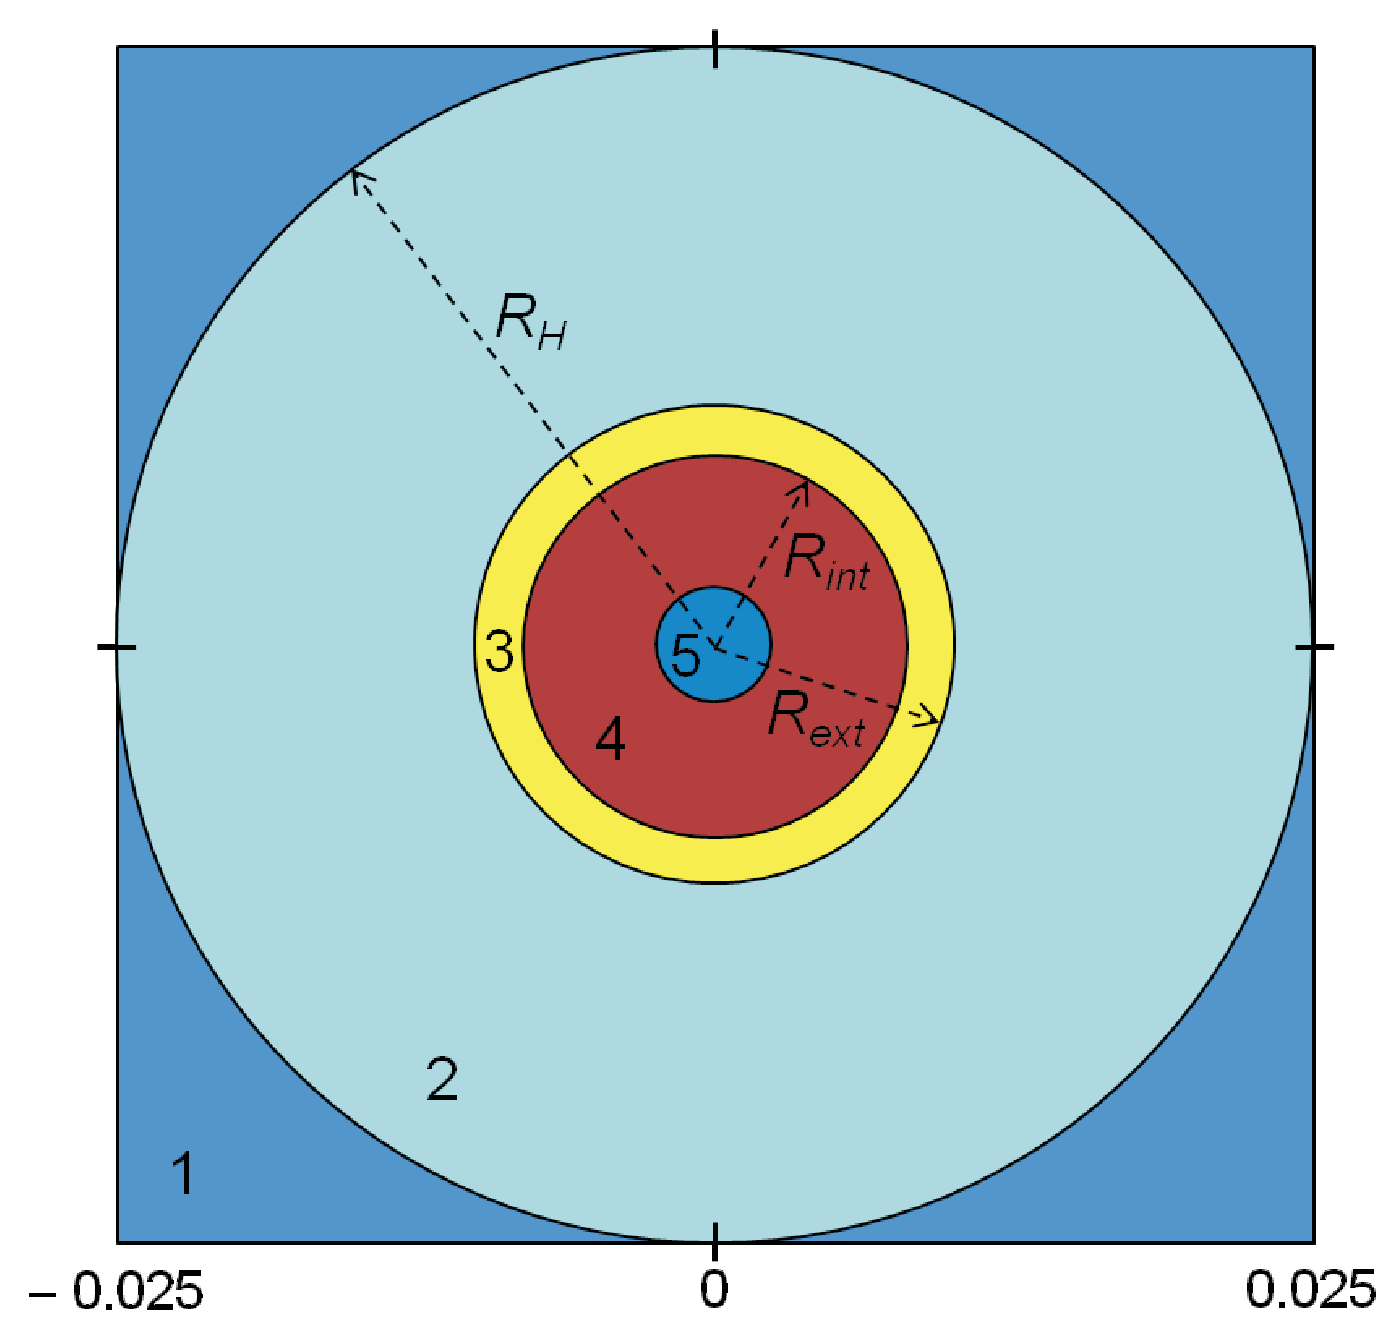
We consider a two-dimensional system, where the simulations are run on a square lattice. The system is sketched in
Figure 1. Five components can be identified:
Thermostat at temperature : It provides the heat for the melting and heating of the PCM.
Bath: It drives the heat from the thermostat to the capsule. For simplicity, we take it as water.
Capsule: This is the container of the PCM.
PCM: We will consider CaCl
2·6H
2O, for which all of the relevant material properties are known [
38].
Void due to the different densities of the solid and liquid phases (only when the PCM is not completely melted).
The physical properties of the materials used in the model are given in
Table 1, complemented by the latent heat of CaCl
2·6H
2O,
J/g, and the melting temperature,
= 30
°C. Note that the density of the solid PCM is larger than for liquid PCM. Because we neglect the deformation of the capsule (the volume is constant), this implies that a void must exist when the PCM is in the solid phase, which we set (at time
) in the center of the capsule; this void is noted by the dark circle in the center of the snapshot of
Figure 1. When the PCM melts completely, the PCM fills the capsule.
The bath, absent in other works, is introduced here to allow monitoring of the evolution of the external surface and correlate it with the kinetics of melting. This is also closer to the operating conditions of real PCM.
In the model, a square homogeneous mesh of size
is used, and only heat conduction from nearest neighbor cells is considered (natural convection, volumetric heat generation and variations of the physical properties of the materials are neglected). The heat flux in cell
,
, is given by the discretization of Fourier’s law in three dimensions, assuming cubic elements of size
, i.e., our system is a slab of thickness
. The heat flux provokes a change in the temperature of cell
according to:
here,
and
are the specific heat and density of the material in the cell, and
is the time step. In the PCM, it must be tested if the cell crosses the melting temperature,
. In this case, the PCM undergoes the liquid-solid phase transition, and the fraction of solid phase,
, changes with time:
Accordingly, the volume of the PCM must change to keep the total mass constant. At every time step, the actual PCM mass (calculated with the volume and density of the liquid and solid phases) is compared with the initial mass. If the difference is larger than the mass corresponding to a single cell (of volume ), a void cell is occupied by PCM, with the same solid fraction as the average of all PCM cells. The void cell is selected randomly, but must be the nearest-neighbor of a cell already filled with PCM. This randomness will result in small heterogeneities in the melting of the PCM, as shown below. One further implication of the difference in density between the liquid and solid phases is that a solid cell is allowed to melt only when it is a neighbor of a void cell or a neighbor of a cell with non-solid PCM (either liquid or liquid-solid mixture). This constraint implies that the melting of the PCM must start in the vicinity of the void, as shown below.
The difference in density between the liquid and solid phases has been considered in previous studies using the enthalpy porosity method, developed by Voller [
27]. A mushy region between the pure liquid and solid phases is introduced, with a so-called liquid fraction between zero and one to model its properties. Our approach forces total mass and cell volume conservation, introduced by allowing the melting of a cell only when it is adjacent to the void or liquid phase. The void is located at the center of the capsule because the freezing (when the void forms) is expected to occur from the internal surface of the capsule to the center. In a real system, it will not be precisely in the center, but shifted upwards; this is expected to have a minor relevance on the results, given the small size of the capsule and void. Solomon et al. [
26] studied the melting of encapsulated PCM with voids distributed in three different positions and found that the void acts as an insulator, which is relevant when it is in contact with the capsule. Thus, we expect only minor effects due to the precise location of the void as far as it is not in contact with the capsule.
In the following, we study the melting of the PCM in different cases. The interior radius of the capsule is fixed at mm; the exterior is varied between 9 and 16 mm; and the radius of the thermostat is mm in all cases, giving capsule thicknesses of 1–8 mm. The simulations are performed with a grid of cells (implying a cell size of mm) and a time step of seconds, unless otherwise stated. The results shown below are independent of these parameters. In every time step, the total flux for every cell is calculated (except for the cells of the thermostat), the new temperatures and solid fractions calculated and the volume correction applied. The temperature in the interior and exterior surfaces of the capsule and the solid fraction and volume of the PCM are monitored as a function of time, in addition to temperature maps and profiles. The physical properties of the nodes are assigned according to their position ( is the distance to the center of the system): , thermostat nodes, bath (water) nodes, capsule (PVC) nodes, PCM (CaCl2) nodes. At , a linear temperature profile with radius is set from the thermostat to the capsule exterior radius, which is below (i.e., the PCM is initially frozen). As mentioned above, the PCM inside the capsule has a circular void at , of radius m, determined by the physical characteristics of the PCM; nodes with represent the void. The total mass of PCM is constant, kg. Our simulation codes are written and run in MATLAB.
3. Theoretical Model
A simple theoretical model is described in this section. The heat equation considering only heat conduction states that: [
39]:
When the PCM is melting, we assume that the system temperature is in the steady state,
, and therefore,
. In cylindrical coordinates, with angular symmetry, this implies:
which yields a linear dependence of
T with the logarithm of the radius,
. This equation is valid in the pure phases (bath, capsule or PCM). In the interfaces, because the system is in the steady state, the flux must be homogeneous:
. From the heat equation, this gives:
where the subindices label the pure phases. On the other hand, the temperature vs. radius must be a continuous function, particularly at the interfaces. Additionally, there are two boundary conditions given by the temperature of the thermostat,
, at
mm and the melting temperature,
, at
. For the latter, there are two possibilities:
, the internal radius of the capsule, corresponding to the start of the melting process or,
, the radius of the void, which corresponds to the final stage of the melting (assuming that the last point to melt is at this border). In the case of
, the PCM is the solid phase, while for
, it is in the liquid one.
Finally, the system of equations to be solved is thus:
where the subindices correspond to the labels shown in
Figure 1. Solving this set of equations for the
A and
B constants allows to calculate the temperature profiles and, particularly, the temperatures in the internal and external walls of the capsule.
Furthermore, using the temperature gradient, the heat flux can be calculated. Assuming that this flux is constant (because the system is in the steady state), the time to melt the PCM can be estimated. The rate at which energy is conducted across the cylindrical surface
S of radius
is (for
),
and the melting time can be calculated as:
, where
is the total mass of PCM.
Note that it is assumed in the model that the system is in the steady state, although this is not the case in the simulations, as shown below, nor in the experimental systems. However, because the melting keeps the temperature almost constant within the capsule, it is a good approximation that allows a simple solution of the model.
4. Results
The model and configurations described above can be used either for heating or cooling the PCM. We focus here on the heating application, for which the PCM is initially set at a temperature below freezing, and the thermostat is at a temperature above melting (
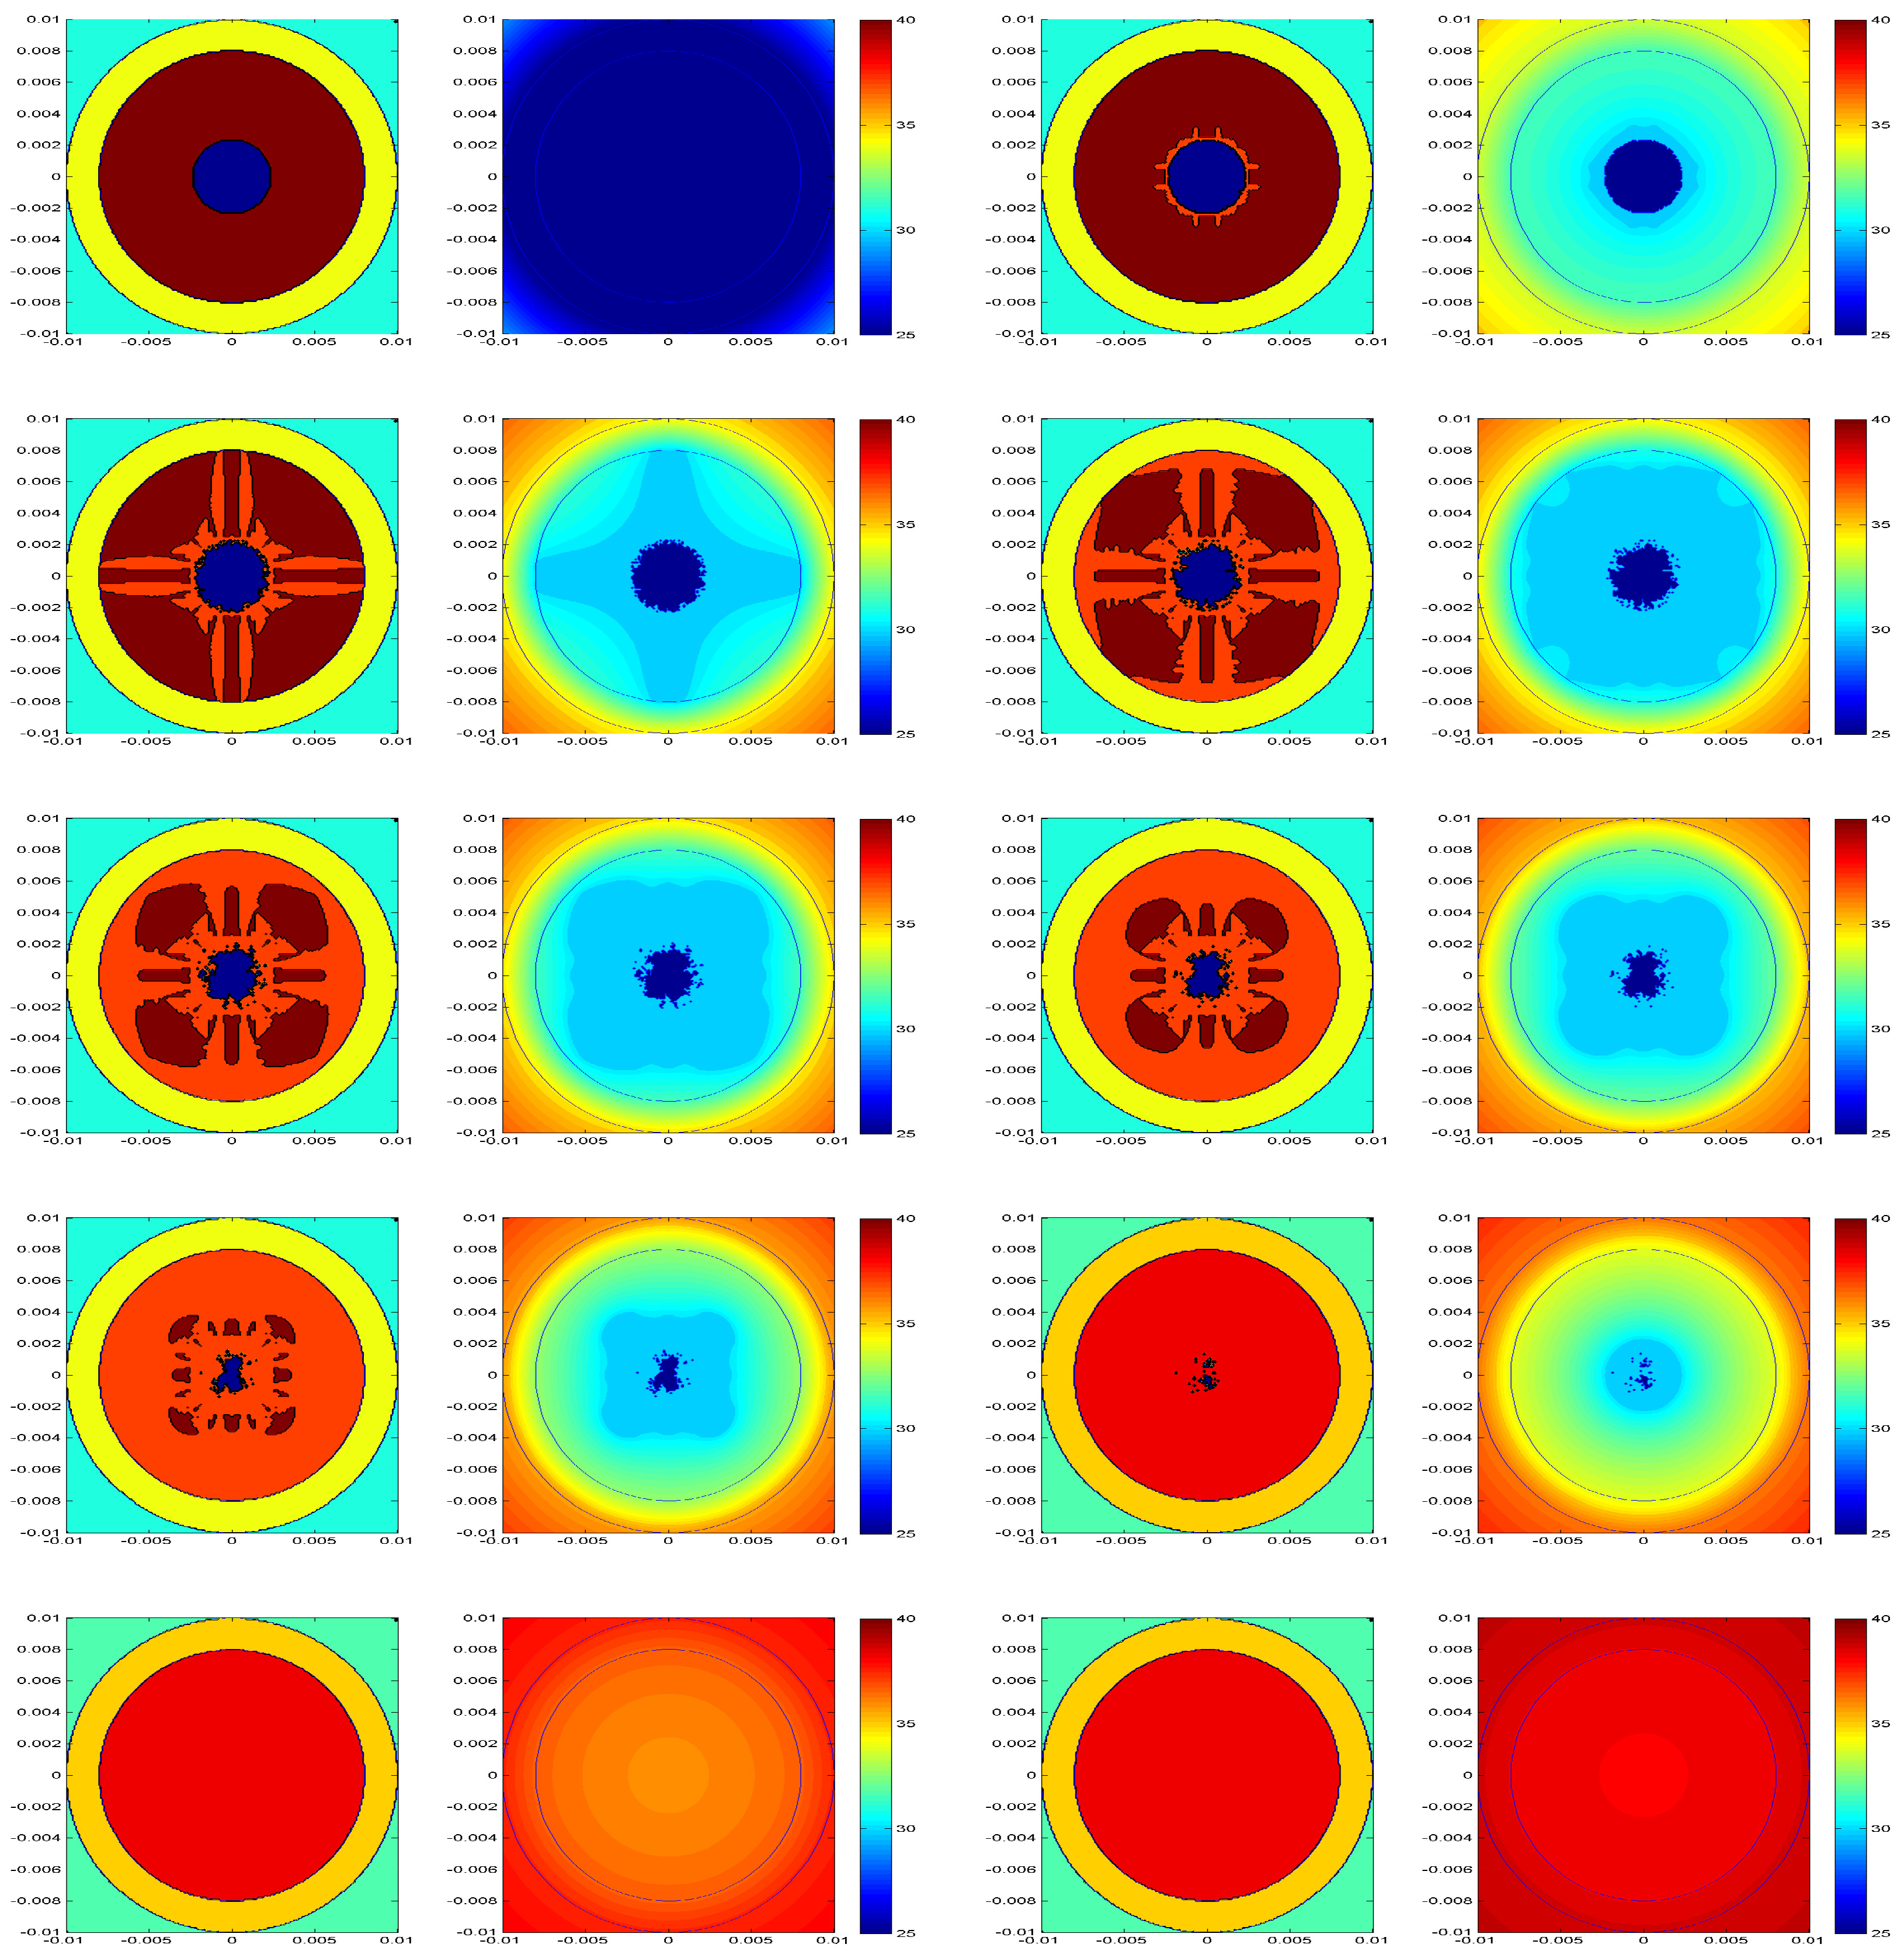
°C). Therefore, we monitor the melting of the PCM. We start presenting the general behavior of the system, as shown by the snapshots of the capsule interior (
Figure 2), for increasing time. In this case, the initial temperature of the PCM is
°C; the thermostat is at
°C; and the capsule external and internal radii are
mm and
mm, respectively.
The snapshots confirm that the melting starts in the interphase with the void, as expected from the restrictions imposed for melting. Melting then progresses to the interphase with the capsule, following straight paths oriented along the mesh lines. The PCM in contact with the capsule melts completely, and only a few solid domains remain, until the entire PCM melts. During this process, the void is filled continuously and randomly, and it completely disappears when the the PCM melts. Although the melting is affected by the underlying mesh and the heterogeneities provoked by the random filling of the void, the agreement with the theoretical model, as shown below, indicates that these effects are not important enough to modify the general results.
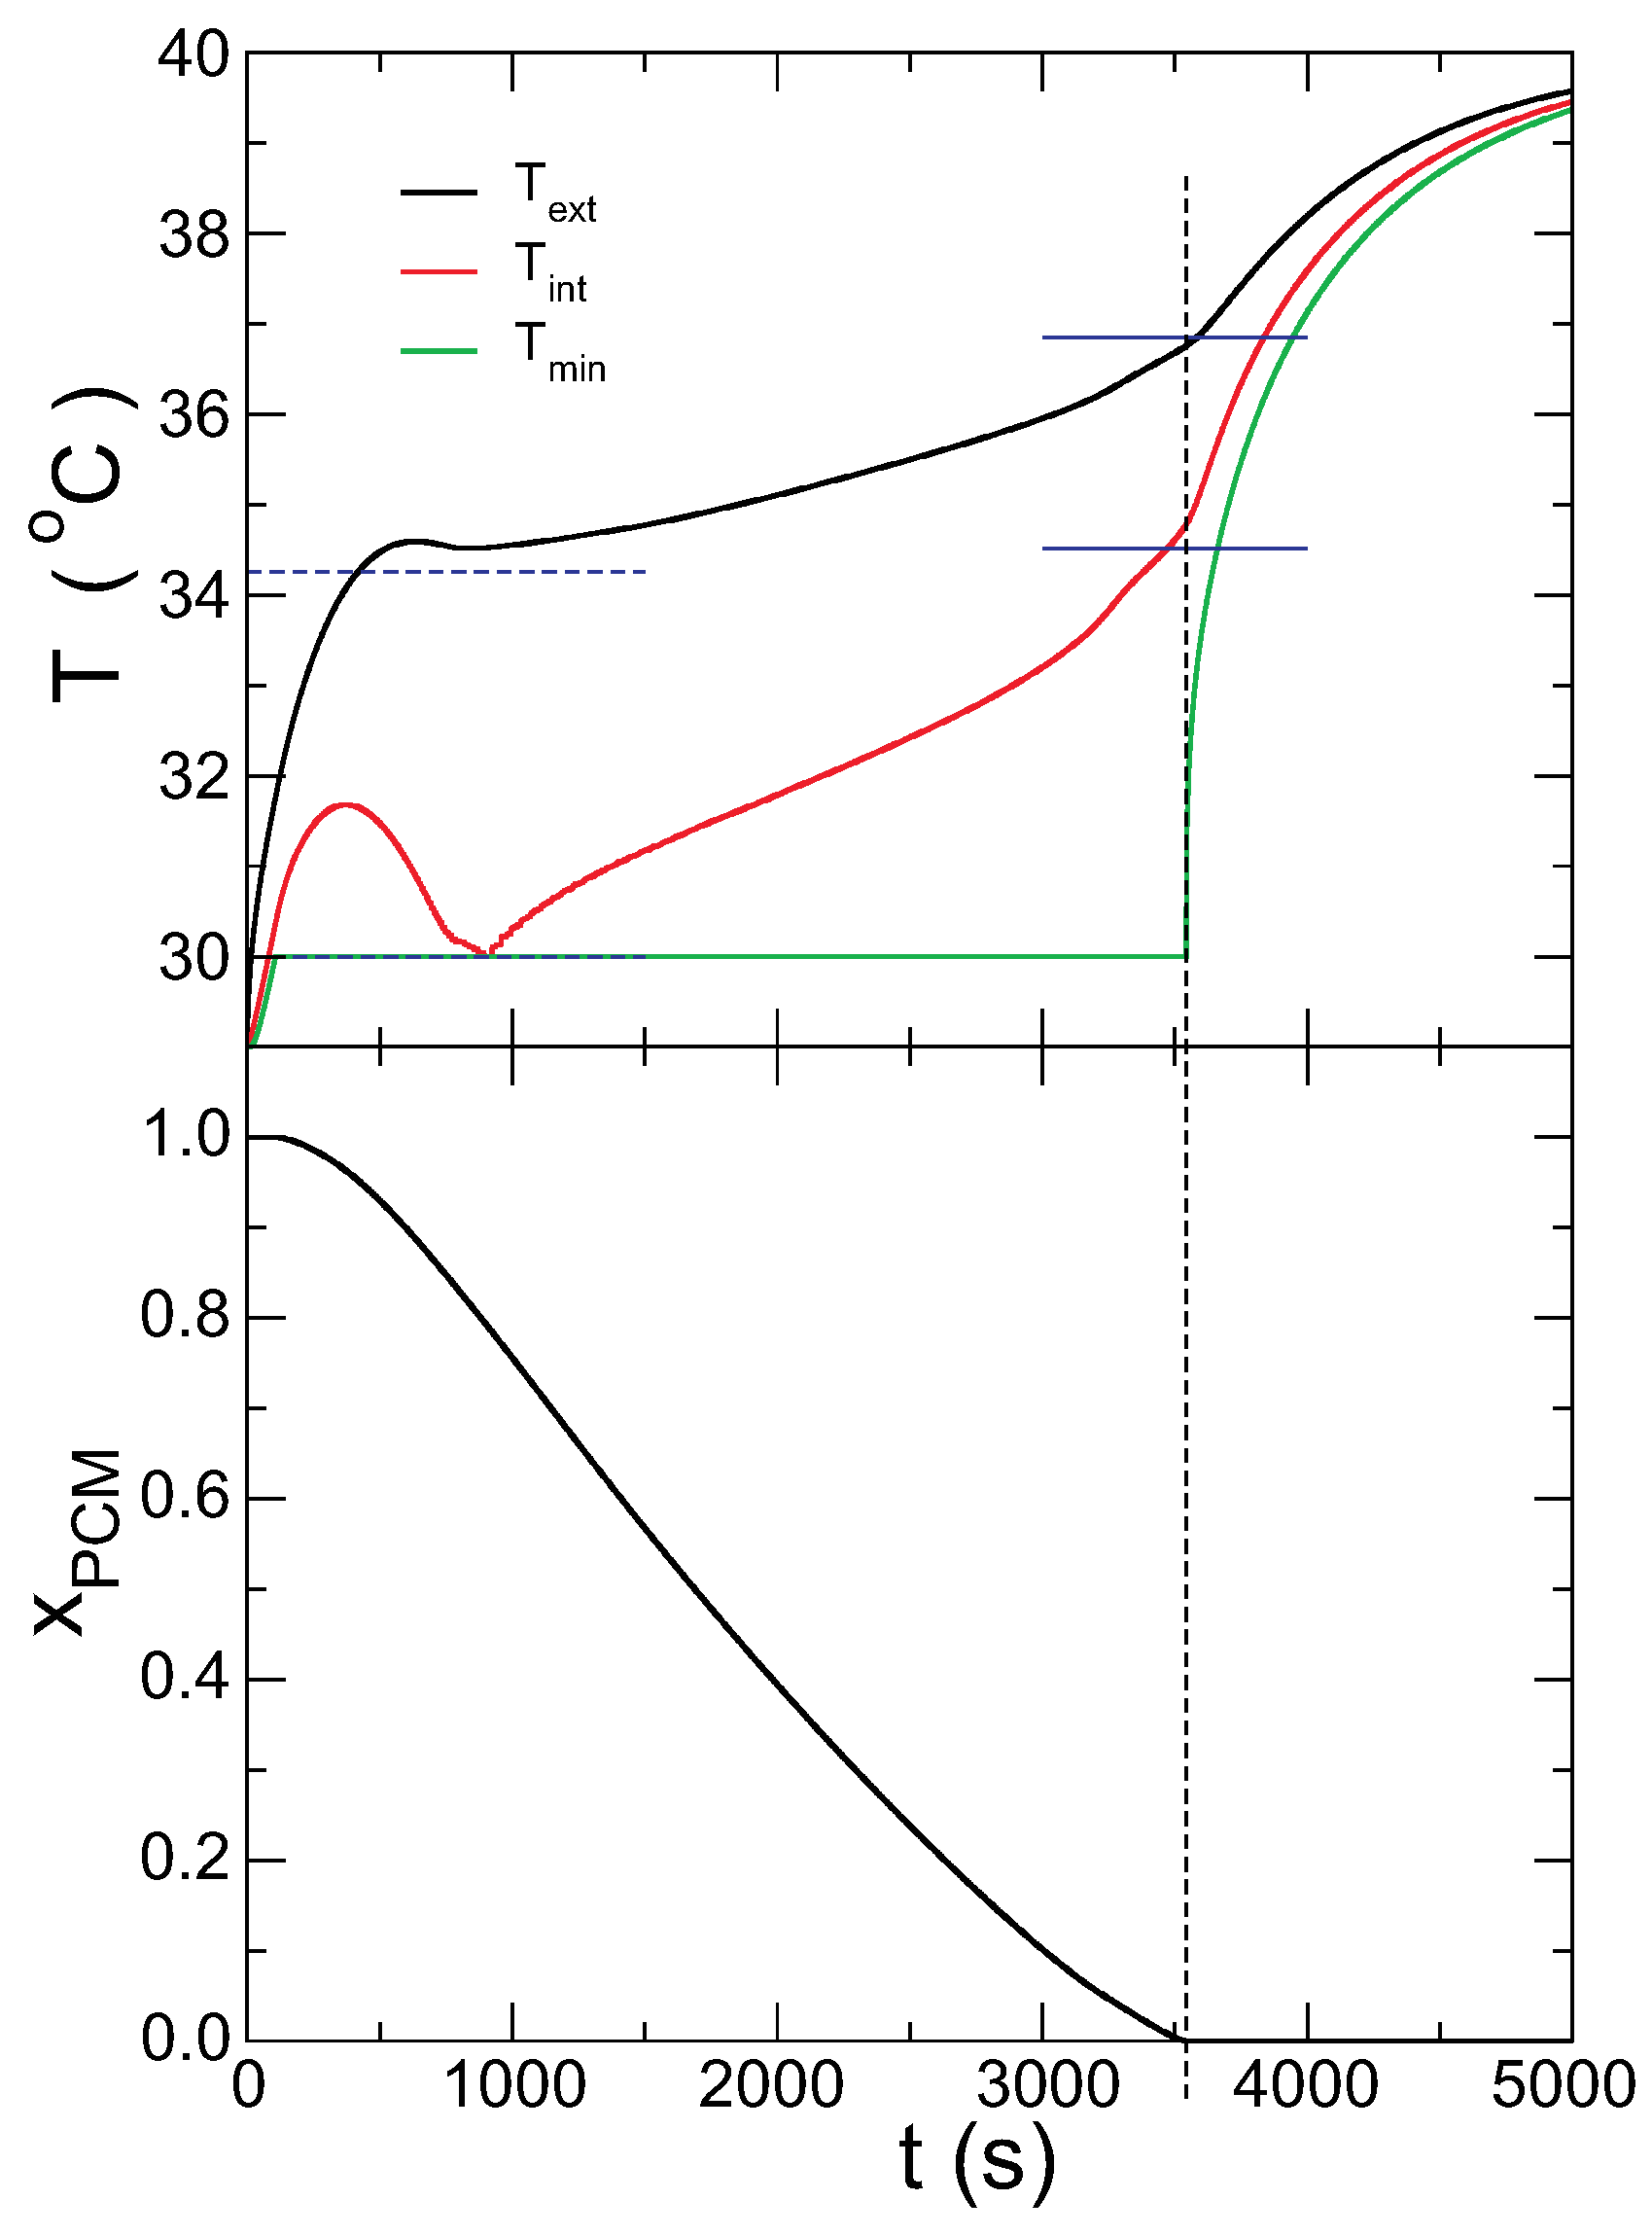
The evolution of the temperature in the inner and outer surfaces of the capsule are presented in correlation with the PCM solid fraction in
Figure 3. The most interesting feature is that the temperature in the outer surface remains almost constant when the PCM is melting, but rises abruptly when it melts completely (marked by the vertical dashed line). Concomitantly, the minimum temperature in the PCM rises drastically when all of the PCM is melted. Another interesting aspect of
Figure 3 is that the temperature in the inner surface grows beyond the melting temperature, but the PCM cannot melt yet in this region. When the melting starts, the temperature goes down to the value of melting and then grows again as the melting of the PCM proceeds. The temperatures from the theoretical model at the inner and outer surfaces of the capsule are compared with the time evolution (blue horizontal lines). The case
in fact gives the temperatures when the melting starts, and
predicts the temperatures when the melting finishes, with good accuracy. Note that there are no fitting parameters in the model; all parameters are given by the boundary conditions.
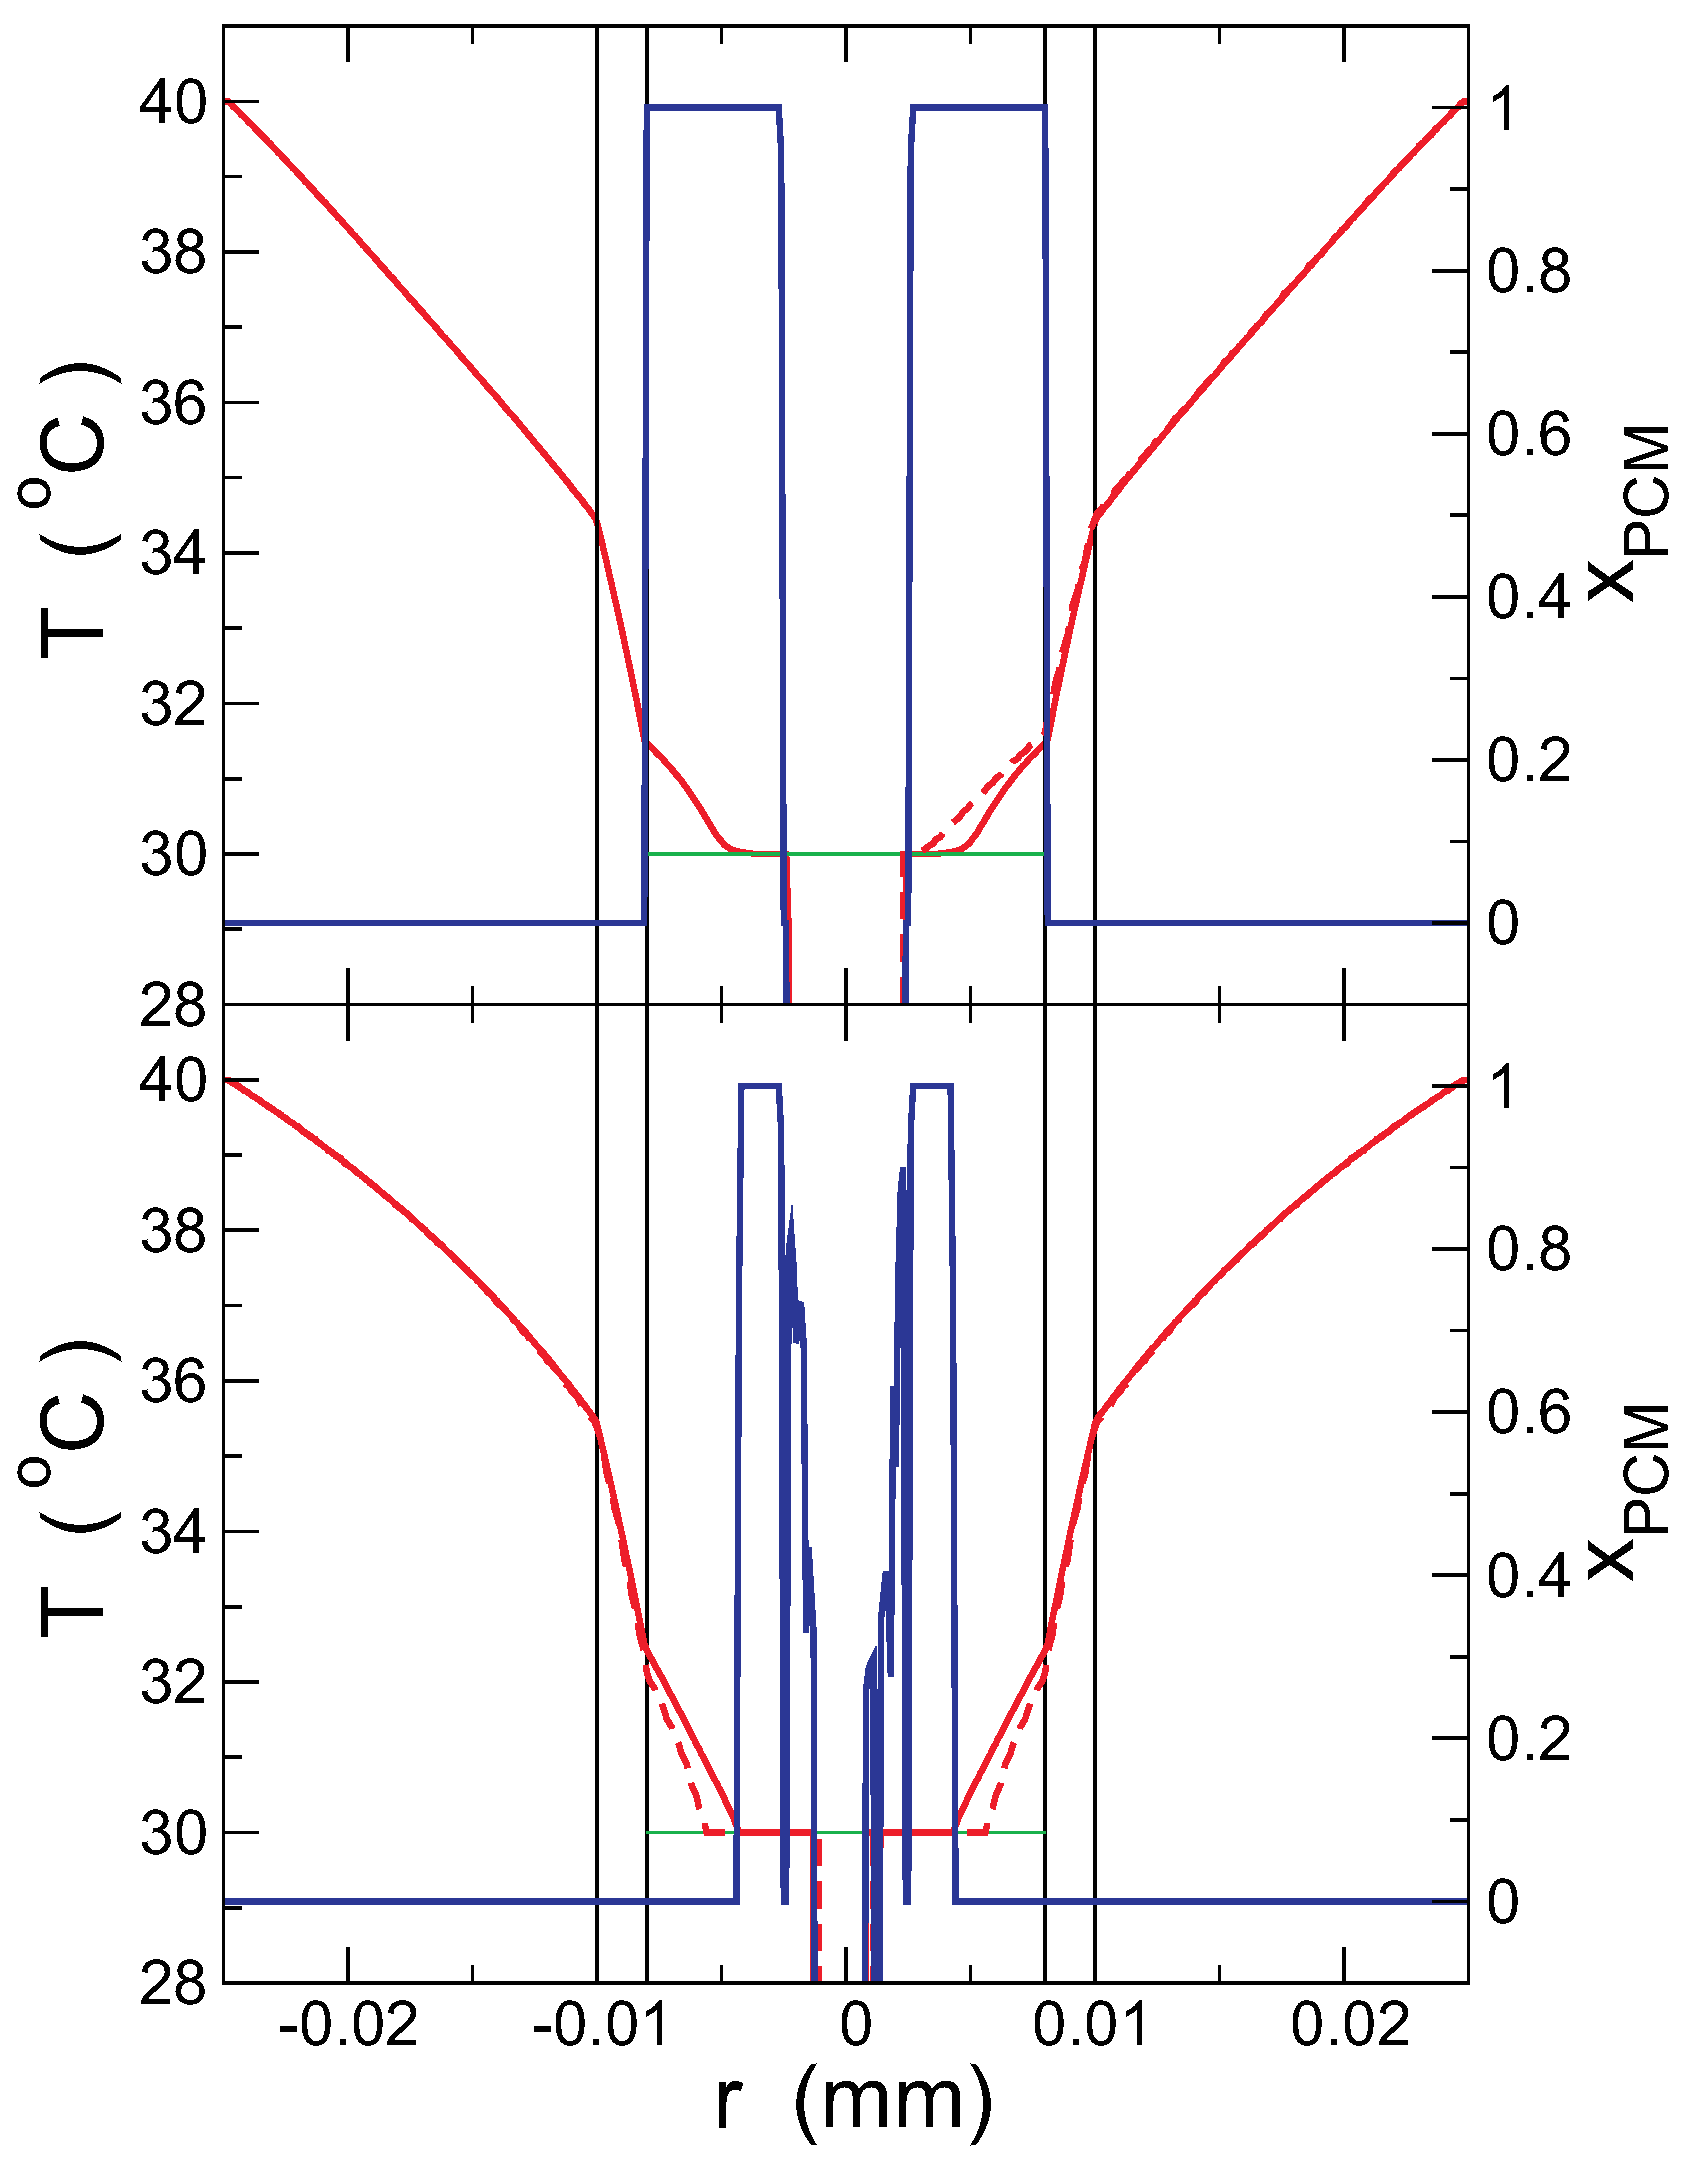
Figure 4 shows the temperature (red line) and PCM solid fraction (blue line) profile for a short time (
s), when the inner surface of the capsule is above the melting temperature, but the PCM is solid (upper panel), and for a long time (
s), when the PCM beside the capsule is already melted (lower panel). The initial void in the PCM is also observed in the figure, with
mm. To make clear the heterogeneity inside the capsule, the temperature profile along two lines is presented: the (horizontal)
x-axis (continuous red line in the figure) and an axis forming
with the
x-axis (dashed line). Interestingly, for short times, the temperature is higher in the slanted axis (the PCM is mostly in the solid phase), but for longer times, the temperature is higher in the horizontal axis. In the outer surface of the capsule, however, both axes give very similar results, indicating that the heterogeneities are hardly observable from the outside. These observations are compatible with the snapshots of
Figure 2, where the last portions of solid PCM are monitored in the slanted axis.
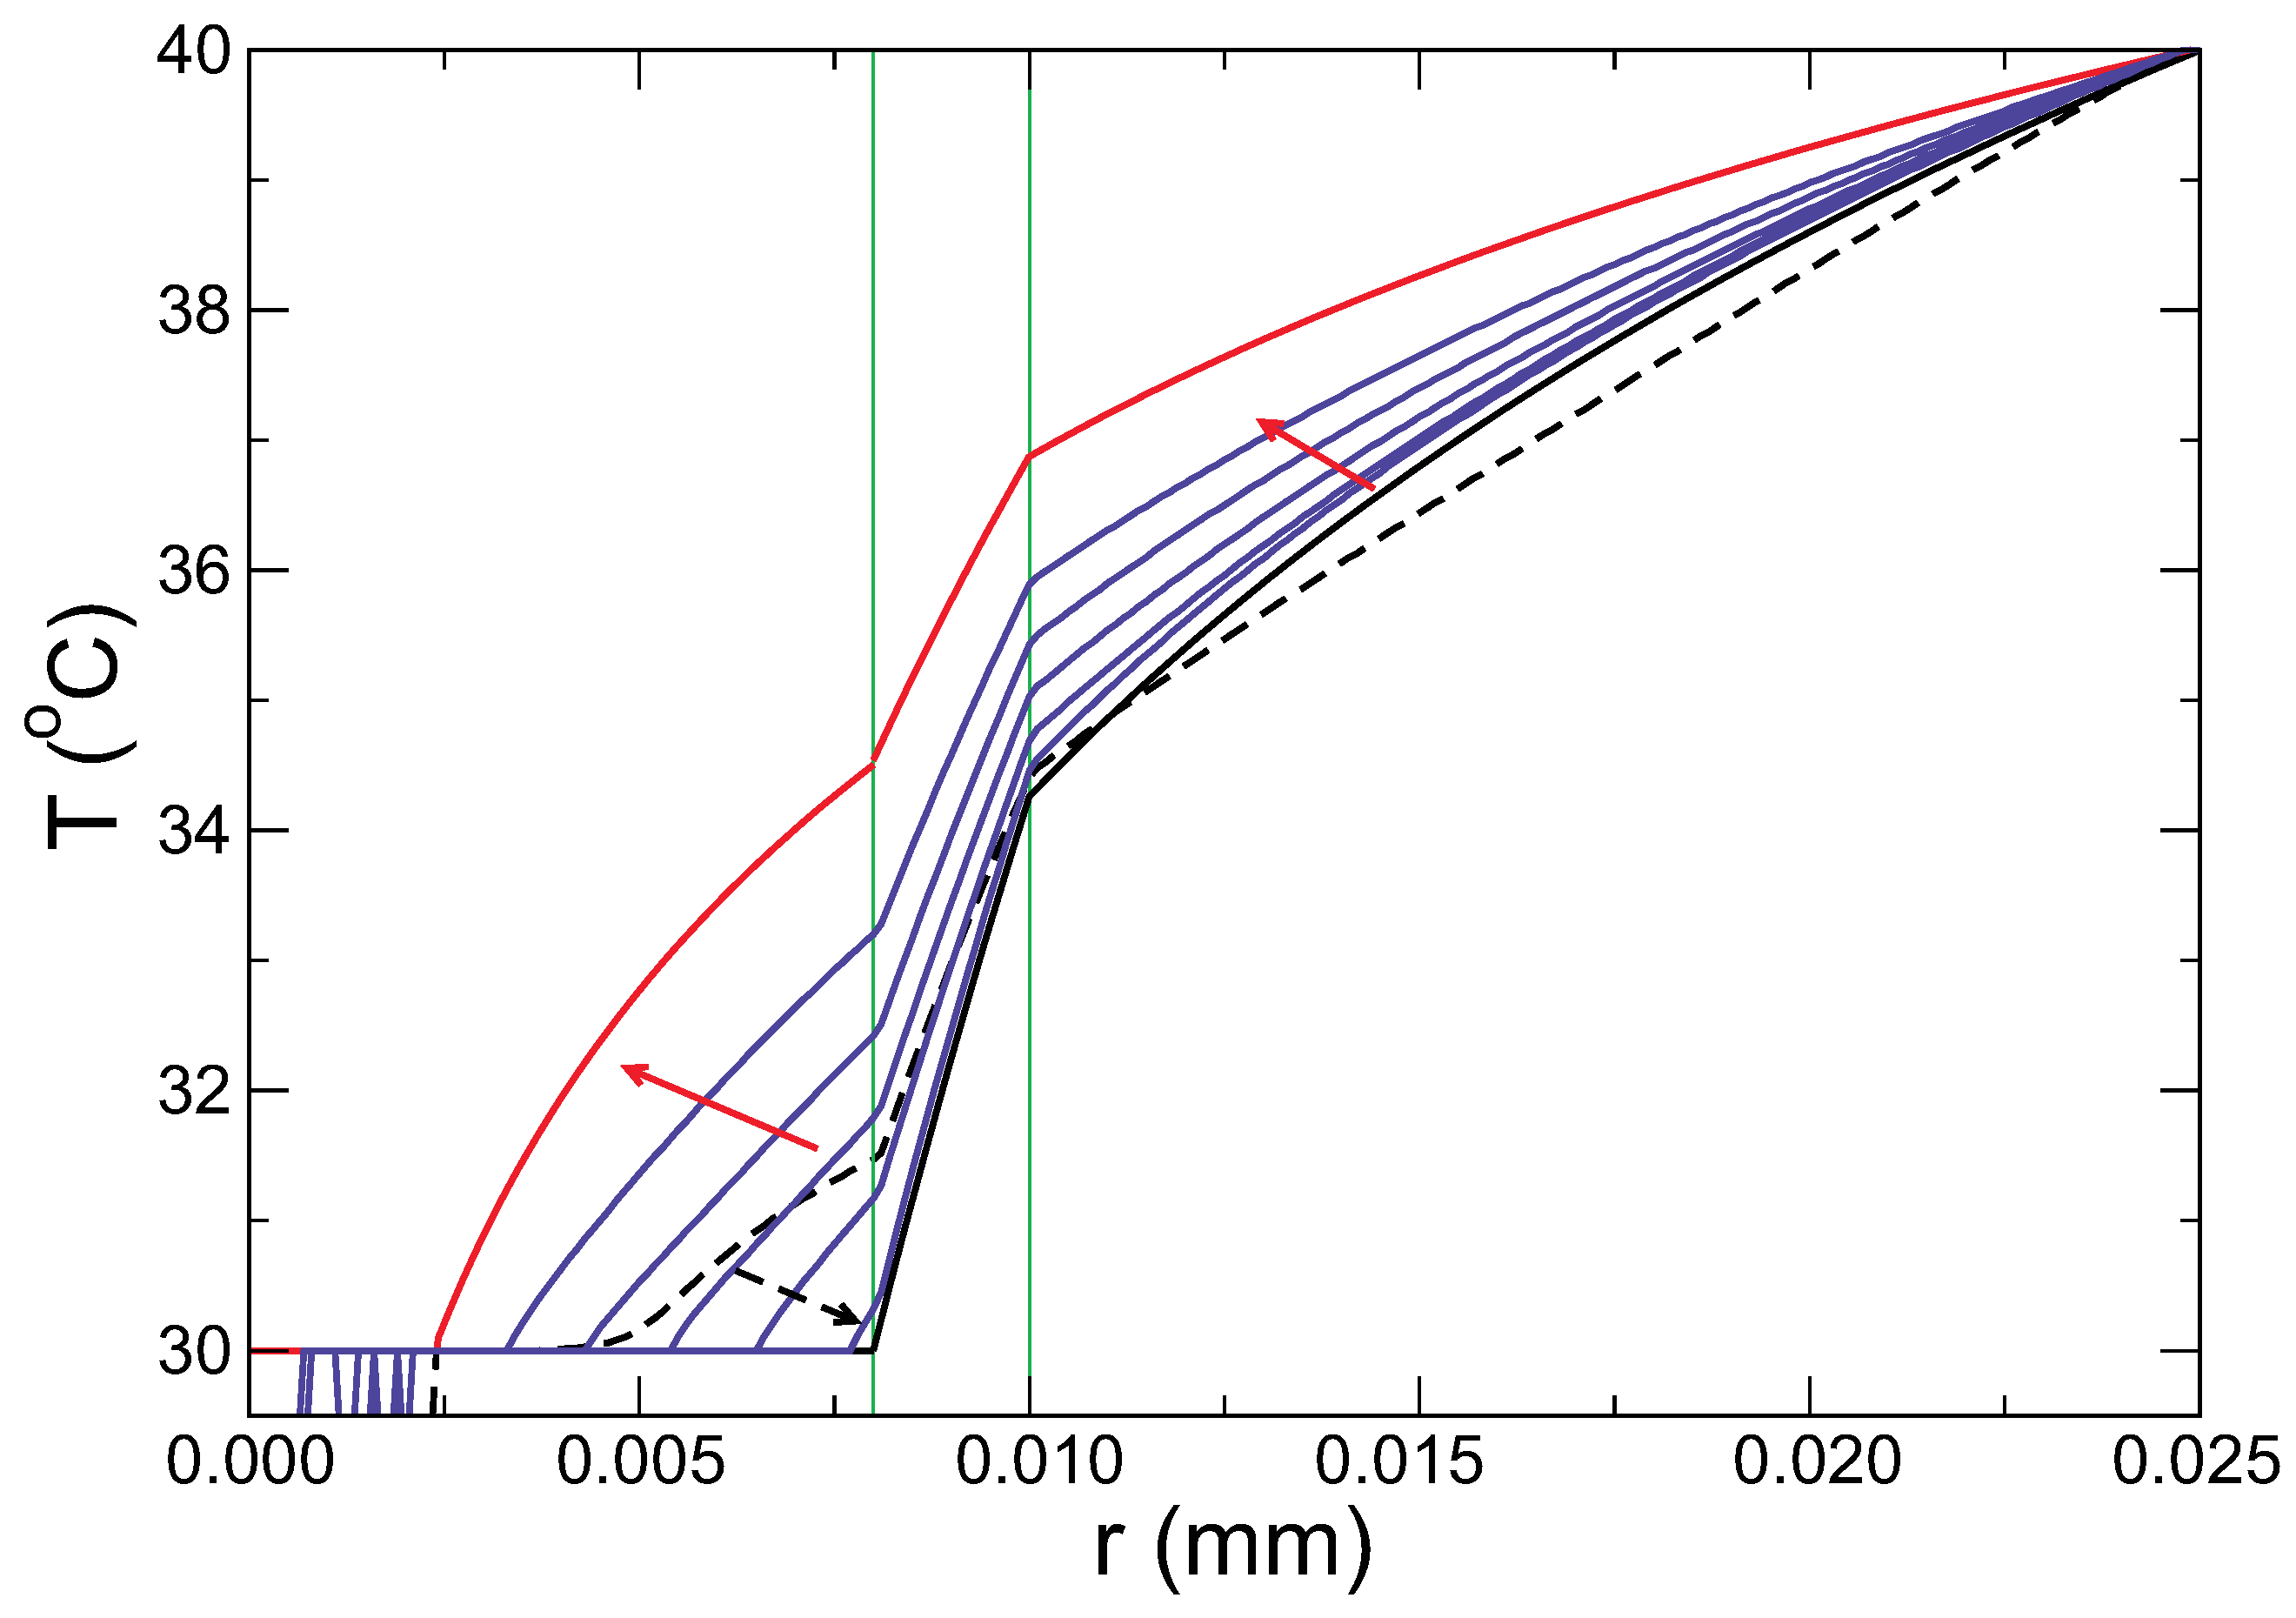
The temperature profiles calculated from the model are compared with the results from the simulations in
Figure 5. While the simulation data (violet lines) evolve from the profile calculated for the initial state (black line) to the final one (red line), the profile at short times, broken black line, clearly deviates from these. This time corresponds to the stage where the PCM is solid, but its temperature is above
. This regime is out of our model and cannot be accounted for. From the comparison, the profiles calculated in the theory for the start and the end of the melting of the PCM agree with the simulations in these limits, validating the model in this respect.
The melting time, calculated for the model with
and
, is given in
Table 2, together with the time obtained from the simulations. The times estimated from the fluxes with
and
are quite different but bracket the value calculated from the simulations. As a first approximation, the mean flux can be taken to calculate the time to melt the PCM completely. This estimation agrees quite well with the simulations and is therefore used below for the comparison with the simulation results for other conditions.
In the following, the effects of different parameters on the kinetics of melting, particularly the melting time, are studied. The temperature of the thermostat, thickness of the capsule and conductivity of the capsule are varied, while the material properties of the PCM and bath are not changed. The results from the simulations are compared with theoretical model. In the final section, natural convection in the bath is included.
4.1. Effect of the Thermostat Temperature
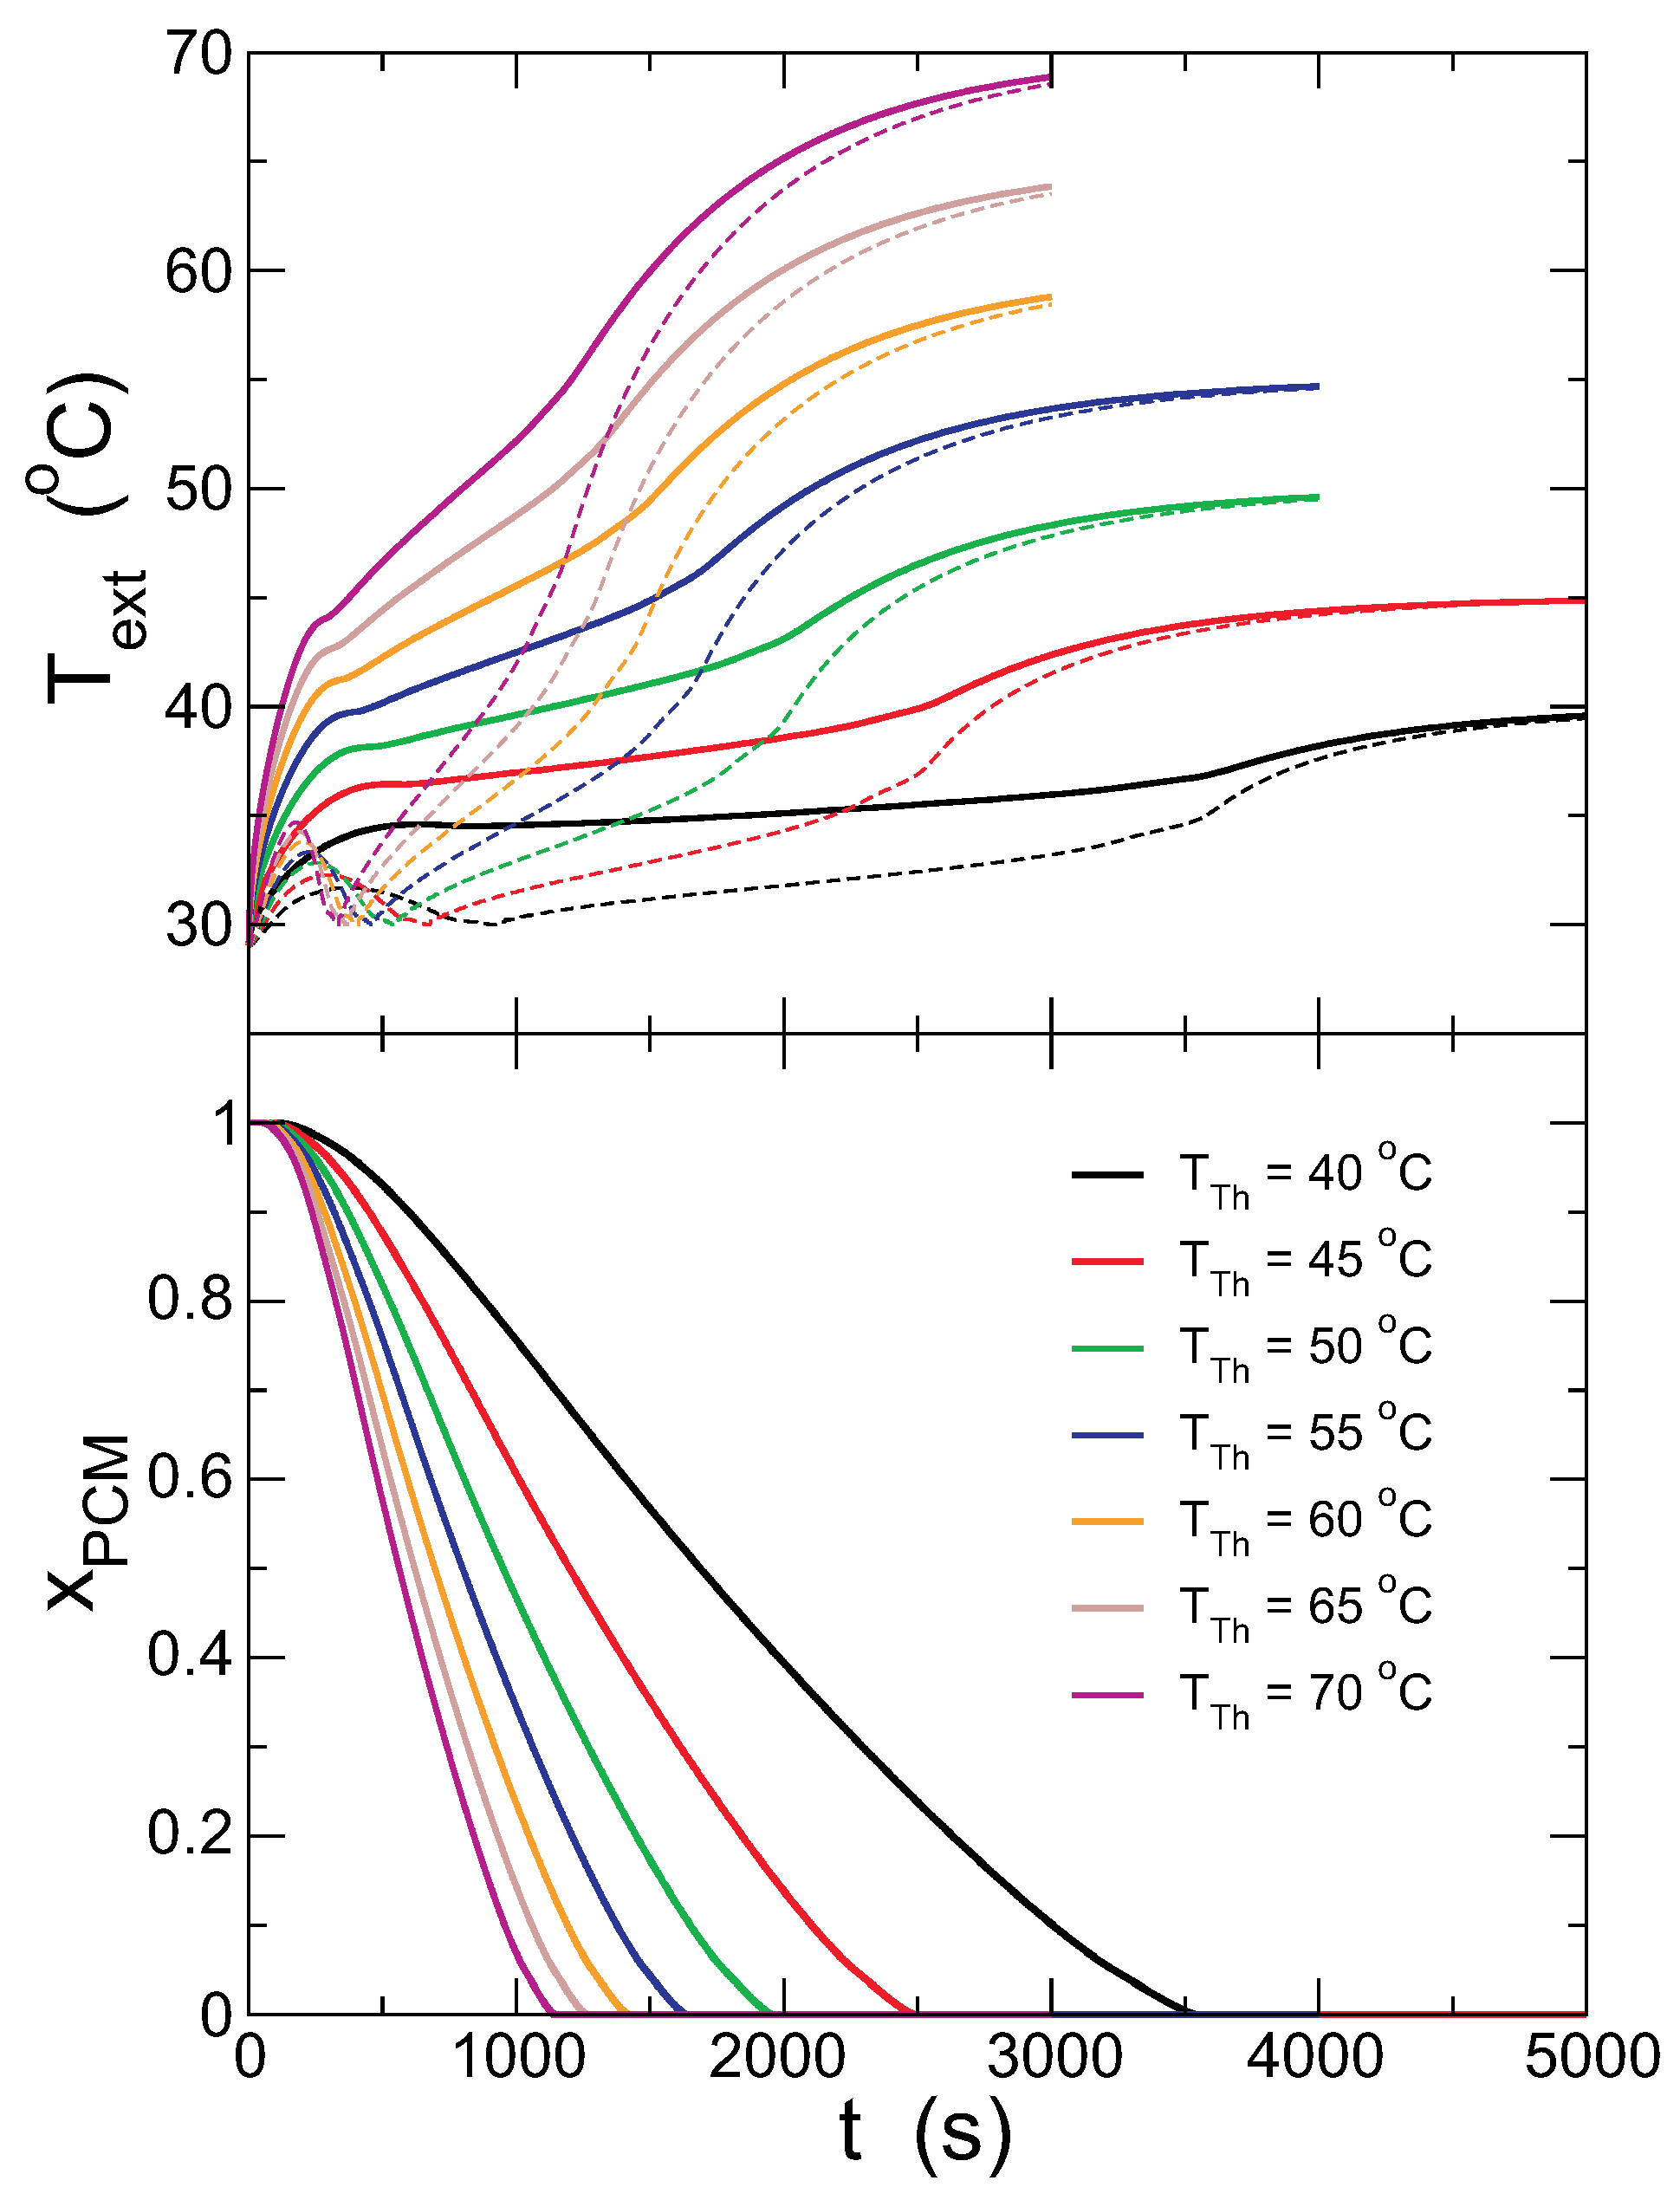
Figure 6 presents the evolution of the temperatures in the outer and inner surfaces of the capsule and the fraction of the solid PCM for different thermostat temperatures,
. Overall, the PCM melts in a shorter time for increasing
, and
is larger. It is also interesting that the change of
during the melting of the PCM is also larger for larger
. The temperature in the internal surface shows the maximum at short times in all cases, indicating that the PCM temperature rises beyond
, with the PCM in the solid phase.
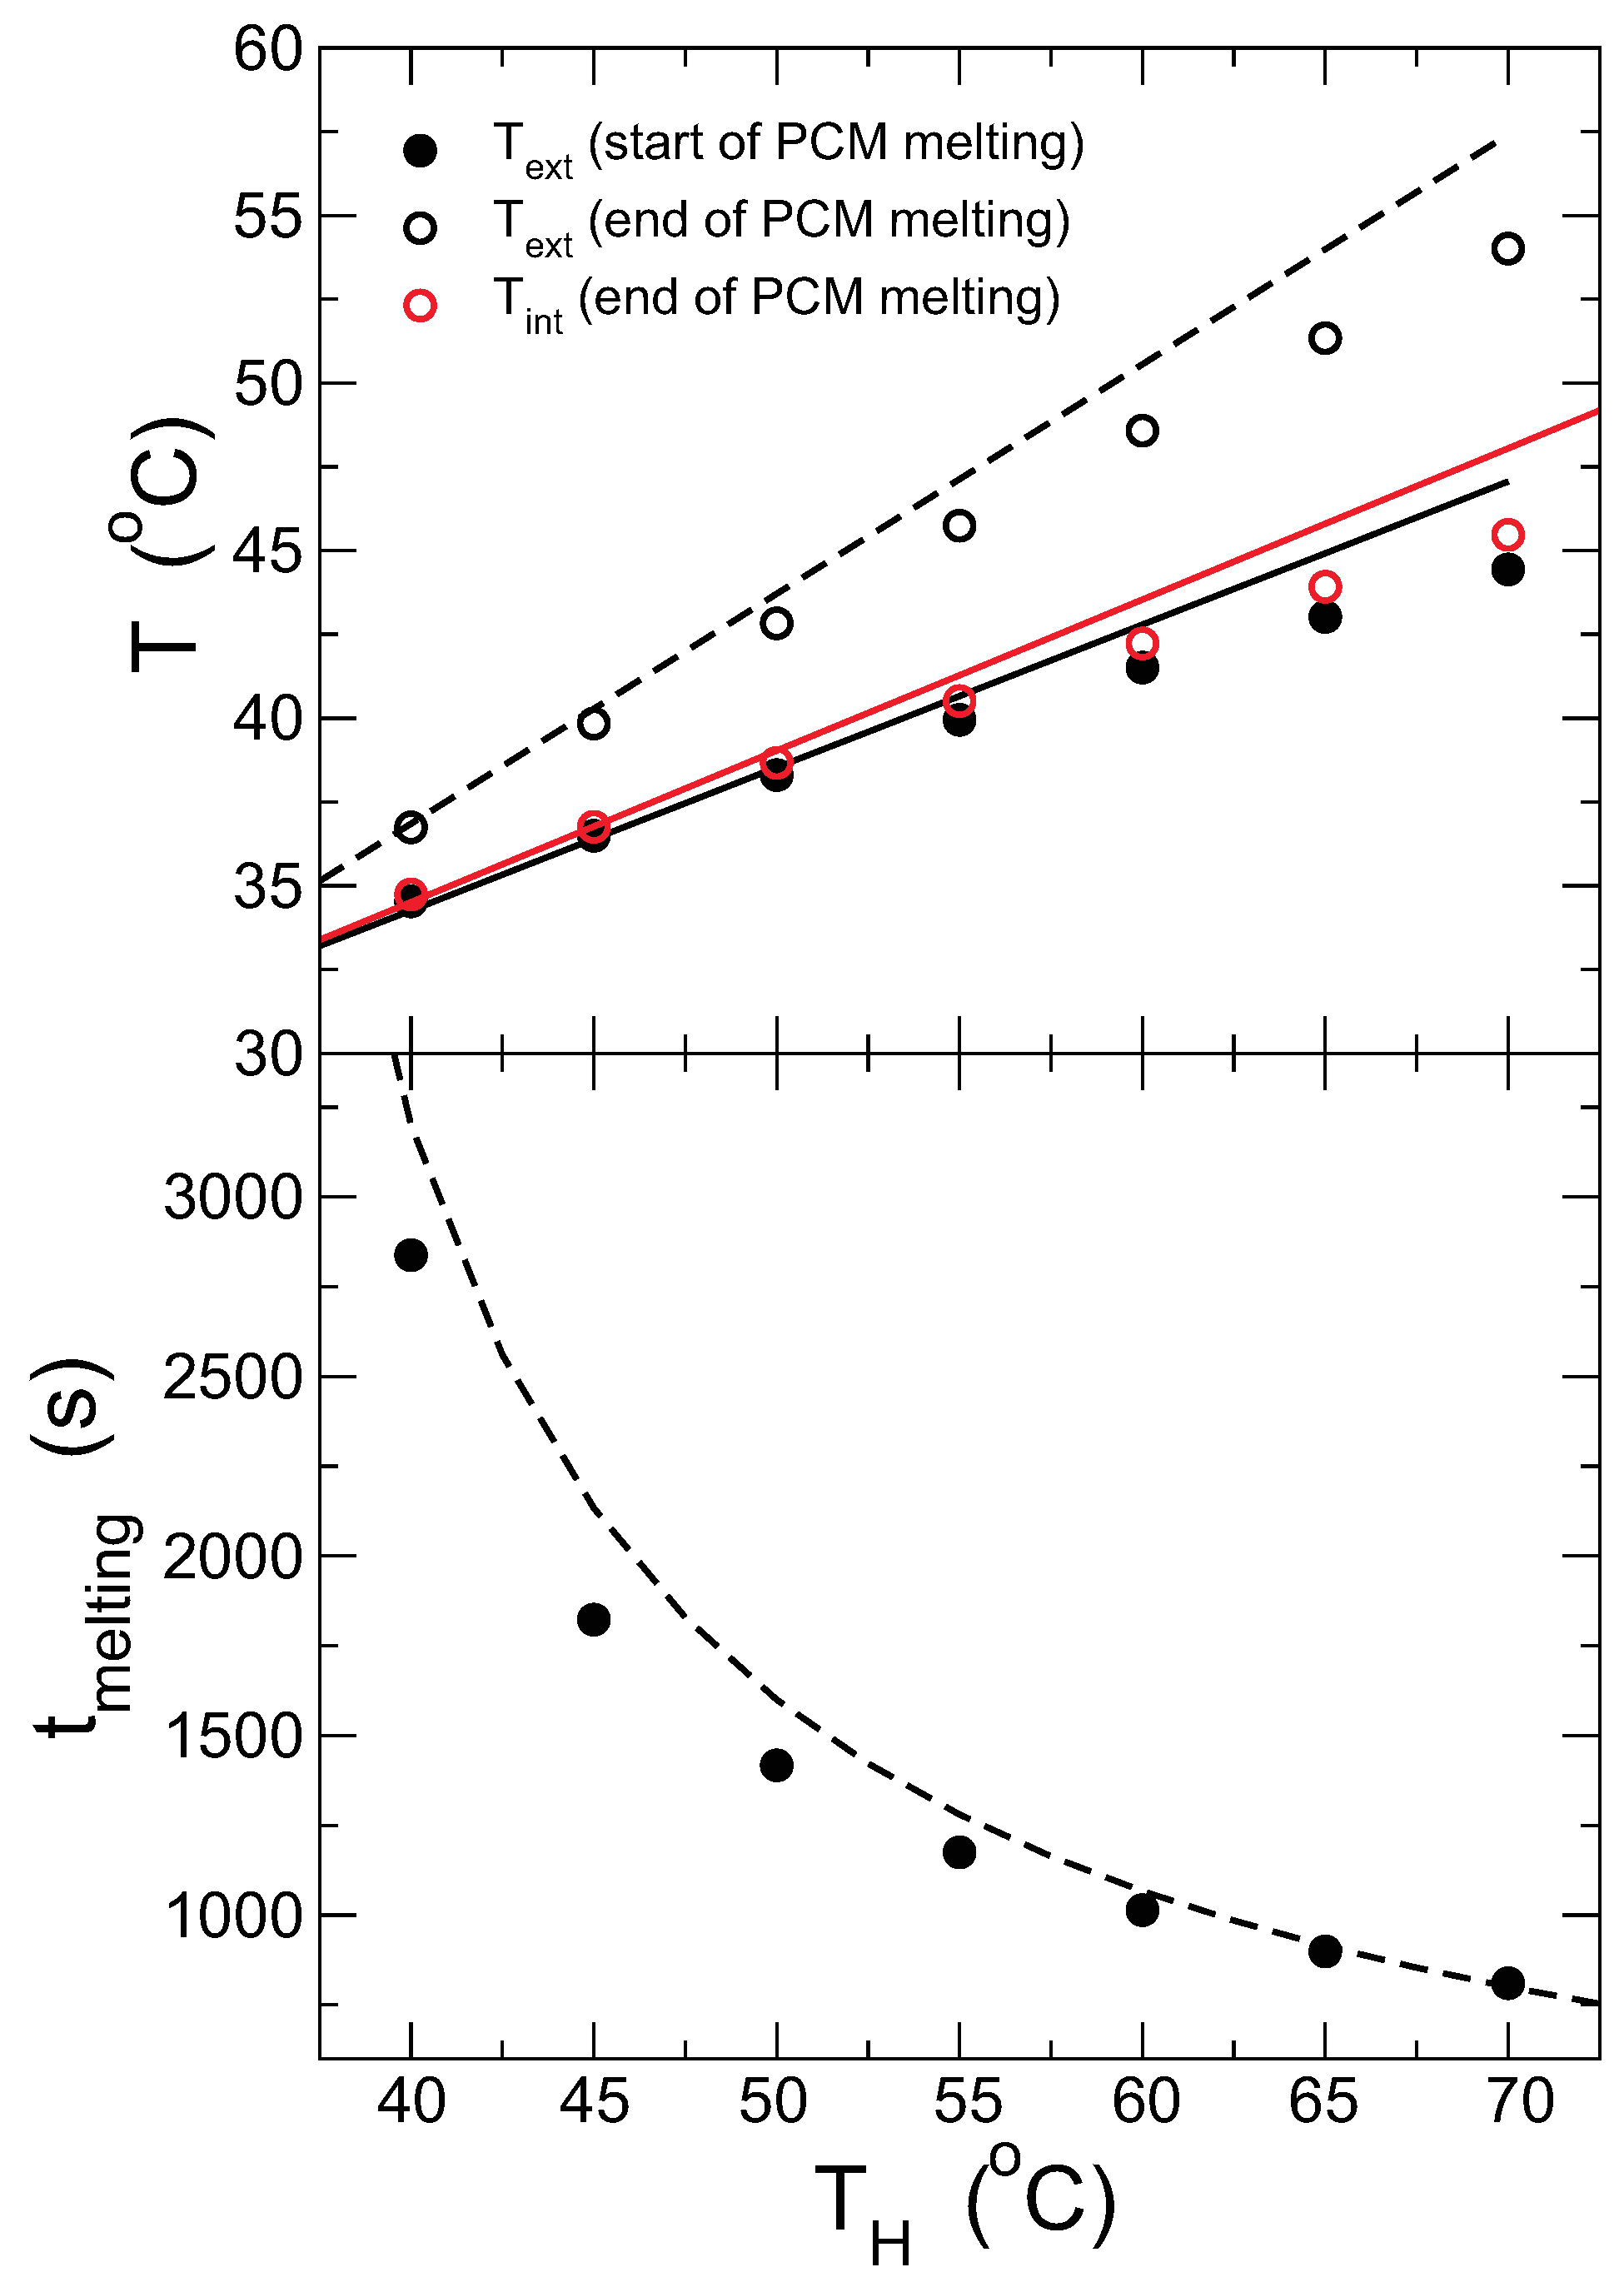
The results concerning the melting time, and temperatures at the start and end, are quantified and compared with the theoretical model in
Figure 7. The temperature in the outer surface of the capsule at the start of the melting is measured when the internal surface is at the freezing temperature, which coincides approximately with the plateau (or inflexion point) of
(see
Figure 6); the internal temperature is equal to
in all cases and, thus, not presented. Accordingly, the melting time is calculated considering that the melting starts at this stage. This presents the advantage that the temperature and melting time can be determined experimentally following a similar protocol. Additionally, the conditions are closer to the assumptions of the model, improving the quality of the comparison. The lines in the figures are the predictions from the model for all quantities, which agree quite well with the results from the simulations, although deviations are observed at high temperatures. This is expected as the model assumes that the system is in the steady state, which is less correct the higher the temperature gradient.
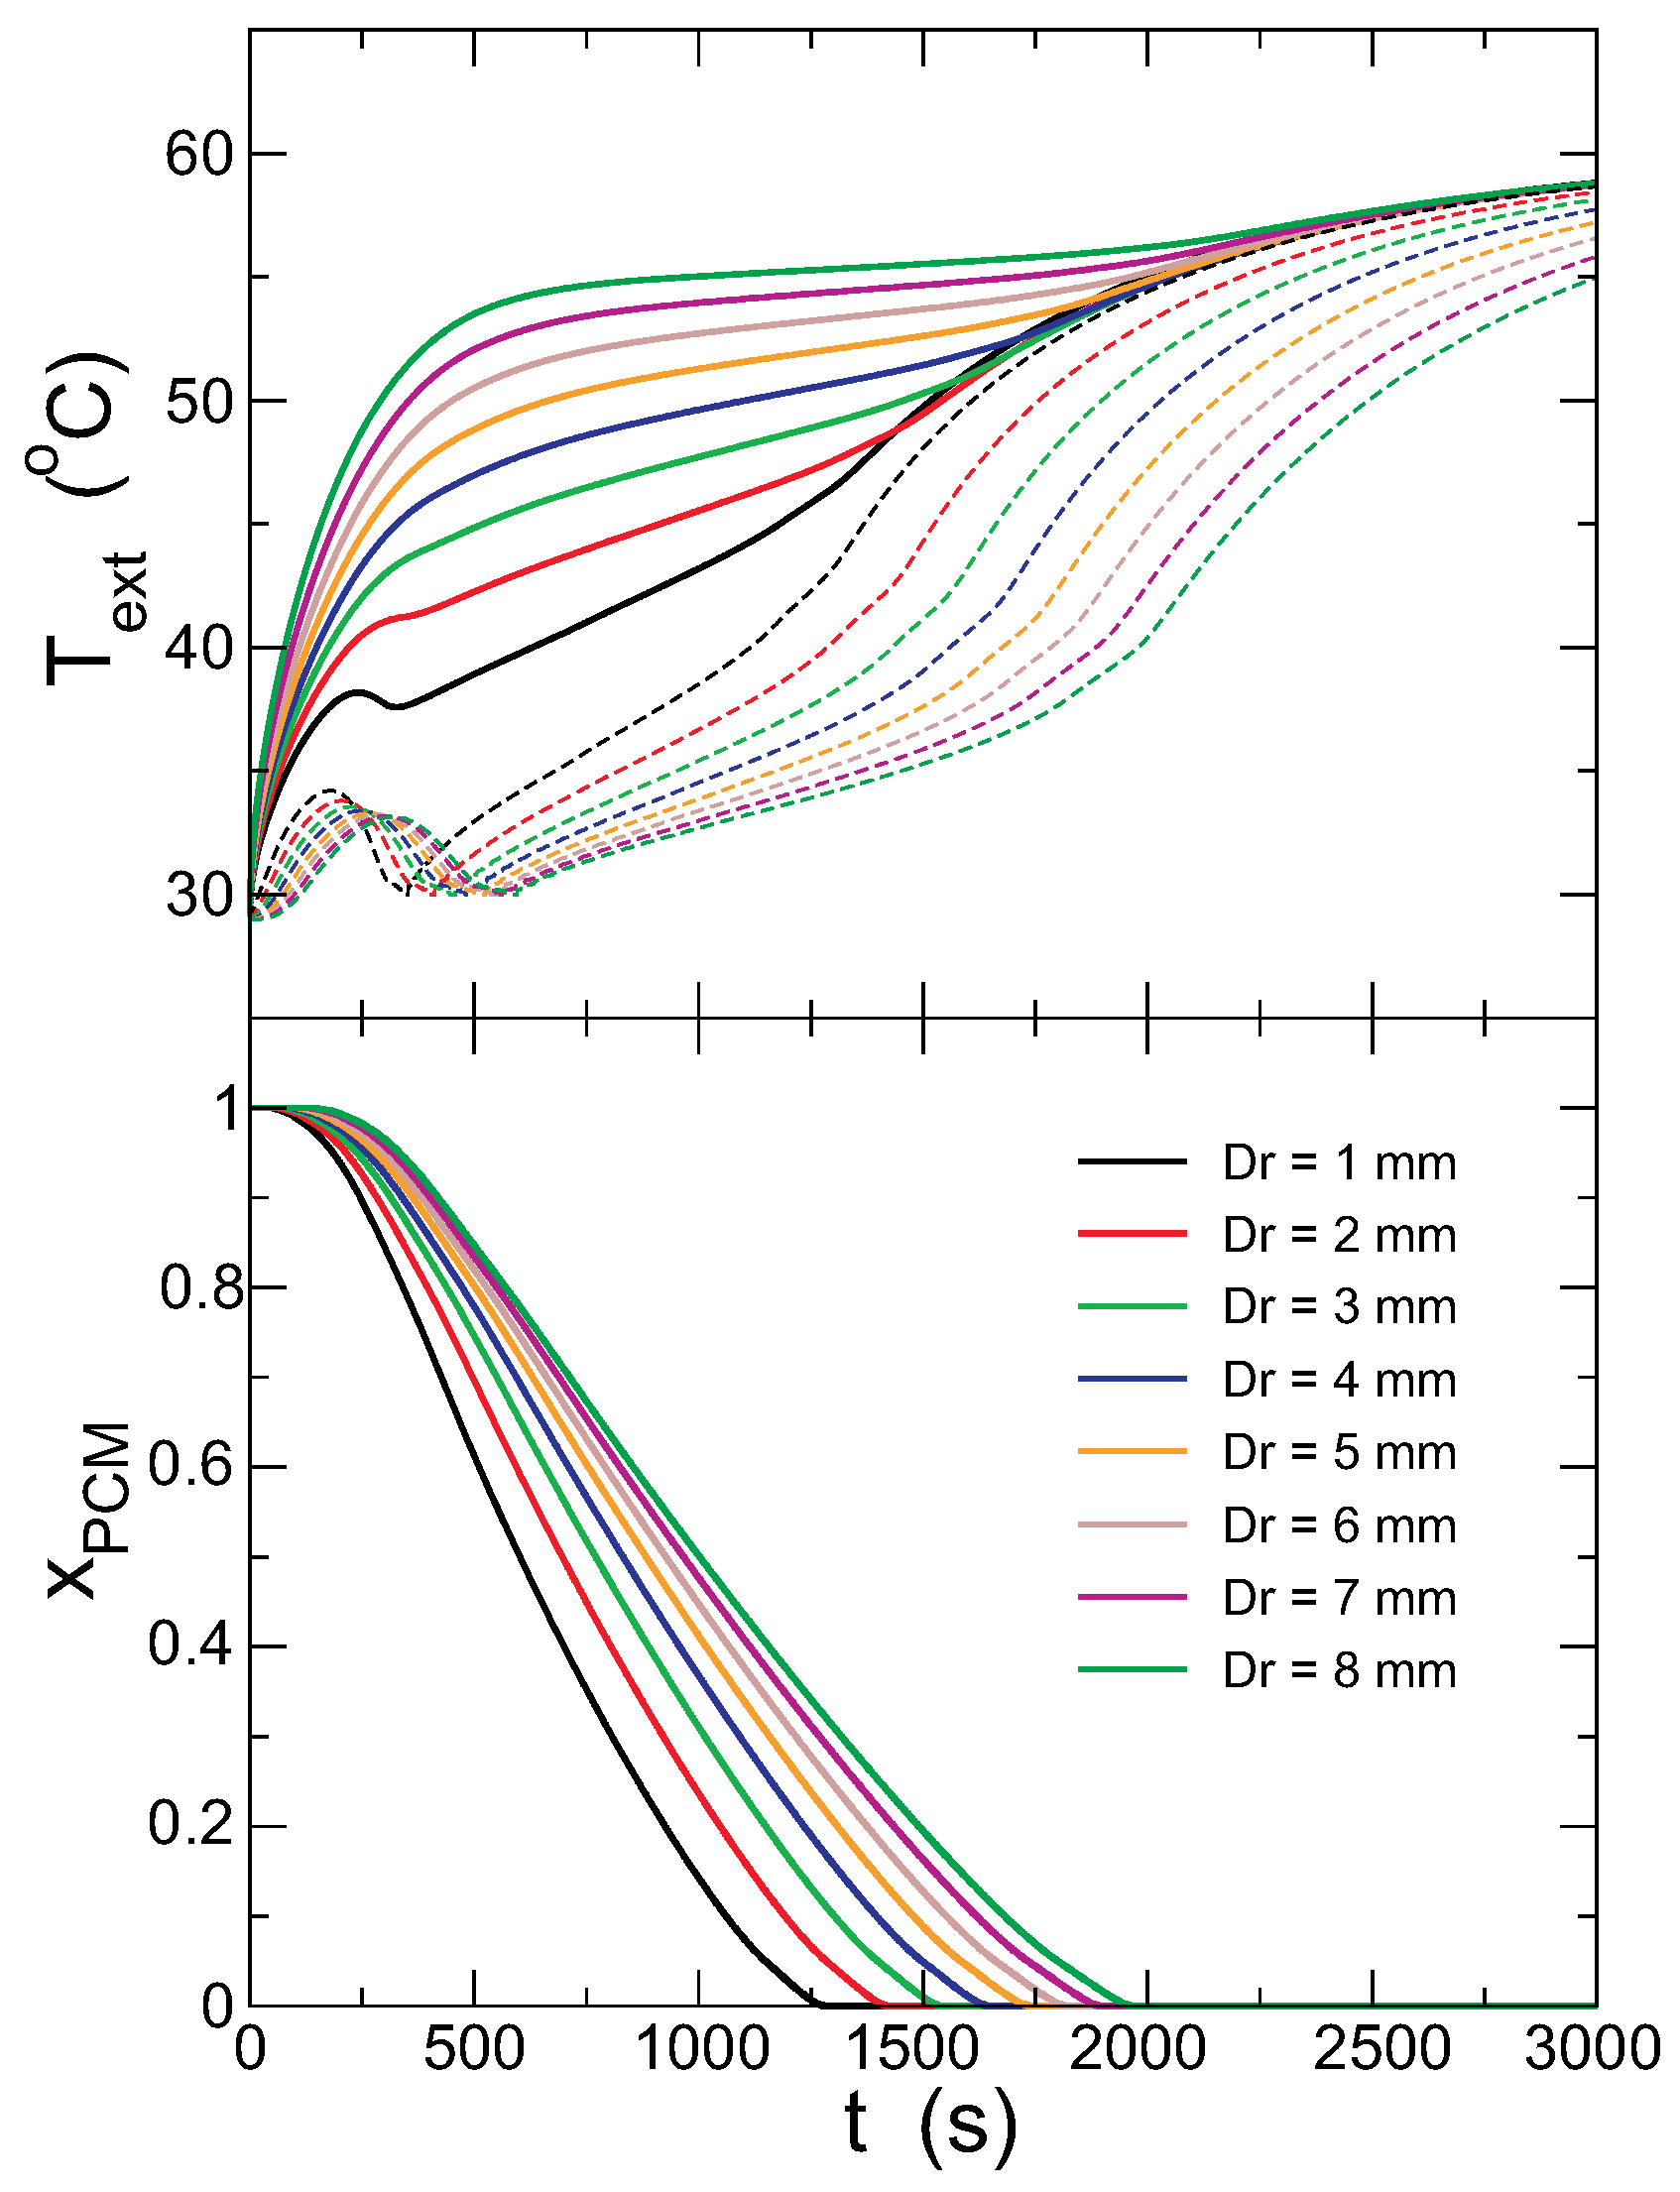
4.2. Effect of the Capsule Thickness
Capsules with the same internal radius
mm and varying the external one are studied in this section, with the thermostat temperature in all cases
°C.
Figure 8 presents the evolution of
and
and the fraction of solid PCM for different capsule thickness,
. Upon increasing
, the most dramatic effect observed in the figure is that the gap between the external and internal temperatures increases, and the temperature evolution is smoother. As a result, when all of the PCM melts, the internal surface of the capsule is colder for thicker walls. The time needed to melt the PCM is therefore increased (recall that the amount of PCM is kept constant). The low thermal conductivity of the capsule isolates the PCM from the heat source more effectively for thicker walls, keeping it colder for a longer time, although the external walls are hotter (because the thermostat is always at
°C).
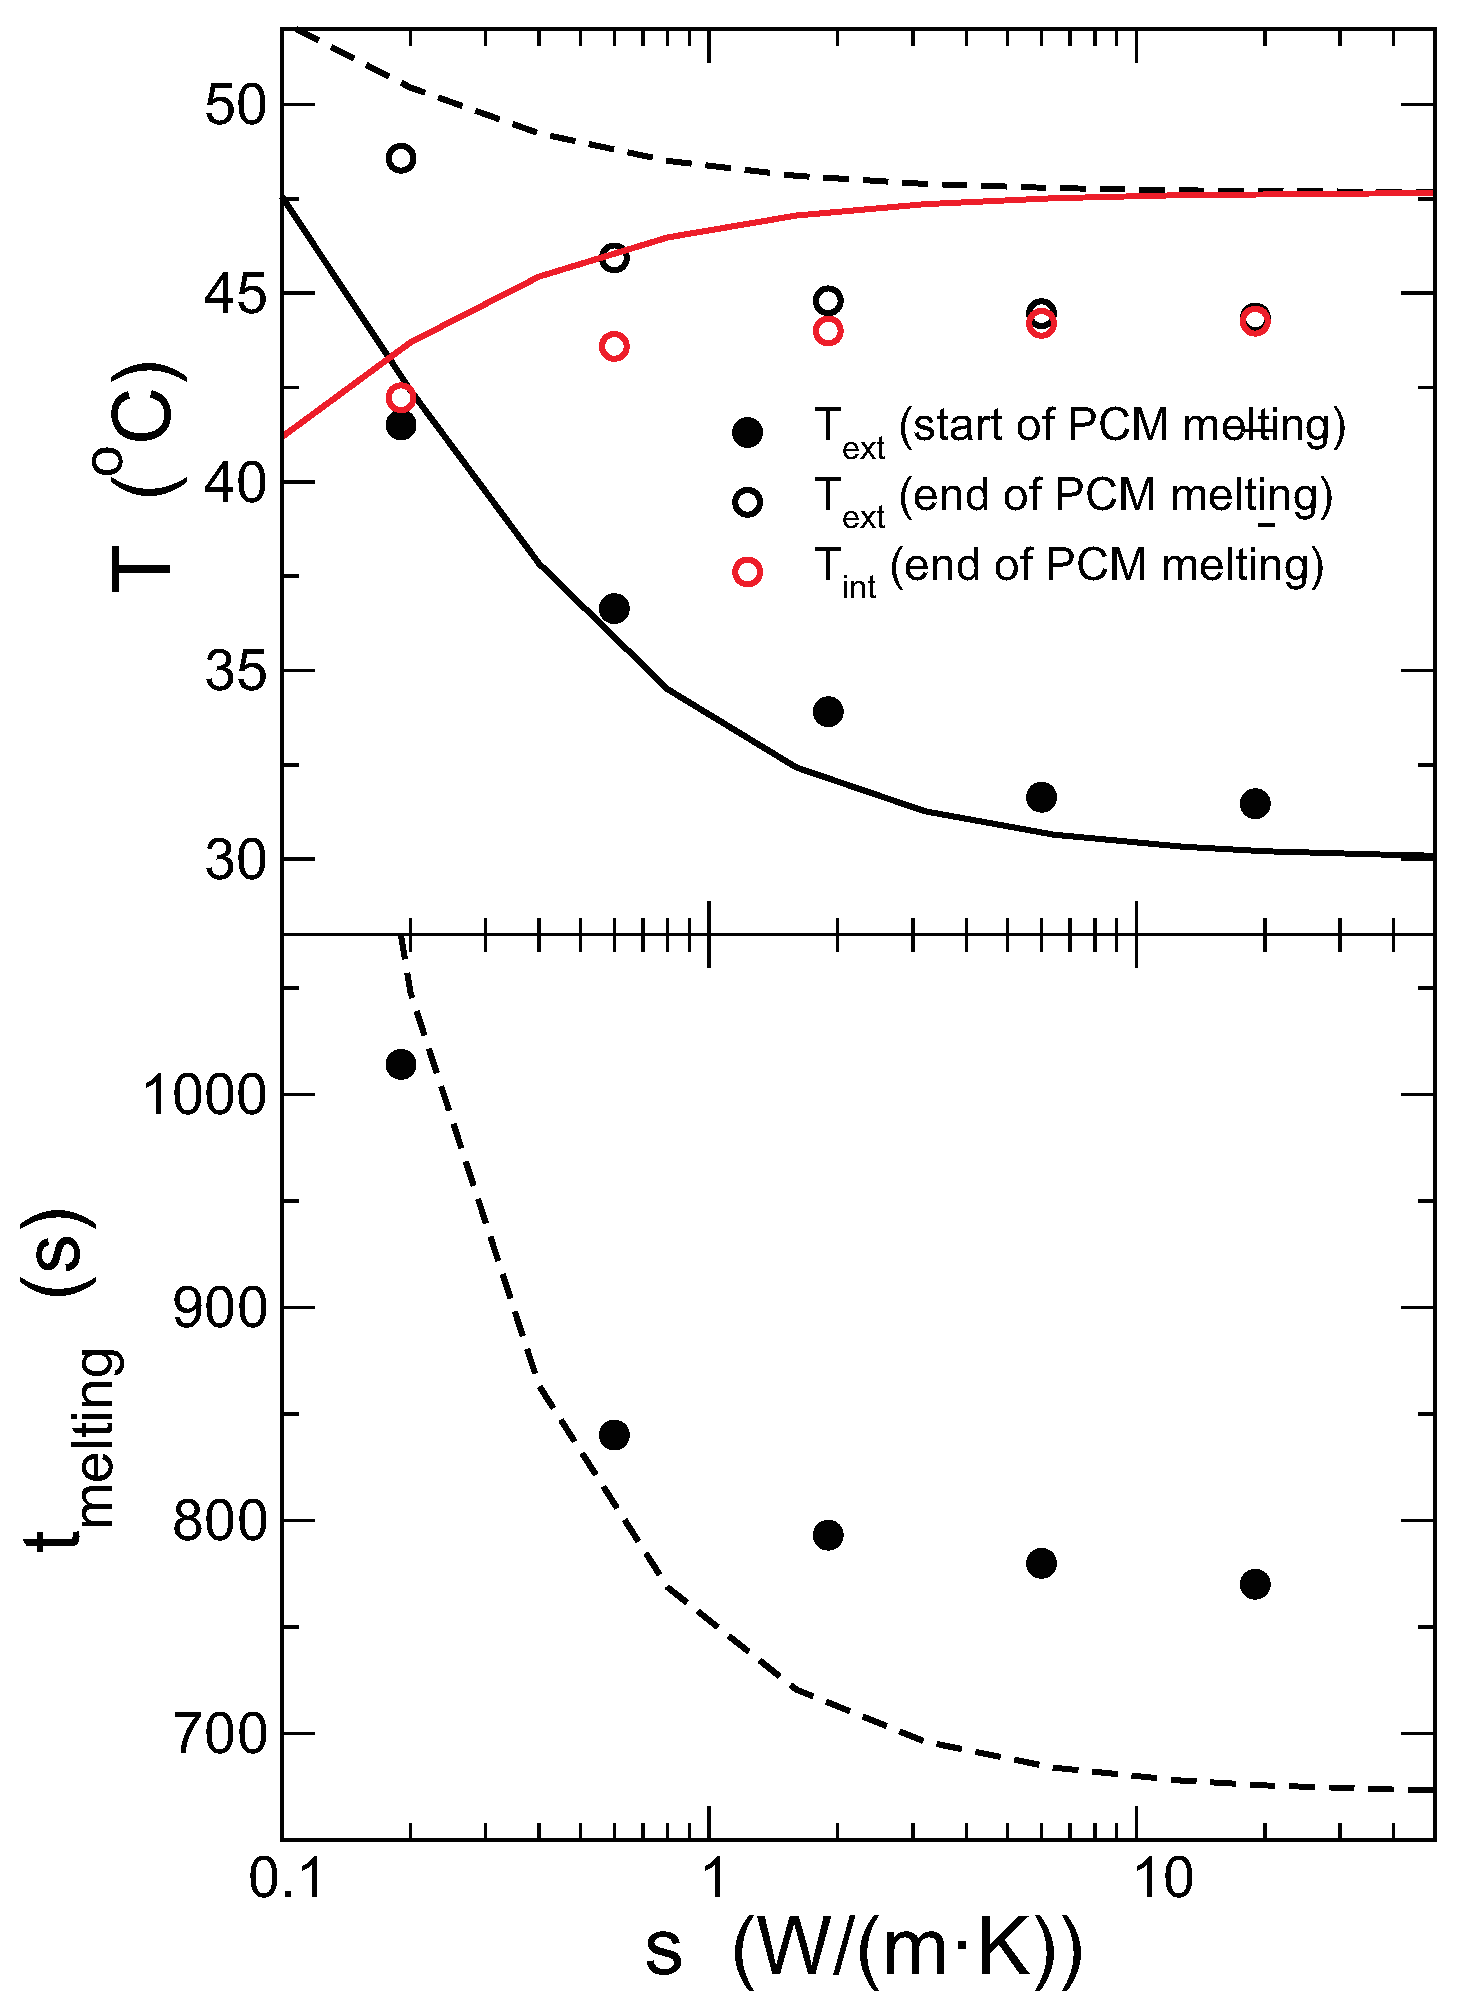
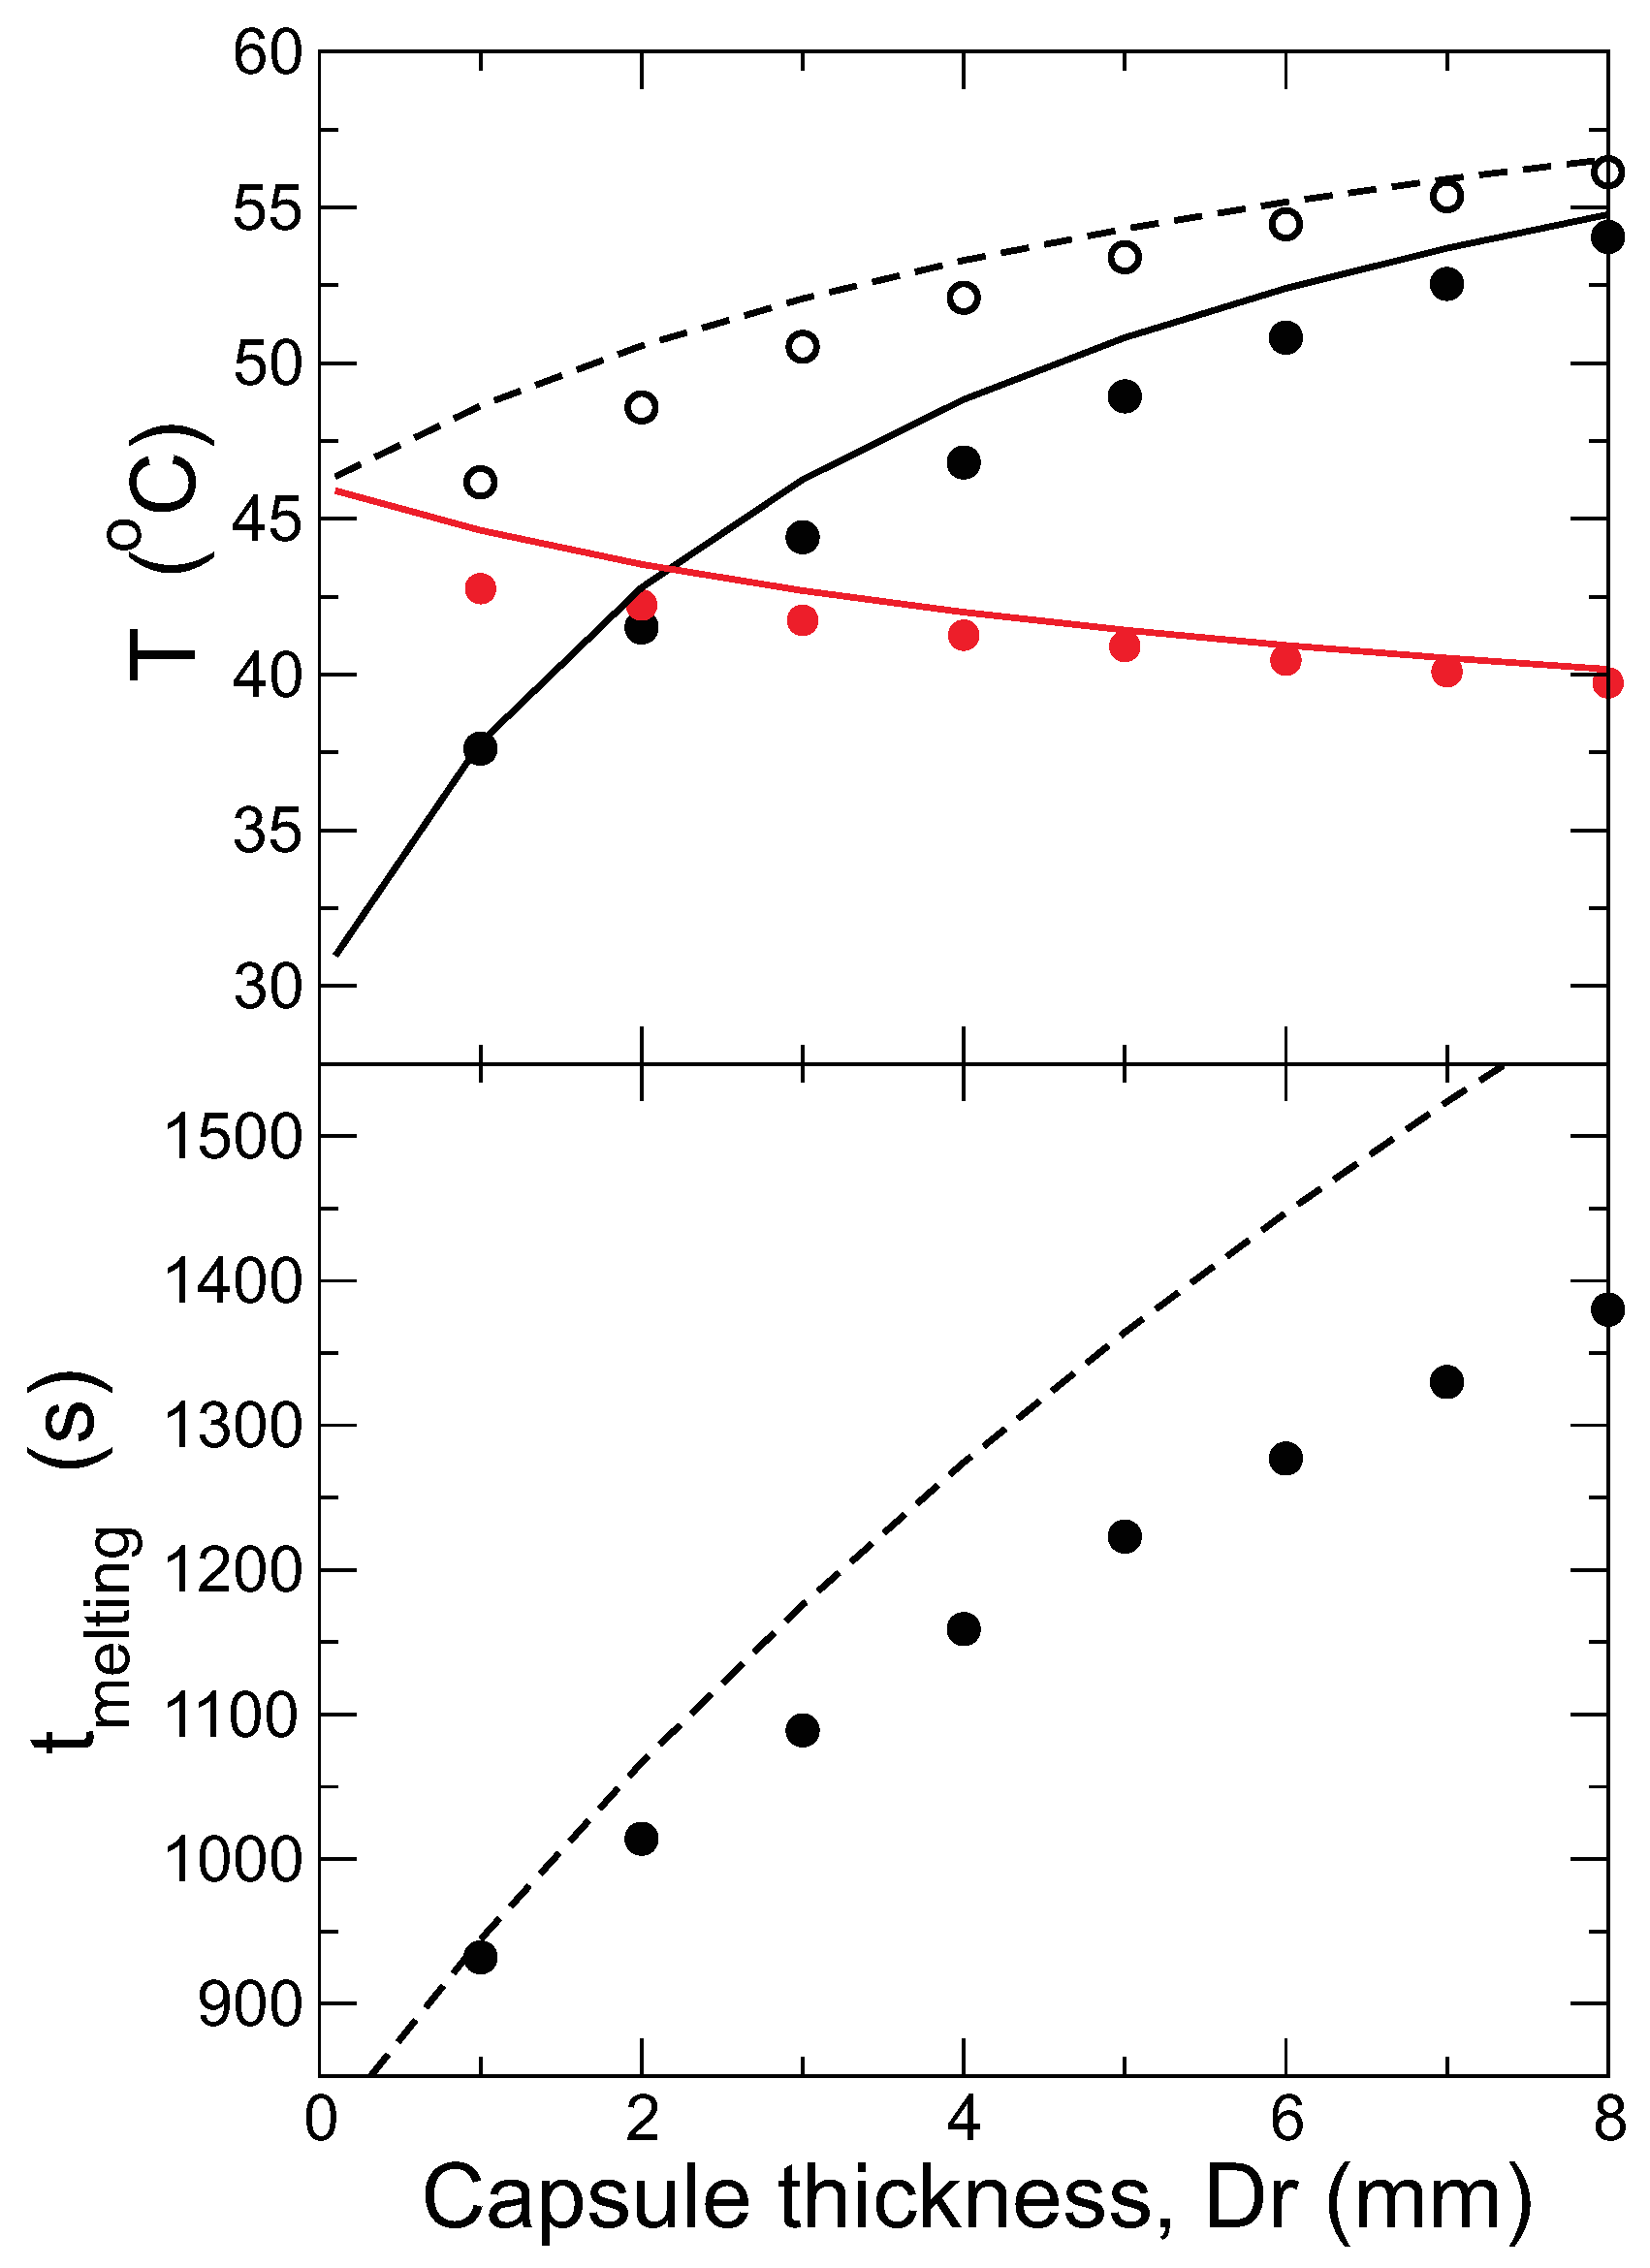
We analyze again the time for melting the PCM completely, and temperatures at the start and end, comparing with the theoretical model, in
Figure 9. As mentioned above, the temperature in the outer surface of the capsule at the start of the PCM melting is determined when the internal surface is at
. The lines in the figures are the predictions from the model for all quantities. The temperatures are quite nicely predicted by the model in the whole range of thicknesses studied, but the melting time deviates strongly for thick walls.
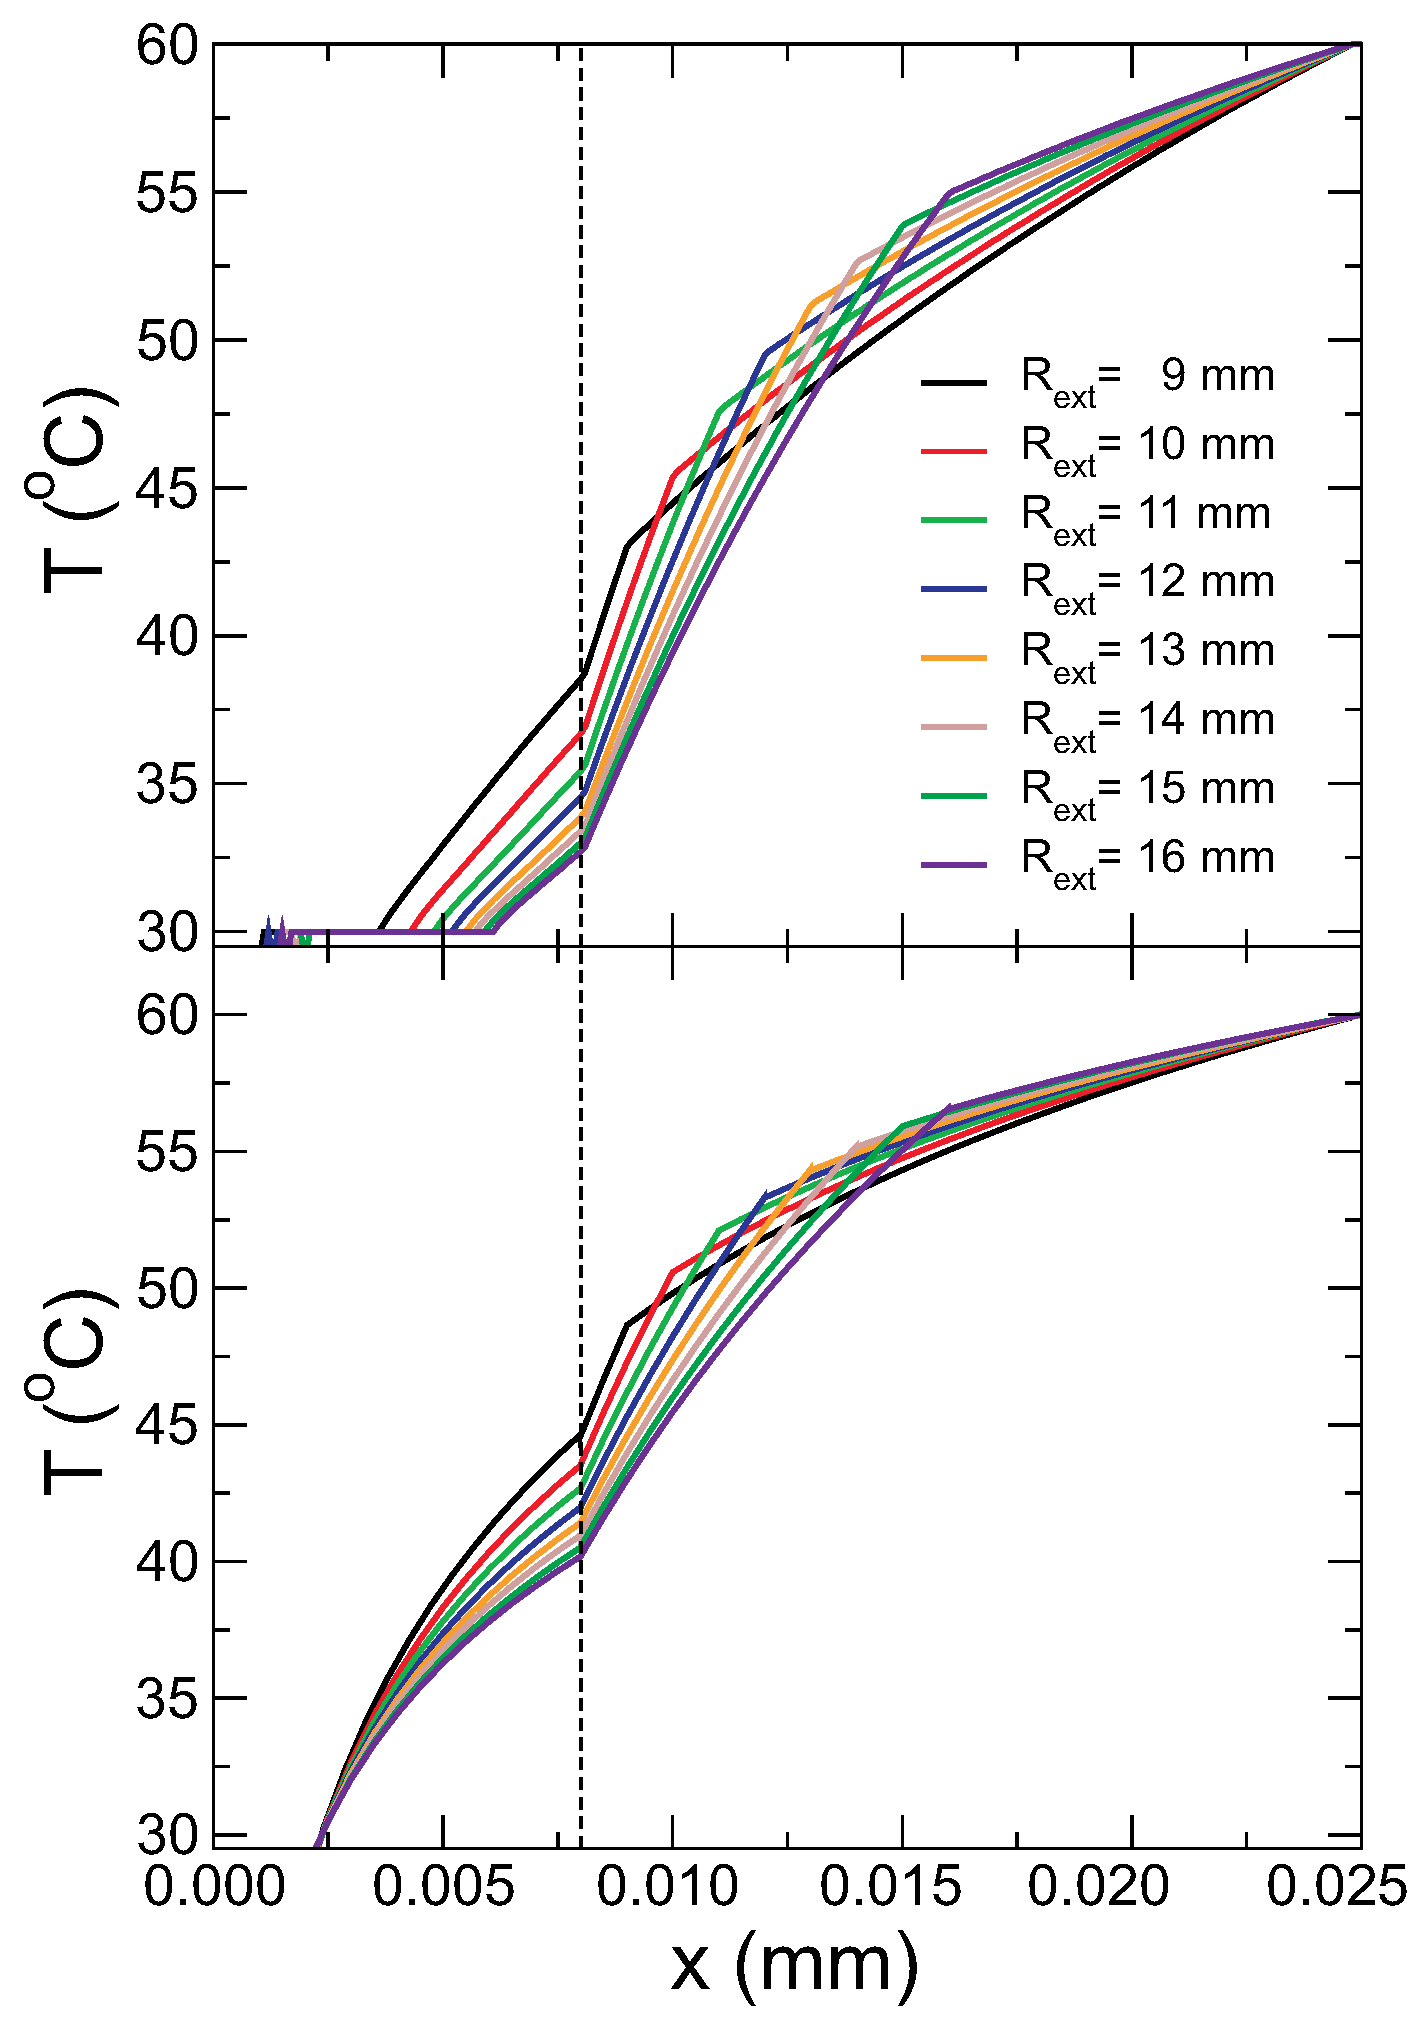
To gain further understanding of the process and check the model,
Figure 10 compares the temperature profiles from simulations and the theoretical model for different capsule thickness, ranging from
mm to
mm. In the figure, the profile from the simulations is taken at a constant time,
s, and compared with the theoretical curves at the final stage of the melting. Note, however, that the melting time increases with the capsule thickness, which affects the comparison of the simulation and theory at short distances. Nevertheless, the same trends are indeed observed. Particularly, the heat flux through the capsule (slope of
T vs.
r) decreases with increasing thickness, although the temperature gap is larger.
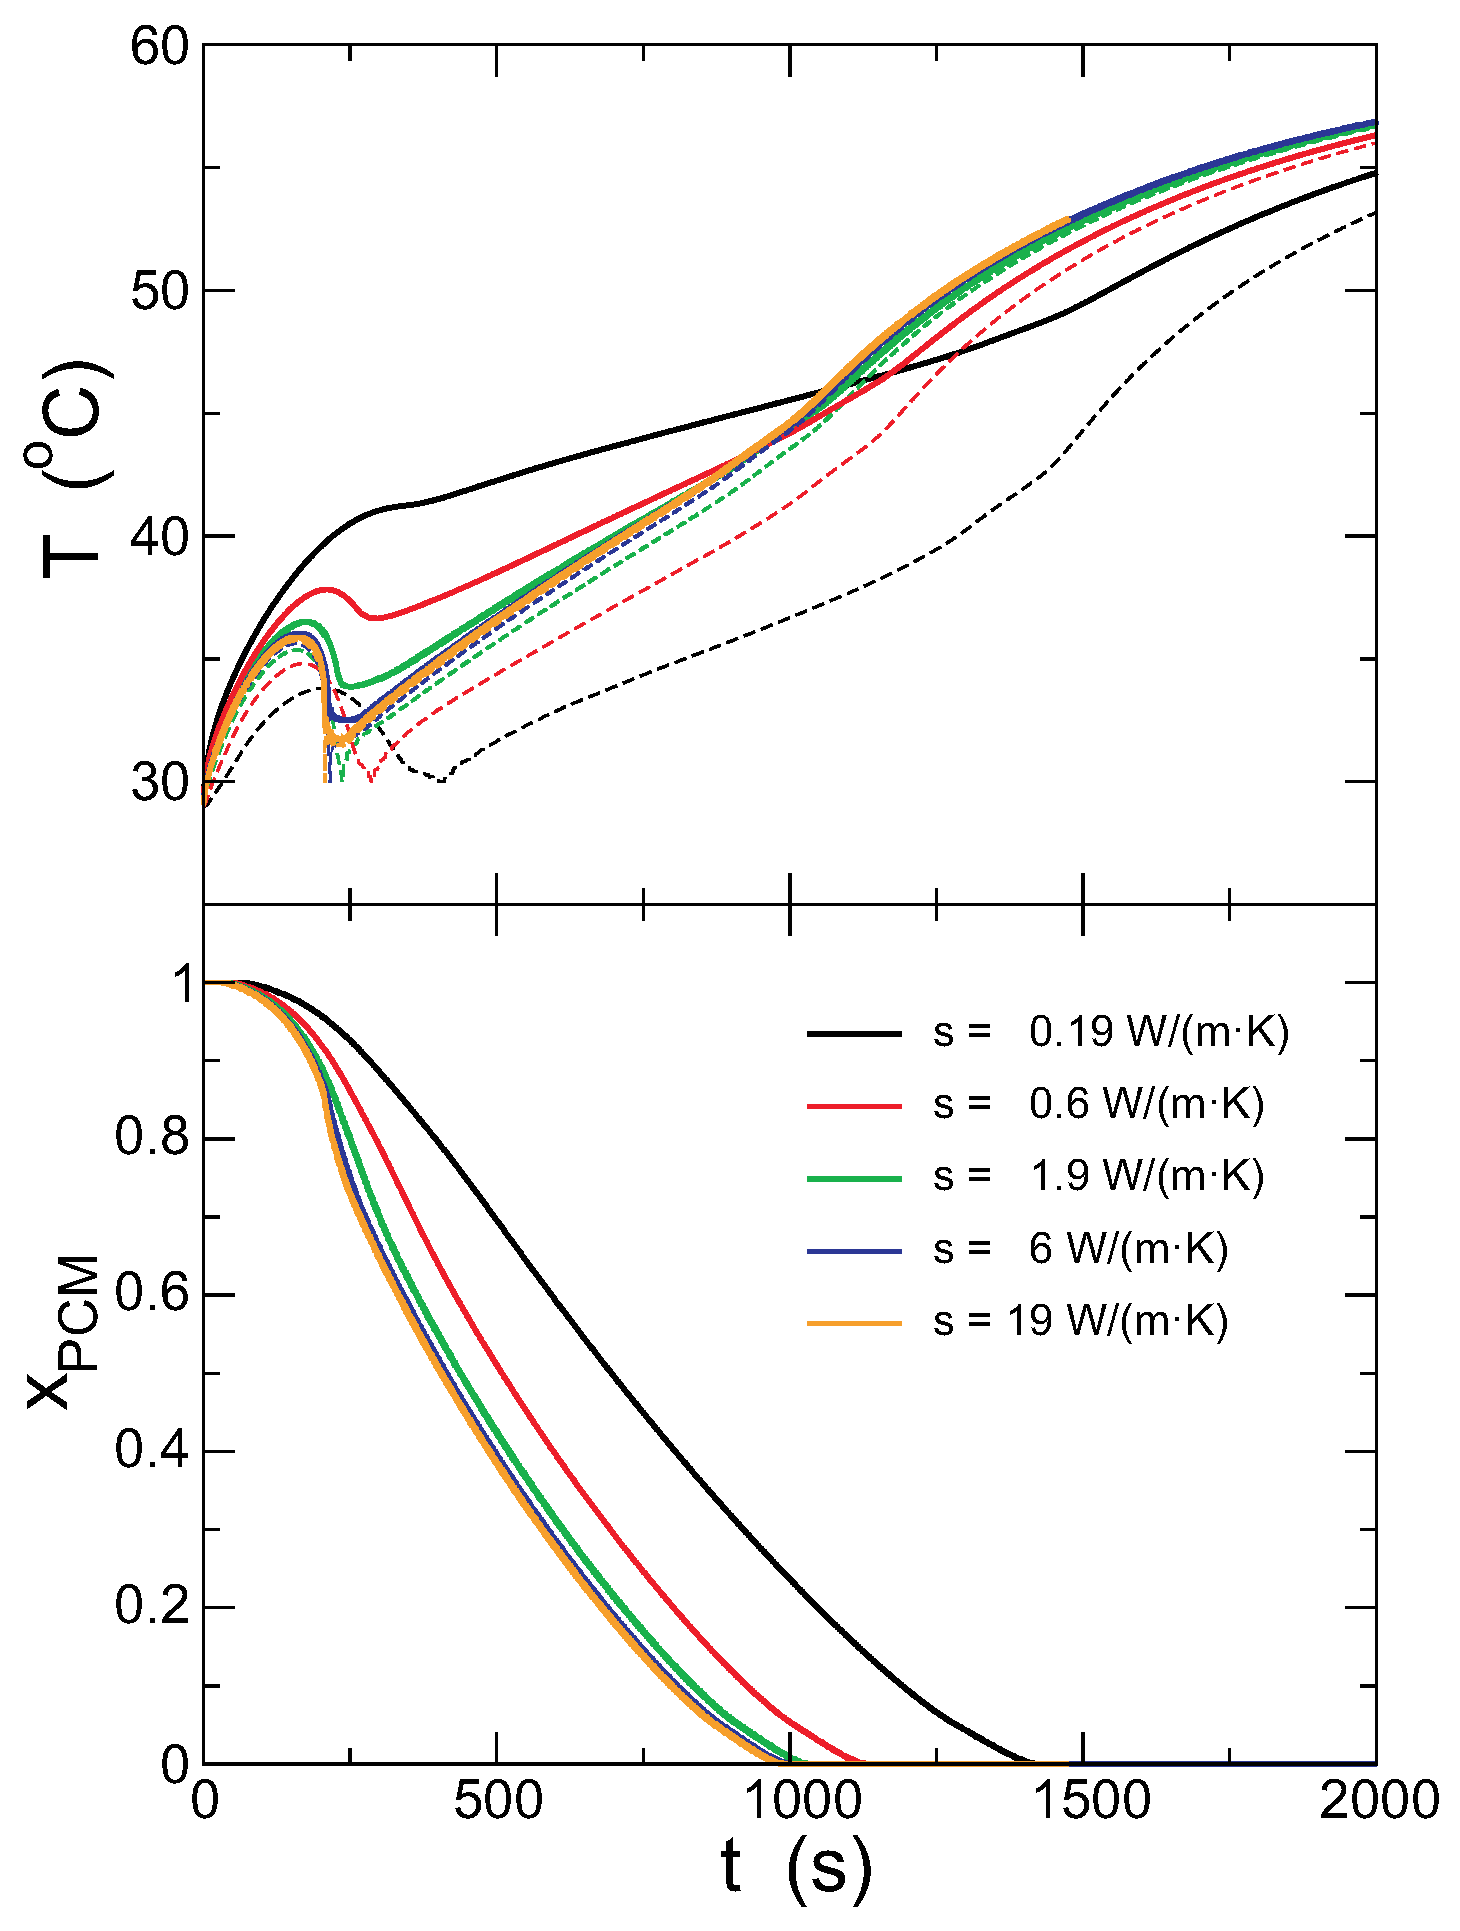
4.3. Effect of the Capsule Conductivity
In this section, the effect of varying the conductivity of the capsule is studied. Other relevant parameters are set as mm, mm, °C. The mass density of the capsule material has not been changed, although the combination of mass and conductivity might not correspond to any real material. The lattice has in all cases cells, but the time step must be adapted, as the heat flux is proportional to the conductivity.
Figure 11 shows the evolution of the external and internal temperatures for different values of the conductivity of the capsule, ranging from
0.19 W/(m·K) (typical of PVC) to
19 W/(m·K) (typical for stainless steel). The time step must be varied from
s for
W/(m·K) to
s for
W/(m·K).
As shown in the figure, for higher conductivities, the PCM melts faster, and the temperature in the outer surface is lower, as expected. More interestingly, the temperatures in the inner and outer surfaces of the capsule are more similar for larger
. The values of the temperatures in the inner and outer surfaces at the beginning and end of the melting are shown in
Figure 12, with the predictions from the model. As discussed previously, upon increasing the thermal conductivity, the internal and external temperatures come closer and become constant for large
. The predictions from the model overestimate the plateau temperature, but otherwise agree qualitatively with the results from the simulations. The total time for melting the PCM completely decreases with increasing
, but the theoretical model underestimates it, although capturing correctly the general trend, particularly the saturation for large conductivities. The reason for the decrease of the melting time is the increase of the heat flux due to the larger conductivity of the capsule. Note, however, that the overall change of this time is a decrease to
of the initial value, even though the conductivity of the capsule is varied by two orders of magnitude.
4.4. Effect of Natural Convection in the Bath
Convection has been neglected throughout this study, both in the bath and the capsule. Within the capsule, given its small size, small temperature differences and high viscosity of the liquid PCM, convection can be safely neglected, as shown below. In the water bath, however, heat transfer due to natural convection can be relevant if convection is not suppressed, e.g., by fins [
19]. In any case, the bath is only a heat conducting fluid, and the modification of the heat transfer mechanism will not affect the physics behind the melting of the PCM, but only its time scale.
The relative importance of convection with respect to heat conduction is given by the Nusselt number,
, which depends on the physical properties of the fluid and the geometry of the problem, and can be used to define an effective thermal conductivity. In general, in the laminar regime, the Nusselt number is estimated as
, with
C a constant that depends on the geometry (normally smaller than one) and
the Rayleigh number [
39]:
where
is the thermal expansion coefficient,
g the acceleration due to gravity,
the temperature difference,
L is the typical length,
the kinematic viscosity and
, with
, the shear viscosity (
c is the specific heat and
is the thermal conductivity, as mentioned above). For the PCM inside the capsule, during the melting, the solid-liquid interface is at the melting temperature, as is the liquid phase. The relevant length for the Rayleigh number is the distance from the inner surface of the capsule to the external border of the solid domains,
ℓ. Taking
°C,
(convection becomes relevant) for
mm, which corresponds to the final stages of the melting (as seen in
Figure 2). Convection is therefore not present during the melting. After that, convection ours inside the capsule, accelerating the heating of the molten PCM with respect to the results shown here.
In the bath, on the other hand, convection is relevant in most practical cases. Raithby and Hollands derived the expression for the heat transport between two concentric horizontal cylinders of radii
and
[
39,
40]:
where
is the Rayleigh number for this geometry, with
, and
is a geometrical factor, which for concentric cylinders is given by:
In the bath, for a typical case with
°C, the temperature difference between the thermostat and the capsule is initially
°C, yielding
, implying that convection enhances dramatically the heat transfer with respect to pure conduction.
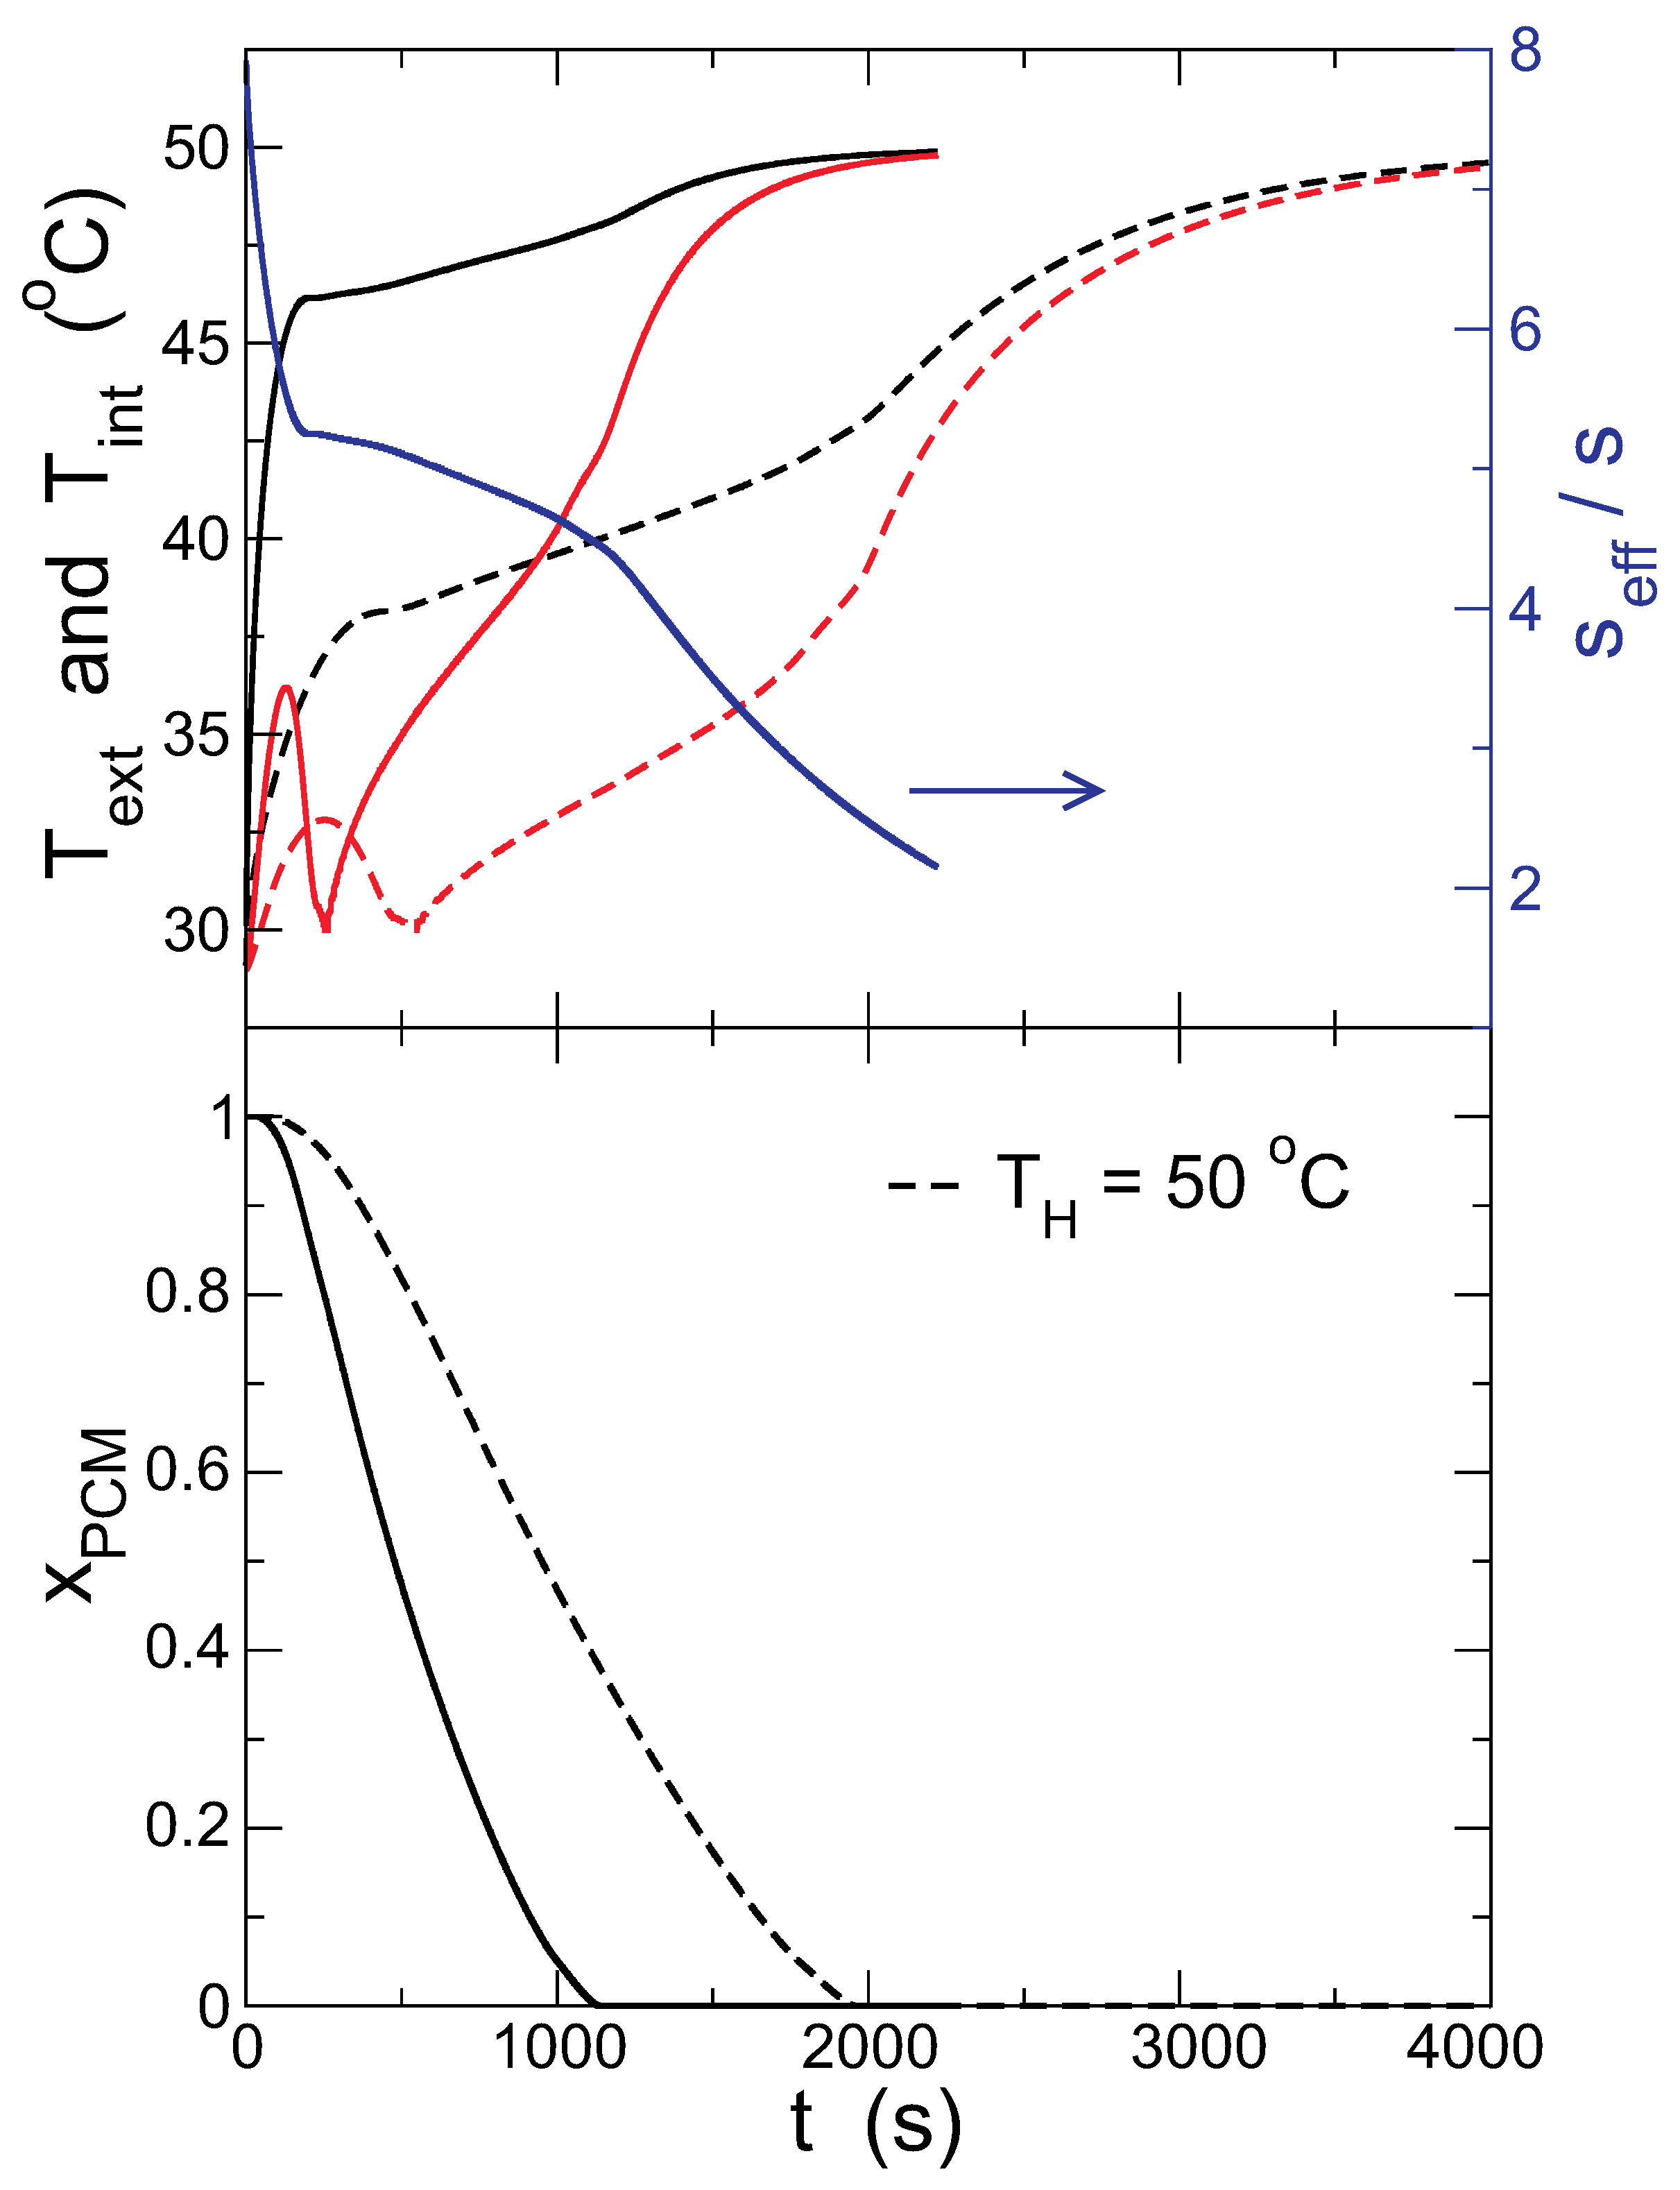
Figure 13 compares the kinetics of melting with and without convection (surface temperature in the upper panel and the solid fraction in the lower one). When convection is taken into account, the PCM melts much faster, and the temperature in both the internal and external surfaces of the capsule is much higher, in agreement with previous results where convection inside the capsule is considered [
19].
The effective conductivity, calculated with the instantaneous temperature difference between the thermostat and the capsule, is also plotted in the upper panel of
Figure 13 (blue line). As the PCM melts and the capsule surface heats up, the importance of convection decreases, but even in the latest stages of the process shown in the graph, when the PCM is completely melted, the
is significantly larger than one. This shows that, if natural convection in the bath that transfers the heat from the thermostat to the PCM is suppressed, the surface temperature of the PCM is lowered, and the melting time grows.
Table 3 presents the external temperatures at the start and end of the melting and the melting times for different bath temperatures. In all cases, the temperatures are higher when convection is present, and the PCM melts faster, reducing the melting time to 60% of the value without convection.
5. Conclusions
Simulations based on the finite difference method in two dimensions are presented, taking into account the difference between the densities of the solid and liquid phases to study the melting of a PCM (CaCl2·6H2O, as an example of a locally-available, inexpensive salt hydrate and the possible application into high thermal mass building walls or storage) in a cylindrical tube. In the model, natural convection both inside the capsule and in the thermal bath is neglected, and the materials are assumed to be homogeneous and their properties constant. We have studied the time dependence of the temperature field and solid fraction of the PCM for different parameters: bath temperature, capsule thickness, capsule conductivity and considering natural convection in the bath. The melting starts in the inner part of the PCM and evolves to the boundary of the capsule. The simulations show that the point where the PCM has melted completely can be identified monitoring the outer surface of the capsule.
A theoretical model has been also derived to reproduce the simulation results. The model considers only conduction, and the initial and final stages of the melting are taken from the limiting conditions of our model. The theoretical model reproduces quasi-quantitatively the results concerning the initial and final temperatures of the capsule and melting time. Both the simulations and theoretical model show that thicker capsules prolongs the melting time, but gives a higher temperature in its surface. On the other hand, the same effects are obtained when a bad thermal conductor is used to encapsulate the PCM. Natural convection in the bath enhances heat transfer notably, reducing the melting time.
Given a particular application, the present model can be used to study the most appropriate conditions to optimize the operation. However, further refinement of the model is necessary to incorporate convection correctly, as the present model is restricted to situations where convection is irrelevant (due to the small size of the capsule or small temperature gradients).


 ,
, 


