Article

Evaluation of Interface Defects in Inaccessible Reactor Shrink Fit Nozzle Welds Using Ultrasonic Waves

1
New Transportation Systems Research Center, Korea Railroad Research Institute, Uiwang 16105, Korea
2
School of Mechanical Engineering, Pusan National University, Busan 46241, Korea
*
Author to whom correspondence should be addressed.
Energies 2017, 10(5), 589; https://doi.org/10.3390/en10050589
Submission received: 11 January 2017 / Revised: 3 April 2017 / Accepted: 20 April 2017 / Published: 25 April 2017
(This article belongs to the Special Issue Next Generation Reactors and Materials for Advanced Fuel Cycles)

Abstract

:
This study proposes an effective method to inspect inaccessible nuclear power reactor head nozzles using interface waves that propagate along the shrink fit boundary of a reactor head. The reactor head is relatively thick, which makes it difficult to inspect from the outside by conventional ultrasonic testing. However, interface waves can propagate a long distance from a fixed transducer position. The inside of the nuclear reactor has limited access due to the high radiation, so the transducers are located outside the nuclear reactor head, and interface waves propagate into the nuclear reactor to detect defects. A numerical simulation and experiments were carried out to validate the method. Various defect cases that simulate field failures are also presented, and the proposed technique shows satisfactory defect classification.

Graphical Abstract

1. Introduction

For their safe operation it is very important to monitor the conditions of nuclear power plants efficiently and to detect defects. Traditionally, to prevent failures schedule-based maintenance was performed to inspect nuclear power facilities, however, inspection schemes are moving away from schedule-based maintenance toward condition-based maintenance (CBM). Condition-based maintenance is defined as maintenance when a need arises. The maintenance is performed based on a structure’s condition in which defects are identified or grow beyond some standard. Ideal condition-based maintenance allows minimizing the cost of storing spare parts, system downtime and time spent on maintenance. For condition-based maintenance inspections, a proper diagnostic method and real time data collection are needed for each component. Currently the nuclear power system industry still relies on following schedule-based maintenance, but we anticipate that CBM will be applied in nuclear power facilities sooner or later. The risk of failure due to defects has increased due to the long-term use of nuclear power plants. Proper inspection methods for defect identification and monitoring defect growth are needed for the safety diagnosis and life prediction for the main equipment in nuclear power plants.
There are several ways of diagnosing plant conditions. First, diagnostic tests to classify candidate anomalies are repeated until an anomaly is identified. Second, an assumption about the nature of a detected anomaly is made, and confirmed by tests. Third, a standard set of diagnostic tests is applied, and the anomaly is diagnosed [1]. Recently, nuclear power facility safety issues have become of great concern to people. The sizes and shapes of nuclear power plant components usually do not follow standard commercial specifications. Standard pipes have suitable inspection methods such as long range ultrasonic testing (LRUT), ultrasonic testing (UT) and phased array ultrasonic testing (PAUT). Transducers and inspection systems based on those methods are commercialized for standard sized pipelines. Therefore, unique inspection methods and systems are required to meet the high safety demands of nuclear power plants. Currently nuclear power plant inspection is performed using regular schedule-based maintenance systems. Ultrasonic non-destructive evaluation (NDE) is employed periodically on nuclear reactors and nozzle welds to inspect any defects or defect growth during periodic overhaul periods. The need for continuous online monitoring for stability safety checks has increased. To accomplish online monitoring of a nuclear reactor, radiation hardened materials and wireless communication under high temperature and radiation condition must be developed. However, achieving the purpose of online monitoring for nuclear power plant components still has a long way to go. Recently, PAUT was employed for precise defect detection and sizing [2]. Nuclear power plant components inspection by LRUT such as nuclear power plant valves [3,4], pipes [5,6,7,8,9,10] and steam generator tubes [11,12,13,14] has been reported. Control element driving mechanism (CEDM) nozzles are attached to and penetrate through the reactor head. However, the reactor head is relatively thick, which makes it difficult to inspect it from the outside of the reactor to monitor the weld conditions inside the reactor by conventional UT due to the signal attenuation. Reactor head nozzles are generally inspected by conventional UT during the in-service inspection (ISI) period from inside of the nuclear reactor with a remote robot system due to the high radiation [15,16,17,18,19,20]. Remote robot systems are a good solution for weld inspections on reactor nozzles, but this method is only possible during ISI, so an alternative inspection method for condition-based maintenance is proposed in this paper.
The penetrated nozzle on the reactor head can be inspected using pseudo interface waves, which propagate along the boundary between the nozzle and reactor head. Using this inspection technique, the defects on the weld and its interface can be identified from outside the nuclear reactor head. The characteristics of pseudo interface waves propagating in a nuclear reactor nozzle were presented in a previous study [21,22]. Previous works are however limited to experimental studies of reactor nozzle welds on simplified defect model samples using interface waves. This paper presents a numerical model analysis for fault identification using pseudo−interface waves. The pseudo-interface wave propagation characteristics and scattering from a defect and weld on a reactor nozzle were evaluated, and the method was validated experimentally for various defect locations and sizes.

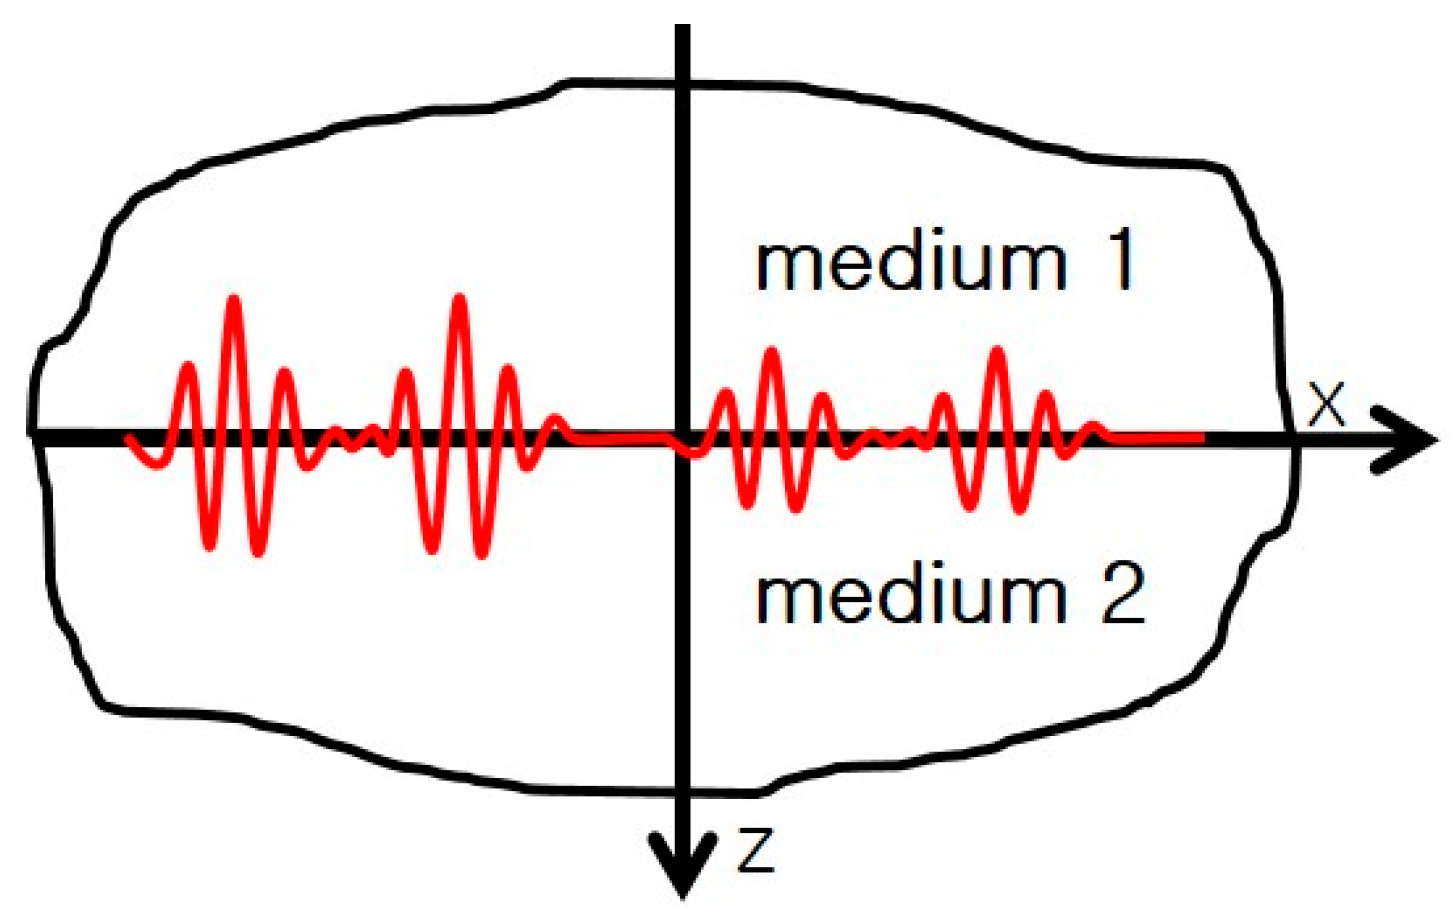
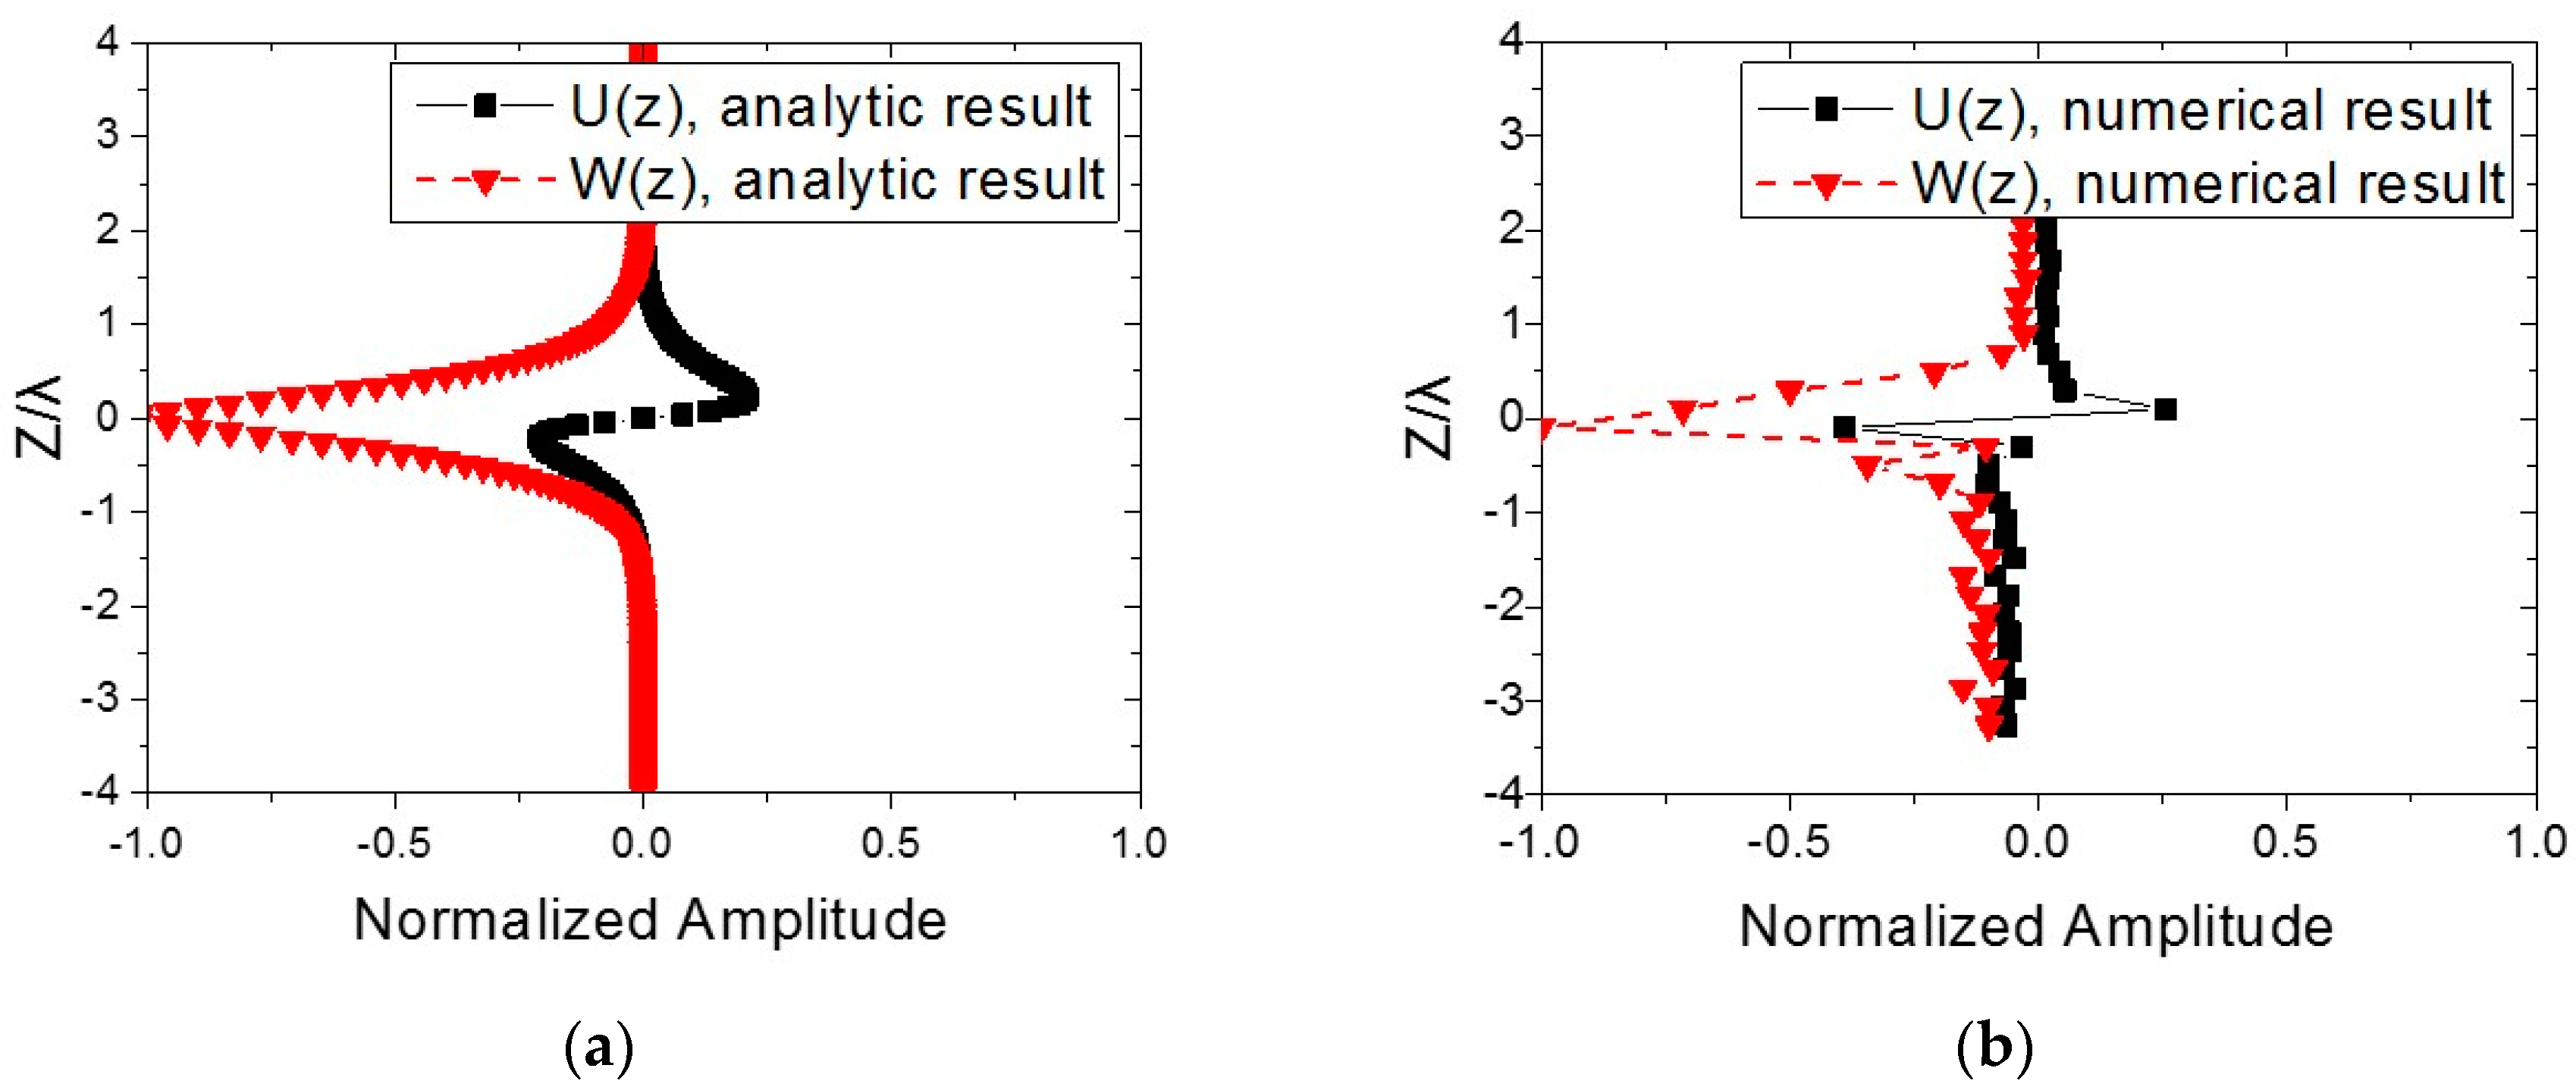
2. Interface Wave Propagation Theory

Rayleigh waves are one of the interface waves that travel in solid-vacuum half space. In isotropic solids, the particle motion is elliptical and retrograde for shallow depths with respect to the propagation direction. Scholte waves exist under the interface condition of fluid-solid media [23]. Most of the energy of a Scholte wave decays exponentially in solid and fluid media. Some studies using Scholte waves and quasi-Scholte waves were presented to validate the propagation characteristics [24,25,26,27,28]. Stoneley waves propagate at the interface between two solid media [29]. Some surface wave applications can be found in earlier papers [30,31,32,33,34]. Surface waves propagate on half infinite media and Stoneley waves propagate along the interface between to different solid materials.
The displacement of an interface wave on a plate is defined as follows [35,36]:
u = u ( z ) e i k x ,   w = w ( z ) e i k x
where u and w is the displacement in the x and z directions. The term e i ω t has been omitted hereafter. The coordinate system is shown in Figure 1. The unknown amplitudes u(z) and w(z) can be defined as:
u ( z ) = [ ( A e k α z + B e k α z ) β ( C e k β z D e k β z ) ] e i k x
w ( z ) = i [ α ( A e k α z B e k α z ) ( C e k β z + D e k β z ) ] e i k x
where α 2 = 1 c 2 c L 2   ,   β 2 = 1 c 2 c T 2   , c = ω k .
The stress components are:
σ z = i μ [ k ( 1 + β 2 ) ( A e k α z + B e k α z ) + 2 k β ( C e k β z D e k β z ) ] e i k x
σ x z = μ [ 2 k α ( A e k α z B e k α z ) + k ( 1 + β 2 ) ( C e k β z + D e k β z ] e i k x
The boundary conditions at the interface between media 1 and 2 are:
u ( m 1 ) = u ( m 2 ) ,   w ( m 1 ) = w ( m 2 ) ,   σ z ( m 1 ) = σ z ( m 2 ) ,   σ x z ( m 1 ) = σ x z ( m 2 )
where superscript (m1) and (m2) indicate medium 1 and 2, respectively. To satisfy the boundary condition, when z = 0, the system Equation (7) has a nontrivial solution when the determinant is zero:
[ σ z ( 1 ) σ z ( 2 ) σ x z ( 1 ) σ x z ( 2 ) u ( 1 ) u ( 2 ) w ( 1 ) w ( 2 ) ] = [ ( 1 + β 1 2 ) 2 β 1 ( 1 + β 1 2 ) g 2 β 2 g 2 α 1 ( 1 + β 1 2 ) 2 α 2 g ( 1 + β 2 2 ) g 1 β 1 1 β 2 α 1 1 α 2 1 ] [ B 1 D 1 A 2 C 2 ] = [ 0 0 0 0 ] .
Figure 2 shows wave amplitude distributions in the thickness direction. The interface wave amplitude distributions in the thickness direction are calculated by an analytic approach using the wave equation in Figure 2a and the finite element numerical approach in Figure 2b. Displacement u(z) is an in-plane displacement and w(z) is an out-of-plane displacement. The out-of-plane displacement is highest at the interface and becomes zero further away from the interface. This study examines a two layered structure made of 316 stainless steel.

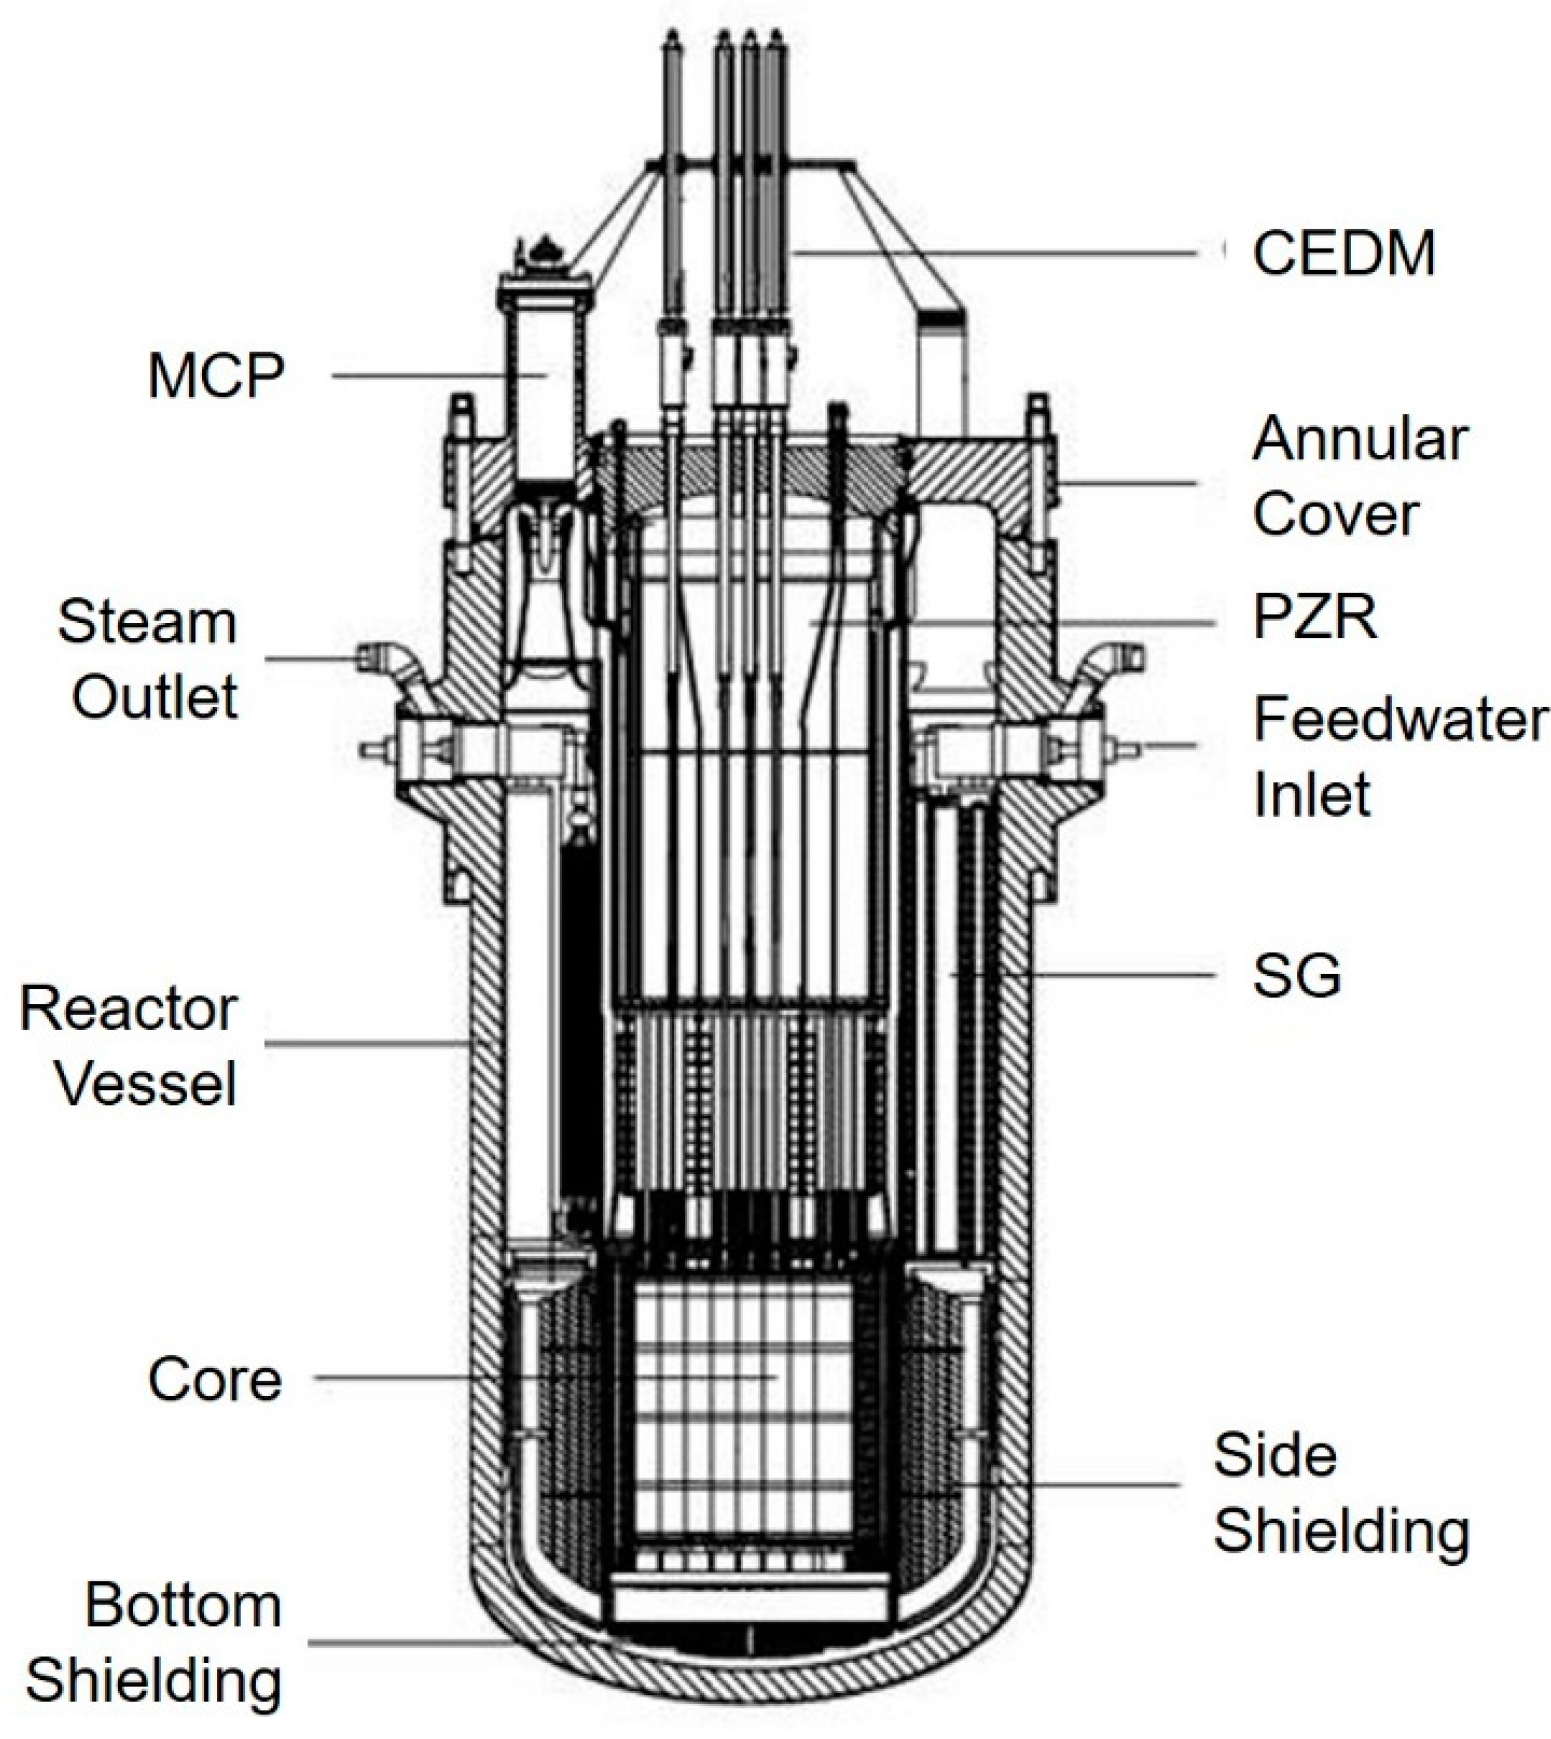
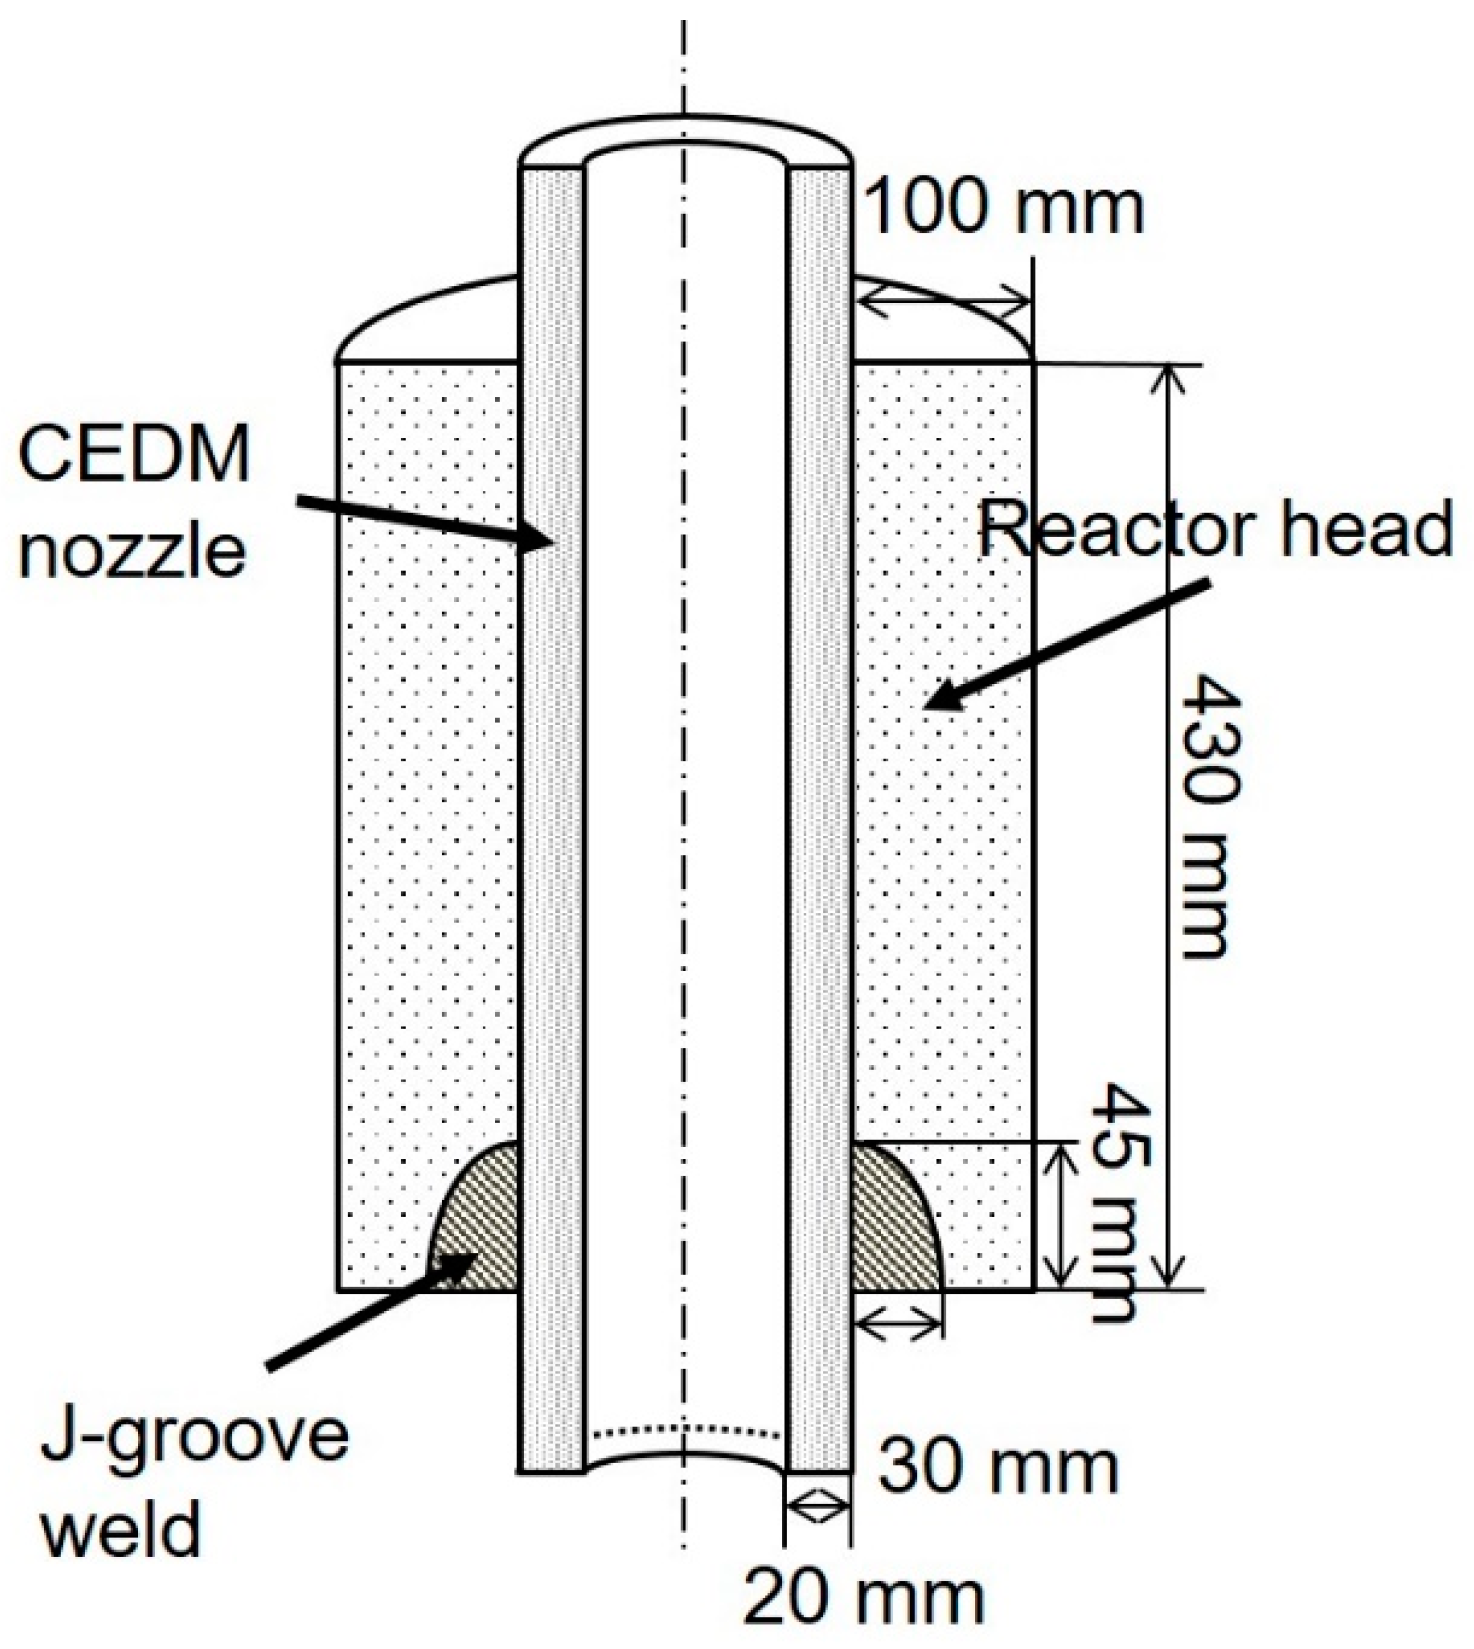
3. Nuclear Reactor Head Nozzle Model

In the small integrated nuclear reactor system illustrated in Figure 3, the control element drive mechanism (CEDM) is installed through the nuclear reactor head. The reactor head and the nozzle pipe are attached using shrink fit conditions and welded at the end of the shrink fit boundary. The CEDM nozzle and reactor head are connected using a J-groove weld to prevent radiation leakage. The proposed interface wave inspection method is applied for monitoring this weld.

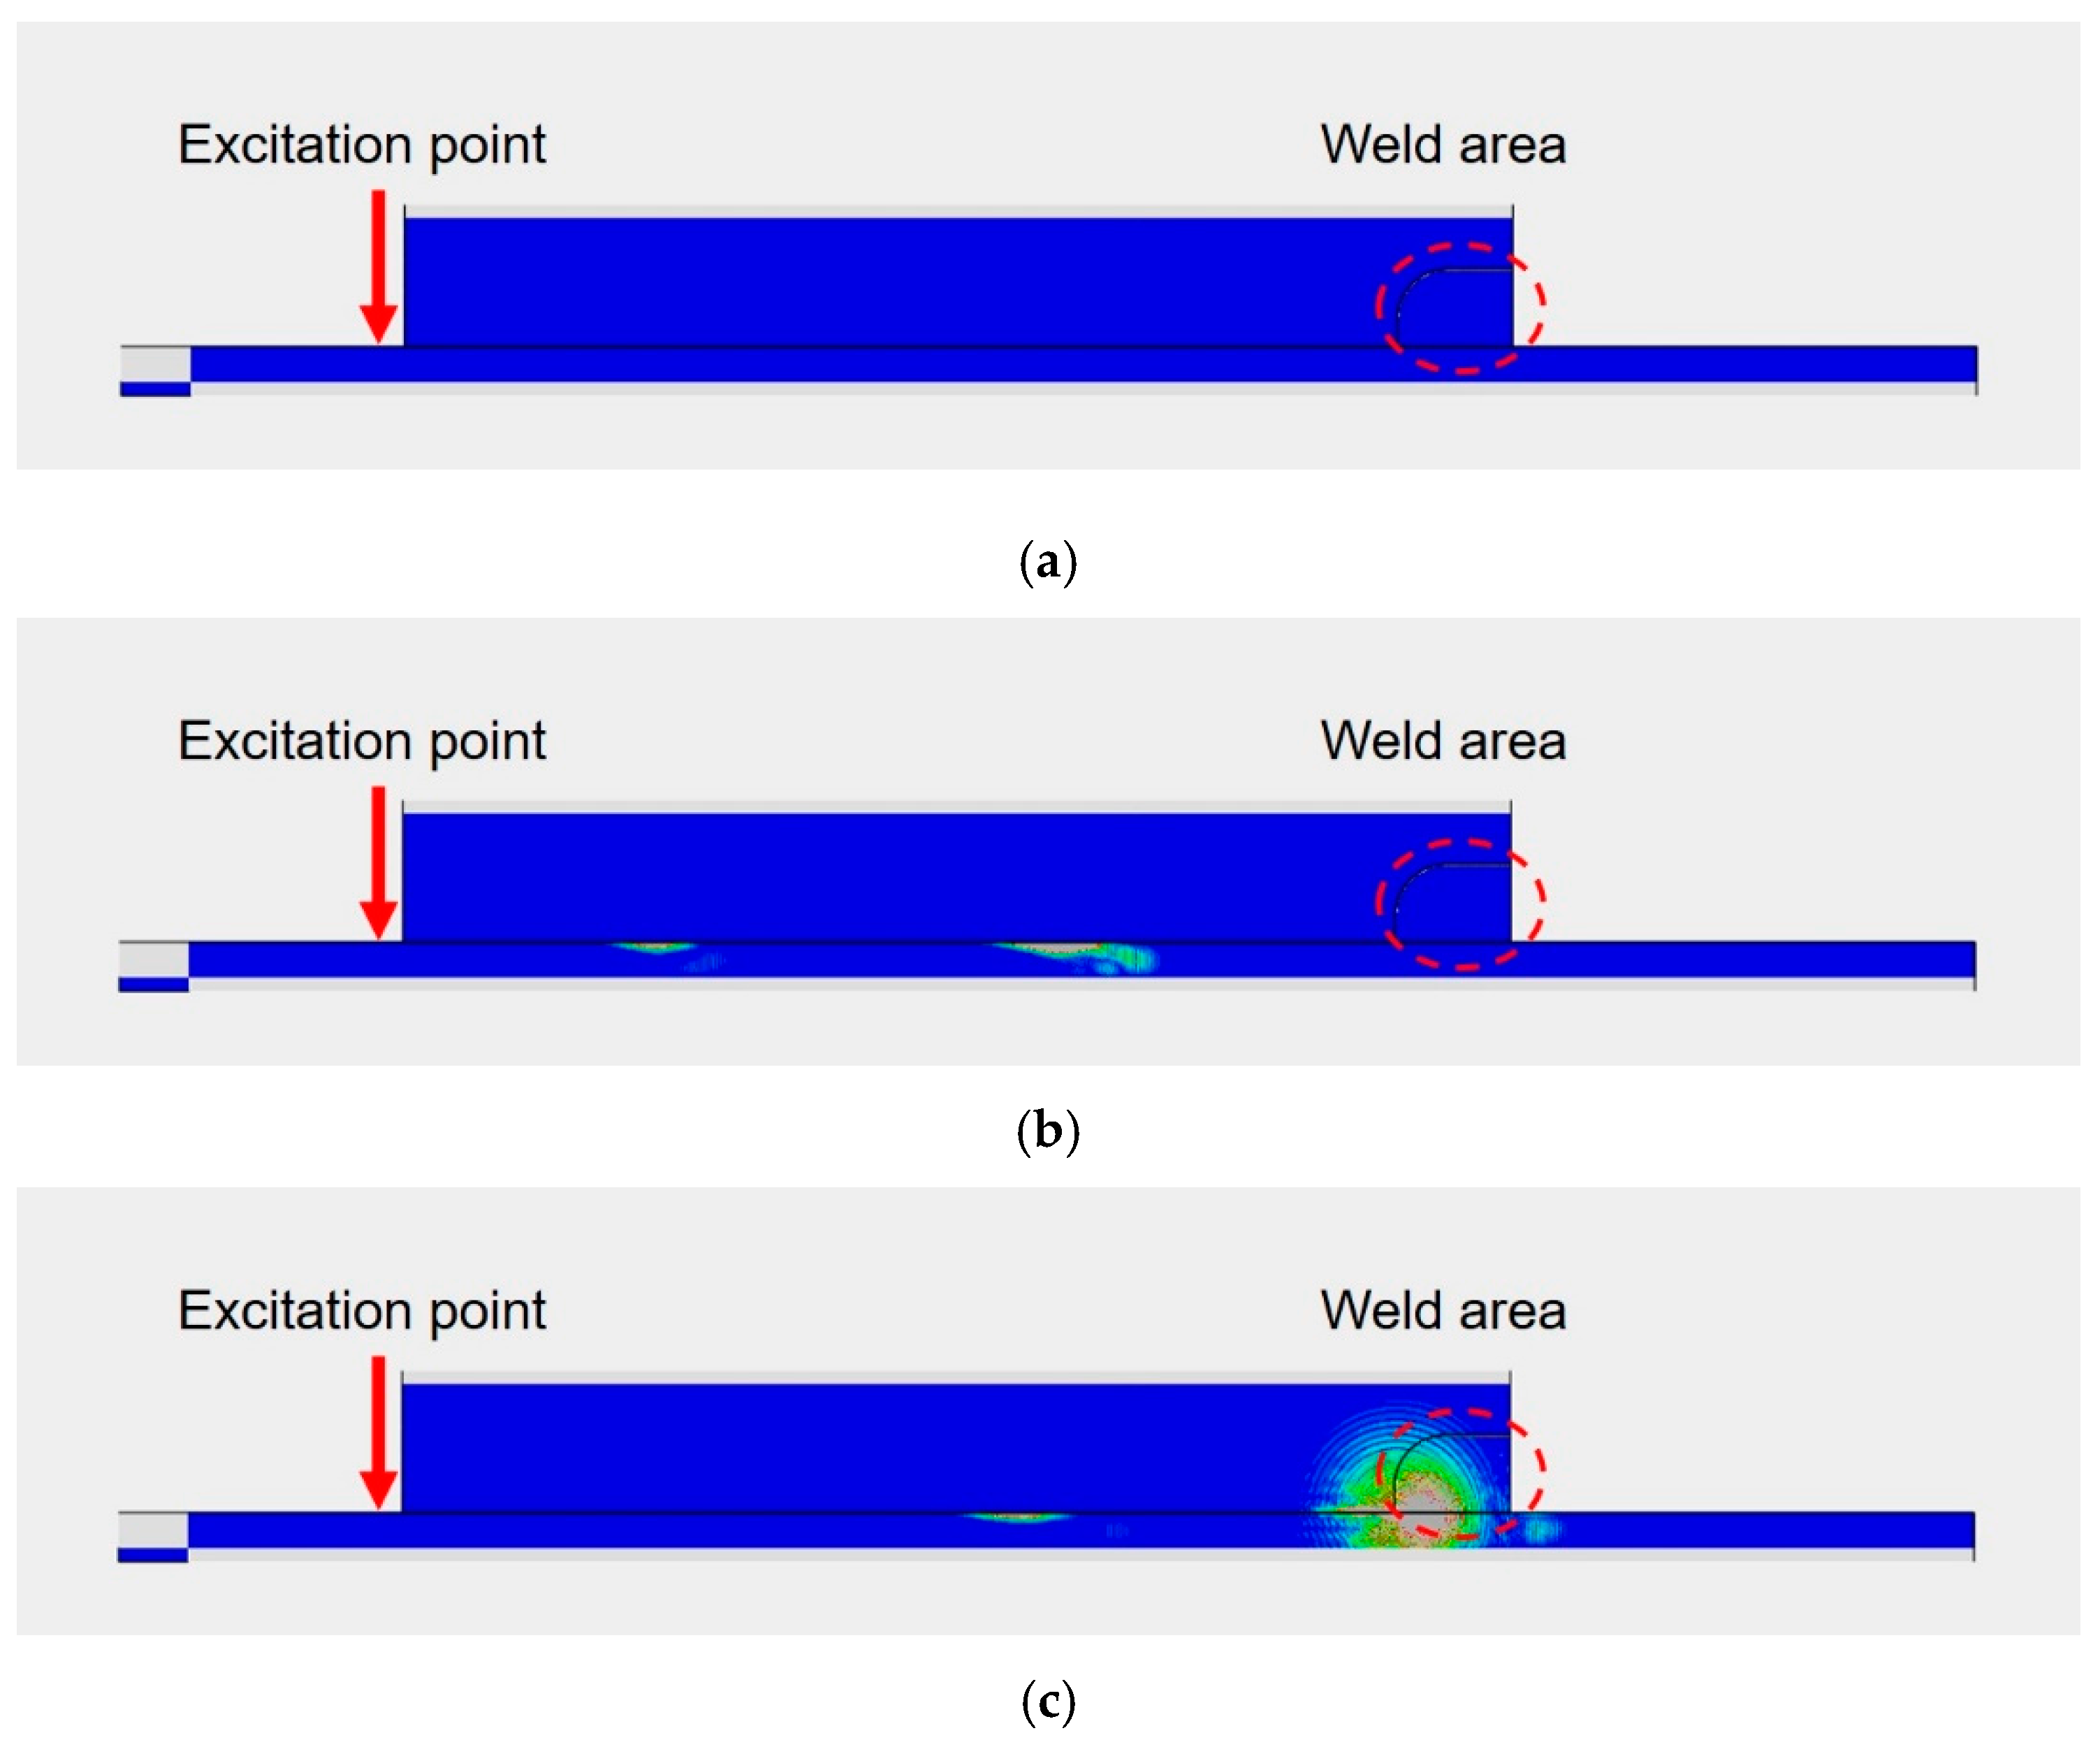
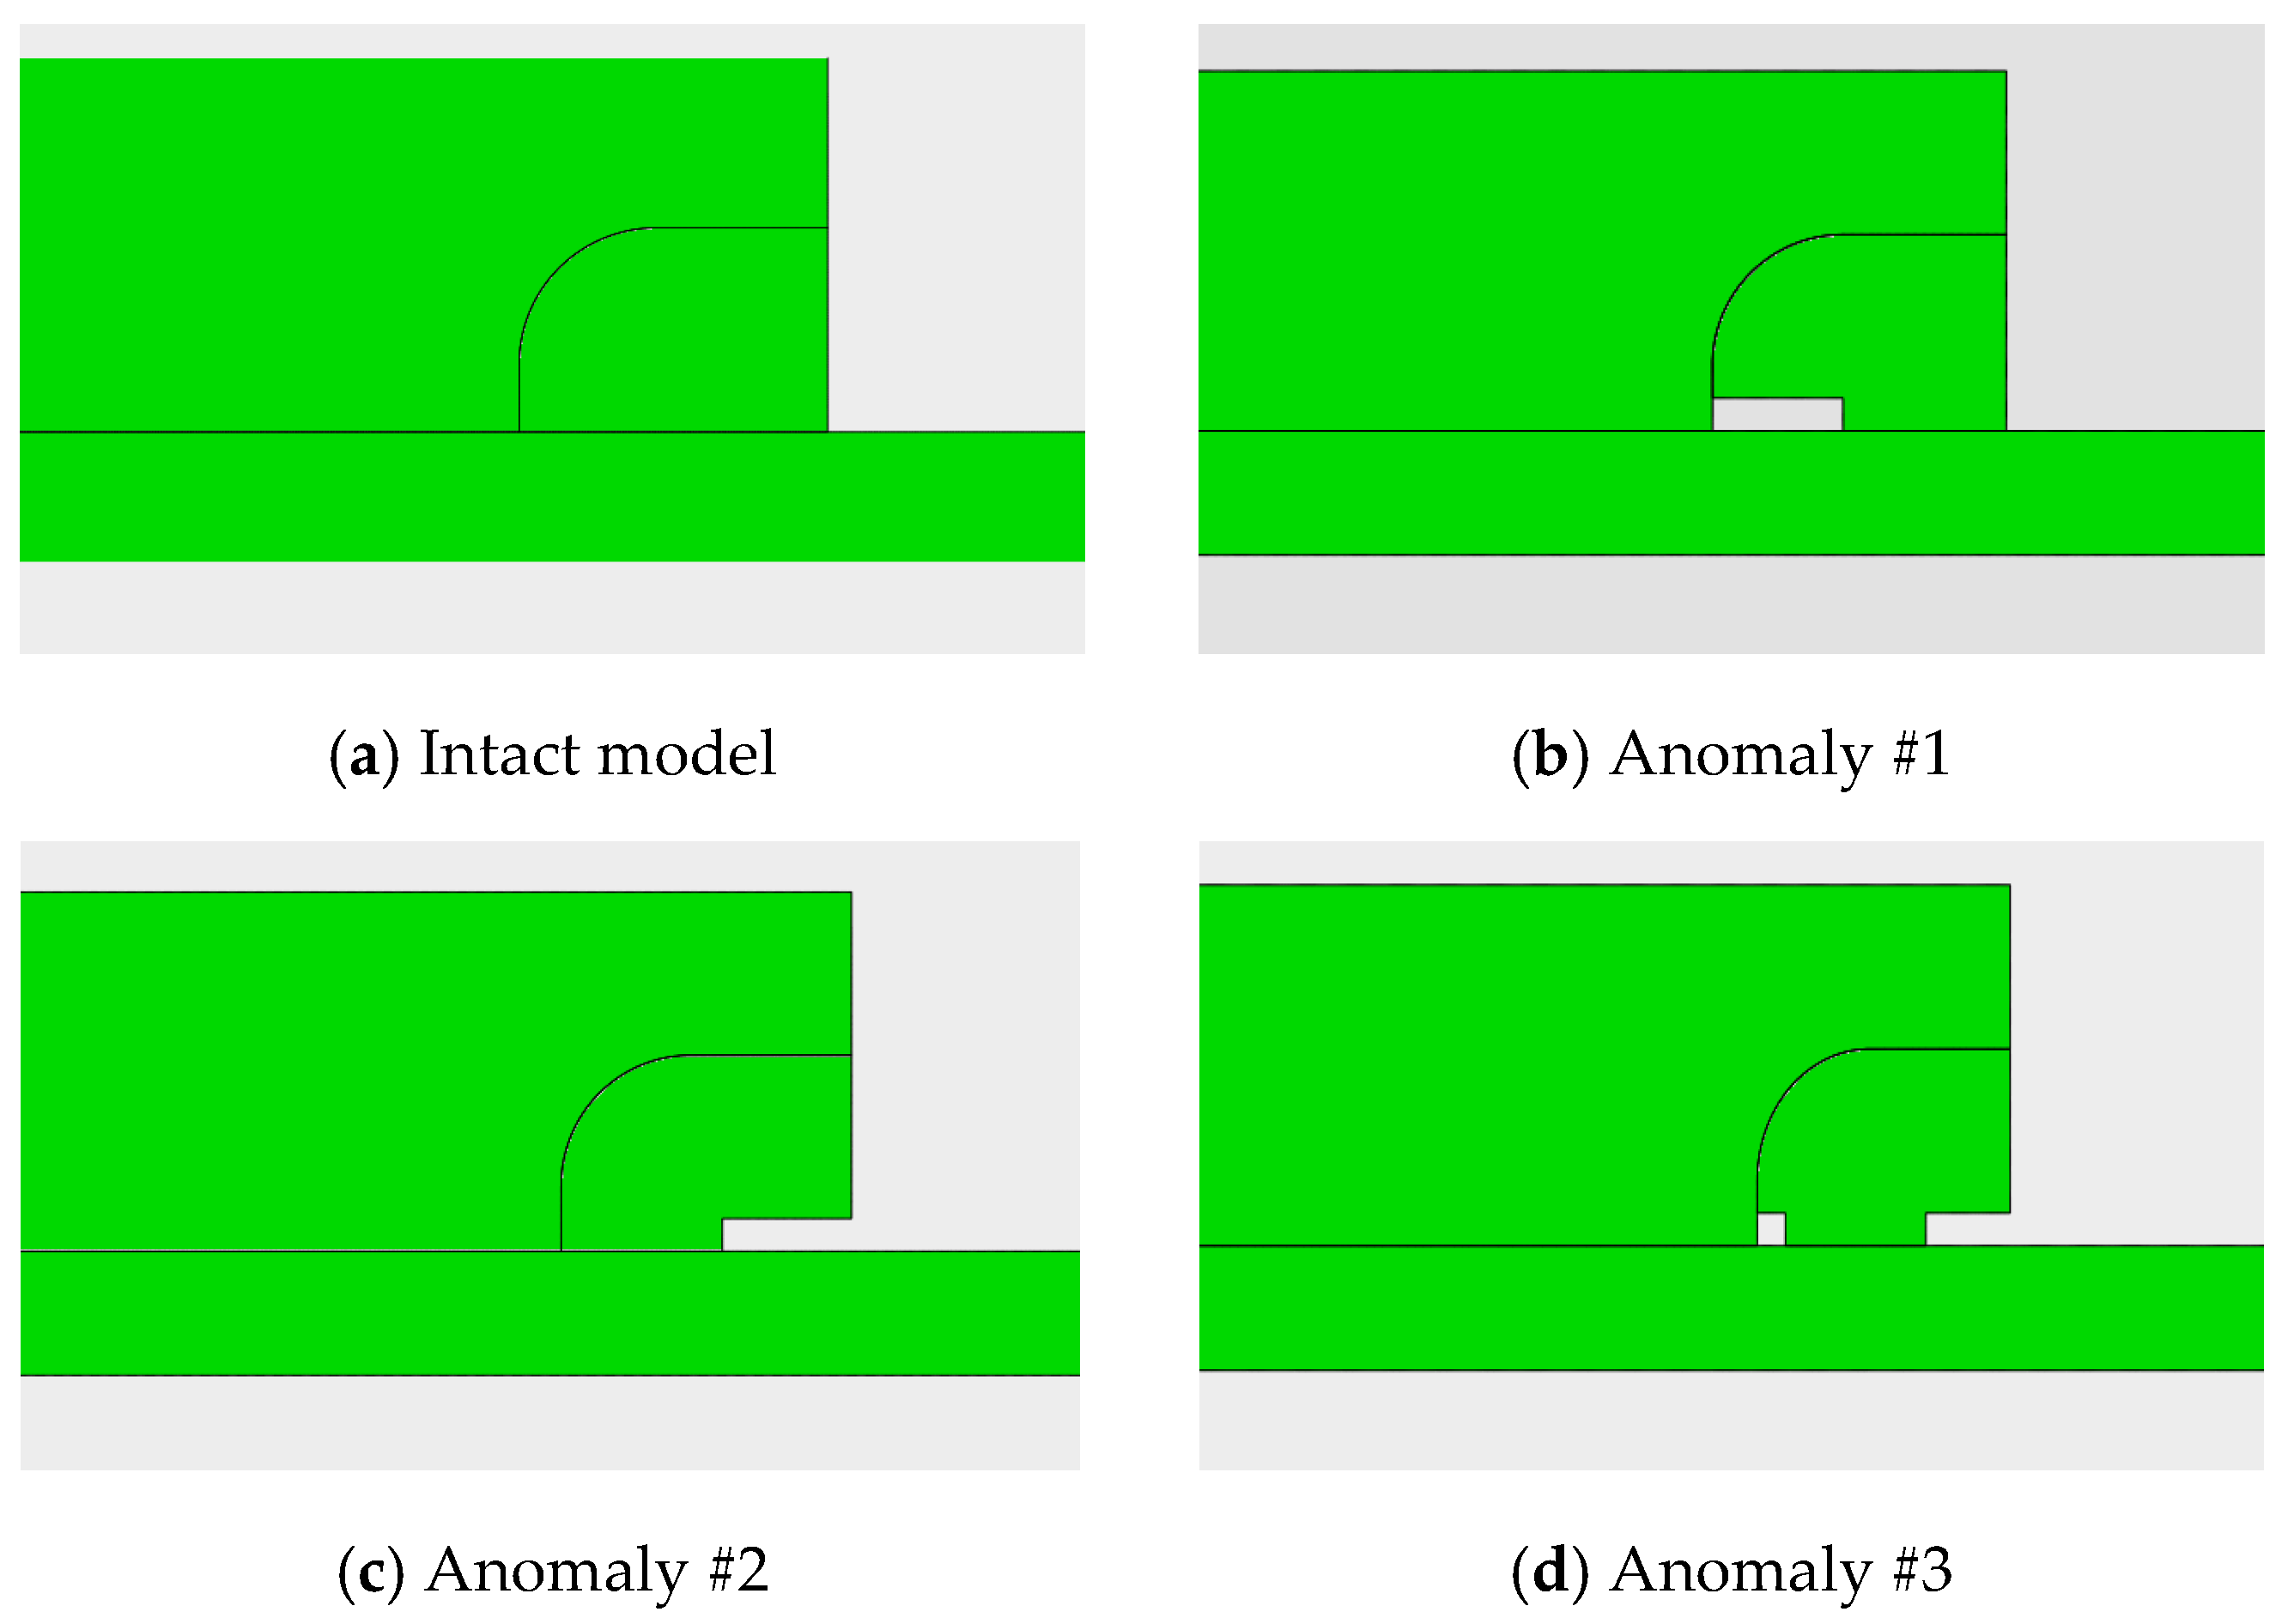
3.1. Finite Element Model Analyis for Reactor Nozzle

Finite element modeling was performed to verify the interface wave propagation pattern and reflection signal analysis using ABAQUS/CAE 6.12 (DASSAULT SYSTEMES, Providence, RI, USA). The detailed specifications of the CEDM nozzle model are shown in Figure 4, and the mesh information is shown in Table 1. The material used for both the reactor head and nozzle is 316 stainless steel. The excitation frequency is 1 MHz, and the wavelength of the interface wave is 0.0027 m. The mesh size is set as 1/10 of the wavelength for proper wave propagation characteristics in the numerical model. The edge of the nozzle and reactor head is set as an absorbing boundary to eliminate an unexpected reflections from the boundary.
The interface waves propagate with strong directivity and less distribution in the circumferential direction [22]. Figure 5 shows the interface wave propagation and reflection from the finite element model of the CEDM nozzle. The interface wave propagation pattern at different times is depicted in Figure 5a–c. The excitation point is on the nozzle surface with the outside of the reactor head and the weld on the reactor head inside the reactor is inspected. The interface wave energy is concentrated at the interface and propagates along the axial direction. The propagation distance of the interface wave is 430 mm from the excitation location, and it is reflected from the boundary of the weld and the end of the reactor head. The interface wave propagation velocity in this study is 2.6 mm/μs.
The finite element model of defects in the nozzle weld is depicted in Figure 6. The J-groove weld is modeled at the end of the nozzle and attached to the reactor head. The interface wave propagates along the boundary of the nozzle and the reactor head. Three different defects are modeled to investigate the reflection from the boundary of the weld and the end of the structure. The defect locations are chosen based on the possibility of defect initiation in the manufacturing process and during operation.
For analysis convenience, each part of the model components is set with a different mesh type. This can help with the computation time and memory. The interface wave is generated on the outside of the reactor head and it propagates along the interface and reflects from the weld and defects. The reflected signals from weld and defects are depicted on Figure 7, which shows the weld and defect reflection signal at each location.
Because two-dimensional models are used, once the interface wave is reflected from the defect, most of the wave energy is scattered. The defects in the weld area are the region of interest in this study. Therefore, only the wave signal that is reflected from the weld area is taken into account for the signal analysis. The first peak is the reflection wave from the boundary of the J-groove weld. Because the boundary and material properties are discontinuous, a large reflection is measured in this area. The transmitted interface wave over the weld is reflected from the boundary of defects and the free end of the specimen.
The second and third peaks are from the defect and free end. The large reflection at the defect and free end is based on the transition of the interface boundary conditions. The numerical model is designed with shrink fit conditions at the interface. However, the boundary of the weld and defects shifts from shrink fit conditions to traction-free boundary conditions. This model analysis indicates the existence and the location of defects.

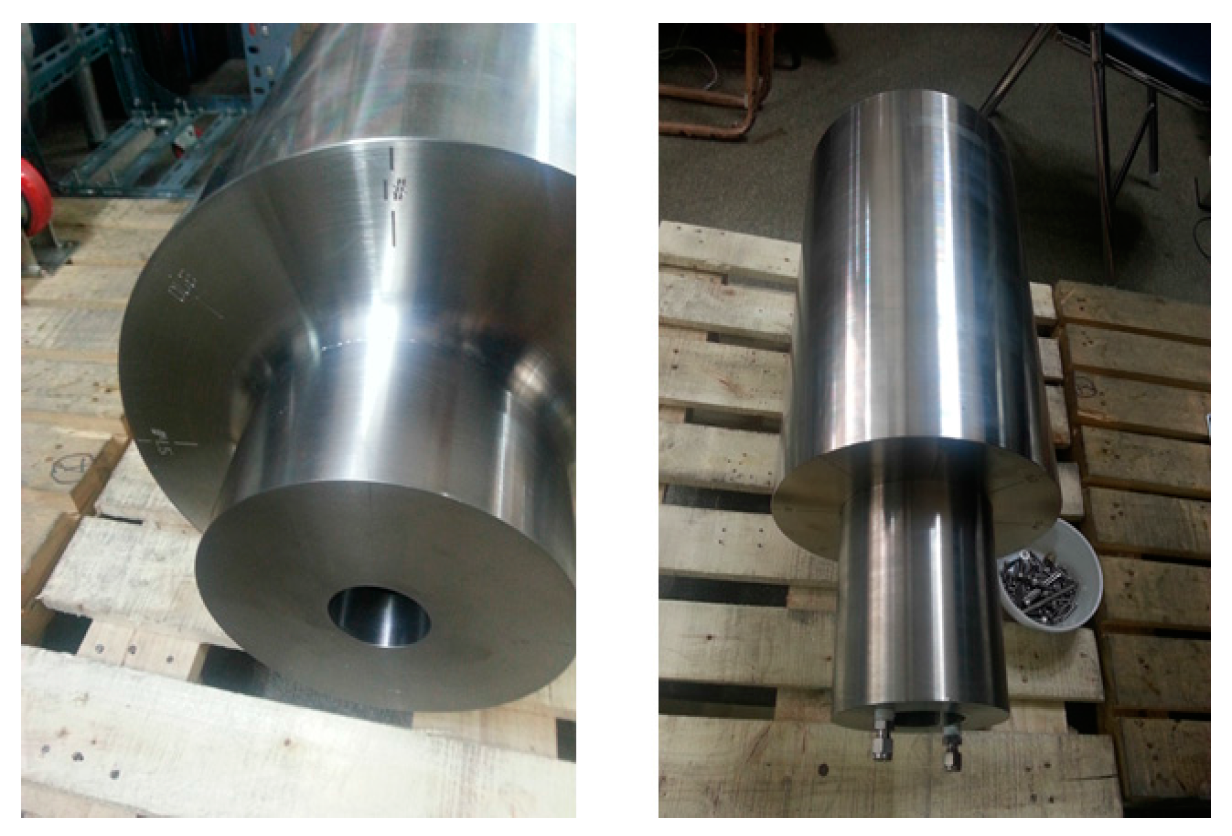
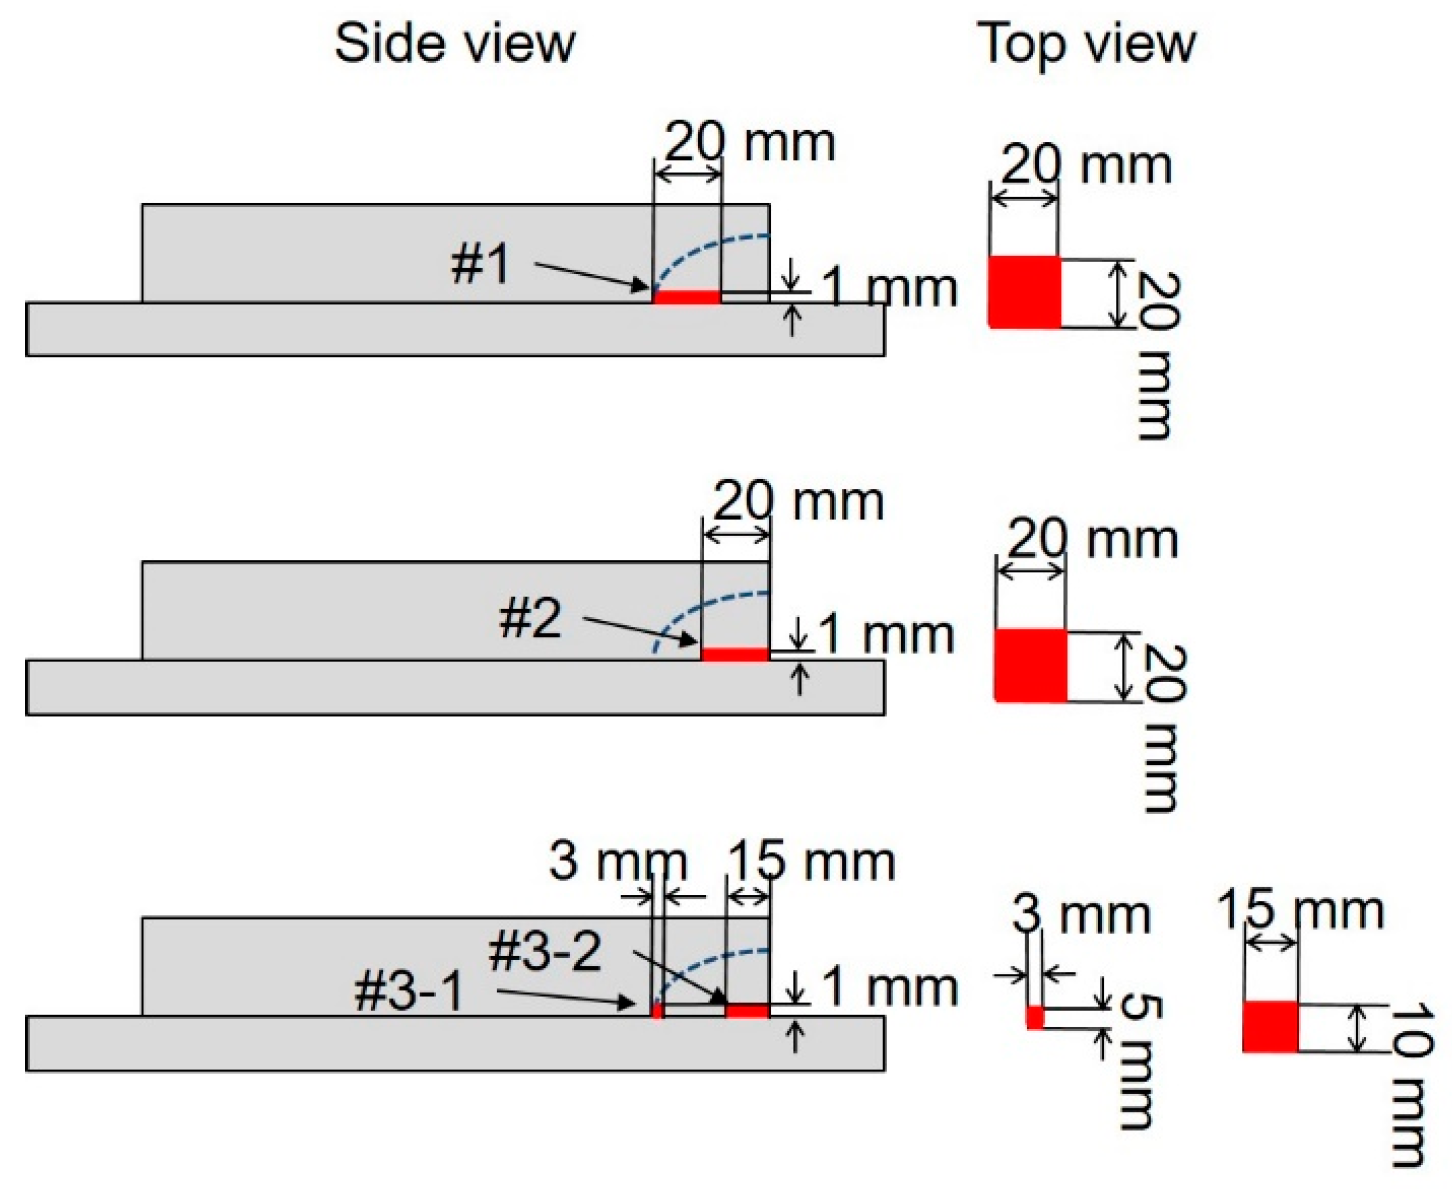
3.2. Experimental Setup and Specimen

The experimental setup is illustrated in Figure 8. The excitation frequency is 1 MHz, and there are four cycles of tone burst wave signals. The high-voltage tone burst signal is generated by a RPR-4000 (RITEC Inc., Warwick, RI, USA). A commercial 1 MHz Piezoeletric (PZT) transducer from Panamatrics (Waltham, MA, USA) was also used. A single transducer works as a transmitter and a receiver.
The specifications of the CEDM nozzle specimen are marked in Figure 8. The thickness of the reactor head is 430 mm and the outer radius of nozzle is 170 mm and its thickness is 20 mm. The material of this specimen is 316 SS. The interface on the reactor head and CEDM nozzle is connected using shrink fit conditions as part of nuclear reactor. One side of the boundary is J-groove welded and the other side is open. Figure 9 shows a picture of a CEDM nozzle specimen with a J-groove weld. The outside of the welded part is ground for surface treatment. The specimen is simplified for the purpose of this study. A real nuclear reactor has s water cooling path inner layer in the nozzle. The complicated inner structures are excluded due to the interface wave propagation characteristics.
To verify the interface wave propagation, a defect was manufactured at the interface of the nozzle and the reactor head. Detailed information about the defects is listed in Table 2. The defect location and size are shown in Figure 10. There are four different defects located at varying locations on the specimen. Two defects are on the same axial line and are used to check the interface wave resolution. The dashed line in Figure 10 indicates the boundary of the J-groove weld.
The results of the interface wave inspection experiment are shown in Figure 11. The excited interface wave is propagated along the interface between the reactor head and nozzle. The peaks below 100 μs are from the banging signal from the transducer itself and the near field reflection of complicated geometry. However, the region of interest is not the near the excitation location. The purpose of this approach is inspection on the weld area distant from the transducer position. Therefore, the reflection signal below 250 μs can be ignored in this study. For the purpose of near field inspection, however, the reflections before approaching the weld area should be considered. The total wave propagation signal is depicted in Figure 11a. The reflection signal of the time of flight of interest is 290 μs to 350 μs. The reflection from the boundary of the weld and the end of the reactor head is included in this time zone.
In Figure 11b, the signals from the weld and end of structure are clearly marked. The reflection from the defects appear at the location of the defect. The extracted peak value shows the defect location. In the case of Defect #1 it shows a clear reflection signal of the weld boundary and the defect due to the simple geometry. A large amount wave energy is reflected from the first discontinuous boundary at 298 μs and a similar amount energy is echoed at the end of the defect boundary at 315 μs. The finite element model analysis results in Figure 7 and experimental results in Figure 11 show good agreement with each other. Both of Finite Element Method (FEM) and experimental results have two peaks from the boundary of the weld and the end of reactor head. From each defect the reflection ratio between the first and second peaks are very different comparing the defective cases and the intact case.

4. Discussion

Defect investigation was performed for the J-groove weld in a nuclear reactor nozzle by the finite element method and an experimental approach based on interface waves. The interface boundary was modeled by the finite element method, and the wave propagation characteristics of the reflection signal were analyzed. The interface wave propagates along the interface and is reflected from the welds and defects. The experimental and numerical results show a flight time difference in the axial direction propagation. The defect location can be estimated by calculating this time of flight difference. The reflected signal pattern shows good agreement between the numerical analysis and experimental validation. It is expected that the present technique can become a promising alternative for inaccessible areas such as the shrink fit weld nozzles in a nuclear reactor.

Acknowledgments

The research was sponsored by a grant from the R&D Program of the Korea Railroad Research Institute and the National Research Foundation of Korea (NRF) grant funded by the Korea government (MSIP) (No. 2016M2A2A9A03913295), Republic of Korea. The opinions expressed in this paper are those of the authors and do not necessarily reflect the views of the sponsors.

Author Contributions

Jaesun Lee designed the methodology, implemented the simulations and experiments, and wrote the manuscript. Younho Cho prepared the specimen for the experiment, gave guidance, and helped to improve the quality of the manuscript.

Conflicts of Interest

The authors declare no conflict of interest.

References

  1. Gofuku, A. Integrated diagnostic technique for nuclear power plants. Nucl. Eng. Technol. 2014, 46, 725–736. [Google Scholar] [CrossRef]
  2. Yamamoto, S.; Semboshi, J.; Sugawara, A.; Ochiai, M.; Tsuchihashi, K.; Adachi, H.; Higuma, K. Phased array ultrasonic inspection technique for cast austenitic stainless steel parts of nuclear power plants. In Proceedings of the 24th International Conference on Nuclear Engineering, Charlotte, NC, USA, 26–30 June 2016. [Google Scholar]
  3. Lee, J.-H.; Lee, M.-R.; Kim, J.-T.; Luk, V.; Jung, Y.-H. A study of the characteristics of the acoustic emission signals for condition monitoring of check valves in nuclear power plants. Nucl. Eng. Des. 2006, 236, 1411–1421. [Google Scholar] [CrossRef]
  4. Ghosh, A.; Varde, P.; Satheesh, C. Prognostics & health management of swing type check valves. Int. J. Emerg. Technol. Adv. Eng. 2013, 3, 374–382. [Google Scholar]
  5. Alleyne, D.; Cawley, P. The excitation of lamb waves in pipes using dry-coupled piezoelectric transducers. J. Nondestruct. Eval. 1996, 15, 11–20. [Google Scholar] [CrossRef]
  6. Rose, J.L.; Cho, Y.; Ditri, J.J. Cylindrical guided wave leakage due to liquid loading. Rev. Prog. Quant. Nondestruct. Eval. 1994, 13, 259. [Google Scholar]
  7. Cheong, Y.-M.; Lee, D.-H.; Jung, H.-K. Ultrasonic guided wave parameters for detection of axial cracks in feeder pipes of phwr nuclear power plants. Ultrasonics 2004, 42, 883–888. [Google Scholar] [CrossRef] [PubMed]
  8. Yang, J.; Lee, H.; Lim, H.J.; Kim, N.; Yeo, H.; Sohn, H. Development of a fiber-guided laser ultrasonic system resilient to high temperature and gamma radiation for nuclear power plant pipe monitoring. Meas. Sci. Technol. 2013, 24. [Google Scholar] [CrossRef]
  9. Van Velsor, J.; Royer, R.; Owens, S.; Rose, J. A magnetostrictive phased array system for guided wave testing and structural health monitoring of pipe. Mater. Eval. 2013, 71, 11. [Google Scholar]
  10. Kang, S.-S.; Hwang, S.-S.; Kim, H.-P.; Lim, Y.-S.; Kim, J.-S. The experience and analysis of vent pipe PWSCC (primary water stress corrosion cracking) in pwr vessel head penetration. Nucl. Eng. Des. 2014, 269, 291–298. [Google Scholar] [CrossRef]
  11. Rose, J.L.; Rajana, K.M.; Carr, F.T. Ultrasonic guided wave inspection concepts for steam generator tubing. Mater. Eval. 1994, 52, 307–311. [Google Scholar]
  12. Xin, J.; Lei, N.; Udpa, L.; Udpa, S.S. Rotating field eddy current probe with bobbin pickup coil for steam generator tubes inspection. NDT E Int. 2013, 54, 45–55. [Google Scholar] [CrossRef]
  13. Pasadas, D.J.; Rocha, T.J.; Ramos, H.G.; Ribeiro, A.L. Remote field eddy current inspection of metallic tubes using GMR sensors. In Proceedings of the IEEE International Instrumentation and Measurement Technology Conference (I2MTC), Minneapolis, MN, USA, 6–9 May 2013; pp. 296–299. [Google Scholar]
  14. Hwang, W.; Bae, S.; Kim, J.; Kang, S.; Kwag, N.; Lee, B. Acoustic emission characteristics of stress corrosion cracks in a type 304 stainless steel tube. Nucl. Eng. Technol. 2015, 47, 454–460. [Google Scholar] [CrossRef]
  15. Nishiyamaa, N.; Kotakeb, S.; Uzawa, M. In-service inspection and repair program for commercialized sodium-cooled fast reactor. In Proceedings of the International Conference on Fast Reactors and Related Fuel Cycles (FR 2009), Kyoto, Japan, 7–11 December 2009; Volume 357. [Google Scholar]
  16. Shin, H.; Seo, Y.C.; Jung, K.M.; Lee, S.U.; Kim, S.; Park, K.S. Development of guide system for a reactor head maintenance robot. In Proceedings of the Transactions of the Korean Nuclear Society Autumn Meeting, Busan, Korea, 27–28 October 2005. [Google Scholar]
  17. Liu, Q.; Wang, G.; Dong, Y.; Liu, P.; Sun, J.; Wu, X.; Xu, Y. A novel nuclear station inspection robot. In Proceedings of the 4th IEEE International Conference on Information Science and Technology, Shenzhen, China, 26–28 April 2014; pp. 678–681. [Google Scholar]
  18. Schmidt, D.; Berns, K. Climbing robots for maintenance and inspections of vertical structures—A survey of design aspects and technologies. Robot. Auton. Syst. 2013, 61, 1288–1305. [Google Scholar] [CrossRef]
  19. Kim, S.; Kim, C.H.; Bae, Y.-G.; Na, H.; Jung, S. NDT inspection mobile robot with spiral driven mechanism in pipes. In Proceedings of the 44th International Symposium on Robotics (ISR), Seoul, Korea, 24–26 October 2013. [Google Scholar]
  20. Lee, J.-H.; Han, S.; Ahn, J.; Kim, D.-H.; Moon, H. Two-module robotic pipe inspection system with emats. Smart Struct. Syst. 2014, 13, 1041–1063. [Google Scholar] [CrossRef]
  21. Lee, J.; Cho, Y.; Park, J.-P.; Rose, J.L.; Huh, H.; Park, K.-B.; Kim, D.-O. A study on nondestructive evaluation technique by the use of interface guided waves on shrink fit structure. Aip Conf. Proc. 2014, 1581, 353–357. [Google Scholar]
  22. Lee, J.; Park, J.; Cho, Y. A novel ultrasonic nde for shrink fit welded structures using interface waves. Ultrasonics 2016, 68, 1–7. [Google Scholar] [CrossRef] [PubMed]
  23. Scholte, J. The range of existence of rayleigh and stoneley waves. Geophys. J. Int. 1947, 5, 120–126. [Google Scholar] [CrossRef]
  24. Yu, L.; Tian, Z. Case study of guided wave propagation in a one-side water-immersed steel plate. Case Stud. Nondestruct. Test. Eval. 2015, 3, 1–8. [Google Scholar] [CrossRef]
  25. Pistone, E.; Rizzo, P. On the use of an array of ultrasonic immersion transducers for the nondestructive testing of immersed plates. Nondestruct. Test. Eval. 2015, 30, 26–38. [Google Scholar] [CrossRef]
  26. Pistone, E.; Li, K.; Rizzo, P. Noncontact monitoring of immersed plates by means of laser-induced ultrasounds. Struct. Health Monit. 2013, 12, 549–565. [Google Scholar] [CrossRef]
  27. Cegla, F.; Cawley, P.; Lowe, M. Material property measurement using the quasi-scholte mode—A waveguide sensor. J. Acoust. Soc. Am. 2005, 117, 1098–1107. [Google Scholar] [CrossRef]
  28. Cegla, F.; Cawley, P.; Lowe, M. Fluid bulk velocity and attenuation measurements in non-newtonian liquids using a dipstick sensor. Meas. Sci. Technol. 2005, 17. [Google Scholar] [CrossRef]
  29. Stoneley, R. Elastic waves at the surface of separation of two solids. Proc. R. Soc. Lond. 1924, 106, 416–428. [Google Scholar] [CrossRef]
  30. Rauch, D. On the role of bottom interface waves in ocean seismo-acoustics: A review. In Ocean Seismo-Acoustics; Springer: New York, NY, USA, 1986; pp. 623–641. [Google Scholar]
  31. Meegan, G.; Hamilton, M.; Il’inskii, Y.A.; Zabolotskaya, E. Nonlinear stoneley and scholte waves. J. Acoust. Soc. Am. 1999, 106, 1712–1723. [Google Scholar] [CrossRef]
  32. Declercq, N.F.; Degrieck, J.; Briers, R.; Leroy, O. Diffraction of homogeneous and inhomogeneous plane waves on a doubly corrugated liquid/solid interface. Ultrasonics 2005, 43, 605–618. [Google Scholar] [CrossRef] [PubMed]
  33. Li, B.; Qiang, L.; Lu, T.; Geng, X.; Li, M. A stoneley wave method to detect interlaminar damage of metal layer composite pipe. Front. Mech. Eng. 2015, 10, 89–94. [Google Scholar] [CrossRef]
  34. Moiseyenko, R.P.; Declercq, N.F.; Laude, V. Guided wave propagation along the surface of a one-dimensional solid-fluid phononic crystal. J. Phys. D Appl. Phys. 2013, 46. [Google Scholar] [CrossRef]
  35. Rose, J.L. Ultrasonic Guided Waves in Solid Media; Cambridge University Press: Cambridge, UK, 2014. [Google Scholar]
  36. Achenbach, J. Wave Propagation in Elastic Solids; Elsevier: Amsterdam, The Netherlands, 1984. [Google Scholar]
Figure 1. Coordinates of interface medium 1 and medium 2.
Energies 10 00589 g001
Figure 2. Wave amplitude distributions in the thickness direction, (a) theoretical analysis, and (b) finite element analysis. Square symbols indicate u(z), and triangle symbols represent w(z).
Energies 10 00589 g002
Figure 3. Schematic of an integrated small modular reactor system.
Energies 10 00589 g003
Figure 4. Interface wave propagation model of the CEDM nozzle model.
Energies 10 00589 g004
Figure 5. Interface wave propagation model of the CEDM nozzle model of finite element analysis at (a) initial moment; (b) 100 μs and (c) 150 μs.
Energies 10 00589 g005
Figure 6. Nozzle weld model (a) Intact model; (bd) anomalies.
Energies 10 00589 g006
Figure 7. Finite element model analysis signals. (a) Wave propagation signal of reflection from the weld and edge; (b) Enlarged wave signal from 270 μs to 350 μs of interesting region; (c) Wave envelop of reflection from the weld and defects; (d) Peaks at wave envelop of reflection from the weld and defects.
Energies 10 00589 g007
Figure 8. CEDM nozzle inspection system.
Energies 10 00589 g008
Figure 9. CEDM nozzle specimen with a J-groove weld.
Energies 10 00589 g009
Figure 10. Defect location and shape on a lateral view of specimen.
Energies 10 00589 g010
Figure 11. CEDM weld specimen inspection signal. (a) Wave propagation signal of reflection from the weld and edge; (b) Enlarged wave signal from 270 μs to 350 μs of interesting region; (c) Wave envelop of reflection from the weld and defects; (d) Peaks at wave envelop of reflection from the weld and defects.
Energies 10 00589 g011
Table 1. CEDM nozzle modeling specifications.
Frequency1 MHz
Wavelength0.0027 m
Mesh Size0.00027 m
Element TypeCPE4R (plane strain conditions)
Table 2. The defect information of the CEDM nozzle specimen.
DefectAxial Size (mm)Circumferential Size (mm)Radius Size (mm)
#120201
#220201
#3-1351
#3-215101

