
A Method for Thermal Dimensioning and for Energy Behavior Evaluation of a Building Envelope PCM Layer by Using the Characteristic Days


Department of Mechanical, Energy and Management Engineering (DIMEG), University of Calabria, P. Bucci 46/C, Rende, 87036 Cosenza, Italy
*
Author to whom correspondence should be addressed.
Energies 2017, 10(5), 659; https://doi.org/10.3390/en10050659
Submission received: 30 March 2017
/
Revised: 25 April 2017
/
Accepted: 5 May 2017
/
Published: 9 May 2017
(This article belongs to the Section D: Energy Storage and Application)
Abstract
:Net zero energy buildings (nZEB) require the development of innovative technologies such as the use of phase change materials (PCMs) in walls for the energy requalification of low inertia buildings. The presence of a PCM layer in the external building wall, due to the effect of storage and release of latent energy phenomena, modifies the energy behavior, both during the summer and winter periods. This paper addresses the problem of the definition of the energetic behavior of a layer subject to phase change with periodic non-sinusoidal boundary conditions, characterizing the external walls of air-conditioned buildings. In such conditions, the layer is the site of the formation of one or more bi-phase interfaces, which originate on the boundary surfaces, or are always present and fluctuate within the layer. It is also possible that the layer does not undergo any phase change. The study has been developed by a finite difference numeric calculation model which explicitly determines the number and the position of the bi-phase interfaces that originate in the layer and the temperature and the heat flux fields. The surface heat fluxes are used to evaluate the PCM layer energetic behavior in terms of energy transferred through the boundary surfaces and of stored energy in sensible and latent form. The proposed method employs the characteristic day that it is periodically repeated for all the days of the considered month. The use of the characteristic days drastically reduces the computational burden of the numerical calculation and it allows to obtain guidance on the behaviour of the PCM throughout the year, in accordance with the variability of external climatic conditions, in order to select the PCM with the most suitable thermophysical properties. The methodology developed is applied to PCM layers with different melting temperatures and subject to climatic conditions of two locations, one with a continental climate and the second one with a Mediterranean climate. The results obtained allowed us to identify which PCM is more suitable in improving the energetic performances of building walls in the heating or cooling period during the year. In particular, the energy analysis highlighted that, in both localities, during the winter period: the lowest energy exiting from the indoor environment is ensured by a PCM with a melting temperature of 15 °C; the highest contribution of energy entering the indoor environment, mainly due to solar radiation, is recorded for a PCM with a melting temperature of 26 °C. During the summer period: the lowest value of energy entering the indoor environment is obtained by a PCM with melting temperature of 26 °C; the highest value of energy exiting from the indoor environment is ensured by a melting temperature equal to 20 °C. In both locations, a PCM with a melting temperature intermediate between those of the winter and summer set points of the indoor environment is the best compromise between winter and summer energy needs for an air-conditioned environment, as it allows obtainment of the highest values of the yearly total stored energy.
1. Introduction
Thermal energy storage (TES) technologies, such as phase change materials (PCMs), are considered one of the proper materials for achieving nZEB targets. The recent reviews of Souayfane et al. [1] and of Zhou et al. [2] highlight that, in recent decades, different passive and active technology systems with PCM were realized to improve the energy efficiency in the building envelope and to contain the temperature fluctuations in the indoor environment within a specific comfort range. Passive systems include PCM in building envelopes, i.e., walls, roofs, floors and windows as part of the building materials or as a building component. In the first case, PCMs are incorporated in a building construction material such as plaster, gypsum plasterboards, bricks, concrete and panels, or are blended with thermal insulations. Some other panels, such as PVC panels, CSM panels, plastic and aluminium foils are also used to encapsulate PCMs. In the second case, the component can be manufactured before the building is being constructed and have a particular design. In contrast to previous passive systems, PCM active systems lead to a better heat transfer coefficient by replacing free convection by forced convection, with the help of small fans, to complete the solidification of the PCM.
PCM provides a high latent energy storage and a reduced temperature range during the solid-liquid phase-change process. PCMs integrated in an external building envelope accumulate solar heating and melt during the daytime, and release the heat stored and solidifies during nighttime, due to the external infrared radiative heat exchange and the reduction of the external air temperature. This prevents overheating during the daytime in warm months and reduces heating needs during nighttime in the winter [3]. PCMs can also be considered as possible solutions to mitigate negative inter-building influences and improve energy efficiency within urban building networks [4]. An effective passive PCM system is able to fully release the accumulated heat during nighttime in warm periods. Ascione et al. [5] found that during the summer, the period where the PCM solidifies would not always be sufficient for the PCM to fully solidify and that during the winter, the heat available during the day would not be enough to completely melt the PCM. Also Halford and Boehm [6] predict that the fraction of the mass melting is relatively low, maximum 5–11%, through most of the expected range of temperatures (307–314 K).
The storage and release of latent energy phenomena are highly dependent on the thermal exchanges between the external surface of building wall and the outdoor environment as well as on the thermal exchanges between the internal surface of building wall and the indoor environment.
Mazzeo et al. [7,8] in previous works have concluded that periodical thermal loadings could lead to one or more bi-phase interfaces originating in the layer. Such multiple bi-phase interfaces and the associated storage and the release processes of latent energy at the melting temperature, compared to the monophase layer, modifies the fluctuant field of the temperature and of the heat flux, both during the summer and winter periods. In particular, the authors have found that the heat flux shows a sharp variation at the beginning and at the end of the phase change at the interested portions of the layer, and the temperature, in the correspondent time period, stays constant. During the process, such modifications propagate also to the adjacent portions not interested by phase change. In these conditions, in a recent work [9], the same authors have defined a new set of parameters to evaluate the effective dynamic thermal behavior of a PCM layer. Such a set of dynamic parameters allows taking into account the modification that the thermal fluctuations undergo on the external and internal surfaces. In particular, the daily maximum excursions change, maximum and minimum peaks undergo a time lag, and in some cases, it can even happen that, in a fraction of the period, the thermal fluctuations are constant. In addition, the fluctuating energy, associated with the fluctuations of the surface heat fluxes, varies.
In energetic terms, the phase change within the layer causes a reduction of the lost energy towards the outdoor environment in the winter period and of the energy that the outdoor environment transfers to the indoor environment during the summer period. For example, studies have reported that PCMs can potentially save 10–30% of the annual cooling and heating loads for buildings in various climate zones in the world. By means of a year-round simulation, Diaconu and Cruceru [10] have studied the annual energy request in Bechar (Algeria) of a room built using a three-layer sandwich-type insulating panel with outer layers consisting of PCM wallboards and a middle layer of conventional thermal insulation. They have found that the reductions of the peak heating and cooling loads are both around 35.4%. The annual energy savings for space heating and cooling are respectively around 12.8% and 1.0%. Wang et al. [11] have evaluated the thermal behavior of a full-scale room with PCM wall in three seasons. The results show: for the summer cases, a reduction of about 0.2 °C and a time delay of about 1–2 h for the maximum interior surface temperature, and a reduction of 24.32% of the cooling load; for the midseason cases, a lower amplitude of the fluctuation of the interior surface temperature; for the winter cases, a reduction respectively of 10–19% and 10–30% of the heating load in continuous and in intermittent regime and of 9–72% of the heat lost in free floating. Chen et al. [12] have demonstrated that using PCM, when the phase change temperature is set at 23 °C, the thickness at 30 mm, the phase change enthalpy at 60 kJ/kg and the heating temperature at 20 °C, the energy saving rate of heating season can reach up to 17% or higher during a whole winter in Beijing, China. Qureshi et al. [13] have monitored a test facility at the University of Auckland (New Zealand) consisting of two identical offices; the first one has walls and ceilings finished with gypsum boards impregnated with PCM. The authors have concluded that, during the days characterized by lower average ambient temperatures and high solar radiation, the energy requirement for heating decreases to around 31%. Peippo et al. [14] have found that, through the use of passive solar heating with a PCM wall in a room of a residential building, direct energy savings of 5–20% could be expected, in Helsinki, Finland and Madison, Wisconsin. Athienitis et al. [15] have obtained a total heating load reduction of approximately 15% in Montreal in a passive solar test-room in which gypsum board is impregnated with a PCM. In the same locality, by means of a system that can simultaneously and efficiently store and manage heat from solar and electric sources, Hammou and Lacroix [16] have attained an electricity consumption for space heating during four consecutive winter months reduced by 32%. Castell et al. [17] have tested macro-encapsulated PCMs in typical Mediterranean building technologies. The authors, with reference to the cooling season, have concluded that the “RT27-Polyurethane cubicle” implied a reduction of 15% compared to the simple Polyurethane one, while the “SP25-Alveolar cubicle” obtained 17% of energy savings compared to the Alveolar solution. Lei et al. [18] have addressed the energy performance of building envelopes integrated with PCM for cooling load reduction in Singapore, with a tropical climate. For the cubic model integrated with 10 mm PCM layer (melting temperature 28 °C) and with an ideal heating, ventilating and air conditioning system (HVAC), they have found that the PCM can effectively reduce heat gains through building envelopes in a range of 21–32% throughout the whole year. Kosny et al. [19] have numerically analyzed a southern-oriented wall for the hot summer period between June 30th and July 3rd in three climatic locations: Warsaw (Poland), Marseille (France) and Cairo (Egypt). They have obtained that for an internal air temperature of 24 °C, hourly peaks of heat gains were reduced by 23–37% for Marseille and 21–25% for Cairo; similar effects were observed for Warsaw.
The studies analyzed reveal that it is indispensable to select the correct phase change temperature in order to optimize the PCM thermal performance when it is integrated in the external walls of the buildings. The optimal phase change temperature in the cooling period is different from that in the heating period. This temperature has been studied by different researchers who have obtained very useful results. From the literature it emerges that, in order to minimize the thermal load of the building or maximize the heat storage, a phase change temperature roughly equal or 1–3 °C higher than the average indoor air temperature is necessary [14,20,21,22,23]. Jiang et al. [24] have proposed a simple analytical method that has been used to estimate in a passive solar room the optimal phase change temperature. This temperature is 1.1–3.3 °C higher than the lower limit of thermal comfort range. Ye et al. [25] have concluded that, in order to maximize the parameter energy saving index (ESI), the melting temperatures in Beijing and Shanghai are about 16 °C and 10 °C, respectively. Diaconu and Cruceru [10] have found that the melting temperature for which the peak of the cooling load reached a minimum is approximately 33.2 °C, while that for which the lowest peak of the heating load and minimum annual energy requirement for heating are, respectively, 19.0 and 19.8 °C. Arnault et al. [26] have obtained an optimal melting temperature to reduce energy cooling consumption of 33.9 °C and to reduce the yearly energy consumed of 26.1 °C. Sun et al. [27] have carried out, for a time period of three summer months in five different climate regions in China, a selection of the optimum melting temperatures of the PCMs, employing both energy and economic criteria, evaluating the energy savings ratio (ESR) and the simple payback period (SPP). Subsequently, the same authors [28] have concluded that the optimal melting temperatures, which resulted in the maximum energy and mass efficiency (EME) in an office building, are 24.1 °C in Shenyang, 25.0 °C in Kunming, 25.3 °C in Zhengzhou and 25.5 °C Changsha, respectively. Thiele et al. [29] have found that: the phase change temperature leading to the maximum energy reduction was equal to the desired indoor temperature regardless of the climate conditions; to achieve the maximum time delay, the optimum phase change temperature rose by increasing the average outdoor temperature. Zhou et al. [30] have stated that the optimal melting temperature depends on both the average outside temperature and the average room temperature.
As evidenced by the scientific literature, the choice of the most appropriate PCM for a given location in the two seasons of air-conditioning requires in-situ experimental testing or dynamic numerical simulations. In the first case, experimental equipment and high monitoring times and costs are required, while in the second case a high computational burden of calculation is required. Furthermore, the aforementioned studies are not generalizable since the choice of the PCM is made for a given building and given weather conditions. The effects produced by a particular PCM vary by varying the locality and, for a given locality, varying the climate conditions over the year. The selection of a PCM based on a specific melting temperature in one climate region will not be appropriate for another. Another critical point is that the PCM behavior should be evaluated under realistic conditions over a long period (on an annual basis), not just over a few days or weeks. Actually, the PCM could work improperly during very hot and sunny days, if solidification is not effectively performed; it could also become useless during cool and cloudy days, if melting is not produced. A study based on a few days of observation might not tackle these issues properly.
All these points induced the authors to elaborate a general methodology for the evaluation of the actual thermal performance of the PCM layer for the improvement of seasonal or annual thermal behavior in buildings. Such a methodology is general, based on a series of energy parameters evaluated in the monthly average day for every month through the year, and summarized on a seasonal and yearly level. It represents a simplified method of thermal dimensioning of the PCM layer that regards the choice of the melting temperature, of the thermophysical properties and of the most appropriate thickness for a given location and season.
This work addresses the issue of the thermal energy exchange of a PCM layer integrated in a vertical building external wall in which one or more bi-phase interfaces are formed, in the hypothesis that the thermal regime is a steady periodic regime. The analyses are developed with an explicit finite difference numerical model, which resolves the equation of conduction in solid phase and liquid phase and the equation of thermal balance at the bi-phase interfaces at the melting temperature. The temperature and heat flux trends on the external and internal surface are employed in order to evaluate the energy behavior of the PCM layer in terms of transferred energy and of stored energy in the layer in the sensible and latent form. The procedure is used in order to evaluate, for each month during the year, upon variation of the PCM melting temperature and of the climatic conditions, the number of bi-phase interfaces which are formed in the layer, the monthly and the seasonal values of the transferred energy, and the monthly and the yearly values of the stored energy in latent and sensible form.
2. Methodology
2.1. Calculation Model
The numerical model and the algorithm used in this study for the determination of the thermal field in the layer, of the position of the several bi-phase interfaces in the layer, and of the configuration of the phases was extensively described by Mazzeo et al. in a previous work [8].
The authors used an explicit finite difference numerical model to solve the equations system: (i) the general equation of heat conduction in the solid phase and in the liquid phase (Equation (1)); (ii) the thermal balance equation at the bi-phase interface (Equation (2)); (iii) temperature continuity at the bi-phase interface (Equation (3)); (iv) boundary conditions on the external surface (Equation (4)); (v) boundary conditions on the internal surface (Equation (5)).
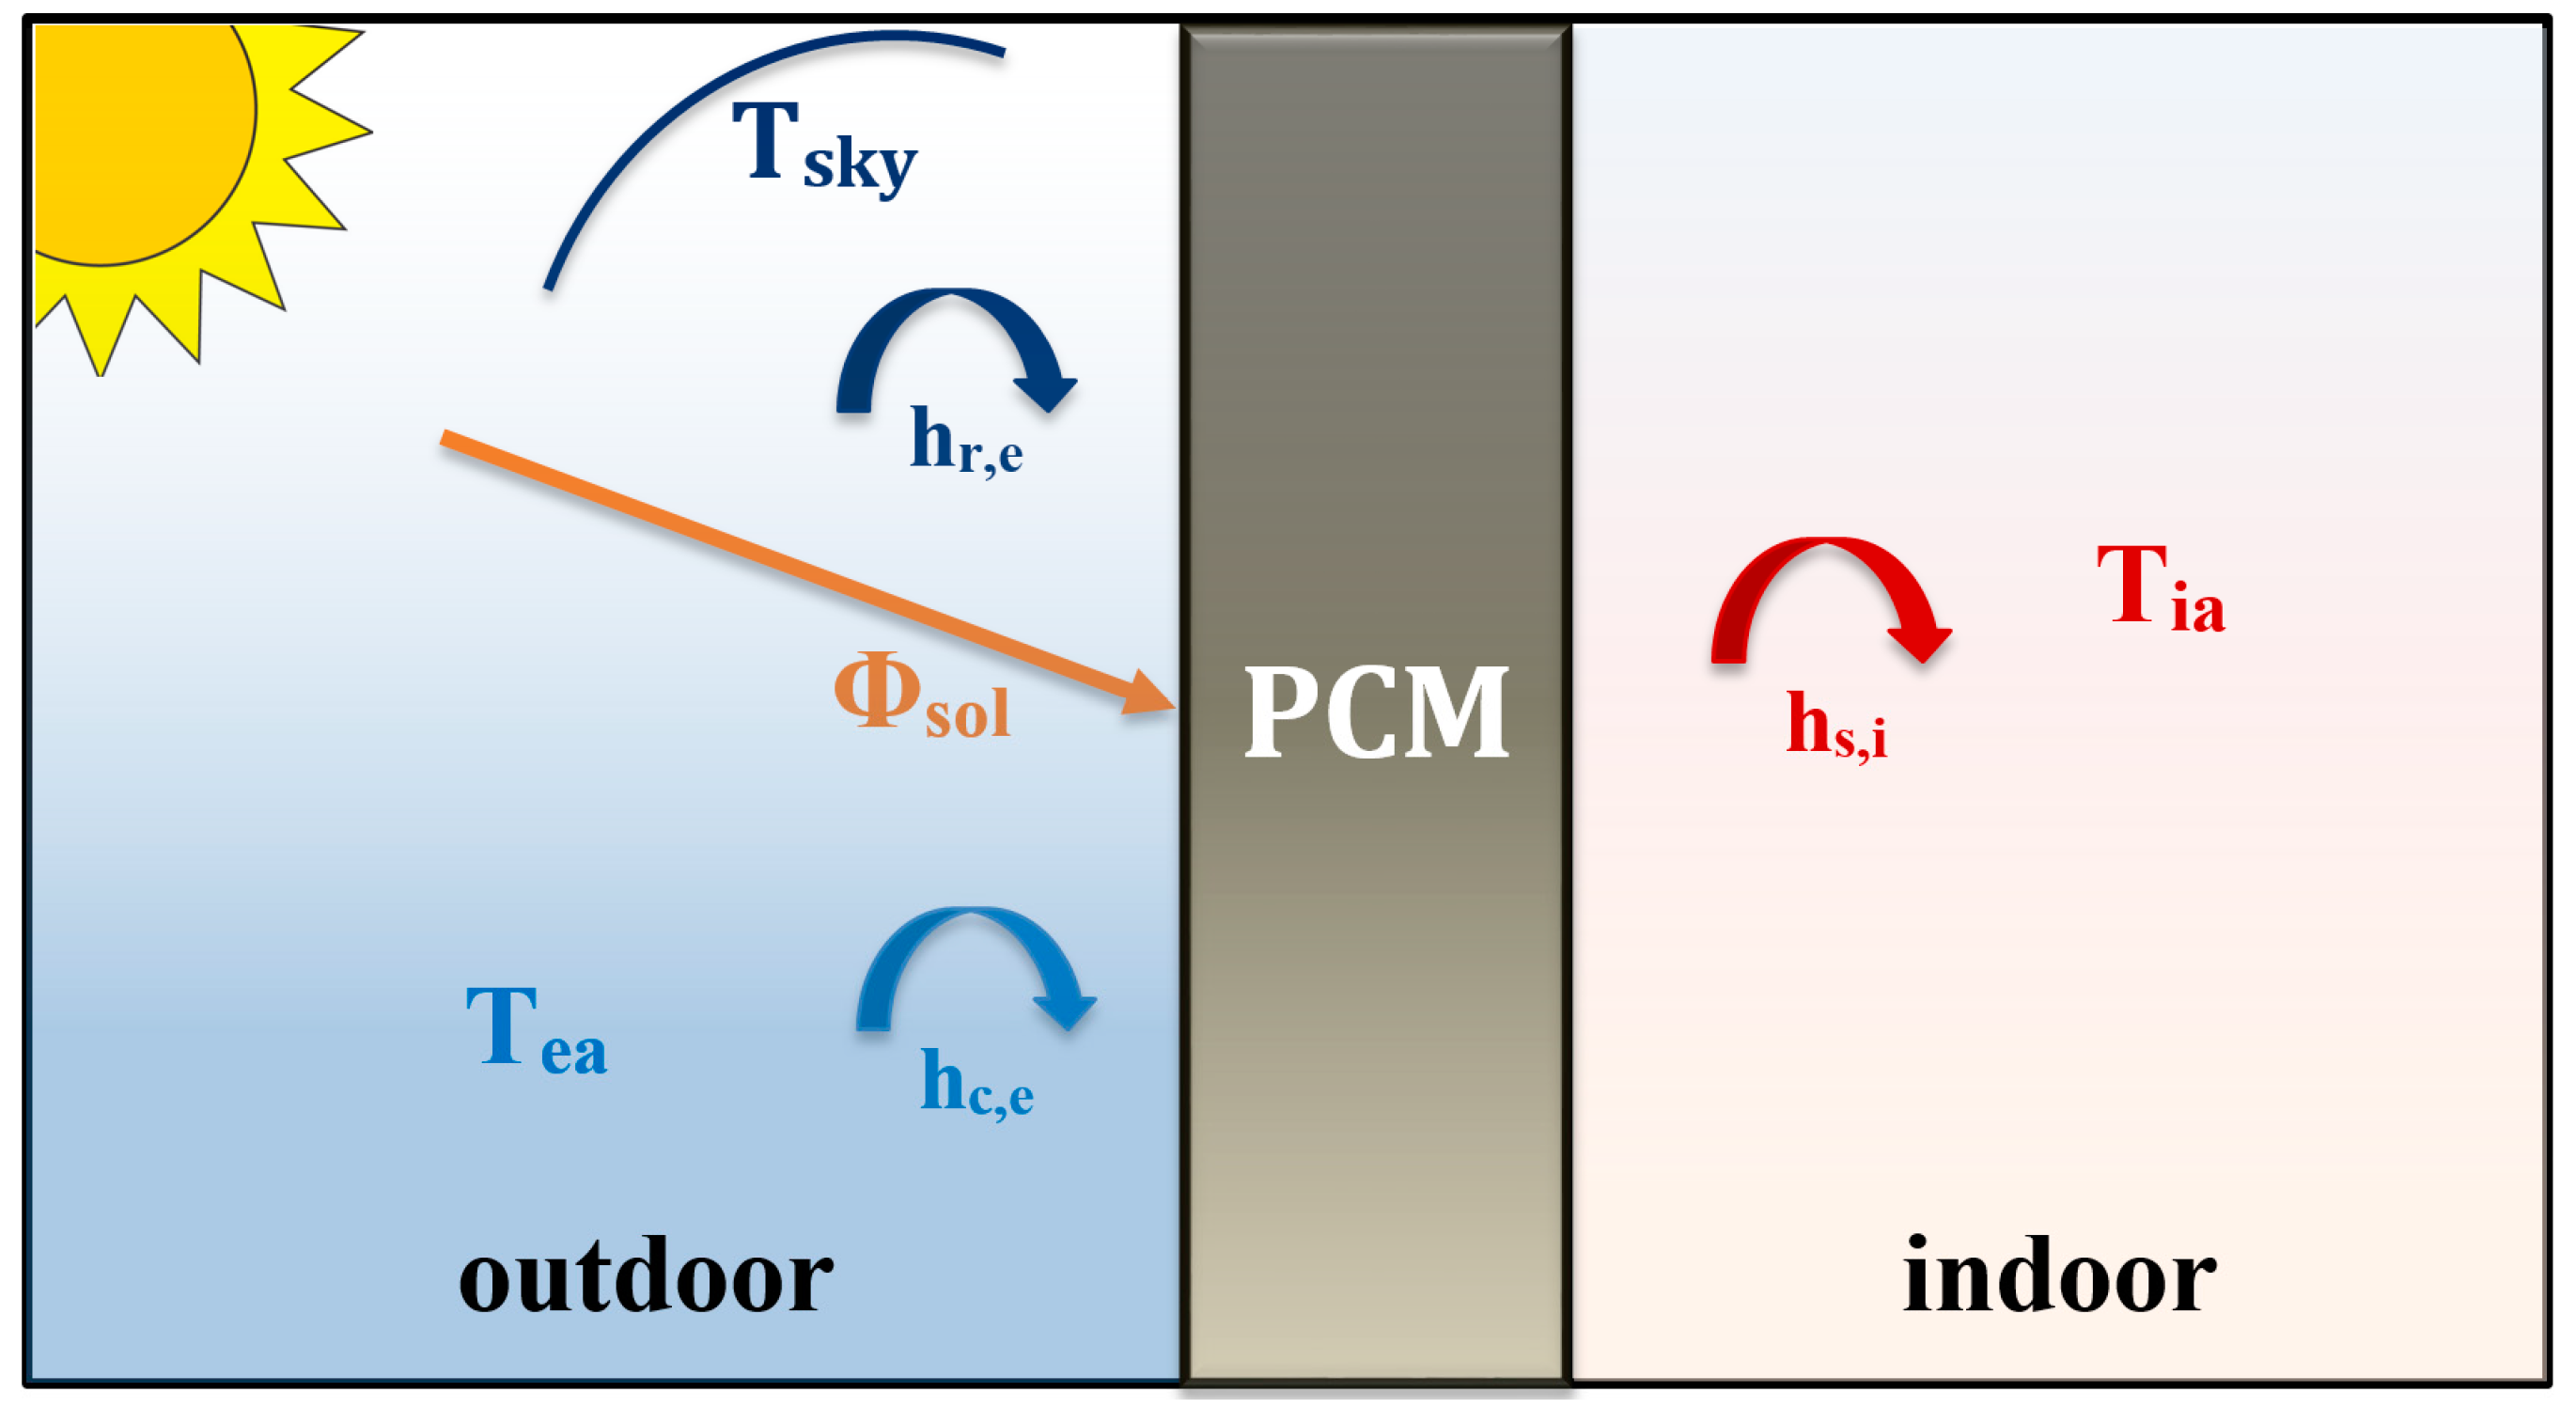
In the previous equations: T is temperature at the abscissa x at the time instant t, a thermal diffusivity, k is thermal conductivity, subscripts l is liquid phase and s is solid phase, ρ is density, H is latent heat of fusion, TM is melting temperature, XM is position of the bi-phase interface, is total heat flux from the outdoor environment, is longwave radiative heat flux exchanged with the sky, is convective heat flux exchanged with the external air, is external surface absorption coefficient, is incident solar radiation, and are external radiative and convective heat transfer coefficients, is sky temperature, is external air temperature, is external surface temperature, is heat flux transferred in the indoor environment, is internal surface heat transfer coefficient, is internal surface temperature, is internal air temperature and L is thickness of the layer.
A sketch of the thermal exchanges between the PCM layer and the outdoor and indoor environments is shown in Figure 1.
The spatial and temporal discretization of the equations system allows us to obtain the algebraic equations for the calculation of the temperatures in the nodes not subject to a phase change and of the liquid fractions present into the subvolume of nodes at the melting temperature. The calculation algorithm is used to identify nodes/subvolumes in phase change and those entirely in liquid phase or in solid phase and to associate the relative algebraic equations. Once the liquid fraction in all nodes is computed, it is possible to determine, as a function of time, the number and the position of the bi-phase interfaces present in the layer.
2.2. Transferred and Stored Energy
The temperature and heat flux trends on the external and internal surface are used to evaluate the energy behaviour of the PCM layer in terms of transferred energy and of stored energy in the layer in the sensible and latent form. The temperature and heat flux trends can be considered as a sum of a steady component and a fluctuant component.
The monthly average daily fluctuant energy on the internal surface and external surface of the layer are calculated by half of the numeric integral in time, extended to the period, of the absolute value of the surface fluctuant heat fluxes and (Equations (6) and (7)). The surface fluctuant heat fluxes and are equal to the difference between the relative total value and the steady mean value.
The total energy stored is calculated by half of the numeric integral in time, extended to the period, of the difference in absolute value of the heat flux entering the layer and exiting from the layer (Equation (8)). Likewise, the advancing velocity of the bi-phase interface k, given by the ratio (, is used to evaluate the latent energy stored associated to the k-th bi-phase interface, by the Equation (9).
The sensible energy is given by half of the numeric integral in time of the difference, in absolute value, between the total stored energy per unit time and the latent energy stored per unit time (Equation (10)).
Furthermore, the surface heat fluxes are used to calculate the energy: (i) through the internal surface, entering the indoor environment and exiting from the indoor environment ; (ii) through the external surface, entering the layer and exiting the layer (Figure 2). The superscripts + and − indicate the energy associated to the time interval in which the heat flux is respectively positive and negative.
The monthly average daily values of the energy transferred through the layer and the stored energy values in the various months have been used for the calculation of the related seasonal and yearly values.
3. Case Study Description
The calculation procedure proposed by the authors was used in order to evaluate, on a monthly basis, the energetic behaviour of five different PCM typologies (see Table 1), with a thickness equal to 6 cm. Melting temperatures ranging from 15 °C to 32 °C were chosen in relation to the set point temperatures of air-conditioned environments in summer and winter periods.
Climatic data of two locations, Turin (TO) and Cosenza (CS), related to monthly average days of a whole year were used. The two locations are quite different regarding their climatic conditions. In particular, the Mediterranean climate of Cosenza, identified as Csa in the Köppen climate classification [31], has moderate temperatures with changeable and rainy weather in winter, while summers are hot and dry. The continental climate of Turin, classified as Dfb, is characterized by hot and humid summers, and winters that are cold with little rainfall, typical of the interior of a continent.
The external air temperature and solar irradiation on the horizontal plane data employed, relative to the monthly average days, are those from the national standard reference [32]. Starting from these values, using TRNSYS 17 [33] software (University of Wisconsin-Madison, Madison, WI (USA)), the climatic data relative to the characteristic day of each month were generated. Such climatic data have a period of 24 h and are represented through the monthly average hourly values of solar radiation on the vertical plane exposed to South, of the sky temperature and of external air temperature. Figure 3 shows the monthly average hourly trends of the characteristic day for all months of the year and for the two locations considered.
In the indoor environment, the air temperature values in continuous regime and the heating and cooling period were chosen according to the reference standard [34,35]. The internal temperature is set equal to 20 °C during the heating period, from October to April in Turin and from November to March in Cosenza; it is set equal to 26 °C during the cooling period, from June to August in Turin and from June to September in Cosenza; while in the intermediate period it is set equal to 23 °C. The numerical simulations considered: on the external surface a solar absorption coefficient equal to 0.60 and a convective and radiative heat transfer coefficient respectively equal to and ; and on the internal surface a heat transfer coefficient equal to . The values of these coefficients were obtained by applying the technical reference standard EN ISO 6946 [36], while for the value of , reference is made to a previous experimental work by some of the authors [37] developed for a vertical wall with southern exposure and corresponding to the average value of an entire year of measurements.
The layer was discretized with 19 nodes and the equation system was solved by an integration step Δt = 5 s. Such values verify the grid independence and the stability conditions.
4. Results and Discussion
Regarding the different PCMs and for the two locations: Section 4.1 shows, for each month, the number of bi-phase interfaces which are formed in the layer, the values of the total, latent and sensible stored energy and of the transferred energy on the two boundary surfaces, and explanations of the observed phenomena; Section 4.2 shows the seasonal values of the transferred energy on the two boundary surfaces and the yearly values of the total, latent and sensible stored energy.
4.1. Monthly Energy Behaviour of the Layer
4.1.1. Number of Bi-Phase Interfaces in the PCM Layer
The calculation procedure has allowed us to evaluate for each month of the year the number of bi-phase interfaces present in the layer and when the layer is entirely in solid or in liquid phase; see Table 2.
For both localities, the configuration of the phases is variable in the different months of the year, and the layer is totally in solid or liquid phase, or it is the site of the formation of one, two or three bi-phase interfaces. The configuration of the phases in the different months mainly depends on the melting temperature and on the boundary conditions.
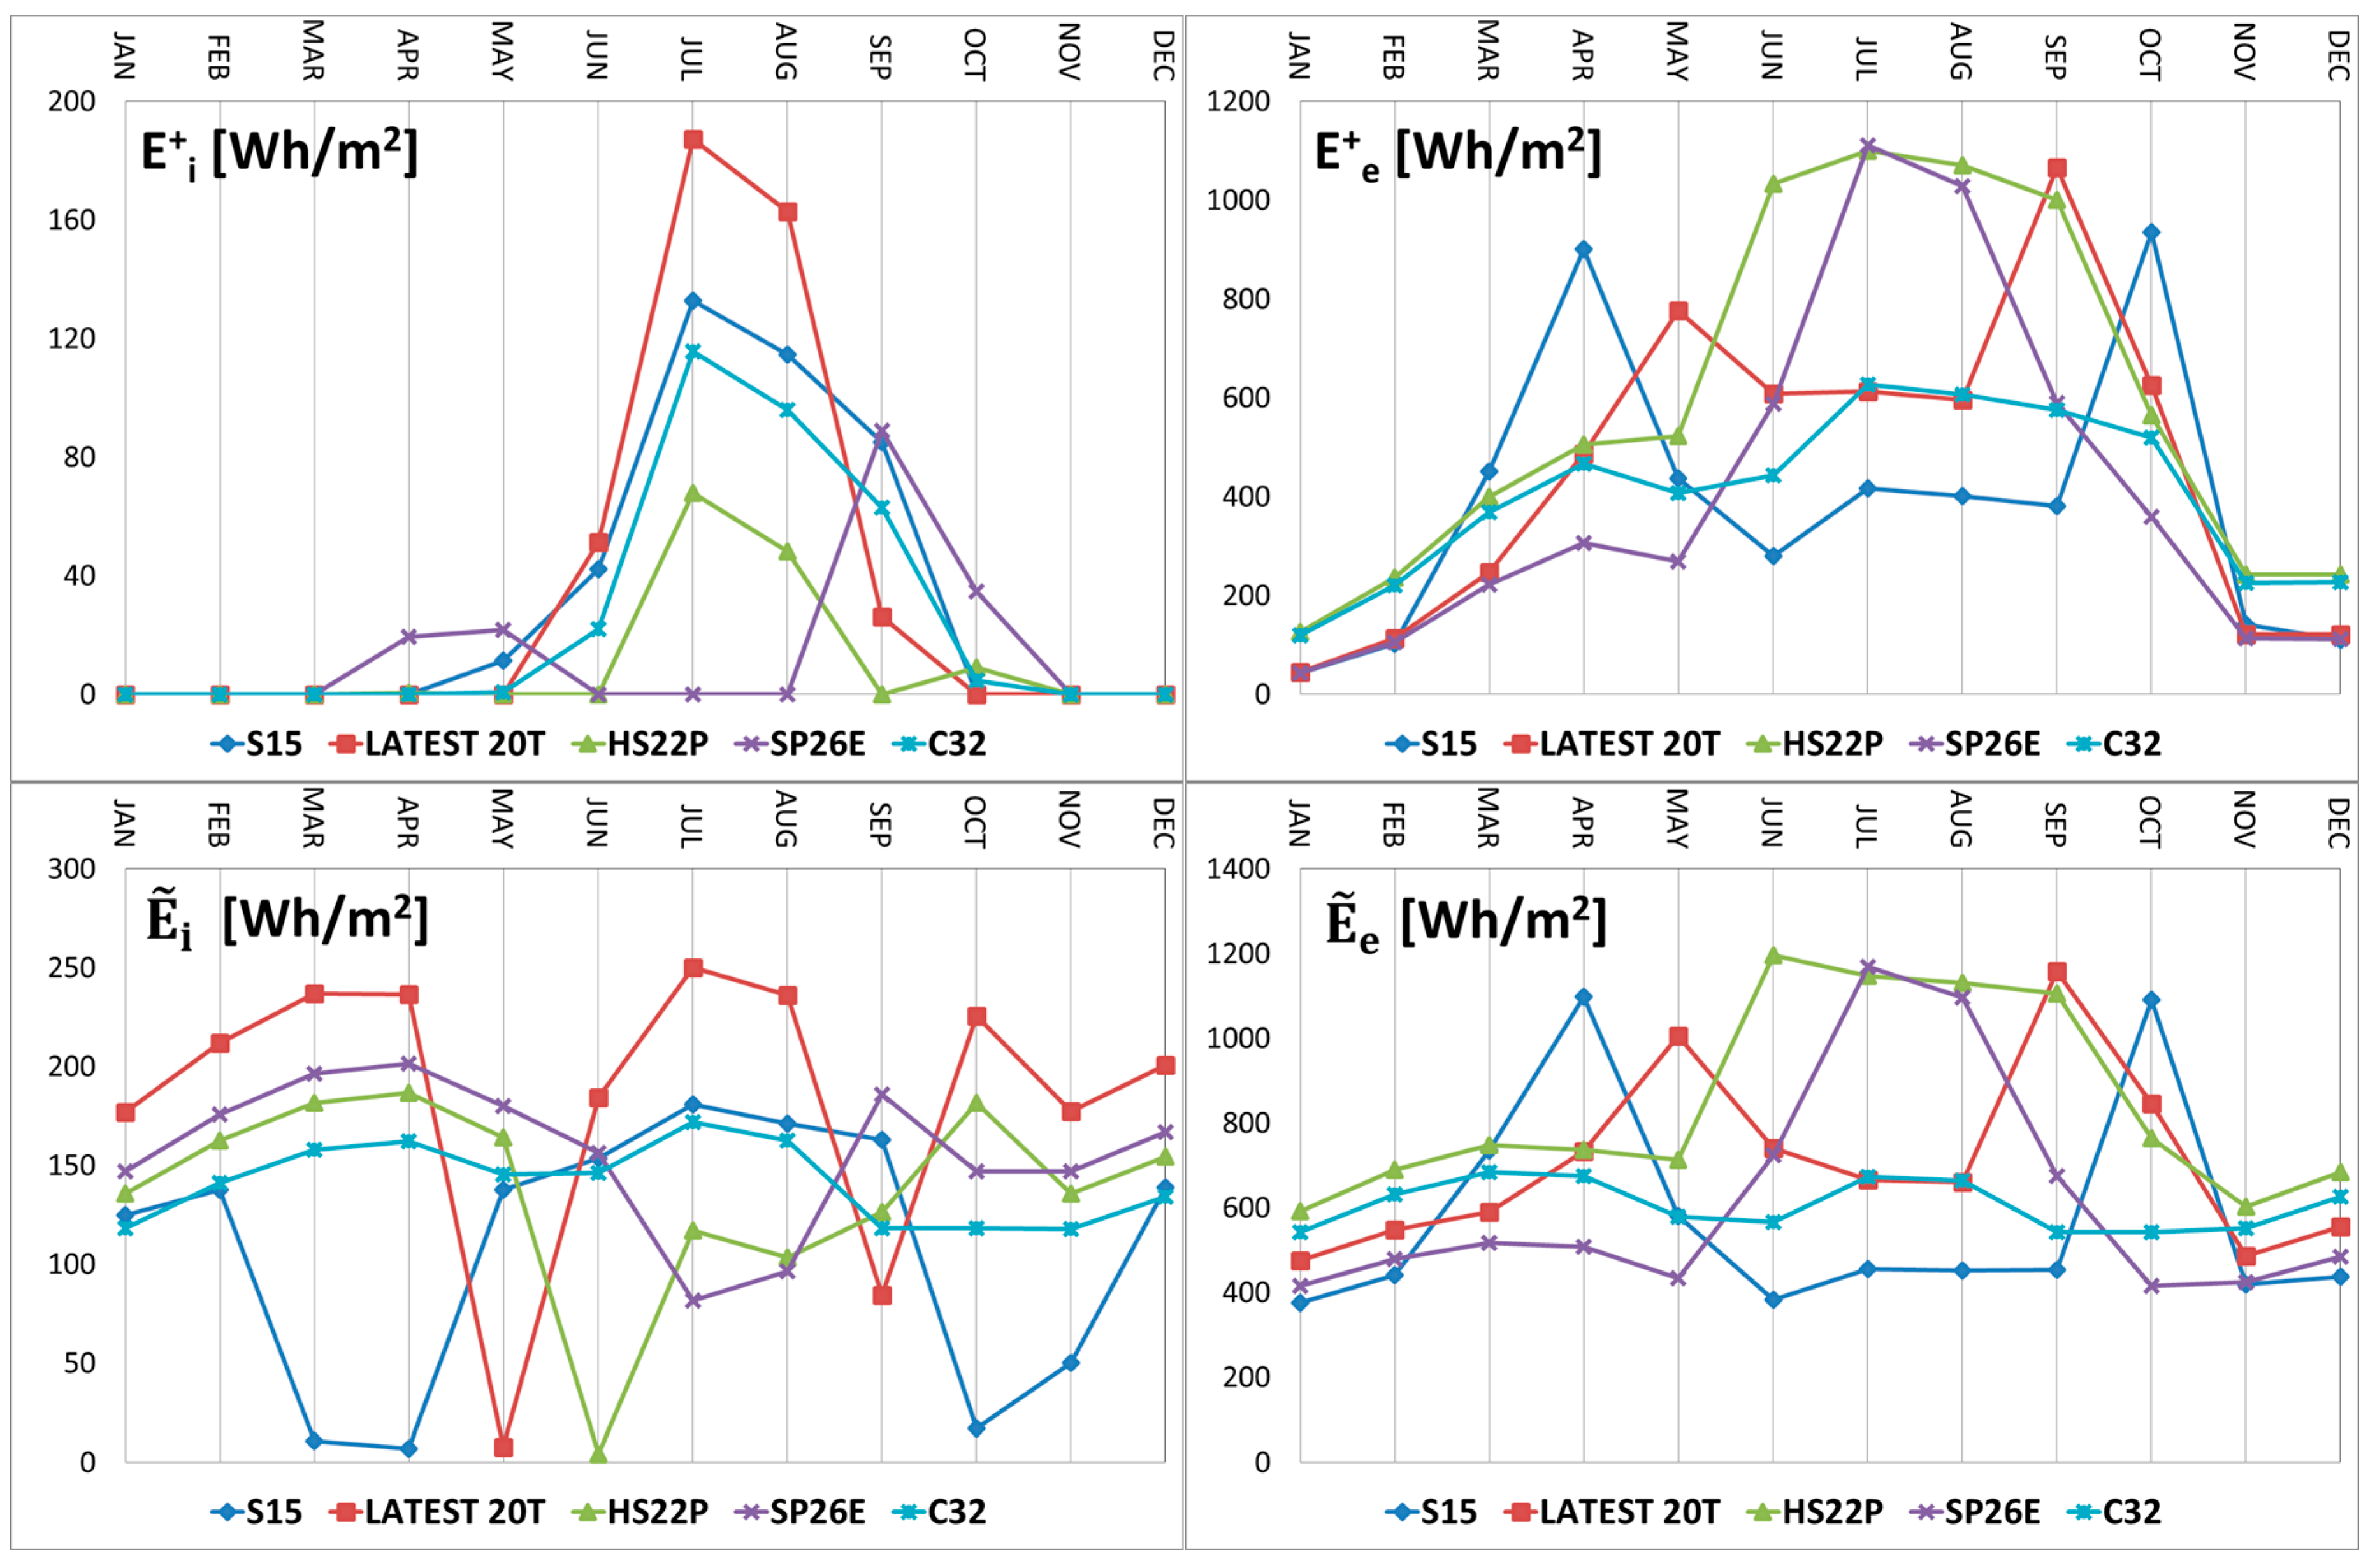
4.1.2. Stored Energy
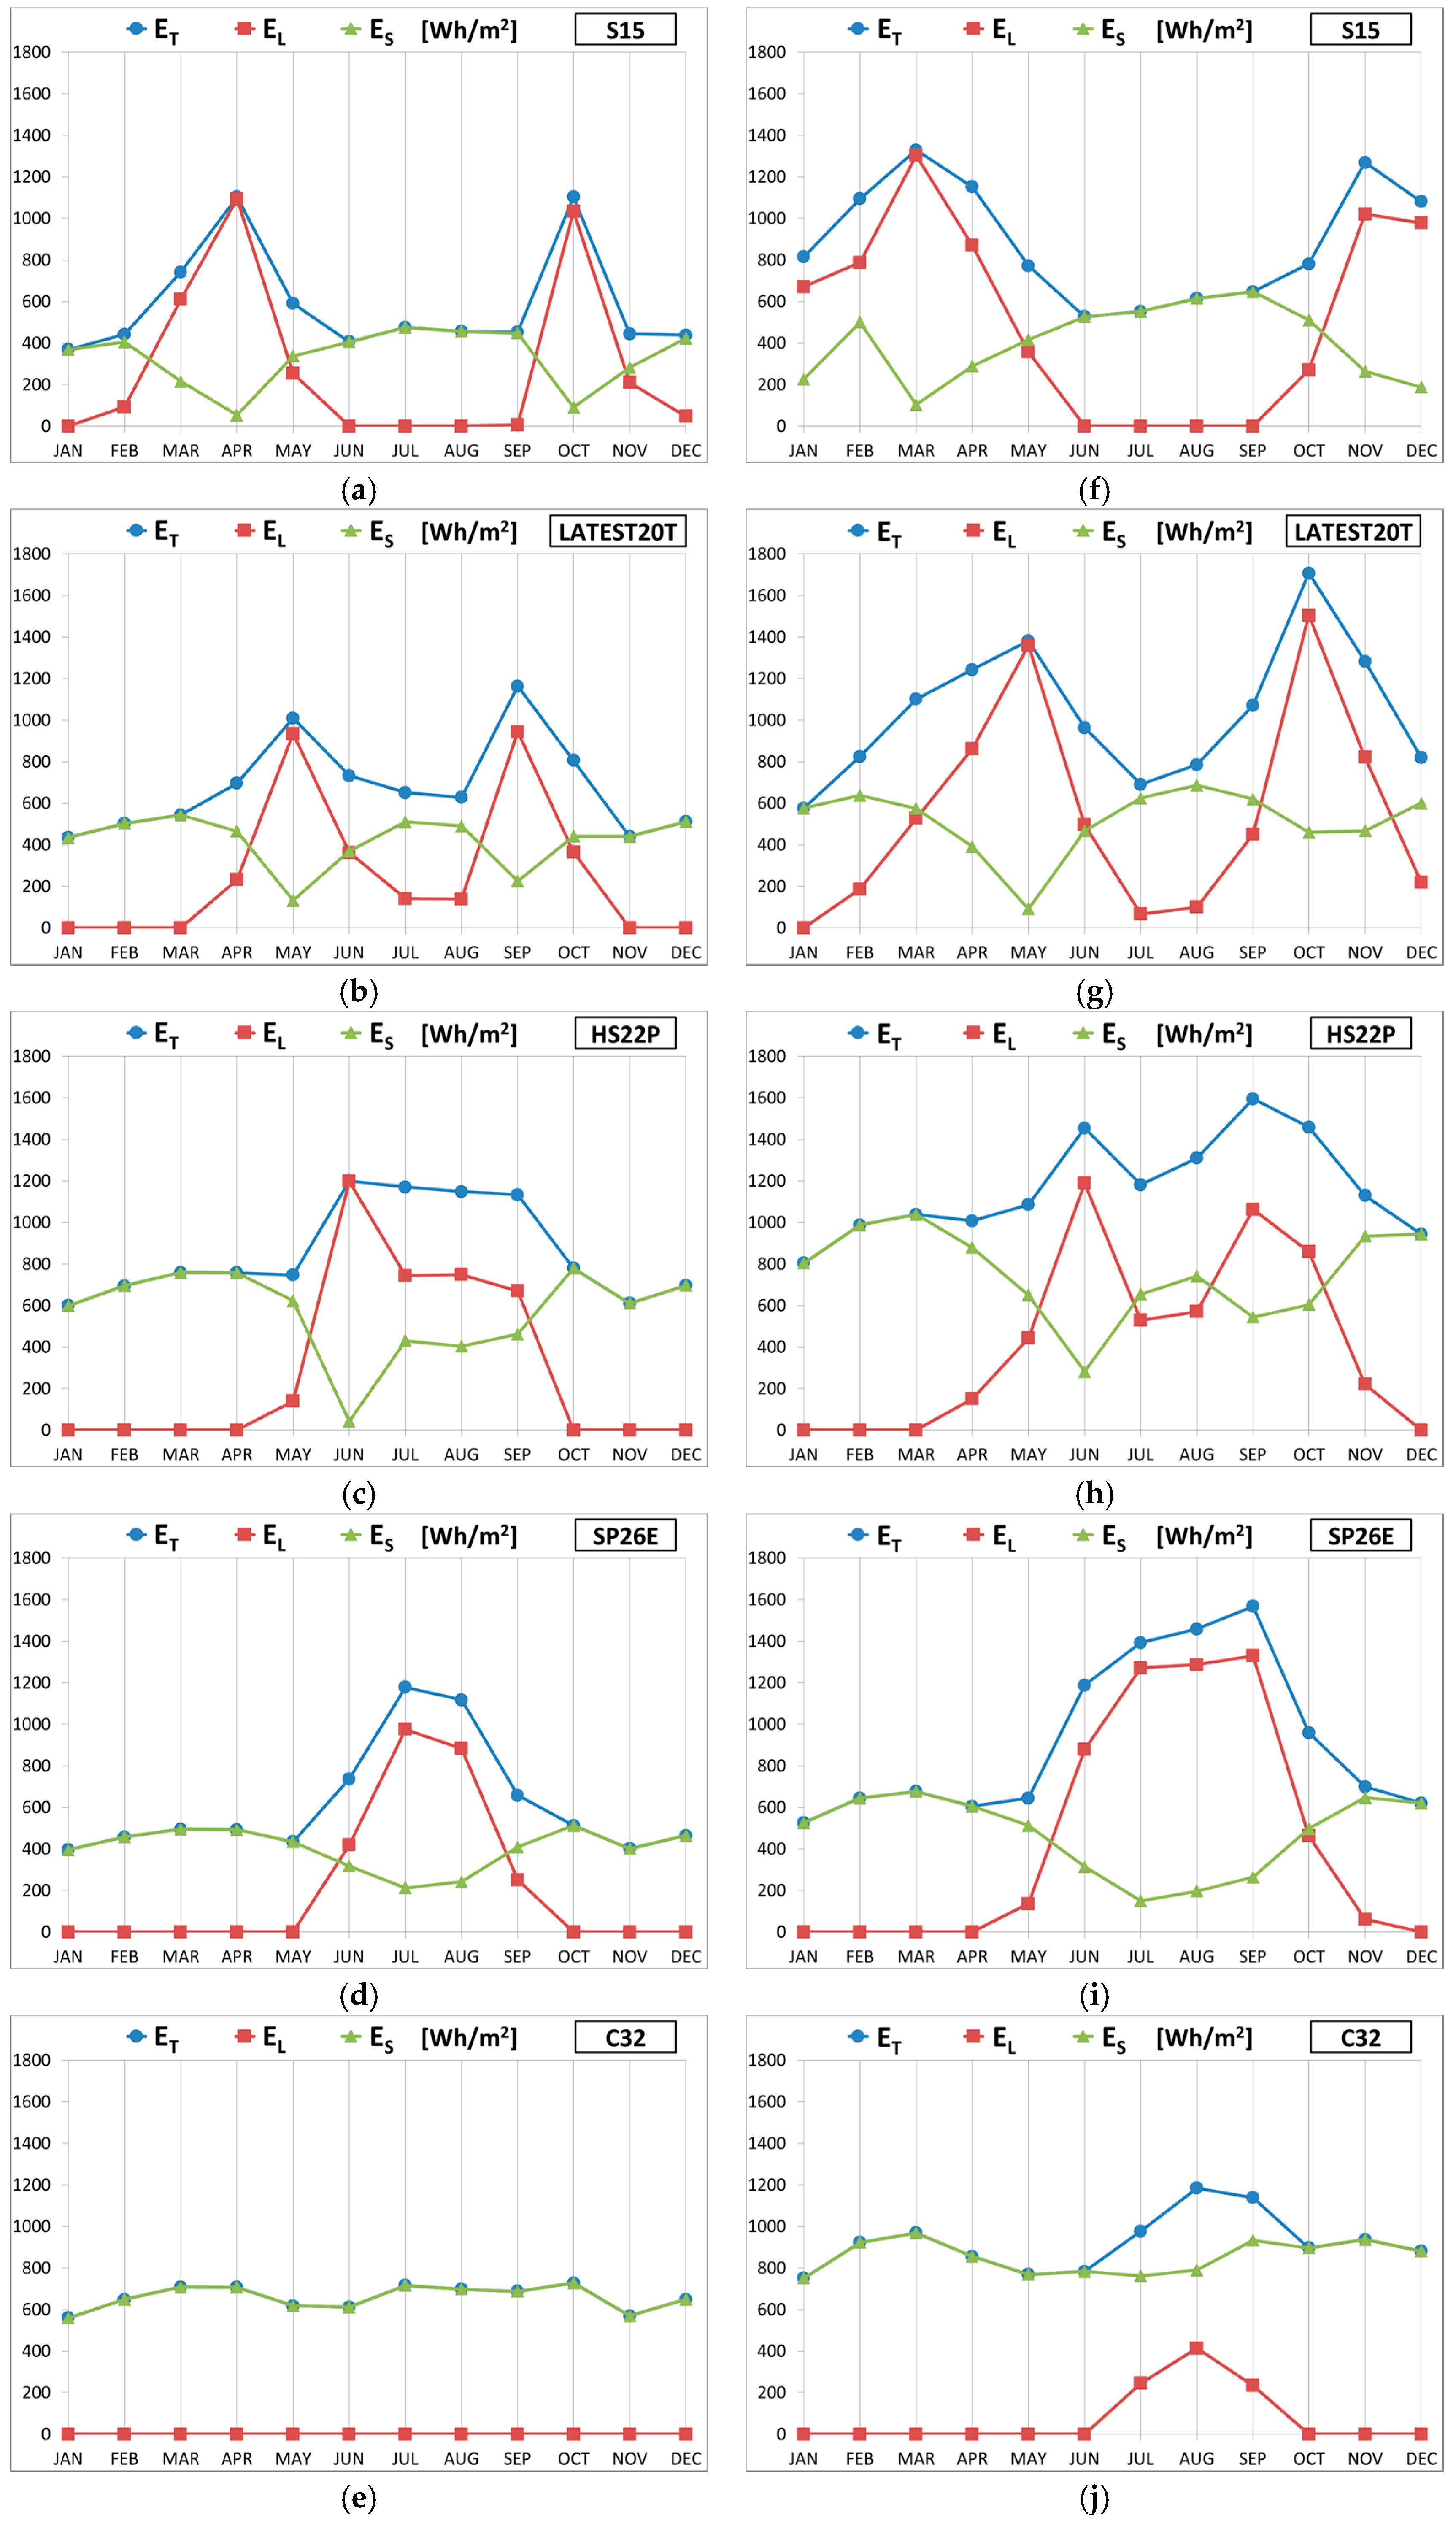
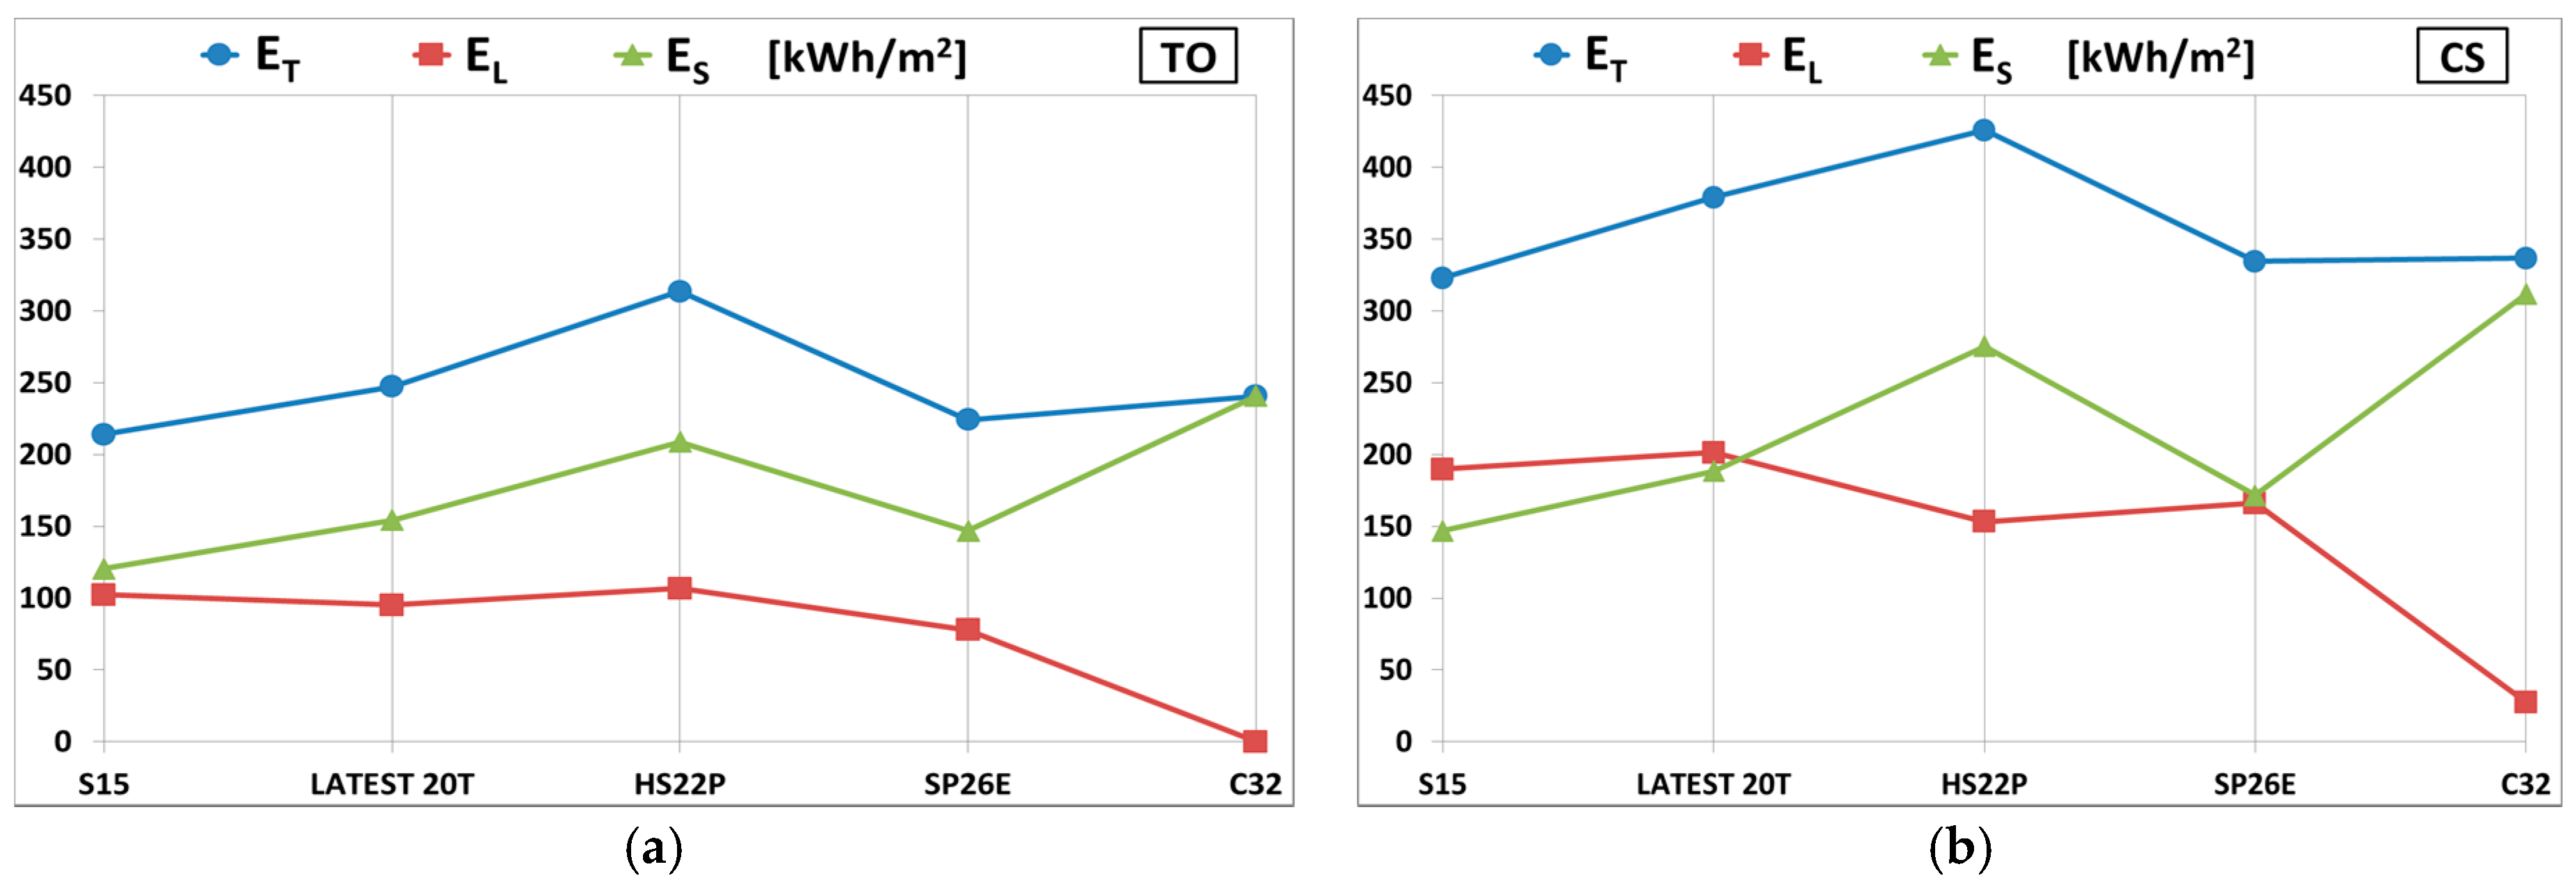
The stored energy referring to the monthly average day in each different month is shown in Figure 4, on the left for Turin and on the right for Cosenza. For each PCM considered, the total, the latent and the sensible contribution of the energy stored, is reported.
With the increase of the melting temperature for both locations, the highest values of the stored latent energy switch from winter and intermediate months—as in the case of PCM S15—to summer months—as in the case of PCM SP26E. The behaviour of PCM C32 is quite different, which does not supply a latent contribution in Turin during the different months, due to the absence of phase change, while in Cosenza phase changes occur in the summer time. The quantity of latent energy stored during the months in which phase change depends on the number of bi-phase interfaces, on the size of the portion of the layer involved in the phase change, on the density and on the latent heat of fusion. In Turin, the highest values occur in April and October for PCM S15, in May and September for PCM LATEST 20T, in June for PCM HS22P, and in July and August for PCM SP26E. In Cosenza, the highest values are recorded in March and November for PCM S15, in May and October for PCM LATEST 20T, in June and September for PCM HS22P, between July and September for PCM SP26E, and in August for PCM C32.
The sensible energy storage shows a reduction during the months in which the phase change occurs, while during the other months it depends on the volumetric heat capacity ρc of the PCM. In particular, the highest values are shown for PCMs HS22P and C32, and the lowest values for S15.
The total stored energy increases during the months in which the phase change occurs, despite the reduction of the sensible contribution; during the other months, it is determined by only sensible energy. In particular, in Turin the total energy stored is higher with PCM HSP22 from November to March and in June, with PCM S15 in April and October, with PCM LATEST20T in May, with PCMs LATEST20T and HS22P in September and with PCMs HS22P and SP26E in July and in August. In Cosenza, the total energy stored is higher with PCM S15 from November to March, with PCM LATEST20T in April, May and October, with HS22P in June and September and with SP26E in July and August.
4.1.3. Transferred Energy
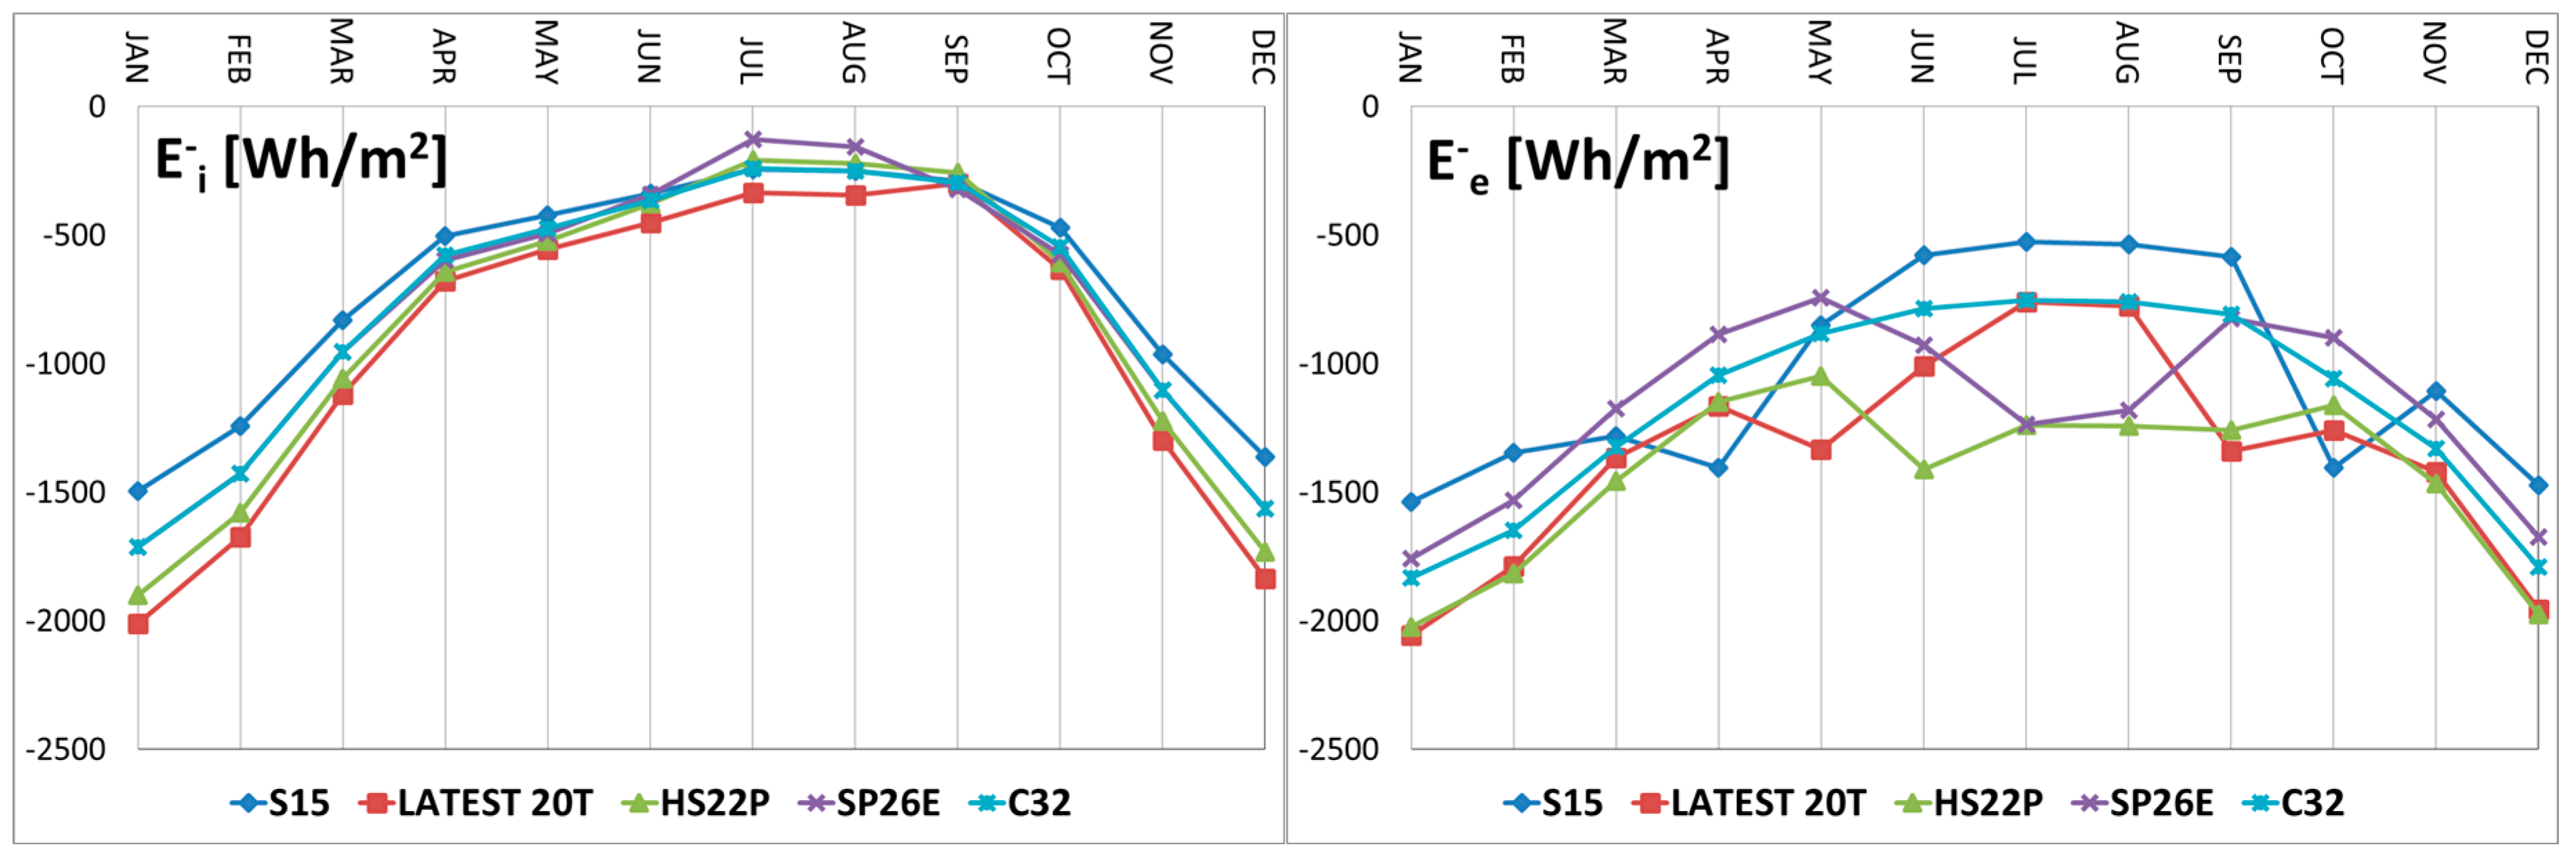
The monthly average values of the total energy and fluctuating energy transferred through the two boundary surfaces of the layer, for each month and for each different type of PCM, are shown in Figure 5 for Turin and in Figure 6 for Cosenza.
For each month and for each type of PCM, each figure shows: above, the energy leaving the environment through the internal surface and leaving the layer towards the outdoor environment ; in the middle, the energy entering the indoor environment through the internal surface and entering the layer from the external surface ; below, the fluctuating energy through the internal and external surface.
The monthly trends of such energetic quantities vary according to the PCM type and can be synthesised as below for Turin:
- shows a regular trend with a minimum value in the summer months and it increases in a monotonous way, proceeding towards the winter months with maximum values in January and December; the PCM LATEST20T provides the highest values in all months, while the lowest values are obtained in July and August with the PCM SP26E and in the other months with the PCM S15;
- shows high values during the winter months and lower values in the summer and intermediate months, with a regular trend in absence of phase change, as in the case of PCM C32. The presence of bi-phase interfaces gives rise to a sharp increase of the energy lost through the external surface. In particular, such an increase moves with increasing melting temperature from intermediate months to the summer months. PCM HS22P provides the highest values from November to March and from June to August, S15 in April and in October, and LATEST20T during the other months. The lowest values occur with PCM S15 between November and February and between June and September, and in the other months with SP26E;
- shows, usually, the highest values during summer months, with a peak in June, and nil values between November and March. PCM LATEST20T records during June, July and August show the highest values. The behaviour of PCM SP26 is quite different, recording nil values during summer months and the highest values during the intermediate months;
- shows low values during winter months and higher values during intermediate and summer months. The irregular trend is due to the phase changes, which cause a sharp increase of the energy entering the layer. The monthly behaviour of different PCMs is totally analogous to that illustrated regarding the energy exiting from the layer toward the outdoor environment , with higher values and lower values obtained by the same PCMs during the different months;
- and show a slightly variable monthly trend in absence of bi-phase interfaces, as highlighted by PCM C32. The phase change determines a modification of the previous trend with significant monthly variations of the heat flux fluctuating components on the internal and external surface. Particularly, the stored and then released latent energy causes a sharp reduction of the fluctuating energy through the internal surface and a marked increase of the fluctuating energy through the external surface.
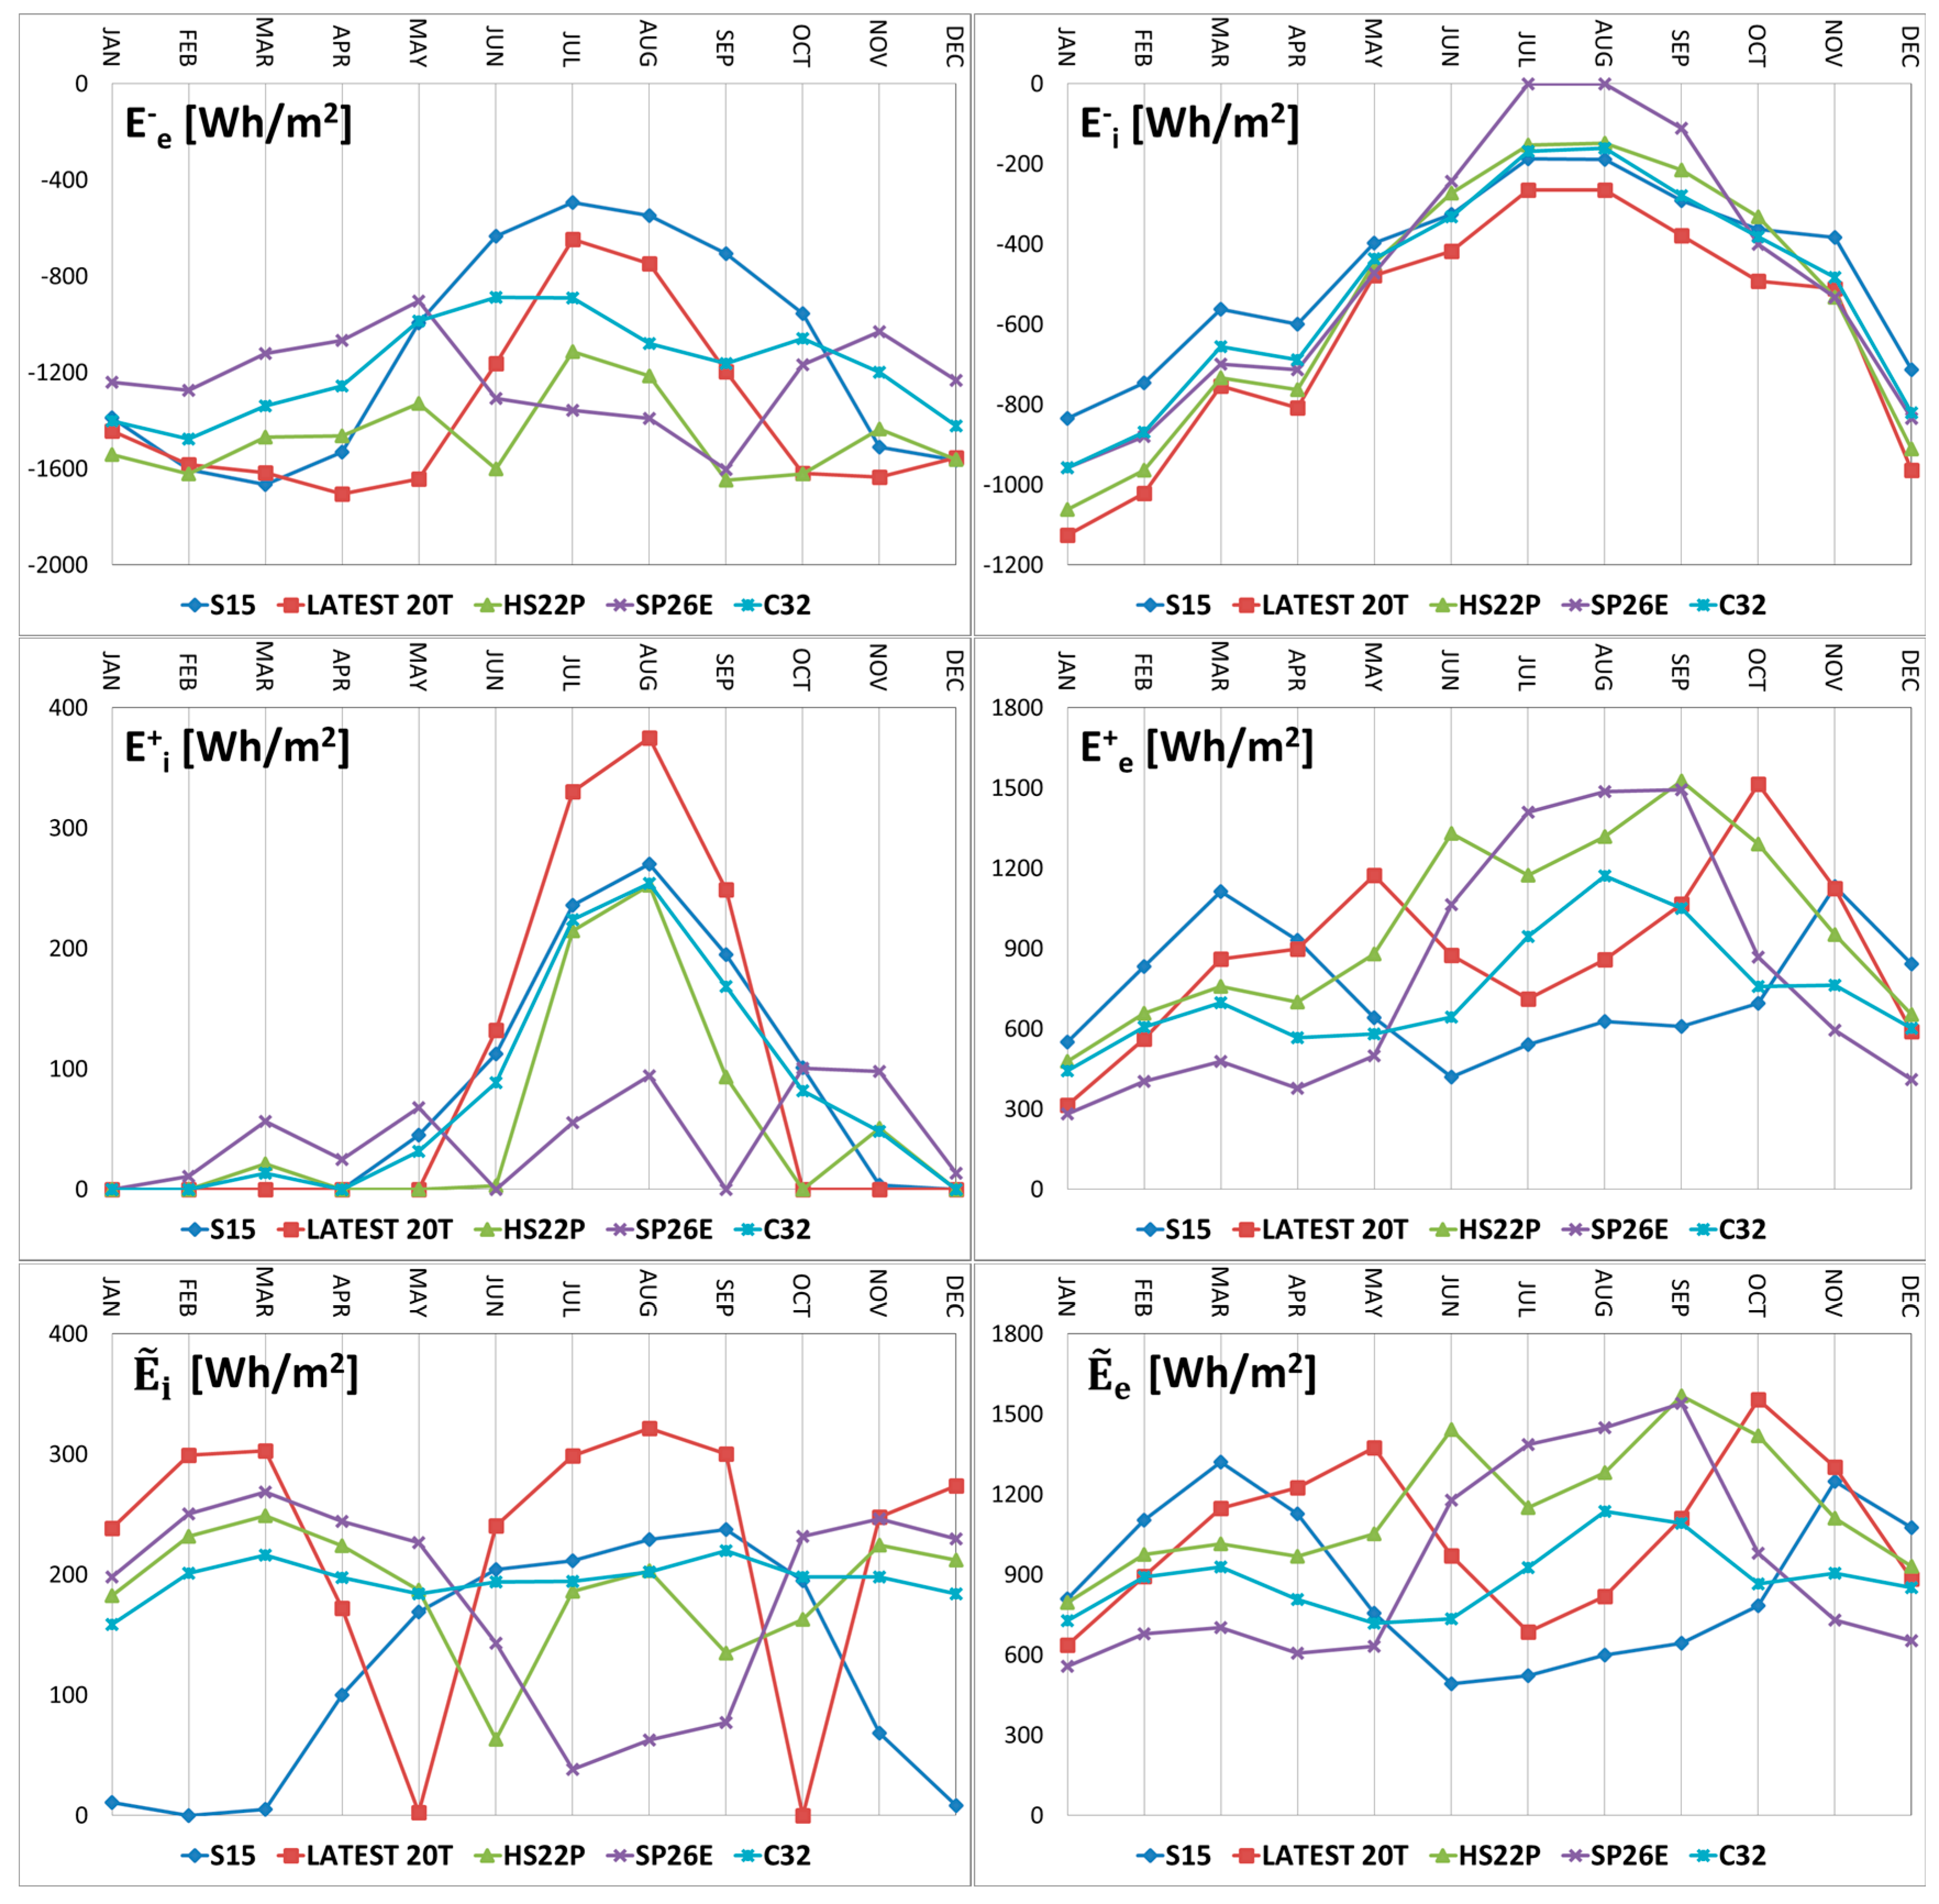
In Cosenza, unlike Turin:
- for the different PCMs shows the same trend with lower values in the different months. Even in this case, the highest values are obtained with PCM LATEST20T. The lowest values are recorded from June to September with PCM SP26E, from November to May with the PCM S15, and in October with PCM HS22P;
- shows the same trend with lower values and, during the months in which phase change occurs, the increase switches with the rise in melting temperature from winter to summer months. PCM S15 shows the highest values in March, LATEST20T in April, May and November, SP26E in July and August, and HS22P in all the other months. The lowest values occur with PCM S15 between June and October and with SP26E from November to May;
- shows a similar trend with higher values and with a maximum in August. PCM LATEST20T records higher values from June to September and, in all other months, nil values. The behaviour of PCM SP26E is quite different, showing lower values in the summer months and higher values during intermediate months;
- shows higher values and the increases switch, due to the phase changes according to the rise of the melting temperature from winter to summer months. Even in Cosenza, the highest and the lowest values during the different months are obtained with the same PCMs highlighted in the comment about exiting energy;
- and show analogous behaviour as that experienced for Turin.
On the whole, it can be observed that in Cosenza, with its Mediterranean climate, the exiting energy from the air-conditioned environment through the internal and external surfaces is lower than that recorded in Turin, while the energies and show lower values in Turin.
4.1.4. Influence of Latent Storage on the Energy Behavior of the Layer
The analysis of the monthly trends of entering and exiting energy through the inner surface and the outer surface of the layer is used to define—in relation to the thermophysical properties of the PCM and of the external loadings—the thermal behavior of the layer in the presence of a phase change. The external loadings trends, the value of the internal air temperature and the value of the PCM melting temperature determine the presence of a phase change. The advancing velocity of the bi-phase interface and the size of the layer portion subject to phase change are related to the density, to the latent heat of fusion and to the daily maximum excursion of the fluctuant heat flux entering through the external surface. The stored latent energy is directly proportional to the advancing velocity (see Equation (2)). Since the latent thermal storage is a dynamical phenomenon, only the fluctuating component of the heat flux field is modified in the layer, while the steady heat flux field remains unchanged. This is highlighted by comparing the trends of the stored latent energy (see Figure 4), and the trends of the fluctuant energy on the internal surface and on the external surface , reported in the bottom images of Figure 5 and Figure 6. The presence of a phase change, highlighted by a value of , gives rise to an abrupt reduction of and a sharp increase of .
The reduction of is caused by the conversion of the fluctuant energy coming from the outdoor environment into stored latent energy in proximity of the bi-phase interface. Subsequently, such energy is released towards either the internal and external surface. The part released towards the external surface increases . Consequently, despite the invariance of the steady components, the total energies , , and are modified, as highlighted in the top and center images of Figure 5 and Figure 6.
4.2. Criterion of Choice of the PCM Layer
The developed analysis can be used to select the most suitable PCM in summer air-conditioning or in winter air-conditioning, or with reference to annual air-conditioning to achieve the nZEB objectives. If the objective is that of reducing energy requirements in a specific air-conditioning season, the criterion to be adopted (see Section 4.2.1) consists of selecting the PCM that ensures: in summer, the least energy entering the indoor environment; in winter, the least energy lost by the indoor environment. If annual energy requirements are considered: if one of the two air-conditioning seasons is more expensive, the choice criterion is the previous one; if the two seasons have comparable energy requirements then the criterion proposed (Section 4.2.2) is that of selecting the PCM that assures the maximum total energy stored throughout the year.
4.2.1. Seasonal Transferred Energy
In order to evaluate the energy transferred through the layer, it is necessary to take into account both the energy exiting the indoor environment—which represents a loss in the winter period and a heat gain in the summer period—and the energy entering the indoor environment—which represents a heat gain in the winter period and a thermal load in the summer period.
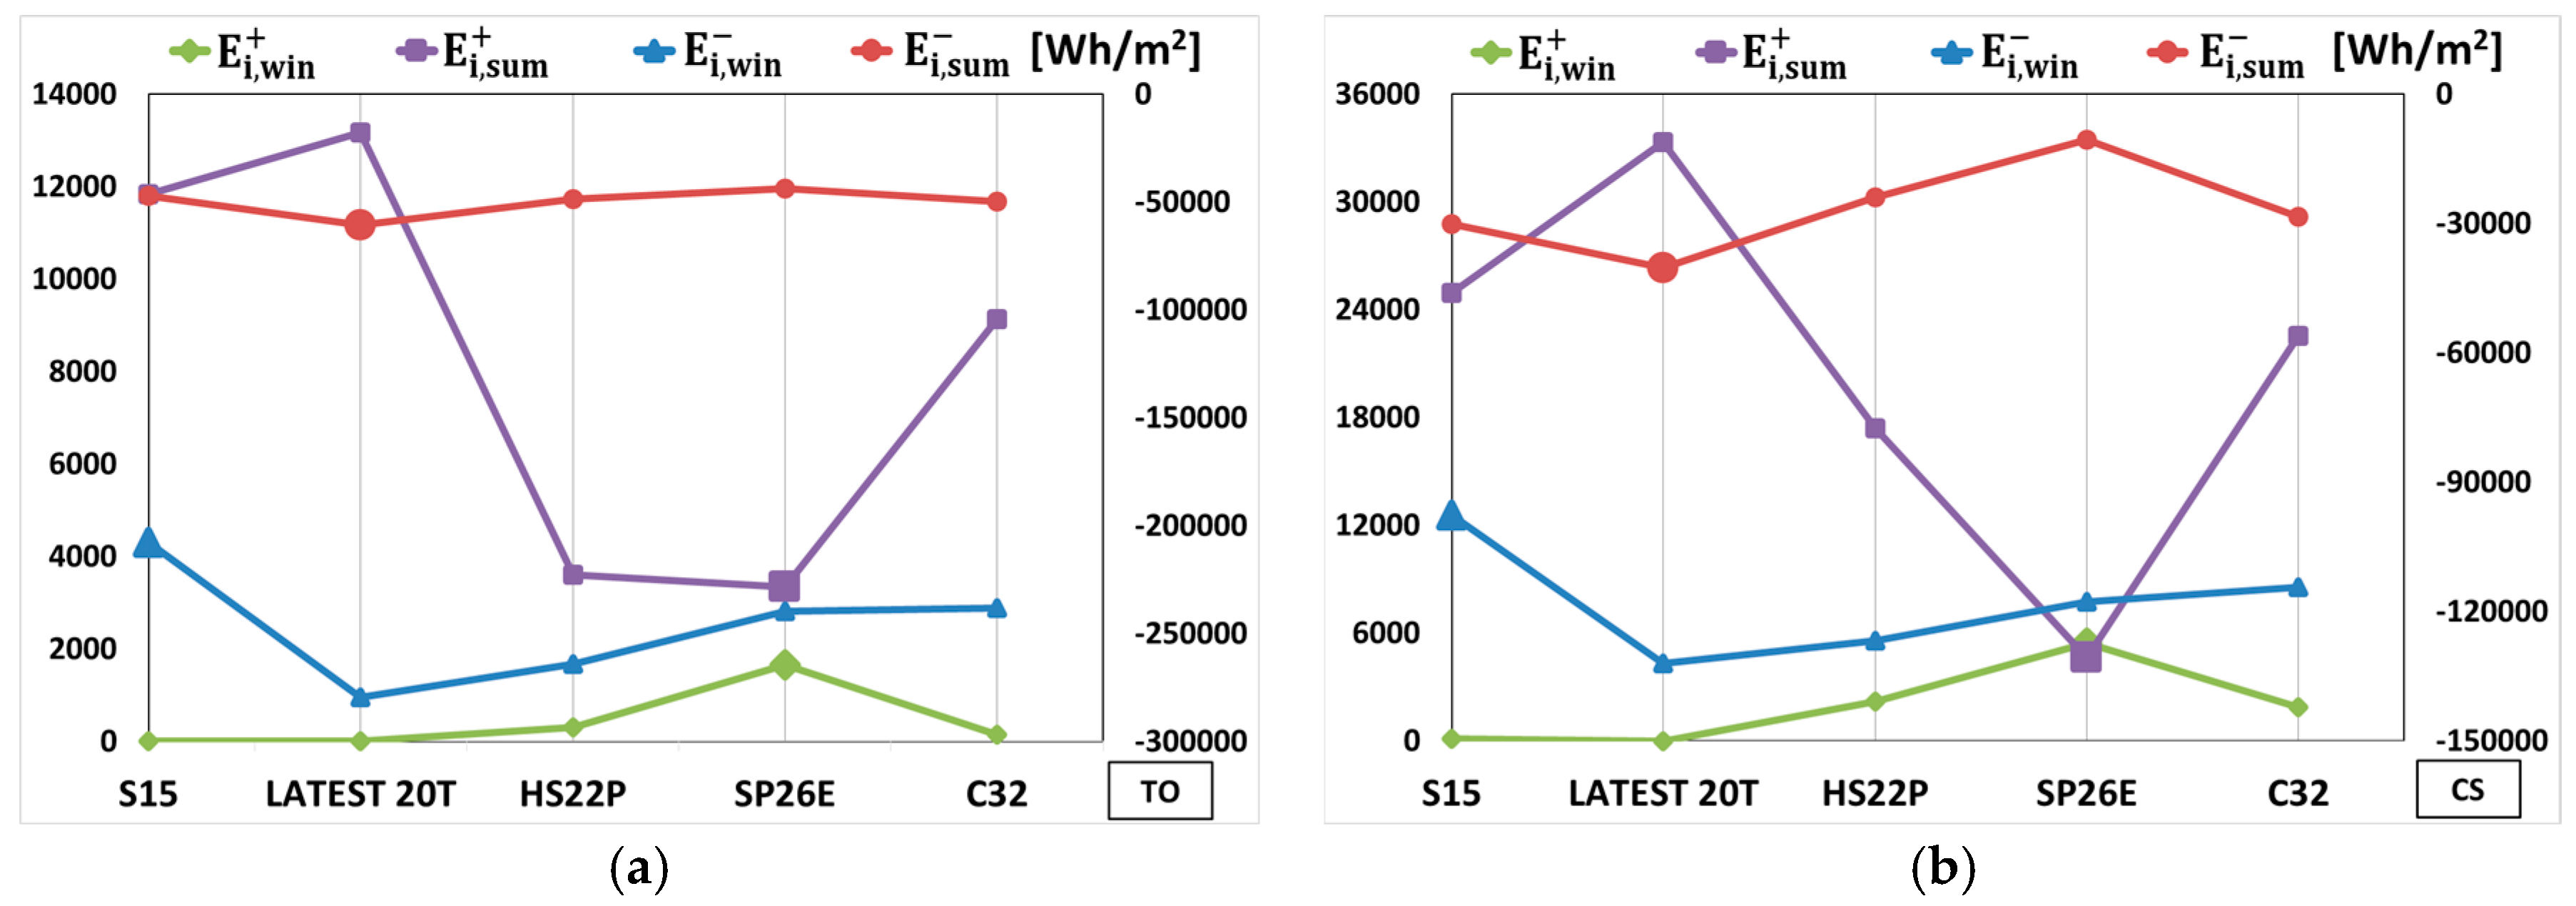
The results obtained with the different PCMs for Turin and Cosenza are shown in Figure 7, which illustrates at the ordinate the energies in the winter period and and during the summer and , calculated as the sum of the correspondent monthly values, determined starting from the monthly average daily values reported in Section 4.1.3.
About Turin: in the winter period, the biggest heat gain is ensured by PCM SP26E and the lowest by PCM LATEST20T and S15, the lowest heat loss by the PCM S15 and the highest by LATEST20T; in the summer period, the most reduced load value is obtained with SP26E and the highest with LATEST20T, the highest heat gain is provided by LATEST20T and the lowest by SP26E.
For Cosenza, the previous results are confirmed, with higher values of the entering energy and lower values of the exiting energy in both seasons. In the figures, for all considered cases, the largest gains and the lowest loads during the heating and the cooling air-conditioning are identified with a more visible pointer.
4.2.2. Yearly Stored Energy
The yearly sensible, latent and total stored energy for the different types of PCM in the two locations is shown in Figure 8. The yearly values are calculated starting from the monthly average daily values reported in Section 4.1.2.
The highest thermal heat storage for both locations is obtained by HS22P. In Turin, the sensible contribution is prevailing on the latent contribution, while in Cosenza this prevalence happens only for PCMs HS22P and C32.
The comparison of the two locations highlights that, independently of the type of PCM, the sensible, latent and total energy stored in the layer are higher in Cosenza compared to Turin.
5. Conclusions
In this work, an accurate energetic analysis of PCM layers with boundary conditions characteristic of external walls of air-conditioned buildings in steady periodic regime has been developed. The analysis allowed for the evaluation of the effects produced by the phase change on the energy transfer and on the thermal storage within the layer. In order to evaluate the energy transferred through the layer, it is necessary to take into account both the energy exiting the indoor environment, which represents a loss in the winter period and a heat gain in the summer period, and the energy entering the indoor environment, which makes a heat gain in the winter period and a load in the summer period. The developed procedure can be used to select the most suitable PCM in summer air-conditioning, or in winter air-conditioning, or even with reference to annual air-conditioning.
The analysis developed in terms of monthly stored energy in relation to PCMs with different melting temperatures subject to different climatic conditions, highlighted that:
- With the increase of the melting temperature, for both locations, the highest values of the stored latent energy switch from winter and intermediate months to summer months. The quantity of latent energy stored, during the months in which phase change is recorded, depends on the number of bi-phase interfaces, on the size of the portion of the layer involved in the phase change, on the density and on the latent heat of fusion.
- The sensible energy storage shows a reduction during the months in which the phase change occurs, while during the other months, it depends on the volumetric heat capacity ρc of the PCM.
- The total stored energy increases during the months in which the phase change occurs, despite the reduction of the sensible contribution; during the other months, it is determined by only sensible energy.
The presence of a phase change gives rise to an abrupt modification of the energies entering and exiting through the internal and external surface. In particular, the analysis developed on monthly bases and synthesized at the seasonal level, in terms of transferred energy highlighted that in Turin during the winter period:
- The lowest energy exiting from the indoor environment is ensured by a PCM with a melting temperature of 15 °C (S15);
- The highest contribution of energy entering the indoor environment, mainly due to solar radiation, is recorded for a PCM with a melting temperature of 26 °C (SP26).
In the summer period:
- The lowest value of energy entering the indoor environment is obtained by SP26;
- The highest value of energy exiting from the indoor environment is ensured by LATEST20 (with a melting temperature equal to 20 °C).
For Cosenza, in both seasons the previous findings, with the highest values of energy entering the indoor environment and lowest values of the exiting energy, are confirmed.
In both locations, the yearly total stored energy, which characterizes the use of PCM, results at its highest values with the PCM HS22P, with melting temperature intermediate between those of winter and summer set points of the indoor environment. Such PCM is the best compromise between winter and summer energy needs for an annual air-conditioned environment.
The results obtained provide valuable indications for improving the thermal performance of the building envelope by using PCM to achieve the nZEB targets.
Author Contributions
Domenico Mazzeo played the main role since he conceived and designed the research; he developed the mathematical model and the calculation algorithm, and contributed to the study of literature, to the analysis and processing of results and to the preparation, writing and revising of the manuscript until the final publication. Giuseppe Oliveti verified the correctness of predictions of the calculation procedure and of the obtained results, he played a significant role in the preparation and writing of the final manuscript. Natale Arcuri was involved in the study of literature, he contributed to the analysis of the results and he re-read and checked the final manuscript.
Conflicts of Interest
The authors declare no conflict of interest.
Nomenclature
| a | Thermal diffusivity (m2/s) |
| c | Specific heat capacity (J/kg K) |
| E | Energy per square meter (J/m2) |
| Ee | Energy on the external surface (J/m2) |
| Ei | Energy on the internal surface (J/m2) |
| h | Heat transfer coefficient (W/(m2 K)) |
| H | Latent heat of fusion (J/kg) |
| k | Thermal conductivity (W/m K) |
| L | Layer thickness (m) |
| P | Period (s) |
| t | Time (s) |
| T | Temperature (K) |
| x | Spatial coordinate (m) |
| XM | Position of the bi-phase interface (m) |
Greek symbols
| Solar absorption coefficient (-) | |
| Finite difference time step (s) | |
| Heat flux (W/m2) | |
| ρ | Density (kg/m3) |
Subscripts
| c | Convective |
| e | External |
| ea | Referring to the external air load |
| ia | Referring to the internal air |
| k | k-th bi-phase interface |
| l | Liquid |
| L | Referring to the latent energy stored |
| M | Melting |
| r | Radiative |
| s | Solid |
| S | Referring to the sensible energy stored |
| s,i | Referring to the internal surface |
| s,e | Referring to the external surface |
| sky | Referring to the sky load |
| sol | Referring to the solar load |
Superscripts
| + | Entering |
| − | Exiting |
| n | Current time instant |
| n+1 | Successive time instant |
Symbols
| ~ | Fluctuating value |
References
- Souayfane, F.; Fardoun, F.; Biwole, P.-H. Phase change materials (PCM) for cooling applications in buildings: A review. Energy Build. 2016, 129, 396–431. [Google Scholar] [CrossRef]
- Zhou, D.; Zhao, C.Y.; Tian, Y. Review on thermal energy storage with phase change materials (PCMs) in building applications. Appl. Energy 2012, 92, 593–605. [Google Scholar] [CrossRef]
- Kalnæs, S.E.; Jelle, B.P. Phase change materials and products for building applications: A state-of-the-art review and future research opportunities. Energy Build. 2015, 94, 150–176. [Google Scholar] [CrossRef]
- Han, Y.; Taylor, J.E. Simulating the Inter-Building Effect on energy consumption from embedding phase change materials in building envelopes. Sustain. Cities Soc. 2016, 27, 287–295. [Google Scholar] [CrossRef]
- Ascione, F.; Bianco, N.; De Masi, R.F.; de’ Rossi, F.; Vanoli, G.P. Energy refurbishment of existing buildings through the use of phase change materials: Energy savings and indoor comfort in the cooling season. Appl. Energy 2014, 113, 990–1007. [Google Scholar] [CrossRef]
- Halford, C.K.; Boehm, R.F. Modeling of phase change material peak load shifting. Energy Build. 2007, 39, 298–305. [Google Scholar] [CrossRef]
- Mazzeo, D.; Oliveti, G.; De Simone, M.; Arcuri, N. Analytical model for solidification and melting in a finite PCM in steady periodic regime. Int. J. Heat Mass Transf. 2015, 88, 844–861. [Google Scholar] [CrossRef]
- Mazzeo, D.; Oliveti, G.; Arcuri, N. Multiple bi-phase interfaces in a PCM layer subject to periodic boundary conditions characteristic of building external walls. Energy Procedia 2015, 82, 472–479. [Google Scholar] [CrossRef]
- Mazzeo, D.; Oliveti, G.; Arcuri, N. Definition of a new set of parameters for the dynamic thermal characterization of PCM layers in the presence of one or more liquid-solid interfaces. Energy Build. 2017, 141, 379–396. [Google Scholar] [CrossRef]
- Diaconu, B.M.; Cruceru, M. Novel concept of composite phase change material wall system for year-round thermal energy savings. Energy Build. 2010, 42, 1759–1772. [Google Scholar] [CrossRef]
- Wang, X.; Yu, H.; Li, L.; Zhao, M. Experimental assessment on the use of phase change materials (PCMs)-bricks in the exterior wall of a full-scale room. Energy Convers. Manag. 2016, 120, 81–89. [Google Scholar] [CrossRef]
- Chen, C.; Guo, H.; Liu, Y.; Yue, H.; Wang, C. A new kind of phase change material (PCM) for energy-storing wallboard. Energy Build. 2008, 40, 882–890. [Google Scholar] [CrossRef]
- Qureshi, W.A.; Nair, N.-K.C.; Farid, M.M. Impact of energy storage in buildings on electricity demand side management. Energy Convers. Manag. 2011, 52, 2110–2120. [Google Scholar] [CrossRef]
- Peippo, K.; Kauranen, P.; Lund, P.D. A multicomponent PCM wall optimized for passive solar heating. Energy Build. 1991, 17, 259–270. [Google Scholar]
- Athienitis, A.K.; Liu, C.; Hawes, D.; Banu, D.; Feldman, D. Investigation of the thermal performance of a passive solar test-room with wall latent heat storage. Build. Environ. 1997, 32, 405–410. [Google Scholar] [CrossRef]
- Hammou, Z.A.; Lacroix, M. A new PCM storage system for managing simultaneously solar and electric energy. Energy Build. 2006, 38, 258–265. [Google Scholar] [CrossRef]
- Castell, A.; Martorell, I.; Medrano, M.; Pérez, G.; Cabeza, L.F. Experimental study of using PCM in brick constructive solutions for passive cooling. Energy Build. 2010, 42, 534–540. [Google Scholar] [CrossRef]
- Lei, J.; Yang, J.; Yang, E.-H. Energy performance of building envelopes integrated with phase change materials for cooling load reduction in tropical Singapore. Appl. Energy 2016, 162, 207–217. [Google Scholar] [CrossRef]
- Kosny, J.; Kossecka, E.; Brzezinski, A.; Tleoubaev, A.; Yarbrough, D. Dynamic thermal performance analysis of fiber insulations containing bio-based phase change materials (PCMs). Energy Build. 2012, 52, 122–131. [Google Scholar] [CrossRef]
- Neeper, D.A. Thermal dynamics of wallboard with latent heat storage. Sol. Energy 2000, 68, 393–403. [Google Scholar] [CrossRef]
- Heim, D.; Clarke, J.A. Numerical modelling and thermal simulation of PCM-gypsum composites with ESP-r. Energy Build. 2004, 36, 795–805. [Google Scholar] [CrossRef]
- Xu, X.; Zhang, Y.; Lin, K.; Di, H.; Yang, R. Modeling and simulation on the thermal performance of shape-stabilized phase change material floor used in passive solar buildings. Energy Build. 2005, 37, 1084–1091. [Google Scholar] [CrossRef]
- Zhou, G.; Zhang, Y.; Wang, X.; Lin, K.; Xiao, W. An assessment of mixed type PCM-gypsum and shape-stabilized PCM plates in a building for passive solar heating. Sol. Energy 2007, 81, 1351–1360. [Google Scholar] [CrossRef]
- Jiang, F.; Wang, X.; Zhang, Y. A new method to estimate optimal phase change material characteristics in a passive solar room. Energy Convers. Manag. 2011, 52, 2437–2441. [Google Scholar] [CrossRef]
- Ye, H.; Long, L.; Zhang, H.; Zou, R. The performance evaluation of shape-stabilized phase change materials in building applications using energy saving index. Appl. Energy 2014, 113, 1118–1126. [Google Scholar] [CrossRef]
- Arnault, A.; Mathieu-Potvin, F.; Gosselin, L. Internal surfaces including phase change materials for passive optimal shift of solar heat gain. Int. J. Therm. Sci. 2010, 49, 2148–2156. [Google Scholar] [CrossRef]
- Sun, X.; Zhang, Q.; Medina, M.A.; Lee, K.O. Energy and economic analysis of a building enclosure outfitted with a phase change material board (PCMB). Energy Convers. Manag. 2014, 83, 73–78. [Google Scholar] [CrossRef]
- Sun, X.; Zhang, Q.; Medina, M.A.; Lee, K.O.; Liao, S. Parameter design for a phase change material board installed on the inner surface of building exterior envelopes for cooling in China. Energy Convers. Manag. 2016, 120, 100–108. [Google Scholar] [CrossRef]
- Thiele, A.M.; Sant, G.; Pilon, L. Diurnal thermal analysis of microencapsulated PCM-concrete composite walls. Energy Convers. Manag. 2015, 93, 215–227. [Google Scholar] [CrossRef]
- Zhou, D.; Shire, G.S.F.; Tian, Y. Parametric analysis of influencing factors in Phase Change Material Wallboard (PCMW). Appl. Energy 2014, 119, 33–42. [Google Scholar] [CrossRef]
- Kottek, M.; Grieser, J.; Beck, C.; Rudolf, B.; Rubel, F. World Map of the Köppen-Geiger climate classification updated. Meteorol. Z. 2006, 15, 259–263. [Google Scholar] [CrossRef]
- Heating and Cooling of Buildings—Climatic Data; UNI 10349; Italian Organization for Standardization (UNI): Milan, Italy, 1994.
- TRNSYS; Version 17; Solar Energy Laboratory University of Wisconsin-Madison: Madison, WI, USA, 2012.
- Energy Performance of Buildings—Calculation of Energy Use for Space Heating and Cooling; EN ISO 13790; European Committee for Standardization (CEN): Geneva, Switzerland, 2008.
- Energy Performance of Buildings Part 1—Evaluation of Energy Need for Space Heating and Cooling; UNI TS 11300-1; Italian Organization for Standardization (UNI): Milan, Italy, 2008.
- Building Components and Building Elements—Thermal Resistance and Thermal Transmittance—Calculation Method; EN ISO 6946; International Organization for Standardization: Geneva, Switzerland, 1997.
- Oliveti, G.; Arcuri, N.; De Simone, M.; Bruno, R. Experimental evaluations of the building shell radiant exchange in clear sky conditions. Sol. Energy 2012, 86, 1785–1795. [Google Scholar] [CrossRef]
Figure 1.
Thermal exchanges schematization on the external and internal surface of the phase change material (PCM) layer.
Figure 1.
Thermal exchanges schematization on the external and internal surface of the phase change material (PCM) layer.

Figure 2.
Energy entering and energy exiting through the external surface, and and through the internal surface, and of the PCM layer.
Figure 2.
Energy entering and energy exiting through the external surface, and and through the internal surface, and of the PCM layer.
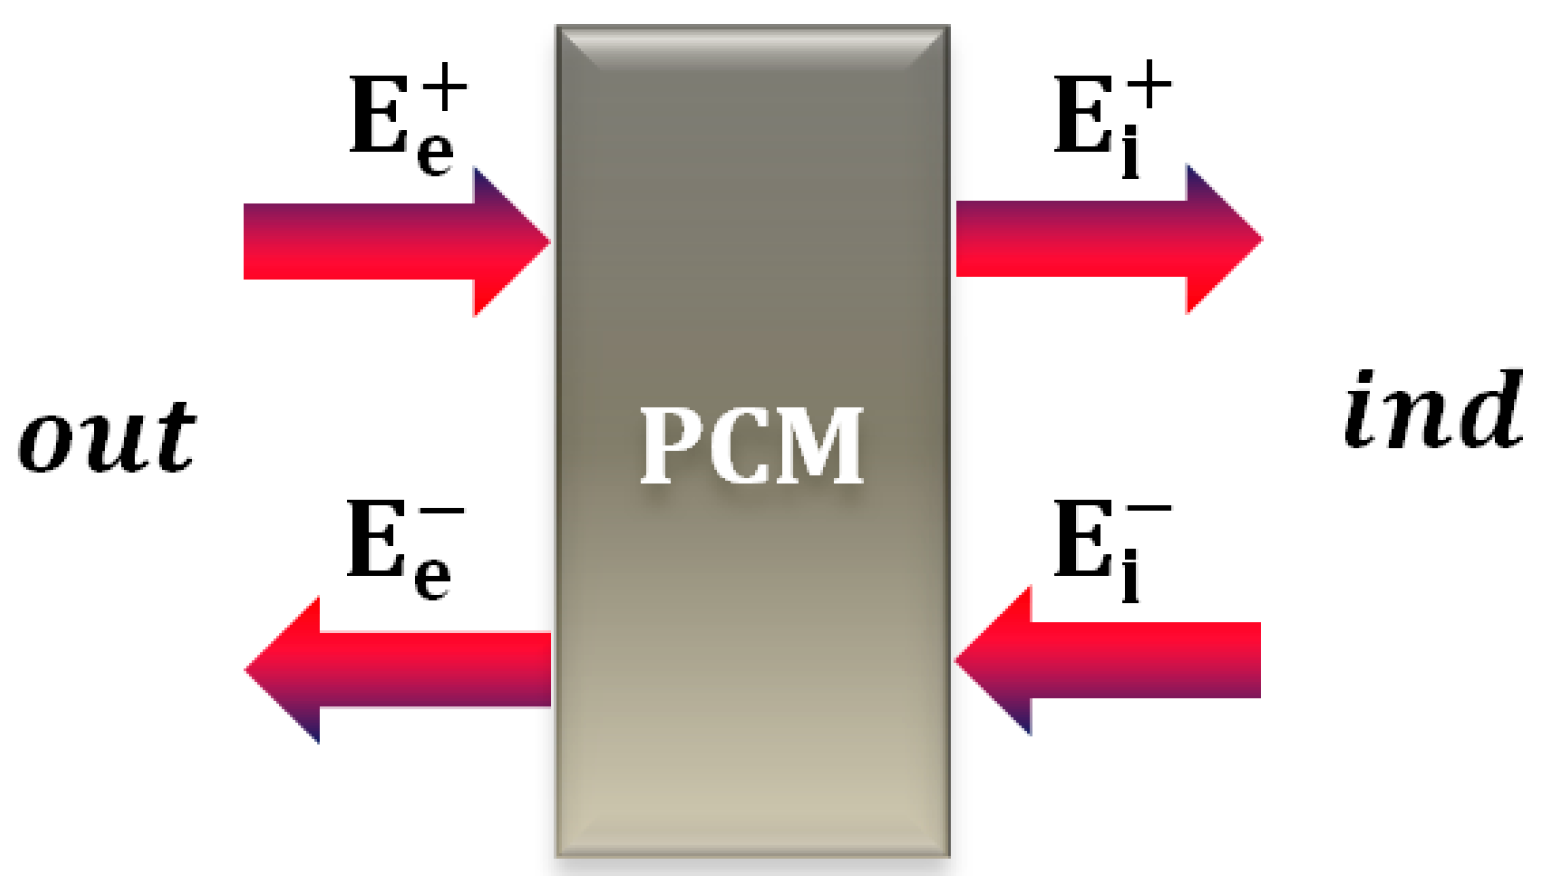
Figure 3.
Characteristic day of the different months in Cosenza and Turin. In each image: incident solar radiation on the vertical plane exposed to South on the left axis, and sky temperature and external air temperature on the right axis.
Figure 3.
Characteristic day of the different months in Cosenza and Turin. In each image: incident solar radiation on the vertical plane exposed to South on the left axis, and sky temperature and external air temperature on the right axis.
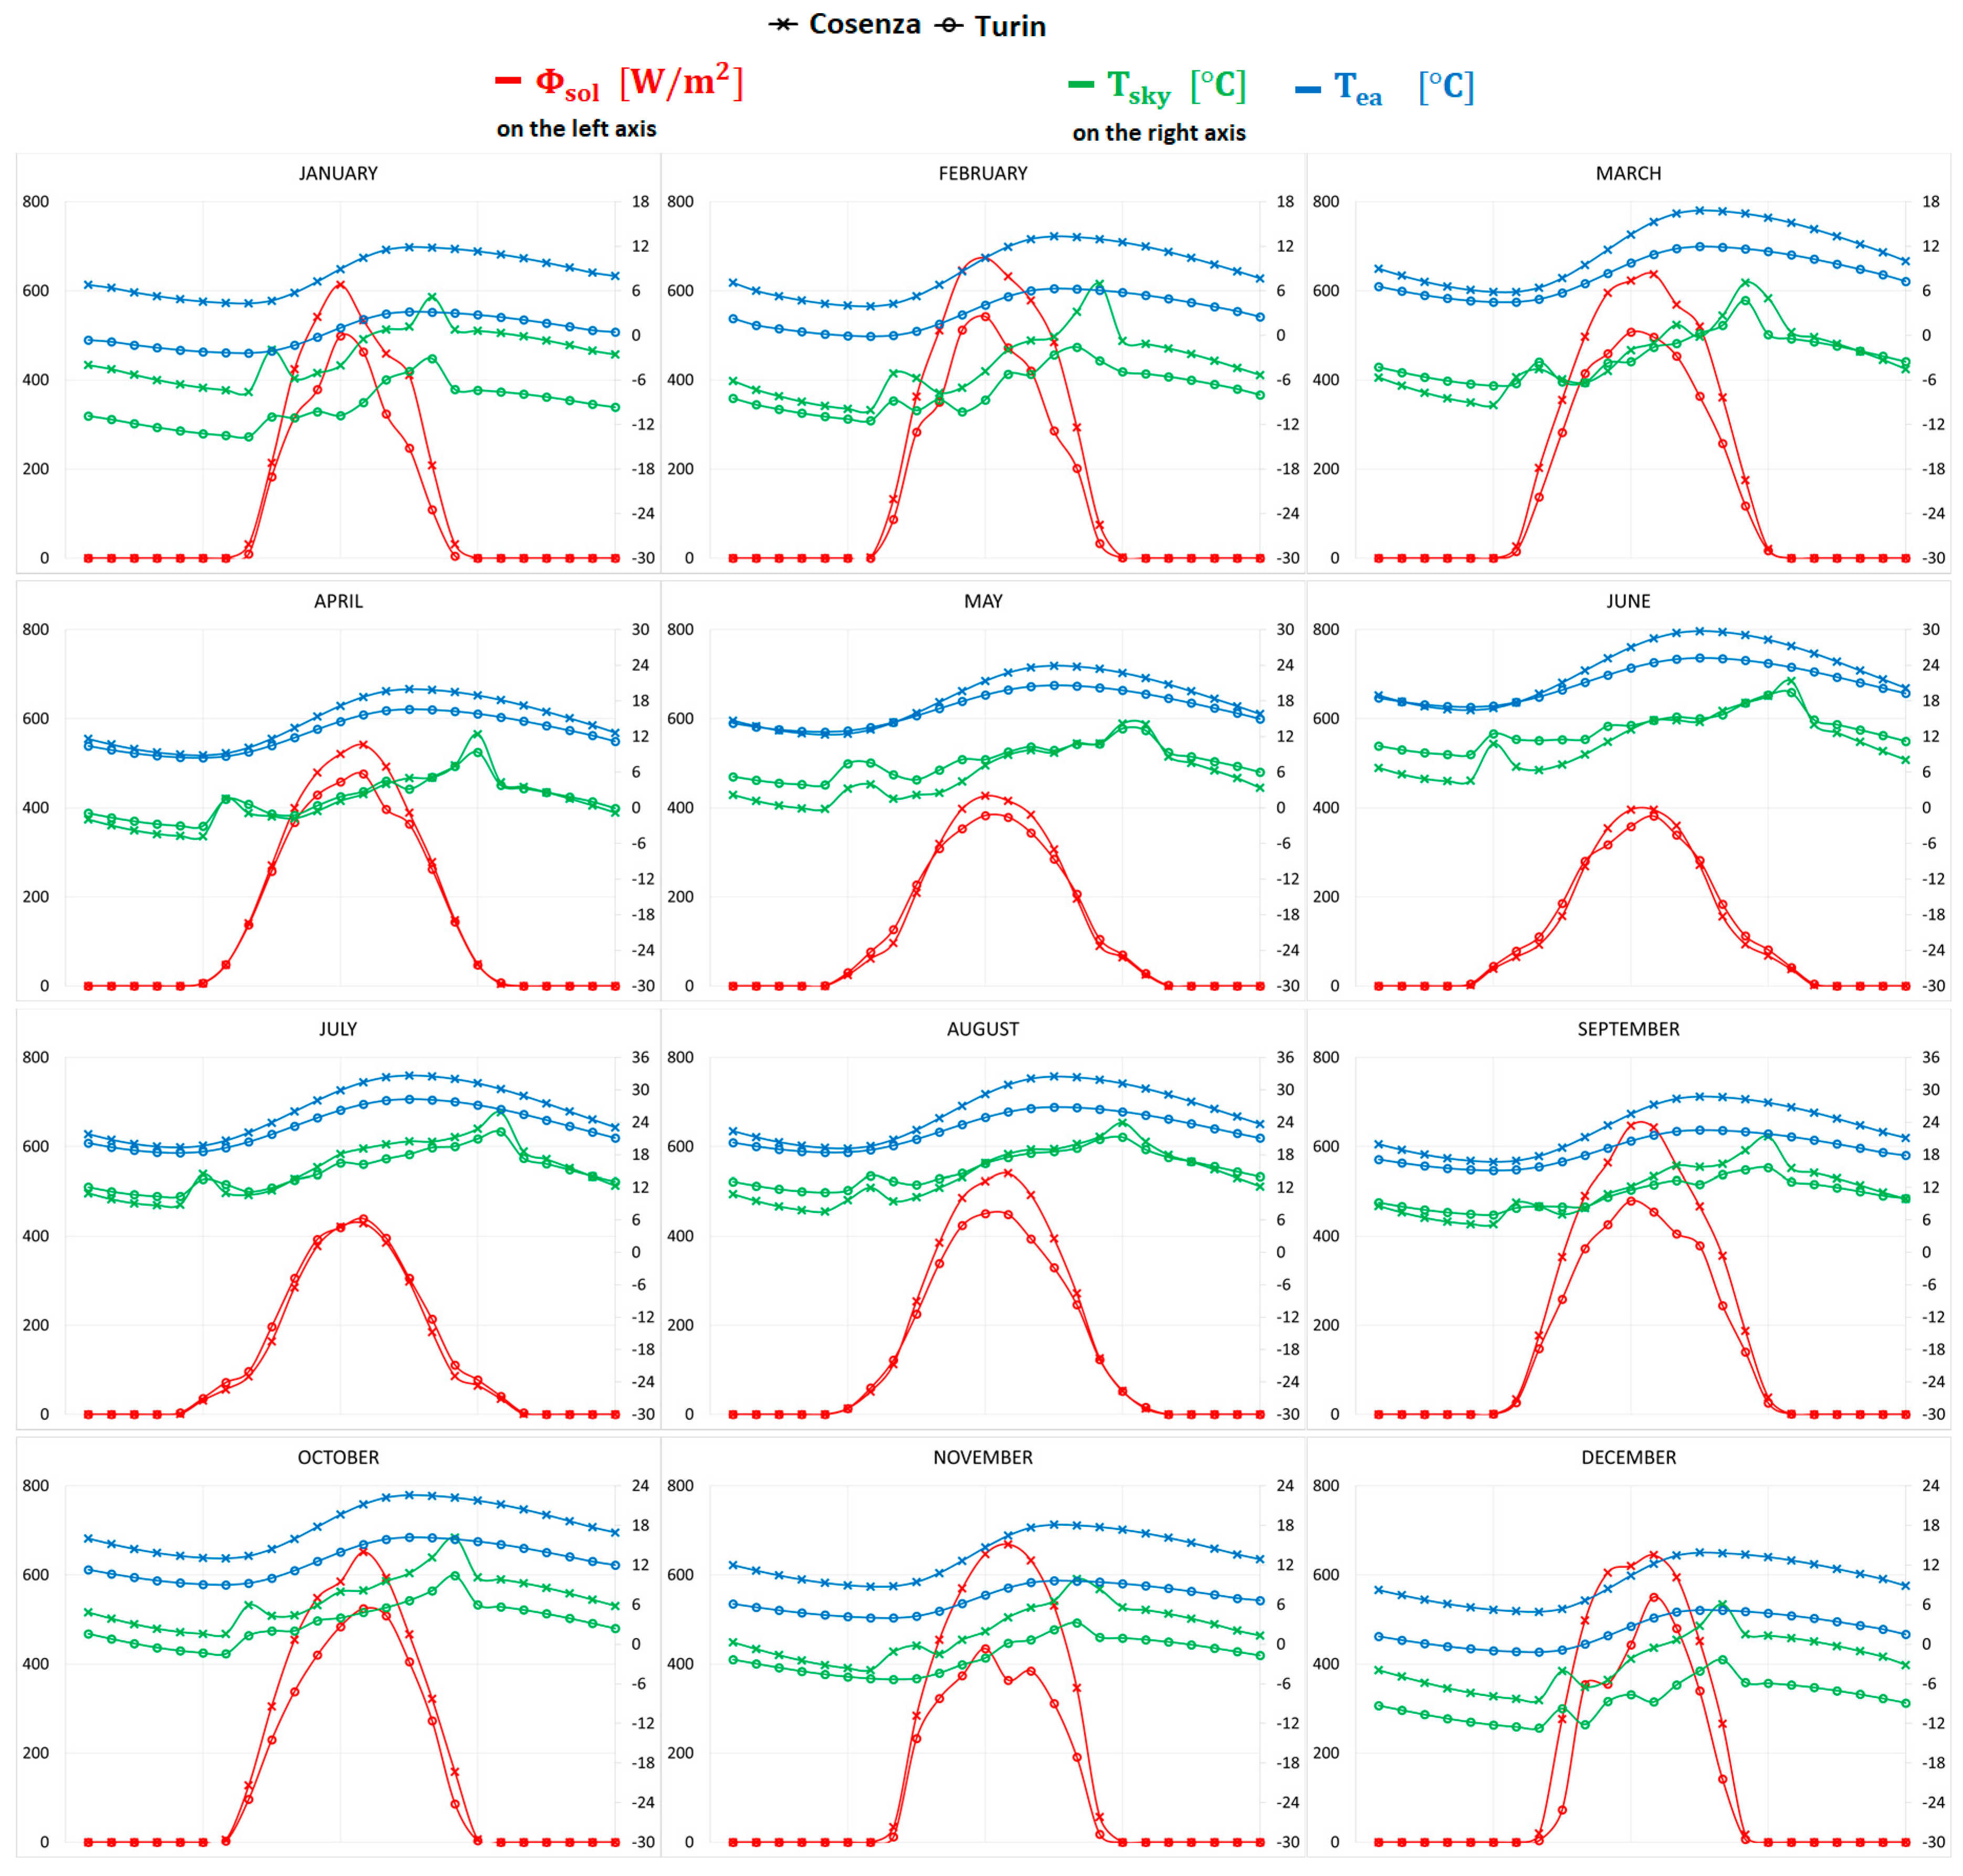
Figure 4.
Monthly average daily total ET, latent EL and sensible ES energy stored in the different months for each type of PCM considered; Turin on the left (a–e) and Cosenza on the right (f–j).
Figure 4.
Monthly average daily total ET, latent EL and sensible ES energy stored in the different months for each type of PCM considered; Turin on the left (a–e) and Cosenza on the right (f–j).

Figure 5.
Monthly average daily values of the total energy and of the fluctuating component transferred through the external surface, , and , and through the internal surface, , and , for the different PCMs, Turin.
Figure 5.
Monthly average daily values of the total energy and of the fluctuating component transferred through the external surface, , and , and through the internal surface, , and , for the different PCMs, Turin.


Figure 6.
Monthly average daily values of the total energy and of the fluctuating component transferred through the external surface, , and , and through the internal surface, , and , for the different PCMs, Cosenza.
Figure 6.
Monthly average daily values of the total energy and of the fluctuating component transferred through the external surface, , and , and through the internal surface, , and , for the different PCMs, Cosenza.

Figure 7.
Seasonal energies entering and the air-conditioned environment and energies exiting and from the air-conditioned environment, for the different PCMs taken into consideration, for Turin (a) and Cosenza (b).
Figure 7.
Seasonal energies entering and the air-conditioned environment and energies exiting and from the air-conditioned environment, for the different PCMs taken into consideration, for Turin (a) and Cosenza (b).

Figure 8.
Yearly sensible ES, latent EL and total ET energy stored for the different PCMs. Values for Turin are on the left (a) and for Cosenza are on the right (b).
Figure 8.
Yearly sensible ES, latent EL and total ET energy stored for the different PCMs. Values for Turin are on the left (a) and for Cosenza are on the right (b).


Table 1.
Thermophysical properties of the different types of PCM.
| Company | PCM | TM (°C) | H (kJ/kg) | ρ (kg/m3) | k (W/(m K)) | c (J/(kg K)) |
|---|---|---|---|---|---|---|
| EPS Yaxley (UK) | S15 | 15 | 160 | 1510 | 0.43 | 1900 |
| TEAP Mumbai (India) | LATEST20T | 20 | 175 | 1490 | 1 | 2000 |
| savENRG Arden, NC (USA) | HS22P | 23 | 185 | 1690 | 0.815 | 3060 |
| RUBITHERM Berlin (Germany) | SP26E | 26 | 190 | 1450 | 0.6 | 2000 |
| CLIMATOR Skövde (Sweden) | C32 | 32 | 162 | 1420 | 0.6 | 3600 |
Table 2.
Number (1, 2, 3) of bi-phase interfaces present in the layer in the different months of the year in Cosenza and Turin for the different PCMs. sol the entire layer is in solid phase, liq the entire layer is in liquid phase.
Table 2.
Number (1, 2, 3) of bi-phase interfaces present in the layer in the different months of the year in Cosenza and Turin for the different PCMs. sol the entire layer is in solid phase, liq the entire layer is in liquid phase.
| Turin | |||||
| S15 | LATEST20T | HS22P | SP26E | C32 | |
| JAN | sol | sol | sol | sol | sol |
| FEB | 1 | sol | sol | sol | sol |
| MAR | 3 | sol | sol | sol | sol |
| APR | 3 | 2 | sol | sol | sol |
| MAY | 2 | 3 | 1 | sol | sol |
| JUN | liq | 2 | 2 | 2 | sol |
| JUL | liq | 1 | 2 | 2 | sol |
| AUG | liq | 2 | 2 | 2 | sol |
| SEP | 1 | 2 | 2 | 2 | sol |
| OCT | 2 | 2 | sol | sol | sol |
| NOV | 2 | sol | sol | sol | sol |
| DEC | 1 | sol | sol | sol | sol |
| Cosenza | |||||
| S15 | LATEST20T | HS22P | SP26E | C32 | |
| JAN | 3 | sol | sol | sol | sol |
| FEB | 3 | 2 | sol | sol | sol |
| MAR | 3 | 2 | sol | sol | sol |
| APR | 2 | 3 | 2 | sol | sol |
| MAY | 2 | 3 | 2 | 2 | sol |
| JUN | liq | 2 | 2 | 2 | sol |
| JUL | liq | 1 | 2 | 2 | 2 |
| AUG | liq | 1 | 2 | 2 | 2 |
| SEP | liq | 2 | 2 | 2 | 2 |
| OCT | 2 | 3 | 2 | 2 | sol |
| NOV | 2 | 2 | 2 | 1 | sol |
| DEC | 3 | 2 | sol | sol | sol |
© 2017 by the authors. Licensee MDPI, Basel, Switzerland. This article is an open access article distributed under the terms and conditions of the Creative Commons Attribution (CC BY) license (http://creativecommons.org/licenses/by/4.0/).
Share and Cite
MDPI and ACS Style
Mazzeo, D.; Oliveti, G.; Arcuri, N. A Method for Thermal Dimensioning and for Energy Behavior Evaluation of a Building Envelope PCM Layer by Using the Characteristic Days. Energies 2017, 10, 659. https://doi.org/10.3390/en10050659
AMA Style
Mazzeo D, Oliveti G, Arcuri N. A Method for Thermal Dimensioning and for Energy Behavior Evaluation of a Building Envelope PCM Layer by Using the Characteristic Days. Energies. 2017; 10(5):659. https://doi.org/10.3390/en10050659
Chicago/Turabian StyleMazzeo, Domenico, Giuseppe Oliveti, and Natale Arcuri. 2017. "A Method for Thermal Dimensioning and for Energy Behavior Evaluation of a Building Envelope PCM Layer by Using the Characteristic Days" Energies 10, no. 5: 659. https://doi.org/10.3390/en10050659
Note that from the first issue of 2016, this journal uses article numbers instead of page numbers. See further details here.