Article

2D Numerical Simulation of Improving Wellbore Stability in Shale Using Nanoparticles Based Drilling Fluid

1
School of Engineering, China University of Geosciences, Wuhan 430074, China
2
115 Geological Team, Bureau of Geology and Mineral Exploration and Development of Guizhou Province, Guiyang 551400, China
3
Chengdu Team of Hydrogeology and Engineering Geology, Chengdu 610072, China
*
Authors to whom correspondence should be addressed.
Energies 2017, 10(5), 651; https://doi.org/10.3390/en10050651
Submission received: 13 January 2017 / Revised: 13 April 2017 / Accepted: 2 May 2017 / Published: 9 May 2017
(This article belongs to the Special Issue Nanotechnology for Oil and Gas Applications)

Abstract

:
The past decade has seen increased focus on nanoparticle (NP) based drilling fluid to promote wellbore stability in shales. With the plugging of NP into shale pores, the fluid pressure transmission can be retarded and wellbore stability can be improved. For better understanding of the interaction between shale and NP based drilling fluid based on previous pressure transmission tests (PTTs) on Atoka shale samples, this paper reports the numerical simulation findings of wellbore stability in the presence of NP based drilling fluid, using the 2D fluid-solid coupling model in FLAC3D™ software. The results of previous PTT are discussed first, where the steps of numerical simulation, the simulation on pore fluid pressure transmission, the distribution of stress and the deformation of surrounding rock are presented. The mechanisms of NP in reducing permeability and stabilizing shale are also discussed. Results showed that fluid filtrate from water-based drilling fluid had a strong tendency to invade the shale matrix and increase the likelihood of wellbore instability in shales. However, the pore fluid pressure near wellbore areas could be minimized by plugging silica NP into the nanoscale pores of shales, which is consistent with previous PTT. Pore pressure transmission boundaries could also be restricted with silica NP. Furthermore, the stress differential and shear stress of surrounding rock near the wellbore was reduced in the presence of NP. The plastic yield zone was minimized to improve wellbore stability. The plugging mechanism of NP may be attributed to the electrostatic and electrodynamic interactions between NP and shale surfaces that are governed by Derjaguin-Landau-Verwey-Overbeek (DLVO) forces, which allowed NP to approach shale surfaces and adhere to them. We also found that discretization of the simulation model was beneficial in distinguishing the yield zone distribution of the surrounding rock in shales. The combination of PTT and the 2D numerical simulation offers a better understanding of how NP-based drilling fluid can be developed to address wellbore stability issues in shales.

1. Introduction

In the oil and gas industry, 75% of all footage was drilled in shale formations which are responsible for 90% of wellbore stability problems [1,2,3]. The main cause of shale instability for both soft and hard shales is water absorption and the subsequent swelling and sloughing of the wellbore [4]. Wellbore pressure penetrates the pore space when water invades the shale. This reduction of true overbalance, which acts as a support pressure for the borehole, can result in shale failure and wellbore instability [5].
Viable types of engineered drilling fluids have been developed to address wellbore stability issues in shale formations. Chenevert [4] suggested balanced-activity oil-continuous muds as a solution to address shale instability issues as there is no interaction between oil and shale. However, for environmental and economic considerations, water-based drilling fluids are preferred if the interaction between the drilling fluid and shale can be minimized. Hayatdavoudi and Apande [6] found that the best possible way of preventing contact between argillaceous rock and water was to seal off exposed clayey surfaces. Carminati et al. [7] showed that the most effective additives in controlling pore fluid pressure in formation and shale hardness, and consequently in preventing shale instability, were the silicates. Van Oort et al. [3] introduced environmentally friendly and inexpensive silicate-based muds as superior fluids for drilling troublesome formations like intact and (micro-) fractured shales and chalks. Reid et al. [8] regarded the interaction between potassium ions and polyols at the clay surface as the critical factor in the provision of shale inhibition. Zhong et al. [9] discovered the mechanism of polyether diamine improving shale wellbore stability in water-based drilling fluids. Van Oort et al. [10] used a high-performance water-based mud to improve wellbore stability in Tor/Ekofisk wells through careful shale-fluid compatibility optimization.
However, unlike traditional sandstone and carbonate reservoirs, shales feature nano-sized pores. The pore diameter of gas shales in China and North America ranges from 5 to 300 nm and 8 to 100 nm, respectively [11,12,13,14,15,16,17]. Therefore, the past decade has seen an increase in NP use to improve wellbore stability in shales [18,19,20,21,22,23,24,25,26,27,28,29,30,31]. To assess wellbore stability in the presence of NP, triaxial failure tests, pressure transmission tests (PTTs), and modified thick walled cylinder (TWC) tests with drilling fluid exposure have been recommended by van Oort et al. [32]. Hoxha et al. [33] used the latter two tests combined with zeta potential measurements to investigate the interaction of NP and intact shales. Hydraulic conductivity and a “PTT delay factor” were used to measure fluid pressure transmission. Electrostatic and electrodynamic interaction between NP and shale surfaces, governed by Derjaguin-Landau-Verwey-Overbeek (DLVO) forces, is considered the main mechanism that leads to pore throat plugging in shales. They stated that NP use for practical shale stabilization required a dedicated, thoroughly engineered solution for each particular field application.
Additionally, numerical simulation is another important method used to conduct rock-fluid interaction research, especially in shale formations. It can present visualized time dependent contour maps of stress and strain in near-wellbore areas for a better understanding of downhole wellbore instability issues and can supplement experimental appraisals on wellbore stability in shales. Frydman et al. [34] discussed the modeling aspects of the coupled process by comparing three formulations: An analytical elastic solution without the diffusion process, an analytical poroelasticity solution, and a numerical chemical hydro-mechanical model. Yu et al. [35] introduced a chemical-mechanical wellbore instability model for shales that accounted for solute diffusion and found that the onset of instability depended not only on water activity, but also on the properties of the solutes. Zhai et al. [36] developed a poro-thermo-mechanical model that integrated the effects of both thermal and hydraulic diffusion to determine the effects of drilling fluid and mud weight on the wellbore system. They found that the pressure differential effect was dominant in high mobility formation while thermal effect was important for low mobility formation. They subsequently improved this model by coupling the chemical-thermal-poro-mechanical effect on borehole stability [37]. The time dependent borehole stability is mainly caused by chemical and thermal diffusion. Huang et al. [38] obtained a chemo-poro-elastic stability model, incorporating drilling fluid-induced chemical osmotic in situ stress. It was found that both the compressive failure index and tensile failure index are a function of pore pressure. The salinity of drilling fluids cause chemical osmotic pressure and further affect the effective principle stresses. Wang et al. [39] reported a fluid-solid-chemistry coupling model that considered fluid flow and ion transmission (induced by shale-drilling) fluid system electrochemical potential osmosis, nonlinearity of flow and solute diffusion in the shale-drilling fluid system, and solid deformation resulted from fluid flow and ion transmission. They found that previous linear models overestimated the pore pressure and stress fields around the sidewall. Wen et al. [40] established a chemo-mechanical coupling model of wellbore stability in hard brittle shale that considered structure characteristics and targeted hydration. Accurate prediction of collapse pressure distribution was obtained by the chemo-mechanical coupling model, where borehole stability was ensured and the density of drilling fluid decreased as long as the drilling fluid activity was controlled in the window. Zhuang et al. [41] investigated the feasibility of utilizing hard rock for compressed air energy storage (CAES) by a couple thermo-hydro-mechanical model. It was found that mass control based CAES operation resulted in energy loss. Supplementary air injection was needed to maintain the required pressure level. Zhu et al. [42] developed a nonlinear semi-concurrent multi-scale method for modeling crack propagation (evolving from micro-structure) for non-linear material behavior and found that it was effective for modeling dynamic damage evolution for brittle materials.
Based on our previous PTT with Atoka shale [19], this paper reports the numerical simulation findings of wellbore stability in the presence of silica (SiO2) NP based drilling fluid, using the 2D fluid-solid coupling model in FLAC3D™ software (Version 3.0, Minneapolis, MN, USA). The results of our previous PTT is first discussed. The steps of numerical simulation, the simulation on fluid pressure transmission in shales, the distribution of stress, and the deformation of surrounding rock are presented. The mechanism of NP in reducing the permeability and stabilizing shale is also discussed.

2. Pressure Transmission Tests on Shale

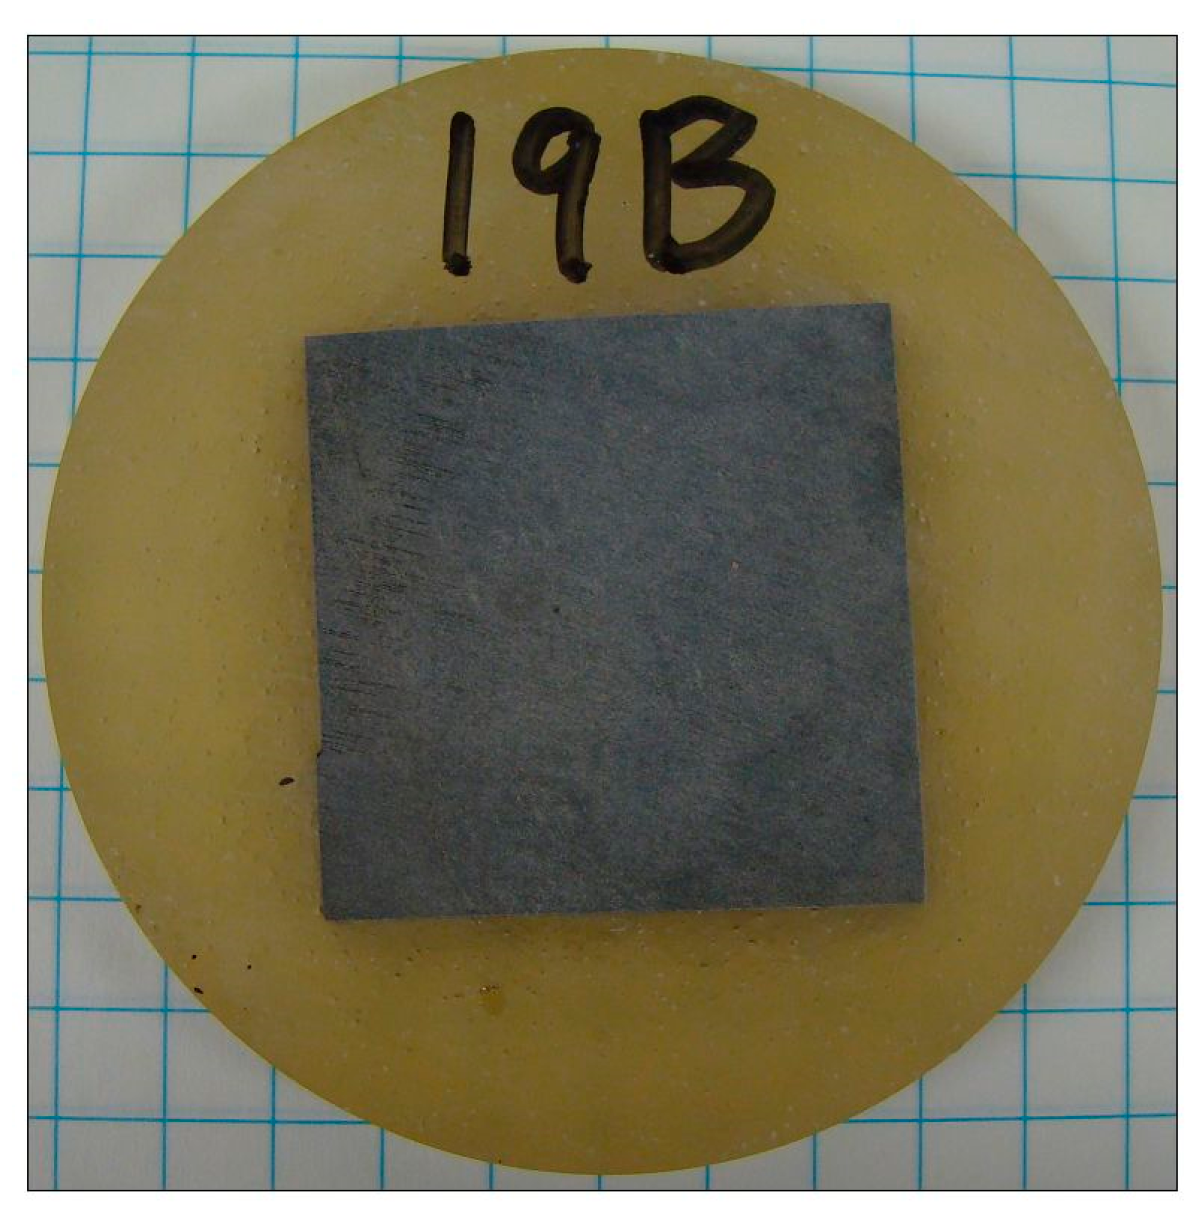
2.1. Experimental Materials
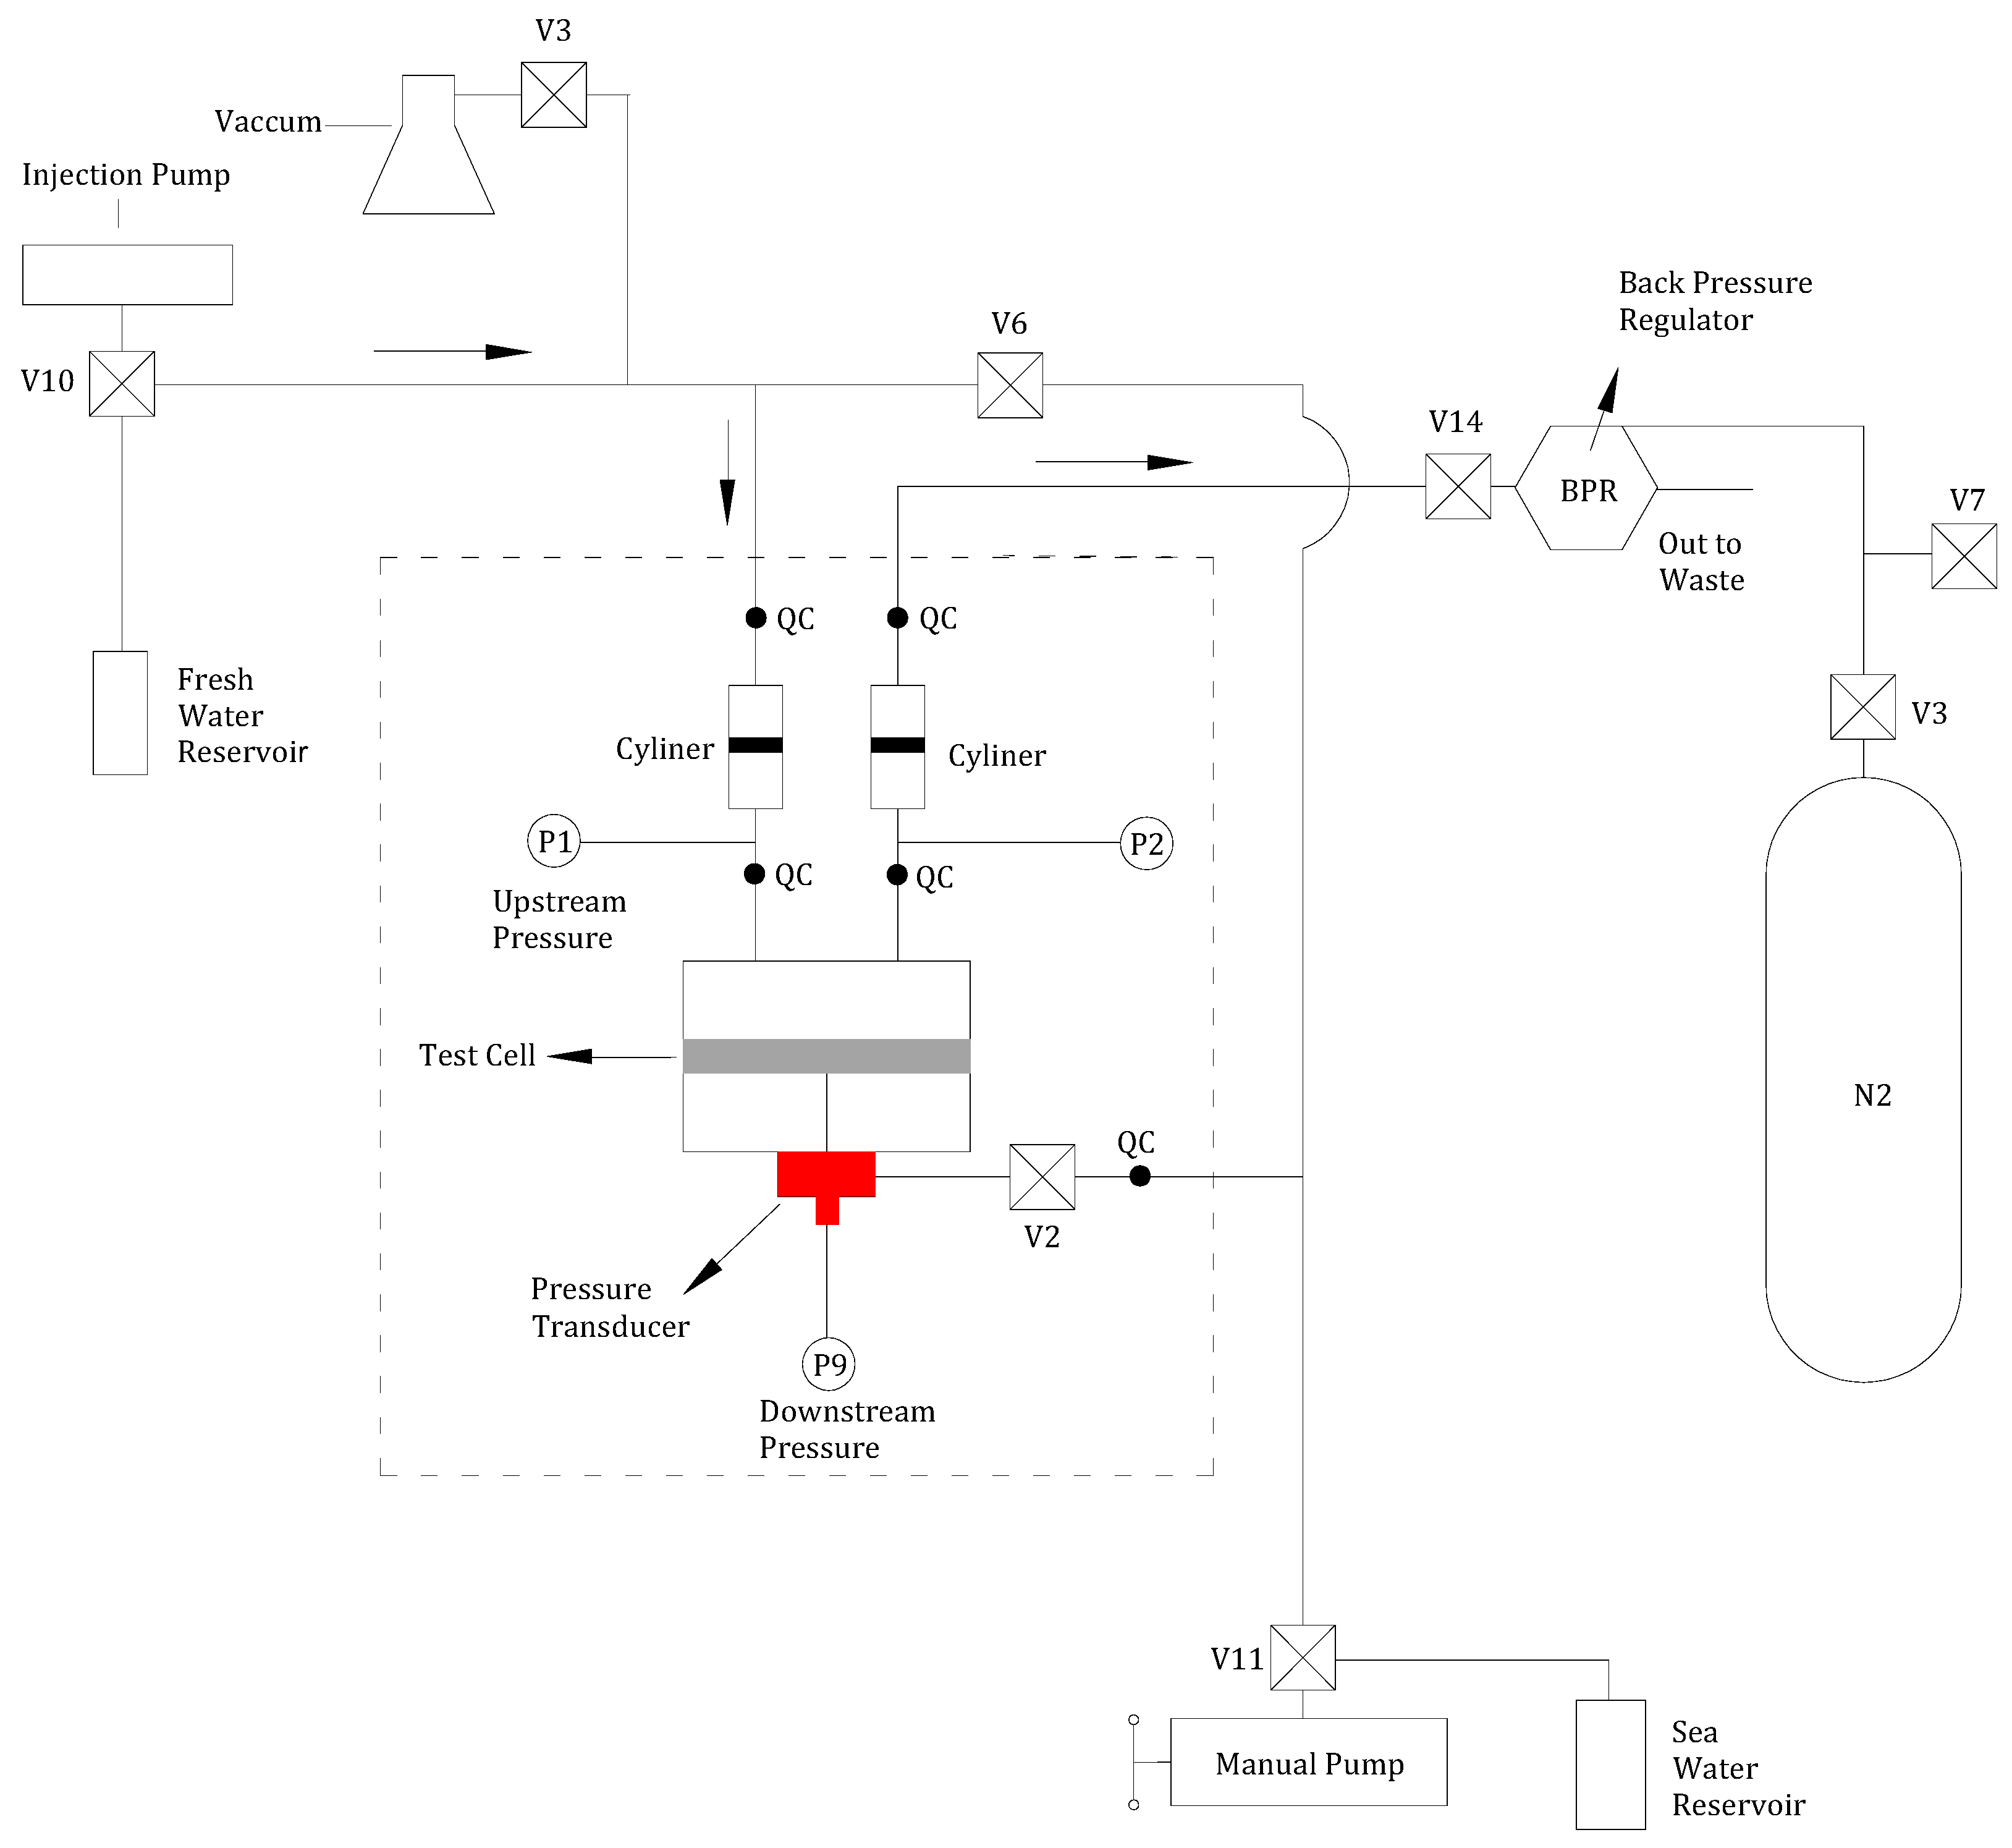
Two types of SiO2 NP (denoted as NP-A and NP-B, respectively) were employed and their basic properties are shown in Table 1.
In this study, hard and preserved Atoka shale samples were numbered as #1 and #2, which comprised 52% quartz, 15% feldspar and 33% clay mineral—which included kaolinite (32%), chlorite (7%), illite (31%), smectite (19%) and mixed-layer (11%). It had an average pore size of 30 nm, and thus, it had relatively strong water sensitivity. Great care was taken to preserve the samples with its native water activity [32,43]. The bentonite mud (BM) used had a plastic viscosity of 41 mPa·s, a yield point of 25 Pa and an API fluid loss of 8.6 mL [19].

2.2. Methodology

PTT measures the tendency of a mud filtrate, applied at overbalance pressure, to invade the shale fabric and elevate the near wellbore pore pressure [3,44,45]. This “mud pressure penetration” effect can be an important cause of time-delayed shale failure. Pore pressure transmission in shales is at least one to two orders of magnitude faster than solute or ion diffusion, which in turn is one or two orders of magnitude faster than the Darcy flow of mud filtrate [46]. Therefore, PTT can be used to conduct fundamental investigations on shale-fluid interactions, and for the development of drilling fluids to promote wellbore stability. The detailed mechanics and procedures of the test can be found in the related literature [3,44,45]. The sliced shale cores were fixed with cured epoxy resin to create a confining pressure, as shown in Figure 1. The symbol on the shale sample was marked for reorganization in the original tests. The setup of PTT (Figure 2) consists of several devices to achieve a continuous flow of the test fluid across the top face of the shale sample while the simulated pore fluid was kept in contact with the lower face of the shale. The “simulated pore fluid” referred to was a 4 wt. % sea salt solution with a 0.98 water activity (aw). Its initial pressure was loaded to 0.34 MPa (50 psi). A test fluid flowed across the top of a shale sample (Figure 1) at a constant pressure of 2.07 MPa (300 psi) and the buildup of fluid pressure in a small sealed chamber located at the bottom of the shale was recorded automatically. The rate of pressure penetration provided a direct and quantitative measurement of shale permeability. Detailed equations for this computation were provided by Al-Bazali [45].
A three-step testing procedure was followed as we found that coring samples from the same shale rock did not have the same original permeability. It was decided to first flow sea water through shale samples until equilibrium was reached to produce saturated shale samples that had the same starting conditions. In step 2, a PTT was run using BM to obtain ‘base mud’ permeability for that sample. Finally, the test was run using the BM that contained 10 wt. % silica NP (BM plus NP). The percent permeability reduction (Δk) was calculated based on the permeability obtained in the second step (times 100) [19].

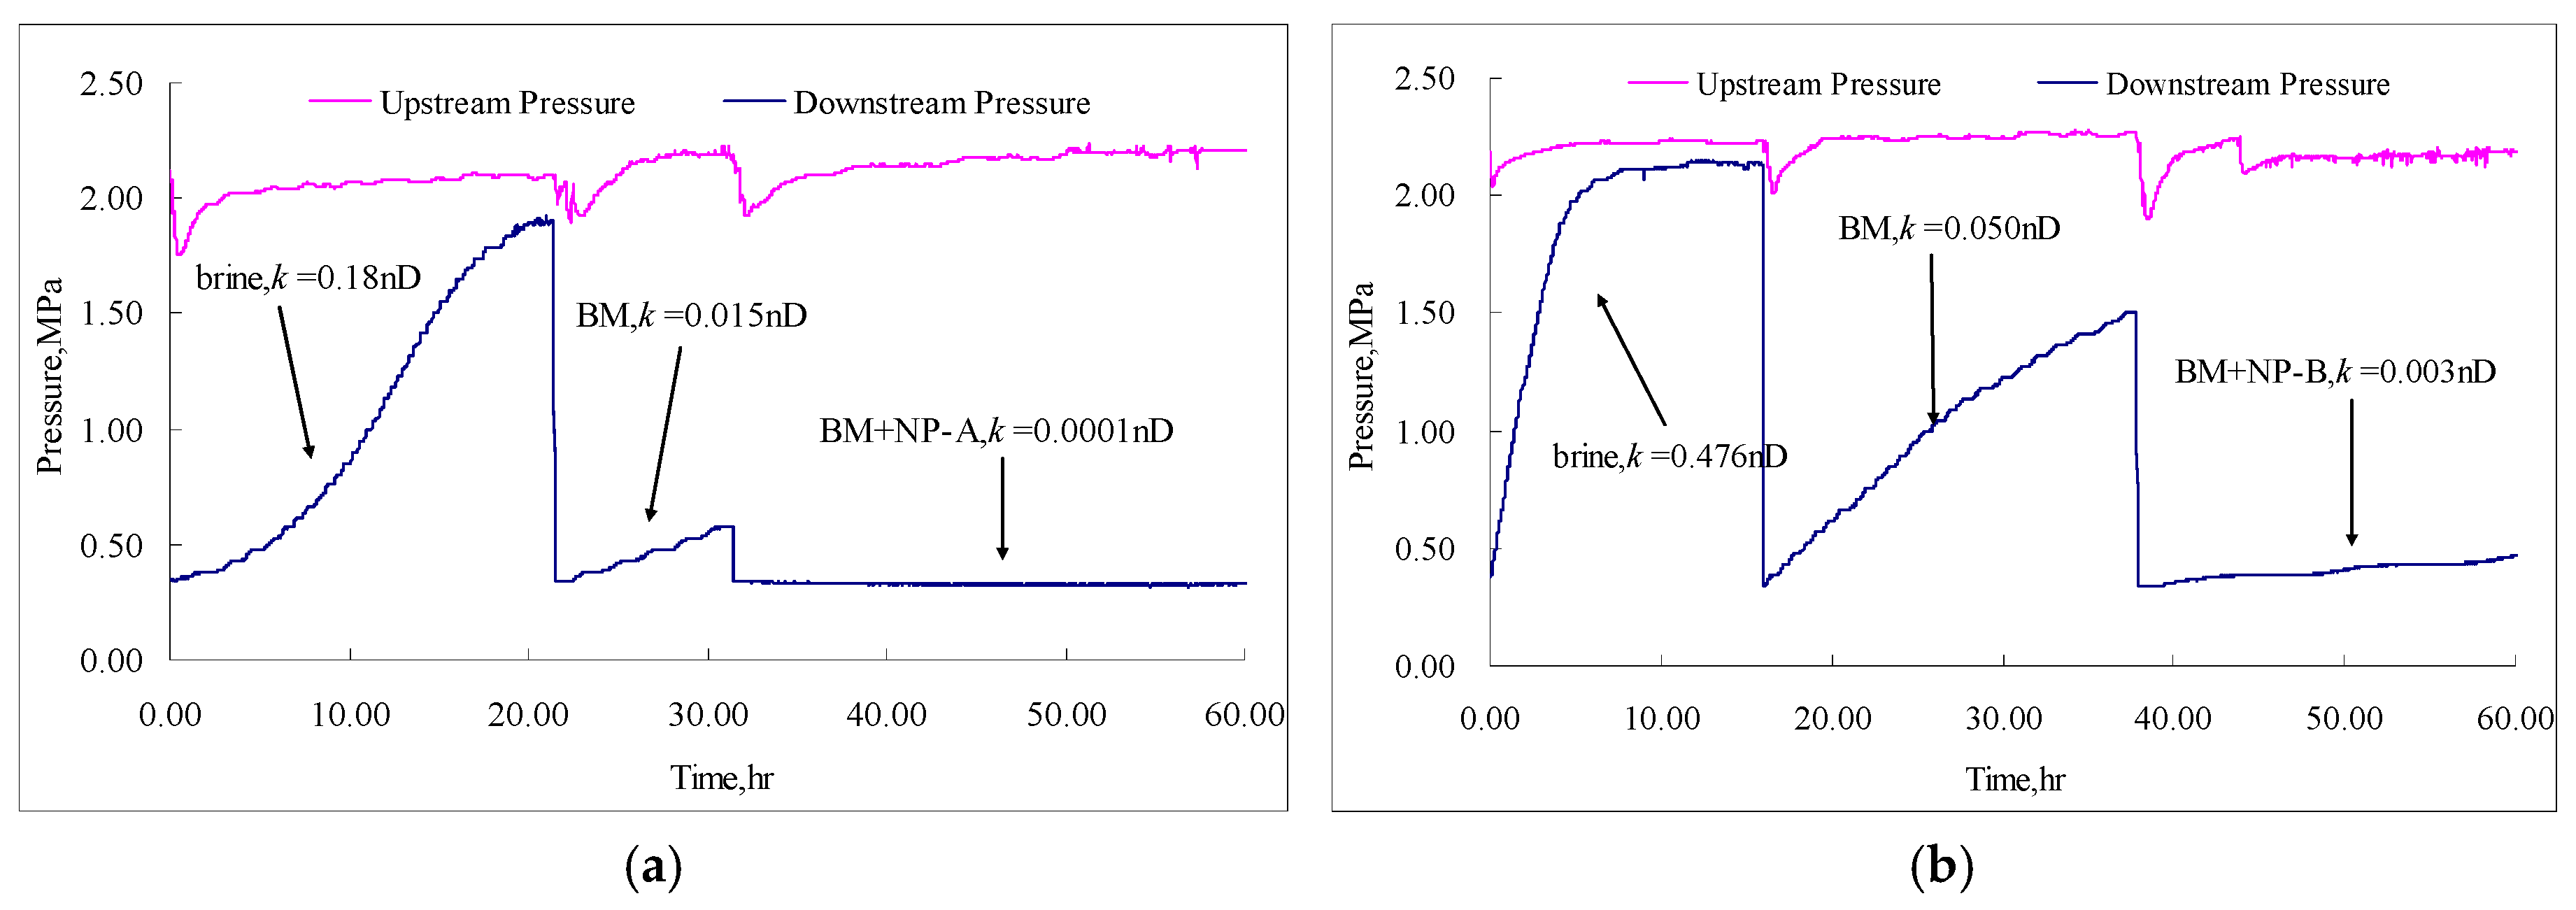
2.3. PTT Results Analysis

2.3.1. Pore Fluid Pressure Transmission from Drilling Fluid to Shale

In step 1, the downstream pressure of shale in contact with sea water (brine) quickly climbed close to the upstream pressure in approximately 20 h (Figure 3a), driven by the positive pressure difference. In the next step with the BM, the rising tendency of downstream pressure was still obvious for about 10 h. Finally, in the presence of SiO2 NP with the BM, the curve of the downstream pressure vs. time was almost flat (Figure 3a). A similar result was obtained when the tests were conducted with #2 Atoka shale sample (Figure 3b), revealing that SiO2 NP could effectively mitigate pore pressure transmission and the invasion tendency of water from the BM, therefore improving wellbore stability in shales.

2.3.2. The Influence of NP on Shale Permeability

The permeability of shale samples in contact with the three types of fluids above-mentioned was calculated, and is shown in Table 2. The permeability reduction rates (Δk) based on the permeability of shales in contact with the BM was as high as 99.33% and 94.00%, respectively, indicating that the perfect plugging performance of SiO2 NP into the Atoka shale samples was obtained.
It was also found that NP with size varying from 7 to 15 nm had better plugging performance than those with size greater than 20 nm [19]. We speculated that only NP particles with a size in this range could enter and plug the pore throat of shale, therefore minimizing the fluid invasion tendency for shale. It must also be pointed out that a range of 7–15 nm NP worked well for Atoka shale; however, other sizes may be needed for other shale types. In addition, the specific type of shale, the specific type, size and concentration of NP, the interaction between NP and shale, and external factors such as pH, salinity, temperature require detailed investigation [33].

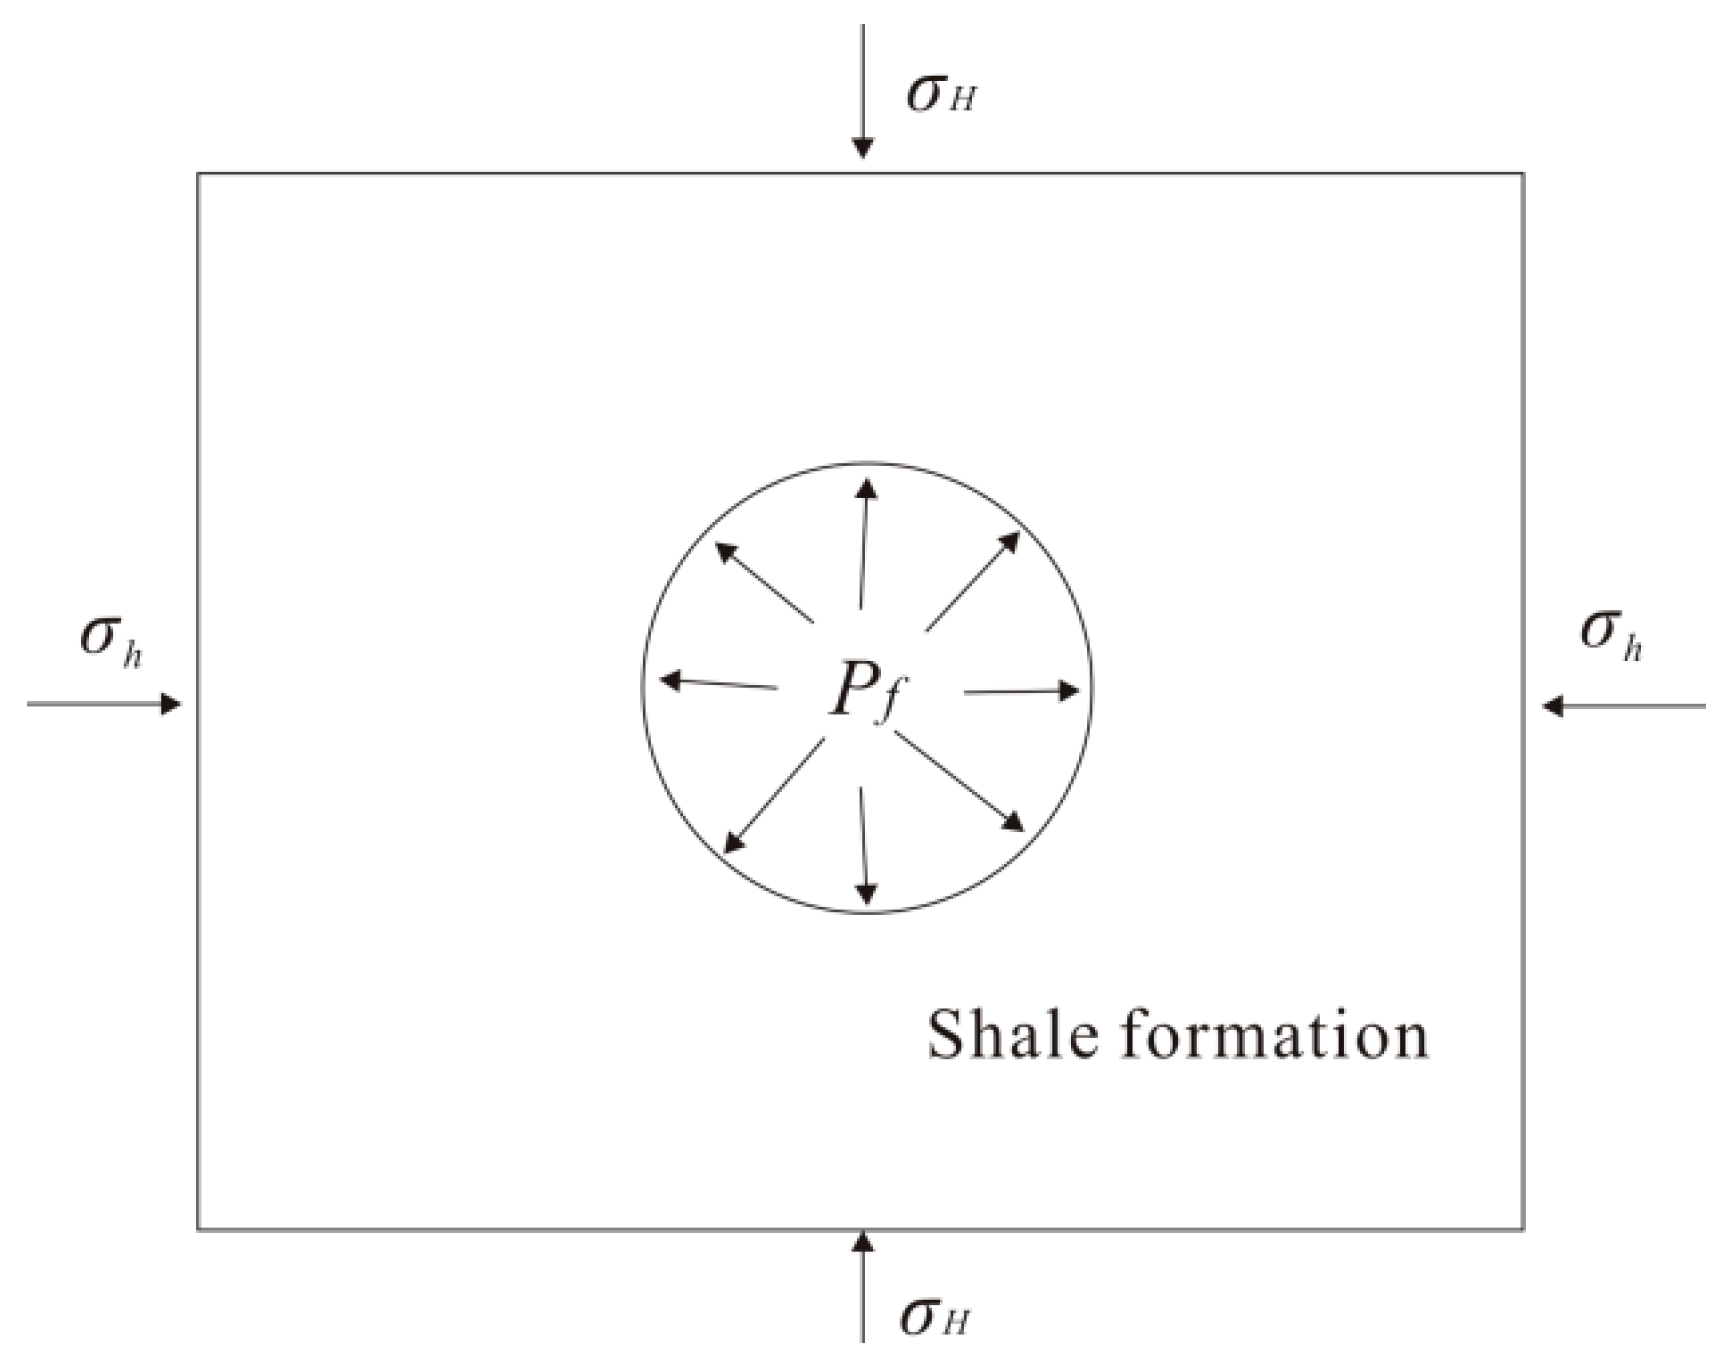
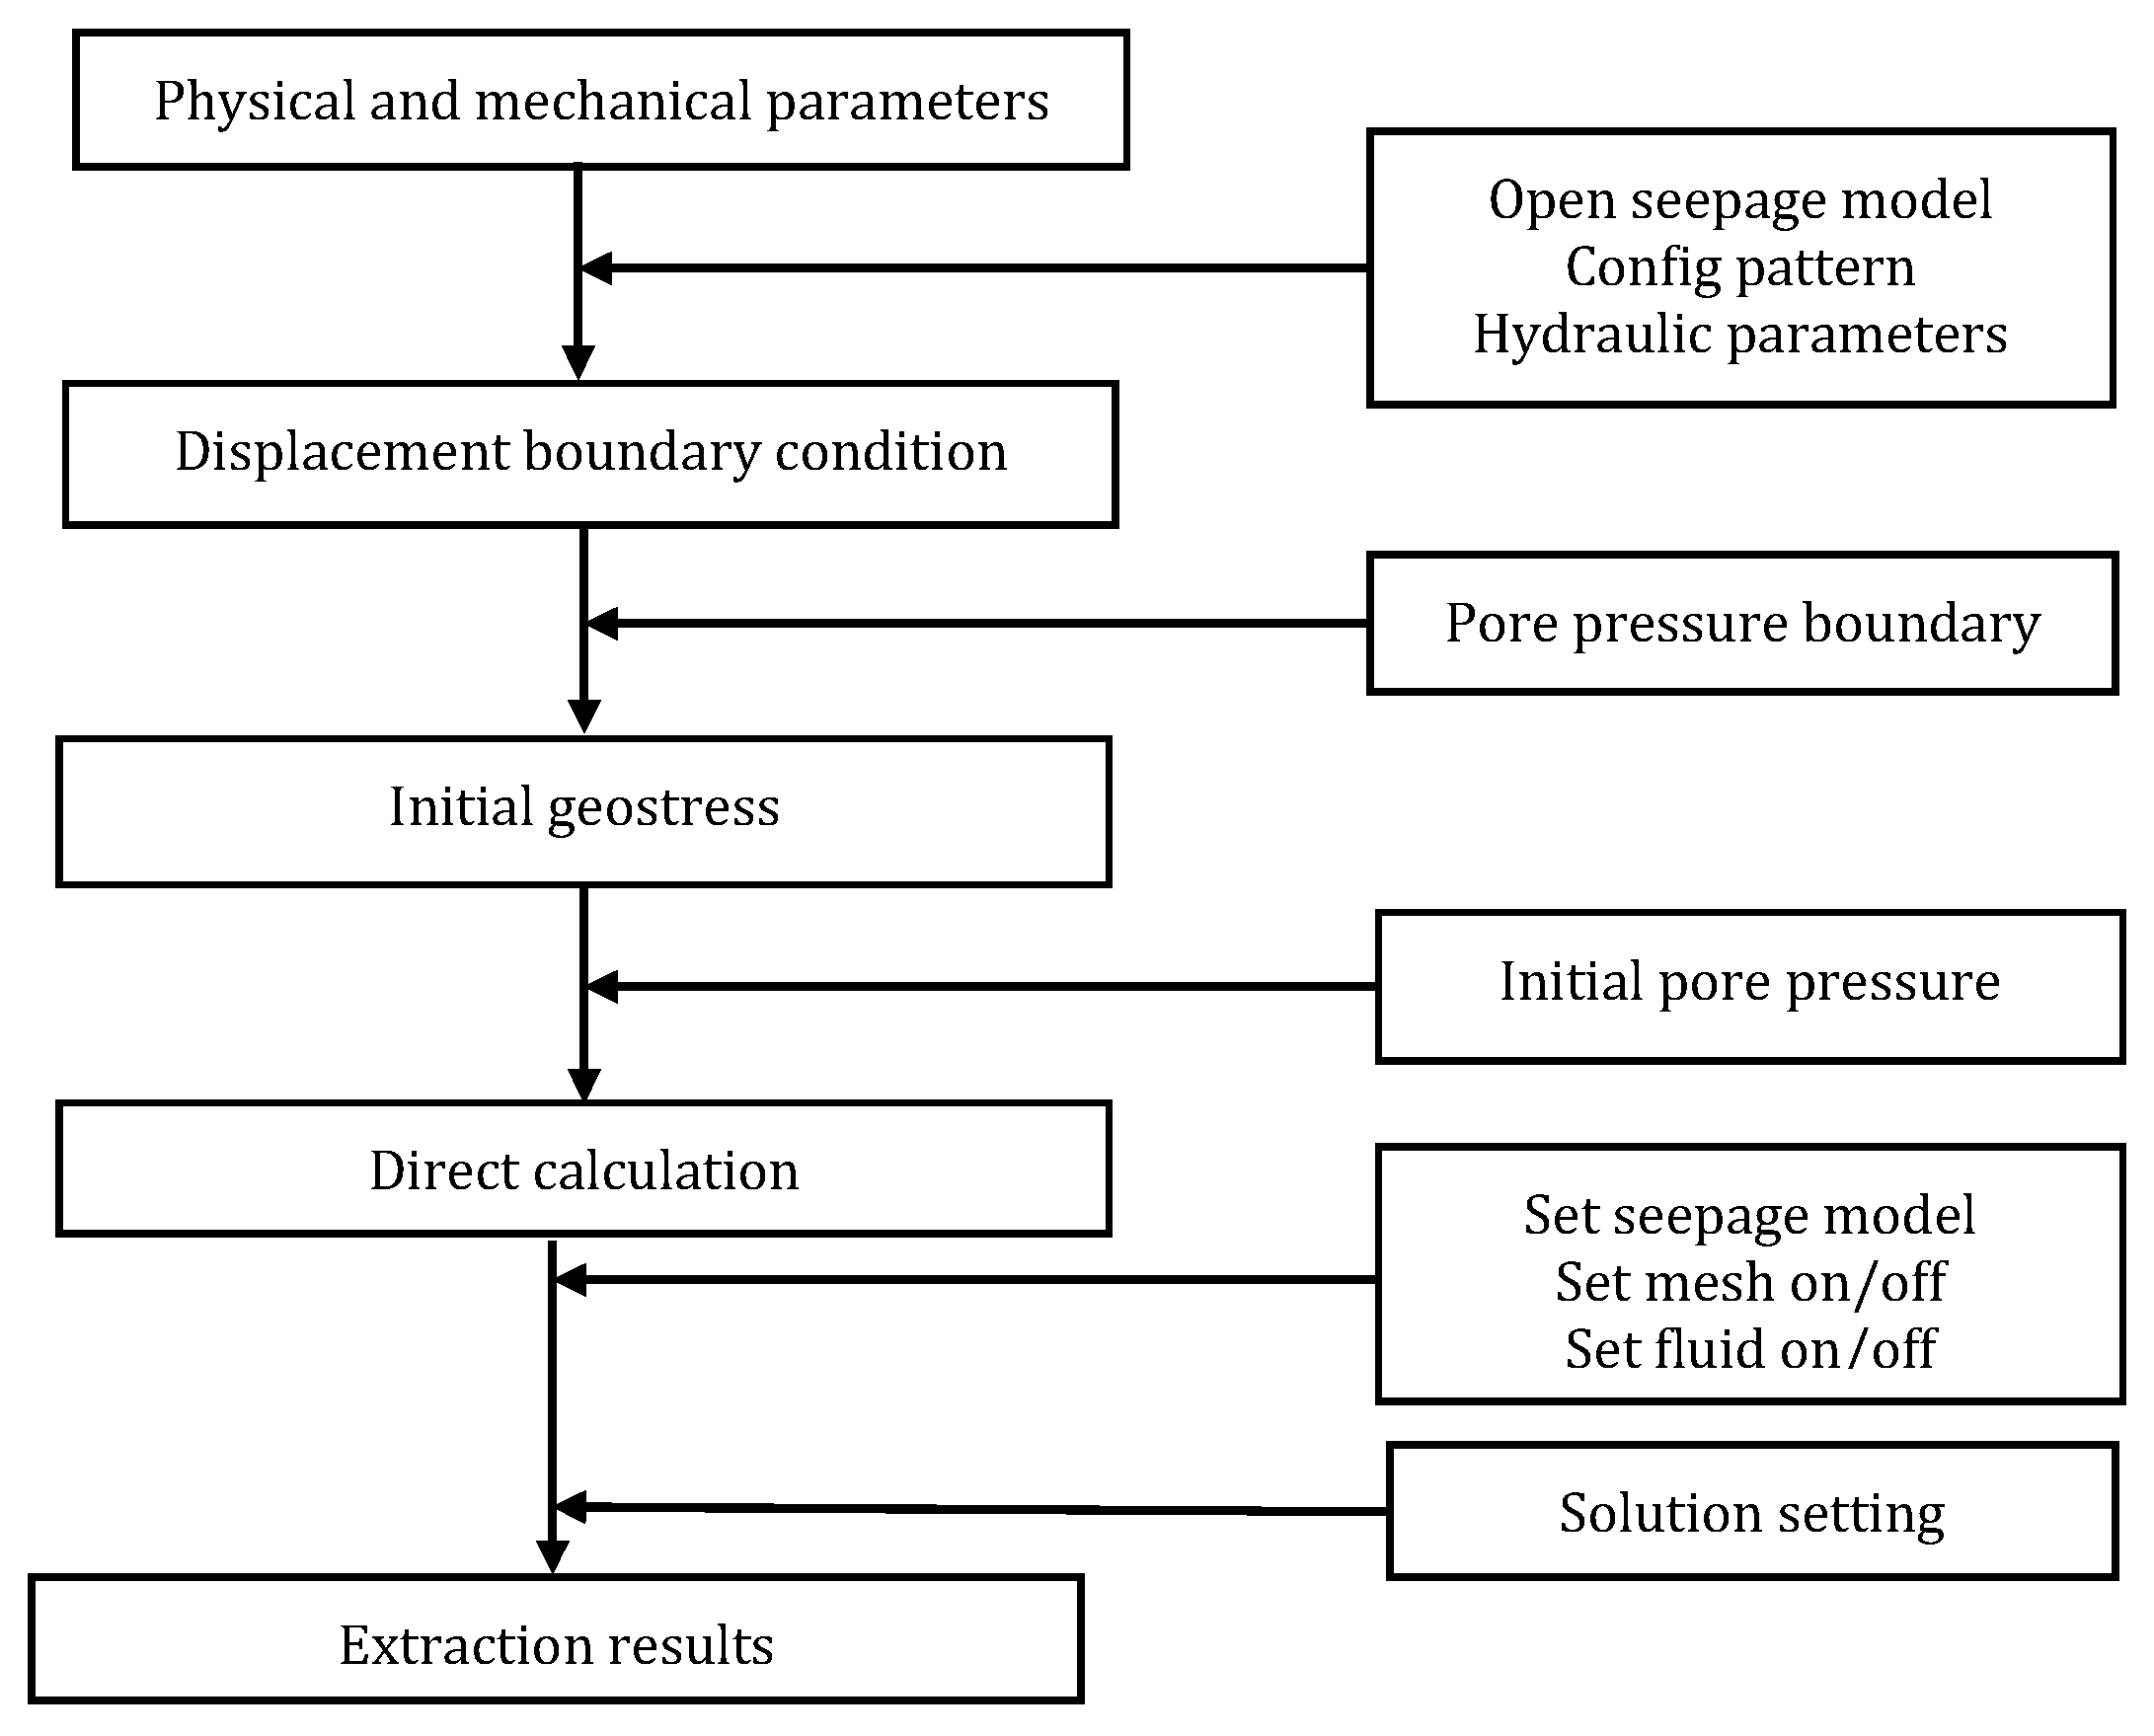
3. Numerical Simulation Parameters for Wellbore Stability Analysis

To better understand the interaction, a numerical simulation for wellbore stability in shales was conducted. By assuming that the shale was isotropic and the wellbore was geometrically symmetrical, it could be simplified as a 2D fluid-solid coupling model in FLAC3D™ software, as shown in Figure 4. Here, σH, σh, and Pf referred to the maximum horizontal crustal press, minimum horizontal crustal press, and drilling fluid pressure, respectively.
Figure 5 shows the basic flow chart of the numerical simulation. The numerical simulation was based on the Mohr-Coulomb model, which belongs to the plane stress model. First, the seepage pattern starts. The left side represents the process of calculating the stress field, and the right side indicates the new step after considering the seepage process. The seepage simulation is mainly through the definition of seepage boundary, initial pore pressure, and mesh force setting to calculate. The software extracted results according to equation of motion, balance equation, and constitutive equation [47]. According to the relationship between the stress and the strain, the strain corresponding to stress can be solved and used to observe the stress distribution around the wellbore and the distribution of the plastic zone.
The wellbore diameter was set 0.2 m and the length of the simulation area was set as 20 times the diameter (4.0 m). A radial grid subdivision method was used to improve computing speed and by considering that stress concentrations normally appeared near the wellbore, the division of the grid was only encrypted near the wellbore area. As a whole, the calculation model was divided into 3600 grids and 7440 nodes. The cell subdivision with finite difference method (FDM) is shown in Figure 6. Surfer® software (Version 8.0, Golden, CO, USA) was used for subsequent data processing, and the intuitive analysis of contour map in FLAC3D™.
In this model, the simulation parameters were adopted from related references [48,49] where the maximum and the minimum horizontal in situ stress gradient were 3 MPa per 100 m and 2 MPa per 100 m, respectively. The pore fluid pressure gradient was 1 MPa per 100 m and the depth of the well was 2500 m. The density of the drilling fluid was 1.40 g/cm3, thus had a hydraulic pressure of 35 MPa. The permeability obtained in the previous PTT with #1 Atoka shale was set as the seepage parameter in the simulation. The parameters of the model are shown in Table 3. The pore fluid pressure transmission, the stress, and deformation of the surrounding rock in contact with drilling fluid, with or without NP, were analyzed in detail in the following.
There is no dispute that 3D simulation would be more convincing than 2D simulation. In the future, we will conduct similar research as permeability might be as variable in 3D simulation. It could forecast that positive results will be derived in the presence of nano-SiO2 in contact with shale. However, the anisotropy of shale should be taken into consideration, otherwise, the differences between 2D simulation and 3D will be minimal even with the time-consuming work.

4. Results and Discussion

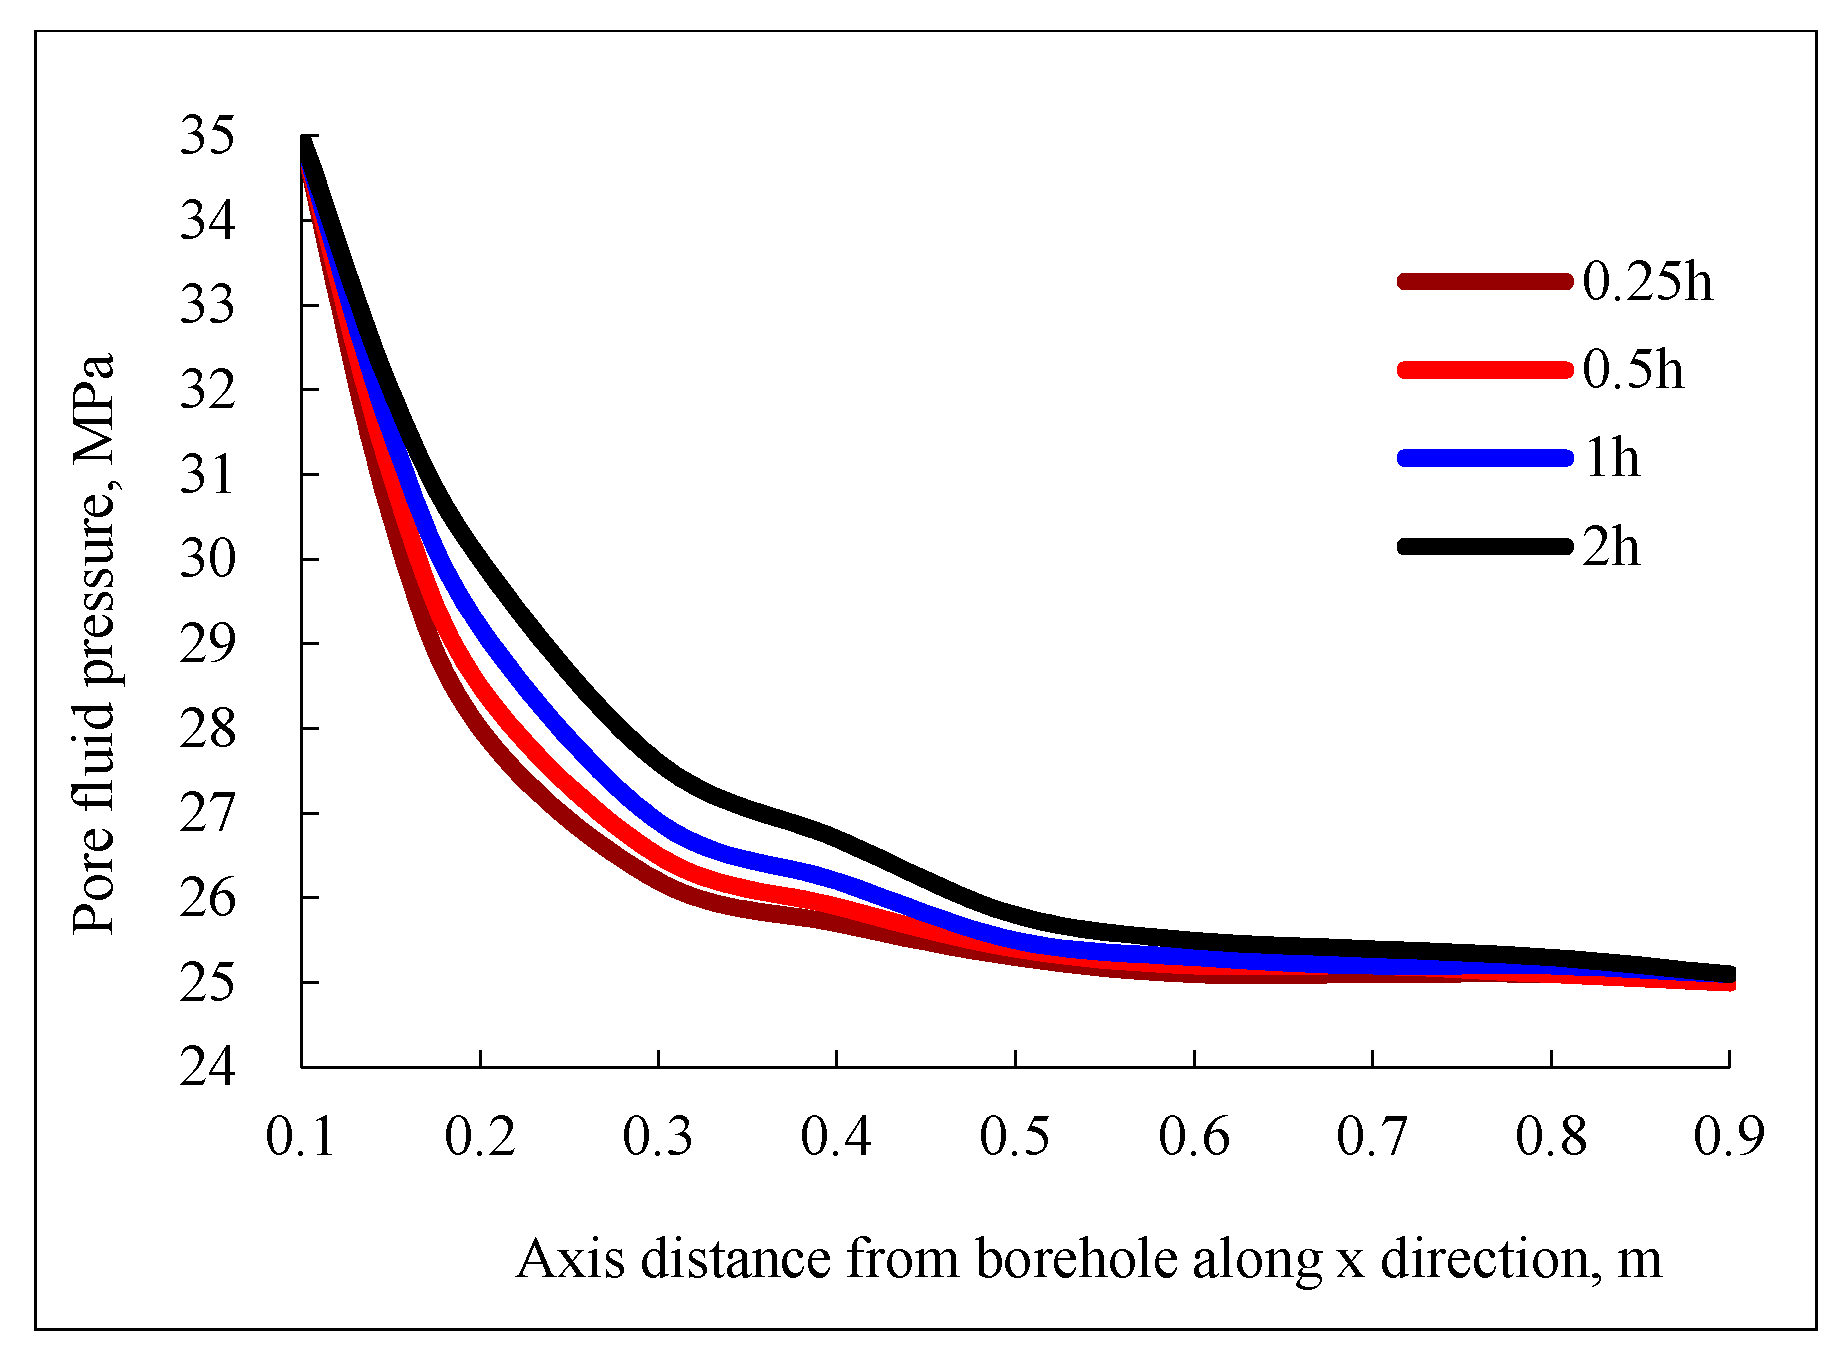
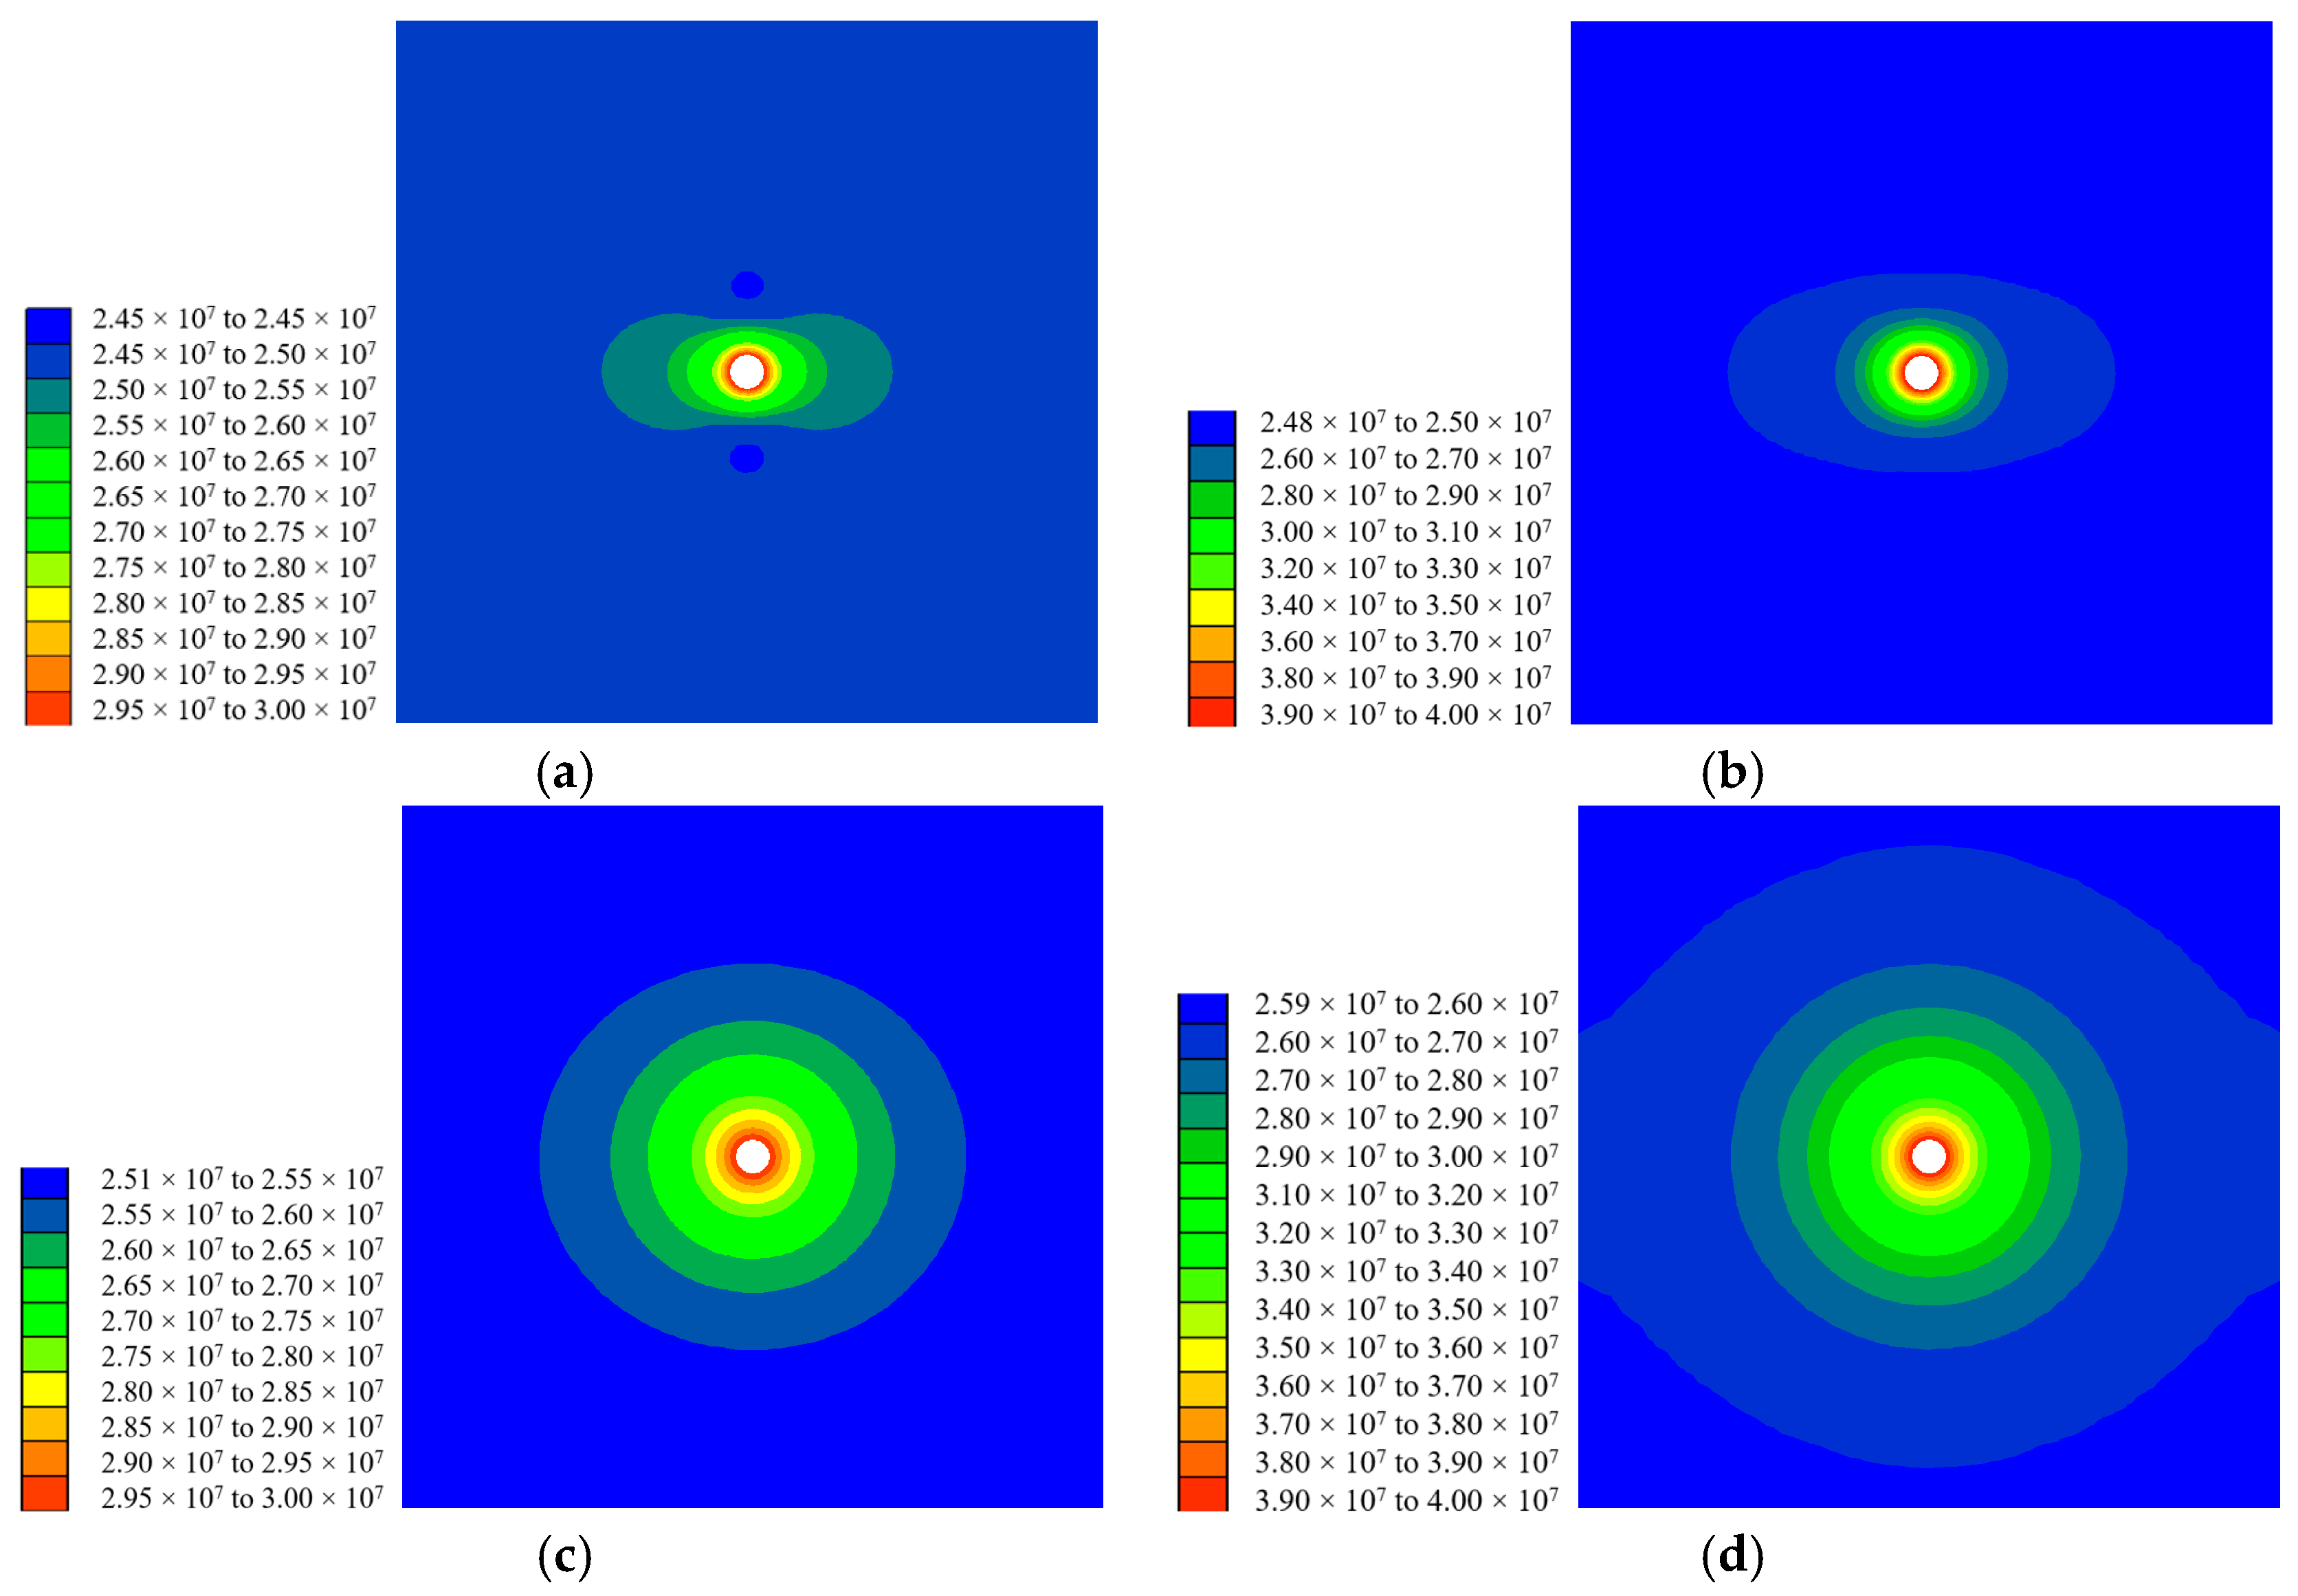
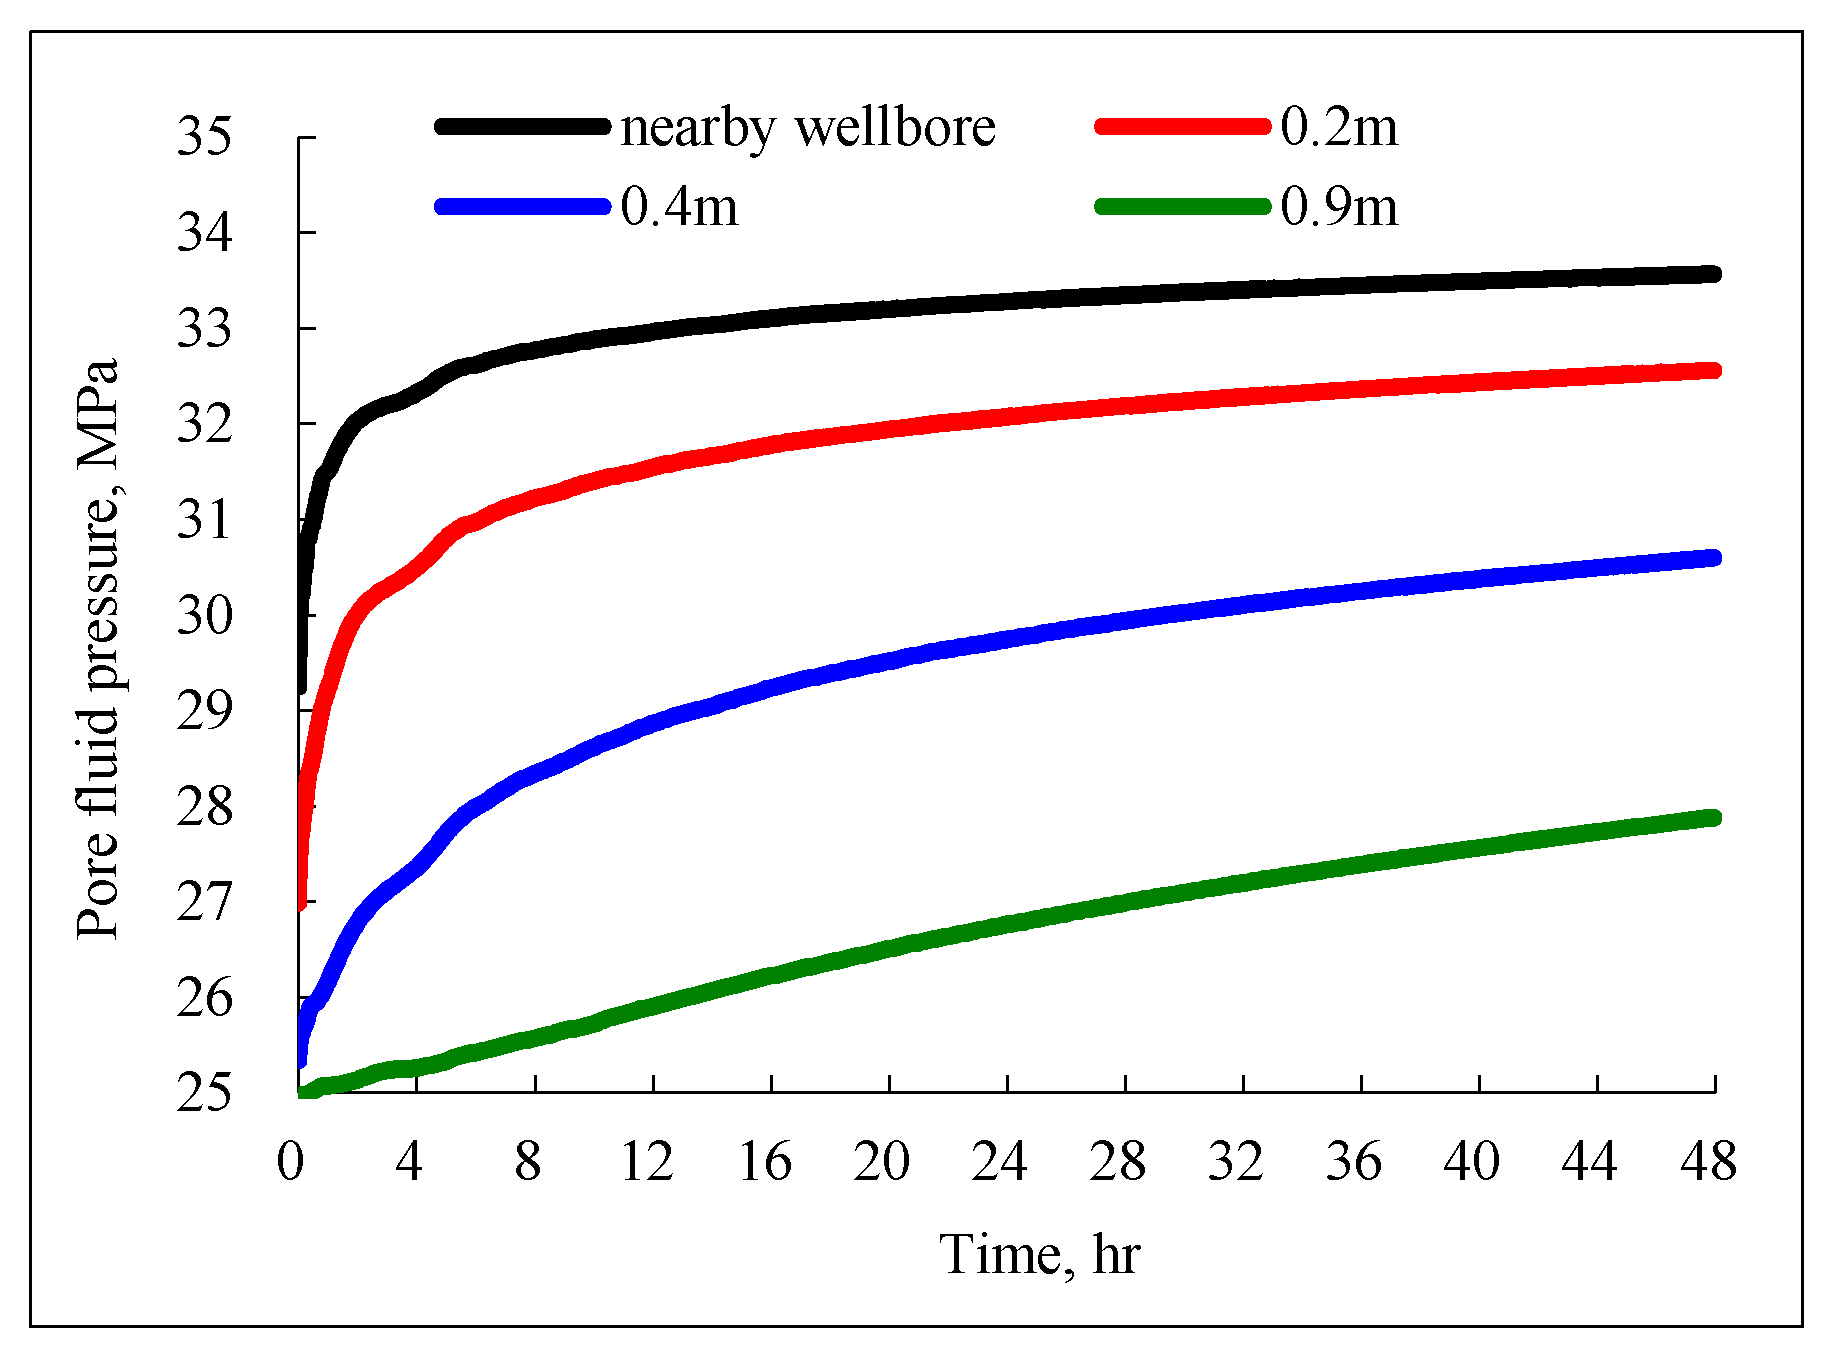
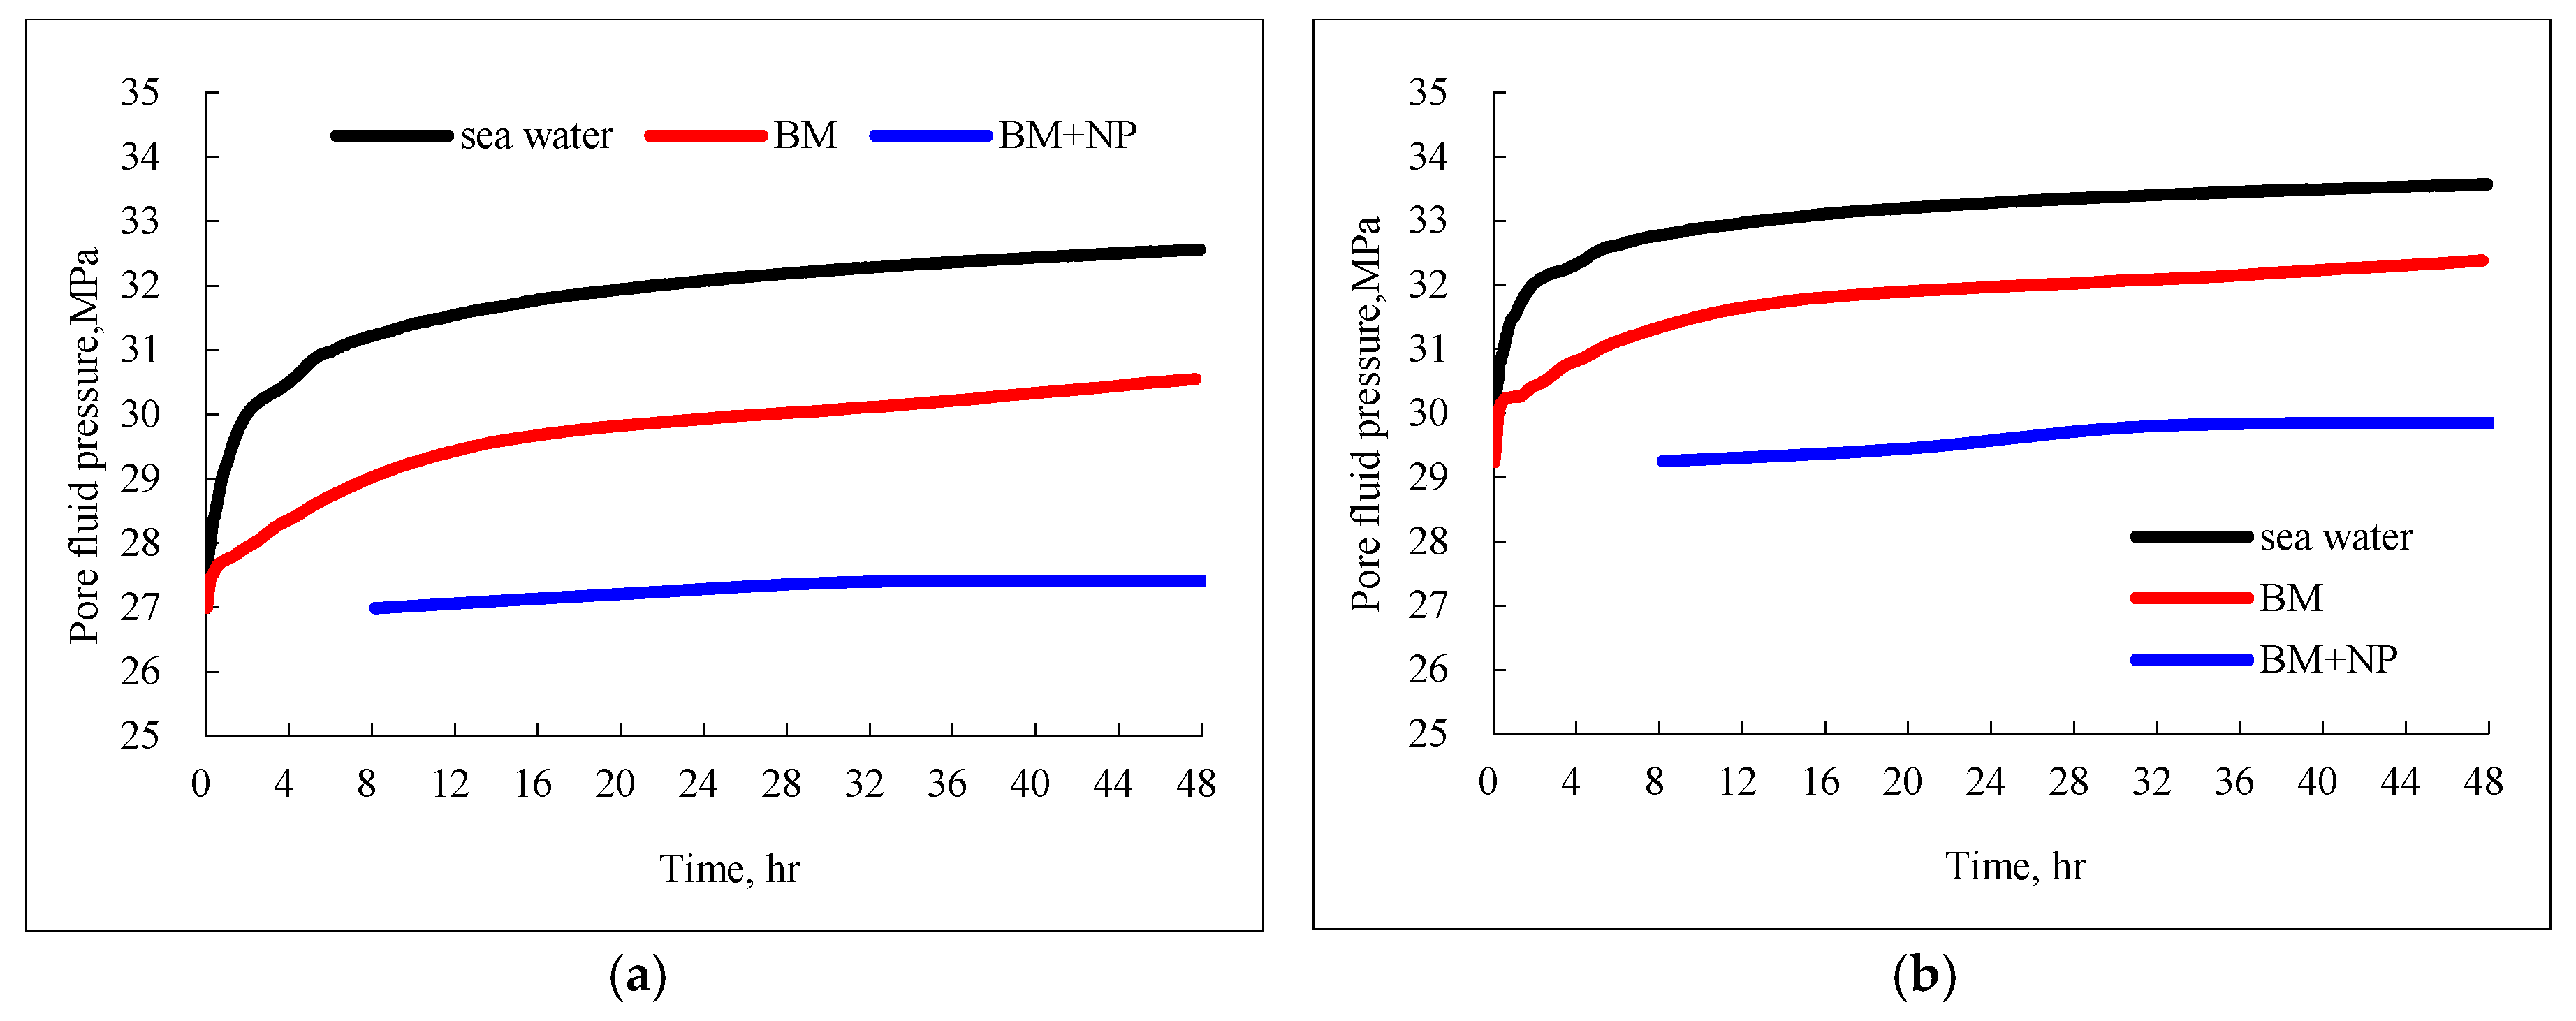
4.1. Pore Fluid Pressure Transmission Simulation of Shale with the Invasion of Drilling Fluid

4.1.1. The Law of Pore Fluid Pressure Transmission of Shale in Contact with Sea Water

In this section, the pore fluid pressure transmission law of shale in contact with drilling fluid (sea water) was first studied. When drilling fluid pressure (Pf) is higher than pore fluid pressure (Po) of shale formation, sea water will gradually penetrate the shale formation due to the hydraulic differential pressure, resulting in the gradual increase of pore fluid pressure of shale. For example, the pore fluid pressure of shale increased from 25 MPa (Figure 7a) to 35 MPa (the drilling fluid pressure) in 24 h (Figure 7b).
Figure 8 and Figure 9 show the distance and time dependent pore fluid pressure transmission from the wellbore. The time dependent pore fluid pressure at different distances from the wellbore increased without exception, indicating the possibility of wellbore instability of shale in contact with sea water (Figure 8). Near the wellbore, the pore fluid pressure increased to 33.30 MPa in 24 h (Figure 8), while away from the wellbore, the pore fluid pressure increased rather slowly (Figure 9). The fluid filtrate invasion gradually (typically in the order of several days) equilibrates the drilling fluid pressure and the near-wellbore pore pressure, whereby effective drilling fluid pressure support is lost. Shale may yield in shear or tensile models because of this pore-pressure elevation that, in combination with the repulsive hydration stress, will reduce the near-wellbore effective stress that hold shale together [3].

4.1.2. Influence of Drilling Fluid Density on the Transmission of Pore Fluid Pressure

In this section, the influence of drilling fluid density on pore fluid pressure transmission was investigated. Figure 10a,b presents the contour map of pore fluid pressure for 1 h and 24 h when the drilling fluid density was adjusted from 1.40 g/cm3 to 1.22 g/cm3 and 1.63 g/cm3, respectively, and the corresponding drilling fluid pressure was 30.50 MPa and 40.75 MPa. With a given pore fluid pressure, the decrease in drilling fluid density could mitigate the positive pressure differential between drilling fluid pressure and pore fluid pressure, resulting in the alleviation of pore fluid pressure transmission (Figure 10c). Furthermore, the increase in drilling fluid density will accelerate the transmission of pore fluid pressure (Figure 10d).

4.1.3. The Influence of NP on the Transmission of Pore Fluid Pressure

(1) The influence of NP on pore fluid pressure transmission of the shale in contact with the BM
In this section, various fluids (4% sea water, BM, BM + NP) successively in contact with the shale sample were simulated. Drilling fluid pressure (Pf) and initial pore fluid pressure (Po) were 35 MPa and 25 MPa, respectively. To the BM, it had higher viscosity compared to sea water and was difficult to invade into the compact shale formation. However, with time, the pore fluid pressure still increased. After 48 h, pore fluid pressure near the wellbore climbed to 32.4 MPa (Figure 11a), indicating the possibility of wellbore instability with the BM. This reduction of true overbalance (which acts as a support pressure for the hole) can result in shale failure and wellbore instability. To the BM plus NP (BM + NP), no pore fluid pressure transmission was observed in the first 8 h (Figure 11). After 48 h, pore fluid pressure near the wellbore and at the distance two times from the wellbore (0.2 m) only increased to 29.90 MPa (Figure 11a) and 27.4 MPa (Figure 11b), respectively, showing that the presence of SiO2 NP can effectively mitigate the transmission of fluid pressure into the shale formation and therefore improve wellbore stability, which is consistent with previous PTT results [19].
(2) The influence of NP on the pore pressure transmission boundary of the shale in contact with the BM
Figure 12 shows the variety in the pore pressure transmission boundary in the shale in contact with the BM and the BM plus SiO2 NP. The red circles are considered the pore pressure transmission boundary. The area inside the circles indicates an increase of pore fluid pressure while outside the red circles, the pore fluid pressure stays as the initial (25 MPa). To the BM, the boundary after 10 h at the x direction and y direction was 0.88 m and 0.32 m (Figure 12a), respectively. After 24 h, the boundary at the x direction and y direction increased to 1.01 m and 0.6 m (Figure 12c), respectively. After 48 h, the boundary at the x direction was out of scope (over than 2.0 m) and was 0.65 m at the y direction (Figure 12c). In presence of SiO2 NP into the BM, the boundary after 10 h was only 0.64 m and 0.12 m at the x and y directions (Figure 12b), respectively. Even after 48 h, the boundary only increased to 0.72 m and 0.16 m (Figure 12f), respectively. Therefore, the presence of SiO2 NP can significantly reduce the pore pressure transmission boundary of the shale in contact with the BM, therefore mitigating the likelihood of wellbore instability.
The invasion of water into the shale formation not only leads to secondary distribution of pore fluid pressure, but also causes the generation of hydration stress due to the water adsorption of clay minerals which destroy the original cementation status of shale particles. Therefore, the strength, the cohesion, and the friction angle of the surrounding rock will decrease. In the presence of NP into the BM, the invasion of water into the shale formation can be mitigated, and the wellbore stability of shale can be significantly improved.
However, for the convenience of numerical simulation, the permeability was set as a constant with the addition of NP. This is the limitation of this 2D model. In reality, permeability decreases gradually, and depends on the matching degree of NP size and the pore throats of shales, as well as on other factors such as pH, salinity, etc. In Figure 3a, we can see that the decrease of permeability was faster than that of Figure 3b. Furthermore, the pressure difference between the upstream and the downstream of the shale should affect this process. Higher pressure difference will lead to faster accumulation of NP on the surface of shale.

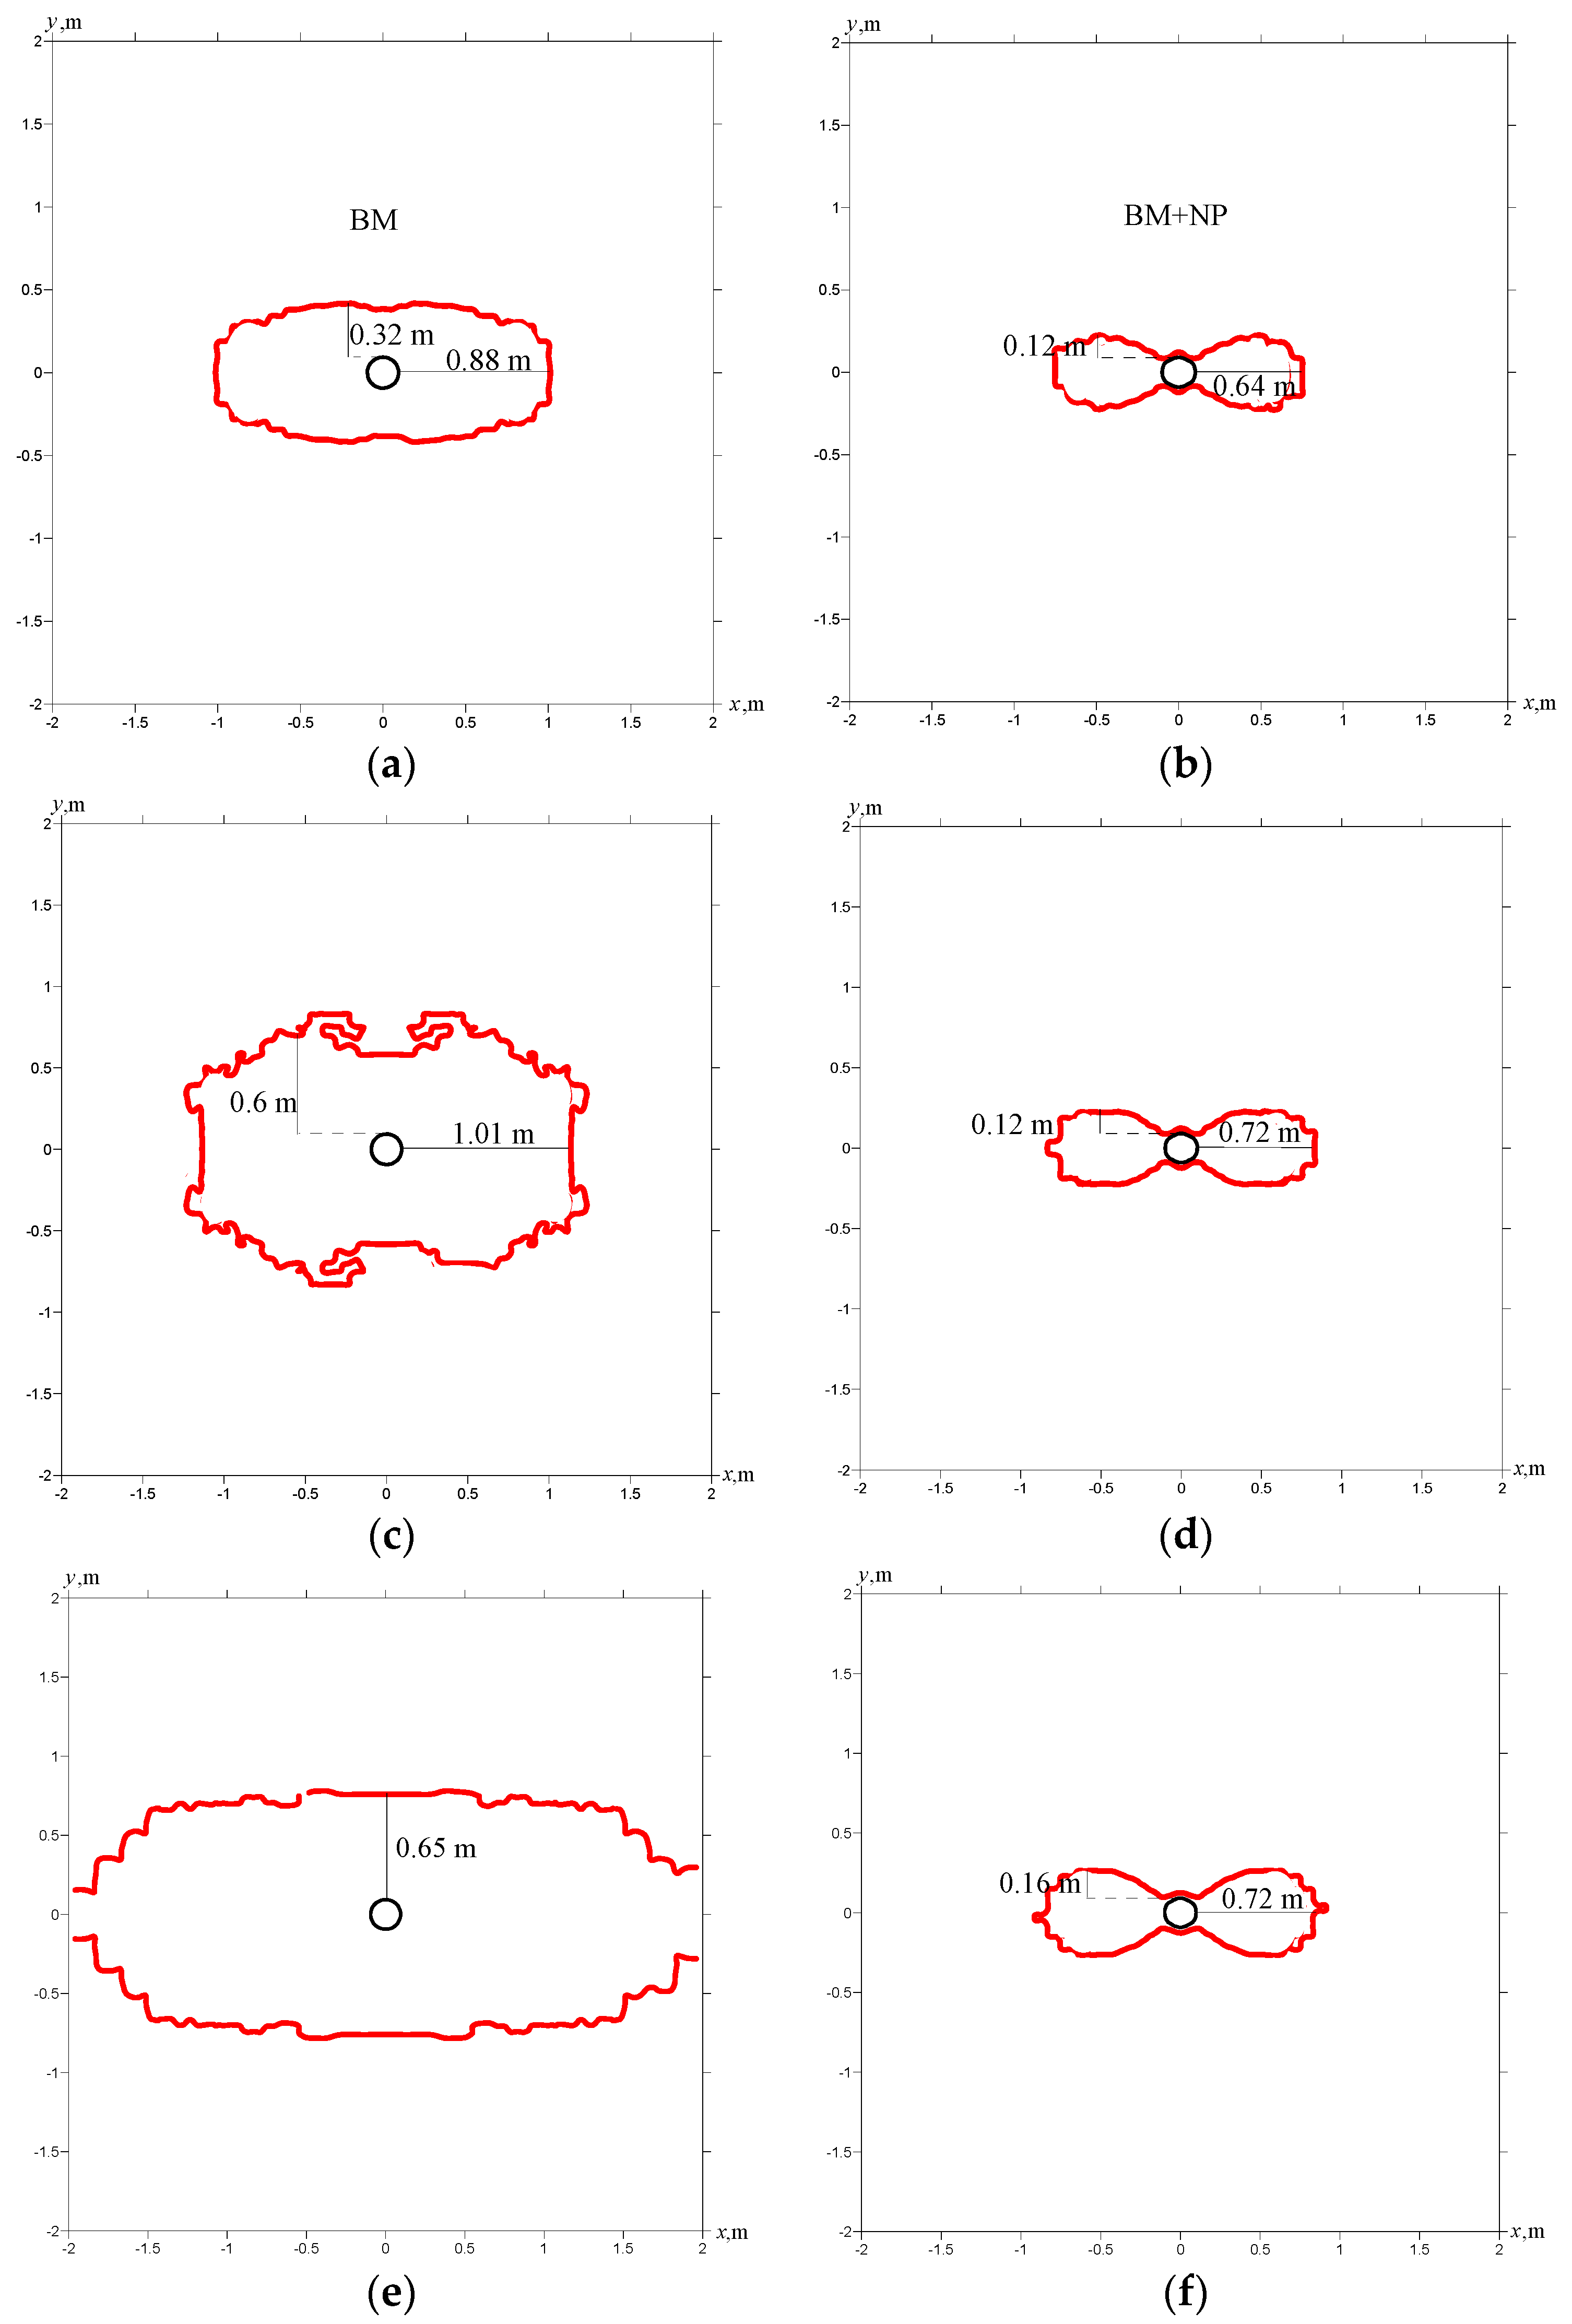
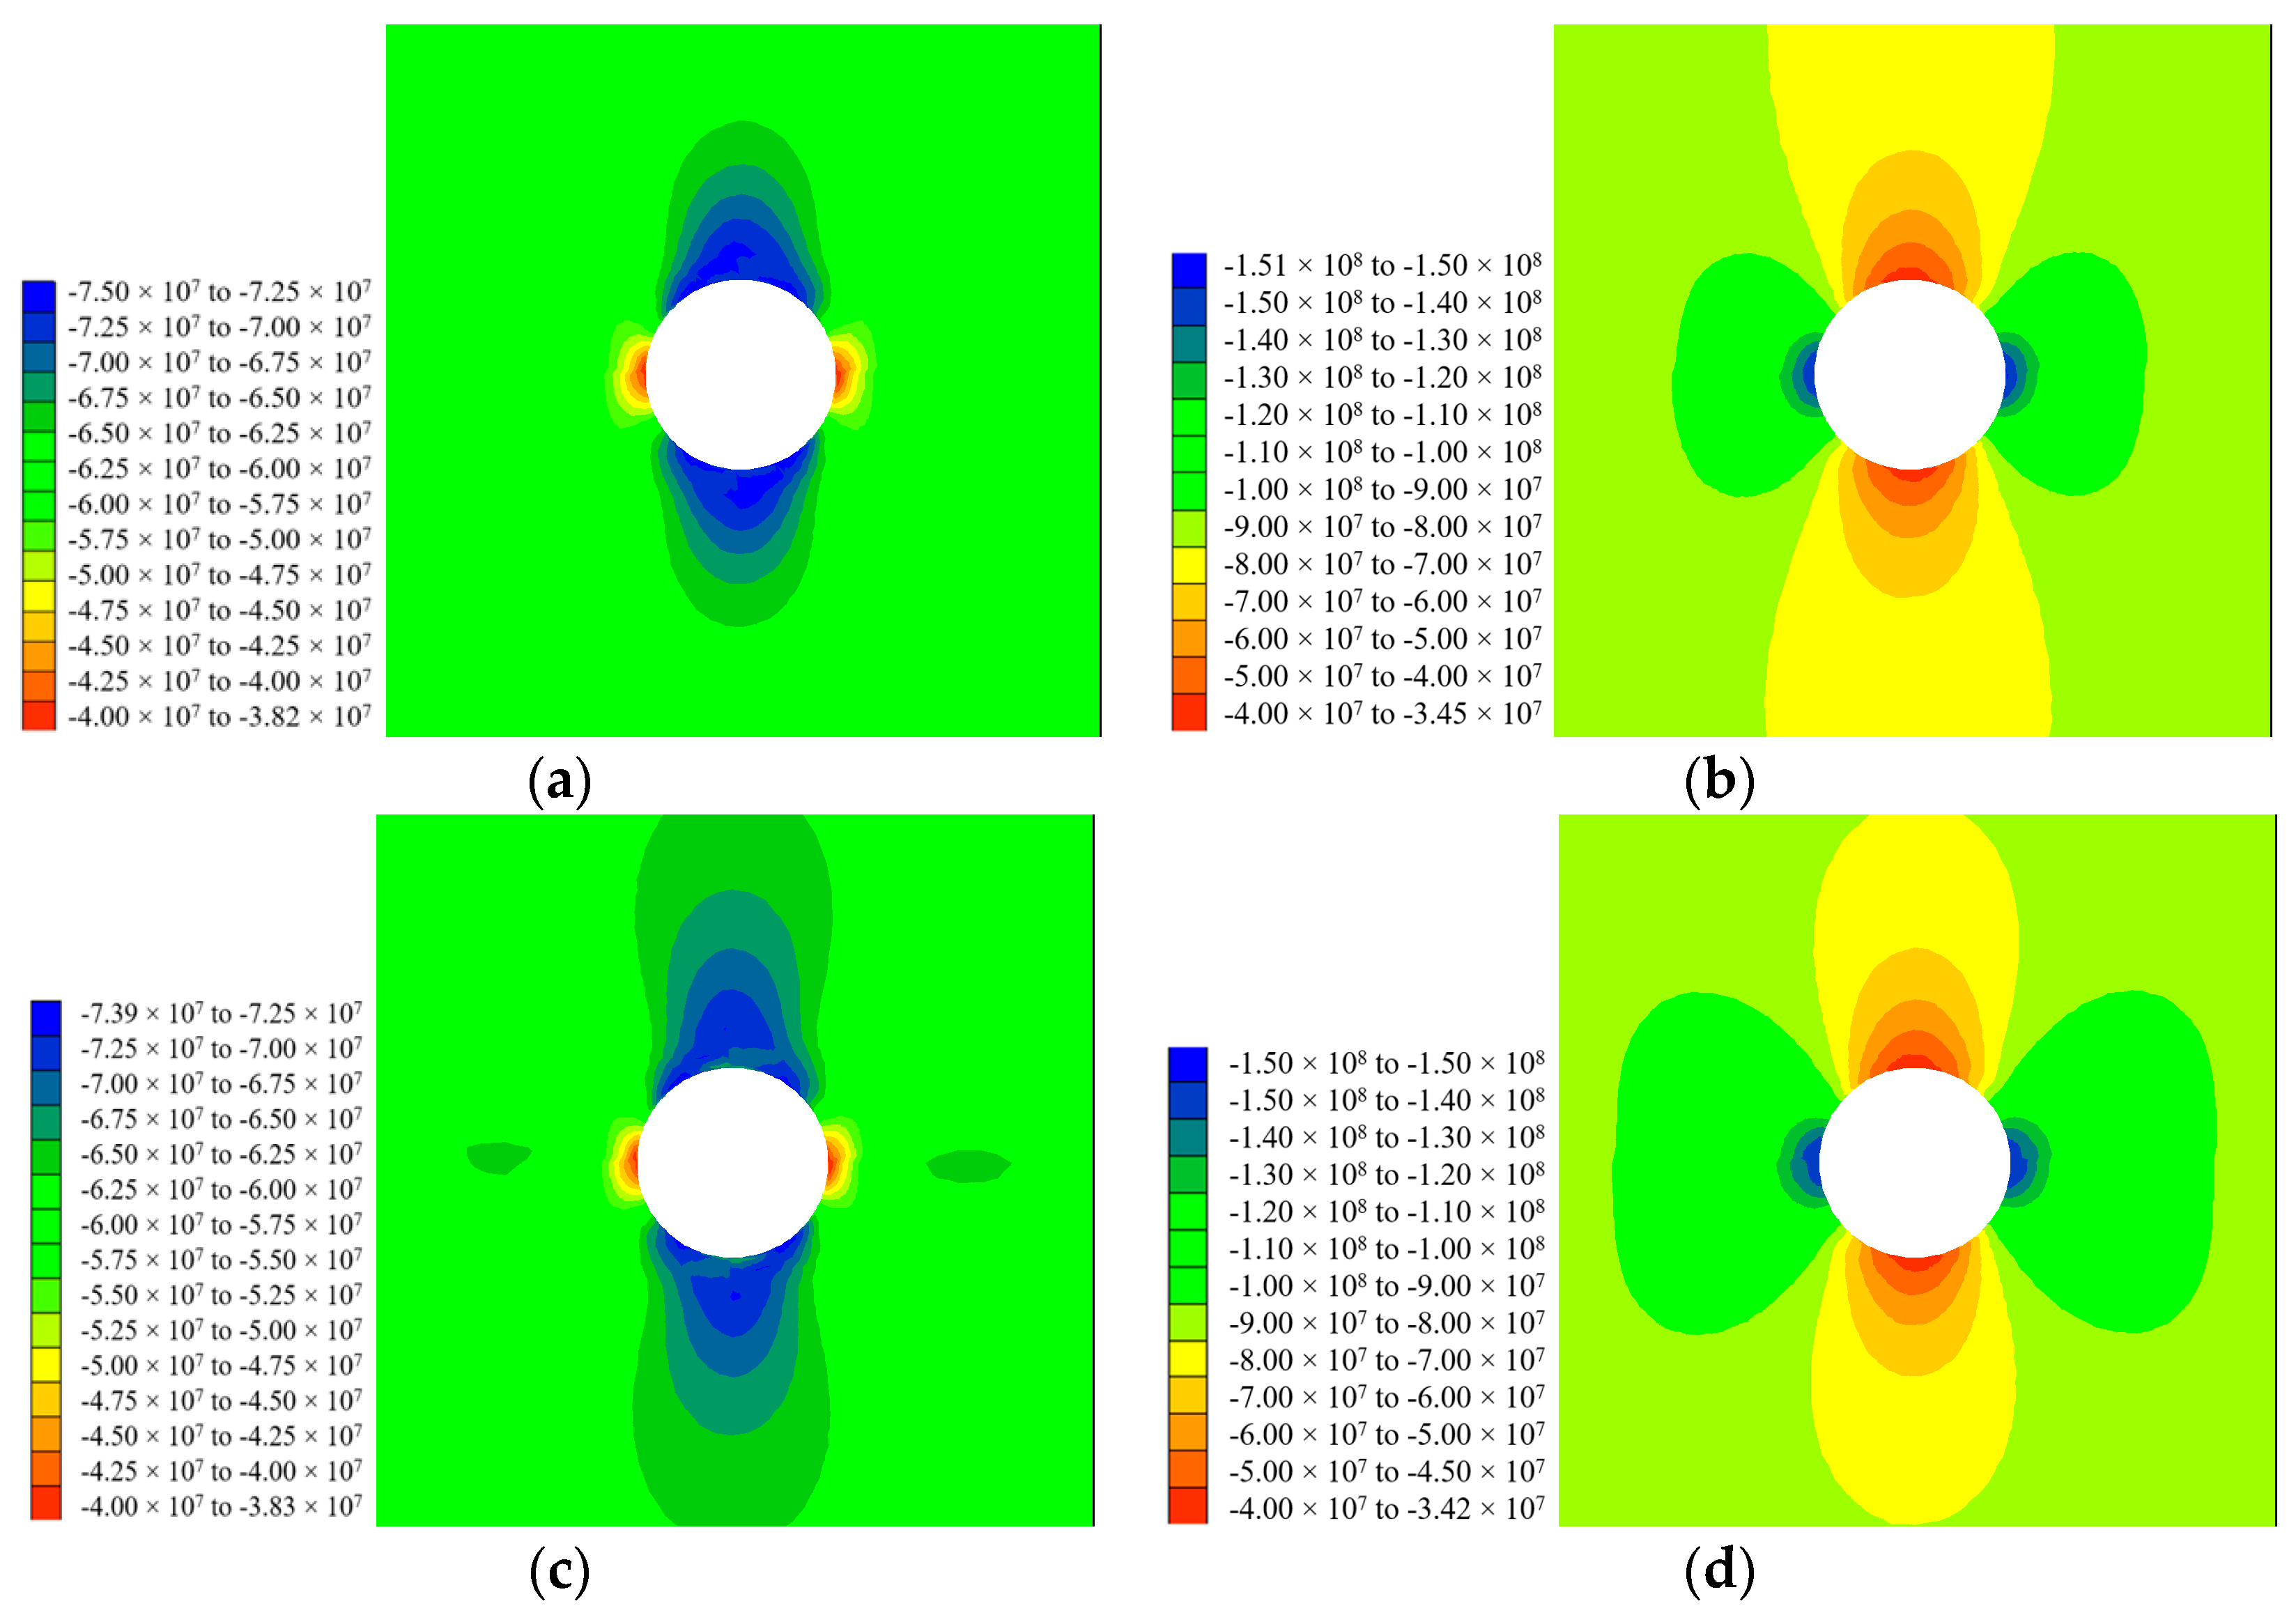
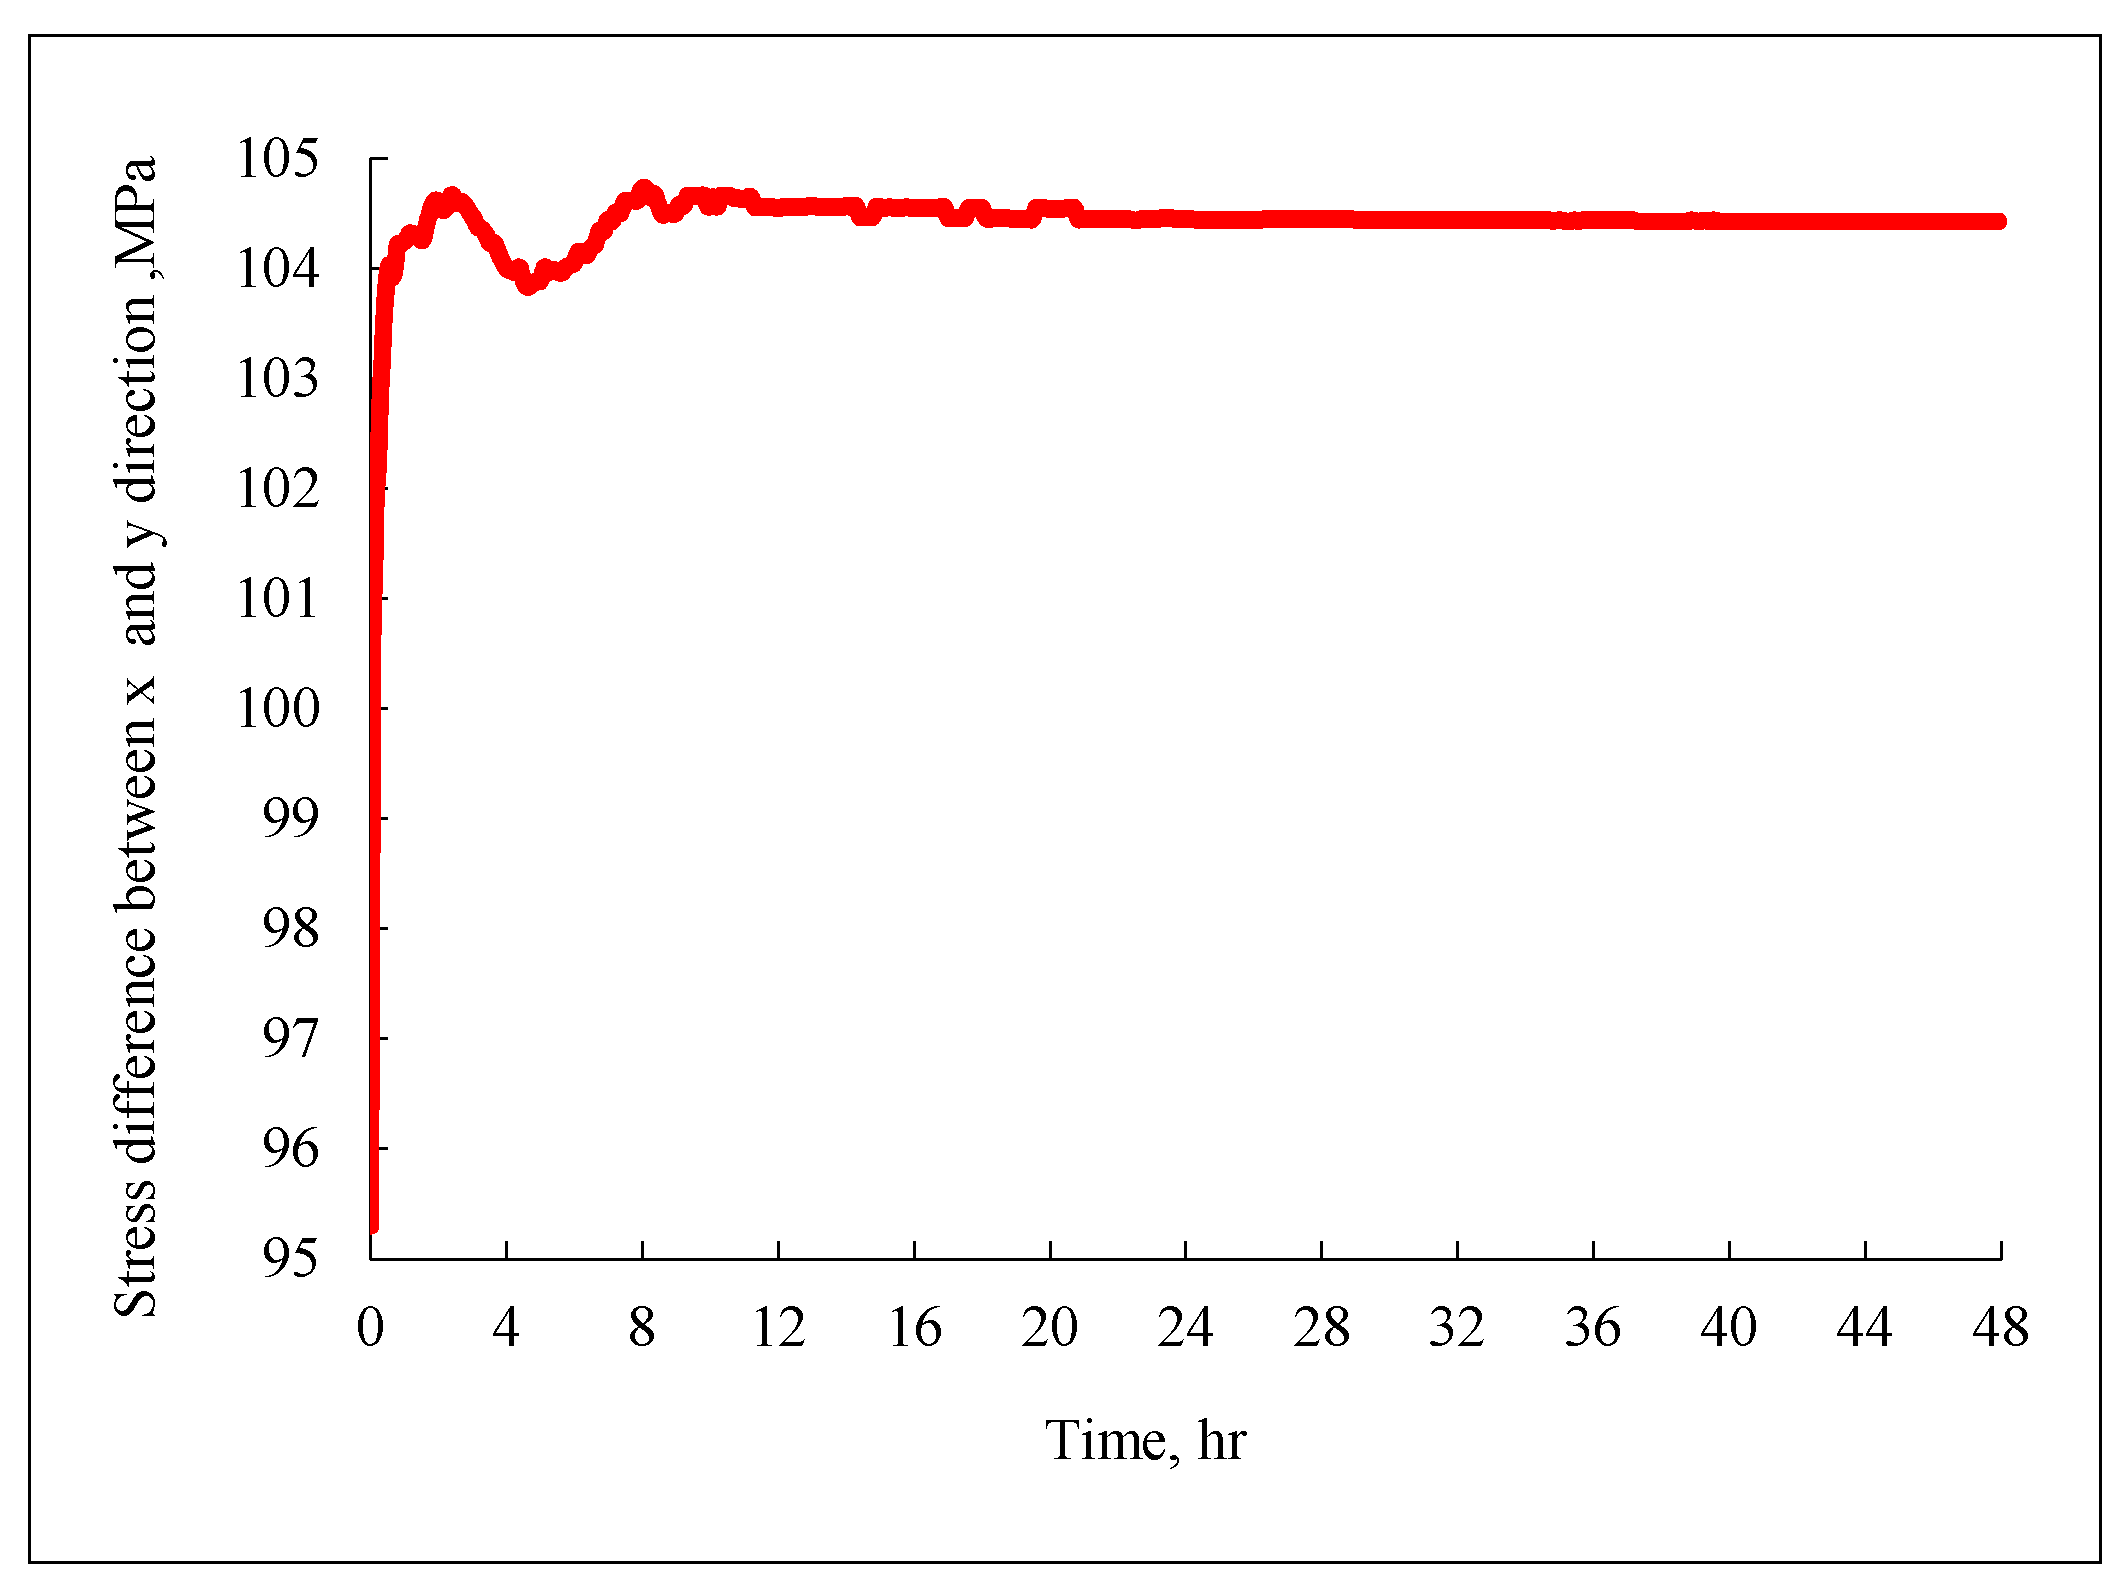
4.2. The Influence of Drilling Fluid Invasion with or without NP on the Stress and Deformation of Surrounding Rock

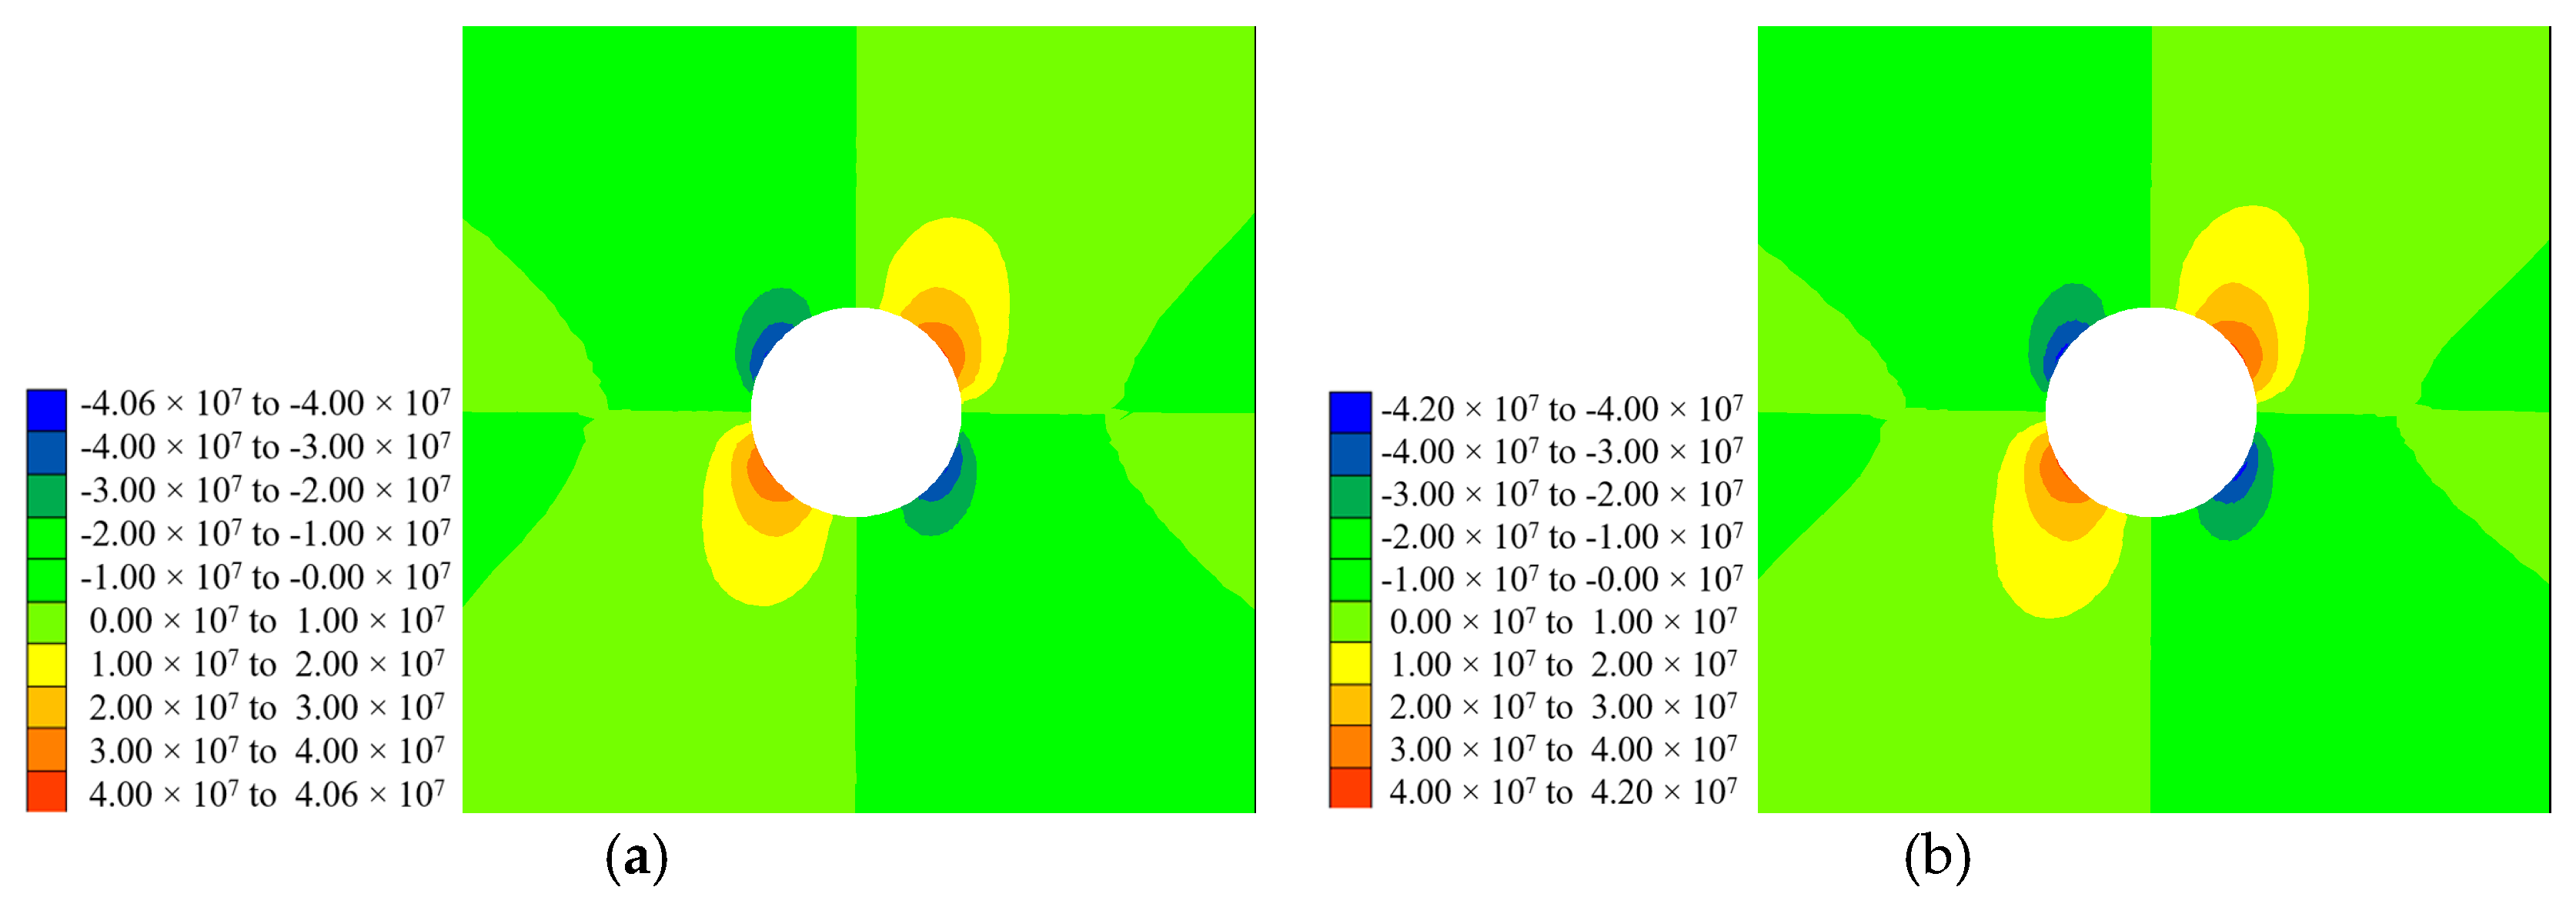
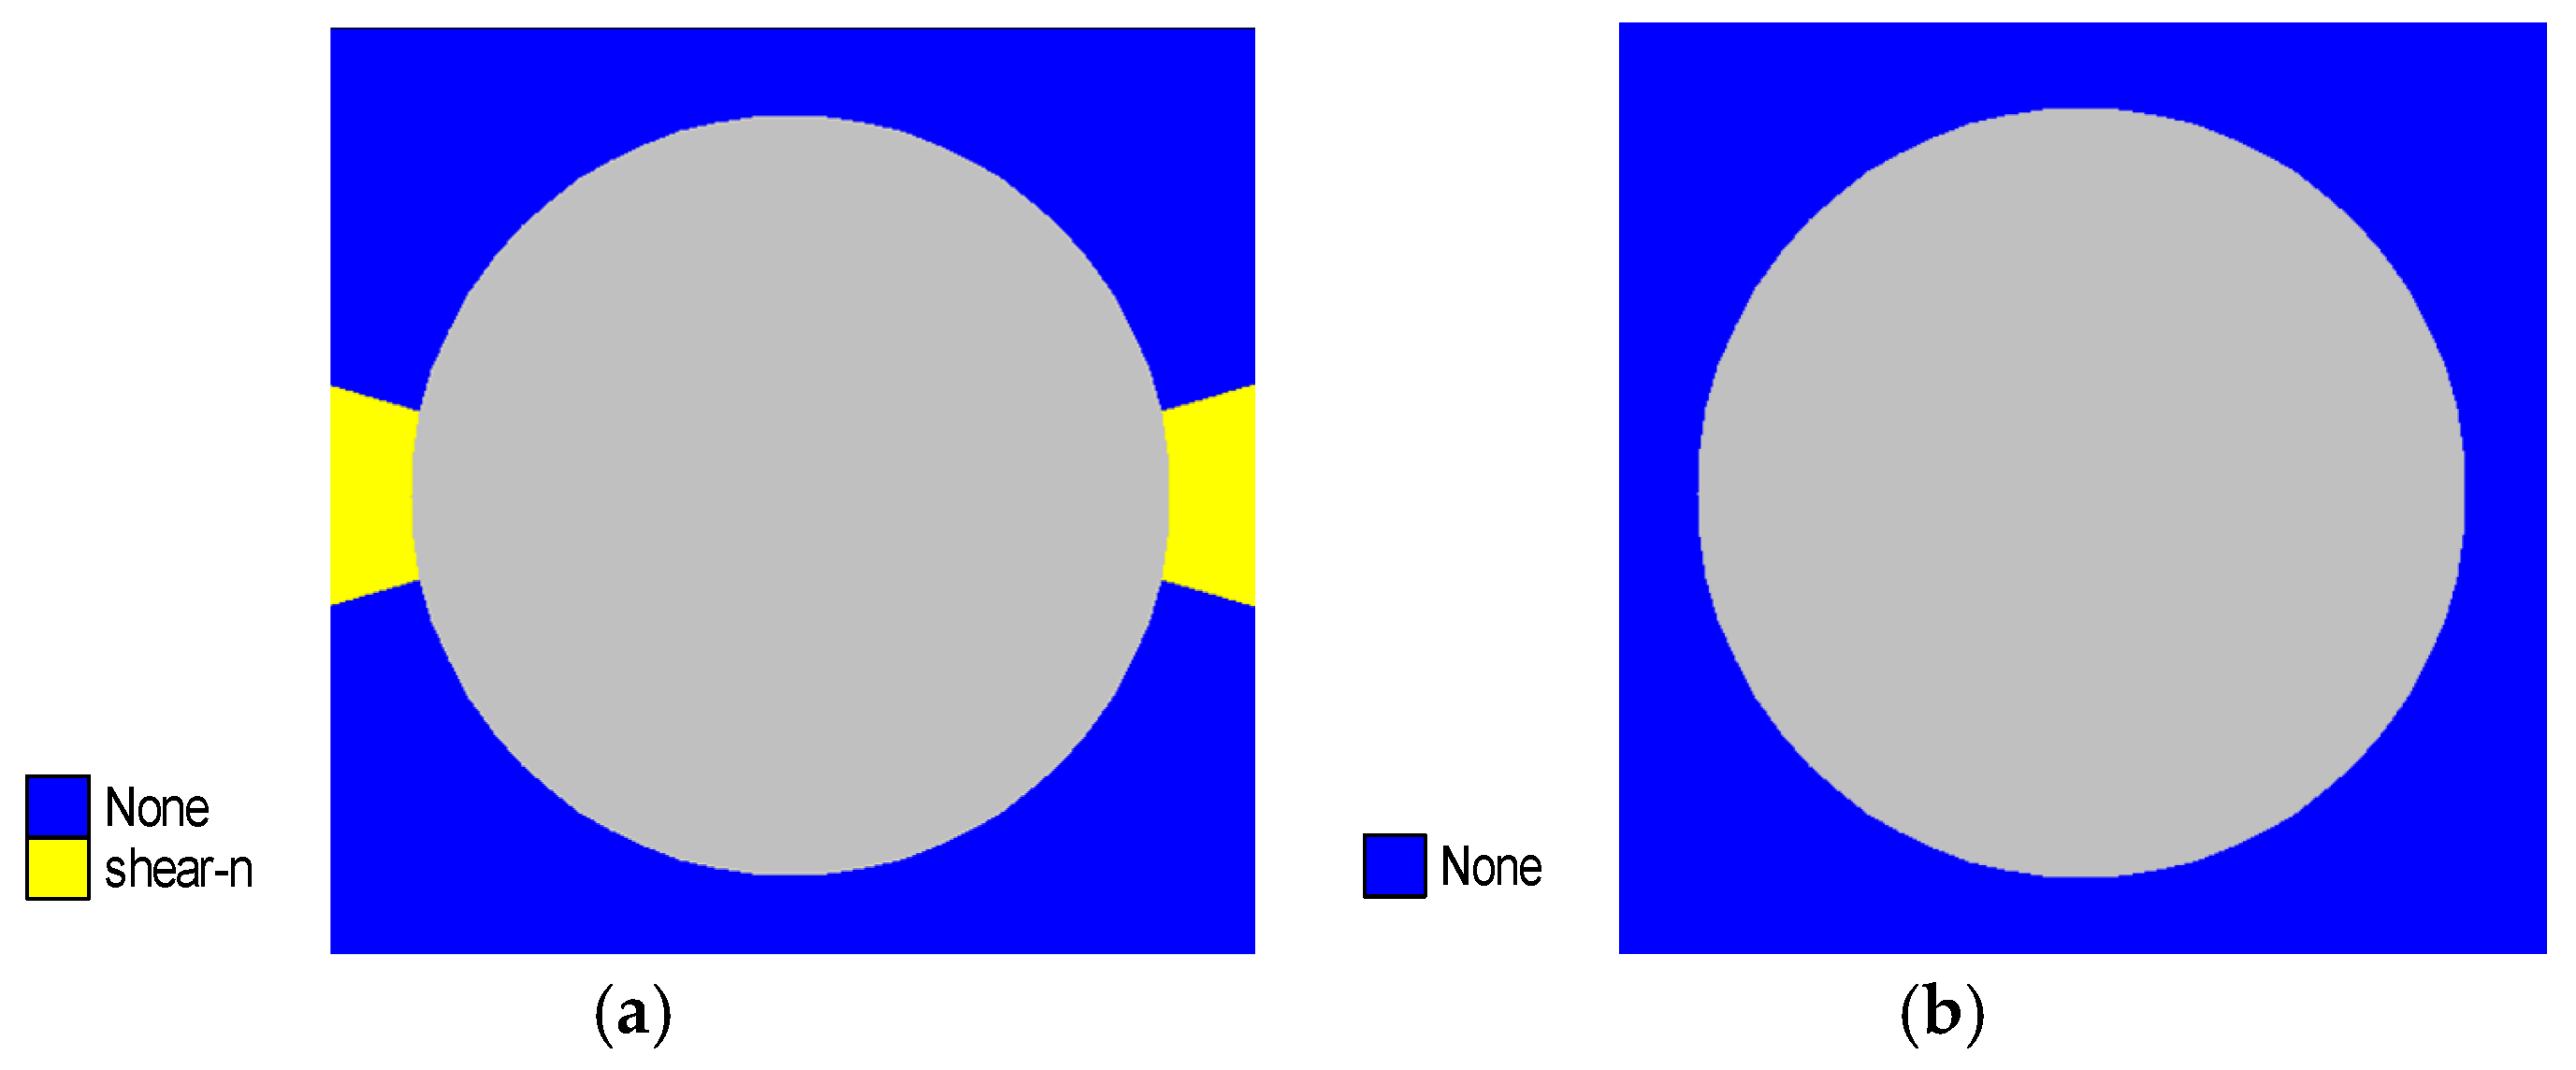
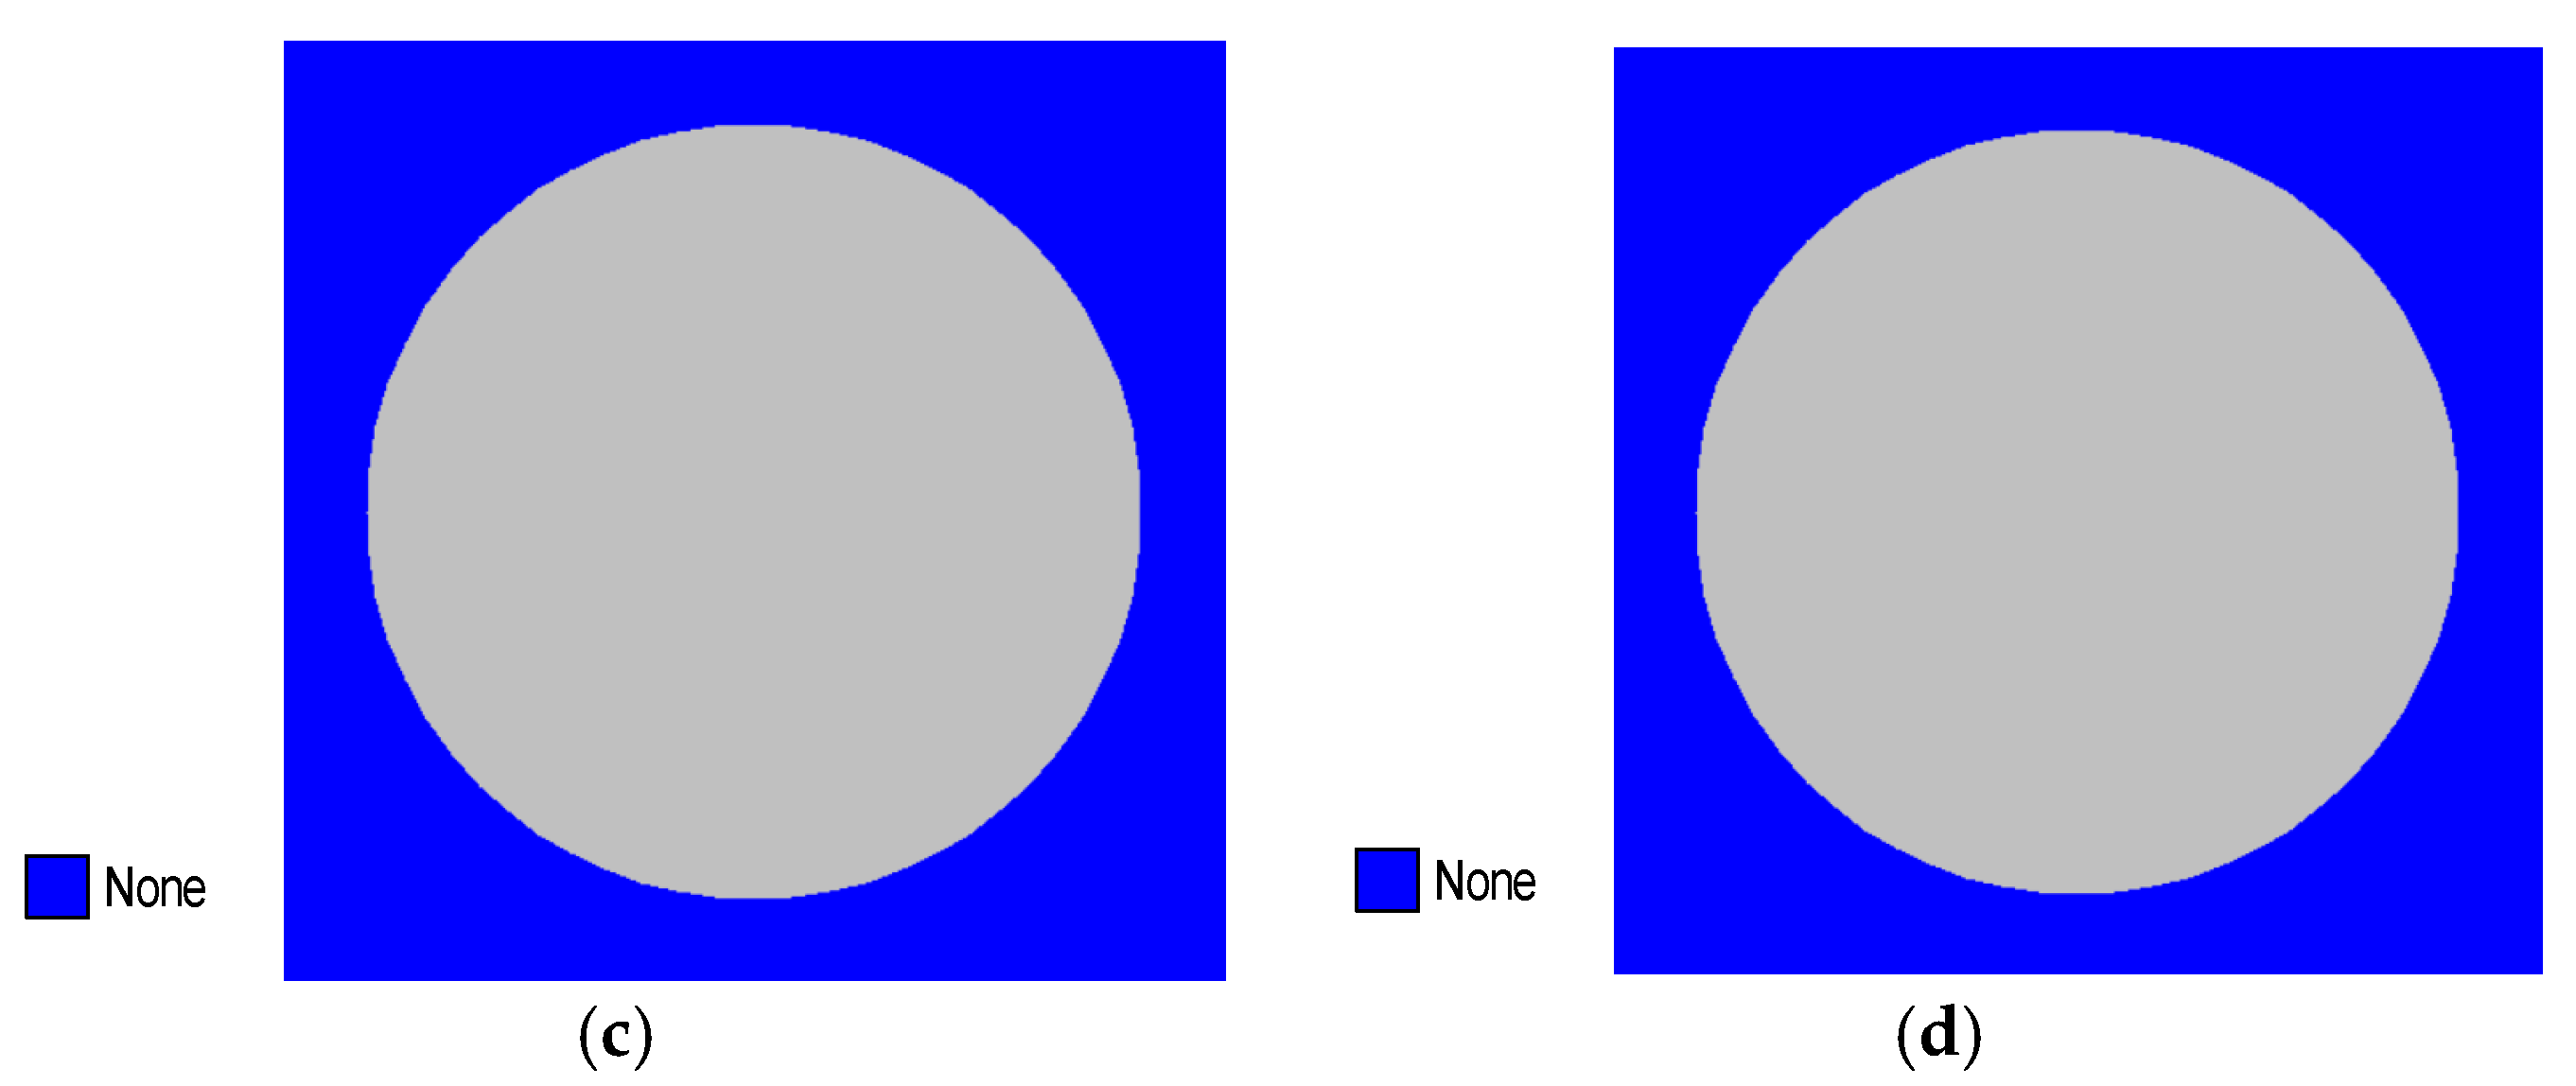
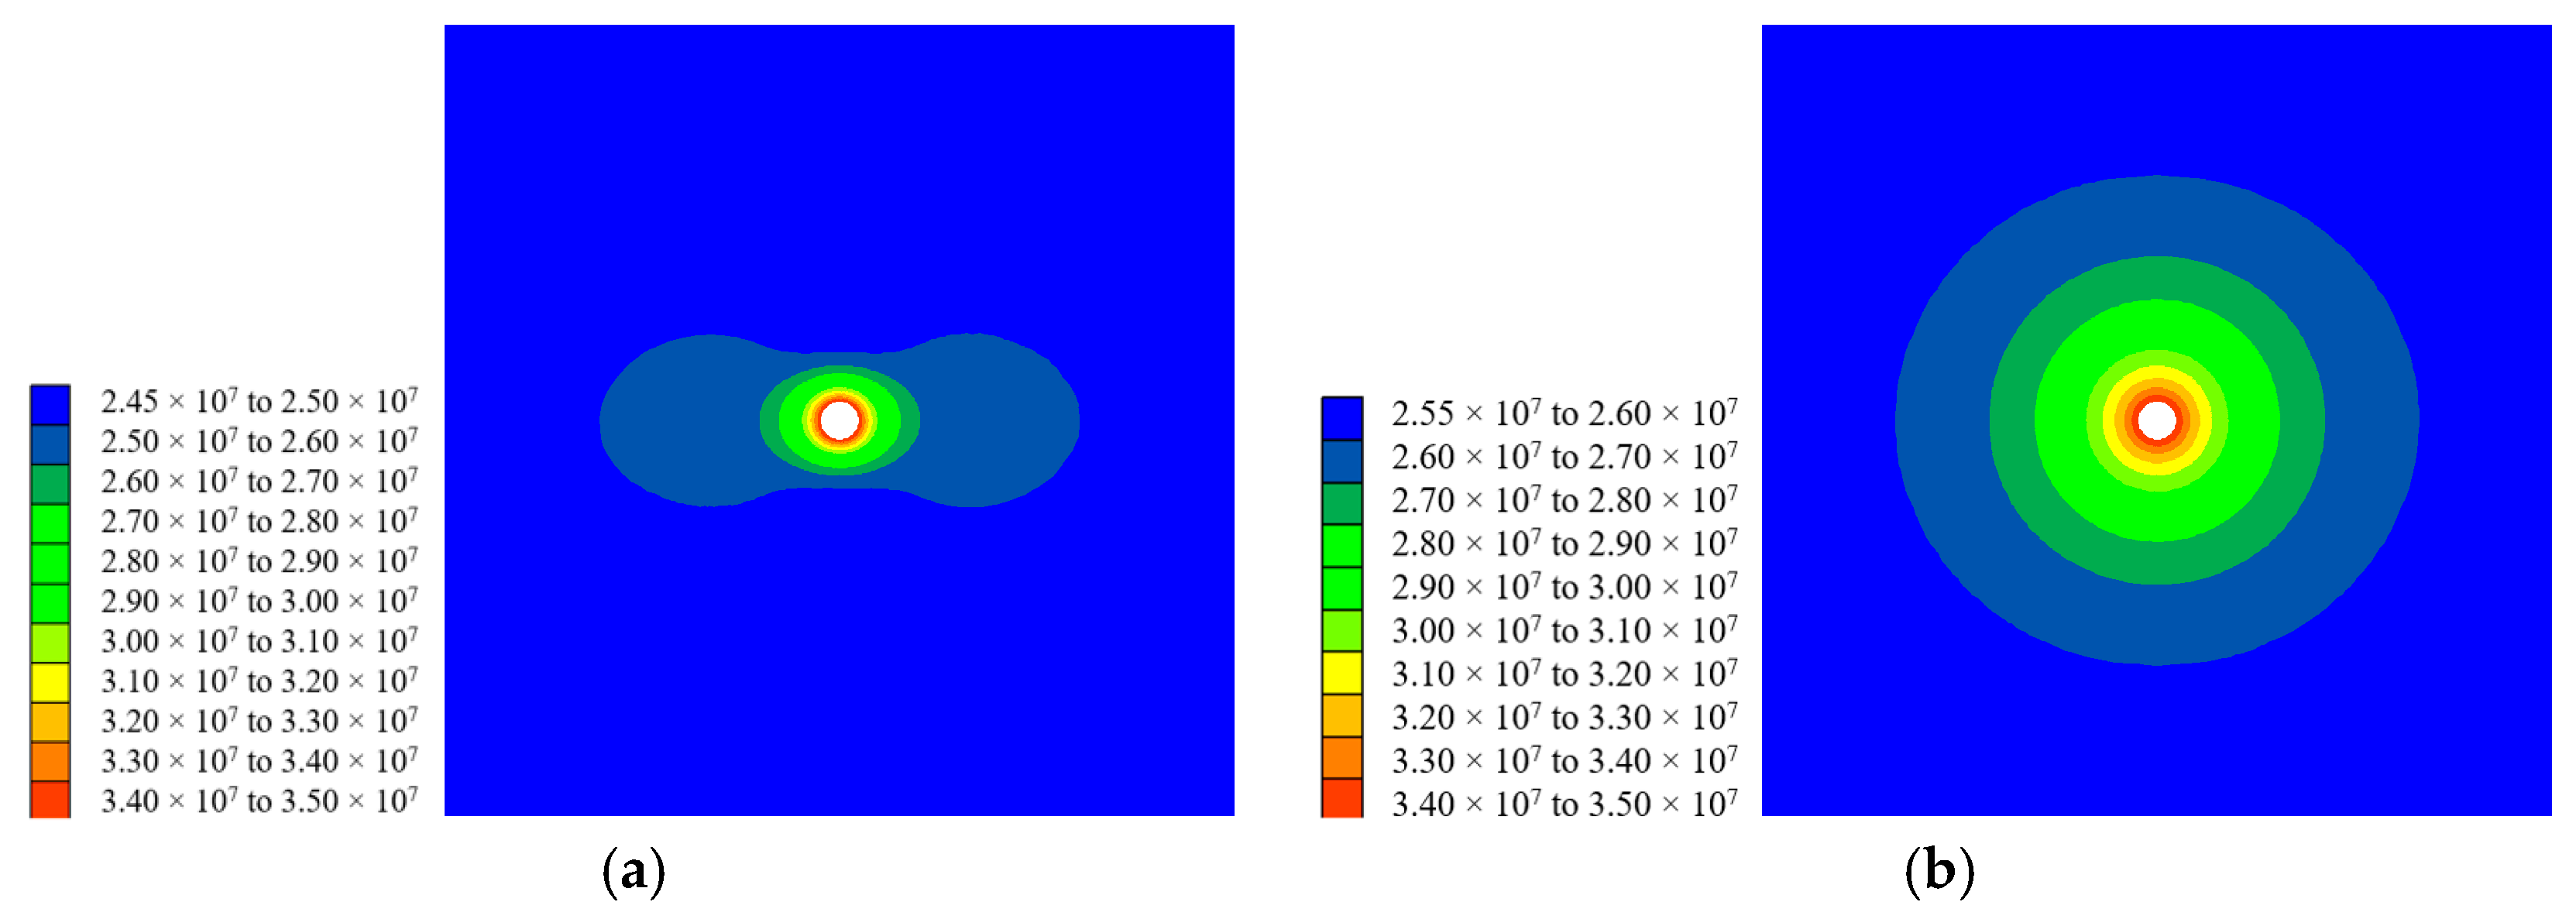
4.2.1. Stress Distribution Law of Surrounding Rock with the Invasion of Sea Water

Figure 13 presents the stress contour of the surrounding rock at the x and y directions with sea water in contact with shale formation after one hour and 48 h, respectively. When the wellbore is opened, the stress difference between the x and y directions has a maximum at the minimum horizontal in situ stress direction, so shear failure is most likely to happen. With sea water invasion into the shale formation, the transmission of pore fluid pressure leads to secondary stress distribution and the stress concentration area spreads to the periphery of the surrounding rock. At the minimum horizontal in situ stress direction, the stress differential between the x and y directions climbed rapidly at the beginning of sea water invasion, which increased the likelihood of shear failure and reached stable stress differential at 10 h (Figure 14).
Based on Figure 15, the shear stress of the surrounding rock presents symmetric distribution in the horizontal maximum (minimum) in situ stresses direction plus/minus 45°. Along with the invasion for 1 h to 48 h, the maximum shear stress of the surrounding rock (tensile stress or stress) increased from 40.62 MPa to 41.95 MPa, which increased the risk of shear failure.
It is acknowledged that shale has a typical compact formation with a very low permeability (i.e., 10−12 to 10−6 Darcy) and if fractures are not taken into consideration, the seepage process is rather slow. Shales lack the protection of a filter cake as they do not experience normal fluid loss from water-based drilling fluid at over balance. However, even this slow fluid filtrate invasion will gradually equilibrate the drilling fluid pressure and the near-wellbore pore pressure, whereby effective drilling pressure support is lost [3]. Therefore, long-term seepage is still unfavorable for wellbore stability. For sea water, pore fluid pressure still spread after 48 h and therefore the stress of the surrounding rock continued to change. The wellbore loses its stability once the stress exceeds the strength of shale formation.

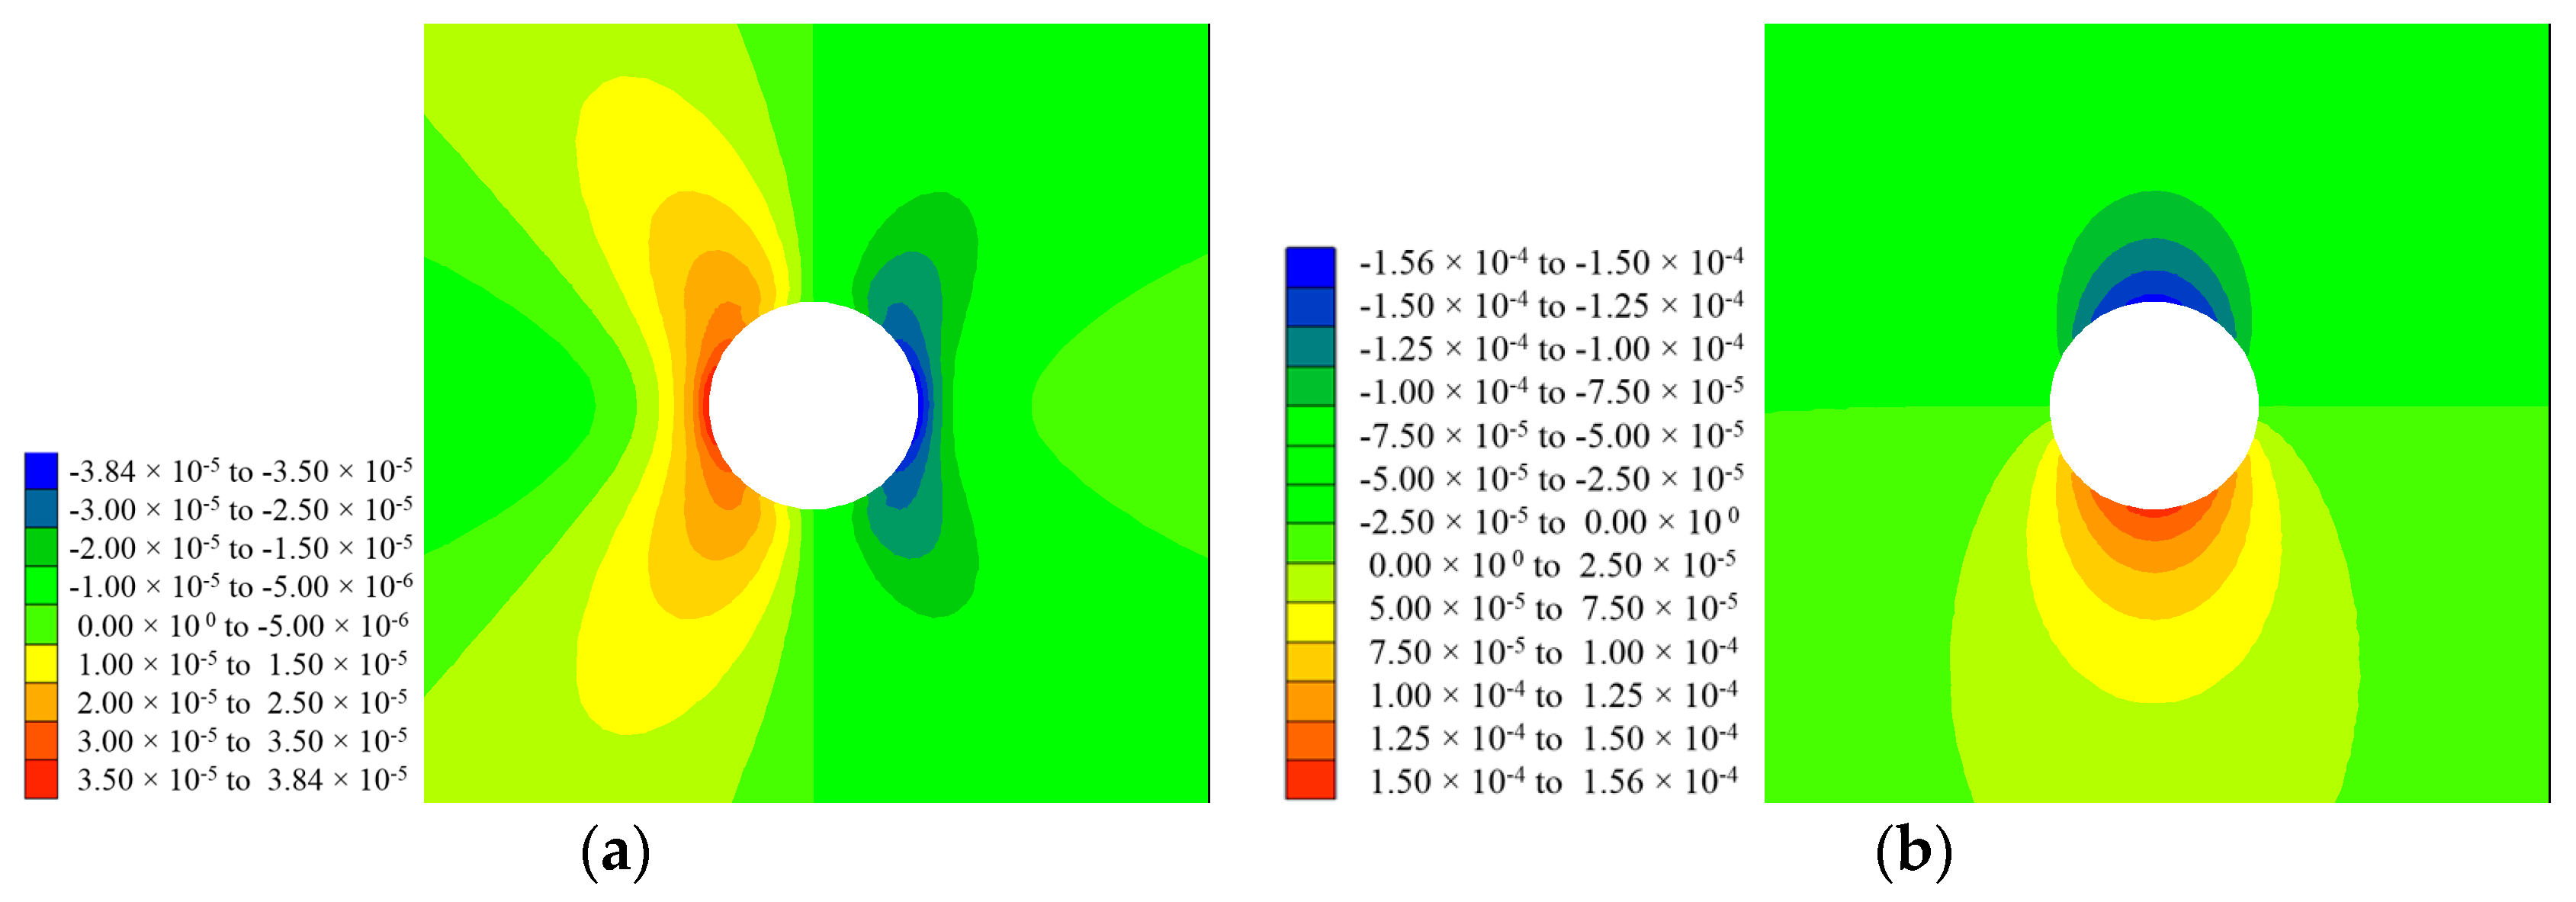
4.2.2. Deformation Distribution Law of Surrounding Rock with the Invasion of Sea Water

The displacement direction of the surrounding rock towards the wellbore in the process of sea water contacted with shale can be found and the displacement of the wellbore at the minimum and maximum horizontal in situ stress direction was given priority at the x and y directions (Figure 16), respectively.
Figure 17 presents the displacement curve at the x and y directions. Even at the y direction, the displacement was only 170 μm after 48 h, showing that the shale sample was a hard and brittle rock and wellbore shrinkage would not happen, which is consistent with the former X-ray diffraction analysis results [19]. Collapse and breaking will become the main model of wellbore instability.
Tensile deformation and shear deformation appeared at the maximum and minimum in situ stress directions, respectively, in the first 24 h of sea water invasion (Figure 18a). In the next 24 h, yield shear deformation occupied the primary position and the radius of the yielding zone increased to a certain extent (Figure 18b).

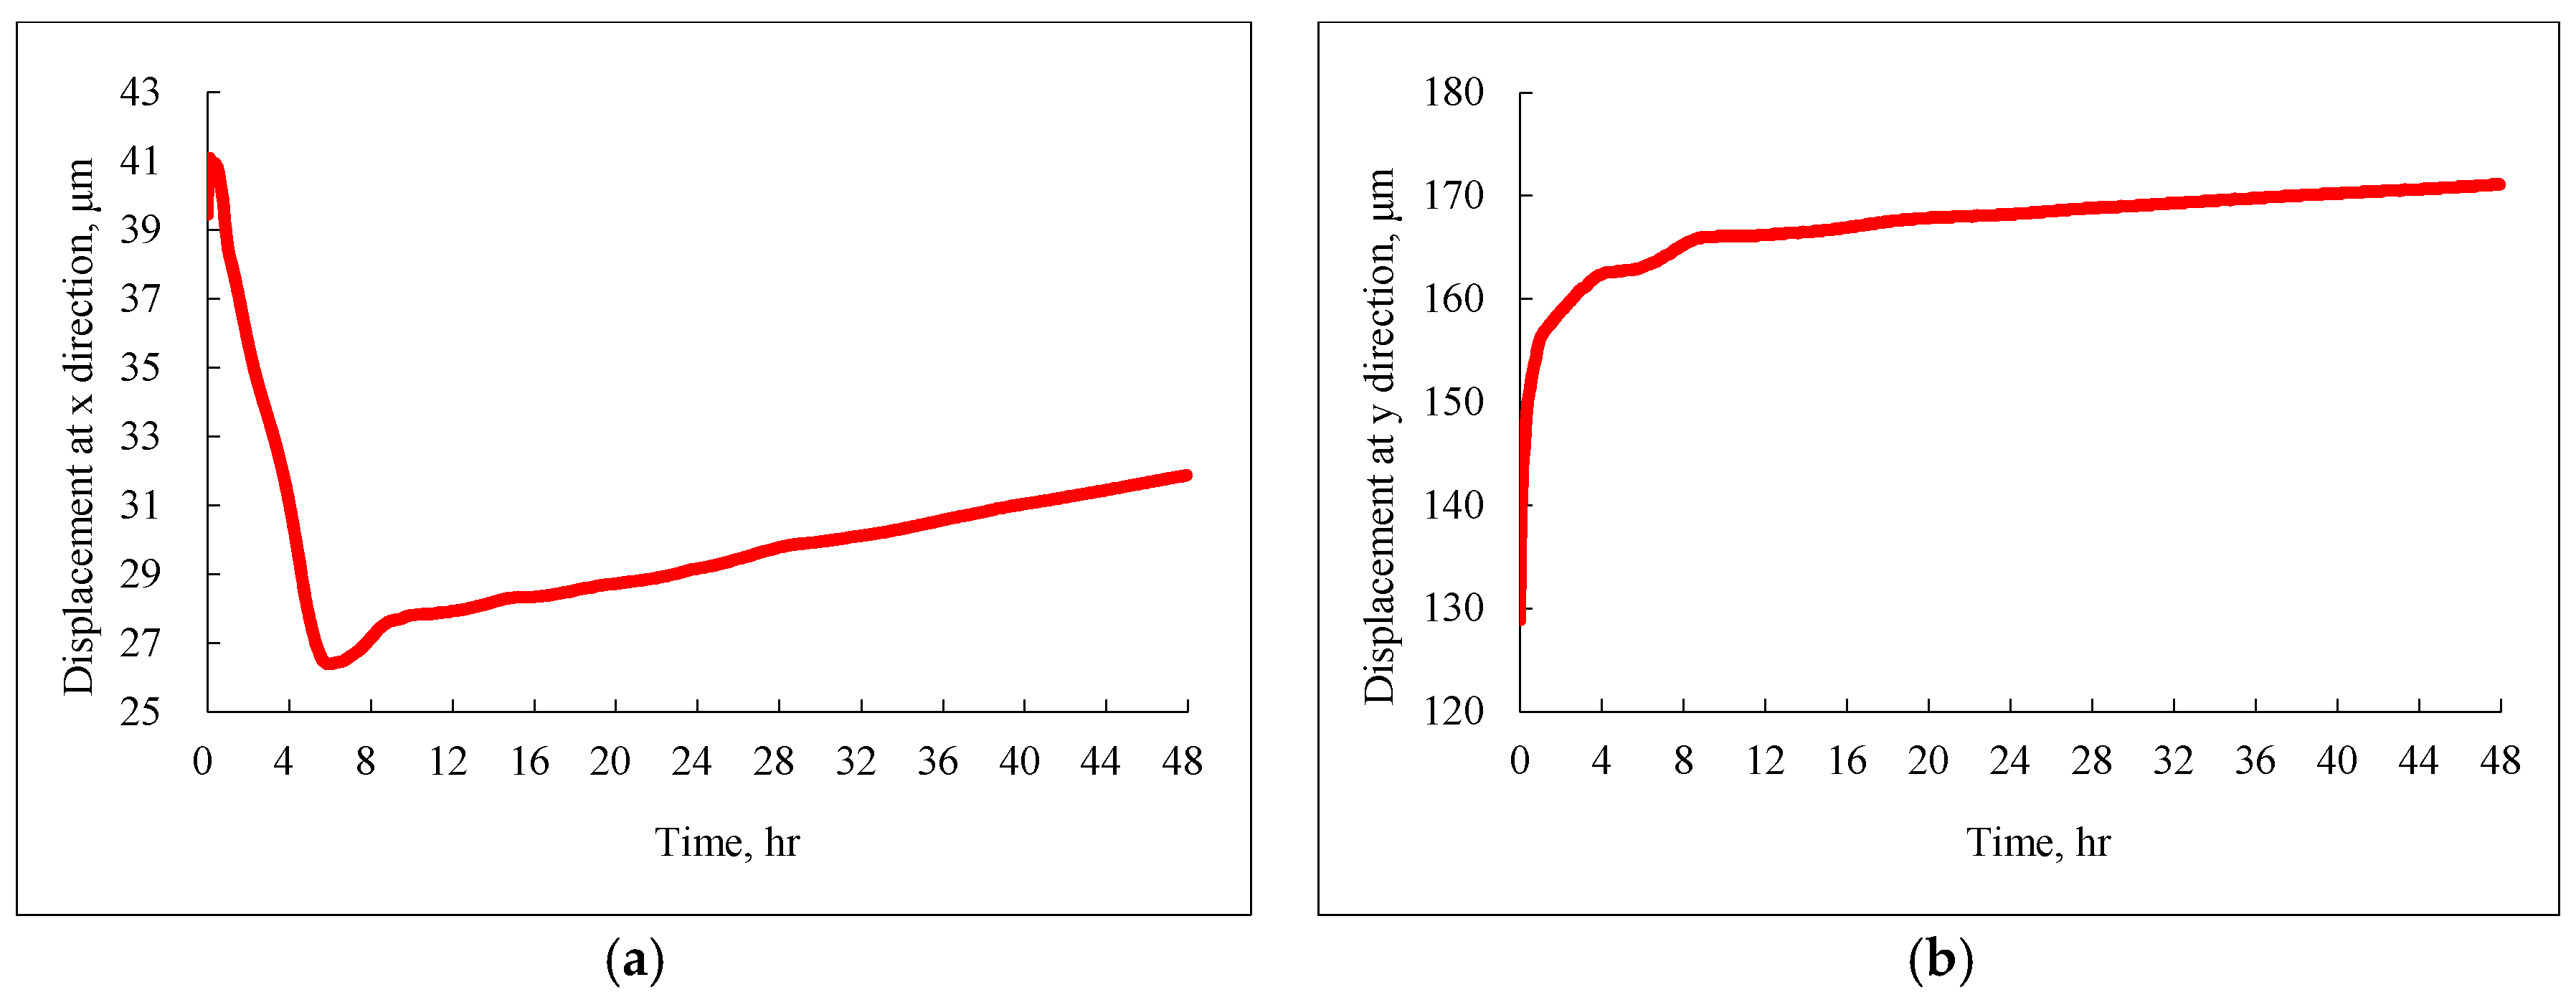
4.2.3. The Influence of Fluid Density on the Deformation of the Surrounding Rock

The effect of fluid density on the plastic yielding zone is shown in Figure 19. The shear failure zone is only observed when the fluid density decreased to 1.22 g/cm3. As the density of the drilling fluid increased to 1.63 g/cm3 and the corresponding drilling fluid pressure was 40.75 MPa, respectively, the tensile yield zone near the wellbore appeared at the beginning of drilling fluid invasion (Figure 19b), indicating that higher density might lead to tensile failure. With further invasion, shear failure became the possible instability model and the yield zone of shear deformation occupied less than that of lower density (1.22 g/cm3), indicating that higher density might be helpful in decreasing the radius of yield zone (Figure 19c,d). This can be explained by higher fluid density bringing higher effective support to the wellbore. However, it may also speed up the invasion of water into shales and weaken the rock, possibly even causing new fractures or lost circulation. Therefore, the density of drilling fluid should be controlled in a rational range.

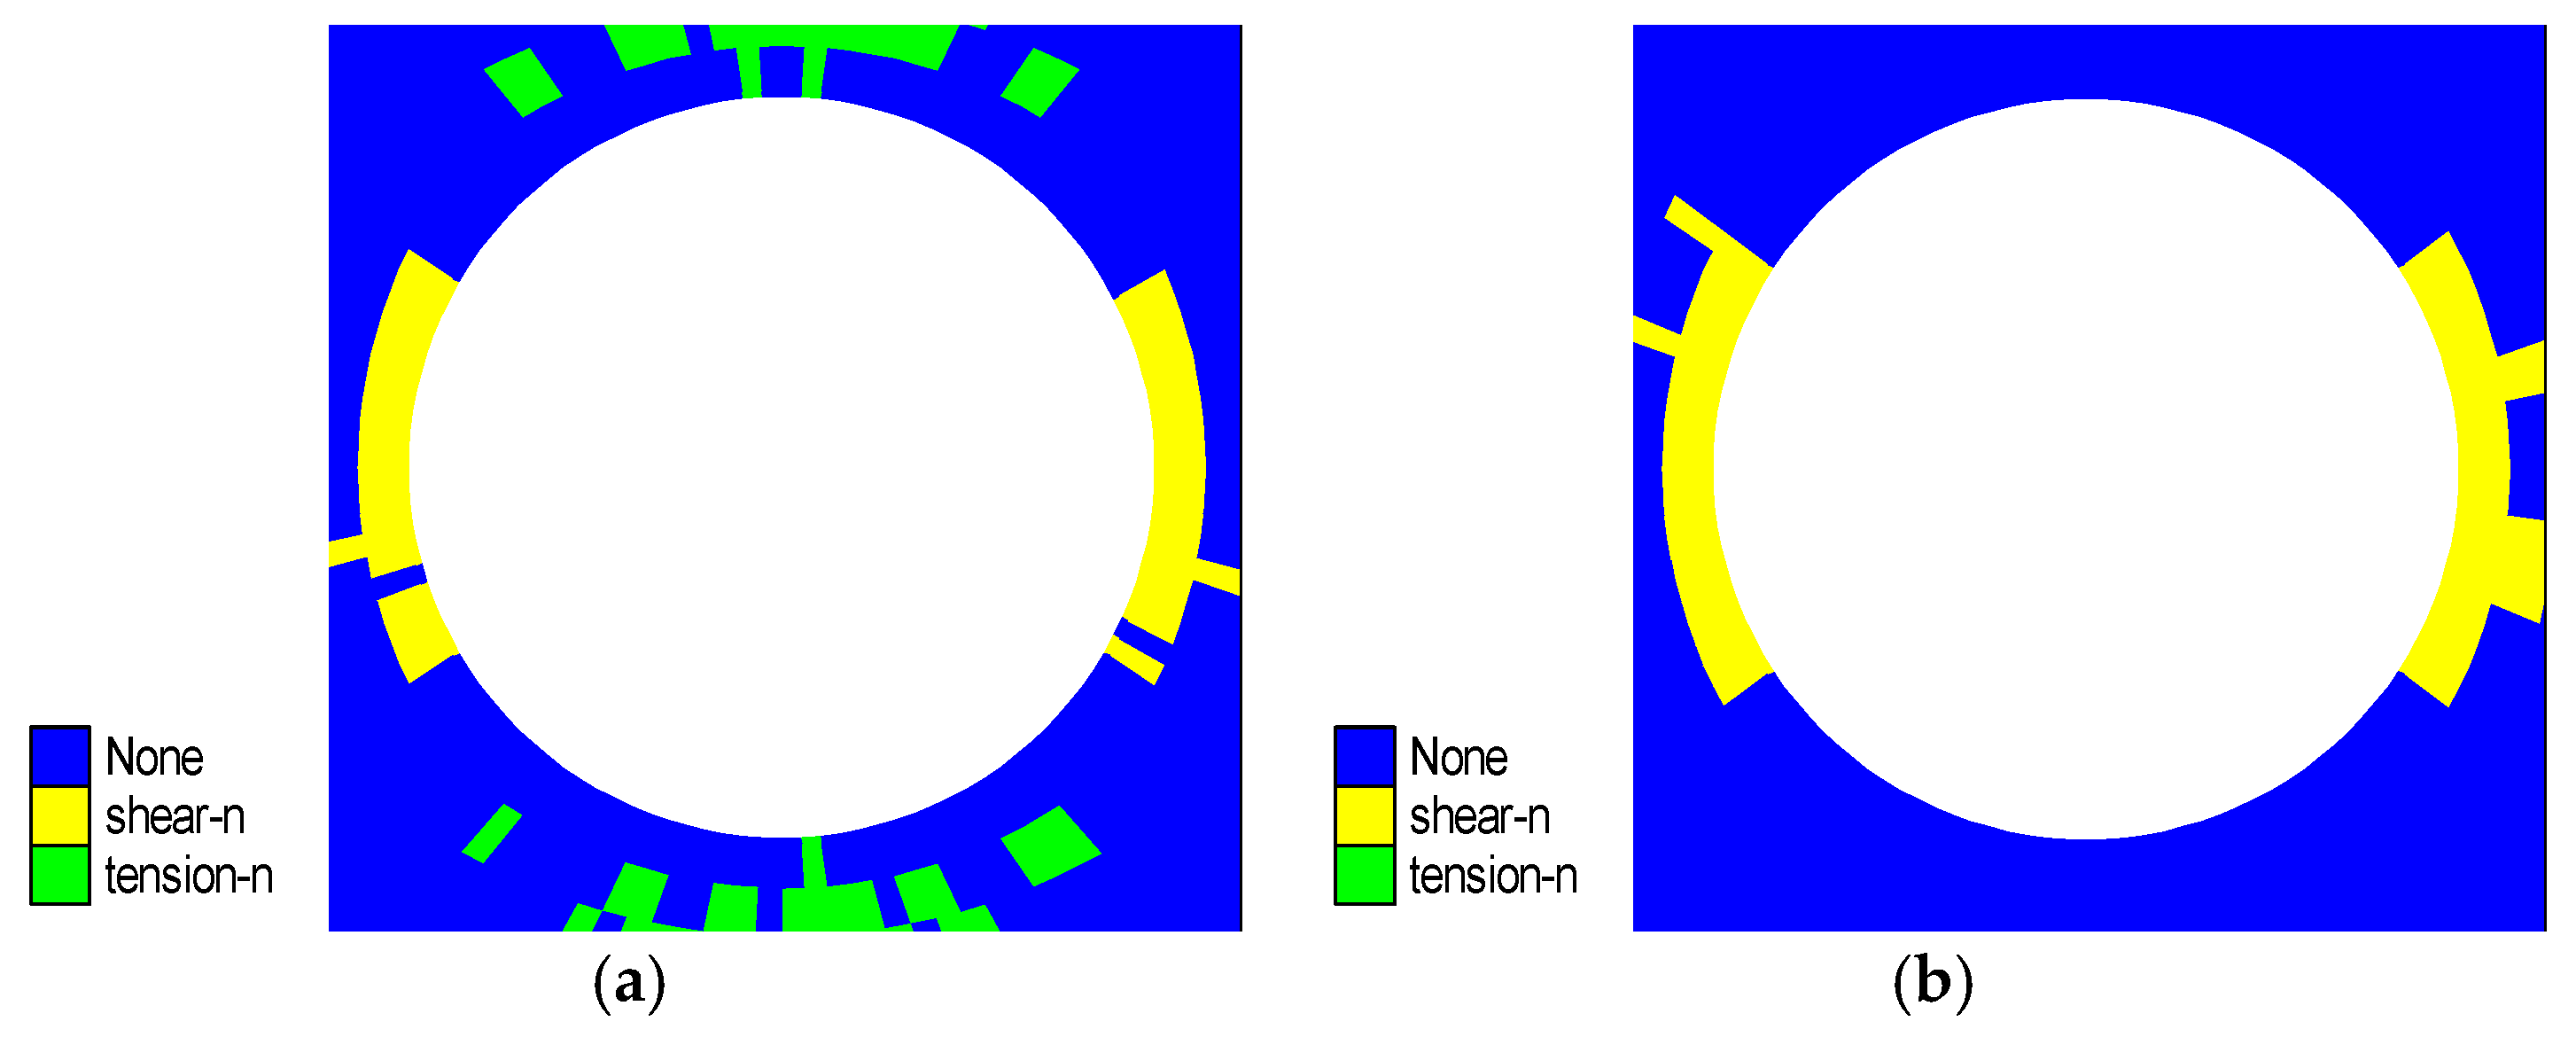
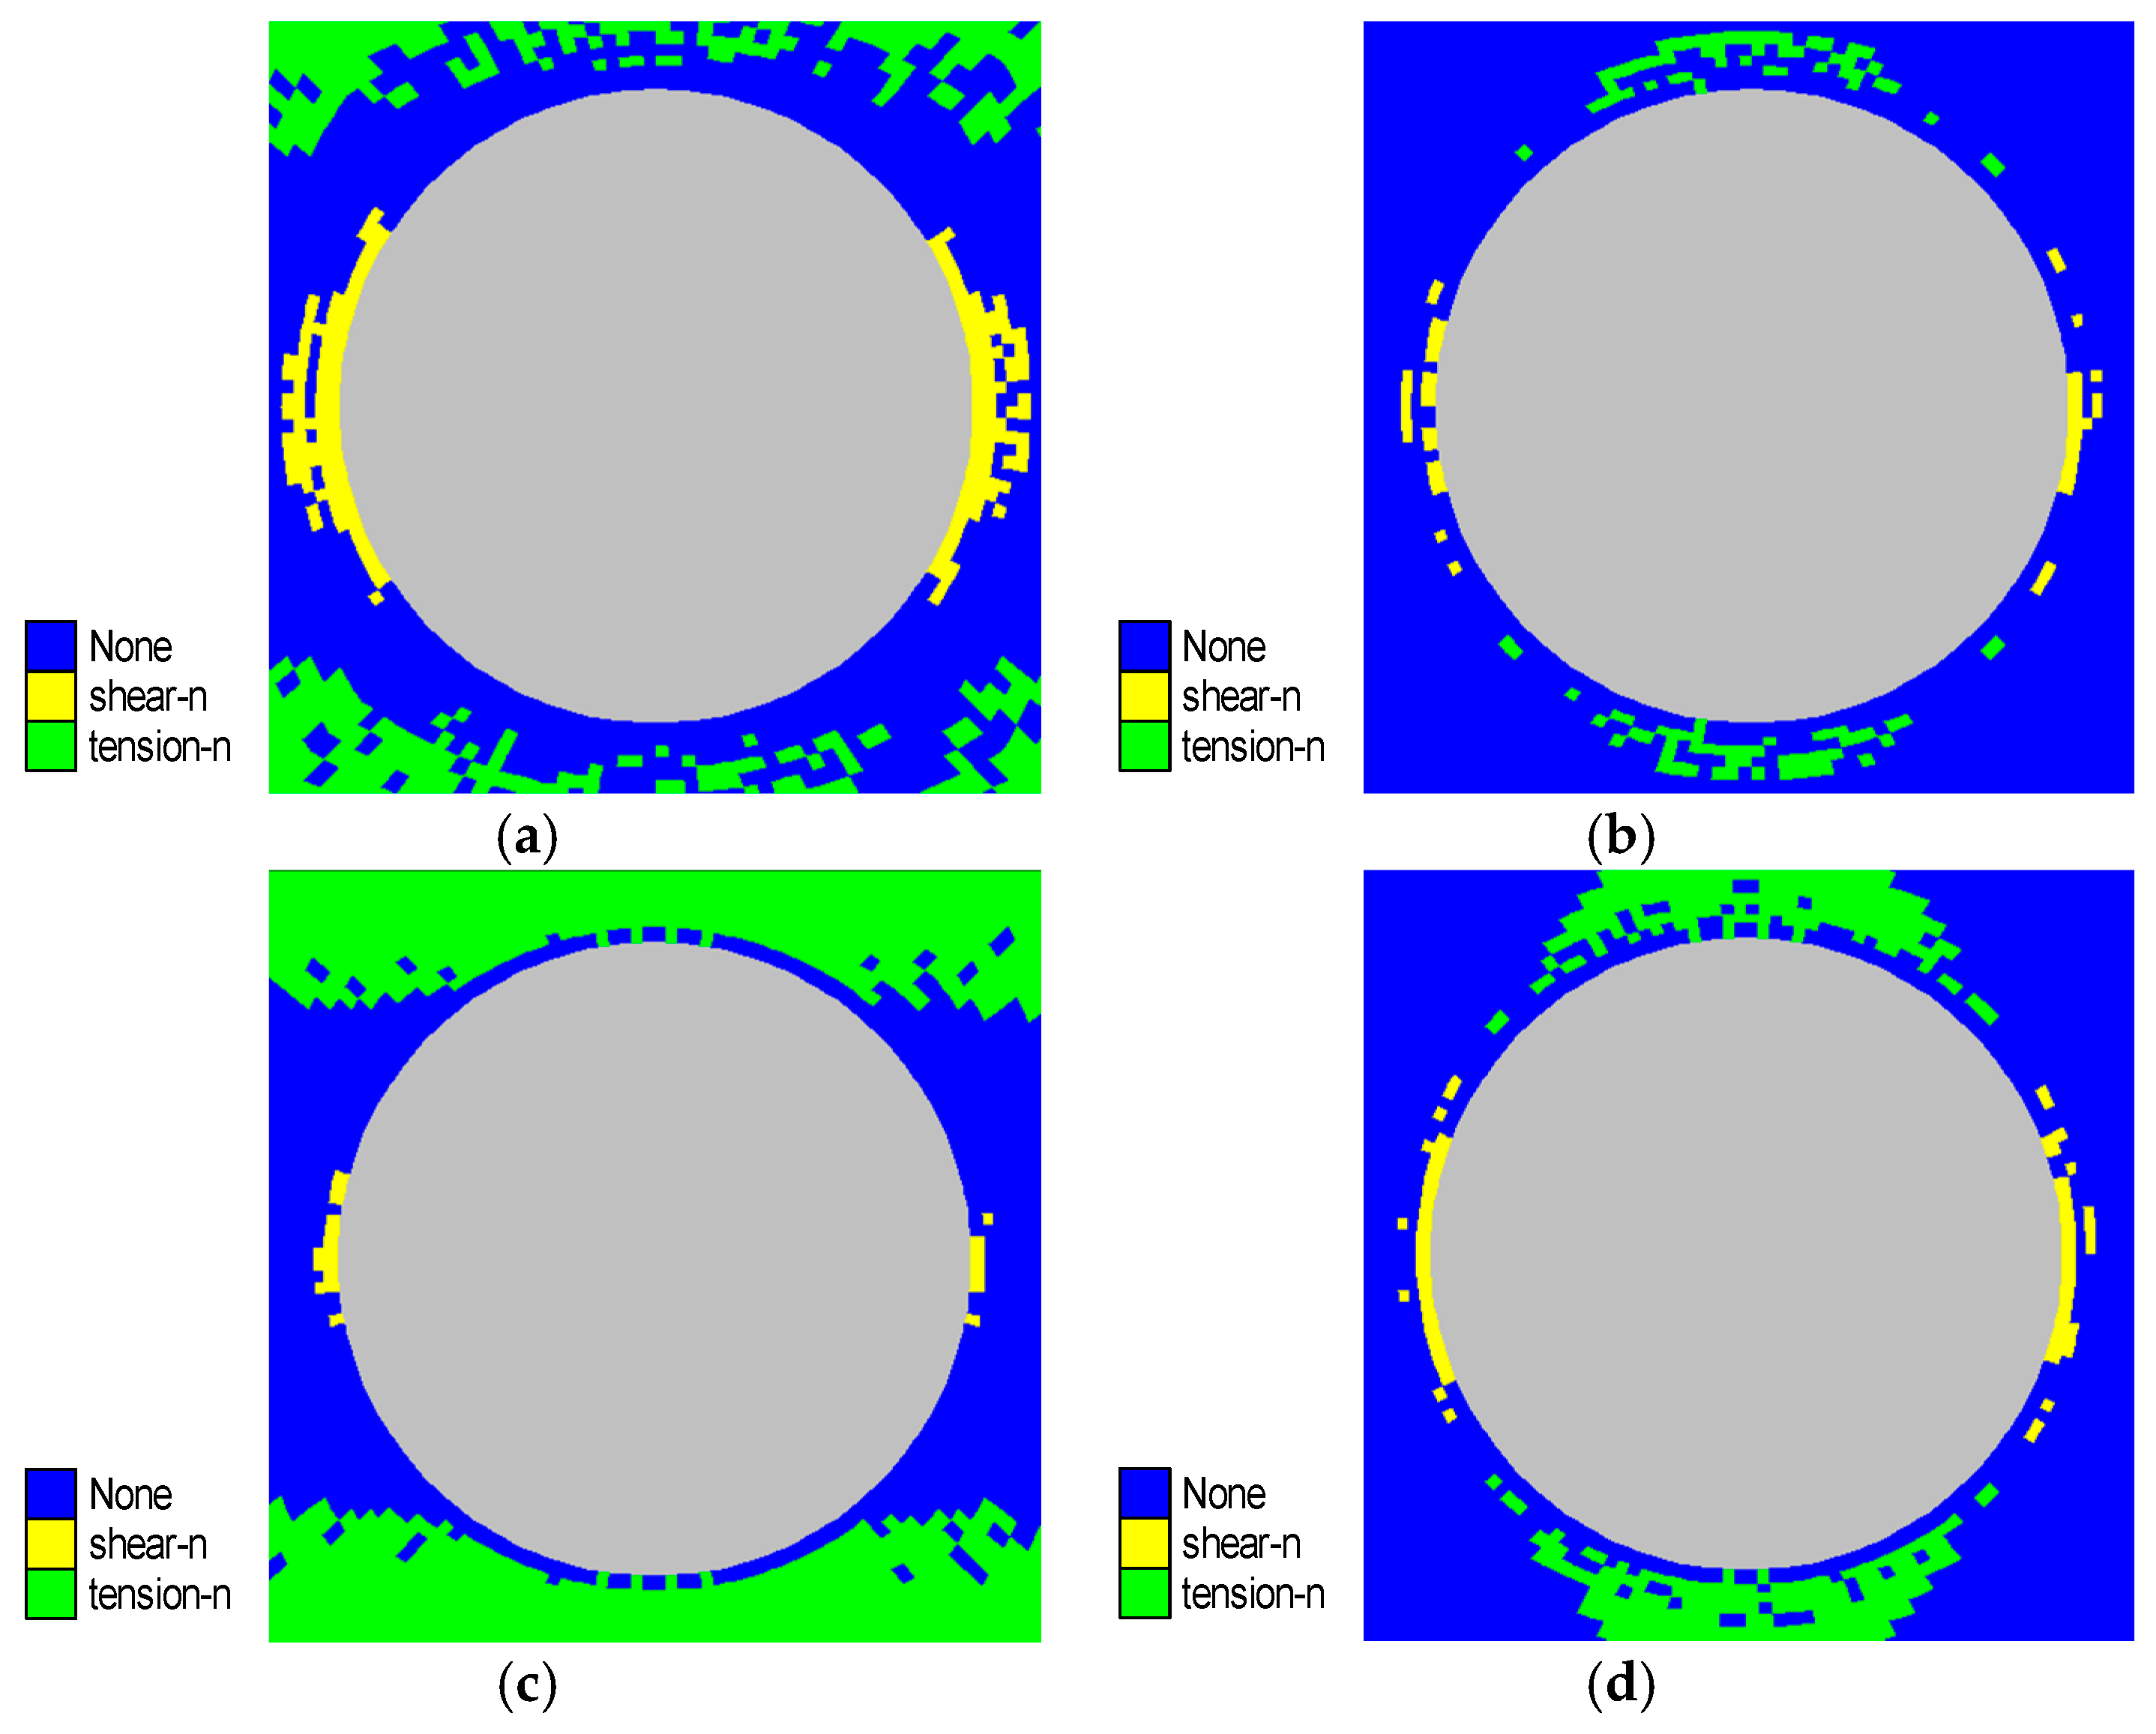
4.2.4. The Influence of SiO2 NP on the Stress and Deformation of the Surrounding Rock

The stress differential between the x and y directions at the wellbore of minimum horizontal in situ stress direction reached a maximum (105 MPa) with the invasion of the BM lasting for 16 h (Figure 20). In the presence of SiO2 NP into the BM for 48 h, the stress differential was only 98.10 MPa, indicating that the BM containing NP had excellent capability to lower the possibility of shear failure and tended to improve wellbore stability.
The maximum shear stress near the wellbore was 40.26 MPa and 41.02 MPa (Figure 21a,c) when the invasion of the BM into the shale lasted 10 h and 48 h, respectively, while the BM with SiO2 NP, the maximum shear stress only reached 32.32 MPa and 37.55 MPa (Figure 21b,d), respectively. Therefore, the BM containing SiO2 NP has much less possibility for shear failure.
Figure 22 shows the effect of the BM with or without SiO2 NP on plastic yield zone distribution near the wellbore. In the first 10 h, no yield zones were observed when the shale was in contact with the BM containing NP and even after 48 h, the yield zone was much smaller compared to the shale with only the BM. The physical plugging of SiO2 NP into the nano-sized pores mitigated the invasion of water from the drilling fluid into the shale formation and therefore decreased the effects on the stress and yield zones of the surrounding rock. Therefore, the wellbore stability in shale formations could be improved.

5. Discussion

5.1. The Mechanism of Silica NP Stabilizing Shale

Similar PTTs (as those in Section 2) and following scanning electron microscope (SEM) tests were conducted to confirm the successful plugging of NP (nano-SiO2) into shale, as shown in Figure 23. The nano-SiO2 used in this study was a milky white dispersion and was procured from Nanjing Haitai Nano Materials Co., Ltd., Nanjing, China. The diameter of nano-SiO2 ranged from 10 to 20 nm. The shale sample was from the outcrop of Longmaxi Group, collected from Xiushan, Chongqing in Southwest China. X-ray diffraction (XRD) results of the shale showed that it included 47% quartz, 25% calcite, 10% illite, 10% chlorite, 5% feldspar and 3% dolomite.
The experimental data in Figure 23 showed that 5% nano-SiO2 by weight could retard liquid pressure transmission effectively and was beneficial in maintaining wellbore stability, which proved that NP can be used to seal the pores of the shale.
SEM tests of shale samples after PTT were run to check the effects of NP in decreasing the permeability of shale. The SEM pictures of shale before and after contact with NP enlarged 2400 times and 30,000 times are shown in Figure 24, respectively. Figure 24b shows that nano-SiO2 attached to the shale surface or penetrated the pores of shale. The nano-SiO2 consolidated and became larger, but we still found that NP attached stably to the surfaces of shale. By increasing magnification to 30,000 times, we could clearly see that the pores of the original shale (Figure 24c) and the blocked pores of shale in contact with NP (Figure 24d). It indicates that nano-SiO2 can plug the shale pore effectively, decreasing its permeability and therefore retarding the pore pressure transmission to maintain wellbore stability.
Statistical diagrams of pore size distribution of SEM pictures of Figure 24c,d are shown in Figure 25. The average pore sizes of shale were 0.275 μm and 0.137 μm, respectively. After plugging, the average pore size was reduced by a ratio of 50.18%. The SEM pictures and statistical diagrams of pore size distribution of shale further confirmed the successful plugging of nano-SiO2 into shale pores, resulting in the decrease of shale permeability.
In terms of how NP stabilizes shales, Hoxha et al. [33] provided an in-depth explanation by addressing the “force” that “drives” NP to block shale pore throats, decrease shale permeability, and reduce fluid pressure transmission. NP exhibits phenomenal surface-active properties with their high surface-to-volume ratio, allowing for their customized attachment to compounds which can be utilized for “fit-for-purpose” applications. Hoxha et al. [33] stated that attraction between shale surfaces and NP is the main mechanism that will lead to pore throat plugging reducing pressure transmission, which in turn benefits borehole stability by slowing down near-wellbore pore-pressure elevation and effective stress reduction. The inter-molecular shale NP interaction should allow for NP to approach the shale surface and be able to adhere to them. This means that electrostatic repulsion needs to be sufficiently slow so that NP can “diffuse” through any present repulsive barrier, and reach the shale surface, resulting in plugging the shale pores. They also advocated the use of NP at optimized concentrations of up to 5% by weight.

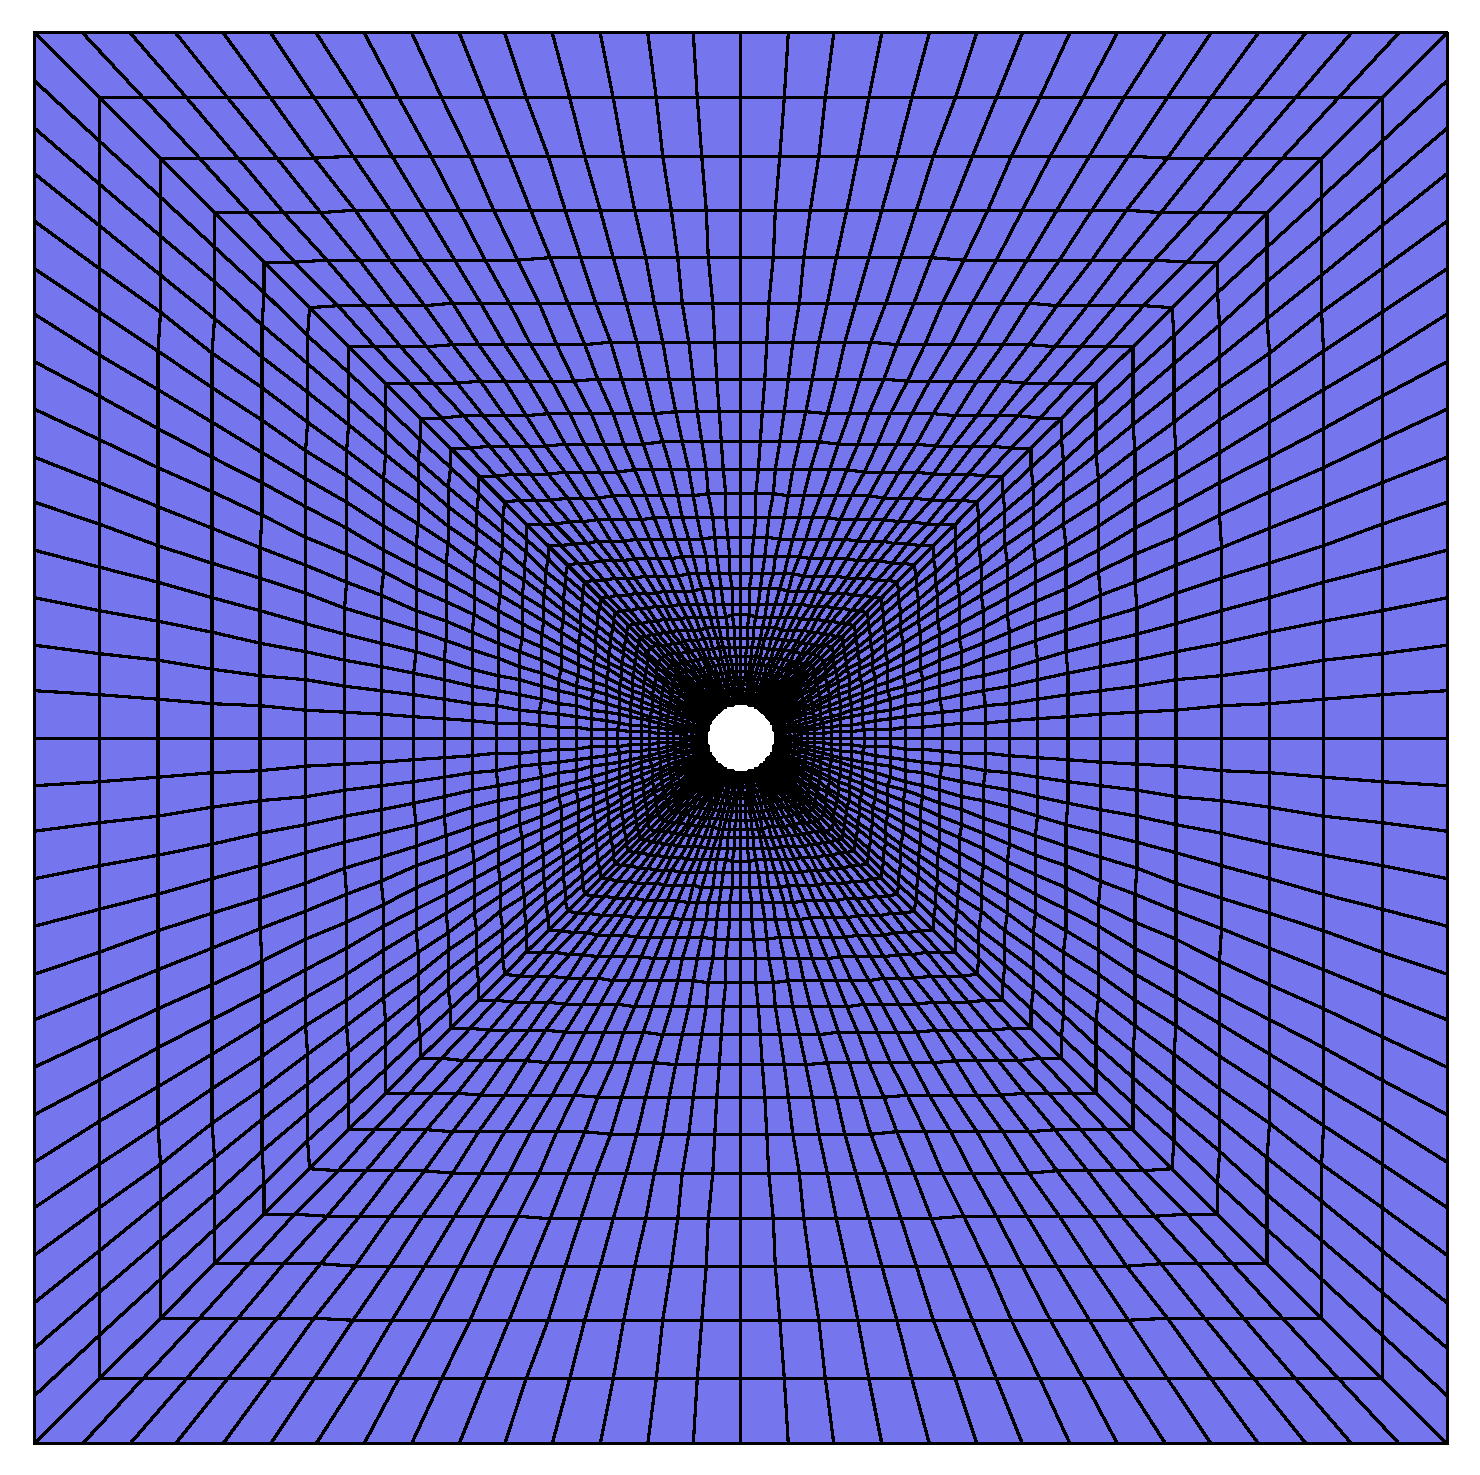
5.2. The Influence of the Underlying Discretization on the Simulation Results

To identify the effect of discretization on the simulation results, by taking Figure 22 (the yield zone distribution of the surrounding rock) as an example, we transformed the mesh into a sparse and denser one (Figure 26), separately, and simulated the deformation of the yield zone distribution of shear failure. As a whole, the calculation model was divided into 1800 grids and 3720 nodes for the sparse one, and the calculation was divided into 7200 grids and 14,880 nodes for the denser one, respectively.
When the grid became a half of the previous model (Figure 6), only the BM solution had a plastic shear zone for 10 h in the near wellbore area, and there was no plastic zone for 24 h. When using “BM + NP”, there was no plastic zone nearby the wellbore for both 10 h and 24 h (Figure 27).
When the grid was doubled, the plastic zone of the “BM + NP” varied more than that of the BM nearby the wellbore for 10 h and 24 h, and the change of the plastic zone was more detailed than that in the article. However, it can be seen from the propagation of the plastic zone that the seepage speed of the “BM + NP” is much slower than that of the BM (Figure 28).
Therefore, discretization is beneficial in distinguishing the yield zone distribution of the surrounding rock in shales. However, it will also greatly decrease the computing efficiency if all the wellbore is divided into too many grids.

6. Conclusions

The combination of PTT and 2D numerical simulation with FLAC3D™ software offers a better understanding of the interaction between shale and NP-based drilling fluid. Based on previous PTT with Atoka shale, the paper reports the numerical simulation findings of wellbore stability in the presence of NP based drilling fluid with the fluid-solid coupling model in FLAC3D™ software. The results of previous PTT were discussed. The steps of numerical simulation, simulation on pore fluid pressure transmission, distribution of stress, and deformation of surrounding rock were also presented. The mechanism of NP in reducing the permeability and stabilizing shale was discussed and the following key conclusions were reached:
(1)
The numerical simulation results showed that water from the water-based drilling fluids had a strong tendency to invade shale, driven by the positive pressure differential between drilling fluid pressure and pore fluid pressure which increased the likelihood of shale instability. However, the transmission of pore fluid pressure could be mitigated in the presence of silica NP, which is consistent with previous results of PTT. The pore pressure transmission boundary of the shale in contact with the drilling fluid could also be restricted with silica NP.
(2)
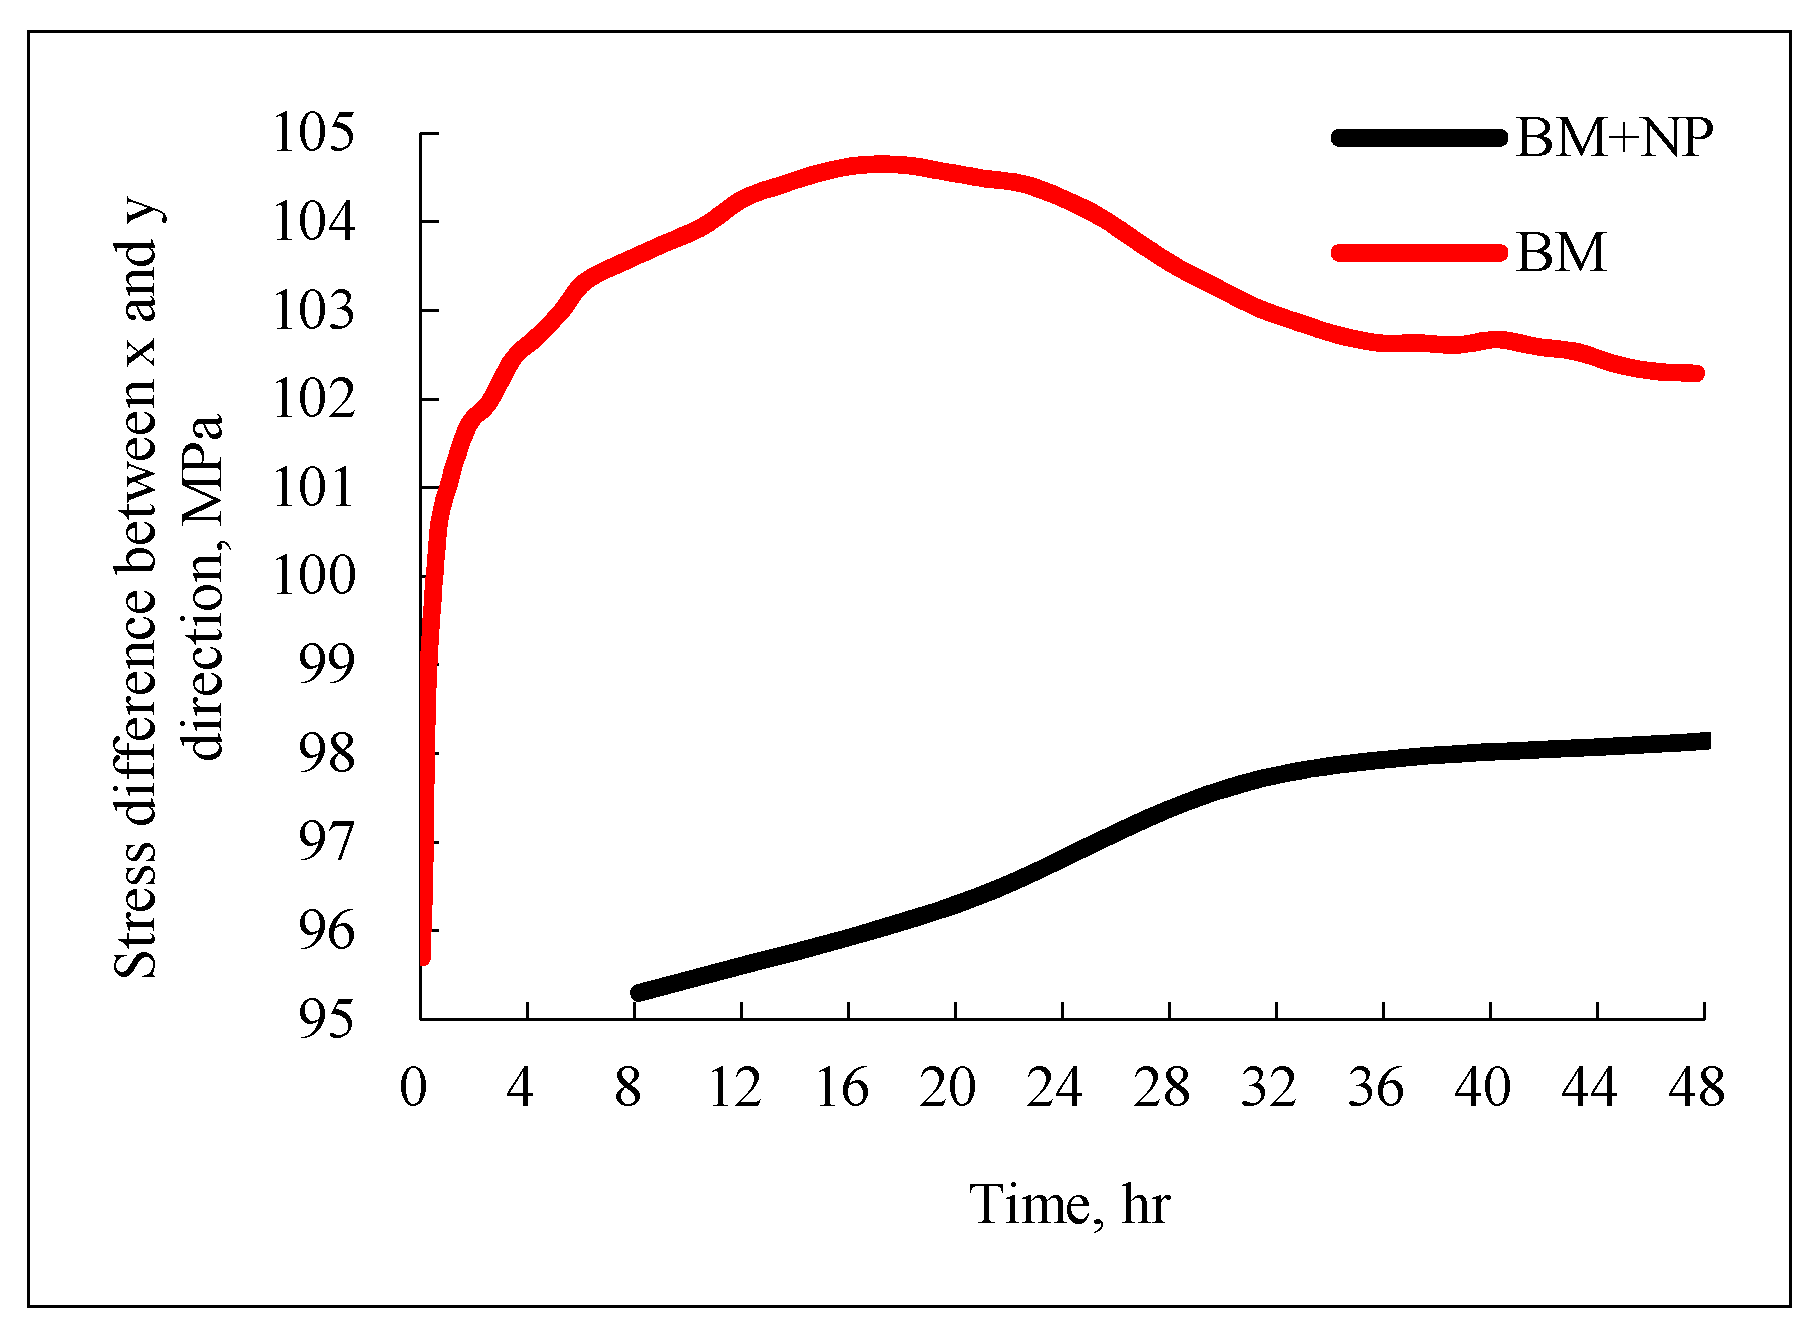
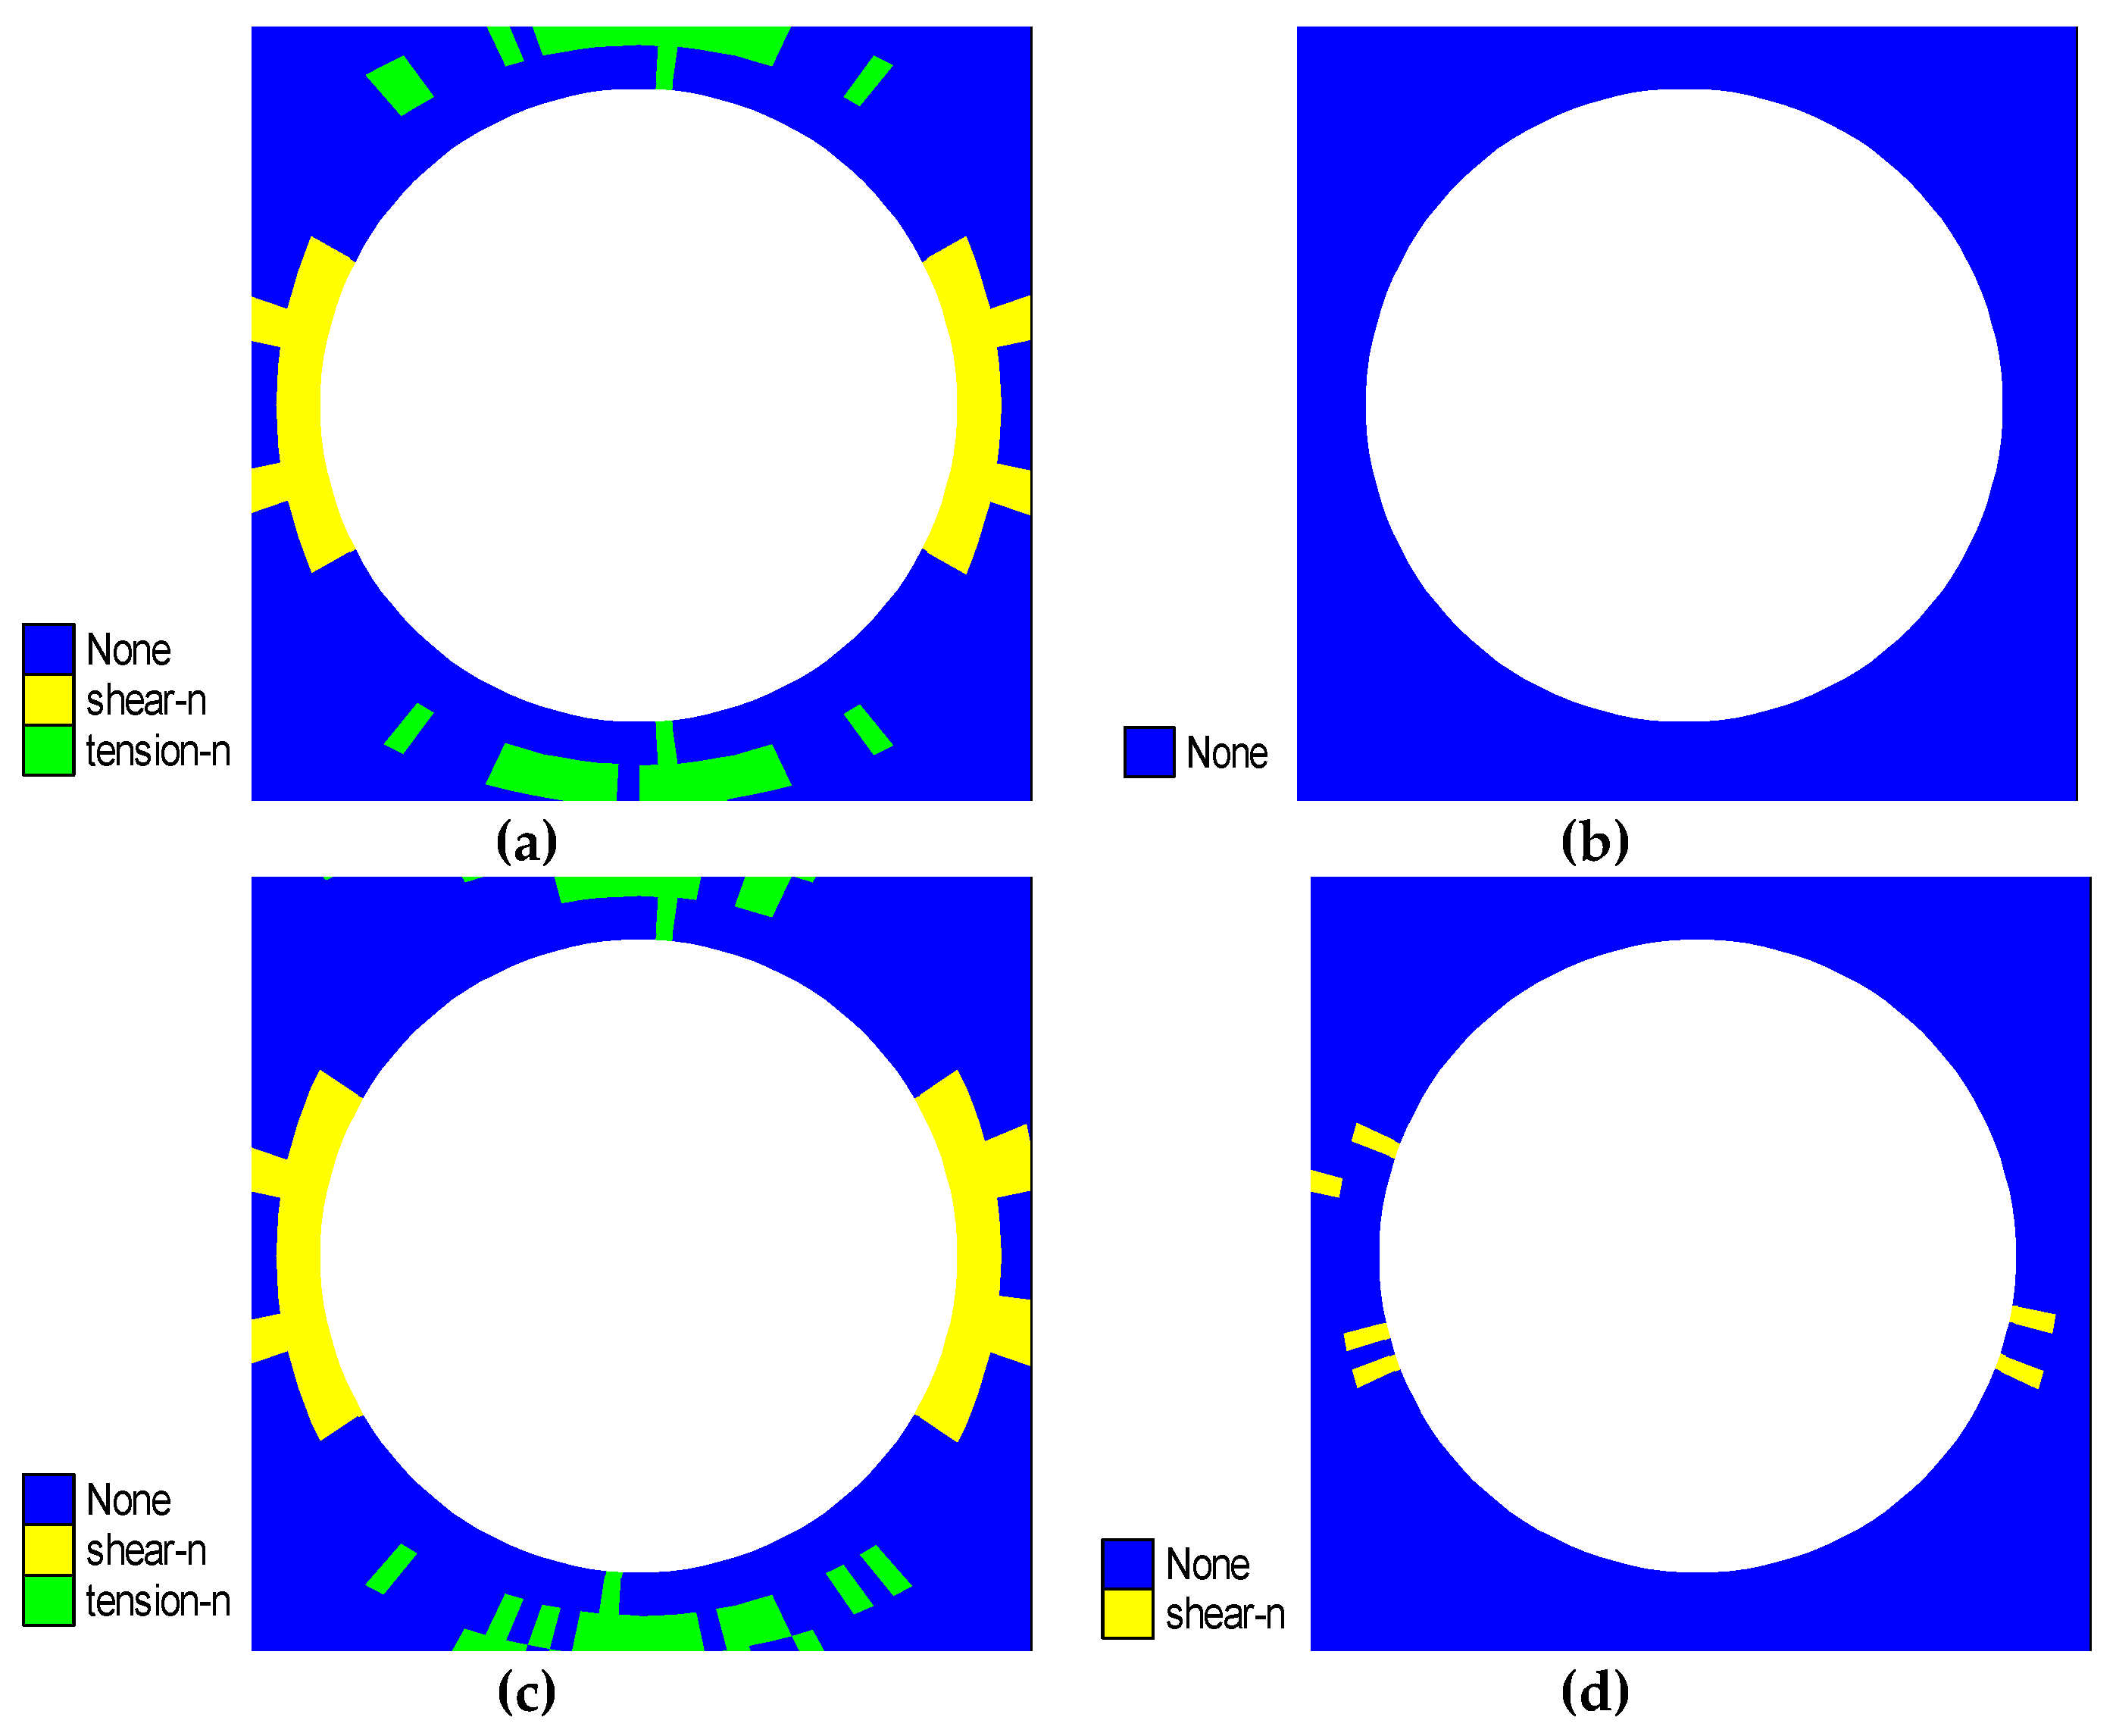
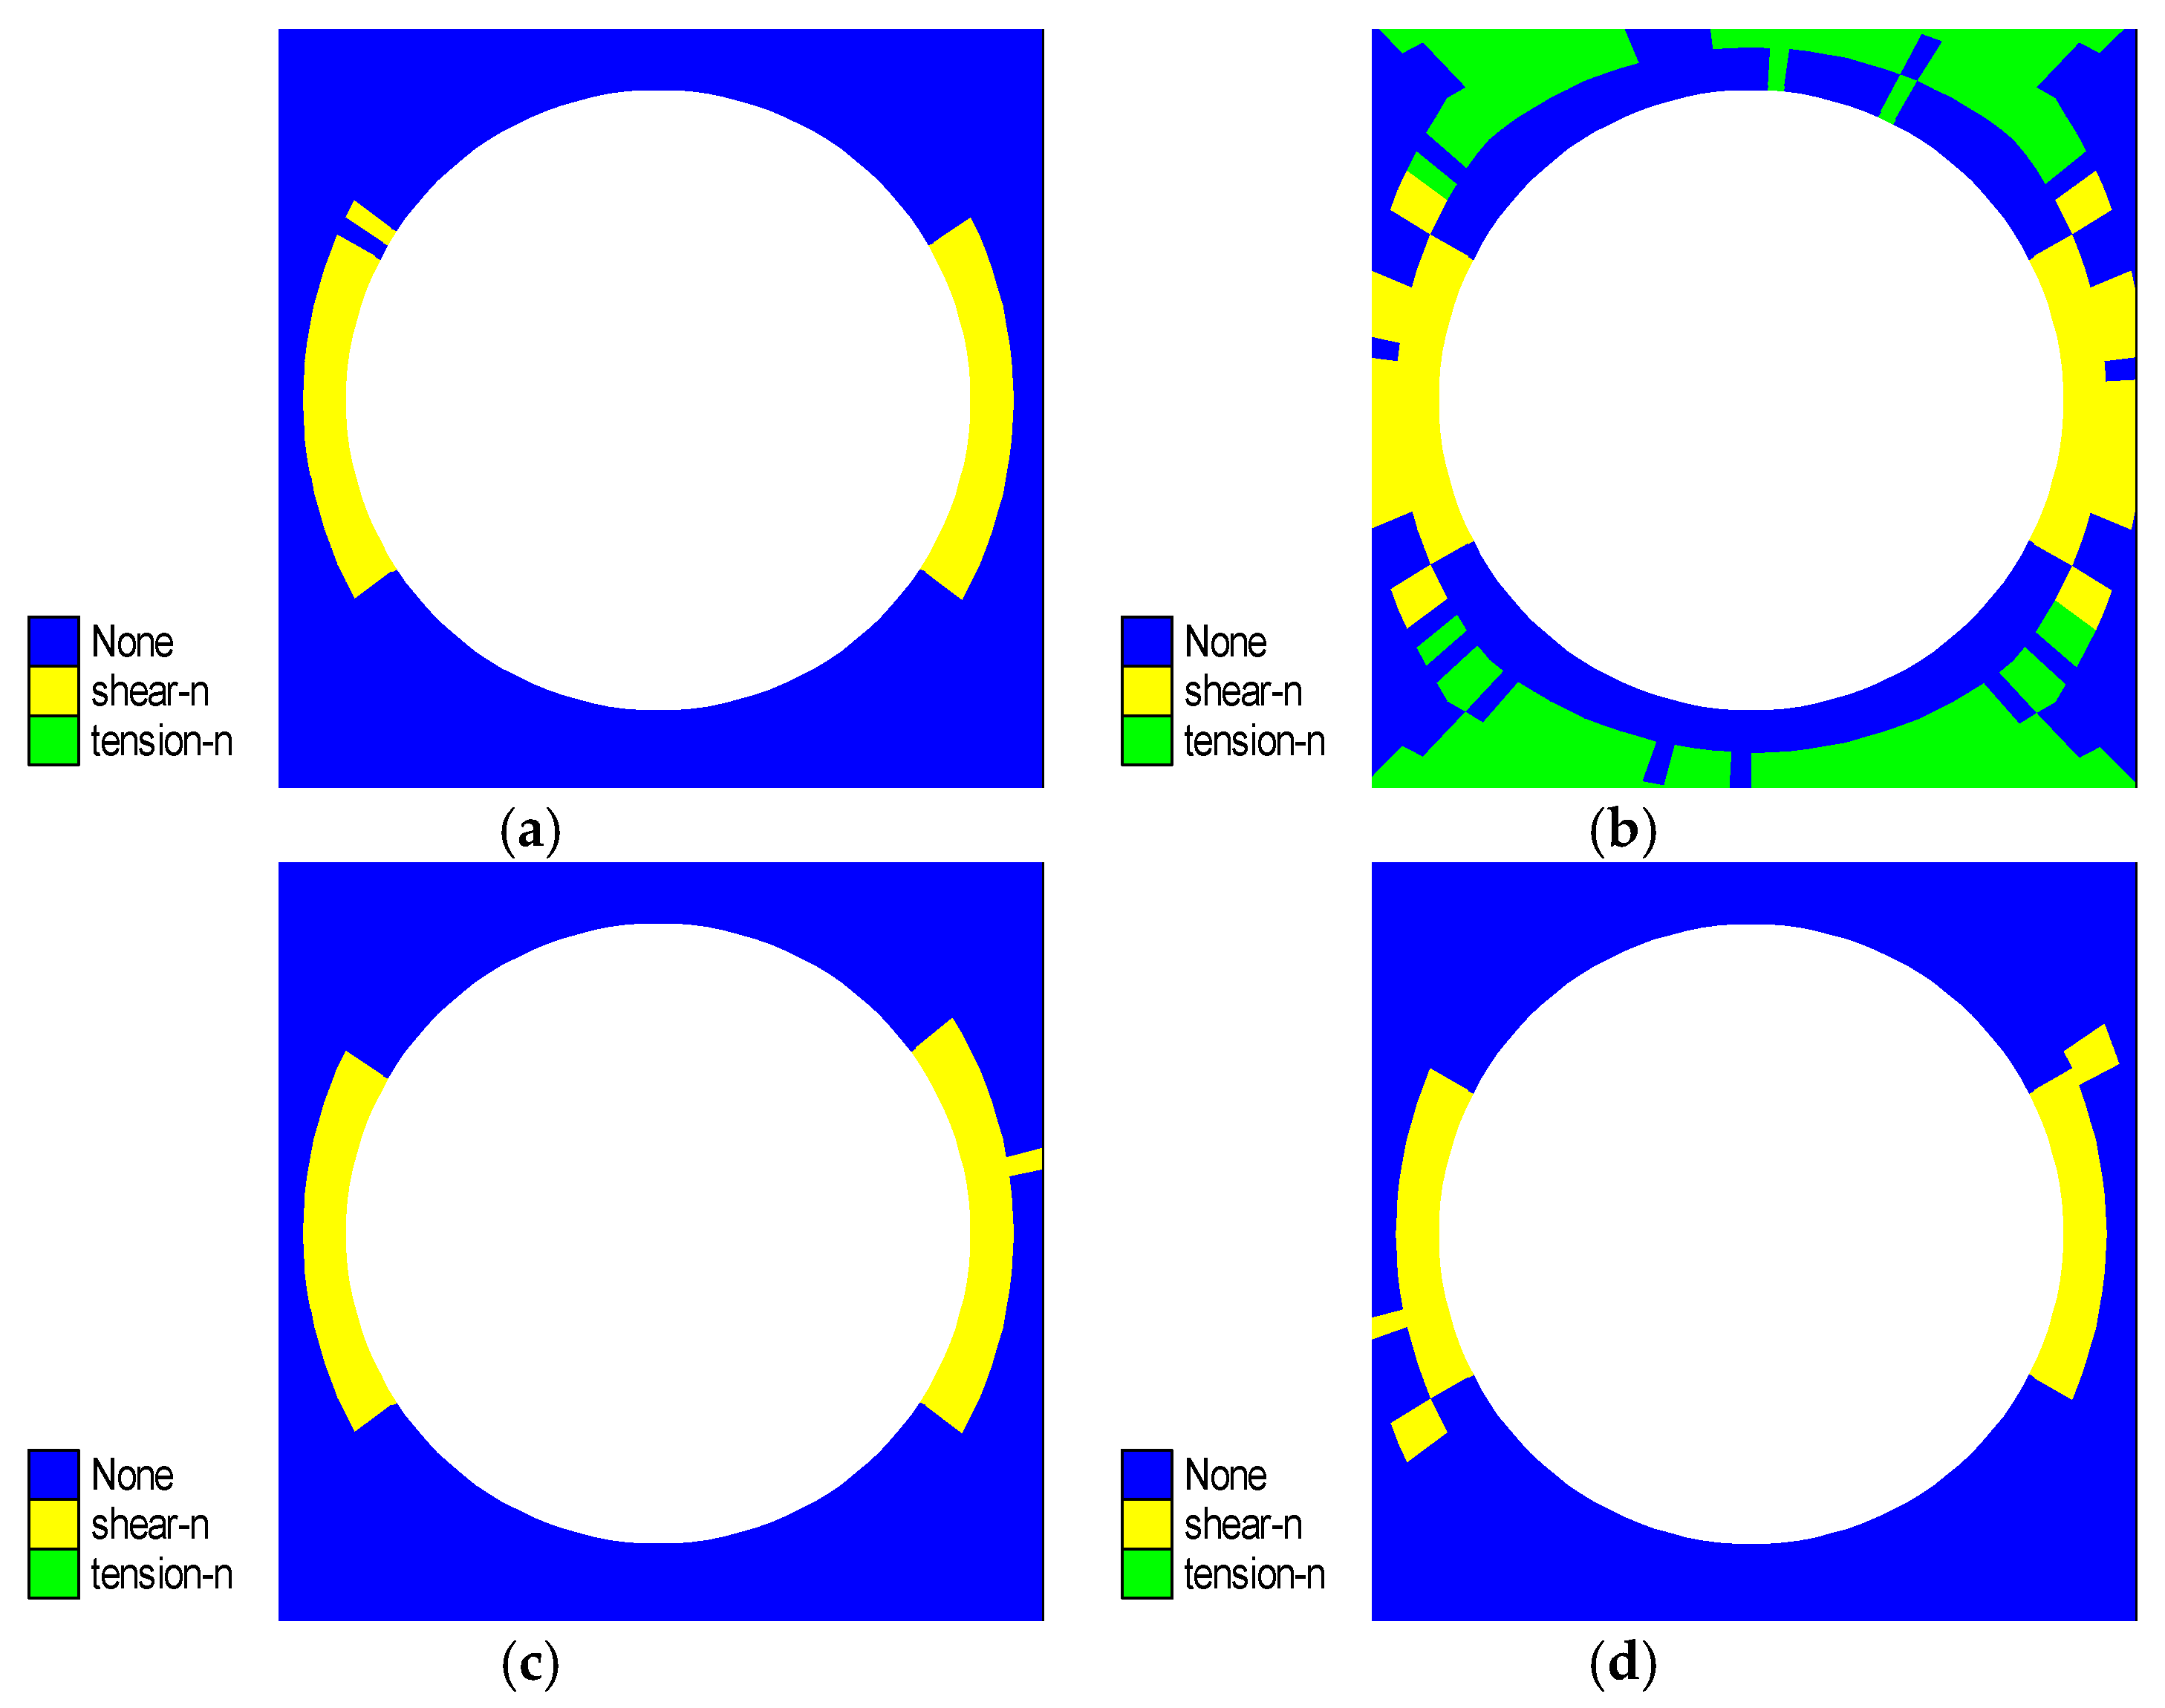
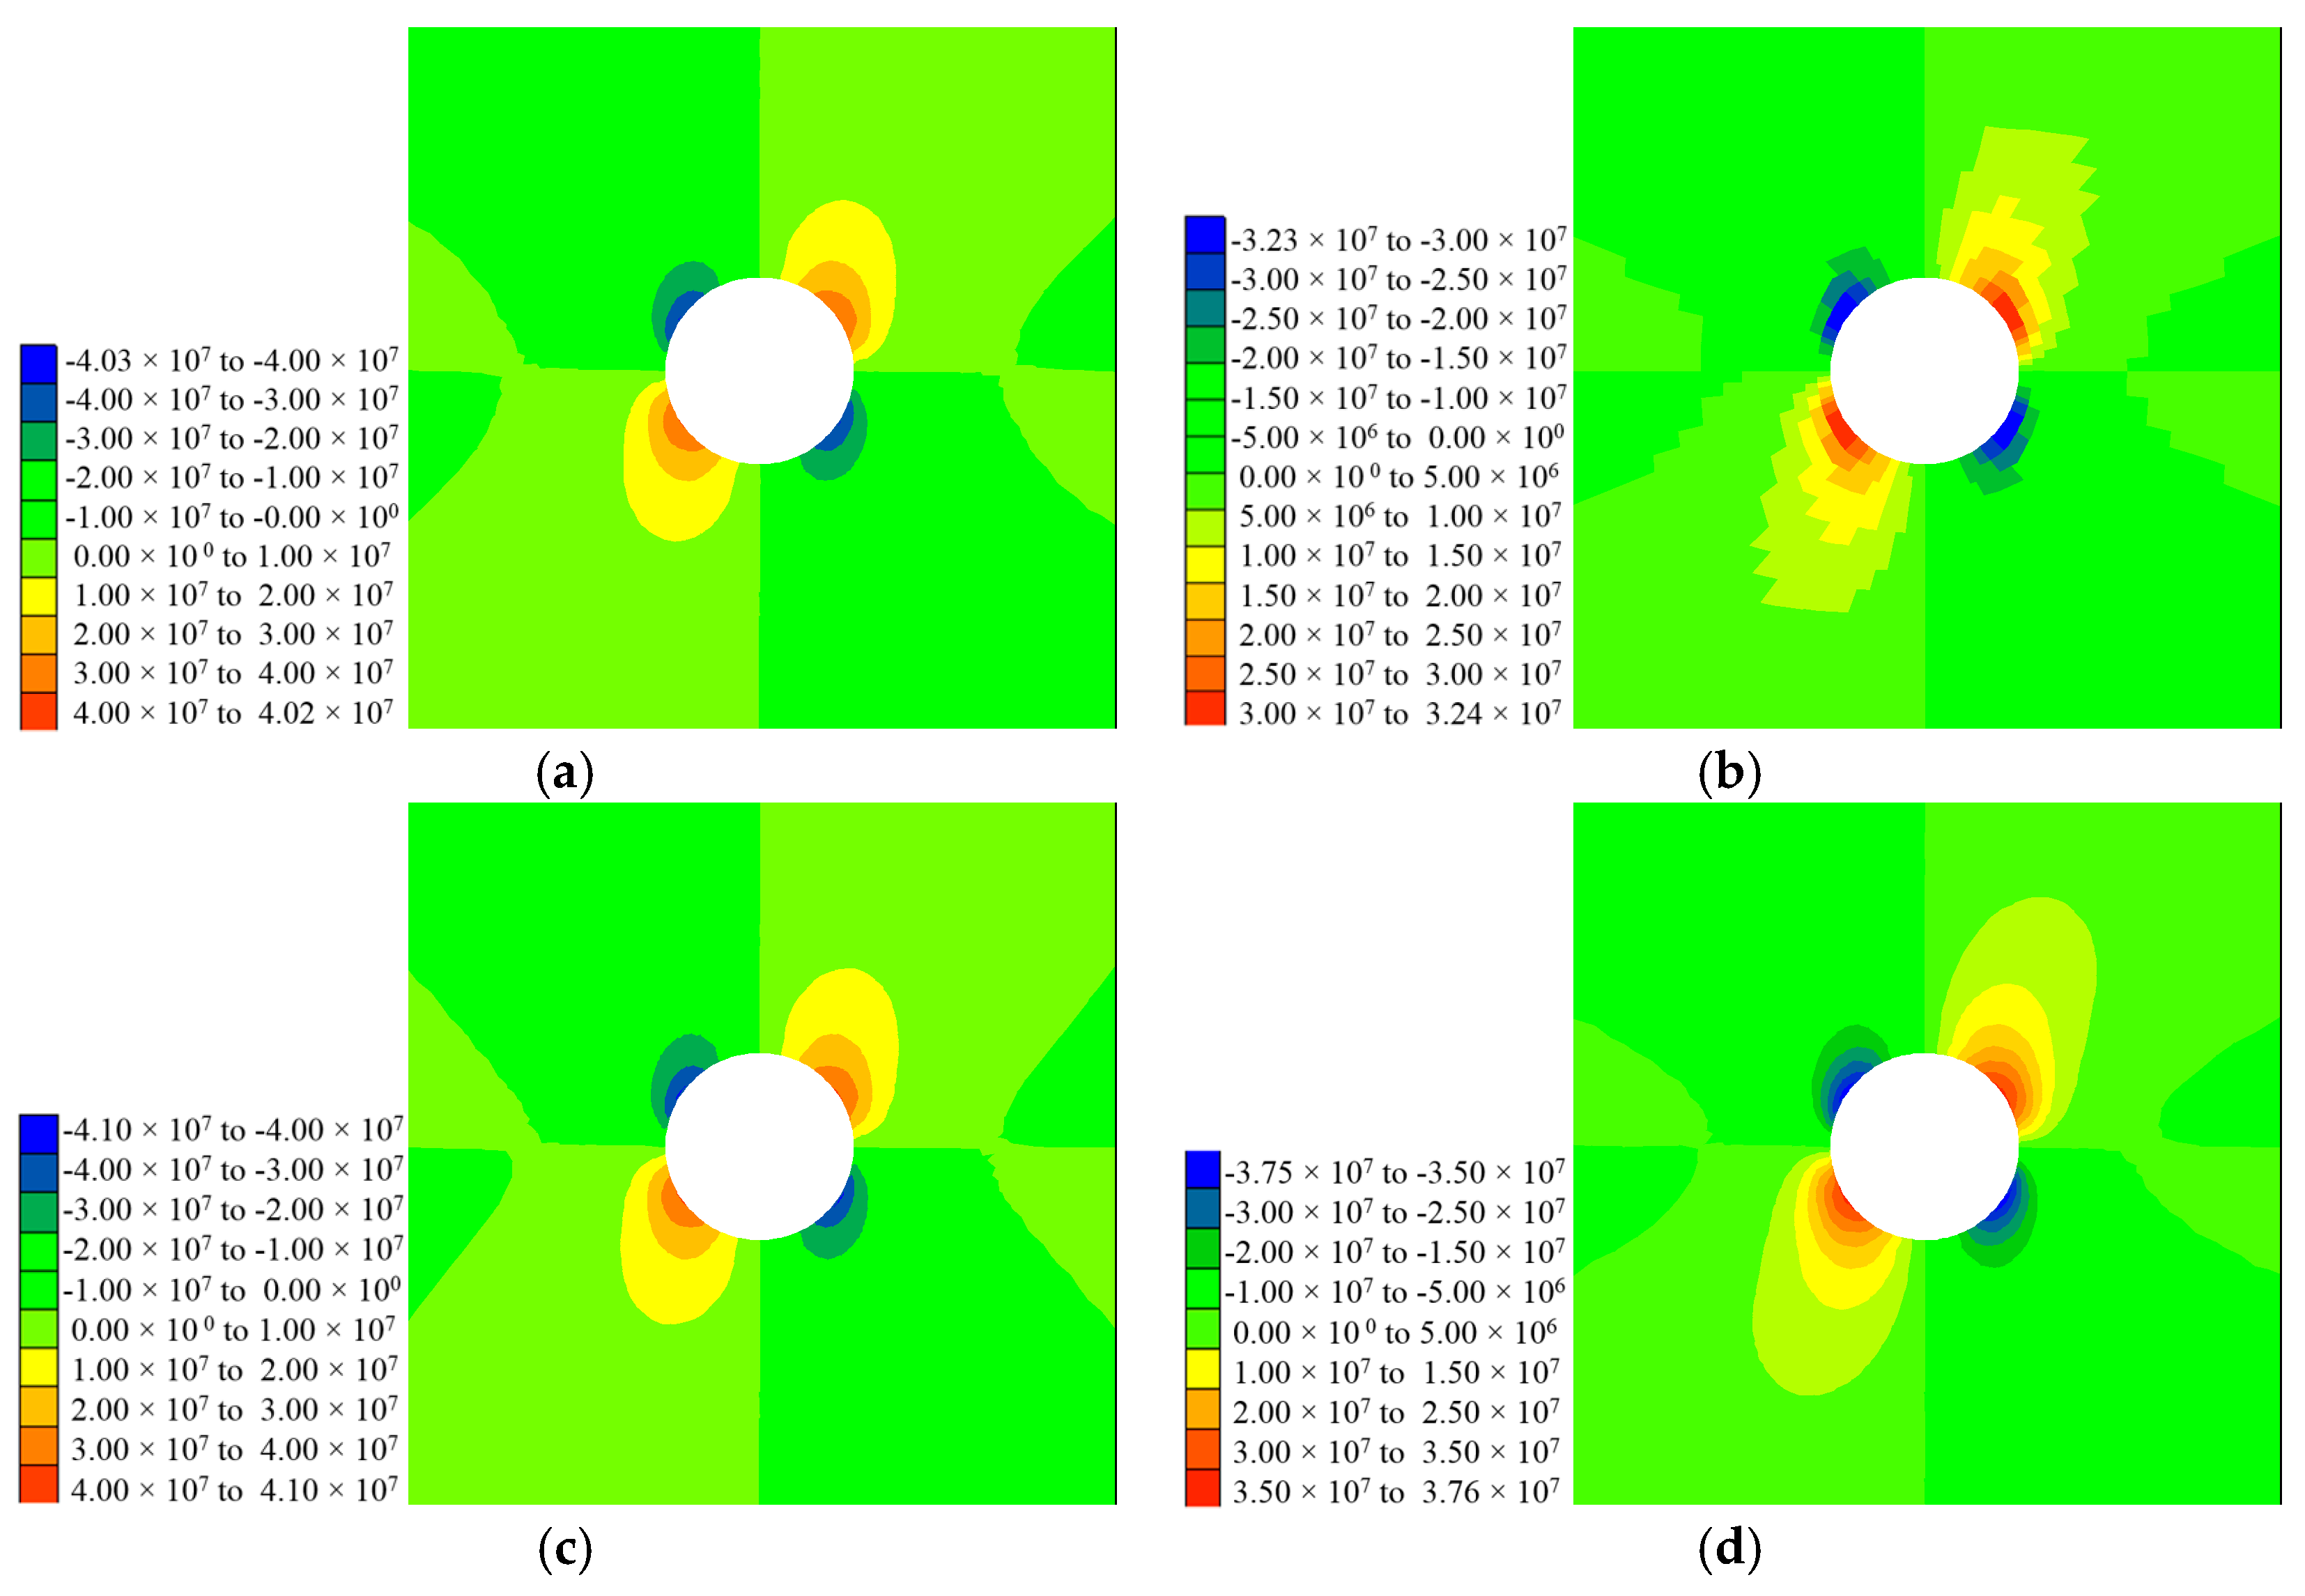
The stress differential and shear stress of surrounding rock near the wellbore can be reduced in the presence of NP. The plastic yield zone is minimized to improve wellbore stability.
(3)
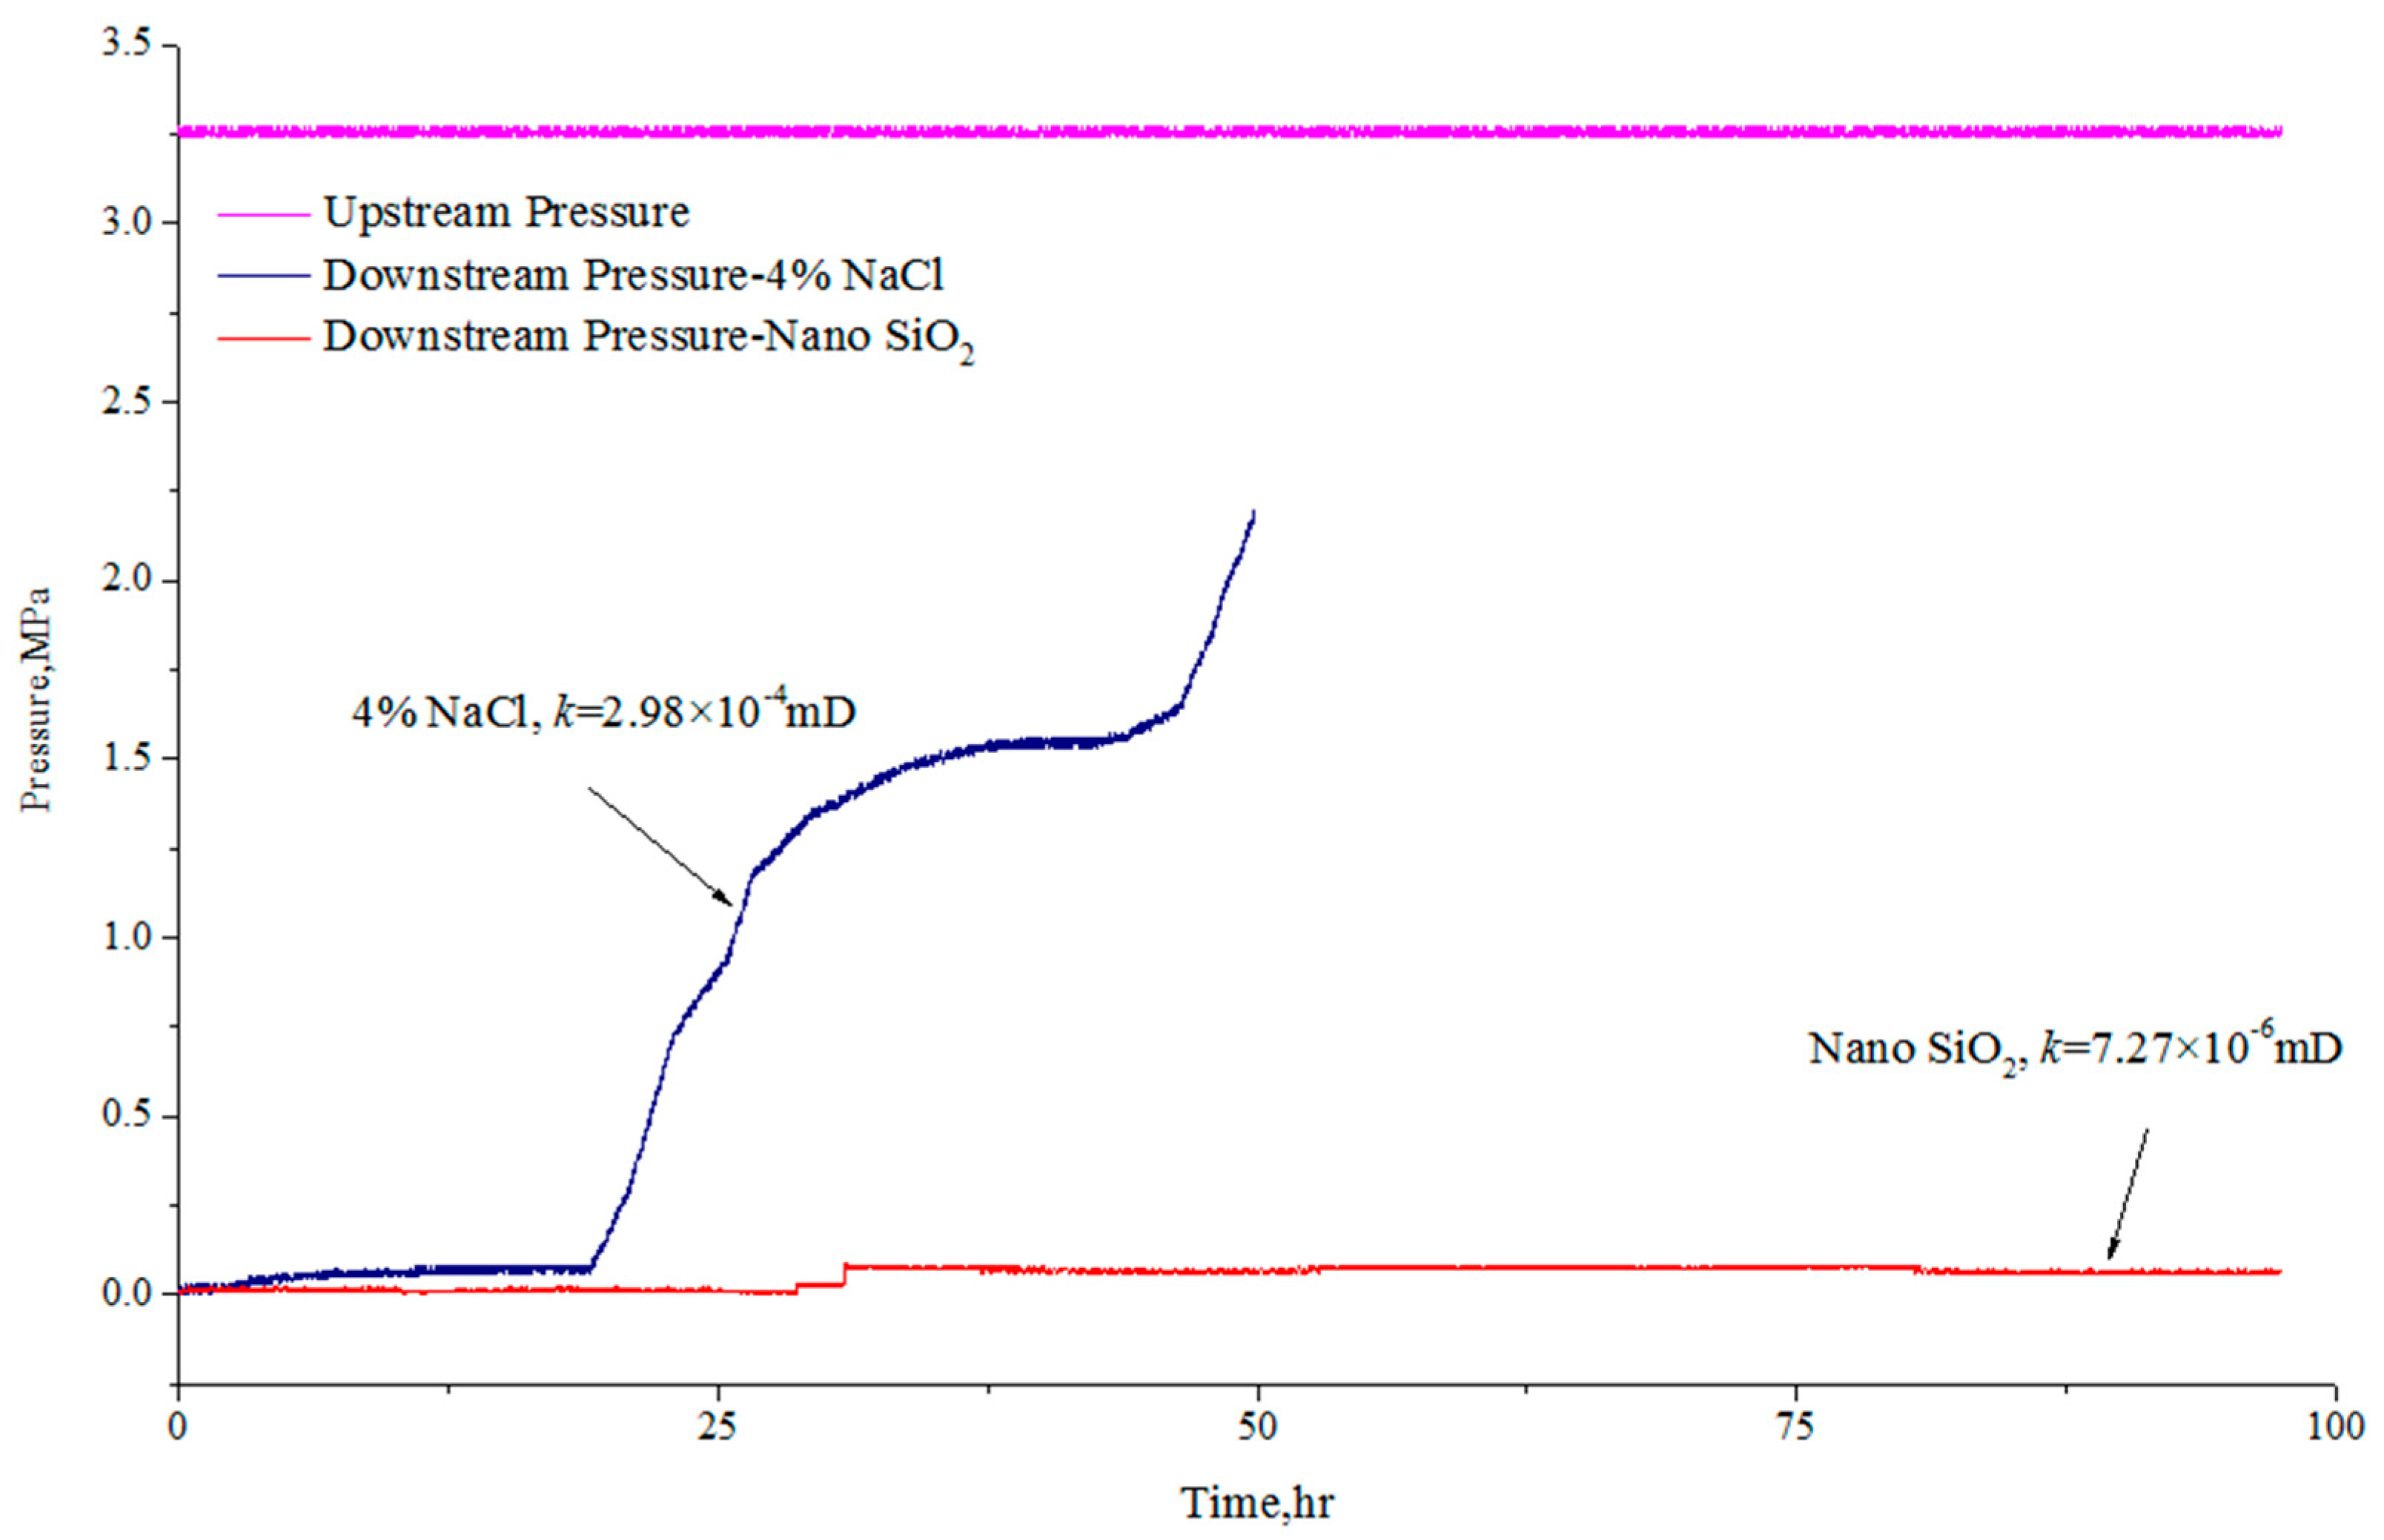
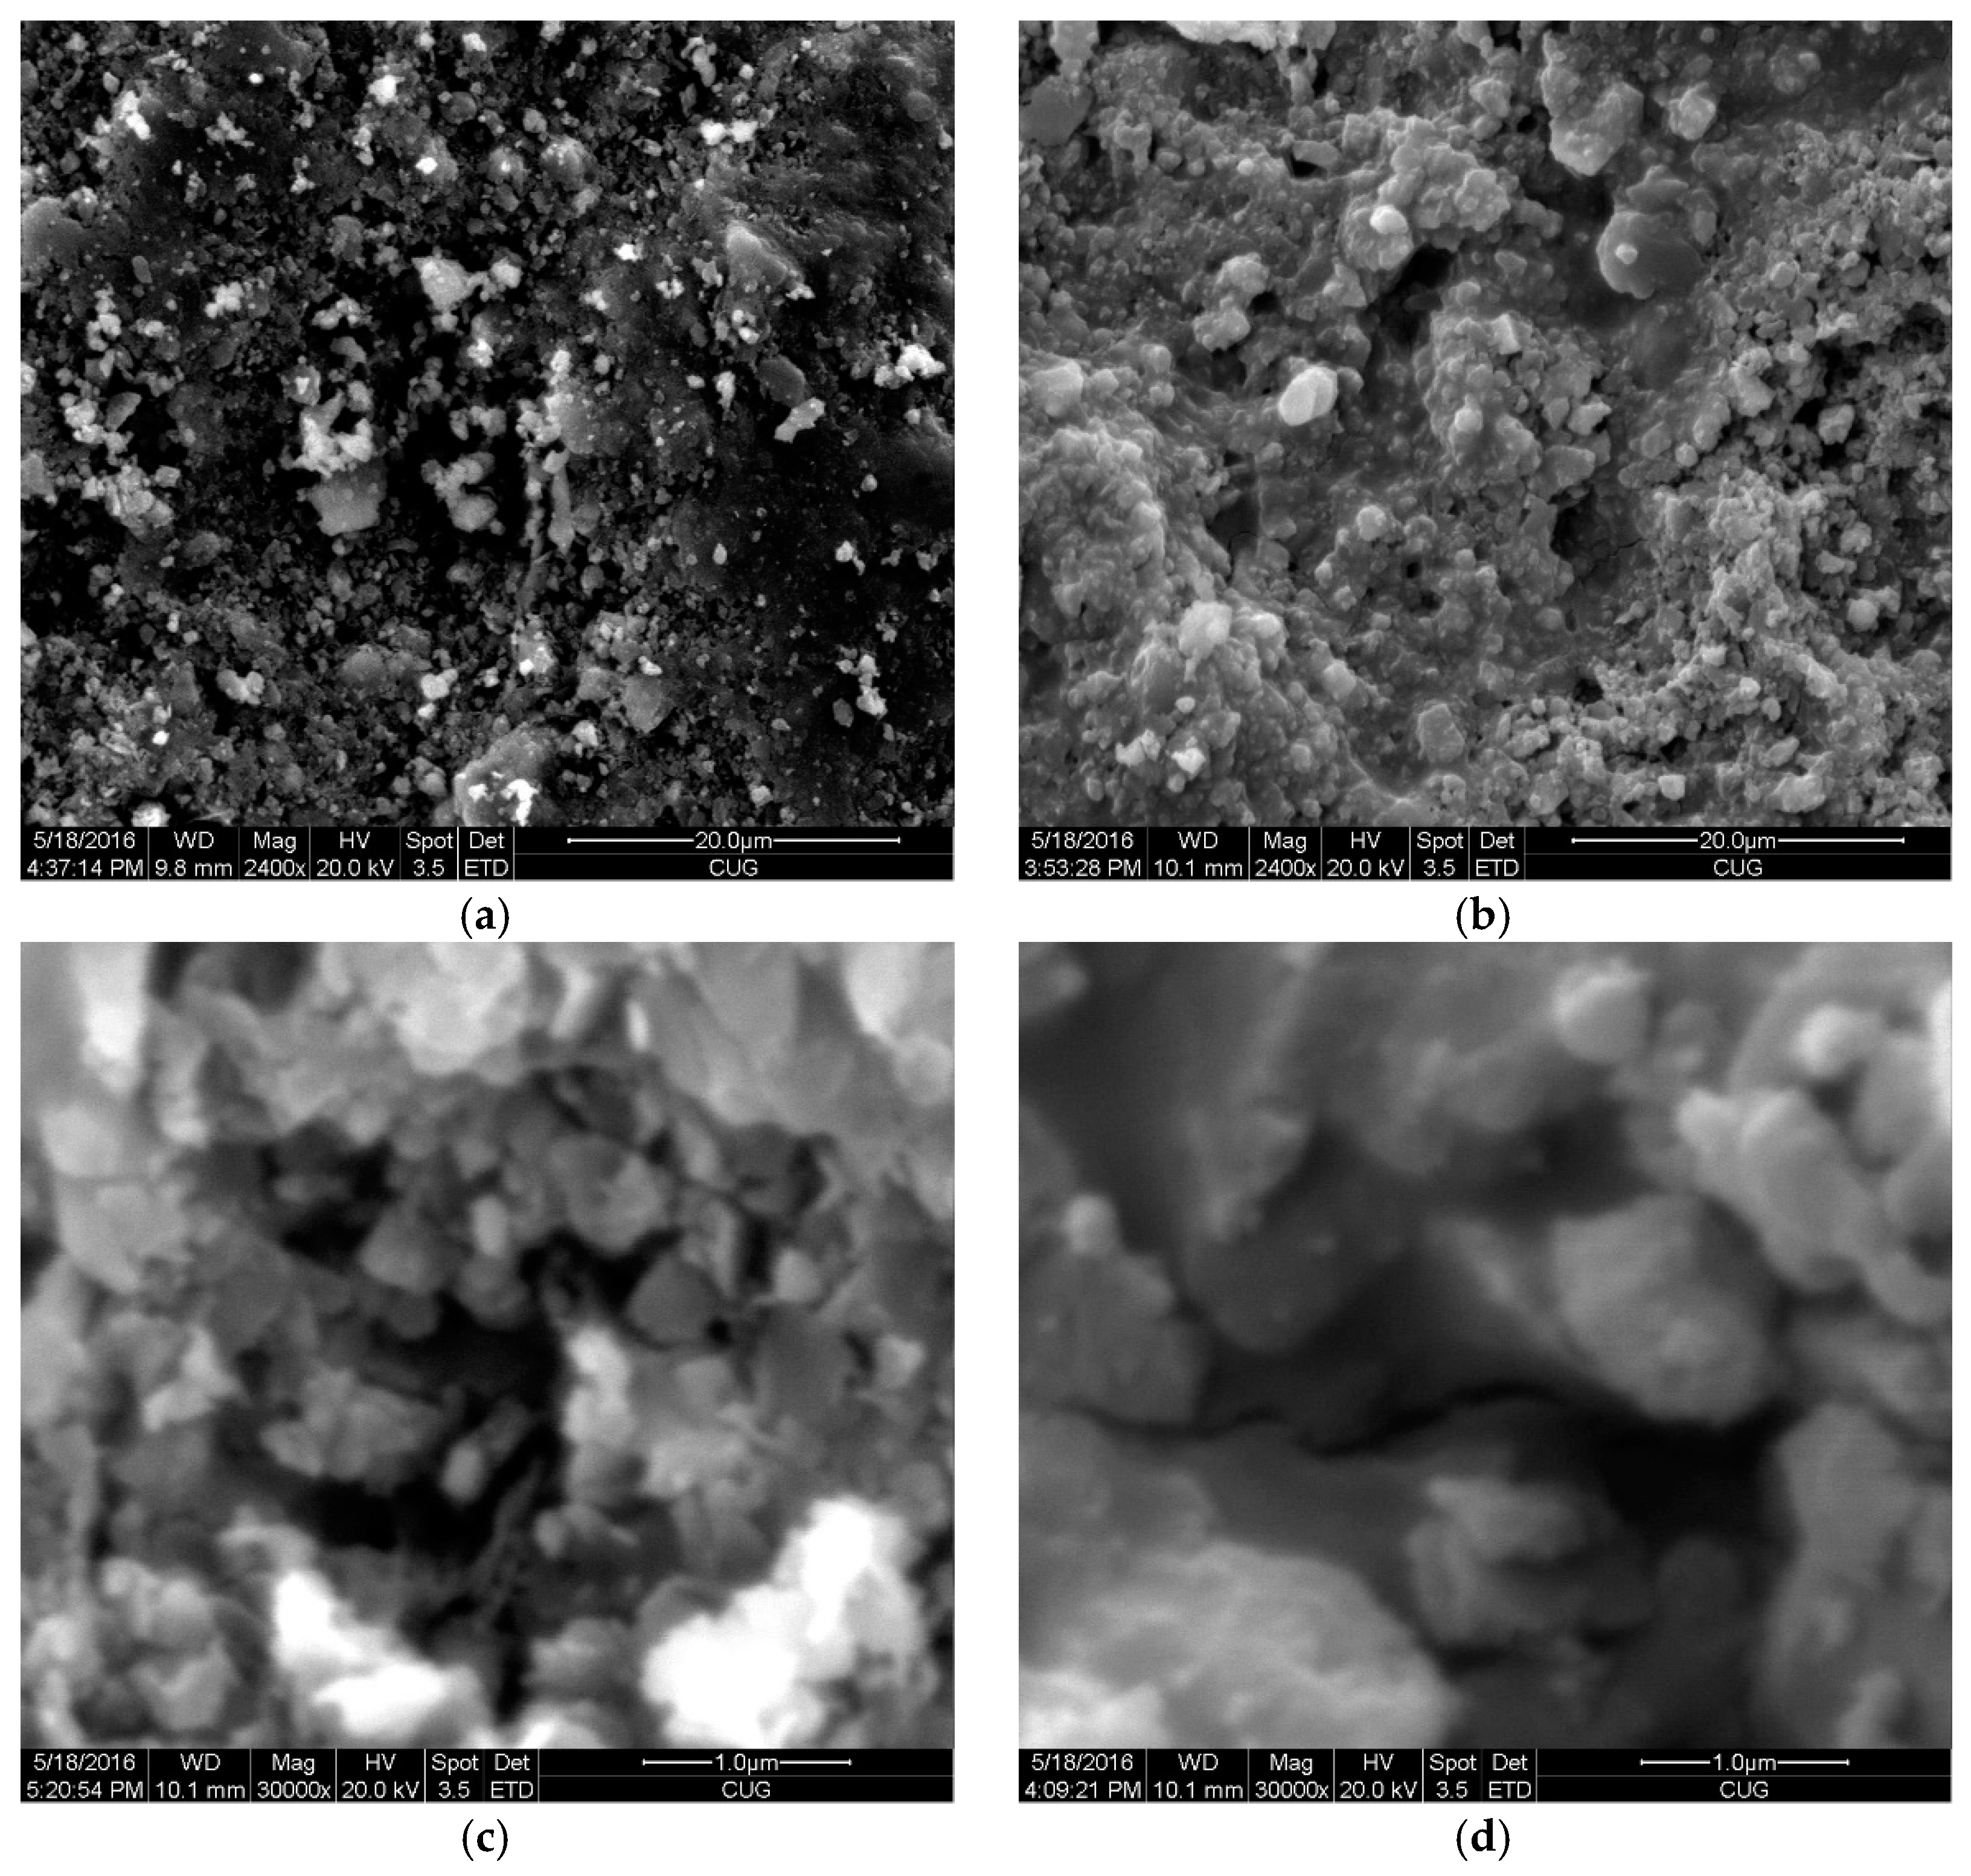
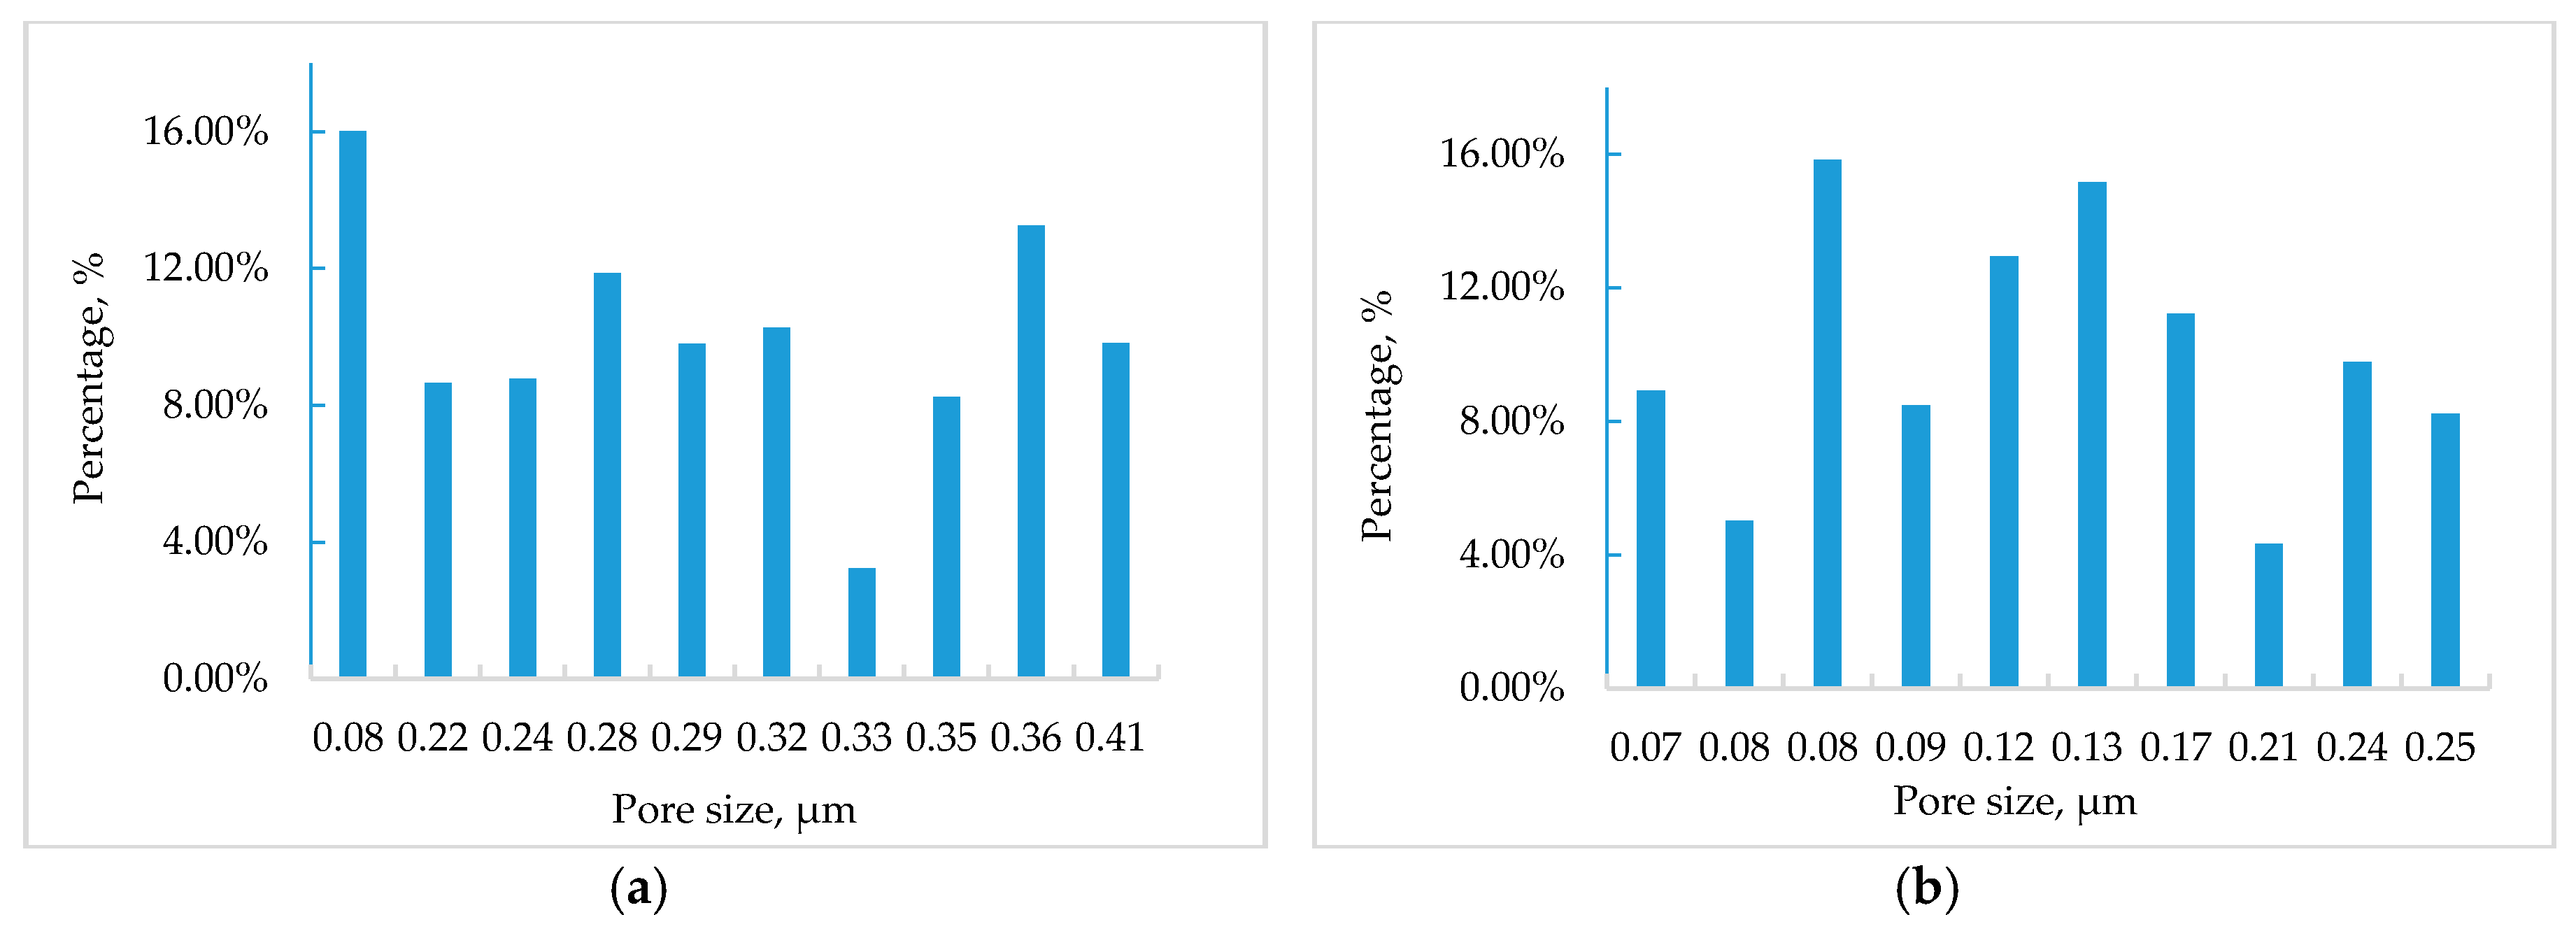
The plugging of silica NP on the surface of the shale plays an important role in decreasing the permeability of shale. The plugging mechanism of NP may be attributed to the electrostatic and electrodynamic interaction between NP and shale surfaces, governed by DLVO forces, which allows the NP to approach shale surfaces and adhere to them.
(4)
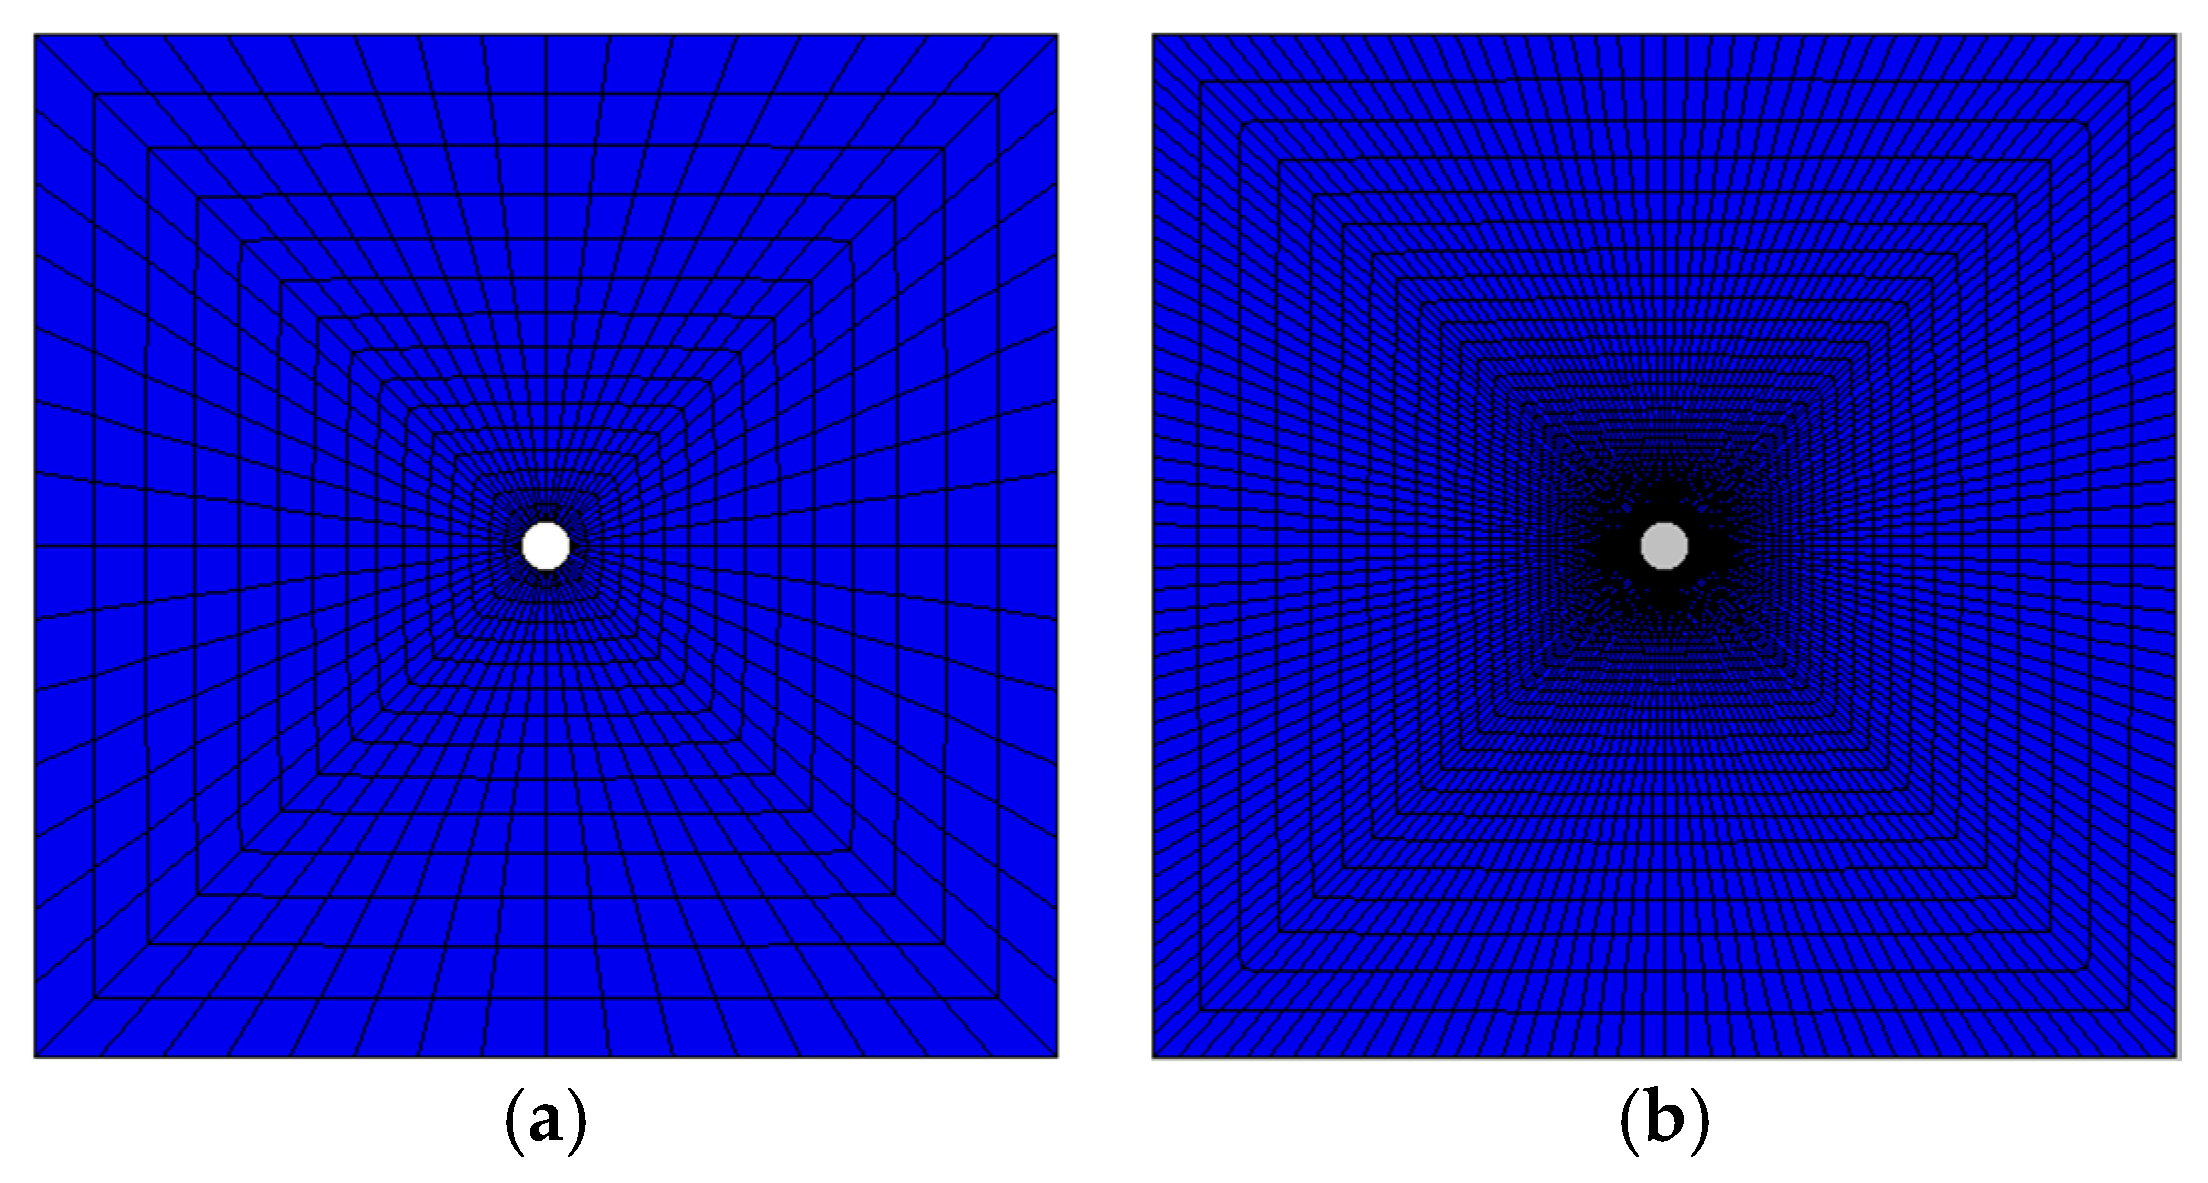
Discretization of the simulation model is beneficial in distinguishing the yield zone distribution of the surrounding rock in shales.

Acknowledgments

Thanks to Martin E. Chenevert and Mukul M. Sharma from the University of Texas at Austin for the patient and careful supervision of pressure transmission tests. Meanwhile, the study is supported by the National Science Foundation of China (No. 41072111), the Innovation Foundation of China National Petroleum Corporation (No. 2014D-5006-0308), and the Key Project of Natural Science Foundation of Hubei Province (No. 2015CFA135).

Author Contributions

Jiwei Song prepared the initial manuscript; Ye Yuan completed the initial 2D numerical simulation; Sui Gu helped to complete the PTT on Atoka shale; Xianyu Yang carried out the 2D numerical simulation according to the reviewers’ suggestions and the PTT on shale sample in China; Ye Yue completed the SEM analysis after PTT; Jihua Cai and Guosheng Jiang were responsible for the academic ideas and the responses to the reviewers’ and the editor’s suggestions.

Conflicts of Interest

The authors declare no conflict of interest.

References

  1. Lal, M. Shale Stability: Drilling fluid interaction and shale strength. In Proceedings of the SPE Asia Pacific Oil and Gas Conference and Exhibition, Jakarta, Indonesia, 20–22 April 1999. [Google Scholar]
  2. Steiger, R.P.; Leung, P.K. Quantitative determination of the mechanical properties of shales. SPE Drill. Eng. 1992, 7, 181–185. [Google Scholar] [CrossRef]
  3. Van Oort, E.; Hale, A.H.; Mody, F.K.; Roy, S. Transport in shales and the design of improved water-based shale drilling fluids. SPE Drill. Complet. 1996, 11, 137–146. [Google Scholar] [CrossRef]
  4. Chenevert, M.E. Shale control with balanced-activity oil-continuous muds. J. Pet. Technol. 1970, 22, 1309–1316. [Google Scholar] [CrossRef]
  5. Ewy, R.T.; Morton, E.K. Wellbore-stability performance of water-based mud additives. SPE Drill. Complet. 2009, 24, 390–397. [Google Scholar] [CrossRef]
  6. Hayatdavoudi, A.; Apande, E. A theoretical analysis of wellbrore failure and stability in shales. In Proceedings of the 27th U.S. Symposium on Rock Mechanics, Tuscaloosa, AL, USA, 23–25 June 1986. [Google Scholar]
  7. Carminati, S.; Del Gaudio, L.; Brignoli, M. Shale stabilisation by pressure propagation prevention. In Proceedings of the SPE Annual Technical Conference and Exhibition, Dallas, TX, USA, 1–4 October 2000. [Google Scholar]
  8. Reid, P.I.; Dolan, B.; Cliffe, S. Mechanism of shale inhibition by polyols in water-based drilling fluids. In Proceedings of the SPE International Symposium on Oilfield Chemistry, San Antonio, TX, USA, 14–17 February 1995. [Google Scholar]
  9. Zhong, H.; Qiu, Z.; Huang, W.; Cao, J. Shale inhibitive properties of polyether diamine in water-based drilling fluid. J. Pet. Sci. Eng. 2011, 78, 510–515. [Google Scholar] [CrossRef]
  10. Van Oort, E.; Pasturel, C.; Bryla, J.; Ditlevsen, F. Improved wellbore stability in tor/ekofisk wells through shale-fluid compatibility optimization. In Proceedings of the SPE/IADC Drilling Conference and Exhibition, The Hague, The Netherlands, 14–16 March 2017. [Google Scholar]
  11. Al-Bazali, T.M.; Zhang, J.; Chenevert, M.E.; Sharma, M.M. Measurement of the sealing capacity of shale caprocks. In Proceedings of the SPE Annual Technical Conference and Exhibition, Dallas, TX, USA, 9–12 October 2005. [Google Scholar]
  12. Ambrose, R.J.; Hartman, R.C.; Diaz Campos, M.; Akkutlu, I.Y.; Sondergeld, C. New pore-scale considerations for shale gas in place calculations. In Proceedings of the SPE Unconventional Gas Conference, Pittsburgh, PA, USA, 23–25 February 2010. [Google Scholar]
  13. Milner, M.; McLin, R.; Petriello, J. Imaging texture and porosity in mudstones and shales: Comparison of secondary and ion-milled backscatter SEM methods. In Proceedings of the Canadian Unconventional Resources and International Petroleum Conference, Calgary, AB, Canada, 19–21 October 2010. [Google Scholar]
  14. Nelson, P.H. Pore-throat sizes in sandstones, tight sandstones, and shales. AAPG Bull. 2009, 93, 329–340. [Google Scholar] [CrossRef]
  15. Schieber, J. Common themes in the formation and preservation of intrinsic porosity in shales and mudstones-illustrated with examples across the phanerozoic. In Proceedings of the SPE Unconventional Gas Conference, Pittsburgh, PA, USA, 23–25 February 2010. [Google Scholar]
  16. Sondergeld, C.H.; Ambrose, R.J.; Rai, C.S.; Moncrieff, J. Micro-structural studies of gas shales. In Proceedings of the SPE Unconventional Gas Conference, Pittsburgh, PA, USA, 23–25 February 2010. [Google Scholar]
  17. Zou, C.; Zhu, R.; Bai, B.; Yang, Z.; Wu, S.; Su, L.; Dong, D.; Li, X. First discovery of nano-pore throat in oil and gas reservoir in China and its scientific value. Atca Petrol. Sin. 2011, 27, 1857–1864. [Google Scholar]
  18. Sensoy, T.; Chenevert, M.E.; Sharma, M.M. Minimizing water invasion in shales using nanoparticles. In Proceedings of the SPE Annual Technical Conference and Exhibition, New Orleans, LA, USA, 4–7 October 2009. [Google Scholar]
  19. Cai, J.; Chenevert, M.E.; Sharma, M.M.; Friedheim, J.E. Decreasing water invasion into Atoka shale using nonmodified silica nanoparticles. SPE Drill. Complet. 2012, 27, 103–110. [Google Scholar] [CrossRef]
  20. Sharma, M.M.; Chenevert, M.E.; Guo, Q.; Ji, L.; Friedheim, J.; Zhang, R. A new family of nanoparticle based drilling fluids. In Proceedings of the SPE Annual Technical Conference and Exhibition, San Antonio, TX, USA, 8–10 October 2012. [Google Scholar]
  21. Hareland, G.; Wu, A.; Lei, L.; Husein, M.M.; Zakaria, M.F. Innovative nanoparticle drilling fluid and its benefits to horizontal or extended reach drilling. In Proceedings of the SPE Canadian Unconventional Resources Conference, Calgary, AB, Canada, 30 October–1 November 2012. [Google Scholar]
  22. Ji, L.; Guo, Q.; Friedheim, J.E.; Zhang, R.; Chenevert, M.E.; Sharma, M.M. Laboratory evaluation and analysis of physical shale inhibition of an innovative water-based drilling fluid with nanoparticles for drilling unconventional shales. In Proceedings of the SPE Asia Pacific Oil and Gas Conference and Exhibition, Perth, Australia, 22–24 October 2012. [Google Scholar]
  23. Zakaria, M.; Husein, M.M.; Harland, G. Novel nanoparticle-based drilling fluid with improved characteristics. In Proceedings of the SPE International Oilfield Nanotechnology Conference and Exhibition, Noordwijk, The Netherlands, 12–14 June 2012. [Google Scholar]
  24. Akhtarmanesh, S.; Shahrabi, M.J.A.; Atashnezhad, A. Improvement of wellbore stability in shale using nanoparticles. J. Pet. Sci. Eng. 2013, 112, 290–295. [Google Scholar] [CrossRef]
  25. Pandey, P.; Kapadnis, P.P.; Ghansar, B.H.; Mandan, S.P. Thermoelectric nanomaterial: A demiurgic approach towards improvement of shale stability. In Proceedings of the SPE Unconventional Gas Conference and Exhibition, Muscat, Oman, 28–30 January 2013. [Google Scholar]
  26. Jung, C.M.; Zhang, R.; Chenevert, M.; Sharma, M. High-performance water-based mud using nanoparticles for shale reservoirs. In Proceedings of the Unconventional Resources Technology Conference, Denver, CO, USA, 12–14 August 2013. [Google Scholar]
  27. Liang, C.; Chen, M.; Lu, B.; Wang, J.; Jin, Y.; Yang, S.; Hou, X.; Hou, B. The study of nano sealing to improve the brittle shale wellbore stability under dynamic load. In Proceedings of the Offshore Technology Conference Asia, Kuala Lumpur, Malaysia, 25–28 March 2014. [Google Scholar]
  28. Yang, X.; Yue, Y.; Cai, J.; Liu, Y.; Wu, X. Experimental study and stabilization mechanisms of silica nanoparticles based brine mud with high temperature resistance for horizontal shale gas wells. J. Nanomater. 2015, 2015, 745312. [Google Scholar] [CrossRef]
  29. Cedola, A.E.; Akhtarmanesh, S.; Qader, R.; Caldarola, V.T.; Hareland, G.; Nygaard, R.; Alsaba, M. Nanoparticles in weighted water-based drilling fluids increase loss gradient. In Proceedings of the 50th U.S. Rock Mechanics/Geomechanics Symposium, Houston, TX, USA, 26–29 June 2016. [Google Scholar]
  30. Gao, C.; Miska, S.Z.; Yu, M.; Ozbayoglu, E.M.; Takach, N.E. Effective enhancement of wellbore stability in shales with new families of nanoparticles. In Proceedings of the SPE Deepwater Drilling and Completions Conference, Galveston, TX, USA, 14–15 September 2016. [Google Scholar]
  31. Ghanbari, S.; Naderifar, A. Enhancing the physical plugging behavior of colloidal silica nanoparticles using binomial size distribution. J. Nat. Gas Sci. Eng. 2016, 30, 213–220. [Google Scholar] [CrossRef]
  32. Van Oort, E.; Hoxha, B.B.; Hale, A.; Aldin, M.; Patterson, R. How to test fluids for shale compatibility. In Proceedings of the AADE Fluids Technical Conference and Exhibition, Houston, TX, USA, 12–13 April 2016. [Google Scholar]
  33. Hoxha, B.B.; van Oort, E.; Daigle, H. How do nanoparticles stabilize shale? In Proceedings of the SPE International Conference on Oilfield Chemistry, Montgomery, TX, USA, 3–5 April 2017. [Google Scholar]
  34. Frydman, M.; da Fontoura, S.A.B. Modeling aspects of wellbore stability in shales. In Proceedings of the SPE Latin American and Caribbean Petroleum Engineering Conference, Buenos Aires, Argentina, 25–28 March 2001. [Google Scholar]
  35. Yu, M.; Chenevert, M.E.; Sharma, M.M. Chemical–mechanical wellbore instability model for shales: Accounting for solute diffusion. J. Pet. Sci. Eng. 2003, 38, 131–143. [Google Scholar] [CrossRef]
  36. Zhai, Z.; Zaki, K.S.; Marinello, S.A.; Abou-Sayed, A.S. Coupled thermoporomechanical effects on borehole stability. In Proceedings of the SPE Annual Technical Conference and Exhibition, New Orleans, LA, USA, 4–7 October 2009. [Google Scholar]
  37. Zhai, Z.; Abou-Sayed, A.S. Fully coupled chemical-thermal-poro-mechanical effect on borehole stability. In Proceedings of the Brasil Offshore, Macaé, Brazil, 14–17 June 2011. [Google Scholar]
  38. Huang, L.; Yu, M.; Miska, S.; Takach, N.; Green, A.; Bloys, B. Determination of safe salinity window in drilling shale formation. In Proceedings of the 46th U.S. Rock Mechanics/Geomechanics Symposium, Chicago, IL, USA, 24–27 June 2012. [Google Scholar]
  39. Wang, Q.; Zhou, Y.; Wang, G.; Jiang, H.; Liu, Y. A fluid-solid-chemistry coupling model for shale wellbore stability. Pet. Explor. Dev. 2012, 39, 508–513. [Google Scholar] [CrossRef]
  40. Wen, H.; Chen, M.; Jin, Y.; Wang, K.; Xia, Y.; Dong, J.; Niu, C. A chemo-mechanical coupling model of deviated borehole stability in hard brittle shale. Pet. Explor. Dev. 2014, 41, 817–823. [Google Scholar] [CrossRef]
  41. Zhuang, X.; Huang, R.; Liang, C.; Rabczuk, T. A coupled thermo-hydro-mechanical model of jointed hard rock for compressed air energy storage. Math. Probl. Eng. 2014, 2014, 179169. [Google Scholar] [CrossRef]
  42. Zhu, H.H.; Wang, Q.; Zhuang, X.Y. A nonlinear semi-concurrent multiscale method for fractures. Int. J. Impact Eng. 2016, 87, 65–82. [Google Scholar] [CrossRef]
  43. Chenevert, M.E.; Amanullah, M. Shale preservation and testing techniques for borehole-stability studies. SPE Drill. Complet. 2001, 16, 146–149. [Google Scholar] [CrossRef]
  44. Mody, F.K.; Tare, U.A.; Tan, C.P.; Drummond, C.J.; Wu, B. Development of novel membrane efficient water-based drilling fluids through fundamental understanding of osmotic membrane generation in shales. In Proceedings of the SPE Annual Technical Conference and Exhibition, San Antonio, TX, USA, 29 September–2 October 2002. [Google Scholar]
  45. AL-Bazali, T.M. Experimental Study of the Membrane Behavior of Shale during Interaction with Water-Based and Oil-Based Muds. Ph.D. Thesis, University of Texas at Austin, Austin, TX, USA, 2005. [Google Scholar]
  46. Van Oort, E. Physico-chemical stabilization of shales. In Proceedings of the International Symposium on Oilfield Chemistry, Houston, TX, USA, 18–21 February 1997. [Google Scholar]
  47. Rutqvist, J.; Wu, Y.S.; Tsang, C.F.; Bodvarsson, G. A modeling approach for analysis of coupled multiphase fluid flow, heat transfer, and deformation in fractured porous rock. Int. J. Rock Mech. Min. 2002, 39, 429–442. [Google Scholar] [CrossRef]
  48. Wu, C.; Luo, J.; Tian, R.; Liu, G.; Li, H.; Zhang, X. The effect of mud-shale hydration on rock mechanic parameters. J. Oil Gas Technol. 2012, 34, 147–150. [Google Scholar]
  49. Yang, J.; Fu, Y.; Chen, H.; Zeng, L.; Li, J. Rock mechanical characteristics of shale reservoirs. Nat. Gas Ind. 2012, 32, 12–14. [Google Scholar]
Figure 1. Atoka shale sample used in the pressure transmission tests (PTTs).
Energies 10 00651 g001
Figure 2. Experimental set up of PTT [19].
Energies 10 00651 g002
Figure 3. PTT of Atoka shale. (a) #1 Atoka shale sample; (b) #2 Atoka shale sample.
Energies 10 00651 g003
Figure 4. Pressure load model of shale formation in numerical simulation.
Energies 10 00651 g004
Figure 5. Flow chart of numerical simulation.
Energies 10 00651 g005
Figure 6. Cell subdivision of the calculation model in numerical simulation (3600 grids and 7440 nodes).
Energies 10 00651 g006
Figure 7. Time dependent pore fluid pressure contour map. The unit of pressure is defaulted as Pa in FLAC3D™, the same as below. (a) 1 h; (b) 24 h.
Energies 10 00651 g007
Figure 8. Pore fluid pressure of shale in contact with sea water vs. time at different distance.
Energies 10 00651 g008
Figure 9. Pore fluid pressure of shale in contact with sea water vs. distance at different time.
Energies 10 00651 g009
Figure 10. Pore fluid pressure contour map with different drilling fluid pressure. (a) 1 h at 30 MPa (Pf); (b) 1 h at 40 MPa (Pf); (c) 24 h at 30 MPa (Pf); and (d) 24 h at 40 MPa (Pf).
Energies 10 00651 g010
Figure 11. Influence of drilling fluid types on pore fluid pressure transmission of shale. (a) Near the wellbore; (b) 0.2 m from the wellbore.
Energies 10 00651 g011
Figure 12. Time dependent pore pressure transmission boundary in the shale. (a) 10 h (BM); (b) 10 h (BM + NP); (c) 24 h (BM); (d) 24 h (BM + NP); (e) 48 h (BM); and (f) 48 h (BM + NP).
Energies 10 00651 g012
Figure 13. Time dependent stress contour map. The symbol “−” before the numbers refers to compressive stress. Otherwise, it refers to tensile stress, the same as follows. (a) x direction stress for 1 h; (b) y direction stress for 1 h; (c) x direction stress for 48 h; and (d) y direction stress for 48 h.
Energies 10 00651 g013
Figure 14. Time dependent stress near the wellbore at the minimum horizontal stress direction.
Energies 10 00651 g014
Figure 15. Shear stress distribution at different times with sea water. (a) 1 h; (b) 48 h.
Energies 10 00651 g015
Figure 16. Displacement contour map around the surrounding rock. (a) x direction displacement for 1 h; (b) y direction displacement for 1 h.
Energies 10 00651 g016
Figure 17. Displacement change trend of the surrounding rock. (a) x direction at the minimum horizontal stress direction; (b) y direction at the maximum horizontal stress direction.
Energies 10 00651 g017
Figure 18. Plastic yield distribution of the surrounding rock. (a) 24 h; (b) 48 h.
Energies 10 00651 g018
Figure 19. Contrast on plastic yield distribution of the surrounding rock with different fluid density. (a) 1 h at 30 MPa (Pf); (b) 1 h at 40 MPa (Pf); (c) 24 h at 30 MPa (Pf); and (d) 24 h at 40 MPa (Pf).
Energies 10 00651 g019
Figure 20. Contrast in the stress difference of the surrounding rock with/without NP.
Energies 10 00651 g020
Figure 21. Contrast of the shear stress distribution of the surrounding rock with/without NP. (a) BM for 10 h; (b) “BM + NP” for 10 h; (c) BM for 48 h; and (d) “BM + NP” for 48 h.
Energies 10 00651 g021
Figure 22. Contrast on the yield zone distribution of the surrounding rock with/without the NP. (a) BM for 10 h; (b) “BM + NP” for 10 h; (c) BM for 24 h; and (d) “BM + NP” for 24 h.
Energies 10 00651 g022
Figure 23. PTT curves of Longmaxi group shale in China with different solutions.
Energies 10 00651 g023
Figure 24. SEM pictures of the shale. (a) Original shale magnified by 2400 times; (b) Shale contacted with nano-SiO2 in PTT magnified by 2400 times; (c) Original shale magnified by 30,000 times; and (d) Shale contacted with nano-SiO2 in PTT magnified by 30,000 times.
Energies 10 00651 g024
Figure 25. Statistics of pore size distribution of SEM pictures. (a) Original shale; (b) Shale contacted with nano-SiO2.
Energies 10 00651 g025
Figure 26. A sparse and dense cell subdivision result of the calculation model in numerical simulation. (a) 1800 grids and 3720 nodes; (b) 7200 grids and 14880 nodes.
Energies 10 00651 g026
Figure 27. Contrast on the yield zone distribution of shear failure of the surrounding rock with/without the NP and with more sparse mesh. (a) BM for 10 h; (b) “BM + NP” for 10 h; (c) BM for 24 h; and (d) “BM + NP” for 24 h.
Energies 10 00651 g027aEnergies 10 00651 g027b
Figure 28. Contrast on the yield zone distribution of shear failure of the surrounding rock with/without the NP and with denser mesh. (a) BM for 10 h; (b) “BM + NP” for 10 h; (c) BM for 24 h; and (d) “BM + NP” for 24 h.
Energies 10 00651 g028
Table 1. Basic properties of SiO2 NP dispersions.
No.Density (g/cm3)NP Size (nm)NP (wt. %)pH
NP-A1.22730.210
NP-B1.2010–1530.410
Table 2. Changes of NP on shale permeability.
ShaleNanoparticlesPermeability, nDΔk, %
Sea WaterBMBM + NP
#1NP-A0.180.0150.000199.33
#2NP-B0.4760.0500.00394.00
Table 3. Shale parameters used in the model.
ParameterValue
Porosity4%
Shale density (ρ)2600 kg/m3
Viscosity of water (μ)1.2 × 10⁻³ Pa·s
Maximum horizontal crustal stress (σH)75 MPa
Minimum horizontal crustal stress (σh)50 MPa
Pore fluid pressure (Po)25 MPa
Drilling fluid pressure (Pf)35 MPa
Elasticity modulus of shale (E)45.9 GPa
Poisson’s ratio (μ)0.25
Cohesion (C)22.73 MPa
Friction angle (φ)34.8°
Tensile strength2.94 MPa
Shale permeability with sea water1.8 × 10−18 cm2
Shale permeability with the BM0.15 × 10−18 cm2
Shale permeability with BM plus NP0.1 × 10−20 cm2

