
Study on the Thermal and Dielectric Properties of SrTiO3/Epoxy Nanocomposites


School of Electrical Engineering, Wuhan University, Wuhan 430072, China
*
Author to whom correspondence should be addressed.
Energies 2017, 10(5), 692; https://doi.org/10.3390/en10050692
Submission received: 24 March 2017
/
Revised: 8 May 2017
/
Accepted: 11 May 2017
/
Published: 15 May 2017
(This article belongs to the Special Issue Selected Papers from 2016 IEEE International Conference on High Voltage Engineering (ICHVE 2016))
Abstract
:SrTiO3/epoxy nanocomposites are prepared using the facile solution-processing technique by incorporating SrTiO3 nanoparticles with different weight fractions into the epoxy resin host. The morphology of the nanoparticles and composites, as well as the thermal conduction characteristics and electrical properties of the composites were investigated via conventional testing methods. The thermal conductivity increased along with the SrTiO3 weight fractions, and the thermal conductivity of the SrTiO3/epoxy composite with 40 wt % weight fraction increased to 0.52 W/mK. The dielectric constant increased along with the weight fractions and decreased along with frequency, thereby suggesting that the interfacial and dipole polarization do not follow the changes in the electrical field direction at high frequency. The dielectric constants at 1 kHz frequency increased along with temperature. Surface breakdown tests illustrated further improvements in the thermal and electrical properties of the composites. In the same time span of 40 s, the 40 wt % nanocomposite demonstrated a rapid temperature decline rate of 6.77 °C/s, which was 47% faster than that of the pure epoxy sample. The surface breakdown voltage also increased along with the weight fractions. The functional composites can solve the key problem in the intelligentization, miniaturization, and high-efficiency of the gas-insulated switchgear, which warrants further research.
1. Introduction
Epoxy resin is known for its excellent electrical properties, including high dielectric breakdown strength and electrothermal stability, which account for its wide practical application in the manufacturing of electrical equipment. To some extent, the physical aging of dielectric materials under complex electrical field conditions can be used to directly assess whether these materials have met certain standards. Thermal conduction is vital in making sound judgments because actual operations are mostly accompanied by electrothermal degradation. Given the increasing demands of smart grids in constructing reliable ultra-high voltage power systems, novel electrical equipment, such as dry-type transformers and solid switch cabinets that require a large amount of epoxy resin, must perform safely and efficiently within a small floor space [1,2,3]. However, the accumulation of heat at the contact layer between the metal parts and the insulating polymer matrix can increase and flourish rapidly, especially when partial defects are encountered during the assembly process. This heat also generates a highly acute partial discharge that increases the inner temperature up to the threshold value of the starting streamer discharge. The potential defects within the insulating materials, such as cracks, cavities, and pinholes, can also exacerbate the whole degradation process. Thus, the incorporation of nanoparticles into the polymer matrix has received extensive attention because of its potential to increase thermal conductivity while sustaining a high dielectric breakdown strength [4,5]. Ceramic fillers with high thermal conductivity, including alumina (Al2O3) [6], boron nitride (BN) [7,8], silicon nitride (Si3N4) [9], aluminum nitride (AlN) [10], and carbon nanotubes (CNTs) [11], are often used in the manufacturing of hybrid dielectric materials. However, the reduction of dielectric strength has received limited attention in previous articles, most of which demonstrate the possible improvements in thermal conductivity after the incorporation of nanoparticles [12,13,14,15,16,17]. Within our practical scope, several factors, including shape, size, and weight fraction, must be considered to fully understand the effects of some fillers. Some theoretical articles [18,19] suggest that small nanoparticles may demonstrate less remarkable improvements in their thermal conductivity compared with micron-sized particles. In terms of dielectric properties, the distortion of electrical fields that are positioned on the interface between the inorganic fillers and the organic matrix, which are produced from the uneven space–charge distribution or the incompatibility of two different phases, can distinctively reduce the dielectric strength of the nanocomposite. Therefore, the dispersion degree of those nanoparticles with adequate amounts of surfactants during the solution process must be improved [12,13,14,15,16,17].
Given its high εr, low dielectric loss, and high dielectric strength [20,21,22,23,24,25], barium titanate (BT) has recently attracted wide usage in the electronic packing industry, specifically in the fabrication of high-quality dielectric nanocomposites that are used in the production of highly effective capacitors. However, a reduction in the dielectric strength of these materials cannot be ruled out [26]. Strontium titanate (SrTiO3), as a versatile and functional ceramics material that can be easily synthesized into 1D materials, shows better thermal stability and dielectric properties than BT [27,28,29].
In this paper, SrTiO3 nanoparticles with a diameter of less than 100 nm were treated with the surfactant KH550 and then incorporated into the epoxy resin matrix to increase the affinity and dispersibility of its filler. The effects of SrTiO3 nanoparticle content on morphology, thermal properties, and dielectric properties were discussed from the perspective of the structure–property relationship to guide future studies on the flashover characteristics and heat dissipation of the designed nanocomposites under different protective atmospheres.
2. Experimental
2.1. Materials
The SrTiO3 nanoparticles were purchased from Beijing DK Nano Technology Co., Ltd. (Beijing, China). The bisphenol-A epoxy resin E51 was purchased from Wuxi Lan-Star Petrochemical Co., Ltd. (Wuxi, China). The surfactant KH550, epoxy resin curing agent 593, and other materials and reagents were supplied by Wuhan Shen Chemical Reagents and Equipments Co., Ltd. (Wuhan, China).
2.2. Sample Preparation
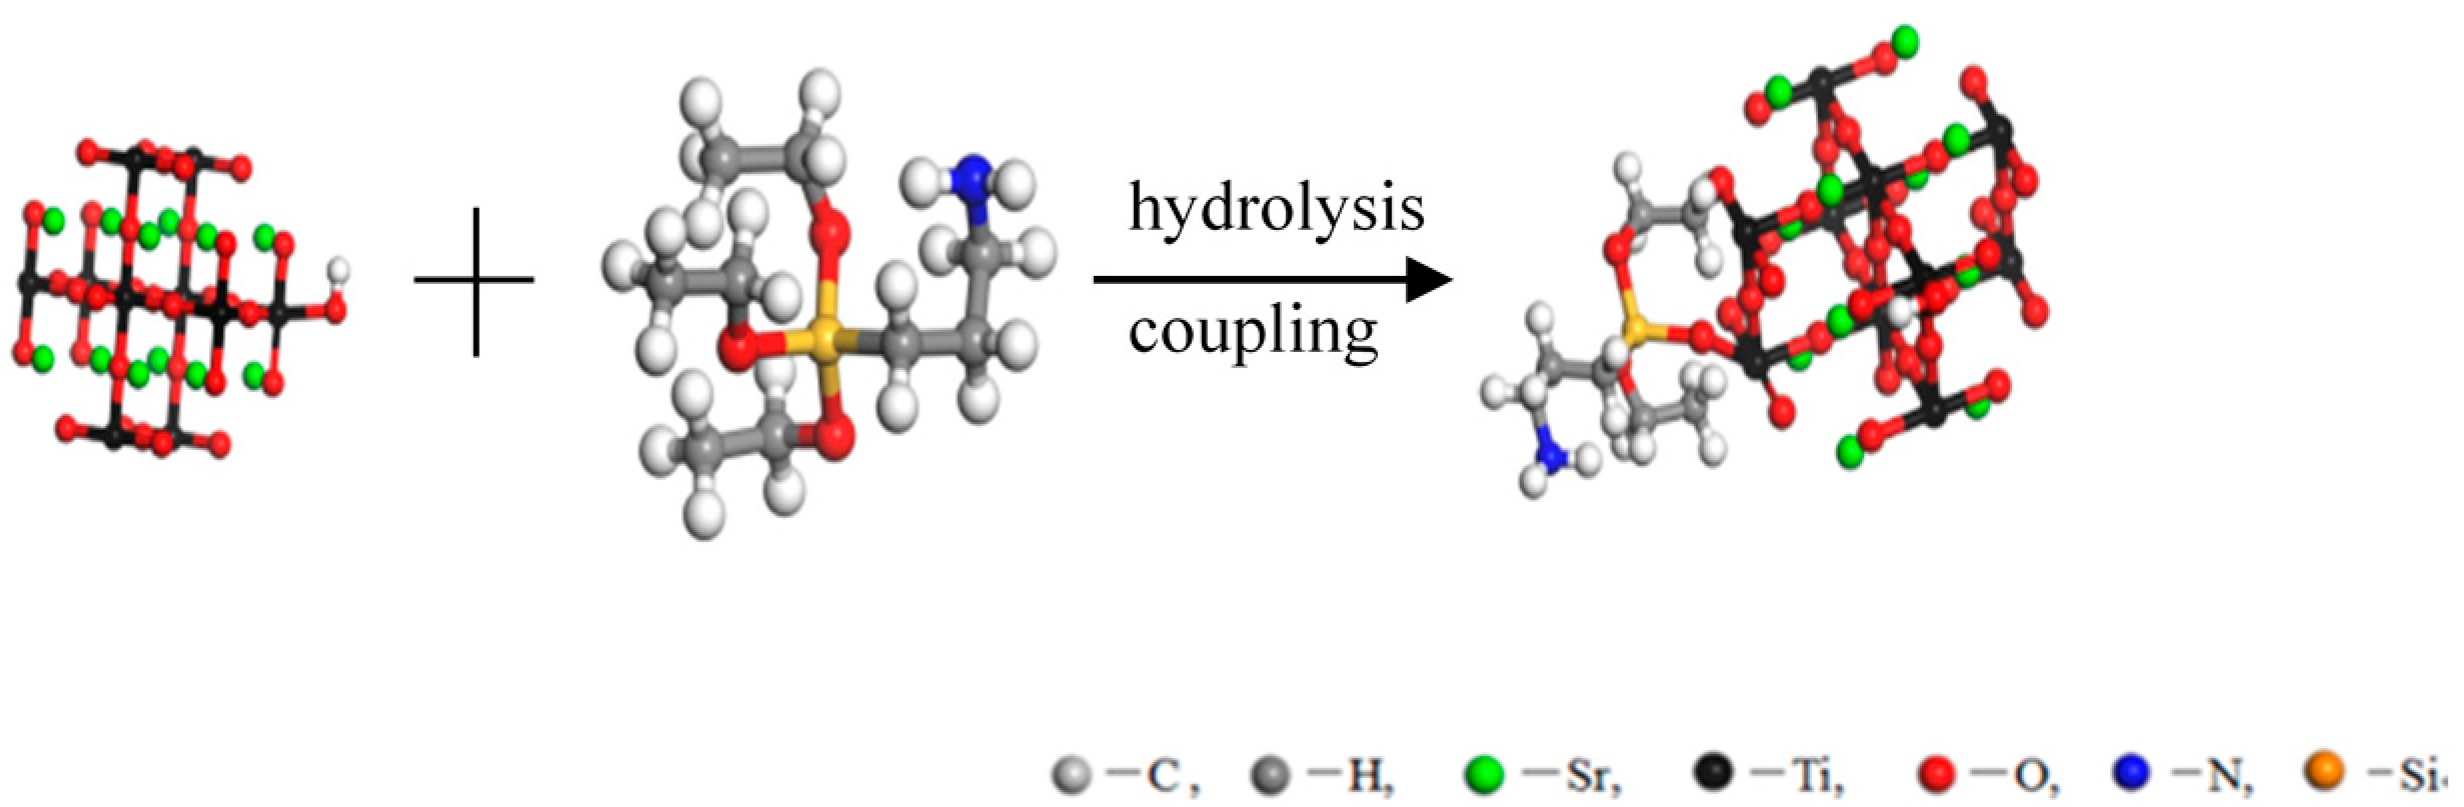
The SrTiO3 nanoparticles were dried at 120 °C for 8 h. The surfactant KH550 was dropped into a mixture of ethanol and deionized water with a volume ratio of 95 mL:5 mL before adding the particles. The suspension of SrTiO3 nanoparticles was stirred for 5 h at 60 °C after being sonicated for 1 h at 60 °C. The modified powder was then collected after milling the dried mixture. The nanoparticles were covered by the surfactant via the hydrolysis and coupling processes illustrated in Figure 1. As a unique characteristic of the entire doping system, the animated functional group –NH2 at the end of the surfactant will react with the epoxy groups to form a keen affinity with the long chain of epoxy resin molecules.
SrTiO3/epoxy composites with SrTiO3 loading amounts ranging from 7 wt % to 40 wt % were fabricated as follows: First, the modified particles were mixed into the low-viscosity epoxy resin, dubbed as E51, and then stirred at 60 °C for 1 h. Second, the mixture was sonicated for 2 h at the same temperature with ultrasonic power at ca. 600 W. Third, the curing agent 593, which accounted for 20 wt % of the epoxy resin, was added into the well-dispersed white mixture. To avoid rapid curing caused by poor heat dissipation, the mixture was stirred at 20 °C for 5 min before being scrapped into a steel mold of round rabbets with 1 mm depth and 20 mm diameter. The mixture was then degassed in vacuum at 40 °C for 20 min, and then cured at room temperature, in an oven, and in air for 12 h. The desirable cured composites were peeled off for further characterization.
2.3. Characterization
The modified nanoparticles were examined using a transmission electron microscope (JEM-2100, JEOL, Tokyo, Japan). The microstructure of the composites was observed using a field emission scanning electron microscope (SIGMA 300, Carl Zeiss, Jena, Germany). Fourier transform infrared (FT-IR) spectra were recorded on a Thermo Scientific Nicolet 5700 FTIR spectrometer (Nicolet 5700, Thermo Fisher Scientific, Waltham, MA, USA). TG-DSC tests were carried on a simultaneous thermal analyzer (STA7300, SEIKO, Tokyo, Japan). The thermal conductivity was evaluated by using the DRP-III thermal conductivity detector (DRP-III, Xiangtan Instrument Apparatus, Xiangtan, China), which was manufactured according to the ASTM D-5470-06 standard. The dielectric properties, including the dielectric constant, dielectric loss, and electric conductivity, were tested using Agilent HP-1294 exchange impedance analysis equipment (HP-1294, Agilent Technologies, Santa Clara, CA, USA).
2.4. Surface Breakdown Test Apparatus
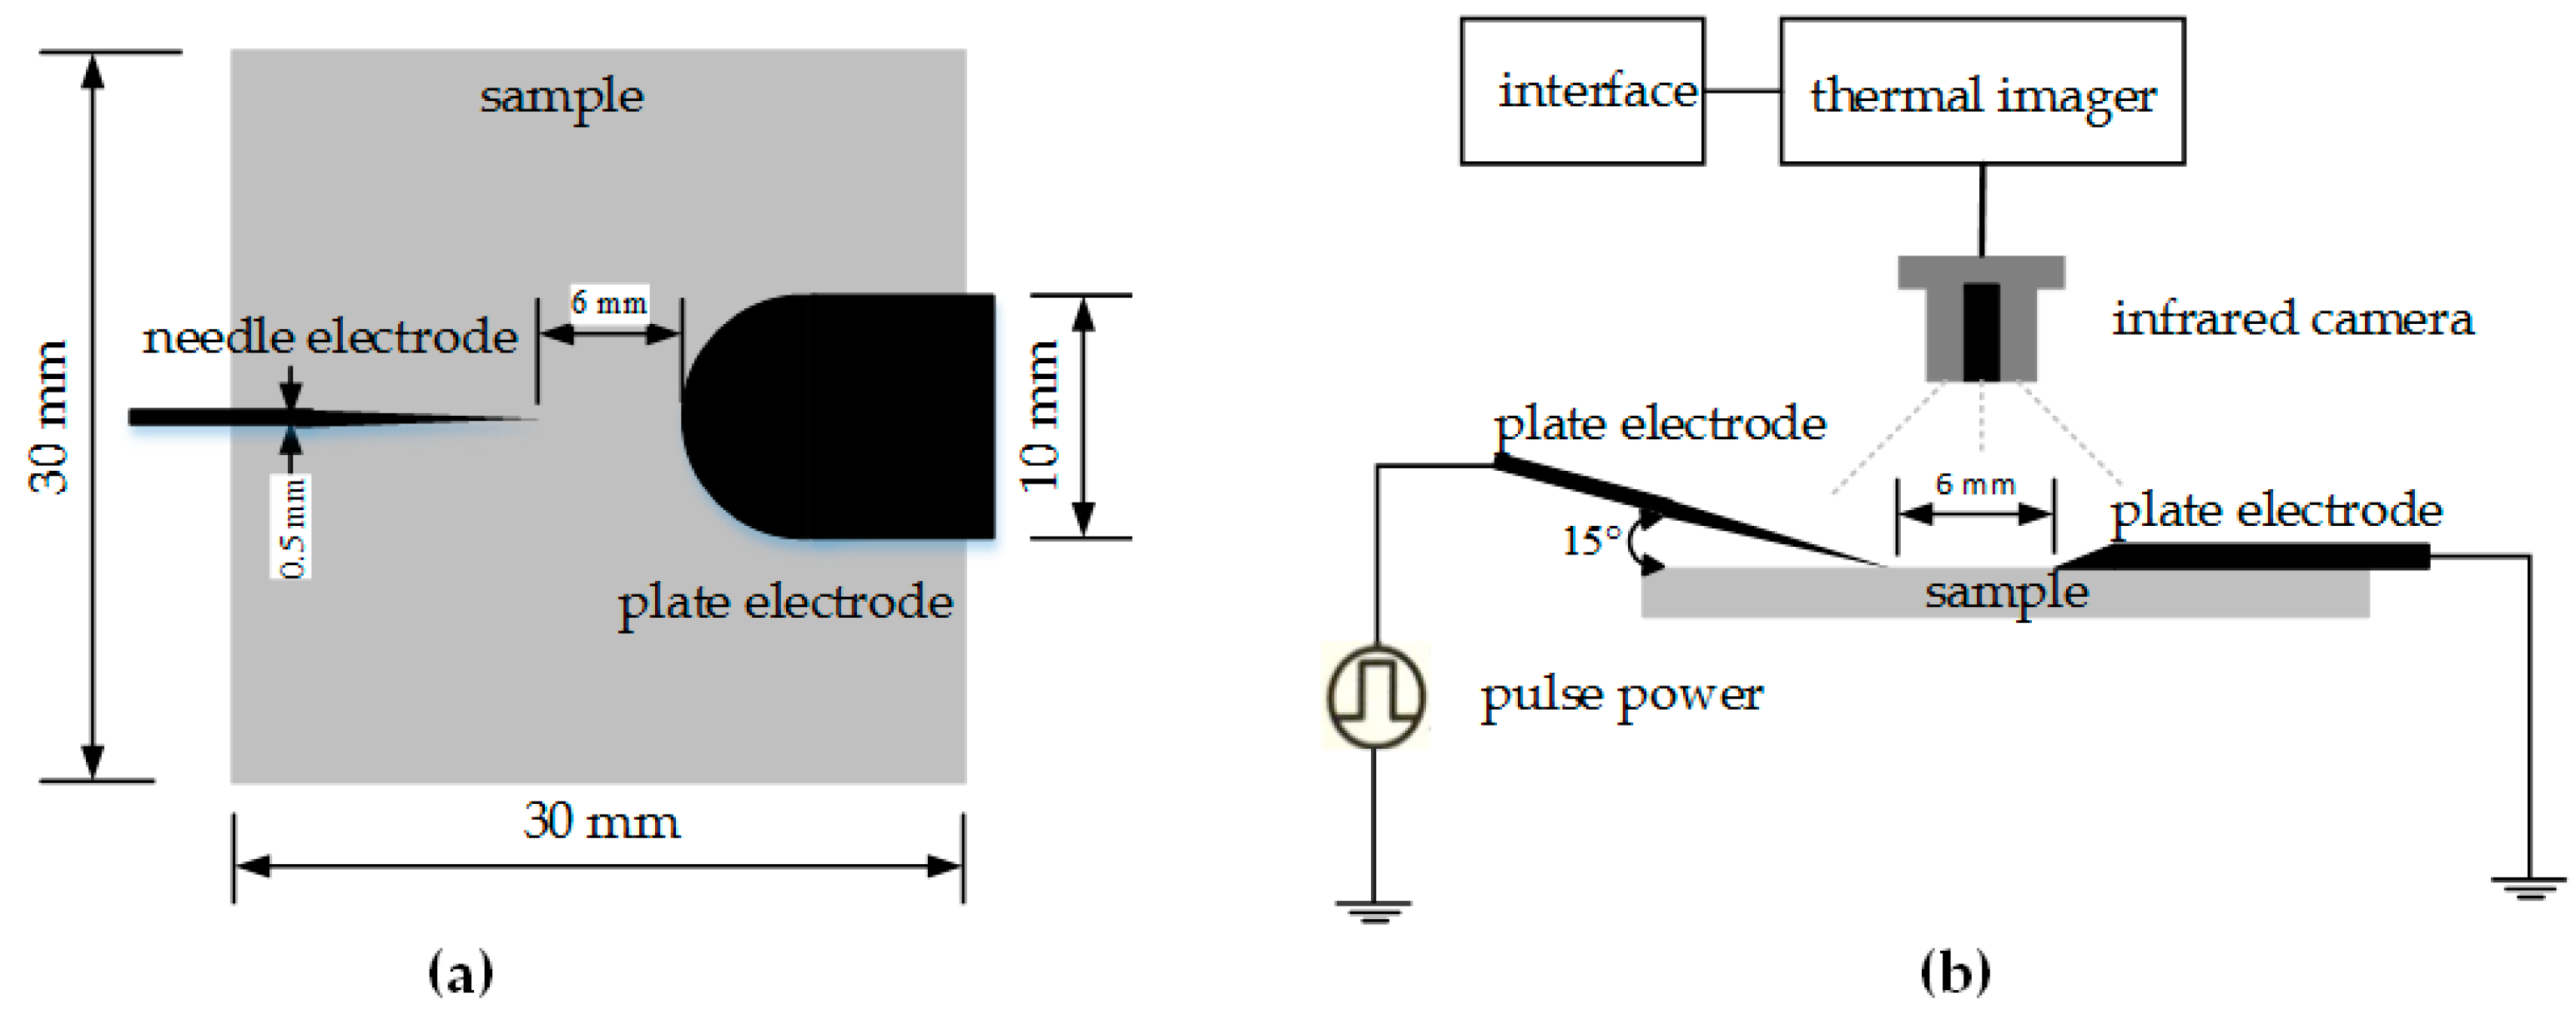
Figure 2 shows the apparatus for the surface breakdown tests. The positive electrode of a long customized needle made of copper was placed 6 mm away from the plate electrode of a flat copper strip, which included a 5 mm radius semicircle at the end to create a severely uneven electrical field. The 1 mm thick sample was a square piece with a side length of 30 mm. The needle electrode should be beveled at 15° with the sample surface, while the plate electrode was attached to the surface of the samples with a small amount of silver paste to ensure that the electrical arc was close enough to the surface when the gap breaks down. Before applying high voltage, the infrared camera should hang over the gap at the best focal distance. The parameters of power are depicted as a half-sine shock pulse with a rising time of 100 μs, a maximum output voltage of up to 15 kV, and a maximum impulse frequency of 1 kHz.
The experiments were performed in air, and the infrared thermograph was recorded every 3 s during the application of high voltage power. Given that the temperature at the front surface showed no significant difference before the applied voltage increased to the inception voltage and resulted in the breakdown of the gap, the temperature decline rate recorded within 60 s after the breakdown can directly reflect the change in the thermal conductivity of the nanocomposites. All thermograph images were taken from the three tests.
3. Results and Discussion
3.1. Surface Treatment of SrTiO3
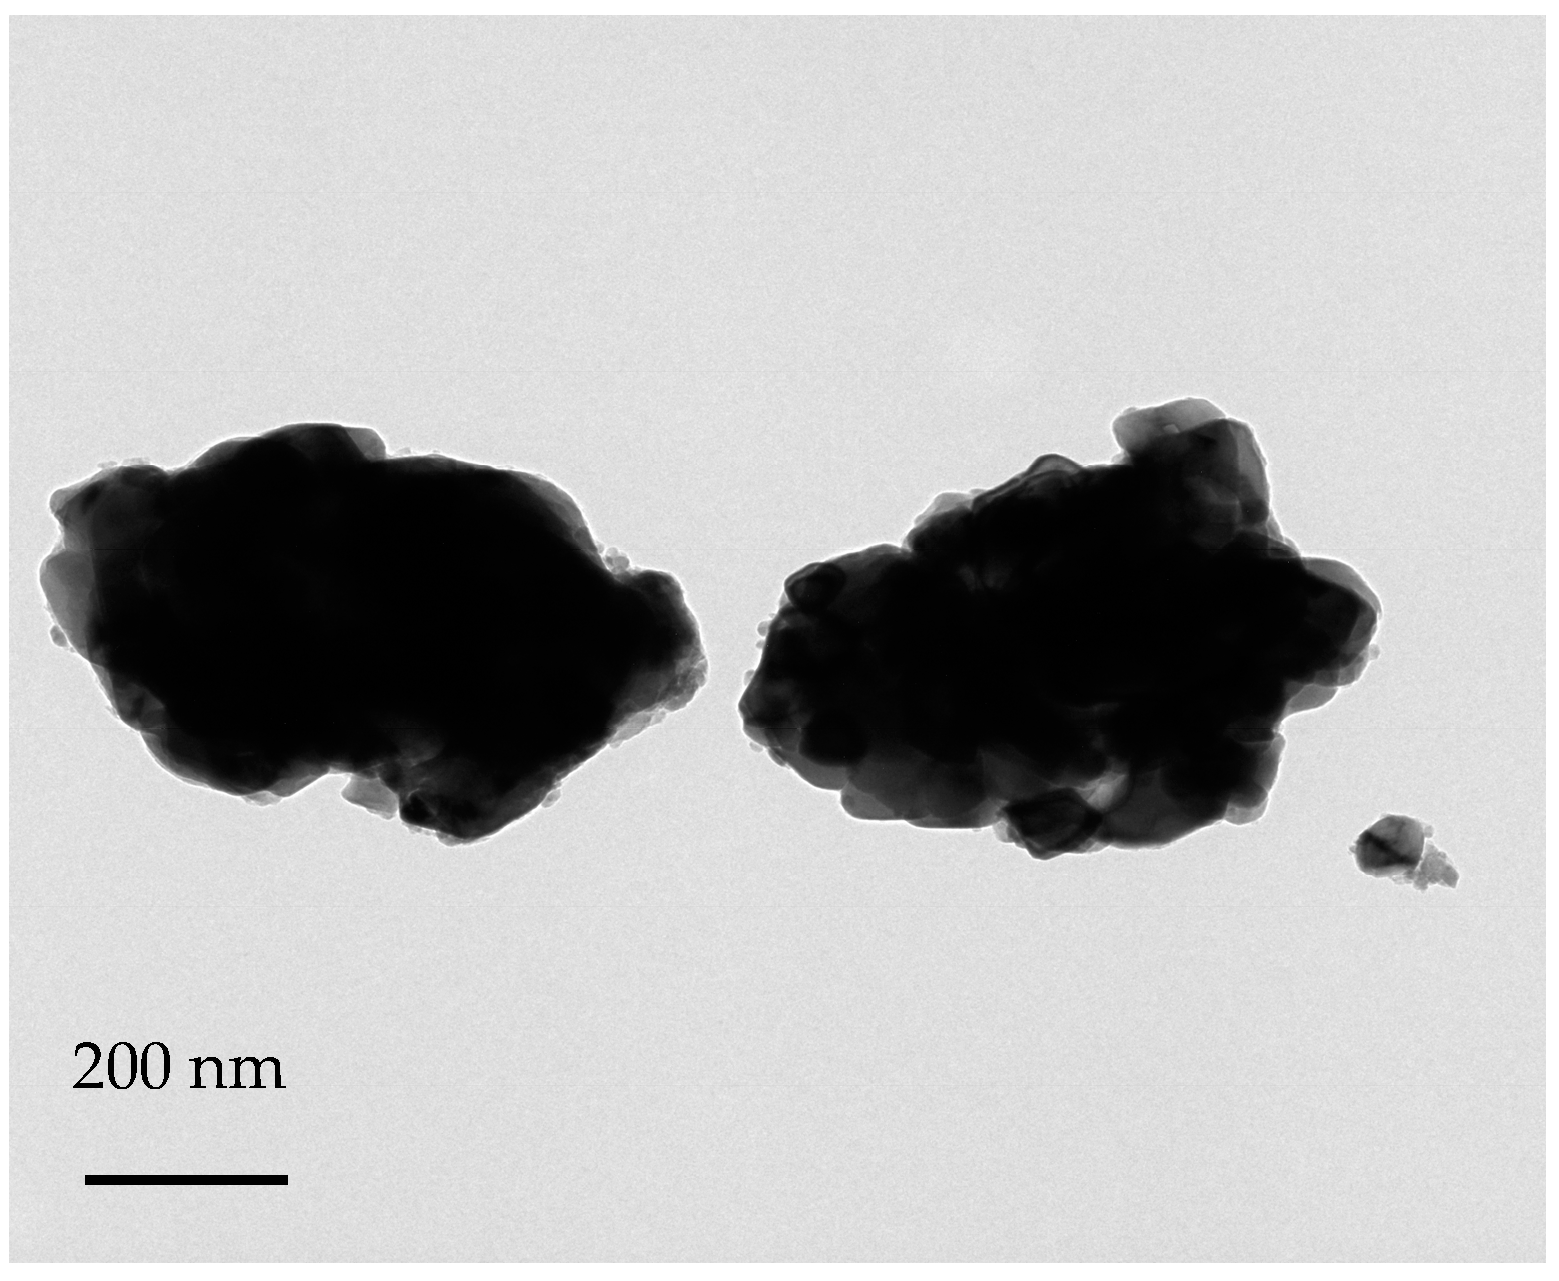
Figure 3 shows a transmission electron microscopy (TEM) image of the modified SrTiO3 nanoparticles. After sonication, the stacking of particles formed a cluster with a mean particle size of more than 100 nm. A thin layer of film covered the surface of the rough particles to reflect the moderate interaction between the silane coupling agent KH550 and the hydroxyl nanoparticles. Figure 4 shows the FT-IR spectra of the cured epoxy resin and 40 wt % nanocomposite, which can verify the formation of the novel bond Ti–O–Si that indirectly accounts for the broadening peak at 1039.5 cm−1 belonging to the vibration absorption peak of bonds Ti–O–Ti. Meanwhile, the peak at 579.1 cm−1 clearly demonstrates the tridentate binding reported in [20]. The peak at 1460.3 cm−1 can be ascribed to the bending vibration of bond C–H.
3.2. Morphology of the Cured Nanocomposites
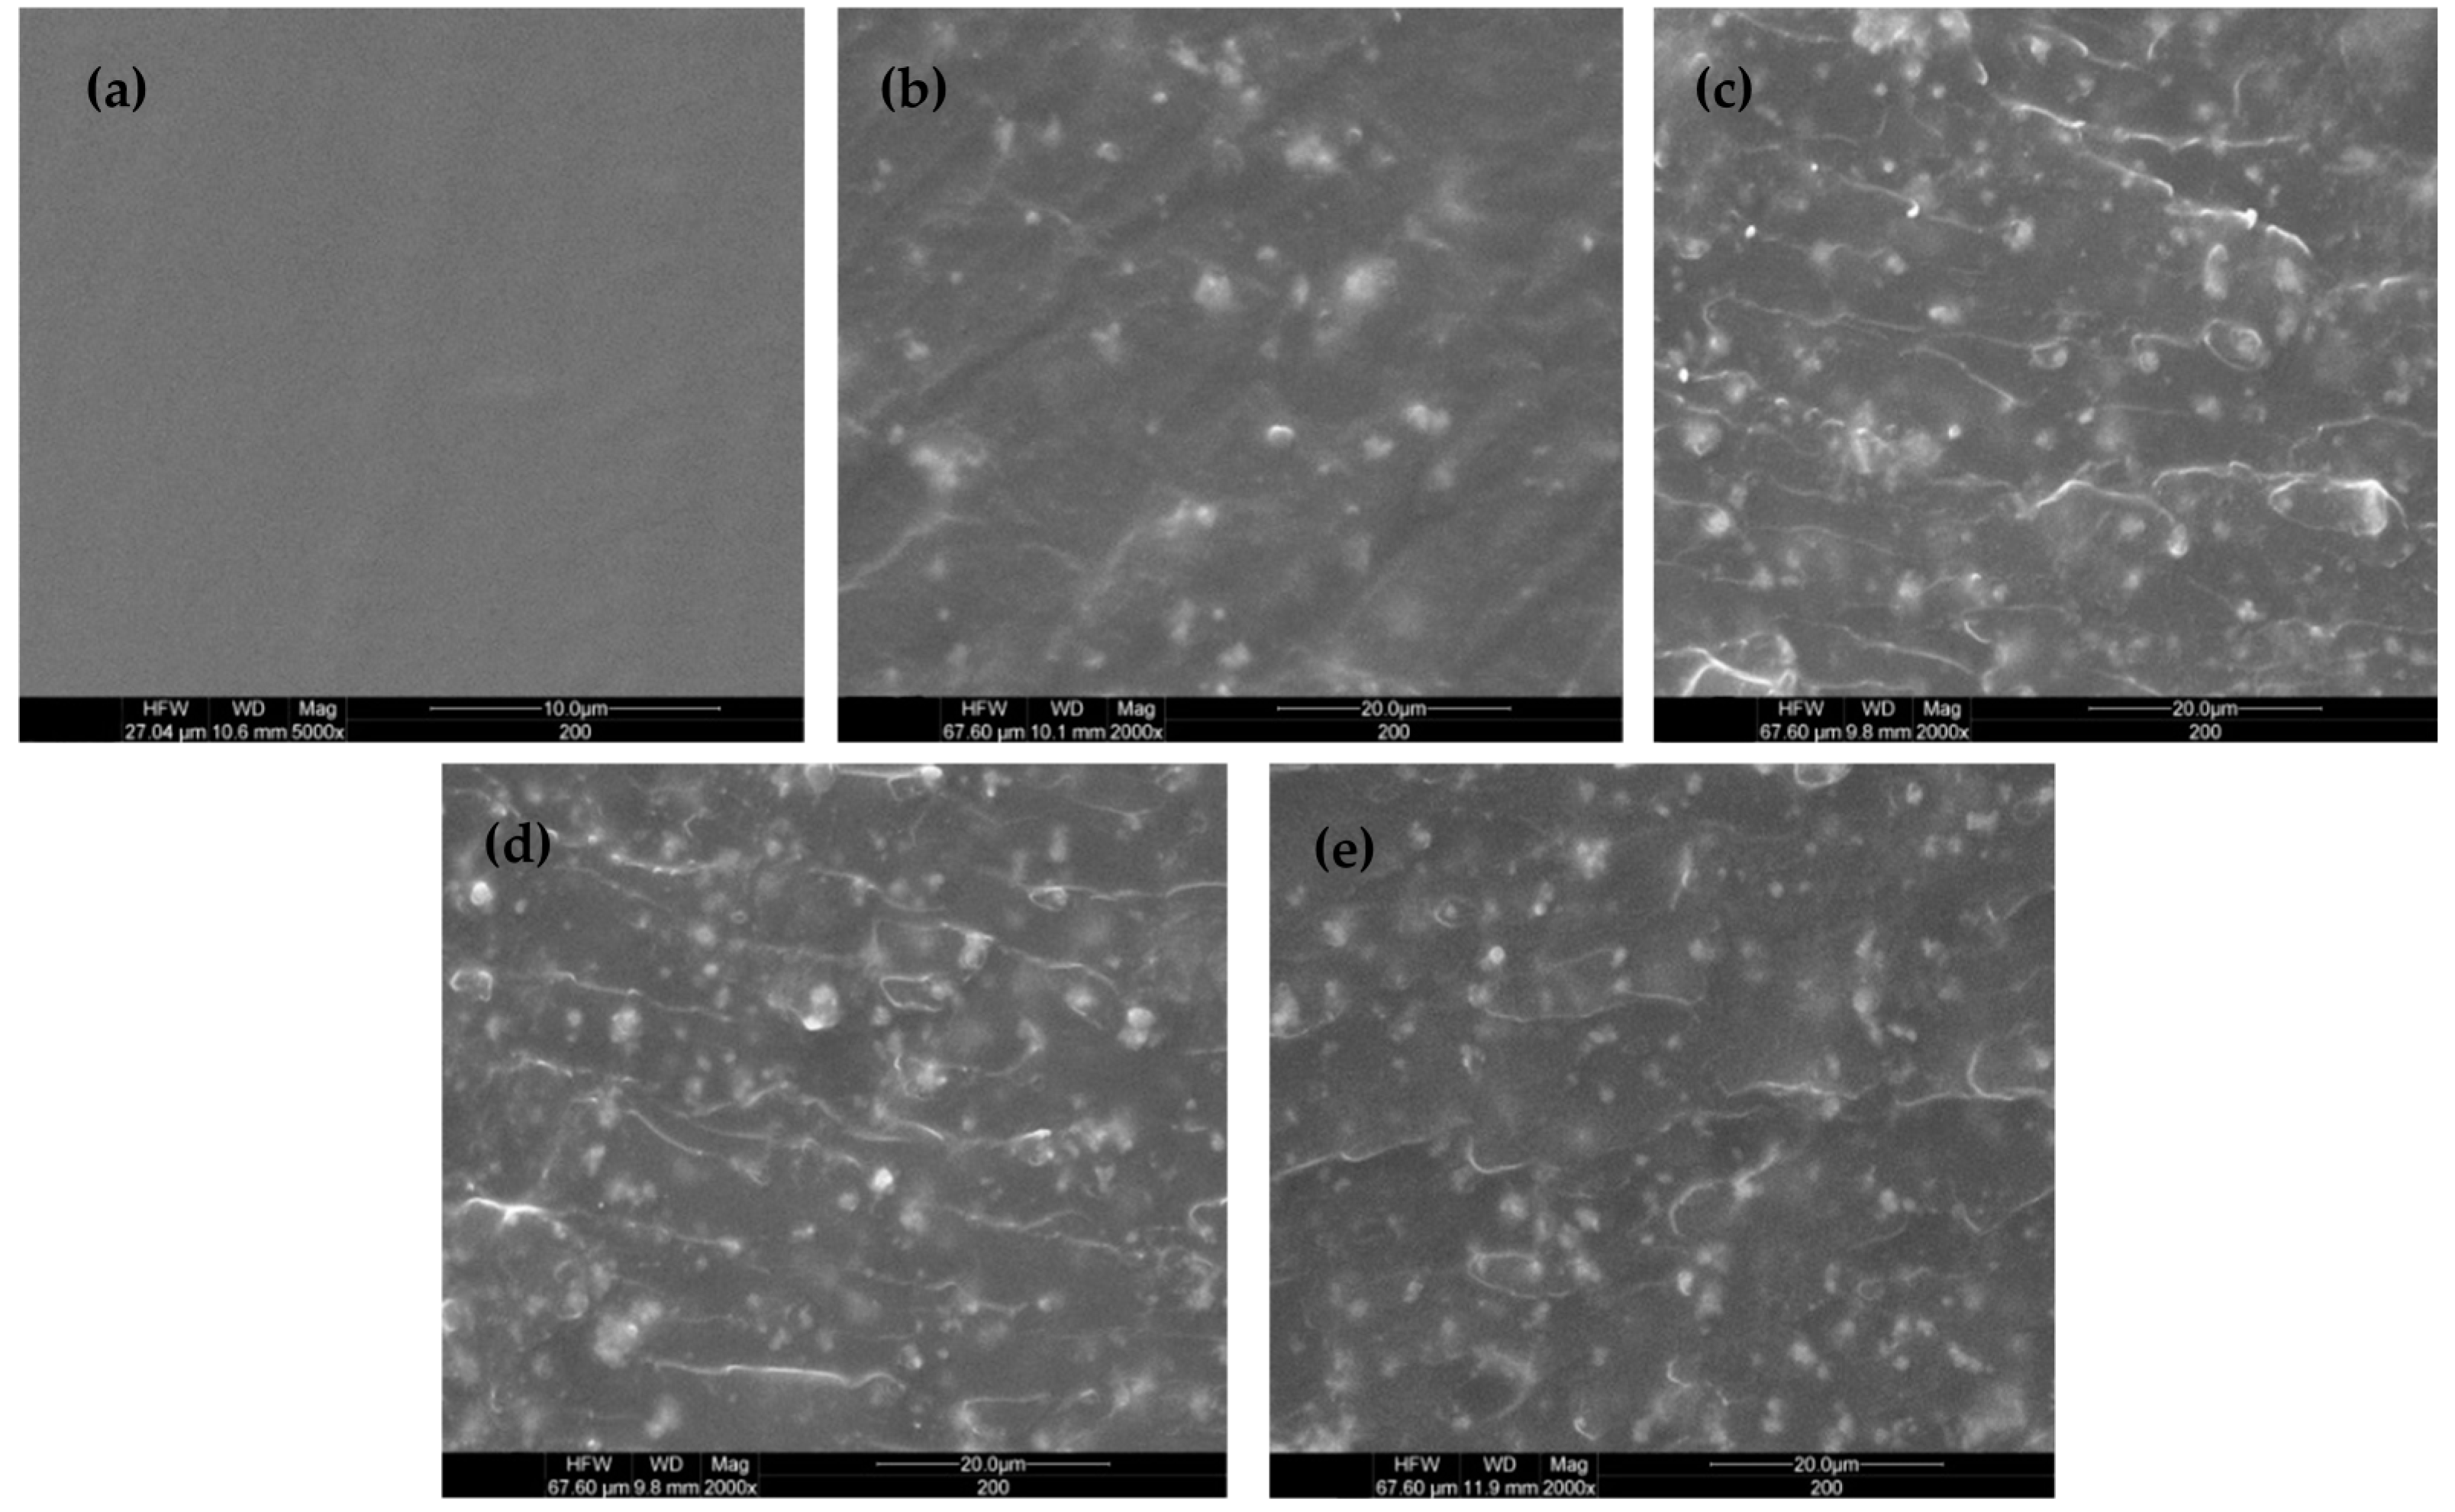
Figure 5 shows the SEM images of the cross-sections of the cured nanocomposites with different weight fractions. The white spots denote the well-dispersed nanoparticles with an average diameter of 200 nm to 500 nm. As the filler amount increases, the nanoparticles homogeneously disperse without large agglomeration, cracks, or pinhole defects. The distance among the particles often exceeds 1 μm, thereby preventing the formation of an effective thermal conduction path. However, some thin ridges more than 5 μm long can be observed among the particles. These ridges, which are not straight enough, yet never cross one another, tend to string two or more particles together from end to end. Although the chemical composition of these ridges has not been identified thus far, they may be directly formed as a result of crystallization during the curing procedure. The selective particles induced the molecular movement along the thermal conduction pathway. A direct connection between particles appears necessary, but the possible agglomeration can reduce the dielectric strength, as reported in [26]. If the ridges can connect the particles while eliminating severe stacks, then both the thermal and electrical properties will be improved. Therefore, all ripple-like curves that do not exist in the pure epoxy resin sample can link together the separate particles in the cross-section and provide pathways for the rapid transmission of heat and for increasing the crystallization degree of the nanocomposites.
3.3. Thermal Properties of the Nanocomposites
Figure 6 shows the thermal conductivity of the composites at room temperature with different filler loadings. When the filler loading reaches 40 wt %, the thermal conductivity of the composites reaches 0.52 W/m·K, which is more than twice than that of the pure epoxy resin (0.2 W/m·K). At a low SrTiO3 concentration, the inorganic fillers cannot easily form an effective thermal conduction pathway because the high density of nanoparticles (4.81 g/cm3), which is almost five times larger than that of pure epoxy resin, can result in low volume ratios. In this case, the particles are separated by a large distance, and the thermal conductivity of the nanocomposites does not increase under an unfavorable heat transmission. Modifying the nanoparticle may improve the thermal conductivity, reduce the surface energy to a low level, and enhance the wetting ability of the particles through the surface activity functional groups. For instance, the functional group –NH2 may react with the epoxy group to establish a crack-free 3D structure without severe interfacial thermal resistance during the curing process. Judging from the morphology analysis results, the ridges that spread throughout the dielectric solids and increase the crystallinity will create a well-arrayed molecular structure that, by and large, increases the heat transmission speed and the thermal conductivity of the nanocomposite. At the same time, the size of the particles reaches a near-micro grade that also accords with the achievements reported in [18,19]. Therefore, the thermal conductivity of the composites must be increased by modifying the surface of the particles [12,13,14,15,16,17].
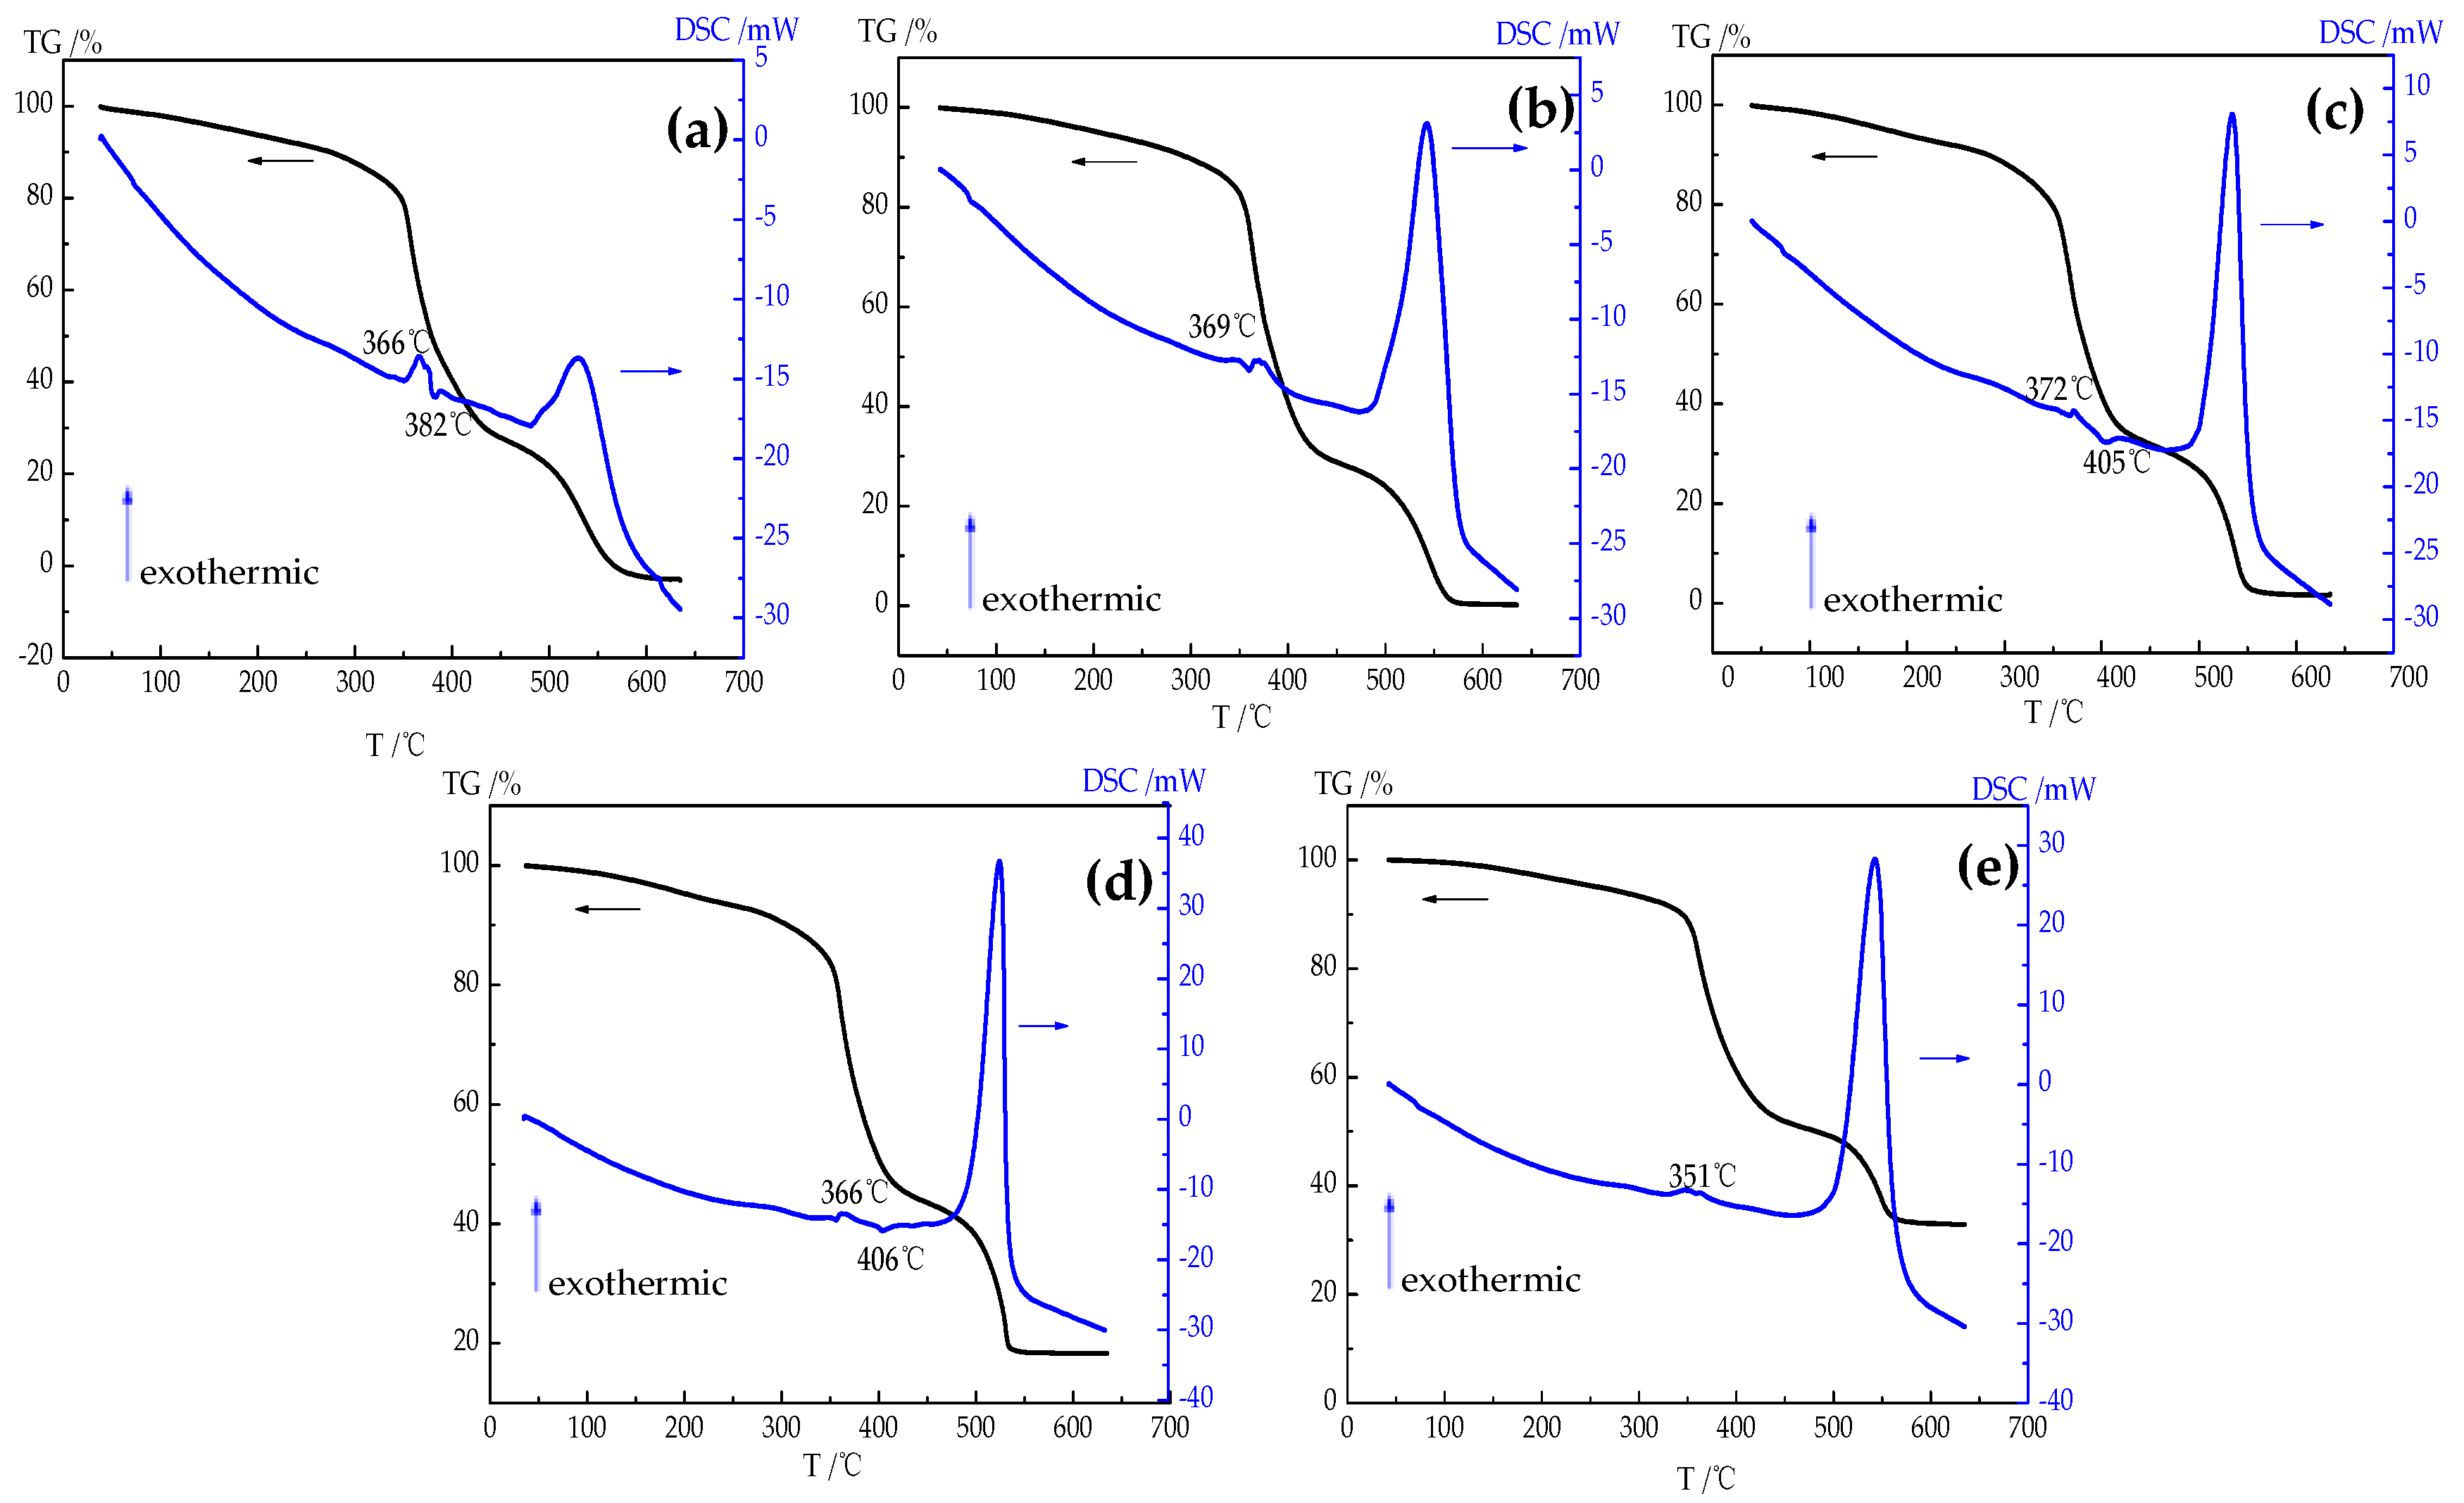
A thermal analysis was conducted using the TG-DSC test to examine further the thermal stability of the dual-phase composite. As shown in Figure 7, the TG-DSC test for the small pieces of the composite were performed in an air atmosphere at a heating rate of 10 °C/min. As the temperature increases, the pure epoxy sample began to melt and decompose at 366 °C, thereby generating an exothermic peak, as shown in Figure 7a. Such an exothermic peak may be a curing exothermic peak because of a potentially incomplete curing reaction.
By contrast, a small endothermic peak was observed near the exothermic peak at 382 °C, which can be ascribed to a slow endothermic melting peak or a possible recrystallization process. One cannot easily distinguish the endothermic melting peaks from the exothermic curing peaks that happen almost at the same time. When the loading amount of those samples with high weight fractions reaching 15 wt %, an exothermic peak was observed at 372 °C. However, the 40 wt % composite sample showed an exothermic peak at 351 °C. The obvious flattening trend of the exothermic peaks could be perceived as a result of the sophisticated melting and decomposition process. In other words, the incorporation of particles would slightly increase the melting temperature of the nanocomposites, but a high loading amount may create a very loose structure with a high potential energy that may easily collapse under heat impingement. Meanwhile, the recrystallization temperature for the 25 wt % nanocomposite increased to 406 °C, which was higher than that of the pure epoxy resin (382 °C). As the amount of particles increased to about 25 wt %, which could facilitate the orientation development of a molecular movement, the nanocomposite showed a well-arranged inner structure, an improved thermal conductivity, and an excellent melting temperature. Increasing the loading amount to 40 wt % may generate many defects that can prompt a melting process at a low temperature. After the temperature reaches 550 °C, each sample burns up and only the proportional SrTiO3 contents are left. The small dents in Figure 7a–e denote the glass transition temperature of approximately 90 °C, which matches the theoretical value.
3.4. Electrical Properties of the Nanocomposites
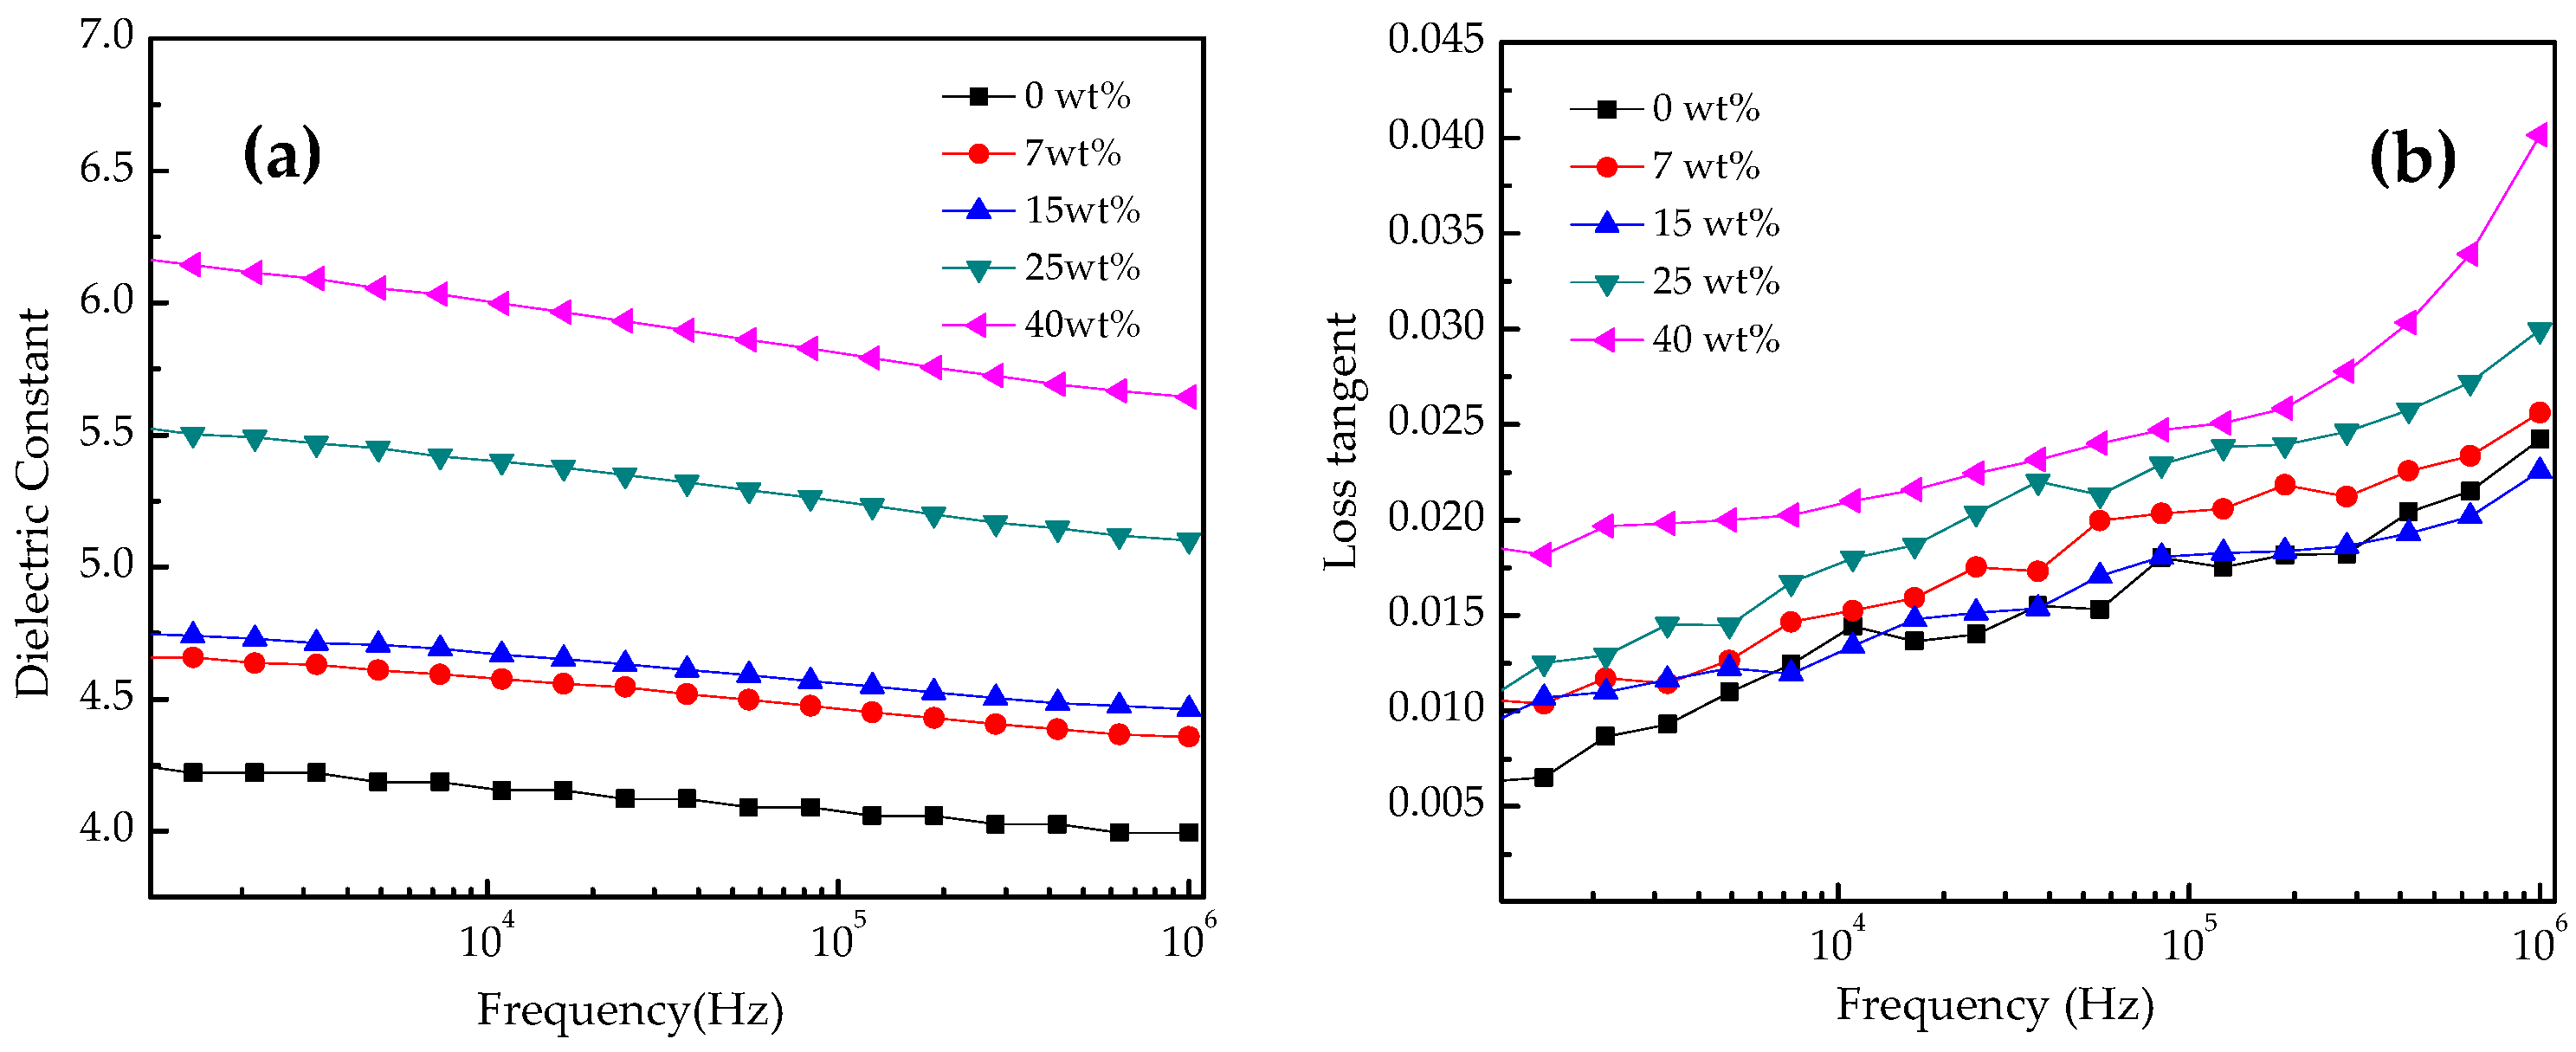
Figure 8 shows the dielectric constant and dielectric loss tangent of the composites. At 1 kHz, the pure epoxy resin and composites with different loading rates have obtained dielectric constants of 4.25, 4.65, 4.75, 5.51, and 6.15, respectively, which are obtained from five measurements to reach a systematic average. The dielectric constant of the 40 wt % composite increased by 44.7% compared with that of the pure epoxy resin. Such a large dielectric constant may be attributed to the high degree of dispersion of the surface-modified SrTiO3 nanoparticles, which has been isolated by a thin repellent film that forms a steric hindrance among the particles. Like placing many ideal capacitors between the particle and the film the dielectric constant increases with the weight fraction. Under high voltage imposition, the capacitors can induce orientational and interfacial polarization, both of which have important roles in increasing the dielectric constant. The dielectric constant decreases along with frequency, which demonstrates the weakening interfacial polarization under high frequency [27,28,29].
Based on the Lichtenecher’s logarithmic mixture formula, the dielectric constants of the composites can be calculated so as to make a comparison with the measured values. Firstly, derived from the Maxwell–Wagner theory, the most appropriate form of the mixing rule can be written as follows:
where is the dielectric constant of the composite; , is the dielectric constant of the individual phases, polymer host and fillers, respectively; f is the volume fraction of the filler; a parameter may be determined by experimental values. For the spherical particles, in the case→0, Equation (1) transforms into the Lichtenecher’s logarithmic mixture formula:
According to Equation (2), the weight fractions 7, 15, 25, and 40 wt % should be converted to volume fractions 1.72, 3.95, 7.20, and 13.44 vol %, respectively. The dielectric constant of the fillers SrTiO3 is defined as 250. Thus, the calculated dielectric constants of the composites compared with the measured values can be shown in the Table 1.
Table 1 shows there is good qualitative agreement between the measured and calculated values when the weight fractions keeps below 25 wt %. A significant difference between the measured and calculated value for the 40 wt % nanocomposite samples also verified that the constant agrees with the effective medium models only within a narrow concentration range reported in [30]. The interface layer may act as the third phase in the composite that leads to the change of the volume fractions, so the mixing rule should be converted to a more complicated three-phase mixing rule. In sum, the Lichtenecher’s logarithmic mixture formula satisfactorily describes experimental values in the SrTiO3/epoxy nanocomposites.
The relative dielectric loss tangent also increases along with frequency from 1 kHz to 1 MHz. This value gradually increases at the beginning because of the limited space charge movement from the deep-level traps of the nanoparticles. The charge transfer decelerates, the leak current is maintained at a low level, and the relaxation time of the 3D structure molecule may also influence the change. In sum, the dielectric loss tangent will either increase or remain the same under the effect of the above aspects.
Increasing the dielectric constant cannot guarantee that the composite will resist any type of high voltage and that the flashover may result in equipment malfunction over the non-uniform electrical field. To some extent, a high dielectric constant may indicate an enhancement in dielectric property under DC voltage. Despite increasing along with frequency, the loss tangent of each sample is maintained at a low level (below 0.02), thereby imposing no threats to the dielectric property of the nanocomposites.
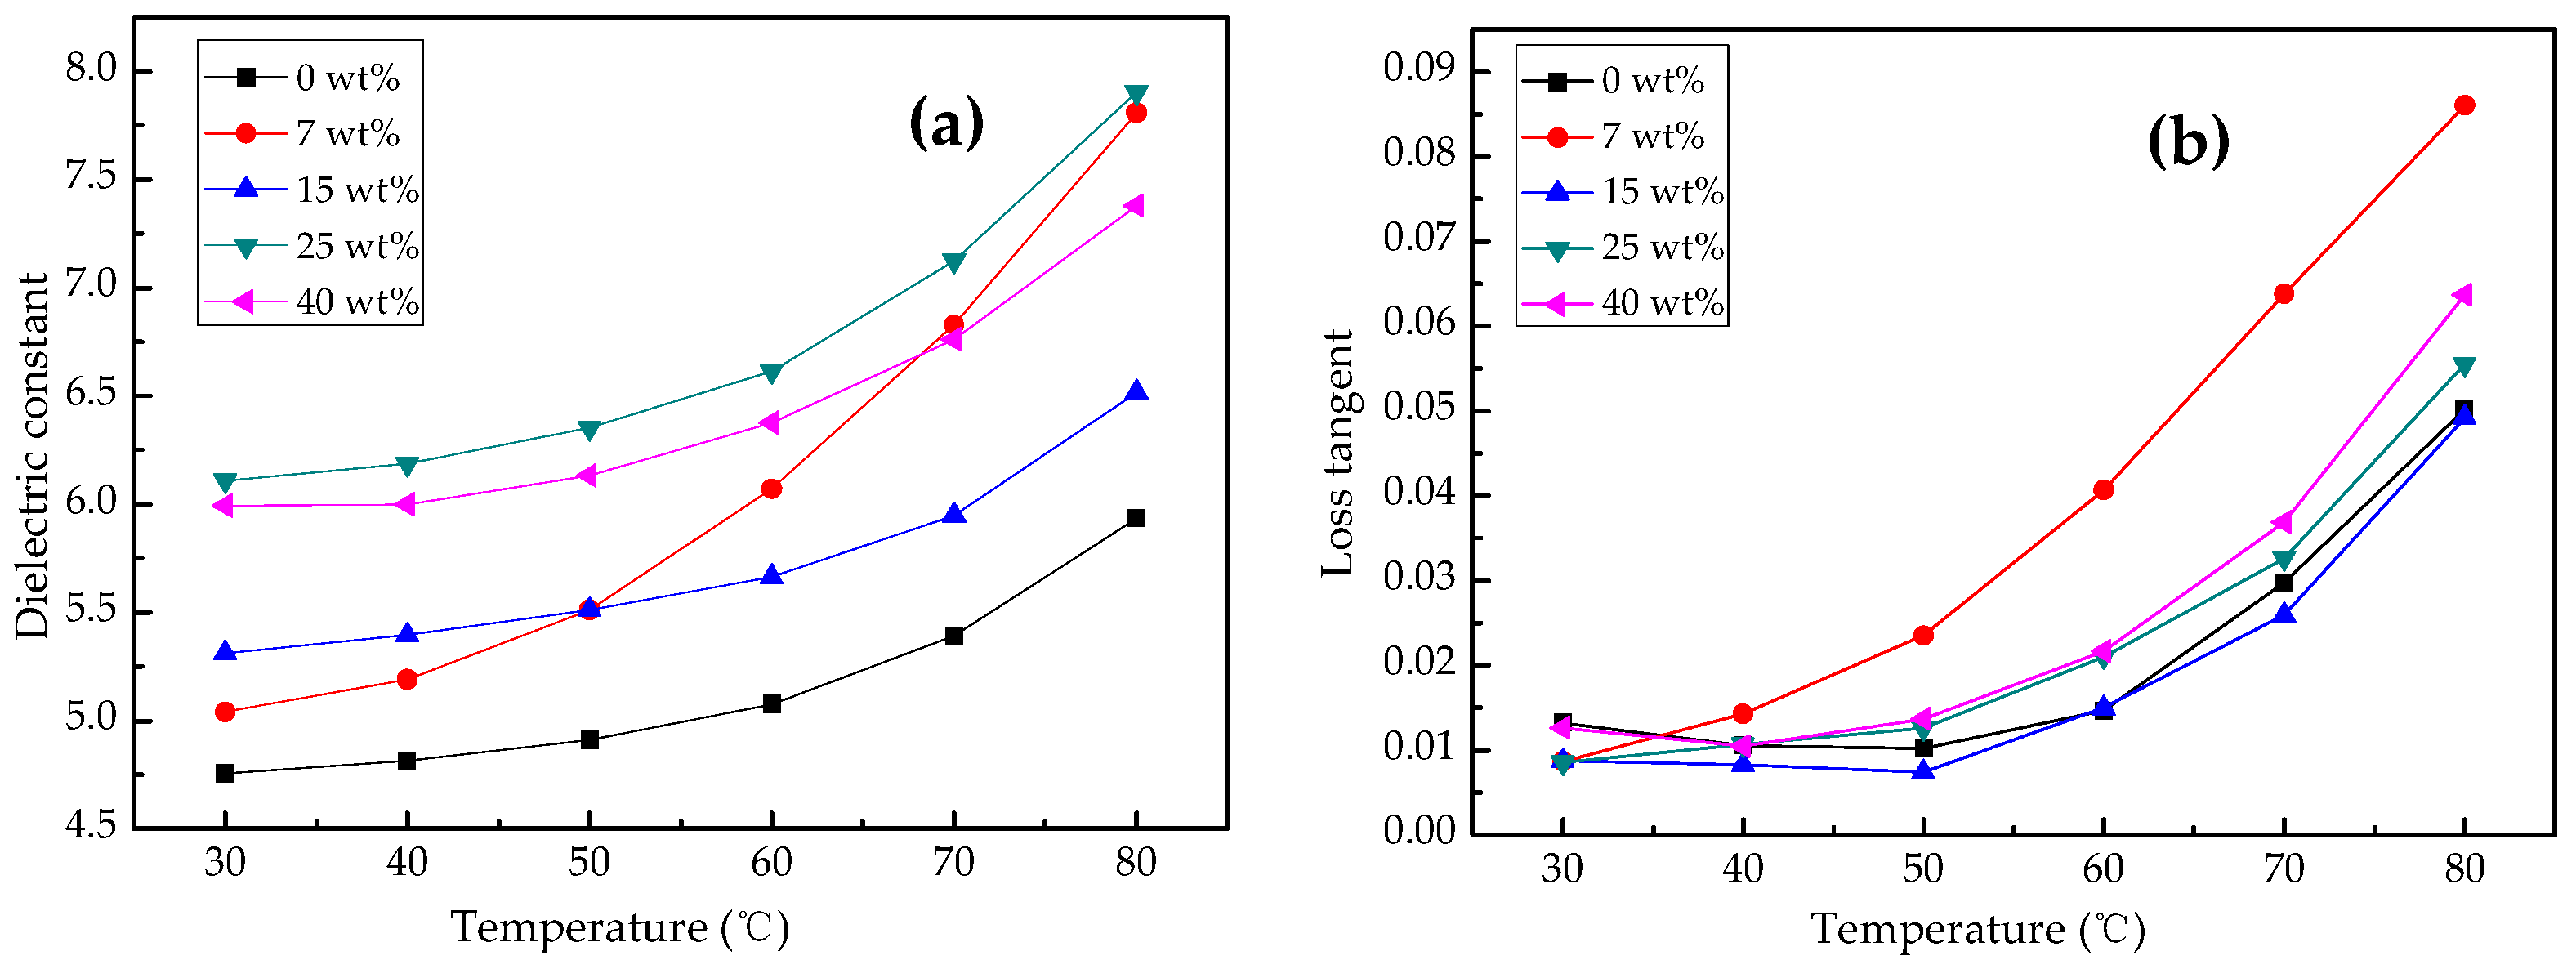
The dielectric constant of the composites at 1 kHz apparently increases along with temperature. The dielectric constant for the 25 wt % nanocomposite increases by 30% when the temperature increases from 30 °C to 80 °C on account of the positive temperature coefficient of the particles and their short relaxation time at high temperature, as shown in Figure 9. The relatively high temperature slightly contributes to the creation of more active electrons and conversely leads to strong interfacial polarization, thereby improving the dielectric properties of the nanocomposites. The dielectric constant of 7 wt % nanocomposite increased drastically with temperature because the small amount of fillers causes less steric hindrance and lower potential energy barriers compared with the other nanocomposites with larger amount of fillers, so a higher temperature enables space charge to exceed the potential energy barriers easily to form space charge polarization for 7 wt % nanocomposite samples at 1 kHz. However, for the nanocomposites with large amounts of fillers, it would cost more time to form space charge polarization, and the temperature below 80 °C also cannot help surmount the very large potential energy barriers. At the same time, the loss tangent of the 7 wt % nanocomposite increased by eight times, along with temperature from 30 °C to 80 °C, while that of the other four samples remained at low levels before demonstrating a rapid increase when the temperature exceeded 50 °C. All samples initially had a low loss tangent of 0.01 at 30 °C. When the temperature approached the glass transition temperature, the loss tangent sharply increased, yet remained at a relatively low level, thereby preventing any severe mechanical and electrical degradation to the whole composite.
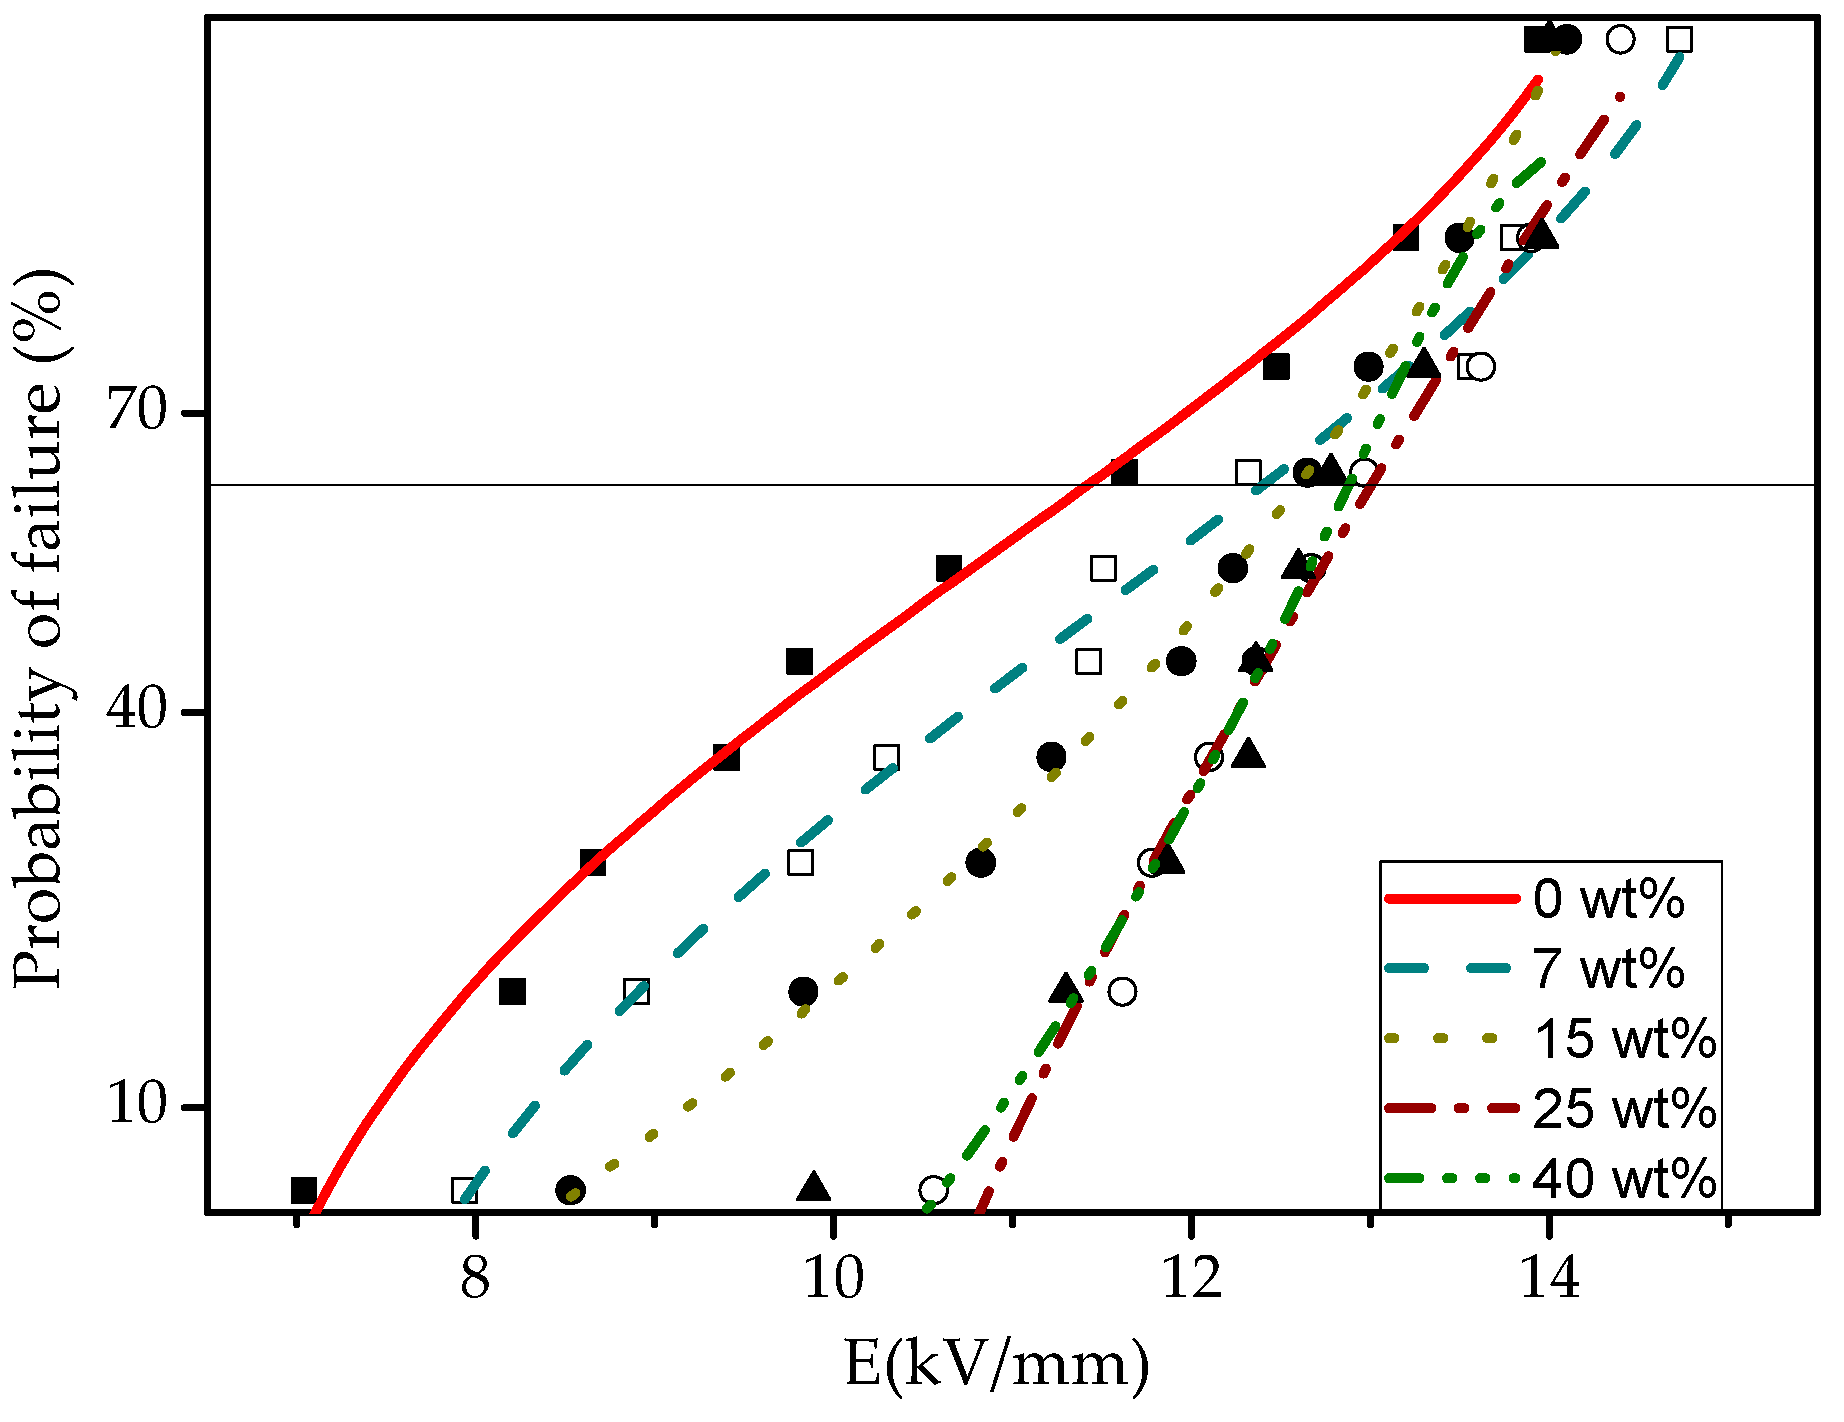
To demonstrate the improvements in electrical properties, the actual breakdown strength of the nanocomposites under power frequency voltage must be considered for further application in the power system. Figure 10 shows the Weibull distribution of the breakdown strength of the nanocomposites and the changes in their breakdown strength after incorporating tiny fillers. The nanocomposites with weight ratios of 0, 7, 15, 25, and 40 wt % at room temperature achieved a breakdown strength of 63.2% at 11.41, 12.40, 12.61, 13.02, and 12.88 kV/mm, respectively. The breakdown strength of the 25 wt % nanocomposites increased by 17% compared with the pure epoxy. Meanwhile, the breakdown strength of the 40 wt % nanocomposites slightly decreased, but additional experiments must be conducted to ascertain whether such strength reached the saturation level or the top point to start a declining trend. Furthermore, the increasing dielectric strength of the nanocomposites depends on a myriad of elements, among which the dispersion degree, average size, and interface reaction of the particles must be considered above the others. The morphology analysis reveals that the uniform dispersion and adequate size of particles can improve their electrical properties. The IR spectra analysis also shows a close affinity between the particles and the polymer host, which is vital in the prevention of defects along the interface. In line with quantum theory, the interaction between the polymer host and the particles can greatly distort the surrounding electric field and may play a more important role than the capture capability of the deep electron traps that have been formed during the curing period. The Schottky effect proved that the surface barrier potential gradually decreased along with an increasing electric field and that the field emission current density increased relatively.
By contrast, the molecular dissociation energy decreases along with an increasing dielectric constant, and the electron collision ionization under high voltage can increase the likelihood of an avalanche breakdown. Increasing the filler amount will produce a loose structure, reduce the conductance activation energy of ionic carriers, and increase the free volume. As a consequence, the ion mobility increases while the breakdown strength decreases. In sum, the breakdown strength of the nanocomposites essentially factors into the final judgment of whether the dielectric materials can be applied in the solid dielectric device. The breakdown strength of the nanocomposites gradually increases along with weight fraction, thereby demonstrating the feasibility for these materials, especially those with improved thermal conductivity and dielectric properties, to be used in the manufacture of some electrical equipment, such as dry-type transformers and solid insulated switchgear.
3.5. Surface Breakdown Tests of the Nanocomposites
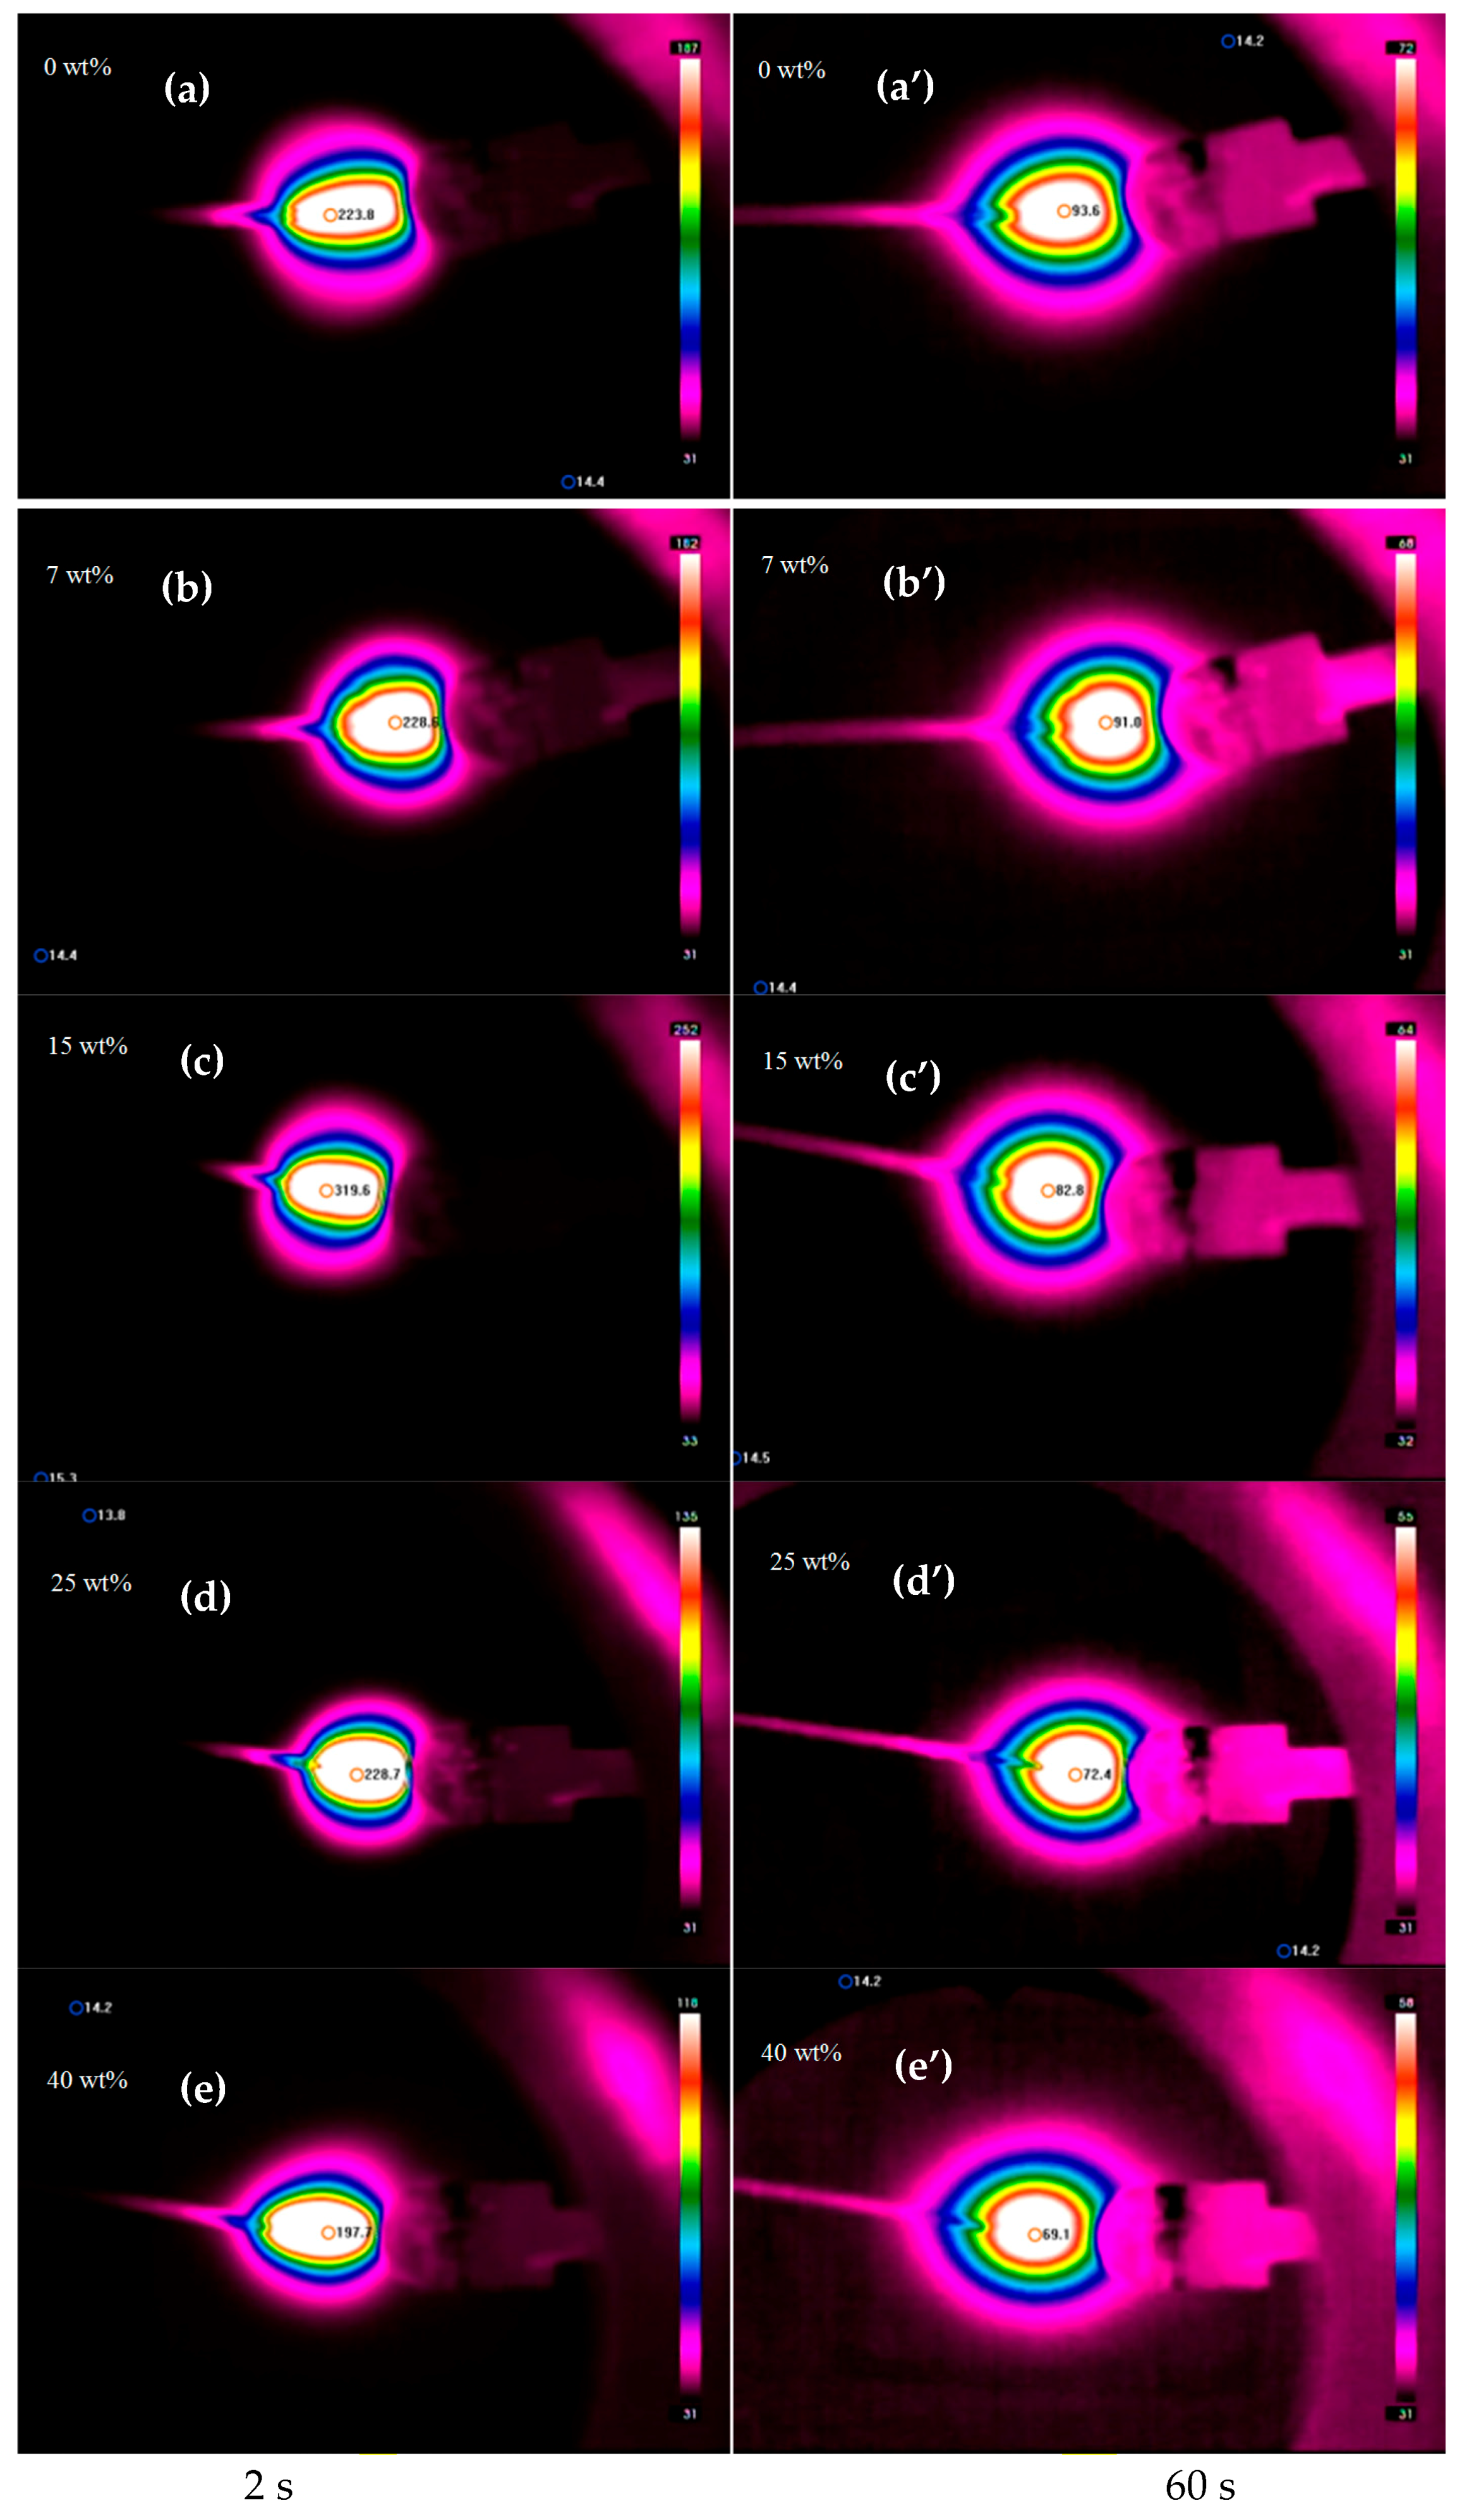
Surface breakdown tests were performed to check the improvements in the electrical and thermal properties of the novel nanocomposites. The breakdown experiments were performed in air by applying half-sine shock pulses with a positive edge time of 100 μs at 1 kHz frequency on needle-plate electrodes and at a constant distance of 6 mm on the surface of the samples. Figure 11 shows the infrared thermographs recorded on the surface of the nanocomposites after cutoff caused by a series of high voltages. Since the temperature exceeded 1000 °C when the gap was in the breakdown state, the thermographs 2 s later were chosen as the first one on record. The highest surface temperatures shown near the small red circle in every thermograph were recorded automatically every 3 s while the lowest temperature on the sample surfaces, or rather the room temperature was kept at about 14 °C as shown near the small blue circles against the dark background. Given that the temperature span scales differ across each test, one cannot easily determine the temperature changes for the nanocomposite samples with various weight fractions by merely looking at the colorful rings on the images. The low temperature color circles apparently grew thicker with time, thereby indicating the spread of heat.
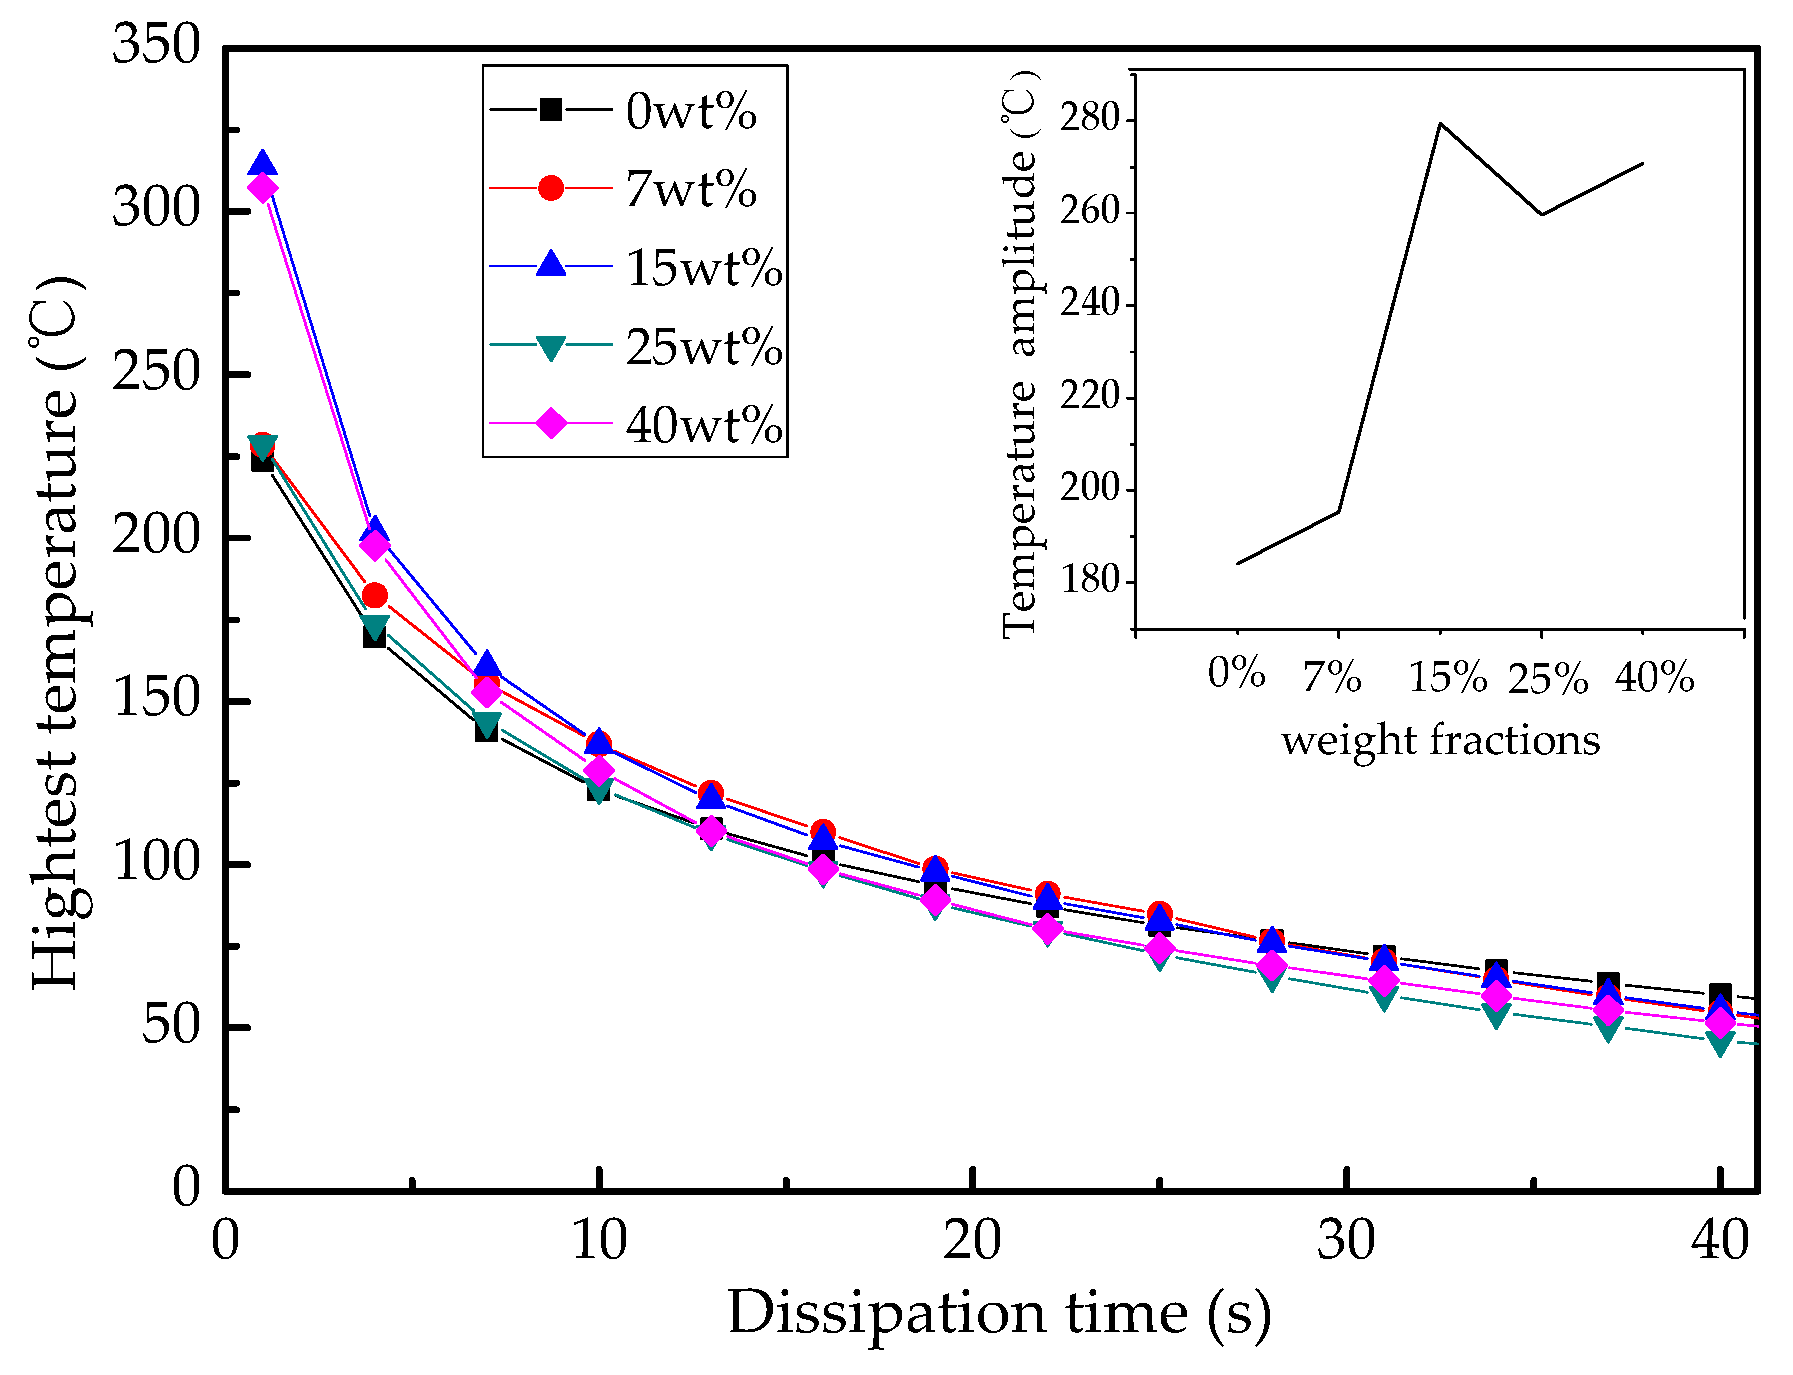
To compare the thermal conductivities of the nanocomposites and the pure epoxy, Figure 12 shows the highest temperature distribution curves that are recorded within 40 s. The highest temperature on the pure epoxy sample declined by 184.2 °C from 233.8 °C to 39.6 °C, and the nanocomposites with different mass ratios showed larger temperature decline amplitudes than the pure epoxy as shown in the inset. The temperature of the 7, 15, 25, and 40 wt % nanocomposites declined to 195.3, 279.4, 259.6, and 270.8 °C with temperature decline rates of 4.88, 6.99, 6.49, and 6.77 °C/s, respectively. The temperature decline rate of the 40 wt % nanocomposites was 47% higher than that of the pure epoxy, and such finding may be attributed to the high thermal conductivity of the nanocomposites. Under similar roughness and high-frequency voltage pulse, electron scattering effects are observed on the surface of the nanocomposites. The trapped space charge increases the electron jump time, thereby enhancing the breakdown strength of the nanocomposites.
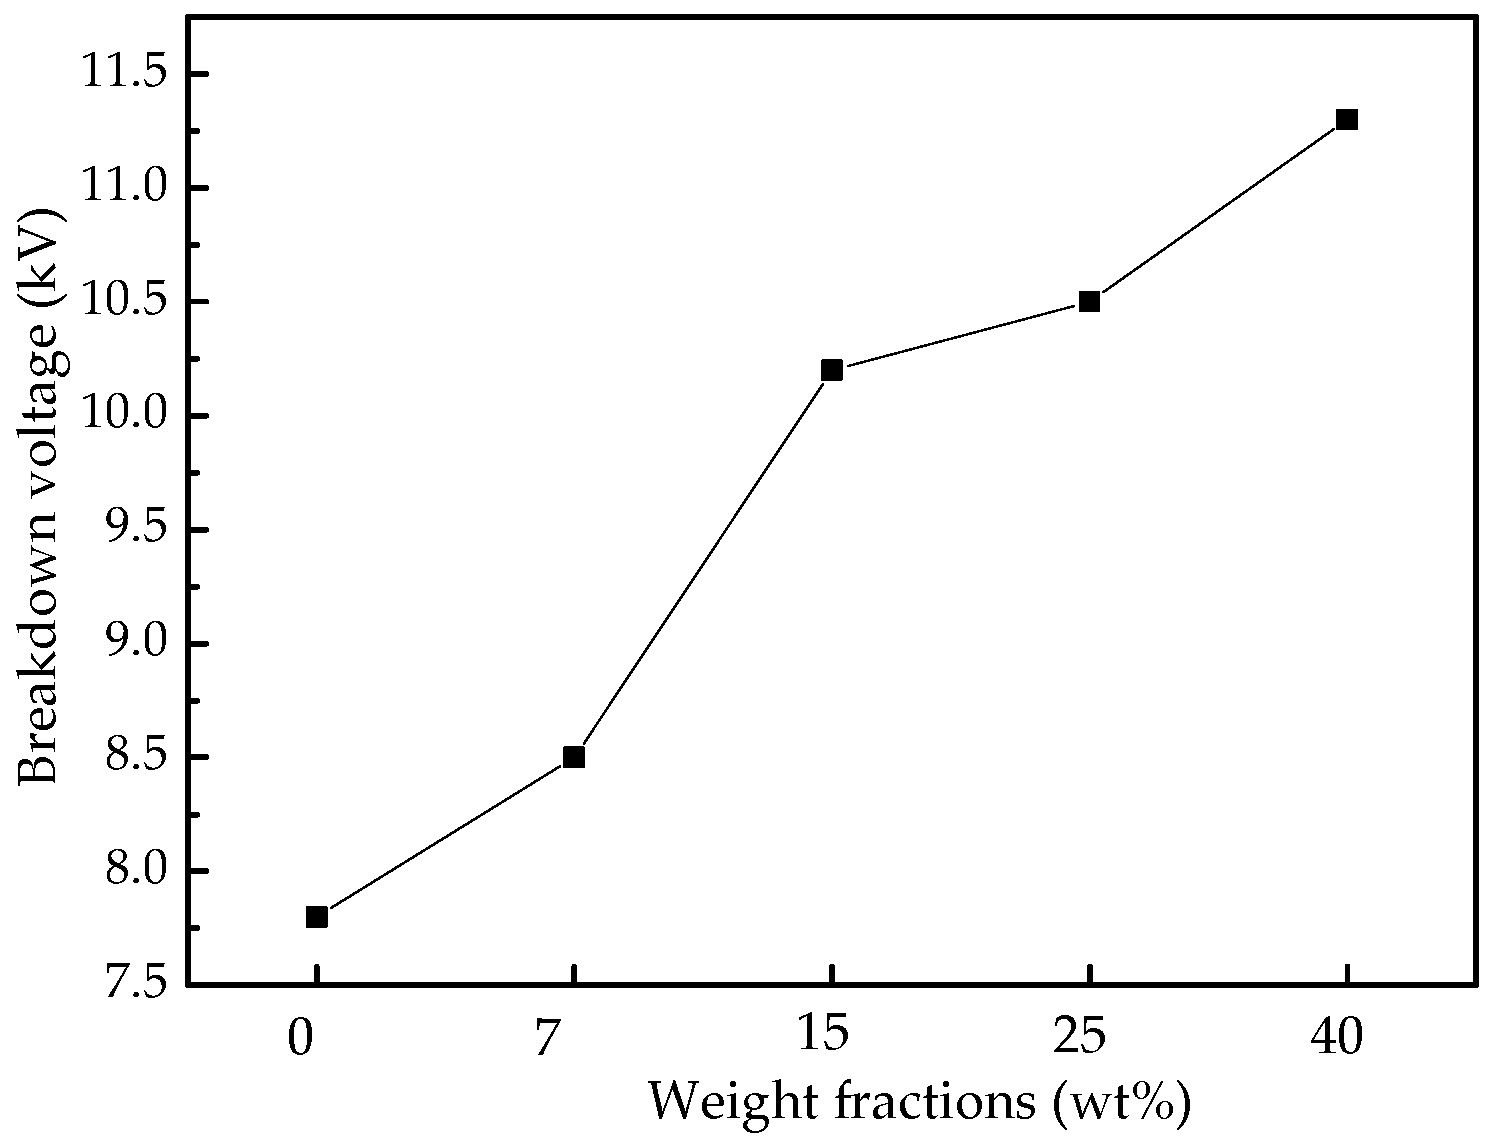
The surface breakdown voltage also increased along with the mass ratio under the same conditions. A 6 mm gap was punctured between the needle-plate electrodes on the pure epoxy surface at 7.6 kV and on the surface of the 40 wt % nanocomposites at 11.2 kV as shown in Figure 13. These findings directly demonstrate the improvements in the electrical and thermal properties of the nanocomposites and propose a prospective method for fabricating a novel epoxy dielectric device that can be applied in power systems that require an increasing voltage grade.
4. Conclusions
Nanocomposites made of epoxy resin and KH550-modified SrTiO3 particles were prepared in this work. The effects of particles on the thermal and electrical properties of these nanocomposites were studied. The following conclusions are drawn from the results:
- The uniformly-distributed nanocomposites exhibit an excellent thermal conductivity. The 40 wt % nanocomposites obtain a 0.52 W/m·K thermal conductivity, which is more than two times larger than that of the pure epoxy resin. The new nanocomposites provide an efficient heat transmission pathway to reduce the chances for a thermal breakdown to occur. The unique positive temperature coefficient characteristic of the particles, as well as the intimate connection between the particles and the epoxy host, may provide important explanations for the results.
- The dielectric constant of the nanocomposites increased along with their weight fractions and fit well with the calculated value from the Lichtenecher’s logarithmic mixture formula. The dielectric constant of the 40 wt % composites increased to 6.15, which was 44.7% higher than that of the pure epoxy resin. The relative dielectric loss tangent also increased along with frequency from 1 kHz to 1 MHz yet remained at a low level (approximately 0.02).
- The Weibull distribution shows that the breakdown strength at 63.2% probability of the 25 wt % nanocomposites increased by 17%. All nanocomposites showed a slightly higher breakdown strength, thereby preventing a potential decrease in breakdown strength after their amount of particles increases.
- The surface breakdown tests reveal that the surface breakdown voltage of the 40 wt % nanocomposites shows an increasing tendency. These composites also have a faster temperature decline rate (6.77 °C/s) compared with the pure epoxy resin. The 40 wt % nanocomposites and the pure epoxy resin had surface breakdown voltages of 11.2 kV and 7.6 kV, respectively.
- The novel dielectric material exhibits improvements in its thermal and dielectric properties. The corona resistance of the new nanocomposites warrants further investigation to explain the relationship between their thermal and electrical properties and to enhance their practical application in the manufacture of key electrical equipment, such as gas-insulated switchgear and efficient transformers.
Author Contributions
Xiaoxing Zhang, Song Xiao, and Hao Wen conceived and designed the experiments; Hao Wen, Xiaoyu Chen, and Yunjian Wu performed the experiments; Xiaoxing Zhang and Hao Wen analyzed the data; and Xiaoxing Zhang and Hao Wen wrote the paper.
Conflicts of Interest
The authors declare no conflicts of interest.
References
- Venkatesulu, B.; Thomas, M.J. Corona aging studies on silicone rubber nanocomposites. IEEE Trans. Dielectr. Electr. Insul. 2010, 17, 615–624. [Google Scholar] [CrossRef]
- Du, B.X.; Zhang, J.W.; Liu, Y. Effects of concentration on tracking failure of epoxy/TiO2 nanocomposites under DC voltage. IEEE Trans. Dielectr. Electr. Insul. 2012, 19, 1750–1759. [Google Scholar] [CrossRef]
- Nysten, B.; Gonry, P.; Issi, J.P. Intra-and inter-chain thermal conduction in polymers. Synth. Met. 1995, 69, 67–68. [Google Scholar] [CrossRef]
- Choy, C.L.; Young, K. Thermal conductivity of semicrystalline polymers-A model. Polymer 1977, 18, 769–776. [Google Scholar] [CrossRef]
- Kurabayashi, K. Anisotropic thermal properties of solid polymers. Int. J. Thermophys. 2001, 22, 277–288. [Google Scholar] [CrossRef]
- Zhou, W.Y.; Qi, S.H.; Zhao, H.Z.; Wang, C.; Kou, J. Effect of particle size of Al2O3 on the properties of filled thermal conductive silicone rubber. J. Appl. Polym. Sci. 2007, 104, 1312–1318. [Google Scholar] [CrossRef]
- Zhang, X.L.; Shen, L.Y.; Wu, H.; Guo, S. Enhanced thermally conductivity and mechanical properties of polyethylene(PE)/boron nitride(BN) composites through multistage stretching extrusion. Compos. Sci. Technol. 2013, 89, 24–28. [Google Scholar] [CrossRef]
- Lin, Z.Y.; Mcnamara, A.; Liu, Y.; Moon, K.S.; Wong, C.P. Exfoliated hexagonal boron nitride-based polymer nanocomposte with enhanced thermal conductivity for electronic encapsulation. Compos. Sci. Technol. 2014, 90, 123–128. [Google Scholar] [CrossRef]
- Zhou, W.Y.; Wang, C.F.; Ai, T.; Wu, K.; Zhao, F.; Gu, H. A novel fiber-reinforced polyethylene composite with added silicon nitride particles for enhanced thermal conductivity. Compos. Part A 2009, 40, 830–836. [Google Scholar] [CrossRef]
- Gu, J.W.; Zhang, Q.Y.; Dang, J.; Zhang, J.; Yang, Z. Thermal conductivity and mechanical properties of aluminum nitride filled linear low-density polyethylene composites. Polym. Eng. Sci. 2009, 49, 1030–1034. [Google Scholar] [CrossRef]
- Gojny, F.H.; Wichmann, M.H.G.; Fieder, B.; Kinloch, I.A.; Bauhofer, W.; Windle, A.H.; Schulte, K. Evaluation and identification of electrical and thermal conduction mechanism in carbon nanotube/epoxy composites. Polymer 2006, 47, 2036–2045. [Google Scholar] [CrossRef]
- Yu, J.H.; Huo, R.M.; Wu, C.; Wu, X.; Wang, G.; Jiang, P. Influence of interface structure on dielectric properties of epoxy/alumina nanocomposites. Macromol. Res. 2012, 20, 816–826. [Google Scholar] [CrossRef]
- Wang, T.T.; Li, W.P.; Luo, L.H.; Zhu, Y. Ultrahigh dielectric constant composites based on the oleic acid modified ferroferric oxide nanoparticles and polyvinylidene fluoride. Appl. Phys. Lett. 2013, 102. [Google Scholar] [CrossRef]
- Tang, H.X.; Sodano, H.A. High energy density nanocomposite capacitors using non-ferroelectric nanowires. Appl. Phys. Lett. 2013, 102. [Google Scholar] [CrossRef]
- Dang, Z.M.; Wang, H.Y.; Xu, H.P. Influence of silane coupling agent on morphology and dielectric property in BaTiO3/polyvinylidene fluoride composites. Appl. Phys. Lett. 2006, 89. [Google Scholar] [CrossRef]
- Balasubramanian, B.; Kraemer, K.L.; Reding, N.A.; Skomski, R.; Ducharme, S.; Sellmyer, D.J. Synthesis of monodisperse TiO2-paraffin core-shell nanoparticles for improved dielectric properties. ACS Nano 2010, 4, 1893–1900. [Google Scholar] [CrossRef] [PubMed]
- Balasubramanian, B.; Kraemer, K.L.; Valloppilly, S.R.; Ducharme, S.; Sellmyer, D.J. Cluster synthesis of monodisperse rutile-TiO2 nanoparticles and dielectric TiO2-vinylidene fluoride oligomer nanocomposites. Nanotechnology 2011, 22. [Google Scholar] [CrossRef] [PubMed]
- Wang, Y.; Fujinami, K.; Zhang, R.; Wang, N.; Ba, Y.; Koumoto, K. Interfacial thermal resistance and thermal conductivity in nanaograined SrTiO3. Appl. Phys. Express 2010, 3. [Google Scholar] [CrossRef]
- Seetawan, T.; Wong-ud-dee, G.; Thanachayanont, C.; Amornkitbumrung, V. Molecular dynamics simulation of strontium titanate. Chin. Phys. Lett. 2010, 27, 217–219. [Google Scholar] [CrossRef]
- Kim, P.; Jones, S.C.; Hotchkiss, P.J.; Haddock, J.N.; Kippelen, B.; Marder, S.R.; Perry, J.W. Phosphonic acid-modified barium titanate polymer nanocomposites with high permittivity and dielectric strength. Adv. Mater. 2010, 19, 1001–1005. [Google Scholar] [CrossRef]
- Chon, J.; Ye, S.; Cha, K.J.; Lee, S.C.; Koo, Y.S.; Jung, J.H.; Kwon, Y.K. High-k dielectric sol-gel hybrid materials containing barium titanate nanocomposites. Chem. Mater. 2010, 22, 5445–5452. [Google Scholar] [CrossRef]
- Li, J.; Claude, J.; Norena-Franco, L.E.; Seok, S.I.; Wang, Q. Electrical energy storage in ferroelectric polymer nanocomposites containing surface-functionalized BaTiO3 nanoparticles. Chem. Mater. 2008, 20, 6304–6306. [Google Scholar] [CrossRef]
- Tang, H.X.; Lin, Y.R.; Sodano, H.A. Synthesis of high aspect ratio BaTiO3 nanowires for high energy density nanocomposite capacitors. Adv. Energy Mater. 2013, 3, 451–456. [Google Scholar] [CrossRef]
- Beier, C.W.; Cuevas, M.A.; Brutchey, R.L. Effect of surface modification on the dielectric properties of BaTiO3 nanocrystals. Langmuir 2010, 26, 5067–5071. [Google Scholar] [CrossRef] [PubMed]
- Yu, K.; Wang, H.; Zhou, Y.C.; Bai, Y.; Niu, Y. Enhanced dielectric properties of BaTiO3/poly(vinylidene fluoride) nanocomposites for energy storage applications. J. Appl. Phys. 2013, 113. [Google Scholar] [CrossRef]
- Xie, L.Y.; Huang, X.Y.; Yang, K.; Li, S.; Jiang, P. “Grafting to” route to PVDF-HFP-GMA/BaTiO3 nanocomposites with high dielectric constant and high thermal conductivity for energy storage and thermal management application. J. Mater. Chem. A 2014, 2, 5244–5251. [Google Scholar] [CrossRef]
- Zhang, X.X.; Wen, H.; Chen, X.X.; Wu, Y. Improving electrical properties of SrTiO3/epoxy nanocomposites with high thermal conductivity. In Proceedings of the 2016 IEEE International Conference on High Voltage Engineering and Application (ICHVE), Chengdu, China, 19–22 September 2016. [Google Scholar]
- Zhou, Q.Z.; Vilarinho, P.M.; Baptista, J.L. Dielectric properties of bismuth doped Ba1−xSrxTiO3 ceramics. J. Eur. Ceram. Soc. 2001, 21, 531–534. [Google Scholar] [CrossRef]
- Chen, W.P.; Zhu, Q.A. Synthesis of barium strontium titanate nanorods in reverse microemulsion. Mater. Lett. 2007, 61, 3378–3380. [Google Scholar] [CrossRef]
- Uvarov, N.F. Estimation of composites conductivity using a general mixing rule. Solid State Ion. 2000, 136–137, 1267–1272. [Google Scholar] [CrossRef]
Figure 1.
Schematic of the surface treatment of SrTiO3 nanoparticles.

Figure 2.
Schematic diagram of the platform for the surface breakdown tests. (a) Top view of sample; and (b) infrared thermograph platform for the surface breakdown tests under pulse power.
Figure 2.
Schematic diagram of the platform for the surface breakdown tests. (a) Top view of sample; and (b) infrared thermograph platform for the surface breakdown tests under pulse power.

Figure 3.
TEM image of the modified SrTiO3 nanoparticles.

Figure 4.
FT-IR spectra of (a) 40 wt % nanocomposite, and (b) the cured epoxy resin.
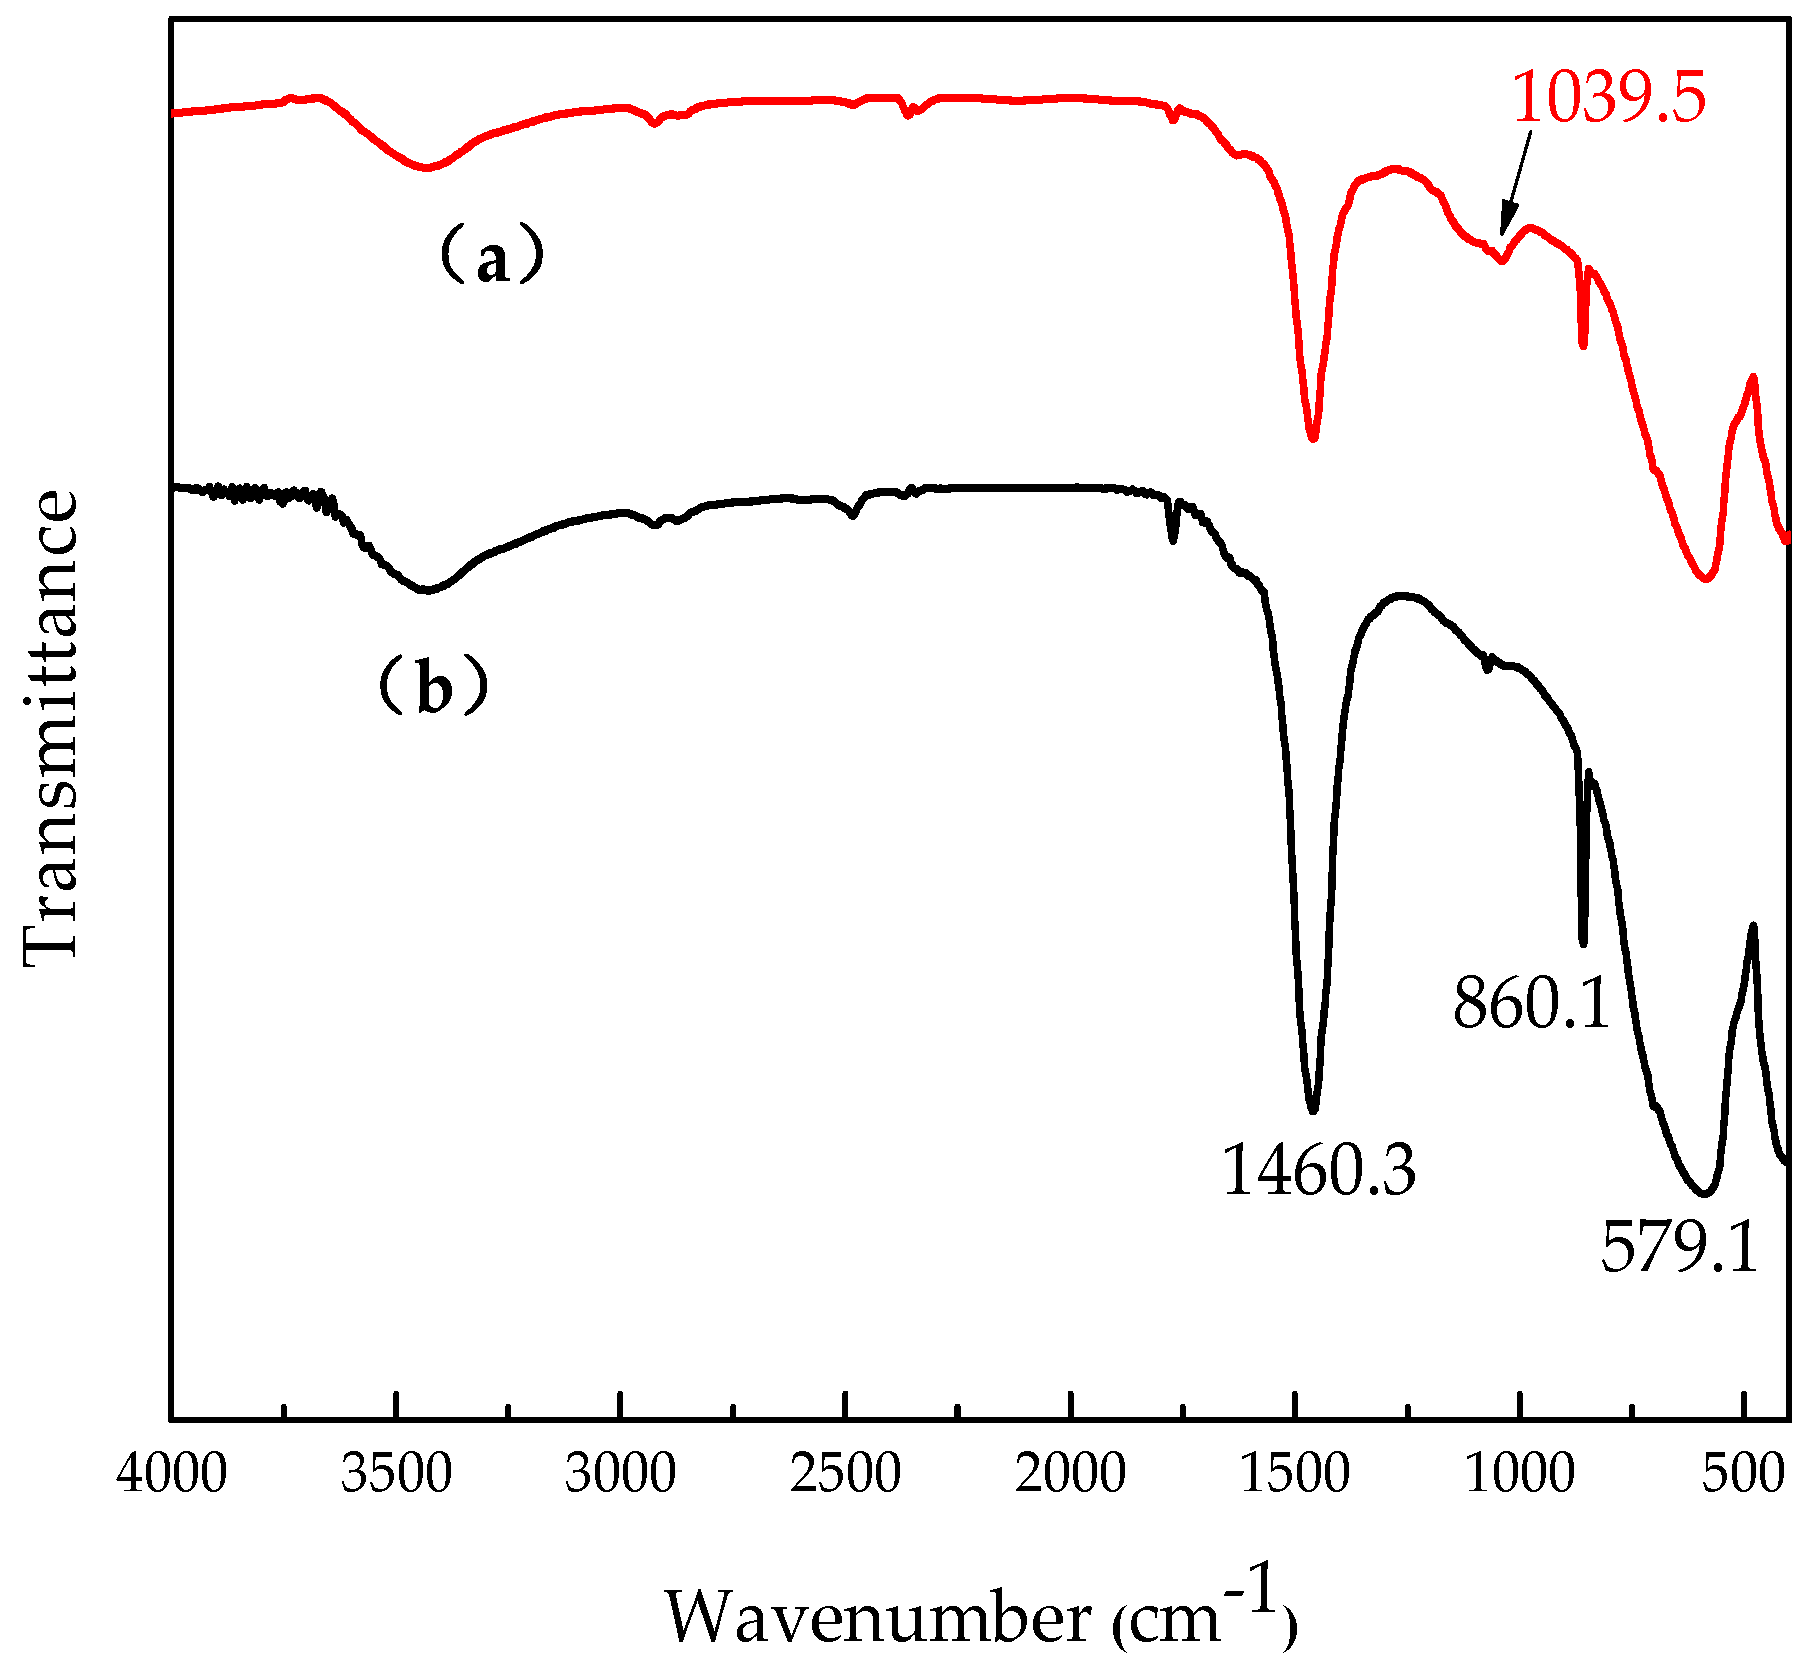
Figure 5.
Cross-sectional SEM images of the nanocomposites with different weight fractions. (a) 0 wt %; (b) 7 wt %; (c) 15 wt %; (d) 25 wt %; and (e) 40 wt %. All bars are 20 μm.
Figure 5.
Cross-sectional SEM images of the nanocomposites with different weight fractions. (a) 0 wt %; (b) 7 wt %; (c) 15 wt %; (d) 25 wt %; and (e) 40 wt %. All bars are 20 μm.

Figure 6.
Thermal conductivity of SrTiO3/epoxy composites with different weight fractions at 25 °C.
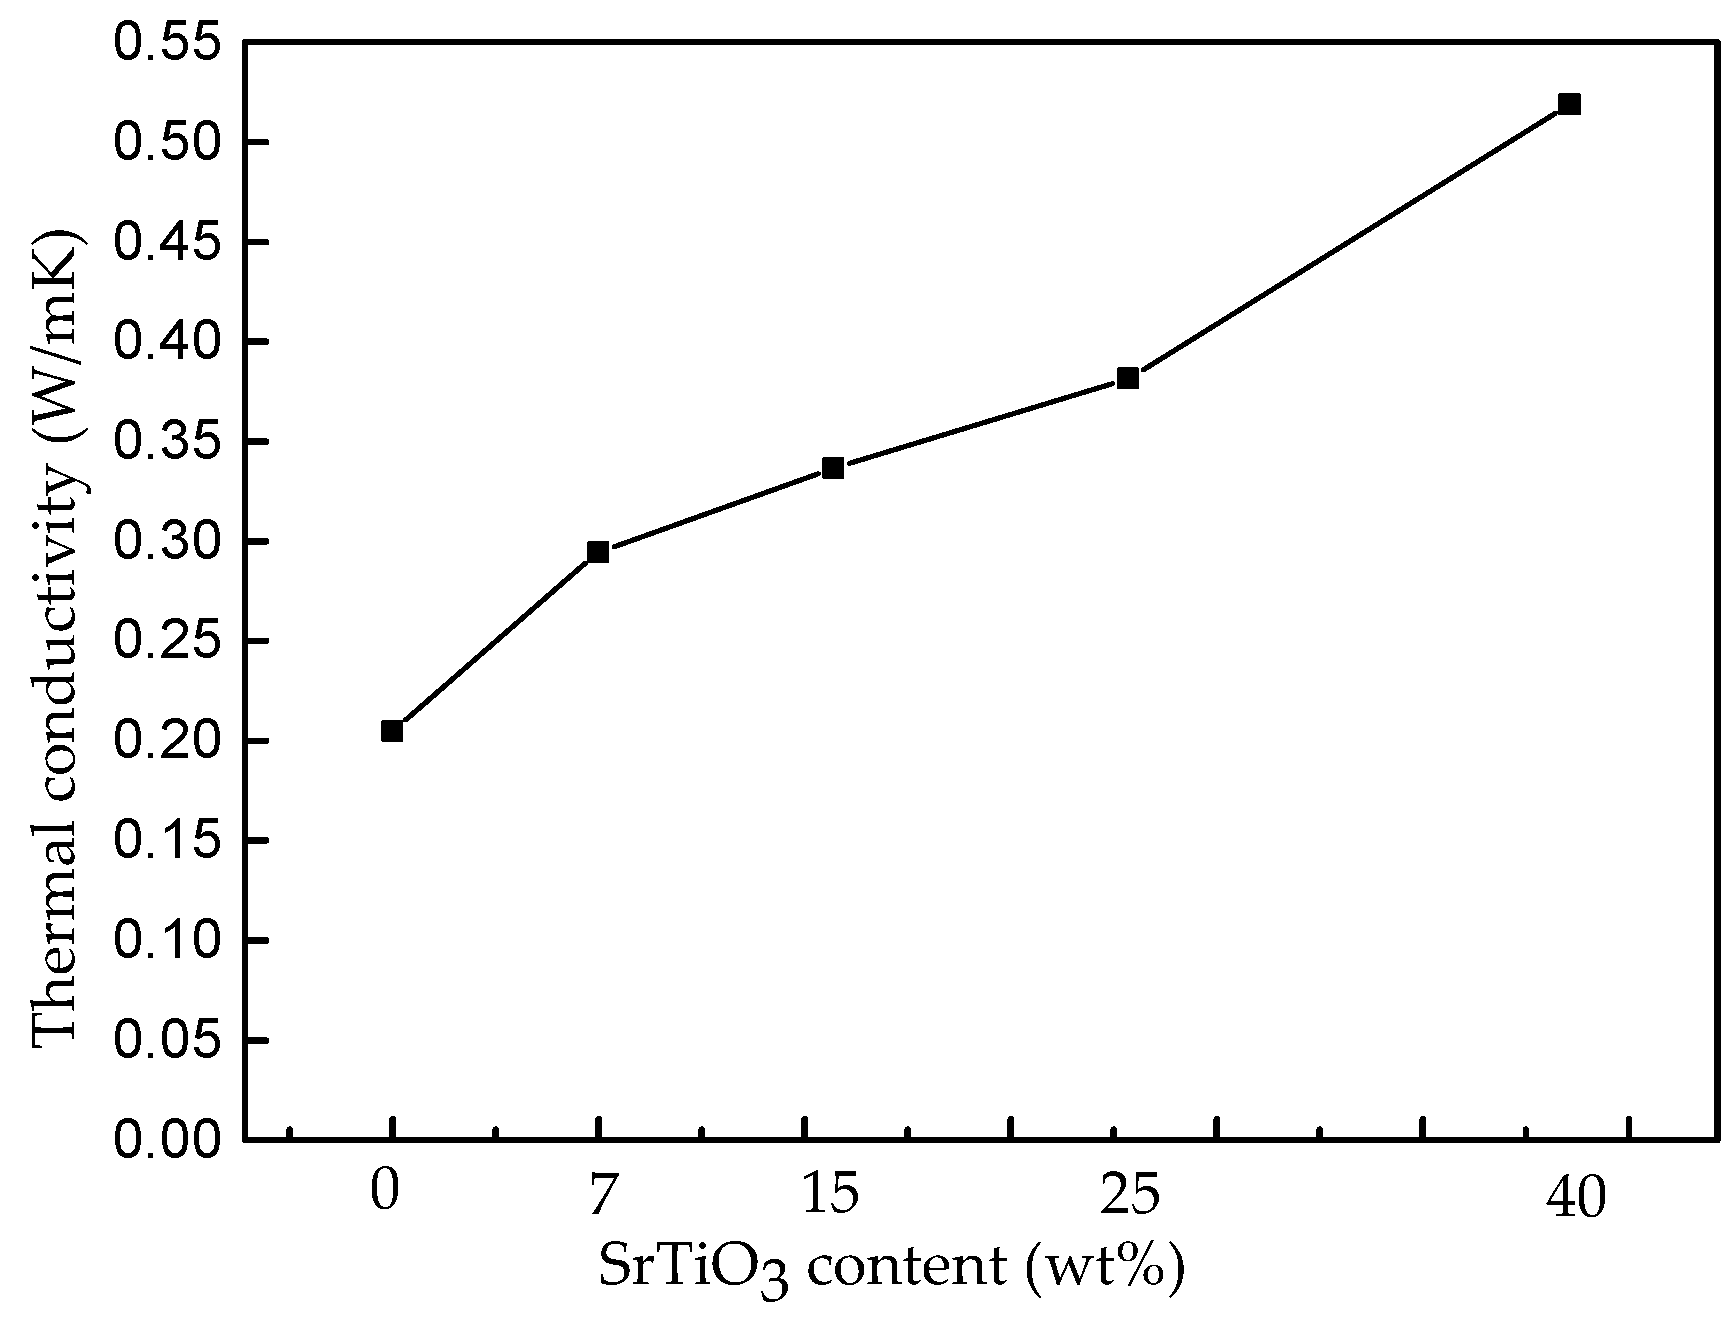
Figure 7.
TG-DSC test of the pure epoxy and nanocomposites in air. (a) 0 wt %; (b) 7 wt %; (c) 15 wt %; (d) 25 wt %; and (e) 40 wt %.
Figure 7.
TG-DSC test of the pure epoxy and nanocomposites in air. (a) 0 wt %; (b) 7 wt %; (c) 15 wt %; (d) 25 wt %; and (e) 40 wt %.

Figure 8.
(a) The frequency-dependent dielectric constant and (b) the dielectric loss tangent of the pure epoxy resin (■) and the 7 (●), 15 (▲), 25 (▼), and 40 wt % (◀) composites at room temperature.
Figure 8.
(a) The frequency-dependent dielectric constant and (b) the dielectric loss tangent of the pure epoxy resin (■) and the 7 (●), 15 (▲), 25 (▼), and 40 wt % (◀) composites at room temperature.

Figure 9.
The temperature-dependent dielectric constant (a) and the dielectric loss tangent (b) of the pure epoxy resin (■) and the 7 (●), 15 (▲), 25 (▼), and 40 wt % (◀) composites at 1 kHz at room temperature.
Figure 9.
The temperature-dependent dielectric constant (a) and the dielectric loss tangent (b) of the pure epoxy resin (■) and the 7 (●), 15 (▲), 25 (▼), and 40 wt % (◀) composites at 1 kHz at room temperature.

Figure 10.
Weibull plot of the breakdown strength of the epoxy nanocomposites with different weight fractions of SrTiO3 particles.
Figure 10.
Weibull plot of the breakdown strength of the epoxy nanocomposites with different weight fractions of SrTiO3 particles.

Figure 11.
Infrared thermographs on the surface of the front side samples of nanocomposites with different weight fractions recorded 60 s after breakdown. (a–e): infrared thermographs 2 s after breakdown; (a′–e′): infrared thermographs 60 s after breakdown.
Figure 11.
Infrared thermographs on the surface of the front side samples of nanocomposites with different weight fractions recorded 60 s after breakdown. (a–e): infrared thermographs 2 s after breakdown; (a′–e′): infrared thermographs 60 s after breakdown.

Figure 12.
The highest temperature distribution on the surface of the front side samples recorded 40 s after breakdown.
Figure 12.
The highest temperature distribution on the surface of the front side samples recorded 40 s after breakdown.

Figure 13.
Surface breakdown voltage of nanocomposites with different weight fractions.


Table 1.
Dependencies of dielectric constants on volume fractions based on Lichtenecker’s logarithmic mixture formula compared with the measured values.
Table 1.
Dependencies of dielectric constants on volume fractions based on Lichtenecker’s logarithmic mixture formula compared with the measured values.
| Samples | Measured Value at 1 kHz | Calculated Value at 1 kHz | Measured Value at 100 kHz | Calculated Value at 100 kHz |
|---|---|---|---|---|
| 7 wt %→1.72 vol % | 4.65 | 4.55 | 4.46 | 4.37 |
| 15 wt %→3.95 vol % | 4.75 | 4.98 | 4.56 | 4.79 |
| 25 wt %→7.20 vol % | 5.51 | 5.69 | 5.25 | 5.48 |
| 40 wt %→13.44 vol % | 6.15 | 7.33 | 5.81 | 7.08 |
© 2017 by the authors. Licensee MDPI, Basel, Switzerland. This article is an open access article distributed under the terms and conditions of the Creative Commons Attribution (CC BY) license (http://creativecommons.org/licenses/by/4.0/).
Share and Cite
MDPI and ACS Style
Zhang, X.; Wen, H.; Chen, X.; Wu, Y.; Xiao, S. Study on the Thermal and Dielectric Properties of SrTiO3/Epoxy Nanocomposites. Energies 2017, 10, 692. https://doi.org/10.3390/en10050692
AMA Style
Zhang X, Wen H, Chen X, Wu Y, Xiao S. Study on the Thermal and Dielectric Properties of SrTiO3/Epoxy Nanocomposites. Energies. 2017; 10(5):692. https://doi.org/10.3390/en10050692
Chicago/Turabian StyleZhang, Xiaoxing, Hao Wen, Xiaoyu Chen, Yunjian Wu, and Song Xiao. 2017. "Study on the Thermal and Dielectric Properties of SrTiO3/Epoxy Nanocomposites" Energies 10, no. 5: 692. https://doi.org/10.3390/en10050692
Note that from the first issue of 2016, this journal uses article numbers instead of page numbers. See further details here.