Article

The Potential of Thermal Plasma Gasification of Olive Pomace Charcoal

by
Andrius Tamošiūnas
1,*,
Ajmia Chouchène
2,
Pranas Valatkevičius
1,
Dovilė Gimžauskaitė
1,
Mindaugas Aikas
1,
Rolandas Uscila
1,
Makrem Ghorbel
3 and
Mejdi Jeguirim
4
1
Plasma Processing Laboratory, Lithuanian Energy Institute, Breslaujos str. 3, LT-44403 Kaunas, Lithuania
2
Institut Supérieur des Sciences et Technologies de l'Environnement, Technopole de Borj-Cedria B.P. 95, 2050 Hammam-Lif, Tunisia
3
OliveCoal, ZI El Jem, 5160 Mahdia BP69, Tunisia
4
Institut de Sciences des Matériaux de Mulhouse, Universite de Haute-Alsace, 15 rue Jean Starcky, 68057 Mulhouse CEDEX, France
*
Author to whom correspondence should be addressed.
Energies 2017, 10(5), 710; https://doi.org/10.3390/en10050710
Submission received: 15 March 2017 / Revised: 19 April 2017 / Accepted: 9 May 2017 / Published: 17 May 2017
(This article belongs to the Special Issue Biomass Chars: Elaboration, Characterization and Applications)

Abstract

:
Annually, the olive oil industry generates a significant amount of by-products, such as olive pomace, olive husks, tree prunings, leaves, pits, and branches. Therefore, the recovery of these residues has become a major challenge in Mediterranean countries. The utilization of olive industry residues has received much attention in recent years, especially for energy purposes. Accordingly, this primary experimental study aims at investigating the potential of olive biomass waste for energy recovery in terms of synthesis gas (or syngas) production using the thermal arc plasma gasification method. The olive charcoal made from the exhausted olive solid waste (olive pomace) was chosen as a reference material for primary experiments with known composition from the performed proximate and ultimate analysis. The experiments were carried out at various operational parameters: raw biomass and water vapour flow rates and the plasma generator power. The producer gas involved principally CO, H2, and CO2 with the highest concentrations of 41.17%, 13.06%, and 13.48%, respectively. The produced synthesis gas has a lower heating value of 6.09 MJ/nm3 at the H2O/C ratio of 3.15 and the plasma torch had a power of 52.2 kW.

1. Introduction

Currently, significant quantities of raw biomasses are found in waste streams in the European Union (EU). In 2014, economic activities and households generated approximately 2.6 billion tonnes of wastes in the EU [1]. Recent developments show that additional improvement on resource efficiency is possible, which can lead to significant environmental, economic, and social benefits. Therefore, converting waste into useful products is a key objective to obtain various benefits, including a reduction of greenhouse gas emissions and job creation [2].
The olive oil industry has been mainly concentrated in the Mediterranean region, where a very large amount of waste, such as olive pomace, olive husks, tree prunings, leaves, pits, and branches are being generated annually. Spain, Italy, Greece, Turkey, Tunisia, Portugal, Syria, and Morocco are the major olive oil producers worldwide [3]. The EU produced 69%, and exported 65%, of the world’s olive oil in the last five years [4]. Consequently, the estimated quantities of wastes derived from the olive oil industry in the EU accounts for 6.8 million tons/year with a promising energy content of around 18 MJ/kg [5,6].
There are several waste-to-energy conversion pathways into useful products depending on the waste/biomass characteristics and the requirement of the end product and its applications [7,8,9,10]. Regarding physicochemical conversion, such as extraction and esterification of biomass to vegetable oil or biodiesel production, biochemical conversion and thermochemical conversion methods have also been extensively applied. Biochemical methods allow the biomass/waste conversion into liquid or gaseous fuels by anaerobic digestion or fermentation with a final primary product of methane or ethanol, respectively. Thermochemical conversion methods include pyrolysis, liquefaction, combustion, and gasification. Although biomass/waste combustion is the main applied process, the overall efficiency of heat production is low. Among all four methods, gasification has been considered to be a more attractive process to exploit the energy from renewable and non-renewable solid biomass with a lower content of moisture when compared to liquefaction at a higher conversion efficiency. The method can be applied not only for direct generation of heat and electricity but also for generation of transportation fuels and chemicals by using low-value feedstocks.
The investigation of olive industry waste feedstock utilization into electrical and thermal power, as well as biogas, biofuels, and synthesis fuels, both by biochemical and thermochemical means, has been extensively studied in [5,6,11,12,13,14,15,16,17,18,19,20,21]. Recently, thermal plasma has attracted the attention as a state of the art waste-to-energy method, showing a better environmental performance over conventional waste treatment technologies in terms of life cycle assessment, as well as process efficiency [22]. Plasma methods can handle not only biomass, but also harmful/toxic wastes, which can be completely converted into products having considerable amounts of useful energy content. In general, plasma, which consists of charged (electrons, ions) and neutral particles, is defined as the fourth state of matter. Depending on the species temperature, plasma can be classified as a high-temperature plasma (fusion plasma) or a low-temperature plasma (gas discharges). The latter group of plasma is the subject of interest of this paper. Low-temperature plasmas, typically related to the pressure, can be classified into thermal plasma, which is in thermal equilibrium (all of the species—electrons, ions, neutrals—are at the same temperature, Te = Ti = Tgas), and cold plasma, which is described by a non-equilibrium state (where the electron temperature is much higher than the ion and neutral gas species, Te > Ti > Tgas) [23,24,25].
Thermal plasma gasification process is an allothermal process that requires an external source of power to heat up and sustain high temperatures. However, conventional autothermal gasification has some limitations related to energy efficiency, material yield, syngas purity, compactness, dynamic response and flexibility that might be overcome by plasma utilization [26]. From the chemical point of view, the thermal plasma can significantly contribute to the gasification by enhancing the reaction kinetics due to the generation of active radicals within the plasma medium and improving high-temperature cracking of tars in the generated gas (syngas). From the thermal aspect, enthalpy provided by the plasma can easily be controlled by adjusting the electrical power of the source delivered to the system, thus making the process independent, contrary to the autothermal gasification process. Therefore, numerous investigations have been performed by utilizing thermal plasmas (direct current (DC), microwave (MW), radio frequency (RF)) for biomass/waste treatment to value-added secondary products, such as synthesis gas, hydrogen, biofuels, chemicals, etc. [27,28,29,30,31,32,33].
The purpose of the present experimental investigation was to evaluate, for the first time, the potential of olive biomass waste for energy recovery in terms of synthesis gas, or syngas, production using the thermal arc plasma gasification method. The olive charcoal derived from the exhausted olive solid waste (EOSW) (olive pomace) was chosen as a reference material for primary experiments. A DC plasma torch was used as a source for high-temperature, enthalpy, and active radical generation. Water vapour was used as a main gas to form the plasma. The experiments were carried out at the various operational parameters: treated material flow rate, water vapour flow rate, and power of the plasma torch.

2. Materials and Methods

2.1. Raw Material

The exhausted olive solid waste was used as a feedstock for charcoal production. This residue was provided by the Zouila factory from the region of Mahdia (Tunisia). The exhausted olive solid waste was the solid by-product obtained after the extraction of the residual oil using hexane as a solvent. It includes basically pulp, skin, and stone. The ultimate analyses of olive pomace are shown in Table 1 and compared with available data from the literature for other lignocellulosic biomass.

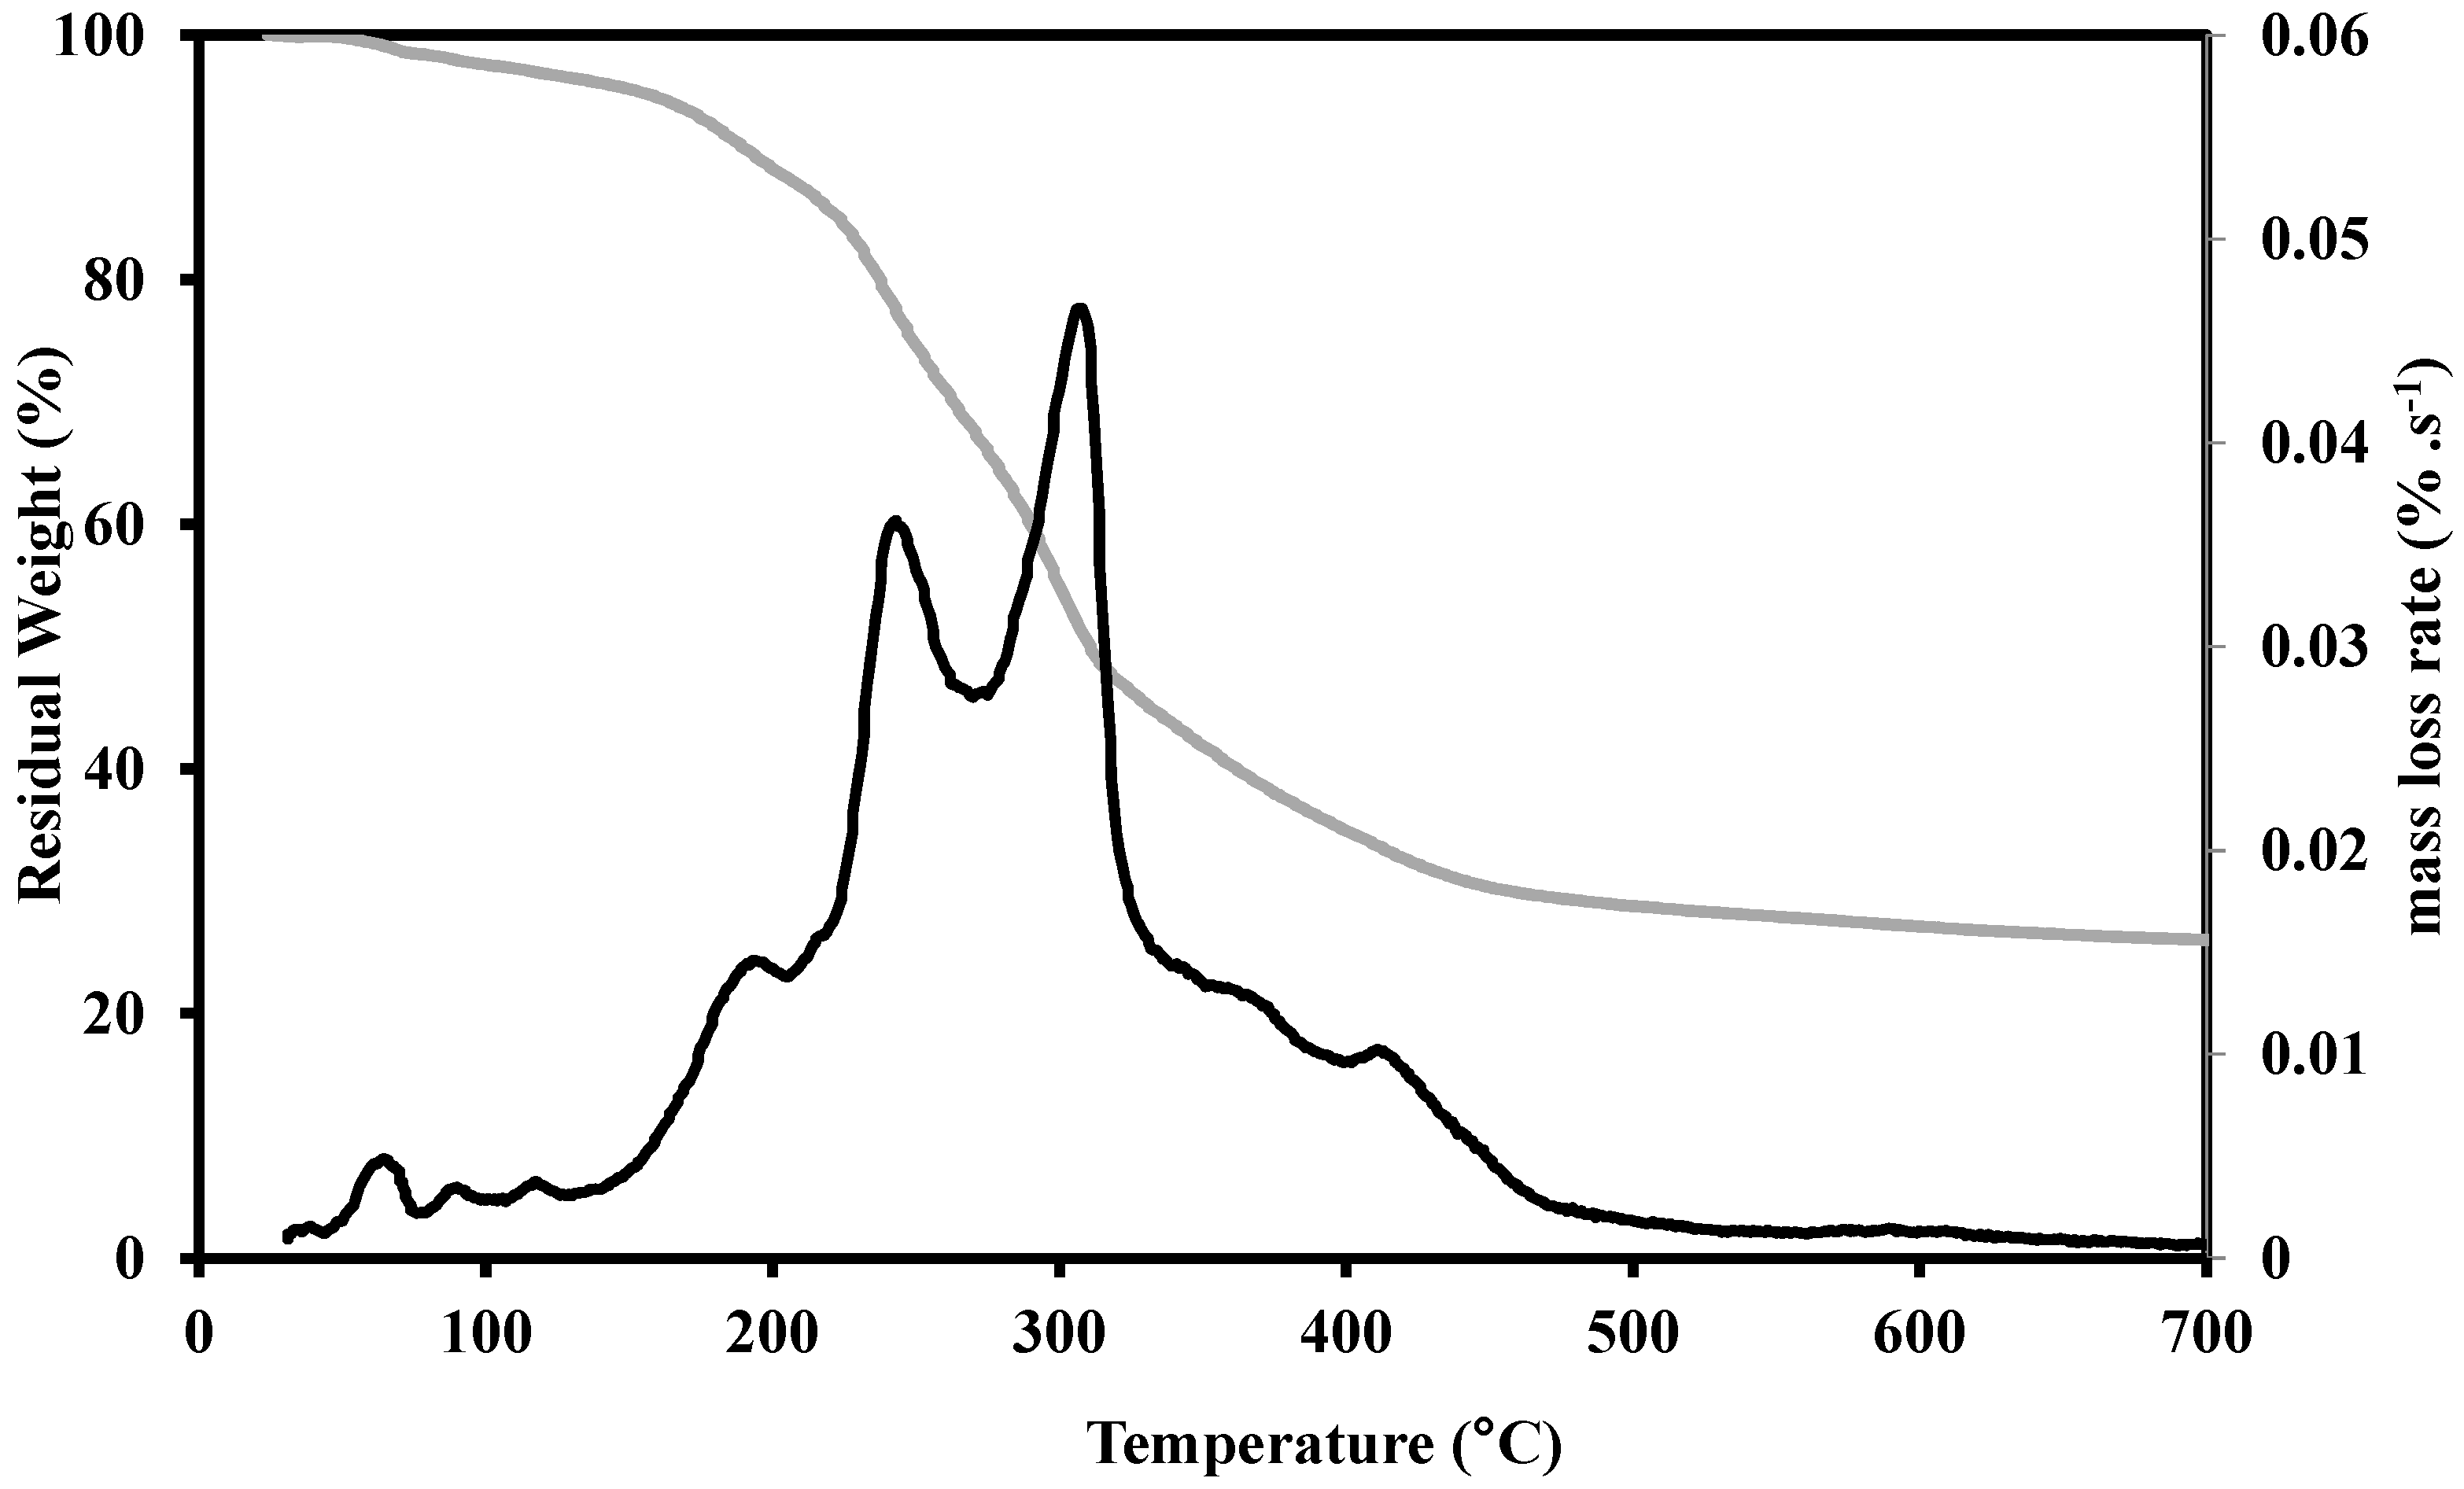
2.1.1. Thermogravimetric Study

Thermogravimetric analysis was carried out using a Mettler-Toledo TGA/DSC3+ (Mettler-Toledo Pte Ltd., Cresent, Singapore). Before each test, 10 mg of olive pomace was put in an alumina crucible. TGA experiments were performed under nitrogen atmosphere of 100 mL/min flow rate at heating rates of 5 °C/min from room temperature to 800 °C. Figure 1 shows the thermogravimetry (TG) and derivative thermogravimetry (DTG) curves obtained during the pyrolysis of olive pomace pyrolysis.
According to this figure, pyrolysis occurs in two noticeable steps: the first step is attributed to the devolatilization. This took place between 150 °C and 340 °C. This step corresponds to the volatile matter removal and the char formation. In this range, two maximum weight loss rates were observed at 244 °C and 312 °C, respectively. These peaks are attributed to hemicellulose and cellulose degradation. At 190 °C, a slight maximum weight loss rate is shown. This can contribute to the earlier decomposition of lignin. Several researchers have found similar thermal profiles [38,39,40,41]. During the first step of pyrolysis, the chemical bonds in the three major constituents of olive pomace, namely cellulose, hemicellulose, and lignin, are thermally cracked. The second pyrolysis step of olive pomace happens in the range of 340–450 °C. During this step, various parallel and serial reactions occur either homogeneously or heterogeneously. These reactions include dehydration, cracking, reforming, condensation, polymerization, oxidation, and gasification reactions [39].
Residual mass at 450 °C is about 30.33% of the initial mass for the olive pomace. Based on the thermogravimetric analysis, pyrolysis experiments at a large scale were conducted at 450 °C in order to prepare the olive pomace charcoal for plasma gasification. The impact of heating rates and particle size were studied by the authors previously in [42].

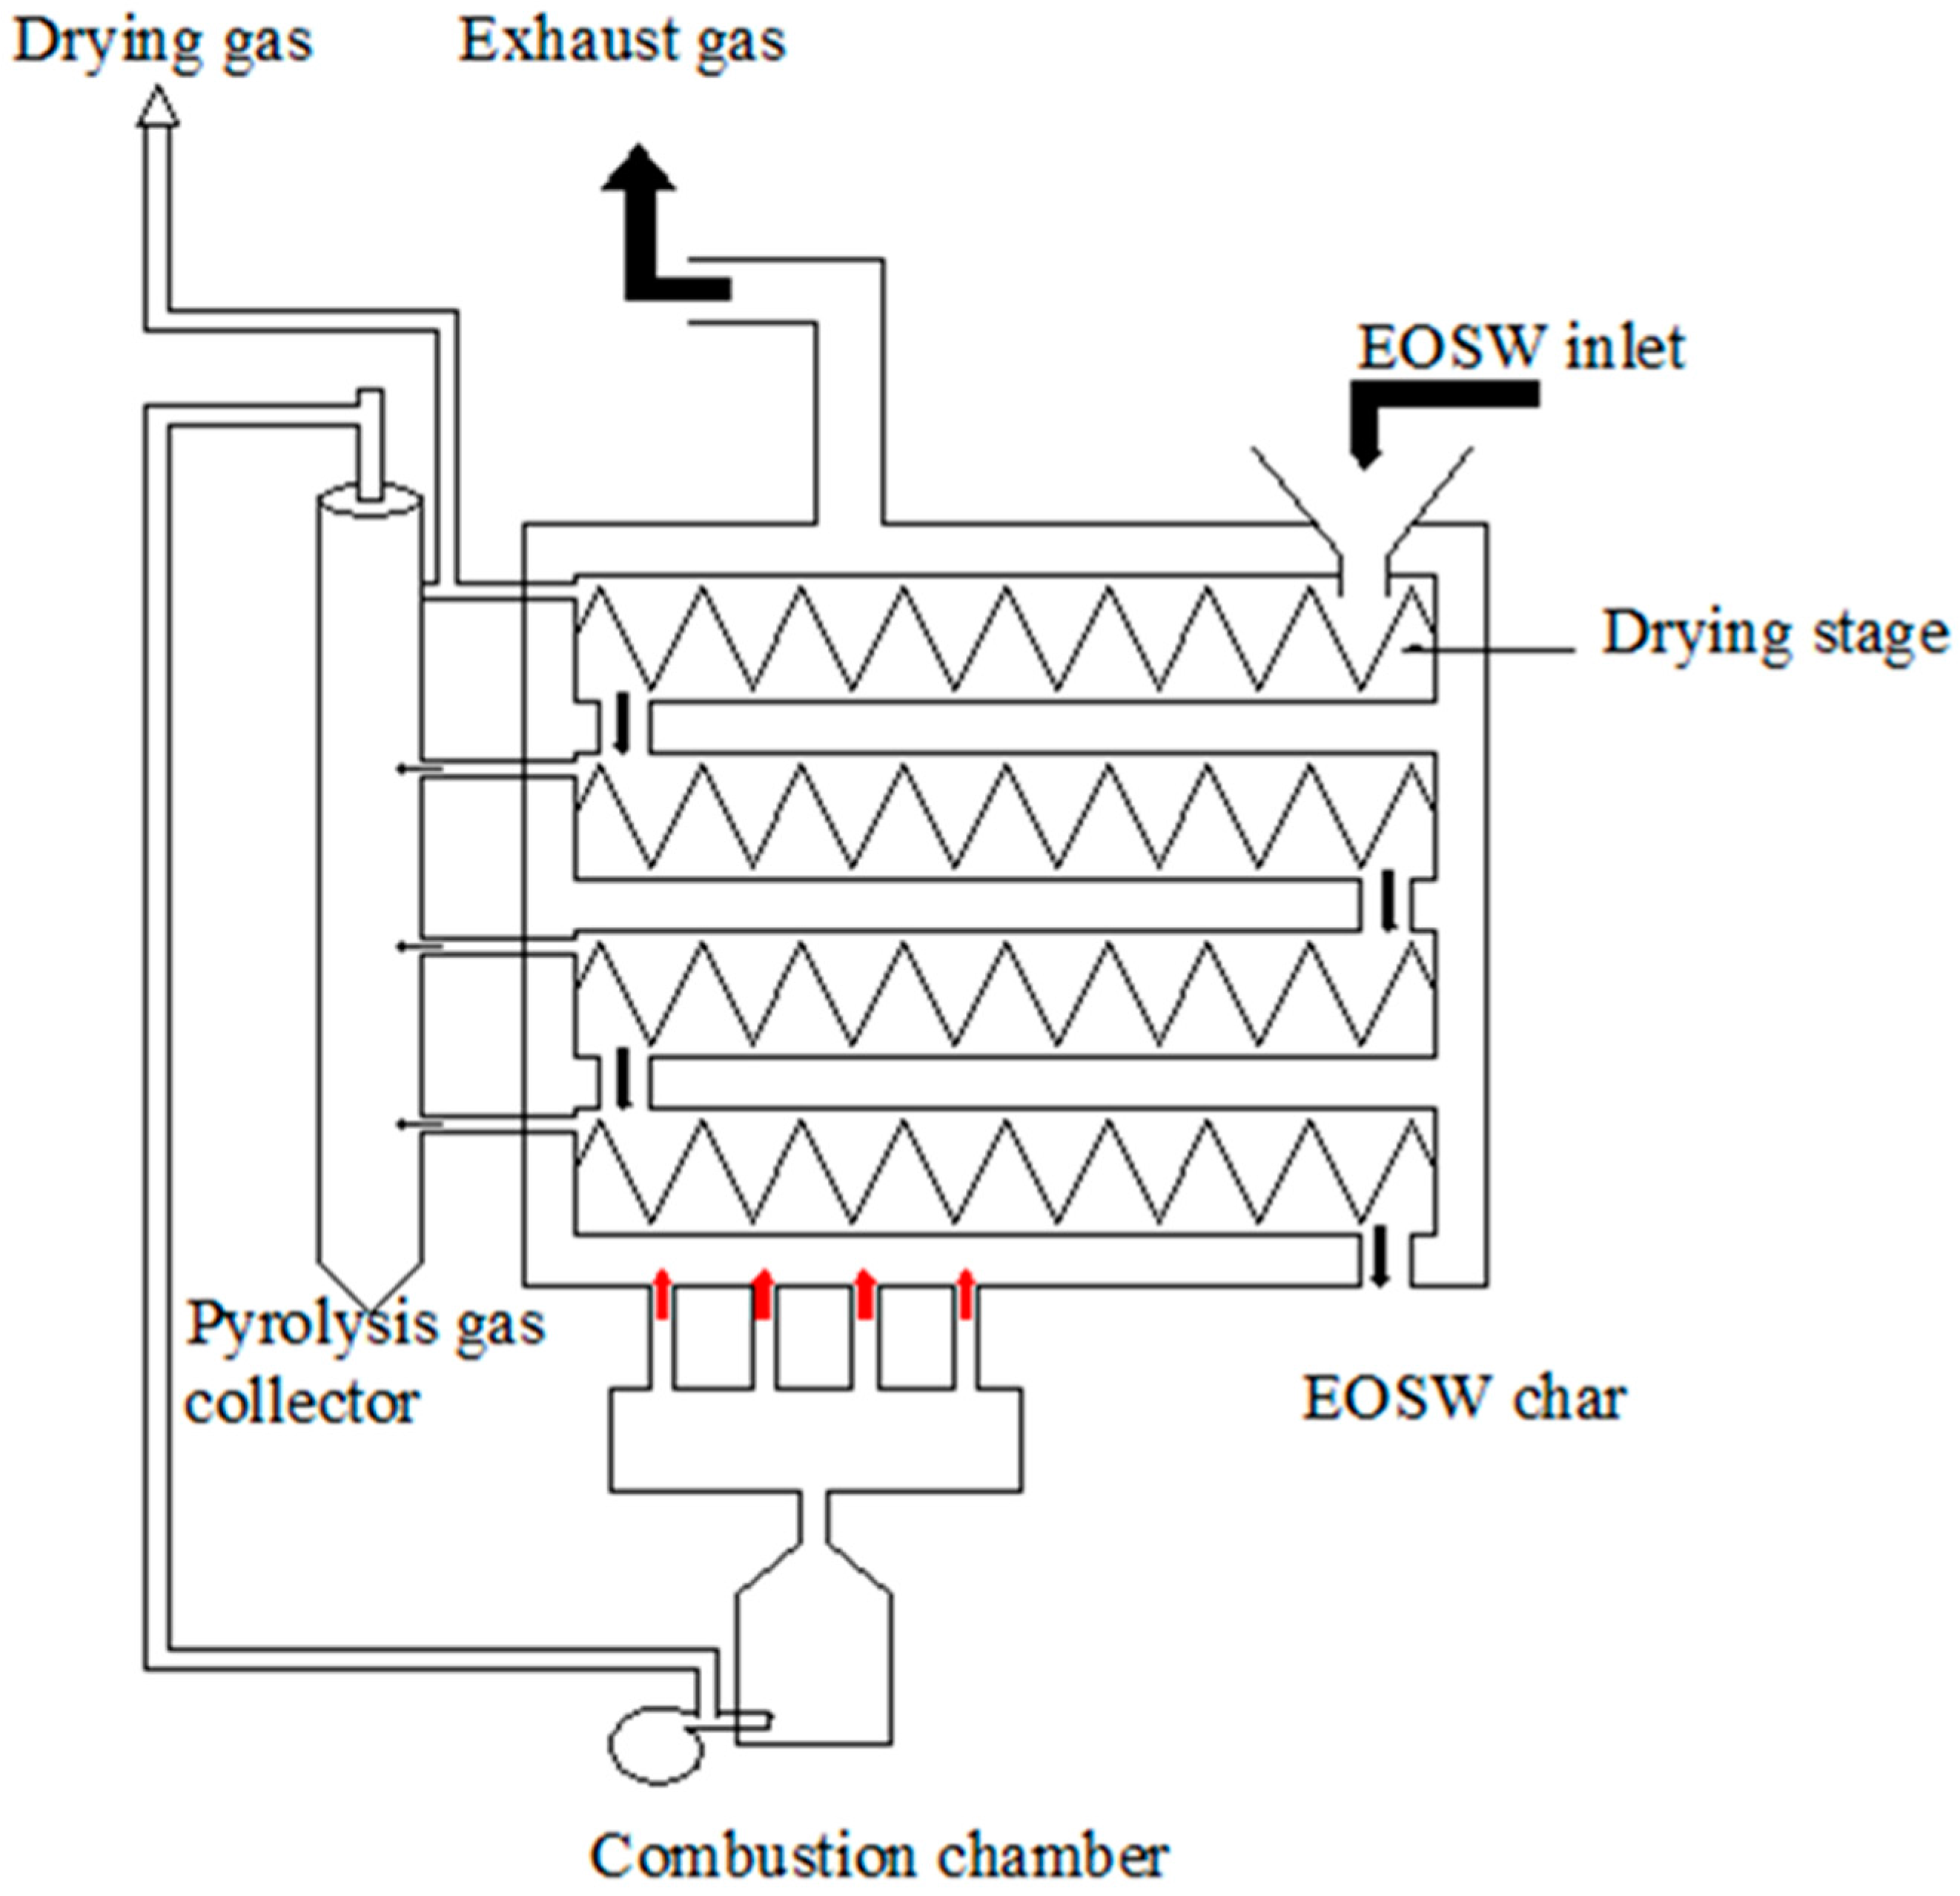
2.1.2. Olive Charcoal Preparation

The experiments of slow pyrolysis of the olive pomace were carried out at an industrial scale in a horizontal multi-stage reactor at the Olive Coal factory (Eljem, Tunisia). The reactor shown in Figure 2 includes four fixed-cylinders. The first cylinder was used essentially for the drying step while the pyrolysis stage occurs slowly in the other cylinders. Each cylinder was comprised of a conveying screw to ensure the progress of the EOSW.
The hopper is tightly sealed in order to avoid the access of air into the feedstock section. The process is firstly launched with a natural gas burner. The pyrolysis reaction results in fine charcoal as a solid product and combustible pyrolysis gases as a volatile product. The pyrolysis gas was composed of a complex mixture of non-condensable constituents, such as hydrogen, carbon monoxide, carbon dioxide, and methane. Moreover, it comprises condensable constituents, such as water vapour, heavy tars, and other hydrocarbons. Pyrolysis gases, produced by the heated biomass, flowed downwards and went through a collector to be burned in the combustion chamber. The combustion temperature of the gases reached 1200 °C and the generated heat was used for the pyrolysis process.
The input olive pomace had a moisture content between 15% and 20%. It was dried with thermal energy, provided by hot gas, recovered by a heat exchanger from the exhaust gases of the combusted pyrolysis gases. The water evaporated during the drying of the EOSW in the first cylinder was rejected.
The pyrolysis cylinders were heated to different increased temperatures of 450 °C, 550 °C, and 650 °C, which is heated by a hot combustion gas. Therefore, the EOSW is heated only by its contact to the wall of the cylinder. The residence time in each stage was about 20 min. A thermocouple was utilized to determine the temperature of char inside the reactor. The final temperature was about 450 °C. Finally, the obtained charcoal is discharged from the reactor by a rotary valve.

2.1.3. Olive Pomace Charcoal Characterization

Table 2 and Table 3 show the proximate and the ultimate analysis of the prepared olive pomace char. Hence, moisture content was measured gravimetrically by the oven drying method conforming to the EN 14774-1 standard. Volatile matter was examined using a thermogravimetric method at 900 °C for 7 min according to the NF EN 15148 standard. Ash was determined at 815 °C, conforming to the ISO 1171 standard. The higher heating value (HHV) was determined by employing an adiabatic oxygen calorimeter, according to the NF EN 14918 standard. Ultimate analysis was determined by SOCOR laboratory (France), as reported by the NF EN 15104 standard.
The obtained results are compared with those found in the literature for different biomass chars. The ultimate analysis revealed that the olive wood char has the highest carbon content, followed by our charcoal. The content of nitrogen found in olive pomace and olive wood chars are of equal amount.
It can also be observed that chars from the olive tree have closer energy content, if compared to hazelnut wood char. Hence, the pyrolysis process can increase the heating value by 75–85% from the initial biomass heating value [44].

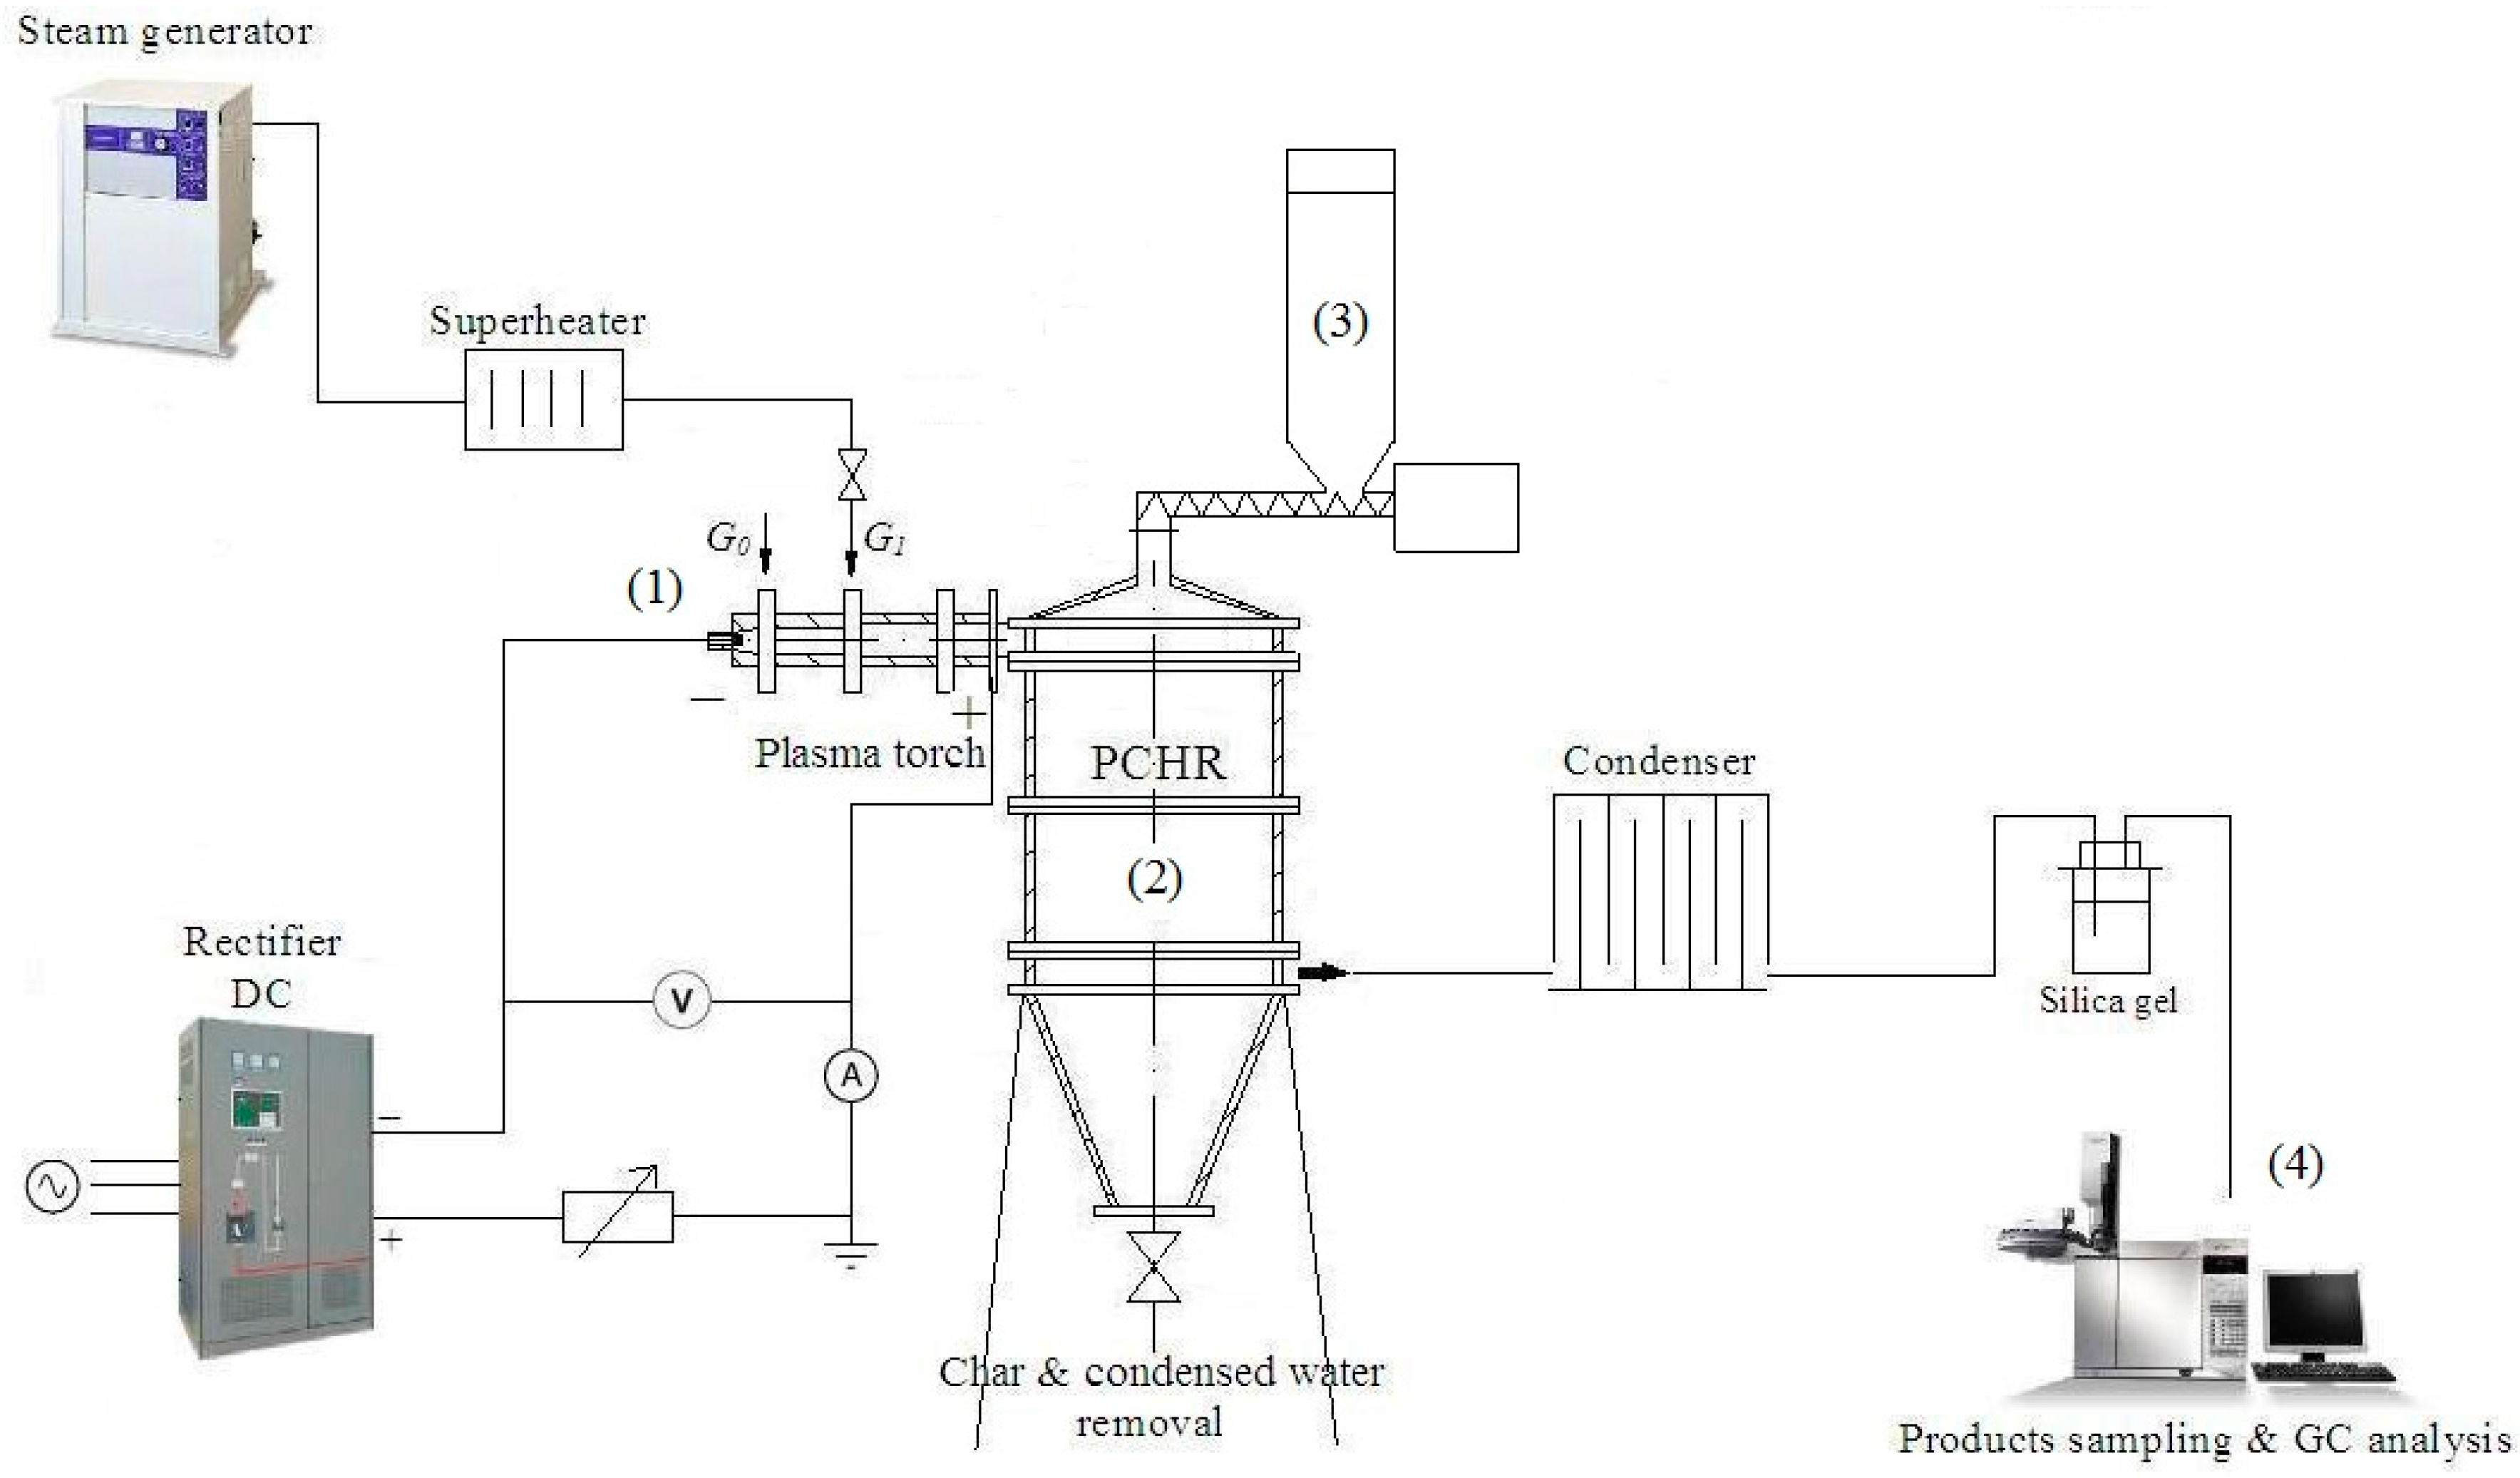
2.2. Plasma Gasification Setup

The experimental setup used in this research is shown in Figure 3. Its basic parts consists of a DC plasma torch (1); a chemical reactor (2); a charcoal feeding system (3); and a producer gas sampling and analysis system (4).
The DC arc plasma torch was used as a source for high temperature, enthalpy, and active radical generation, which operated at atmospheric pressure. Its power ranged from 45 kW to 52.2 kW at a fixed arc current intensity of 180 A and voltage drop of 250–290 V. The plasma torch operated on superheated water vapour at a flow rate in the range of G1 = (2.4 − 4.64) × 10−3 kg/s. Therefore, the water vapour was superheated to 500 K, serving as the main gas to form the plasma and as a source for active particle/radical (O, H, OH) generation inducing and accelerating the thermochemical reactions. A hafnium cathode of the plasma torch was protected by a small amount of air (G0 = 0.62 × 10⁻³ kg/s) to avoid its erosion. The thermal efficiency (η) of the plasma torch ranged between 0.67 and 0.75 and the mean generated temperature exceeded 2800 ± 7% K.
The chemical reactor is 1 m long with a 0.4 m inner diameter. Its inner walls are insulated with a refractory material (ceramic coating) to avoid excessive overheating. The EOSW charcoal was fed by a screw feeder from a hopper at an average flow rate of 1.3 × 10⁻³ kg/s. The maximum particle size of charcoal was less than 2 mm. Around 10 kg of the EOSW charcoal was used within the seven individual experimental runs. At the bottom of the plasma-chemical reactor there is a by-product removal section, and in the middle, an outlet chamber for the producer gas sampling and analysis. The producer gas was analysed by means of an Agylent 7890 A gas chromatograph (GC) equipped with dual-channel thermal conductivity detectors (TDCs) and a MRU AIR SWG 300-1 gas analyser (MRU Instruments, Inc., Houston, TX, USA). Each experimental point was measured three times to obtain an average concentration of the produced gas. In each case, the relative deviation was below ±5%.

2.3. Main Chemical Reactions

The gasification of the EOSW charcoal to syngas encompasses various complex chemical reactions. Active radicals produced by the plasma torch in the arc discharge chamber can considerably accelerate the reaction kinetics [45,46]. The primary chemical heterogeneous and homogeneous reactions of the charcoal gasification are described in Table 4.

3. Results and Discussion

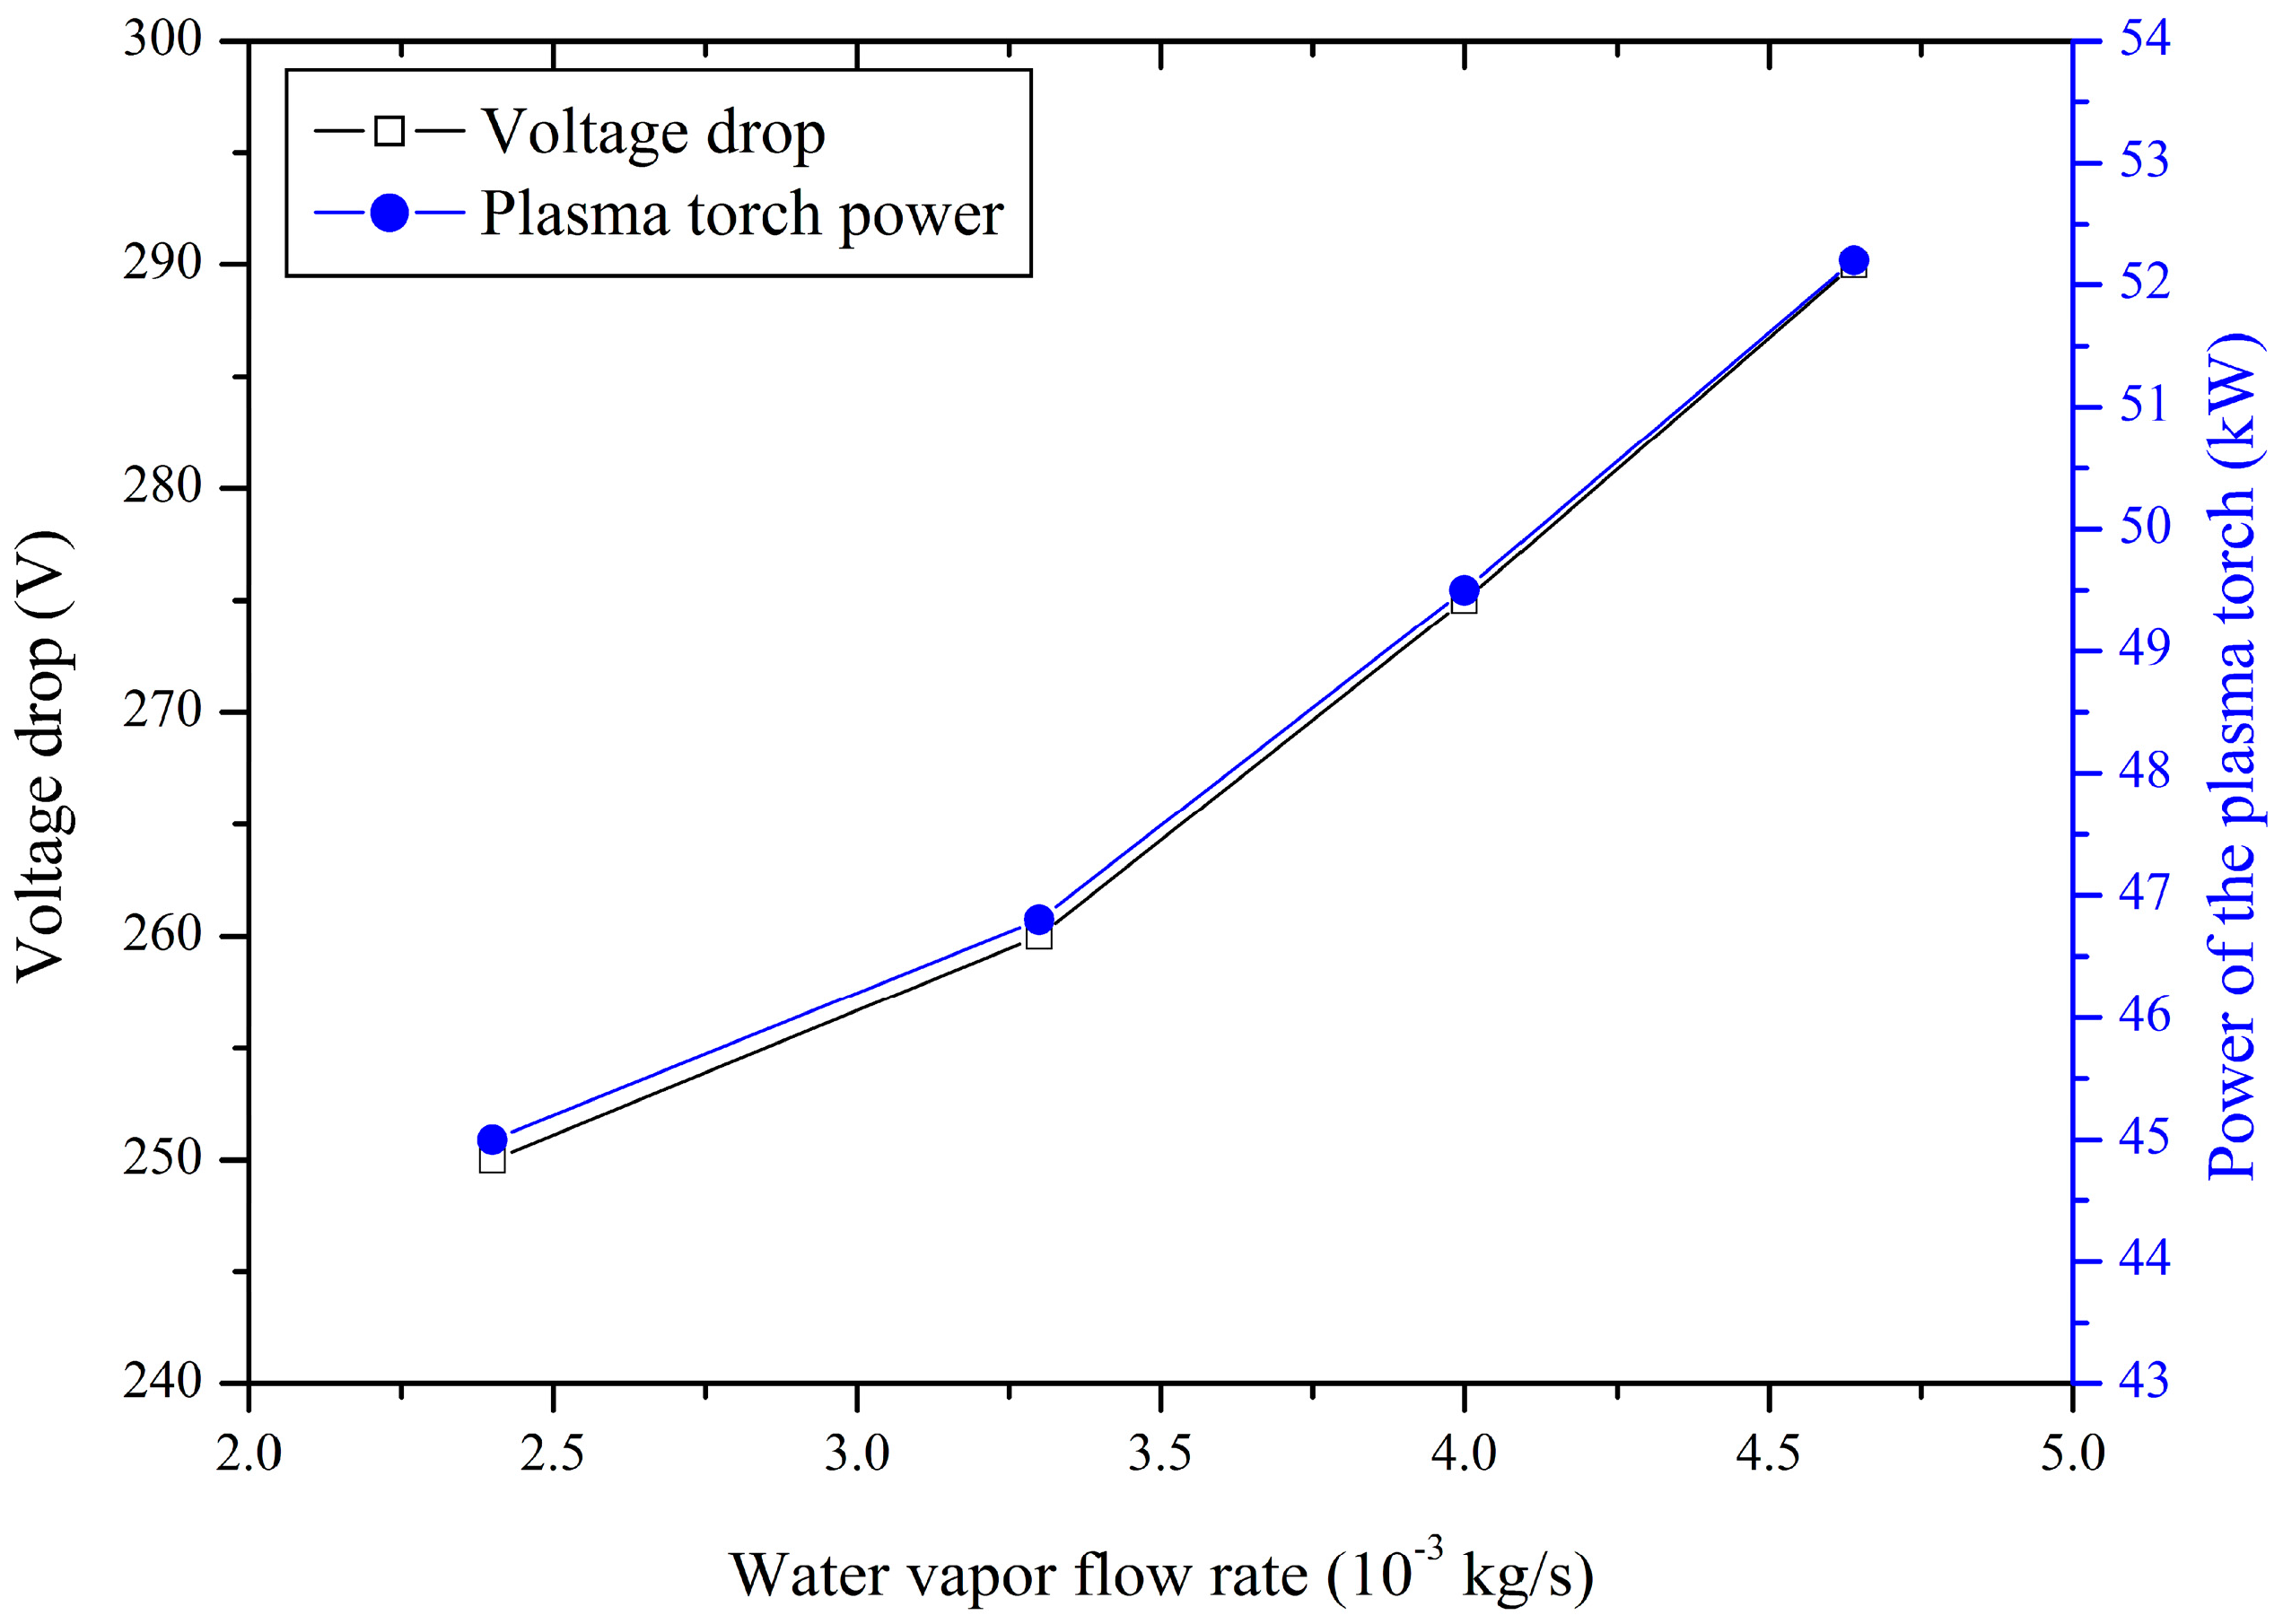
3.1. Relation between the Water Vapour Flow Rate and the Power of the Plasma Torch

Since the experiments were carried out at the various operational parameters, such as treated material flow rate, water vapour flow rate, and power of the plasma torch, however, there is a direct relation between the water vapour used as a plasma forming gas and the power of the plasma torch. The change in water vapour flow rate changes the power of the plasma torch due to the increase of the voltage drop in the arc at a fixed current intensity. This relation is shown in Figure 4.
As could be seen from the above figure, as the water vapour flow rate increased from 2.4 × 10⁻³ kg/s to 4.64 × 10⁻³ kg/s, the voltage drop in the arc discharge chamber of the plasma torch also increased from 250 V to 290 V. The increasing water vapour flow rate tangentially supplied through the ring into the arc discharge chamber intensifies the heat transfer mechanism between the arc column and the injected water vapour surrounding the arc and, therefore, the flow changes from laminar to turbulent along the arc discharge chamber. As a result, the electric field of the arc, as well as the arc potential, increases significantly leading to the increased voltage drop [48]. Therefore, this directly influences the plasma torch power, which, during experiments, increased from 44 kW to 52.2 kW, due to the relation P = VI, where P is power (W), V is the voltage of the arc (V), and I is the current of the arc (A). Consequently, the operational parameters related to the increased water vapour flow rate at the fixed arc current simultaneously means the increased power of the plasma torch.

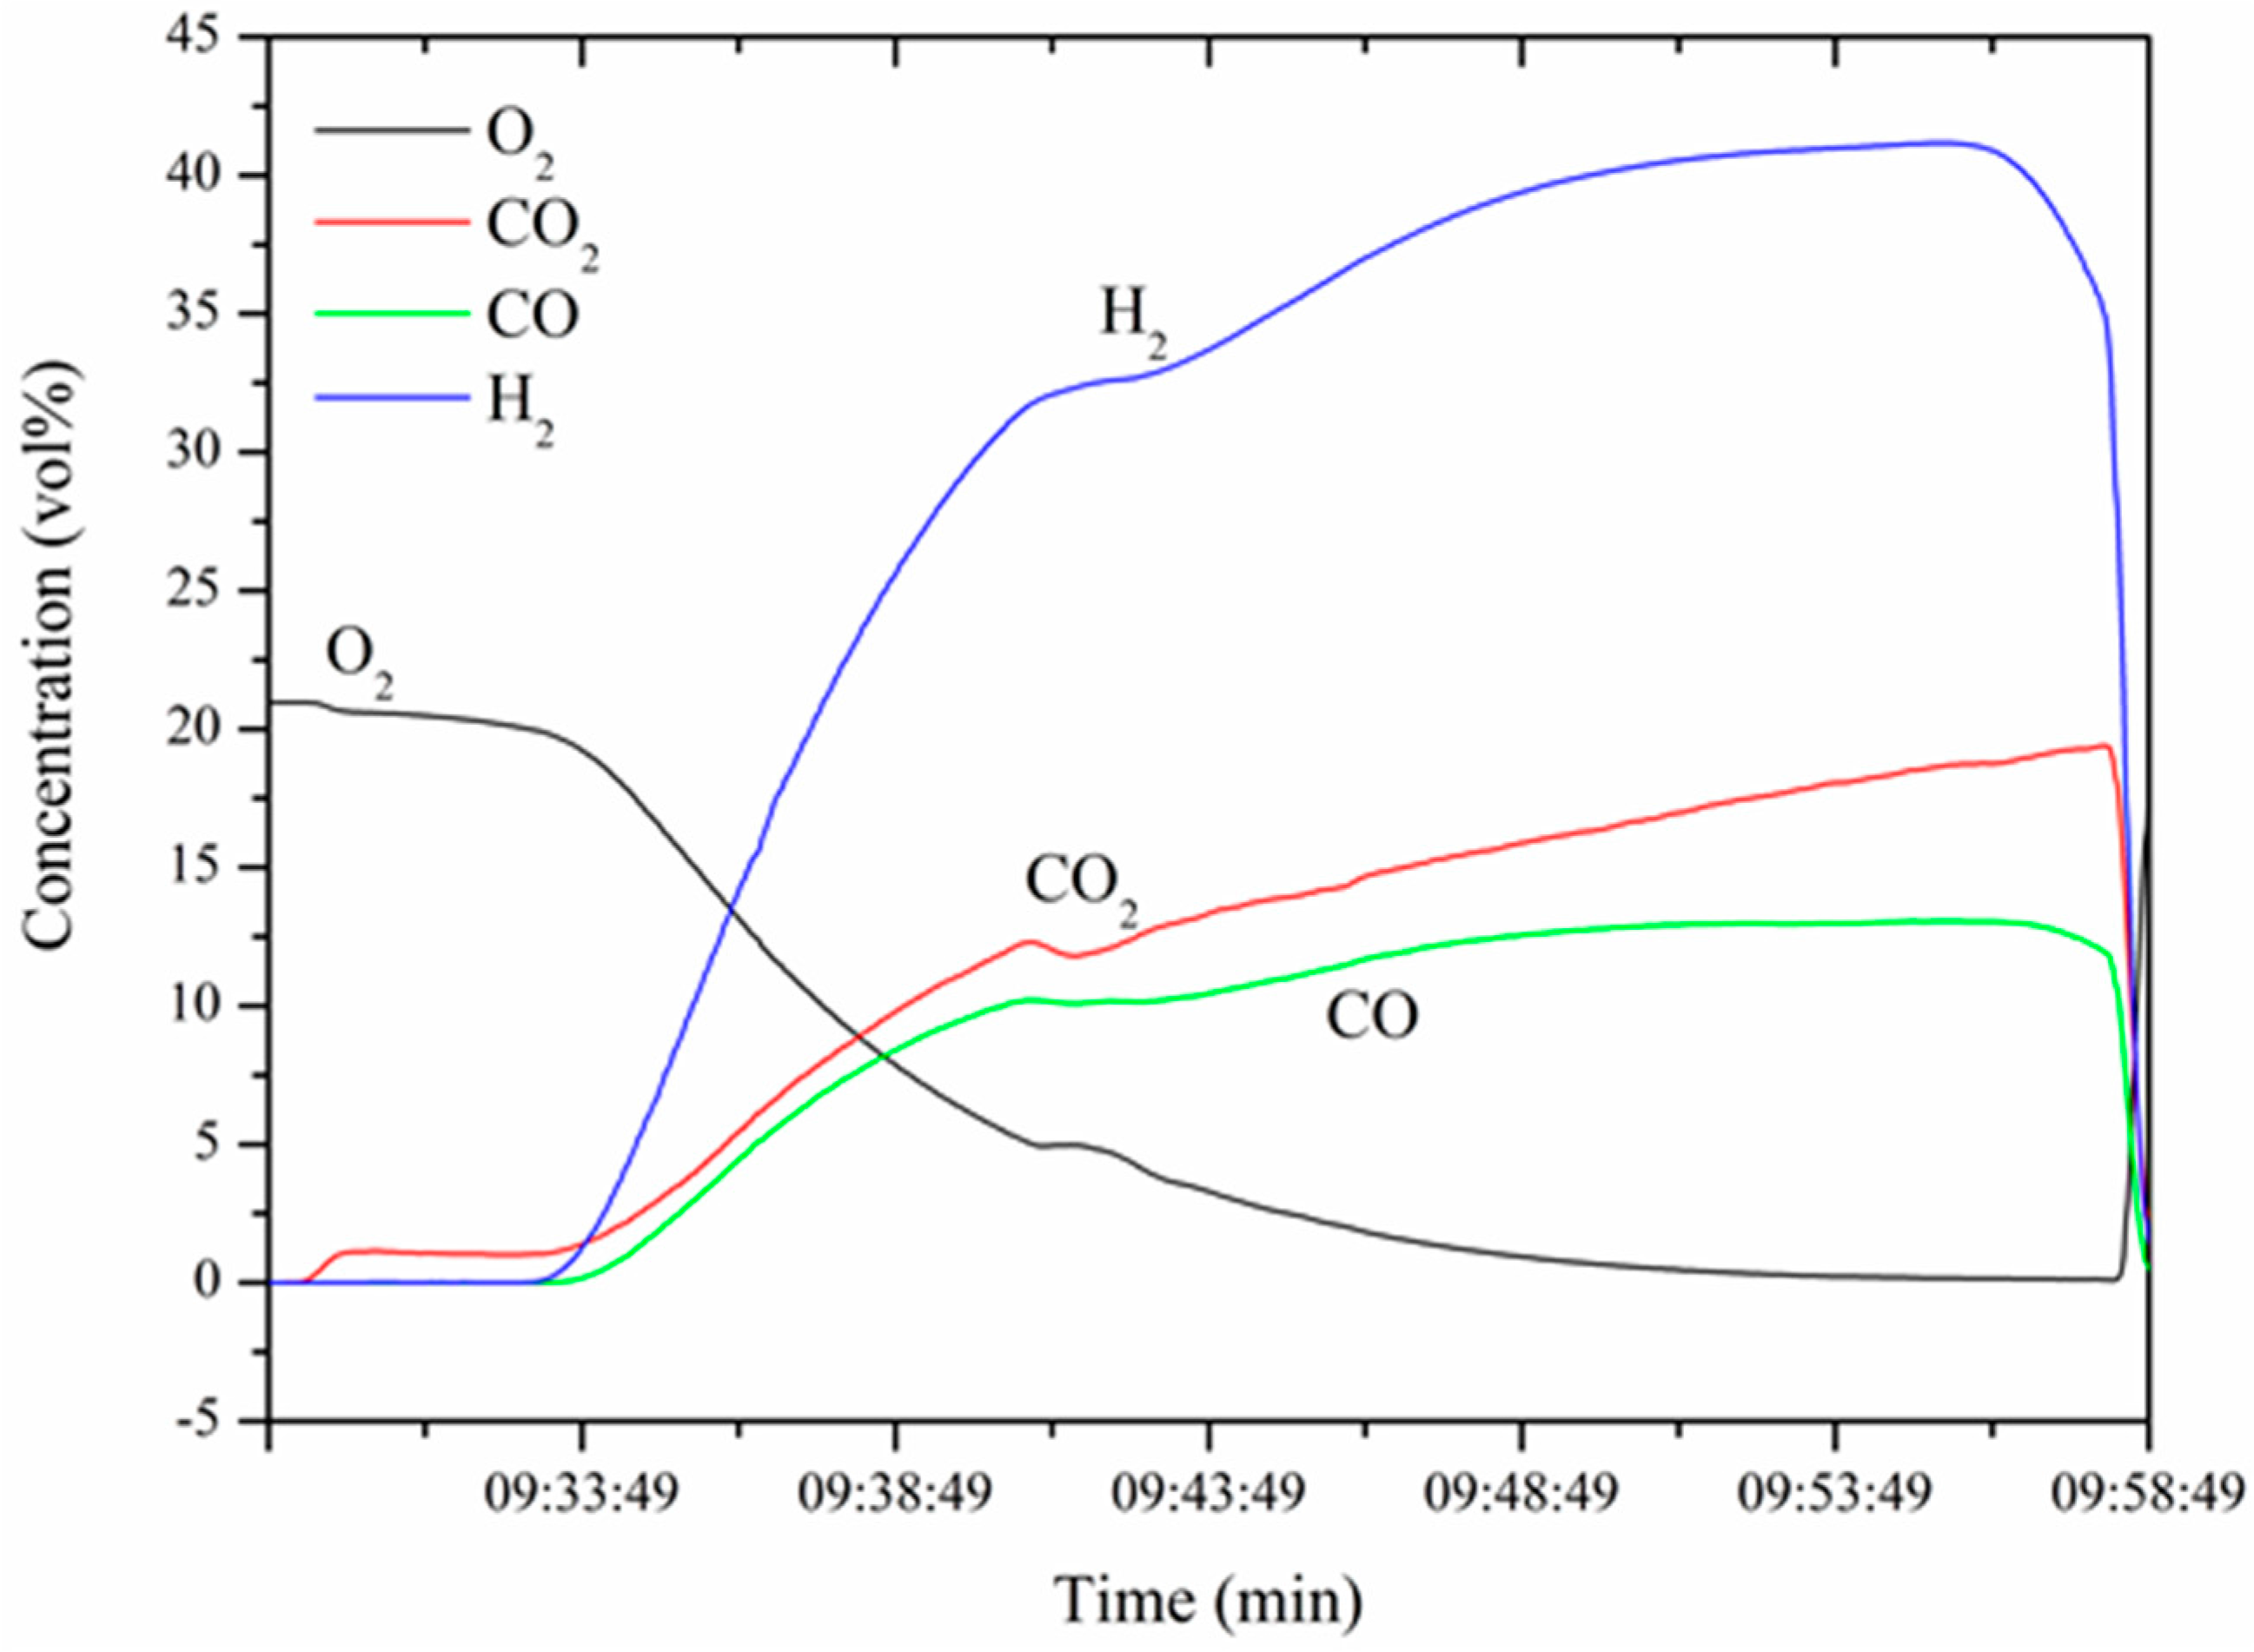
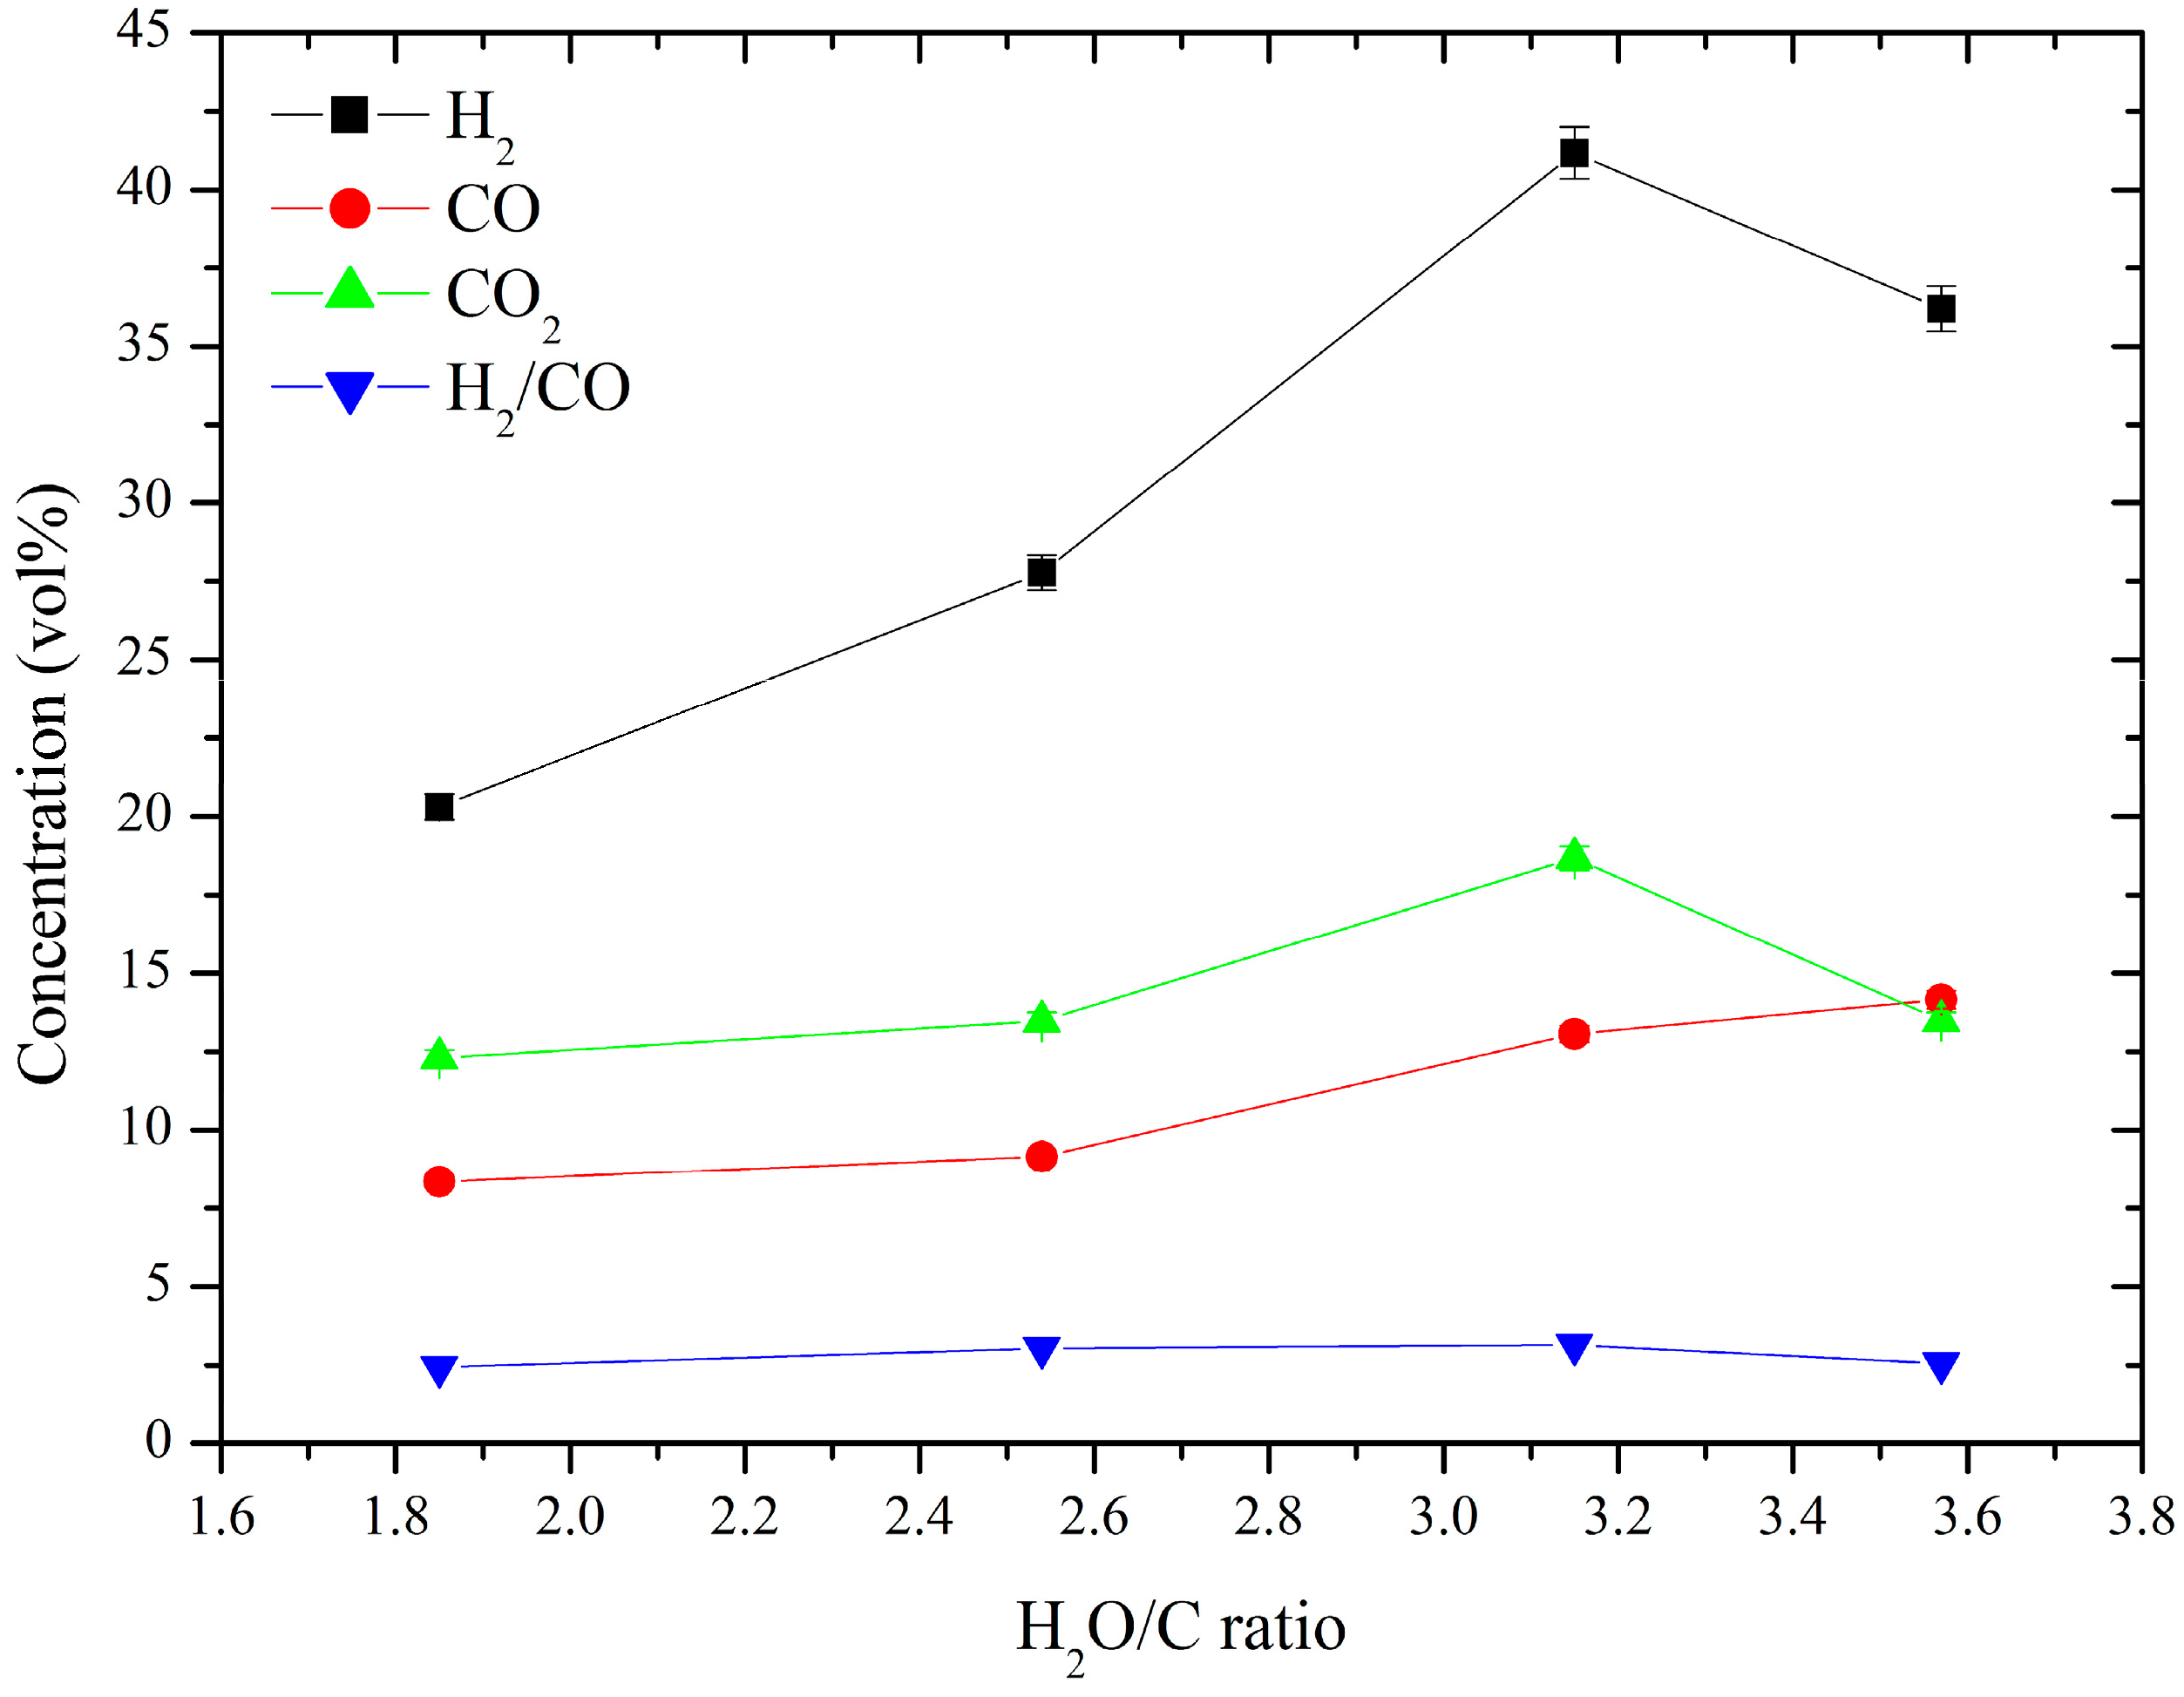
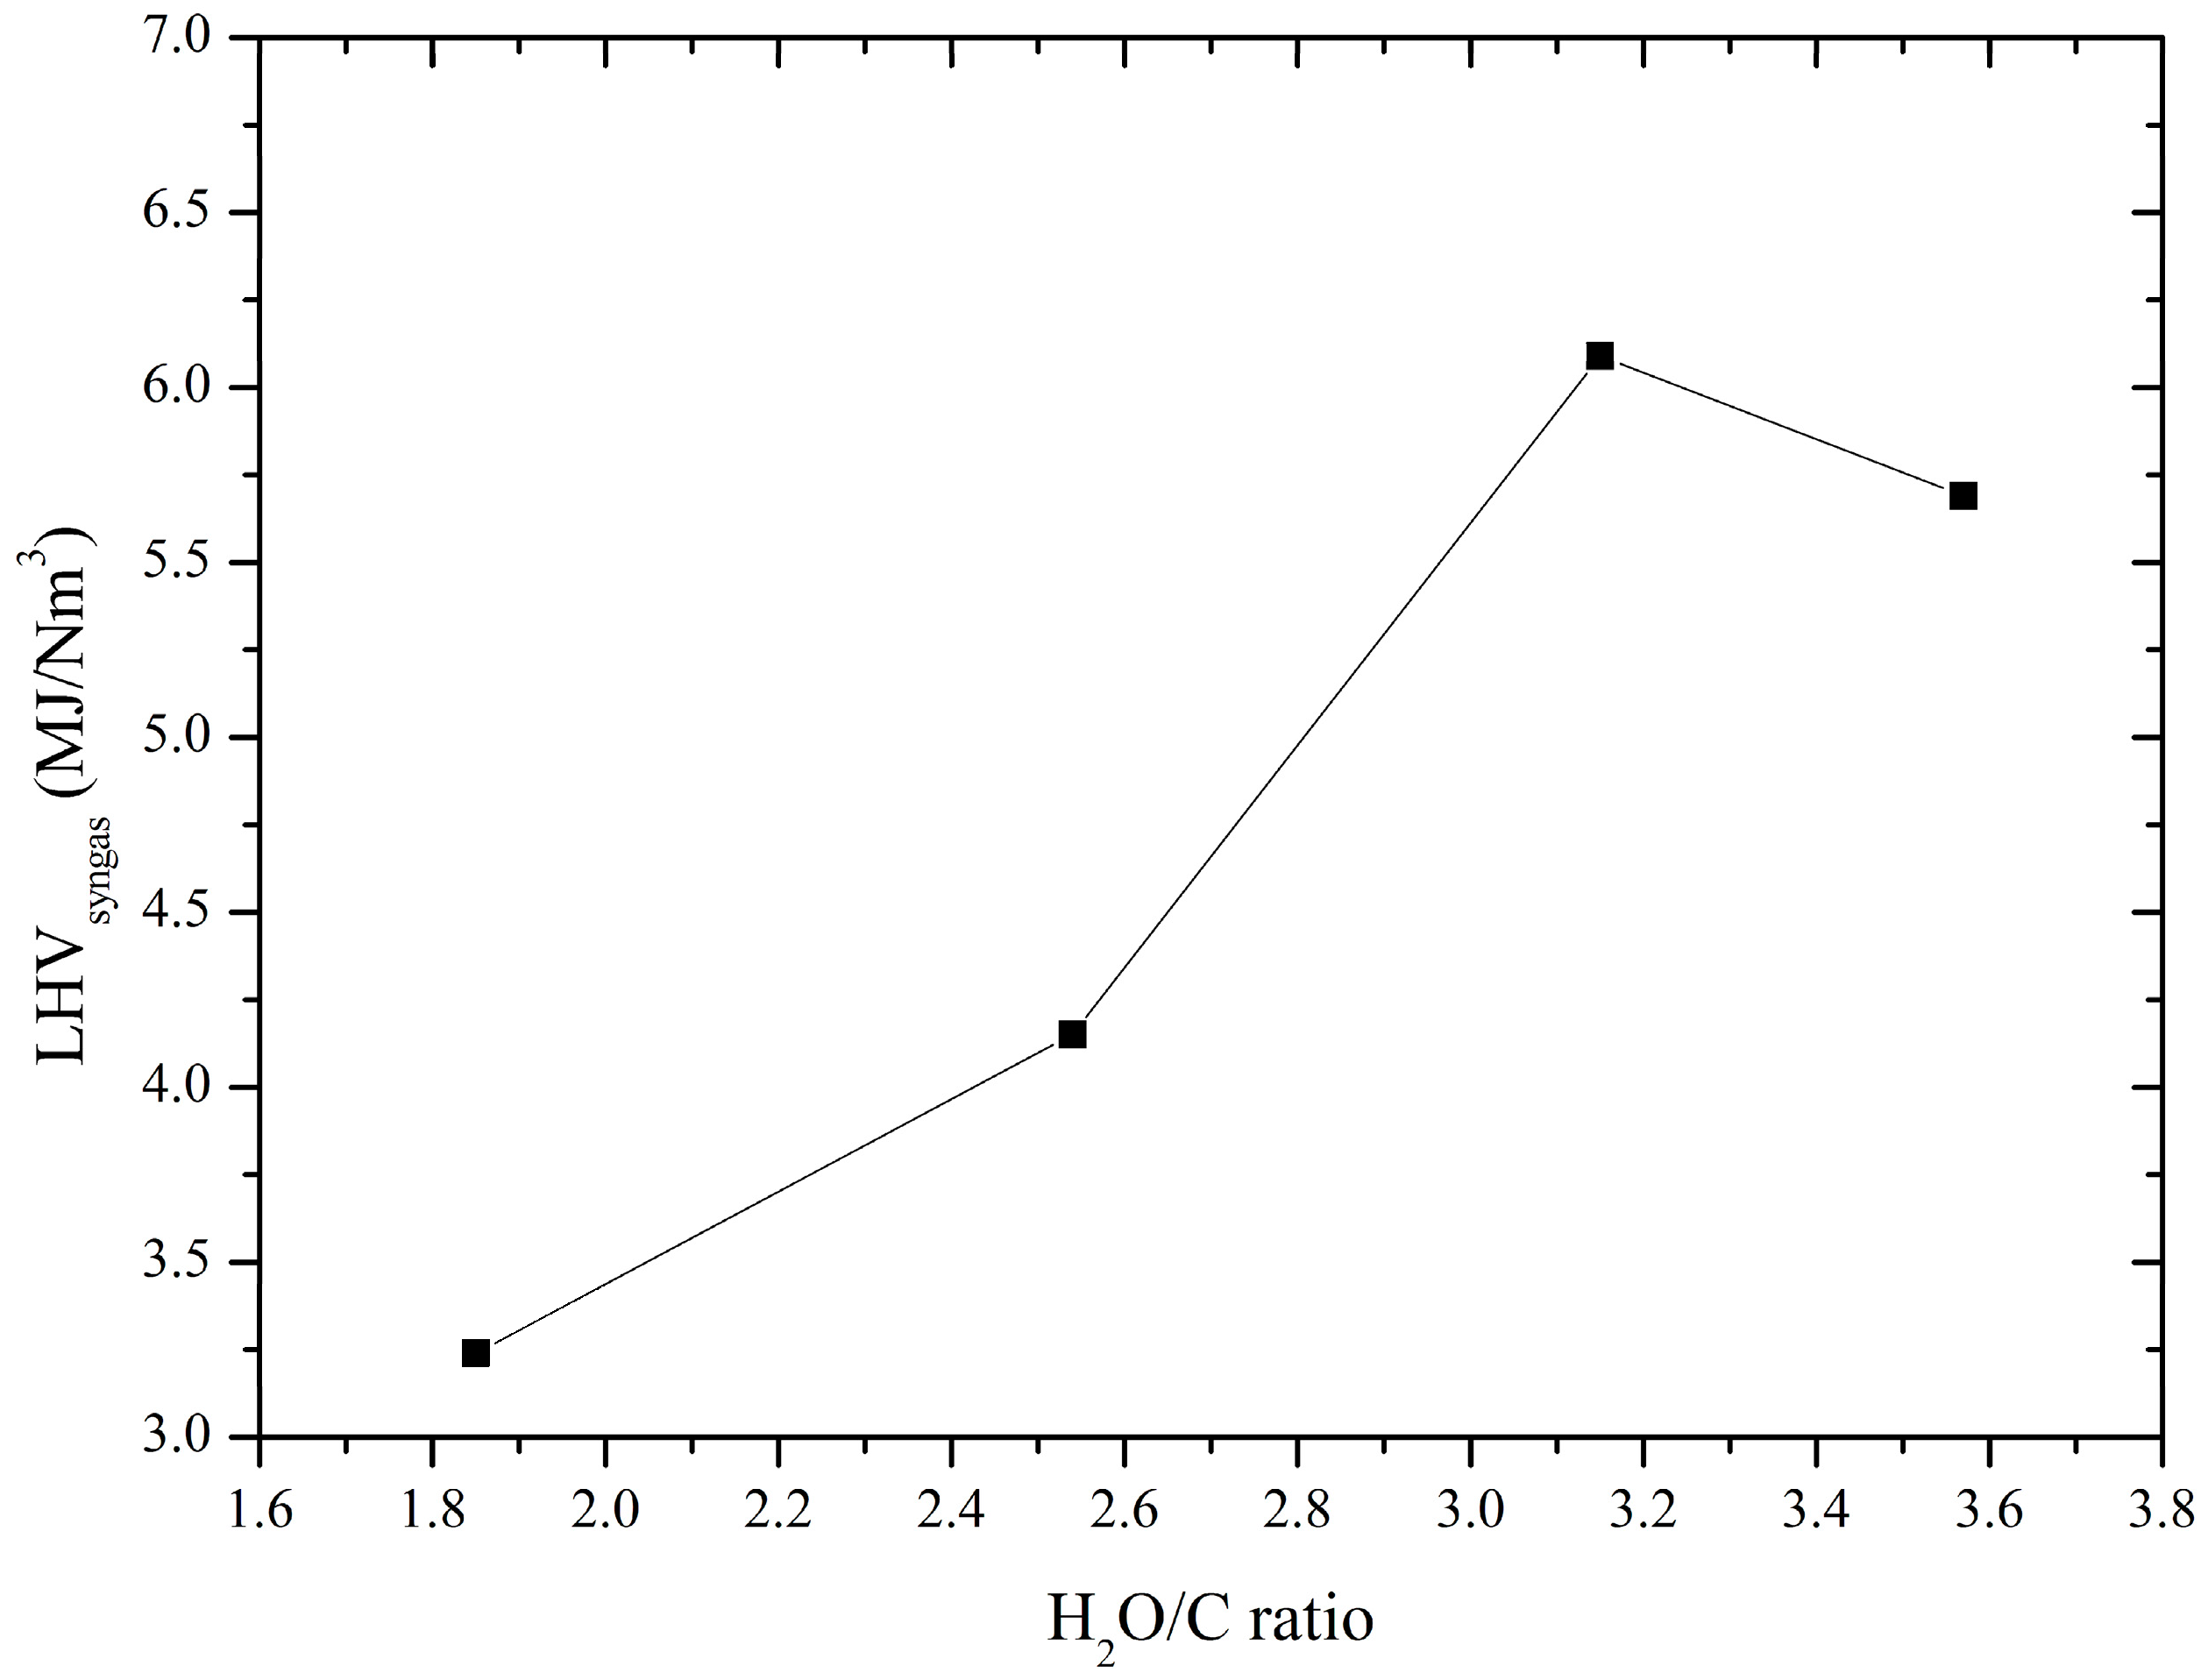
3.2. Produced Syngas Composition

In this paragraph, the effects of the water vapour to charcoal (H2O/C) ratio, as well as the plasma torch power on the gasification of the EOSW charcoal, are discussed.
Firstly, the experiments were performed in order to determine the reaction time required to reach equilibrium (operating) conditions during charcoal gasification, i.e., an elapsed time to reach the highest concentrations of the formed gases. This is shown in Figure 5.
It can be seen from the figure that a reaction time required to reach the optimal operating gasification conditions, at which the concentrations of H2 and CO were at the highest level, was approximately 25 min. The same tendency was observed during other experiments at the different regime parameters, such as the H2O/C ratio and the power of the plasma torch. Additionally, the main produced gases were H2, CO, and CO2, and only traces of other lighter hydrocarbons were detected.
Afterwards, the influence of the H2O/C ratio on the generated gas concentrations was investigated. The results are shown in Figure 5. As the H2O/C ratio increased from 1.85 to 3.15, the concentrations of H2 and CO2 increased from 20.3% and 12.3% to 41.17% and 18.68%, respectively, and only at 3.15 to 3.57, decreased to 36.19% and 13.48%, respectively. Meanwhile, the concentration of CO increased all the time, from 8.35% to 14.15%. Since the charcoal steam gasification is an allothermal process requiring an external heat source for initiation of endothermic reactions, it is possible to highlight just three independent main gasification reactions: water–gas reaction (WG) (Equation (5)), water–gas shift (WGS) (Equation (6)), and the Bouduard reaction (Equation (10)). However, it is a simplified explanation, since other chemical elements (H, N, O, S, etc.) and compounds could be involved as reactants and/or products [49]. Therefore, H2, CO2, and CO formation mechanisms and variations of concentrations could be explained by these gasification reactions. In this research, the thermal plasma torch was utilized to provide heat for endothermic reaction initiation. The increase of concentrations of H2 and CO2 at the H2O/C ratio of 3.15 can be explained by the dominance of WG and WGS reactions, whereas the decrease at the H2O/C ratio from 3.15 to 3.57, due to the dominance of reversed shift reaction and the Bouduard reaction, as well as less favourable WG reaction.
The figure also indicates the dependence of the H2/CO ratio, which was in the range of 2.43 to 3.15, on the H2O/C ratio. The H2/CO ratio mostly depended on the variation of the concentrations of H2 to CO. At the beginning, as the H2O/C ratio increased from 1.85 to 3.15, the H2/CO ratio increased from 2.43 to 3.15. However, between the H2O/C ratios of 3.15 to 3.57 the latter decreased from 3.15 to 2.56 due to the decrease in H2 and CO concentrations. Generally, a desired H2/CO ratio for the Fischer–Tropsch synthesis (FTS) of syngas to produce diesel and gasoline is around 2.1:1 [9]. Therefore, the produced syngas required an adjustment to reduce the H2 content or increase the CO content by a WGS reaction (Equation (6)). Nevertheless, the primary experiments showed a promising result for syngas production from the EOSW charcoal.
However, the lower heating value (LHV) of the produced syngas was of low quality. The dependence of the LHV of the syngas on the H2O/C ratio is shown in Figure 6 and Figure 7. It could be observed that the LHV of the syngas increased from 3.24 MJ/nm3 to 6.09 MJ/nm3 at the H2O/C ratio in the range of 1.85 to 3.15. However, at the H2O/C ratio of 3.15 to 3.57, the LHV decreased from 6.09 MJ/nm3 to 5.69 MJ/nm3. This was mostly induced by the decrease of H2 concentration determined by a reversed water–gas shift reaction.
Future prospects will be to assess the performance parameters of the thermal plasma gasification system in terms of cold gas efficiency, carbon conversion efficiency, syngas yield, specific energy requirements, etc.

3.3. Comparison with Similar Gasification Methods

In this paragraph a comparative study in terms of syngas production with similar gasification methods, both conventional (commercially available and near commercial) and plasma, is discussed. The results are summarized in Table 5.
There are a number of various gasification technologies. However, according to the configuration of the gasifier, all of the existing gasifiers can basically be divided into four main configurations: moving bed, fluidized bed, entrained flow, and transport flow [50]. This division is suitable for plasma gasification (plasma gasifiers) as well, where torches or arcs are being used as an external heating source. Nevertheless, despite the fact that the end/final product is usually similar, its syngas, conventional gasification, and plasma gasification technologies differ significantly. Traditional gasification methods require high pressures (greater than 30 Bar), long residence times of treated materials (up to several hours), special catalysts and their recovery, higher investment and maintenance costs, etc. [54]. Here, where the thermal plasma comes from with its advantages, such as an easy control of the gasification process, operation at atmospheric pressure, short residence time (up to several minutes), no need of catalysts and their recovery, flexibility and smaller size of the equipment of the same capacity, ability to generate reactive species, etc. Nevertheless, the concentrations of the produced H2 and CO, the H2/CO and the LHV in both cases are at comparable levels. One of the greatest advantages of the plasma gasification are the low environmental emissions and better environmental impact in terms of life cycle assessment [10,22]. Therefore, this makes plasma an attractive method to use in waste-to-energy applications. However, despite the mentioned advantages, plasma gasification has not been fully commercially proven yet because of the large energy penalty, especially of the DC arc plasma and, consequently, the techno-economic feasibility of such units. High power consumption to operate plasma torches, periodic changes of their electrodes, expensive power supply units, and instability of the plasma flame, especially for MW and RF discharges, makes it challenging for further commercialization.
If compared just between the plasma means, the simplest among these and the most widely used is a DC arc plasma. The power capacity of the MW and RF plasmas can reach several kilowatts (3–5 kW, in some cases up to 10 kW) [51,53], whereas that of the DC arc plasma from hundreds of kilowatts up to several megawatts. This makes the DC arc plasma closer to industrial scale applications, as well as its reliability in operation. The greatest disadvantage of the DC arc plasma is a shorter lifetime of the electrodes due to the electric arc erosion. Moreover, in this particular case, the quality of the produced syngas was lower if compared to Yoon et al. [52], who used MW discharge for coal gasification.
To sum up, the overall situation for the plasmas being applied for syngas production from coal or other carbonaceous materials/wastes is promising in terms of its flexibility, environmental issues, easy process control, generation of active radicals, etc. This primary experiments with the charcoal made from an exhausted olive solid waste showed a promising result for future experiments with the thermal water vapour plasma method for syngas production.

4. Conclusions

In the current primary experimental research, the potential of synthesis gas production from the charcoal derived from the exhausted olive solid waste (olive pomace) by utilizing thermal arc plasma was investigated. The experiments were carried out at different H2O/C ratios, as well as different plasma torch powers. A direct relation between the water vapour flow rate and the plasma torch power at a constant arc current intensity was demonstrated. The main reaction products were hydrogen (41.17%) and carbon monoxide (13.06%), forming syngas, which comprised approximately 55% in the produced gas. The highest LHV of the produced syngas was 6.09 MJ/nm3 and the H2/CO ratio was 3.15. The performed experiments showed great potential for syngas production from the charcoal derived from olive pomace as a residue/waste from the olive oil industry. Therefore, the future outlook will rely on a more detailed investigation of the performance parameters of the plasma gasification unit and its comparison with similar gasification methods in terms of cold gas efficiency, carbon conversion efficiency, syngas yield, specific energy requirements, etc.

Author Contributions

All authors contributed equally to the work done.

Conflicts of Interest

The authors declare no conflict of interest.

References

  1. Eurostat. Statistics Explained. Available online: http://ec.europa.eu/eurostat/statistics-explained/index.php/Waste_statistics (accessed on 8 February 2017).
  2. Directive of the European Parliament and of the Council amending Directive 2008/98/EC on Waste. Available online: http://eur-lex.europa.eu/legal-content/EN/TXT/?uri=CELEX%3A52015PC0595 (accessed on 12 February 2015).
  3. Food and Agriculture Organization of the United Nations Statistical Databases; Food and Agriculture Organization of the United Nations: Rome, Italy, 2014; Available online: www.faostat.fao.org/ (accessed on 8 February 2017).
  4. European Commission. Agriculture and Rural Development. Available online: http://ec.europa.eu/agriculture/olive-oil_en (accessed on 8 February 2017).
  5. Guizani, C.; Haddad, K.; Jeguirim, M.; Colin, B.; Limousy, L. Combustion characteristics and kinetics of torrefied olive pomace. Energy 2016, 107, 453–463. [Google Scholar] [CrossRef]
  6. Jeguirim, M.; Elmay, Y.; Limousy, L.; Lajili, M.; Said, R. Devolatilization behaviour and pyrolysis kinetics of potential Tunisian biomass fuels. Environ. Prog. Sustain. Energy 2014, 33, 1452–1458. [Google Scholar]
  7. Molino, A.; Chianese, S.; Musmarra, D. Biomass gasification technology: The state of the art overview. J. Energy Chem. 2016, 25, 10–25. [Google Scholar] [CrossRef]
  8. Sansaniwal, S.K.; Pal, K.; Rosen, M.A.; Tyagi, S.K. Recent advances in the development of biomass gasification technology: A comprehensive review. Renew. Sustain. Energy. Rev. 2017, 72, 363–384. [Google Scholar] [CrossRef]
  9. Kumar, A.; Jones, D.D.; Hanna, M.A. Thermochemical biomass gasification: A review of the current status of the technology. Energies 2009, 2, 556–581. [Google Scholar] [CrossRef]
  10. Bosmans, A.; Vanderreydt, I.; Geysen, D.; Helsen, L. The crucial role of waste-to-energy technologies in enhanced landfill mining: A technology review. J. Clean. Prod. 2013, 55, 10–23. [Google Scholar] [CrossRef]
  11. Siciliano, A.; Stillitano, M.A.; De Rosa, S. Biogas production from wet olive mill wastes pretreated with hydrogen peroxide in alkaline conditions. Renew. Energy 2016, 85, 903–916. [Google Scholar] [CrossRef]
  12. De Rosa, S.; Siciliano, A. A catalytic oxidation process of olive oil mill wastewaters using hydrogen peroxide and copper. Desalination Water Treat. 2010, 23, 187–193. [Google Scholar] [CrossRef]
  13. Giordano, G.; Perathoner, S.; Centi, G.; De Rosa, S.; Granato, T.; Katovic, A.; Siciliano, A.; Tagarelli, A.; Tripicchio, F. Wet hydrogen peroxide catalytic oxidation of olive oil mill wastewaters using Cu-zeolite and Cu-pillared clay catalysts. Catal. Today 2007, 124, 240–246. [Google Scholar] [CrossRef]
  14. Al-Mallhi, J.; Furuichi, T.; Ishii, K. Appropriate conditions for applying NaOH-pretreated two-phase olive milling waste for codigestion with food waste to enhance biogas production. Waste Manag. 2016, 48, 430–439. [Google Scholar] [CrossRef] [PubMed]
  15. Christoforou, E.; Fokaides, P.A. A review of olive solid wastes to energy utilization techniques. Waste Manag. 2016, 49, 346–363. [Google Scholar] [CrossRef] [PubMed]
  16. Vera, D.; Jurado, F.; Margaritis, N.K.; Grammelis, P. Experimental and economic study of a gasification plant fueled with olive industry wastes. Energy Sustain. Dev. 2014, 23, 247–257. [Google Scholar] [CrossRef]
  17. Vera, D.; de Mena, B.; Jurado, F.; Schories, G. Study of a downdraft gasifier and gas engine fueled with olive oil industry wastes. Appl. Therm. Eng. 2013, 51, 119–129. [Google Scholar] [CrossRef]
  18. Kipcak, E.; Akgun, M. Oxidative gasification of olive mill wastewater as a biomass source in supercritical water: Effects on gasification yield and biofuel composition. J. Supercrit. Fluids 2012, 69, 57–63. [Google Scholar] [CrossRef]
  19. Margaritis, N.; Grammelis, P.; Vera, D.; Jurado, F. Assessment of Operational Results of a Downdraft Biomass Gasifier Coupled with a Gas Engine. Procedia Soc. Behav. Sci. 2012, 48, 857–867. [Google Scholar] [CrossRef]
  20. Wang, L.; Weller, C.L.; Jones, D.D.; Hanna, M.A. Contemporary issues in thermal gasification of biomass and its application to electricity and fuel production. Biomass Bioenergy 2008, 32, 573–581. [Google Scholar] [CrossRef]
  21. Vera, D.; Jurado, F.; Panopoulos, K.D.; Grammelis, P. Modelling of biomass gasifier and microturbine for the olive oil industry. Int. J. Energy Res. 2012, 36, 355–367. [Google Scholar] [CrossRef]
  22. Evangelisti, S.; Tagliaferri, C.; Clift, R.; Lettieri, P.; Taylor, R.; Chapman, C. Life cycle assessment of conventional and two-stage advanced energy-from-waste technologies for municipal solid waste treatment. J. Clean. Prod. 2015, 100, 212–223. [Google Scholar] [CrossRef]
  23. Bogaerts, A.; Neyts, E.; Gijbels, R.; van der Mullen, J. Gas discharge plasmas and their applications. Spectrochim. Acta B 2002, 57, 609–658. [Google Scholar] [CrossRef]
  24. Huang, H.; Tang, L. Treatment of organic waste using thermal plasma pyrolysis technology. Energy Convers. Manag. 2007, 48, 1331–1337. [Google Scholar] [CrossRef]
  25. Tamošiūnas, A.; Valatkevičius, P.; Gimžauskaitė, D.; Jeguirim, M.; Mėčius, V.; Aikas, M. Energy recovery from waste glycerol by utilizing thermal water vapor plasma. Environ. Sci. Pollut. Res. 2016, in press. [Google Scholar] [CrossRef]
  26. Fabry, F.; Rehmet, C.; Rohani, V.; Fulcheri, L. Waste gasification by thermal plasma: A review. Waste Biomass Valoriz. 2013, 4, 421–439. [Google Scholar] [CrossRef]
  27. Rutberg, G.Ph.; Bratsev, A.N.; Kuznersov, V.A.; Popov, V.E.; Ufimtsev, A.A.; Shtengel, S.V. On efficiency of plasma gasification of wood residues. Biomass Bioenergy 2011, 35, 495–504. [Google Scholar] [CrossRef]
  28. Arabi, K.; Aubry, O.; Khacef, A.; Cormier, J.M. Syngas production by plasma treatments of alcohols, bio-oils and wood. J. Phys. Conf. Ser. 2012, 406, 1–8. [Google Scholar] [CrossRef]
  29. Tamošiūnas, A.; Valatkevičius, P.; Valinčius, V.; Levinskas, R. Biomass conversion to hydrogen-rich synthesis fuels using water steam plasma. CR Chim. 2016, 19, 433–440. [Google Scholar] [CrossRef]
  30. Tamošiūnas, A.; Valatkevičius, P.; Grigaitienė, V.; Valinčius, V.; Striūgas, N. A cleaner production of synthesis gas from glycerol using thermal water steam plasma. J. Clean. Prod. 2016, 130, 187–194. [Google Scholar] [CrossRef]
  31. Qiu, J.; He, X.; Sun, T.; Zhao, Z.; Zhou, Y.; Guo, Sh.; Zhang, J.; Ma, T. Coal gasification in steam and air medium under plasma conditions: A preliminary study. Fuel Process. Technol. 2004, 85, 969–982. [Google Scholar] [CrossRef]
  32. Agon, N.; Hrabovsky, M.; Chumak, O.; Hlina, M.; Kopecky, V.; Mašlani, A.; Bosmans, A.; Helsen, L.; Skoblja, S.; Van Oost, G.; et al. Plasma gasification or refuse derived fuel in a single-stage system using different gasifying agents. Waste Manag. 2016, 47, 246–255. [Google Scholar] [CrossRef] [PubMed]
  33. Du, C.; Wu, J.; Ma, D.; Liu, Y.; Qiu, P.; Qiu, R.; Liao, S.; Gao, D. Gasification of corn cob using non-thermal arc plasma. Int. J. Hydrogen Energy 2015, 40, 12634–12649. [Google Scholar] [CrossRef]
  34. Vamvuka, D.; Zografos, D. Predicting the behaviour of ash from agricultural wastes during combustion. Fuel 2004, 83, 2051–2057. [Google Scholar] [CrossRef]
  35. Kraiem, N.; Lajili, M.; Limousy, L.; Said, R.; Jeguirim, M. Energy recovery from Tunisian agri-food wastes: Evaluation of combustion performance and emissions characteristics of green pellets prepared from tomato residues and grape marc. Energy 2016, 107, 409–418. [Google Scholar] [CrossRef]
  36. Bouraoui, Z.; Jeguirim, M.; Guizani, C.; Limousy, L.; Dupont, C.; Gadiou, R. Thermogravimetric study on the influence of structural, textural and chemical properties of biomass chars on CO2 gasification reactivity. Energy 2015, 88, 703–710. [Google Scholar] [CrossRef]
  37. Jeguirim, M.; Bikai, J.; Elmay, Y.; Limousy, L.; Njeugna, E. Thermal characterization and pyrolysis kinetics of tropical biomass feedstocks for energy recovery. Energy Sustain. Dev. 2014, 23, 188–193. [Google Scholar] [CrossRef]
  38. Blanco-López, M.C.; Blanco, C.G.; Martimez-Alonso, A.; Tascou, J.M.D. Composition of gases released during olive stones pyrolysis. J. Anal. Appl. Pyrolysis 2002, 65, 313–322. [Google Scholar] [CrossRef]
  39. Chouchene, A.; Jeguirim, M.; Favre-Reguillon, A.; Trouvé, G.; Le Buzit, G.; Khiari, B.; Zagrouba, F. Energetic valorisation of olive mill wastewater impregnated on low cost absorbent: Sawdust versus Olive Solid Waste. Energy 2012, 39, 74–81. [Google Scholar] [CrossRef]
  40. Ozveren, U.; Ozdogan, Z.S. Investigation of the slow pyrolysis kinetics of olive oil pomace using thermo-gravimetric analysis coupled with mass spectrometry. Biomass Bioenergy 2013, 58, 168–179. [Google Scholar] [CrossRef]
  41. Pantoleontos, G.; Basinas, P.; Skodras, G.; Grammelis, P.; Pintér, J.D.; Topis, S.; Sakellaropoulos, G.P. A global optimization study on the devolatilisation kinetics of coal, biomass and waste fuels. Fuel Process. Technol. 2009, 90, 762–769. [Google Scholar] [CrossRef]
  42. Chouchene, A.; Jeguirim, M.; Khiari, B.; Trouvé, G.; Zagrouba, F. Thermal degradation behavior of olive solid waste: Influence of the particle size and oxygen atmosphere. Resour. Conserv. Recycl. 2010, 54, 271–277. [Google Scholar] [CrossRef]
  43. Hmid, A.; Mondelli, D.; Fiore, S.; Fanizzi, F.P.; Al Chami, Z.; Dumontet, S. Production and characterization of biochar from three-phase olive mill waste through slow pyrolysis. Biomass Bioenergy 2014, 71, 330–339. [Google Scholar] [CrossRef]
  44. Abenavoli, L.M.; Longo, L.; Roto, A.R.; Gallucci, F.; Ghigoli, A.; Zimbalatti, G.; Russo, D.; Colantoni, A. Characterization of biochar obtained from olive and hazelnut prunings and comparison with the standards of European Biochar Certificate (EBC). Procedia Soc. Behav. Sci. 2016, 223, 698–705. [Google Scholar] [CrossRef]
  45. Kim, Y.; Ferreri, V.W.; Rosocha, L.A.; Anderson, G.K.; Abbate, A.; Kim, K.T. Effect of plasma chemistry on activated propane/air flames. IEEE Trans. Plasma Sci. 2006, 34, 2532–2536. [Google Scholar] [CrossRef]
  46. Tamošiūnas, A.; Valatkevičius, P.; Grigaitienė, V.; Valinčius, V. Production of synthesis gas from propane using thermal water vapor plasma. Int. J. Hydrogen Energy 2014, 39, 2078–2086. [Google Scholar] [CrossRef]
  47. Arena, U. Process and technological aspects of municipal solid waste gasification. A review. Waste Manag. 2012, 32, 626–639. [Google Scholar] [CrossRef] [PubMed]
  48. Tamošiūnas, A.; Valatkevičius, P.; Grigaitienė, V.; Valinčius, V. Water vapor plasma torch: Design, characteristics and applications. World Acad. Sci. Eng. Technol. 2012, 6, 10–13. [Google Scholar]
  49. De Souza-Santos, M.L. Solid Fuels Combustion and Gasification: Modeling, Simulation, and Equipment Operations, 2nd ed.; CRC Press: Boka Raton, FL, USA, 2010; p. 508. [Google Scholar]
  50. Breault, R.W. Gasification processes old and new: A basic review of the major technologies. Energies 2010, 3, 216–240. [Google Scholar] [CrossRef]
  51. Hong, Y.C.; Lee, S.J.; Shin, D.H.; Kim, Y.J.; Lee, B.J.; Cho, S.Y.; Chang, H.S. Syngas production from gasification of brown coal in a microwave torch plasma. Energy 2012, 47, 36–40. [Google Scholar] [CrossRef]
  52. Yoon, S.J.; Lee, J.G. Hydrogen-rich syngas production through coal and charcoal gasification using microwave steam and air plasma torch. Int. J. Hydrogen Energy 2012, 37, 17093–17100. [Google Scholar] [CrossRef]
  53. Messerle, V.E.; Ustimenko, A.B.; Lavrichshev, O.A. Comparative study of coal gasification: Simulation and experiment. Fuel 2016, 164, 172–179. [Google Scholar] [CrossRef]
  54. Chen, Z.; Dun, Q.; Shi, Y.; Lai, D.; Zhou, Y.; Gao, S.; Xu, G. High quality syngas production from catalytic coal gasification using disposable Ca(OH)2 catalyst. Chem. Eng. J. 2017, 316, 842–849. [Google Scholar] [CrossRef]
Figure 1. TG and DTG curves of olive pomace under inert atmosphere at 5 °C min−1.
Energies 10 00710 g001
Figure 2. Scheme of the pyrolysis reactor (red colour: hot gases).
Energies 10 00710 g002
Figure 3. Scheme of the plasma gasification setup.
Energies 10 00710 g003
Figure 4. Relation between the water vapour flow rate and the power of the plasma torch at the constant arc current intensity of 180 A.
Energies 10 00710 g004
Figure 5. Concentration of formed gaseous products during charcoal gasification vs. the time required to reach equilibrium conditions. Arc current I = 180 A, plasma torch power P = 52.2 kW.
Energies 10 00710 g005
Figure 6. Effect of the H2O/C ratio on the produced gas concentrations.
Energies 10 00710 g006
Figure 7. Effect of the H2O/C ratio on the lower heating value of the syngas.
Energies 10 00710 g007
Table 1. Ultimate analysis of different biomasses.
Biomass TypeC a (wt %)H a (wt %)N a (wt %)S a (wt %)
Olive pomace (this study)47.045.730.87<0.06
Olive tree wood [34]48.205.300.700.03
Pine Sawdust [35]51.306.400.200.01
Miscanthus [36]47.606.000.300.02
Corn cob [37]46.405.401.00.02
a Weight percentage on dry basis.
Table 2. Proximate analysis of olive pomace charcoal.
Biomass TypeMoisture (% Dry Basis)Volatile Matter (% Dry Basis)Fixed Carbon (% Dry Basis)Ash (% Dry Basis)
Olive pomace char coal2217.4775.6
Table 3. Energy content and ultimate analysis of different chars.
ParametersThis Study Olive Pomace CharOlive Mill Waste Char [43]Olive Wood Biochar [44]Hazelnut Wood Biochar [44]
Pyrolysis temperature 450 °C480 ± 10 °C400–800 °C400–800 °C
C a (wt % )80.475.390.178.1
H a (wt % )2.873.641.581.21
N (wt %)0.420.940.420.64
S a (mg/kg)271NDNDND
HHV a (MJ/kg)30.8929.2131.7126.62
LHV a (MJ/kg)30.3028.3530.4825.66
a On dry basis; ND: not determined.
Table 4. The main thermo-chemical heterogeneous and homogeneous reactions during solid waste gasification [47].
Oxidation Reactions
1.Carbon partial oxidation C + 1 2 O 2 CO –111 MJ/kmol
2.Carbon monoxide oxidation CO + 1 2 O 2 CO 2 –283 MJ/kmol
3.Carbon oxidation C + O 2 CO 2 –394 MJ/kmol
4.Hydrogen oxidation H 2 + 1 2 O 2 H 2 O –242 MJ/kmol
Gasification Reactions Involving Steam
5.Water–gas reaction C + H 2 O CO + H 2 +131 MJ/kmol
6.Water–gas shift reaction CO + H 2 O CO 2 + H 2 –41 MJ/kmol
7.Steam methane reforming CH 4 + H 2 O CO + 3 H 2 +206 MJ/kmol
Gasification Reactions Involving Hydrogen
8.Hydrogasification C + 2 H 2 CH 4 –75 MJ/kmol
9.Methanation CO + 3 H 2 CH 4 + H 2 O –227 MJ/kmol
Gasification Reactions Involving Carbon Monoxide
10.Bouduard reaction C + CO 2 2 CO +172 MJ/kmol
Table 5. Comparison with other similar coal/charcoal gasification methods.
MethodGasifying AgentMaterialH2 (vol %)CO (vol %)H2/COLHVsyngas (MJ/nm3)Ref.
Conventional gasification (Lurgi, HTW, Siemens, Shell, etc.)
Moving BedOxygenCoal *28.1–42.315.1–61.20.5–2.74–11[47,50]
Steam/air 16.2–23.317.1–27.80.69–1.35
Fluidized BedOxygenCoal *32.8–40.031.0–53.00.71–0.85
Steam/air 12.6–28.5612.54–30.70.56–1.0
Entrained flowOxygenCoal *28.1–42.315.1–61.20.51–2.72
Steam/air 15.7–25.516.1–31.00.82–2.00
Transport flowOxygenCoal *36.2–41.925.5–39.10.92–1.64
Steam/air 11.8–15.713.3–23.70.5–1.18
Plasma gasification (MW, DC)
MW Steam/airCoal48232.08-[51]
O2/airCoal21.351.70.41-
MWSteamCoal62203.110.9[52]
Charcoal58173.4110.4
DC thermal arc plasmaSteam/airCoal58.735.51.65-[53]
DC thermal arc plasmaSteam/airCoal39341.14-[31]
DC thermal arc plasmaSteamCharcoal41.1713.063.156.09This work
* Coal—means various types of coals (brown, lignite, bituminous, sub-bit, anthracite).

