Article

Insulation Resistance Monitoring Algorithm for Battery Pack in Electric Vehicle Based on Extended Kalman Filtering

1
State Key Laboratory of Automotive Simulation and Control, Jilin University, Changchun 130022, China
2
School of Mechanical Science and Engineering, Jilin University; Changchun 130022, China
3
Department of Automotive Engineering, College of Automotive Engineering, Jilin University, Changchun 130022, China
*
Author to whom correspondence should be addressed.
Energies 2017, 10(5), 714; https://doi.org/10.3390/en10050714
Submission received: 16 March 2017 / Revised: 1 May 2017 / Accepted: 12 May 2017 / Published: 18 May 2017
(This article belongs to the Section F: Electrical Engineering)

Abstract

:
To improve the accuracy of insulation monitoring between the battery pack and chassis of electric vehicles, we established a serial battery pack model composed of first-order resistor-capacitor (RC) circuit battery cells. We then designed a low-voltage, low-frequency insulation monitoring model based on this serial battery pack model. An extended Kalman filter (EKF) was designed for this non-linear system to filter the measured results, thus mitigating the influence of noise. Experimental and simulation results show that the proposed monitoring model and extended Kalman filtering algorithm for insulation resistance monitoring present satisfactory estimation accuracy and robustness.

1. Introduction

The voltages of storage batteries, fuel cells, and ultra-capacitors for electric vehicles far exceed the safety limit for the human body, with certain battery packs reaching voltages of 600 V. The performance of insulating materials, however, degrades after a certain period. Other factors, such as humidity, can also decrease the performance of the insulation between a high-voltage system and the chassis ground. Such decrease will create a leakage circuit when the positive or negative wire penetrates the insulating layer and connects to the chassis ground, which increases its electric potential and thus affects the operation of the motor controller, other low-voltage electronics, and passengers’ safety. When insulation performance is degraded in multiple points between the high-voltage circuit and the chassis ground, heat energy accumulates, which may cause electrical fires under serious circumstances. To ensure safe vehicle operation, a specialized device should be designed for the real-time online monitoring of insulation resistance between the high-voltage system and the chassis ground [1,2].
Current methods for monitoring insulation within electric vehicles all have significant drawbacks. The two most prevalent methods, namely, balanced bridge circuit [3,4] and the unbalanced bridge circuit [5], cannot detect leakage between the battery pack and the chassis ground. Furthermore, the introduction of reference resistance during measurement reduces the insulation performance of the system. The accuracy of non-contact current differential detection [6] for insulation monitoring in electric vehicles requires further improvement. Although the alternating current (AC)-voltage signal injection method [7] mitigates the interference of electromagnetic signals of a vehicle to the monitoring circuit, the frequent injection of high-voltage signals affects the safe operation of battery packs. In addition, although the proposed low-voltage, low-frequency signal injection method can detect leakage within the battery pack, mismeasurement may occur during voltage spikes. To improve the accuracy of dynamic insulation monitoring, in the present study, measurement and system noise were considered based on the low-voltage, low-frequency signal injection method, and the insulation monitoring of the battery pack was modeled. On the basis of this model, results were filtered according to the extended Kalman filtering algorithm so that calculation results would most closely approximate actual insulation resistance.

2. Mechanism of the Low-Voltage, Low-Frequency Signal Injection Method Monitoring Circuit

Figure 1 shows the overall voltage curve of the battery pack of an electric vehicle during realistic working conditions. In this figure, A to B and E to F are hard acceleration processes, whereas C to D and G to H are regenerative braking processes. During these processes, the violent fluctuation in the overall voltage can be as high as 80 V. To analyze the effect of changes in the overall voltage of the battery pack on monitoring accuracy, the equivalent circuit model of the battery pack should be considered in the insulation monitoring model. The insulation resistance monitoring model of the battery pack (Figure 2) can be acquired via the low-voltage, low-frequency signal injection method, where: E1En are the open-circuit voltages of the battery cells; r01r0n are the internal resistances; r1rn are the polarized resistances; C1Cn are the polarized capacitors; R0Rn are the insulation resistances between the batteries in series and the chassis ground; I is the bus current of the battery pack; Rr1 and Rr2 are the reference resistances of the monitoring circuit (with both values being Rr); Rs is the sampling resistance; and Ef is the square-wave generator.
The maximum leakage current occurs at either the positive or negative electrode of the battery pack. Thus, the insulation resistance of the two electrodes should be monitored to determine the insulation performance of the battery pack. The insulation resistances of the positive and negative electrodes are defined as Rp and Rn respectively. Therefore,
Rp = R1//R2…//Rn,
and,
Rn = R0.
The insulation resistance monitoring circuit of the positive electrode Rp can be simplified as shown in Figure 3, where EH is the terminal voltage of the battery pack, Vf is the low-voltage monitoring square-wave voltage, and Vs is the voltage of the sampling resistance. The monitoring voltage generates a monitoring current that flows into the sampling resistance. Then, the square-wave voltage signal generated from the sampling resistance is measured and converted by the control unit in accordance with Equation (6). The value of insulation resistance will be calculated within the control unit.
Equation (6) can be acquired via the following steps:
I 2 = I 1 + I s
V f = R p × I s + R r 2 × I 2 + R s × I s
V h = R r 1 × I 1 + R r 2 × I 2
where Vs can be measured through the voltage measuring circuit. Therefore, Is can be expressed through Equation (4). The correlation between Rr1 and Rr2 can be expressed as Equation (5).
I s = V s / R s
R r 1 = R r 2 = R r
Therefore, through conversion, the insulation resistance between the positive electrode and the chassis ground is:
R p = R s × 2 × V f V h 2 × V s R s 0.5 × R r

3. Design of the Discrete Extended Kalman Filter

The extended Kalman filter (EKF) was designed during system modeling to reduce the impact of the overall voltage fluctuation. The extended Kalman filtering algorithm includes a highly efficient observer, which also presents high robustness against non-linear systems [8,9]. To apply the EKF in the insulation monitoring system, the system should be described by a state space model [10], which can be expressed as:
X ( k + 1 ) = f [ k , X ( k ) ] + G ( k ) × W ( k )
Z ( k ) = h [ k , X ( k ) ] + V ( k )
where X(k + 1) and X(k) are the respective system state vectors at the kth and (k + 1)th sampling time; G ( k ) is the noise-driving matrix; W ( k ) is the process noise; V ( k ) is the observation noise; and f [ k , X ( k ) ] and h [ k , X ( k ) ] are functions that describe the system. In the mode of the insulation monitoring system proposed in this paper, X(k) = [Vh(k) Vs(k)]T. Thus,
f [ k , X ( k ) ] = X ( k )
h [ k , X ( k ) ] = V f × R S B × X ( k ) A × X ( k ) × R S B × X ( k ) R S 0.5 × R r
where A = [ 1 0 ] , B = [ 0 1 ] and X ( k ) = [ V h V s ] T .
Given that the system is nonlinear, a linearization process is undertaken at each step to approximate a nonlinear system with a linear time-varying system [11]:
X ( k + 1 ) = F ( k + 1 | k ) X ( k ) + G ( k ) × W ( k ) + Φ ( k )
Z ( k ) = h [ X ( k | k 1 ) , k ] + h X ( k ) | X ( k | k 1 ) [ X ( k ) X ( k | k 1 ) ] + V ( k )
where,
h X ( k ) | X ( k | k 1 ) = H ( k )
h [ X ( k | k 1 ) , k ] h X ( k ) | X ( k | k 1 ) X ( k | k 1 ) = y ( k )
Therefore, Equation (12) can be expressed as:
Z ( k ) = H ( k ) X ( k ) + y ( k ) + V ( k )
The linearized model is then acquired as:
X ( k + 1 ) = F ( k + 1 | k ) X ( k ) + G ( k ) × W ( k )
Z ( k ) = H ( k ) X ( k ) + y ( k ) + V ( k )
where,
F ( k + 1 | k ) = 1 ,
  • G ( k ) is the noise-driven matrix,
  • W ( k ) is the process noise with an average value of 0 and a variance of Q, and
  • V ( k ) is white Gaussian noise with an average value of 0 and a variance of R.
    H ( k ) = [ R s 2 × X k 1 ( 2 ) R s ( 2 × V f + X k 1 ( 1 ) ) 2 × ( X k 1 ( 2 ) ) 2 ]
The choice of covariance matrices affects the filter convergence and should thus be considered with care. In practice, process and measurement noises Q and R are difficult to obtain [12]. Therefore, they are often used as tuning parameters. Laroche et al. [13] proposed a methodology for tuning Q to achieve parameter tracking. The component of the matrix is chosen as the square of the typical parameter variation on a sampling interval. To ensure convergence in less than 40 s and without being too senstive to the noise, after measurement and multiple adjustment, Q = [ 0.04 0.01 ] and R = 80 are chosen.
EKF is essentially based on the principle of minimizing the mean square error estimation to seek a recursive estimation algorithm. The time update and measurement update are consecutively performed at each time interval. The detailed steps can be summarized by the following steps [14,15]:
(1)
Initial state X(0) and P0.
(2)
Time update, which includes the state space update and covariance of the error update:
X k = X ^ k 1
P k = F k P ^ k 1 F k T + Q k
where X k is the predicted state at step k, X ^ k 1 is the previous estimated state at step k−1, P k is the predicted error covariance at step k, and P ^ k 1 is the estimated error covariance at step k−1.
(3)
Measurement update, which involves Kalman gain calculation, state estimation measurement update, and error covariance update:
K k = P k × H k T × [ H k × P k × H k T ] 1
Z k = H k × X k
X ^ k = X k + K × ( Z k Z k )
P ^ k = ( I K k × H k ) × P k
where K k is the Kalman gain, Z k is the predicted output, and Z k is the measured output.

4. Matlab Simulation Model and Analysis

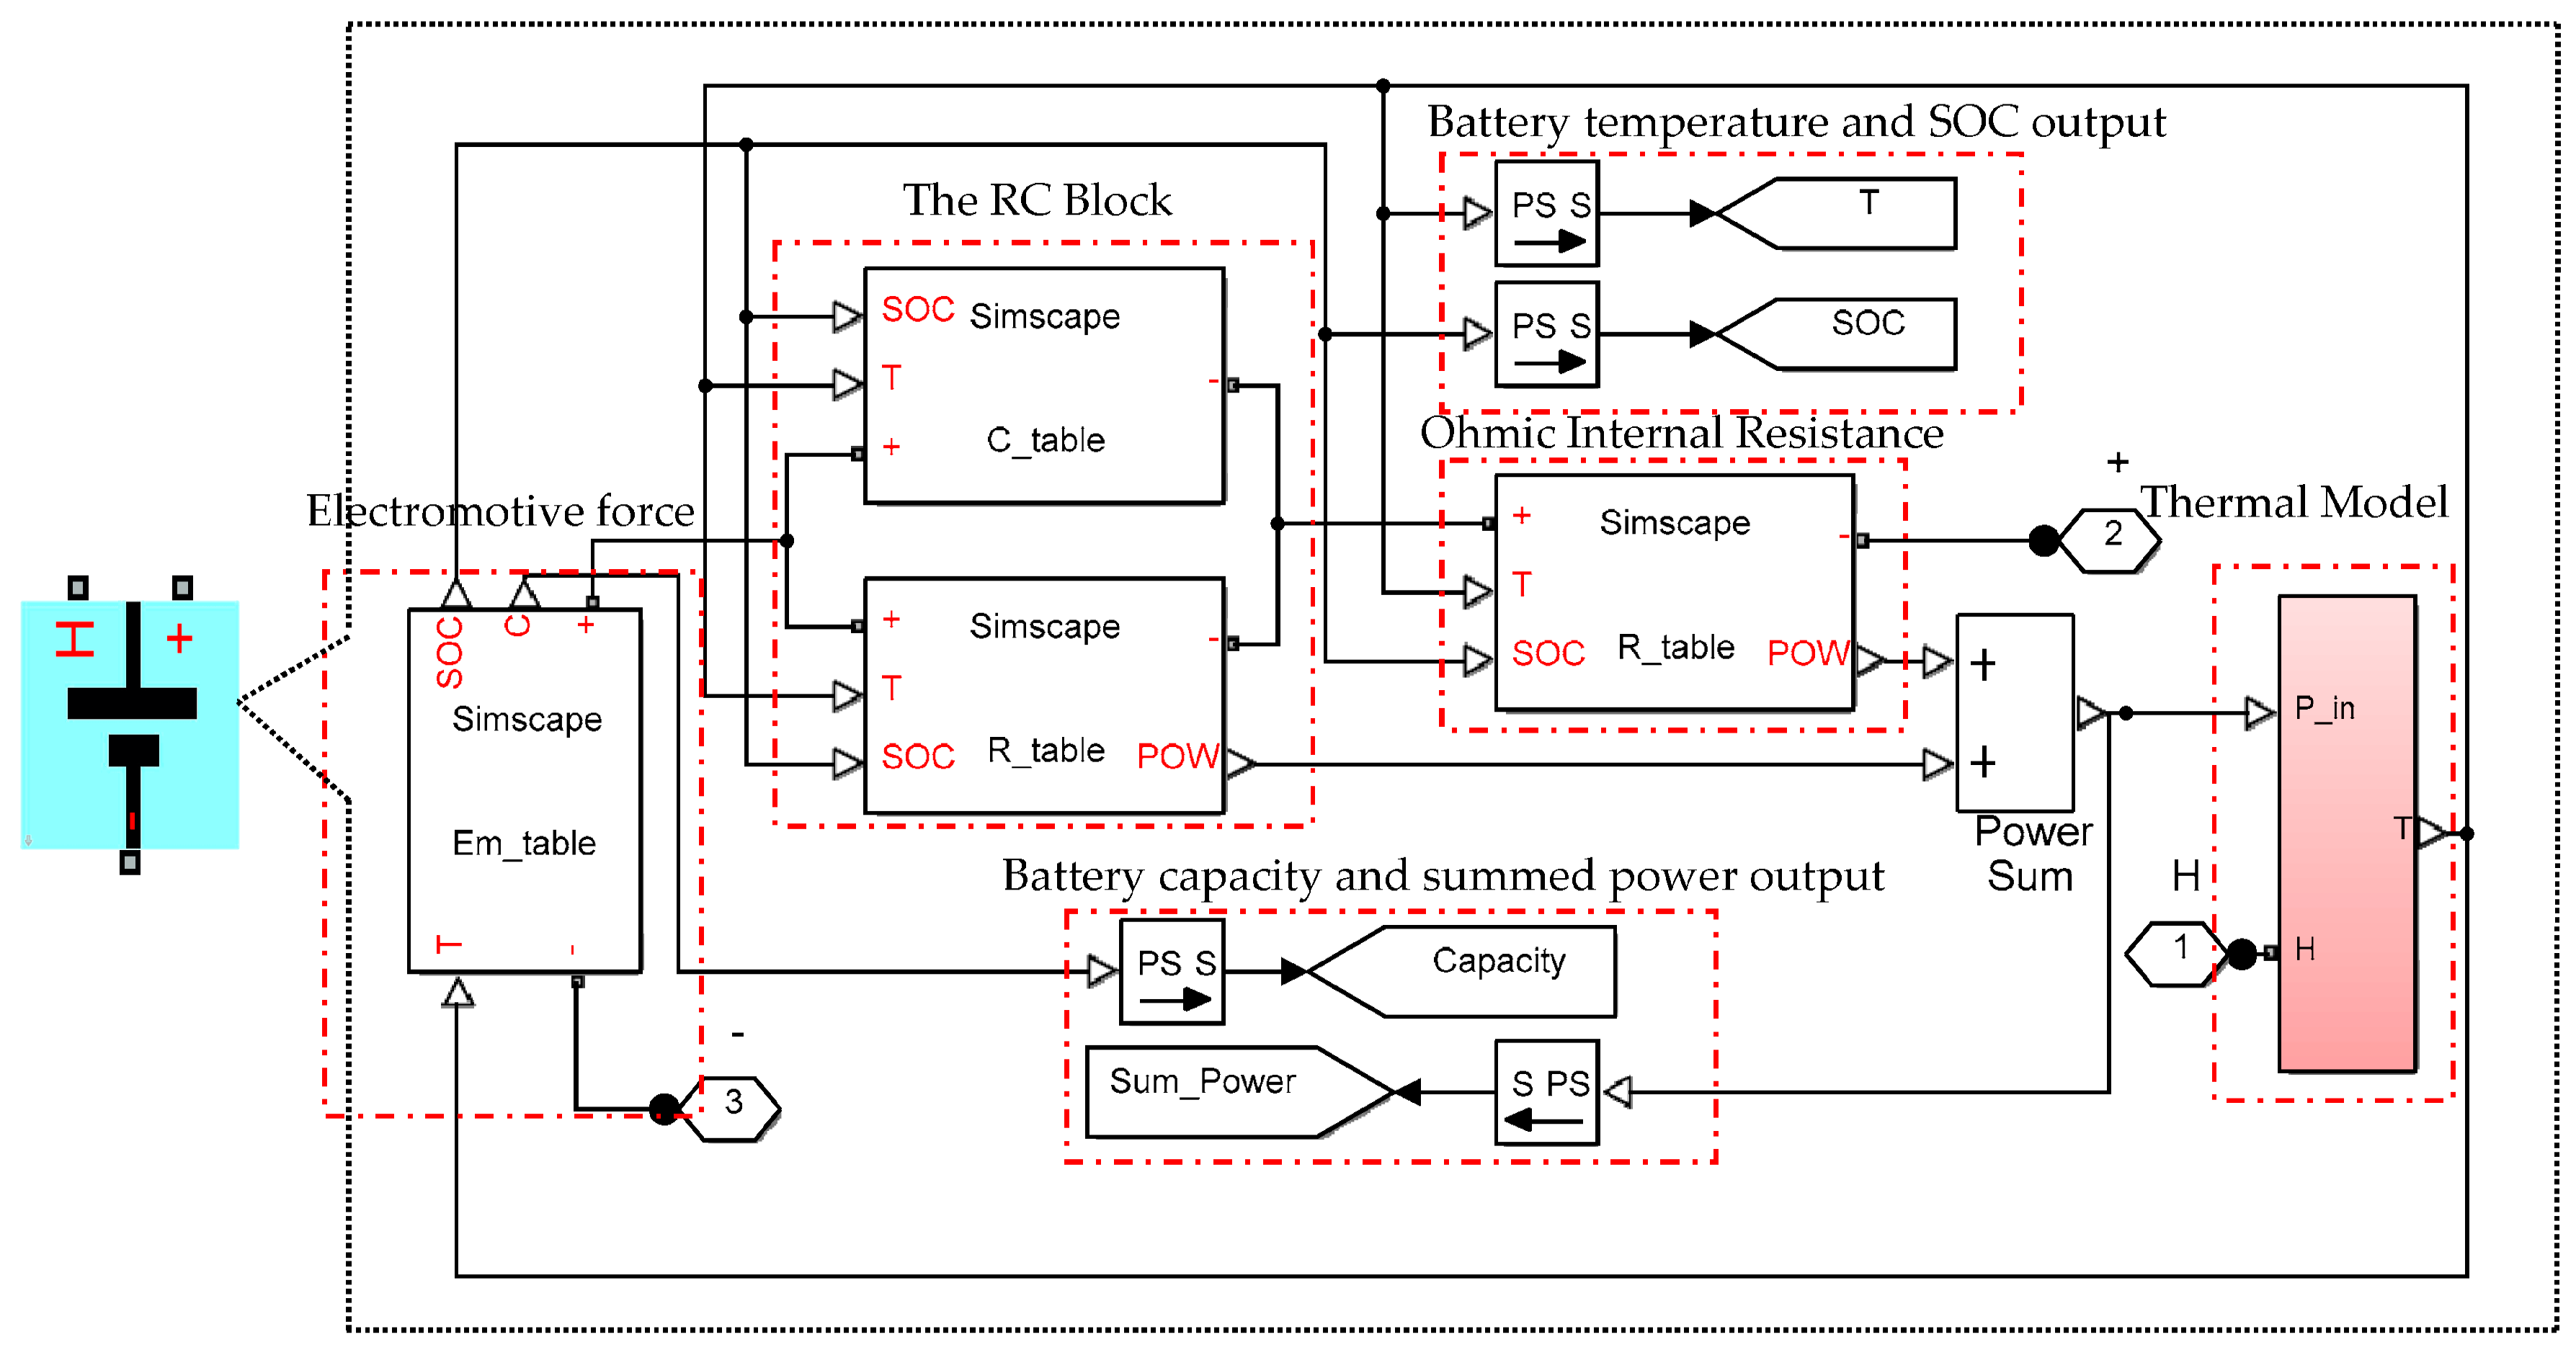
4.1. Simscape Battery Cell Model

Several battery models and charging and discharging characteristics were described in references [16,17,18,19]. The first-order equivalent circuit model is very common in simulating cell voltage change because the model is relatively simple, can easily obtain parameters, and runs in real time. The core goal of the equivalent circuit model is to simulate the actual battery voltage response of the current input. Huria et al. [20] reported that the first-order resistor-capacitor (RC) circuit model is precise for most industrial application. Increasing the order will significantly increase the amount of required calculation, but will not increase accuracy [21]. The first-order equivalent circuit model is supported by Huria et al. [20] due to its accuracy and feasibility, and many researchers have adapted this model in their studies [18,22,23,24,25]. Figure 4 shows the classic first-order RC equivalent circuit model. The equivalent circuit model, which contains a voltage source, series resistor, and a pair of RC, accurately describes cell characteristics.
The electrical behavior of a practical model [26] shown in Figure 4 can be expressed as follows:
U 1 = U 1 R 1 C 1 + I L C 1
U t = E m U 1 I L R 0
In Figure 4, Em is the open circuit voltage; R1 and C1 are the resistance and capacitance of polarization effect respectively, and R0 represents the resistance of battery. Em, R1, C1, and R0 are functions of the state of charge (SOC) and temperature. Specifically, these four elements can be obtained from the two-dimensional look-up tables:
R0 = R0 (SOC, T)
R1 = R1 (SOC, T)
C1 = C1 (SOC, T)
Em = Em (SOC, T)
Those look-up tables were obtained by using a parameter estimation tool in Simulink Design Optimization (R2012b, The MathWorks, Inc, Natick, MA, USA) with series pulse discharge data under different temperatures. These look-up tables were selected based on seven different points of SOC. The pulse discharge curve for each temperature was run individually through estimation. This will produce a set of one-dimensional look-up tables versus SOC for the four parameters at each temperature. Simulink Design Optimization iteratively simulated the discharge profile in Simscape while comparing the simulation results with experimental data. Then also, using nonlinear least squares algorithm, the error gradient across each of the 28 parameters (four tables × seven breakpoints) to minimize the sum of squared error.
We used the battery model from reference [20], which is a fidelity electrical model with thermal dependence, to characterize and simulate high-power lithium battery cells. Hence, the SOC and temperature were calculated following the method cited in the literature. SOC was calculated in Coulomb counting using Equation (29), and SOC(t0) was periodically recalibrated by the SOC-OCV (open circuit voltage) curve. State of health (SOH) was calculated using Equations (30) and (31) as follows:
SOC(t) = SOC(t0) − (∫ I(t) dt)/CM,
CM = (PassedCharge)/(SOC2 − SOC1),
SOH = CM/CN × 100%,
where SOC(t0) is the SOC at the beginning of the discharge or charge; I(t) is the working current; CM is the current capacity of the battery; CN is the brand new capacity of the battery; PassedCharge is the total capacity flow out of the battery; and SOC1 and SOC2 are the SOCs of the battery before and after discharge, respectively.
Thermal influence is not usually considered in the currently proposed battery models. However, Huria et al. [20] added a thermal model to the equivalent circuit model and creatively improved the Simscape model. As shown in Figure 5, the Simscape model contains three input terminals (environment temperature input, positive, and negative) and three output terminals (battery temperature, SOC, and energy consumption power).
These outputs can be used to analyze the operating state of the cell and estimate the system insulation resistance. The Simscape model is suitable for Matlab simulation and analysis. The parameters of the equivalent circuit model can be estimated through the least square method with experimental data, which can be obtained by pulse discharge process under different temperatures and SOCs. Then, the parameter results are incorporated into look-up tables that are related to SOC and temperature T. The computer determines the parameters of the model via the look-up tables. This is a practical method. Moreover, the Simscape model has been tested by Huria et al. [20] and Wang et al. [27]. Their results indicate that the model responds accurately in a given battery voltage fluctuation.

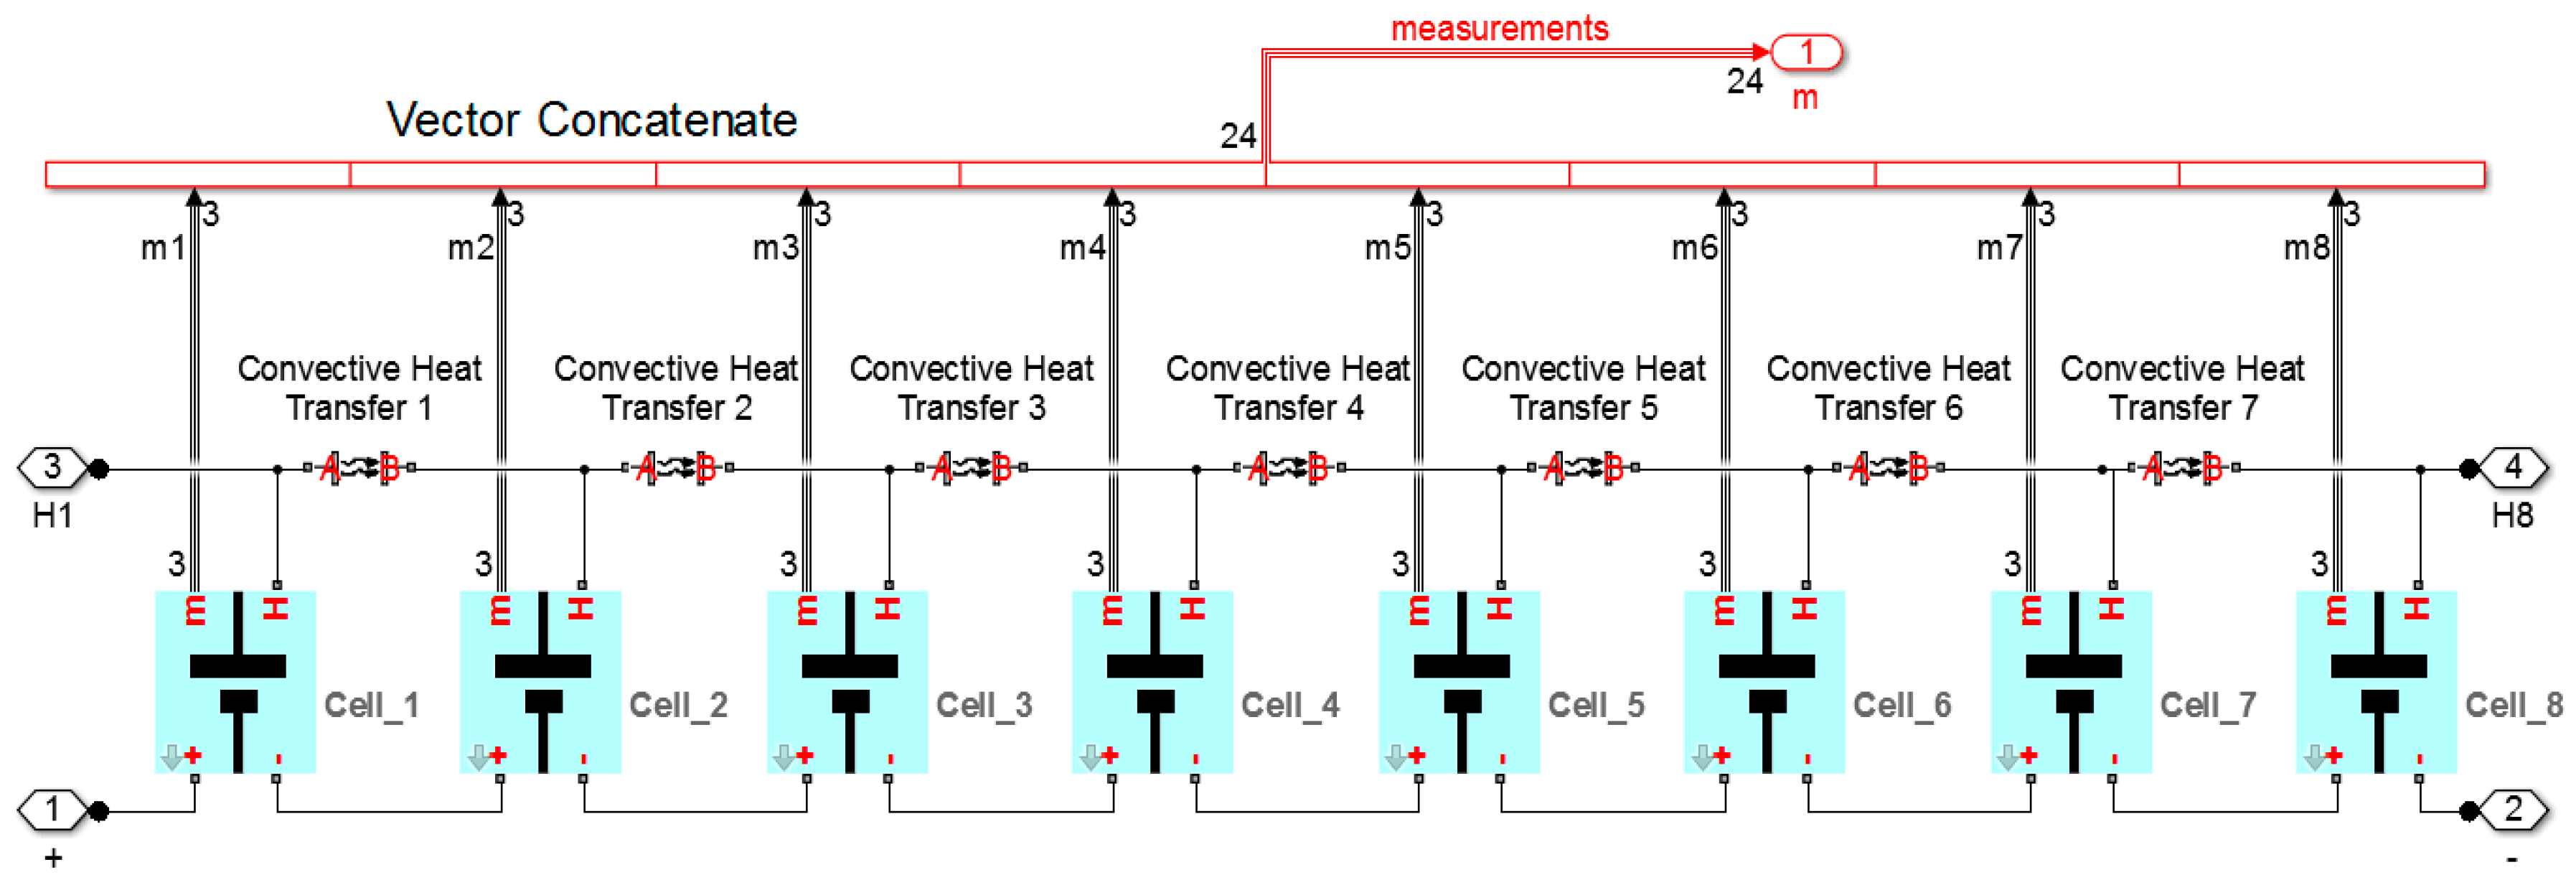
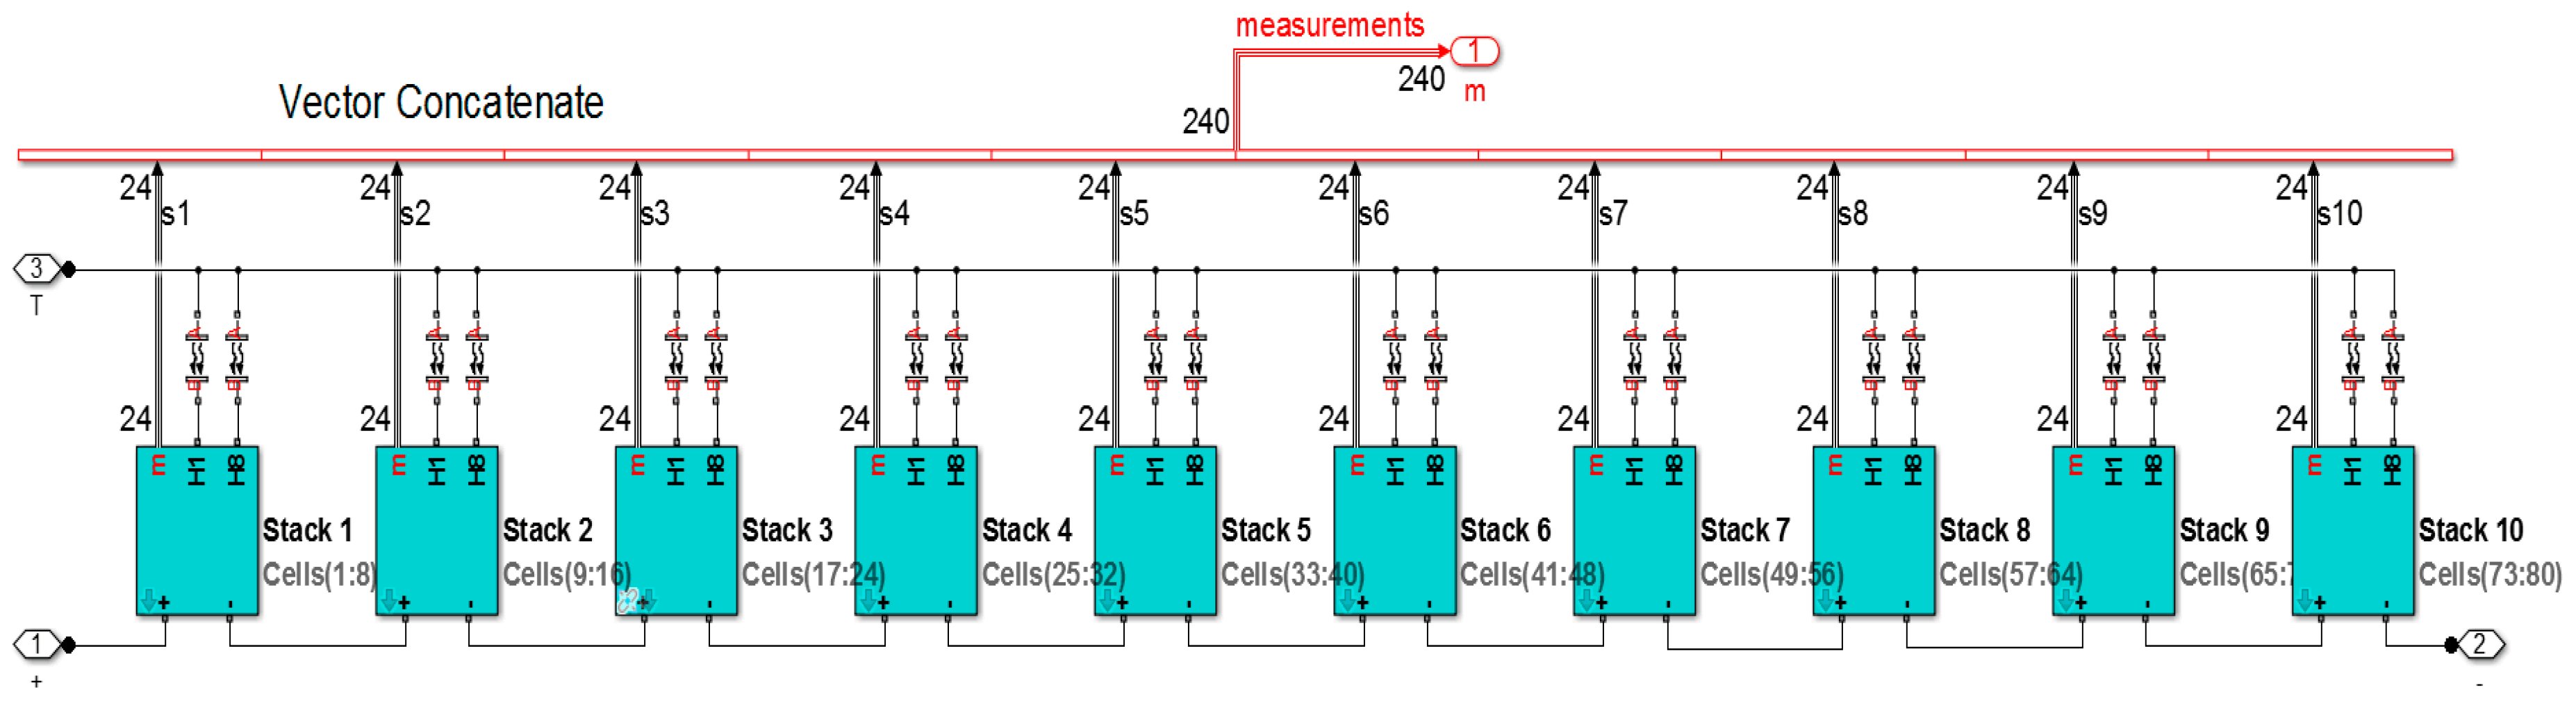
4.2. Battery Pack Model

Eight cells were connected in series to compose a stack (Figure 6). The internal structure of each battery is shown in Figure 5, where the H terminal outputs the internal temperature of the battery, and convective heat transfer occurs between two batteries to simulate the heat transfer on both sides of the battery. The m-port on each battery outputs the collected battery voltage, current, and temperature. Next, 10 stacks were again connected in series to compose a pack (Figure 7). The model parameters are derived from 80 ICR18650 battery cells (Samsung SDI Co., Ltd., Yongin-Si, Gyeonggi-Do, Korea) using the method in [20]. The discharge capacity of the series battery pack is limited by the cell with the smallest SOC. Therefore, we make the minimum value of the SOCs of all series cells as the SOC of the battery pack. Similarly, the SOH of the battery pack is the minimum of the series cells’ SOHs.
Through the charging and discharging process of the 80 battery cells, we validated the accuracy of our model relative to the actual reaction. We built a 3.2-Ah, 296-V battery pack model composed of 80 battery cells that were connected in series. When the pack is fully charged, the voltage can reach 336 V. Figure 8 compares the battery voltage between the simulation and experimental results for the battery pack under a (a) constant current/constant voltage (CC/CV) charging mode, and a (b) 0.5 C/1 C discharging mode. The simulation results closely approximate the experimental values and have a maximum error of 1.6%. These results showed that the battery pack model accurately reflects the actual voltage and can be applied in the insulation monitoring of the power system.

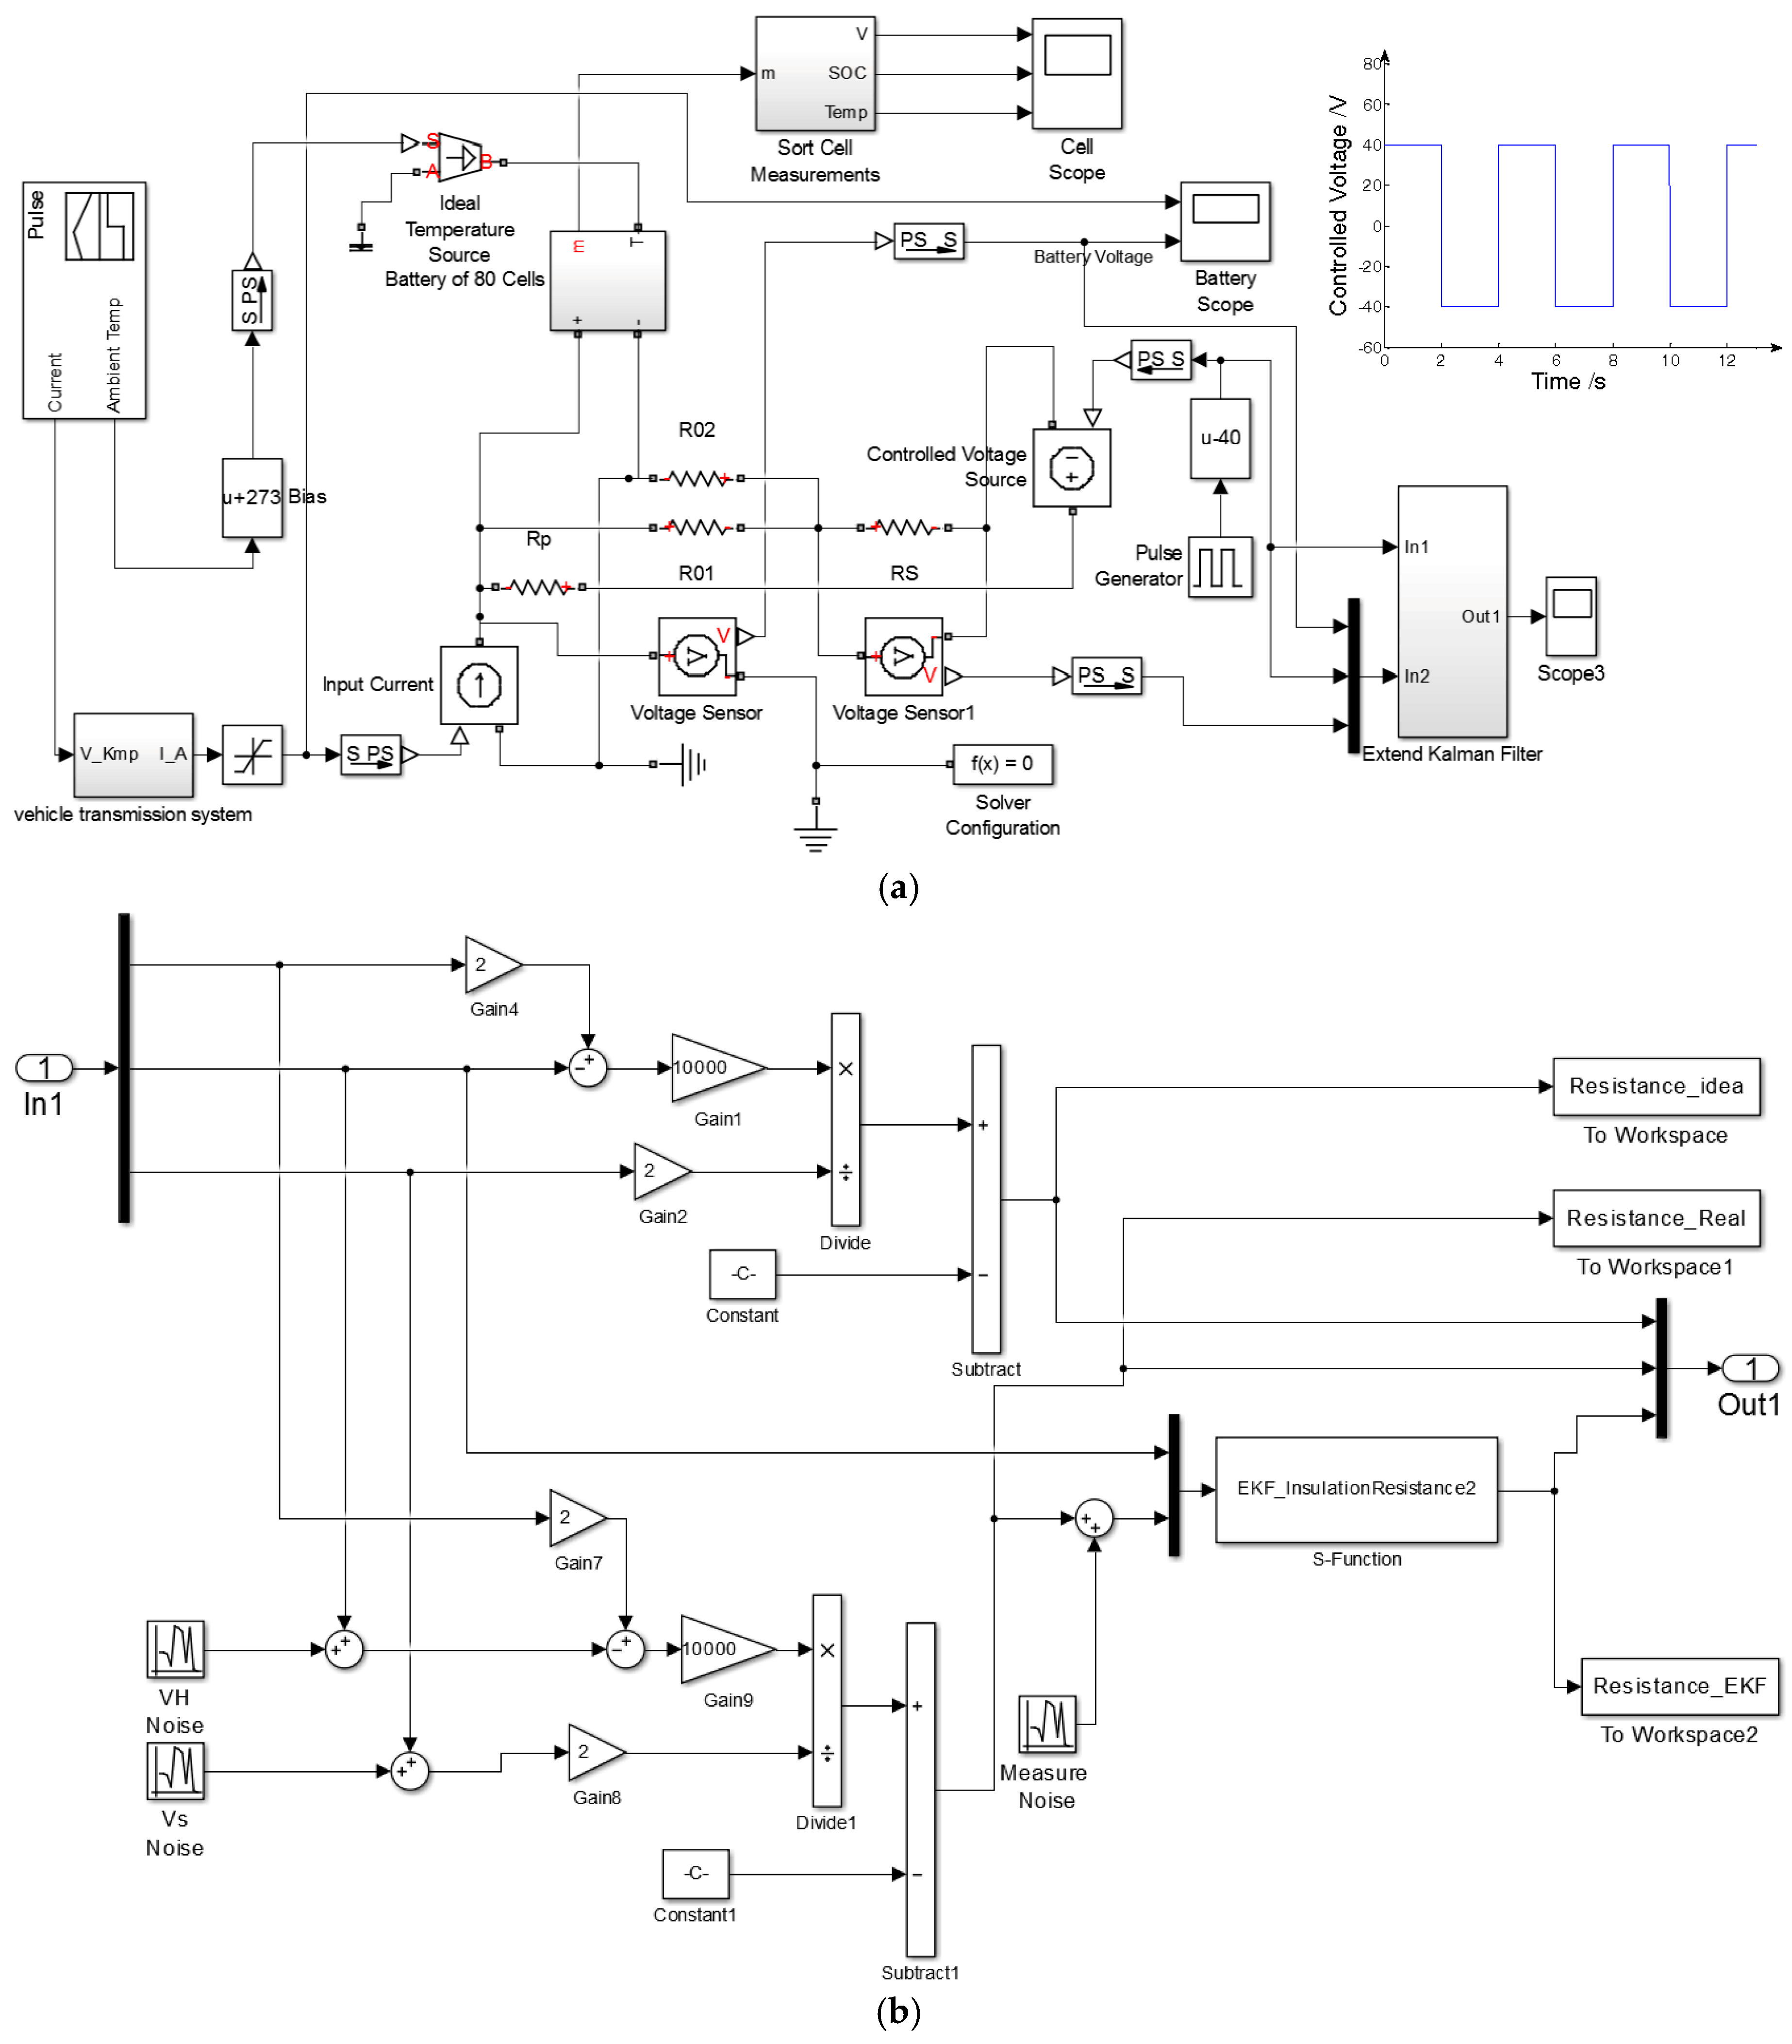
4.3. Insulation Resistance Monitoring Model

The monitoring model is shown in Figure 9. In the model, vehicle speed and ambient temperature were simulated by Signal Builder. The power system of the vehicle was also simulated through the vehicle transmission system, which calculated the current through the battery pack. R01 and R02 are the reference resistances, Rs is the sampling resistance, and Rp is the insulation resistance between the simulated battery pack and the chassis ground. In Figure 9a, the Vf signal waveform is drawn to express the Vf signal more clearly, with a signal voltage of ±40 V and a frequency of 0.25 Hz. The Figure 9b shows that the extended Kalman filtering algorithm was achieved by the EKF block. In the simulation experiment, the variances of the noises added to VH and Vs signals are 0.02 and 0.00001 respectively and the measure noise is 80 or 800.
In the simulation, R01 = 2000 KΩ, R02 = 2000 KΩ, and RS = 10 KΩ, and the NEDC operating cycle was simulated. The system impedance was set as 2000 KΩ and 20 KΩ. The variance of the simulation noise was set as 4000 and 80 K. The results are shown in Table 1. A comparison of simulations 1 and 2, or of 3 and 4, revealed that the monitoring circuit calculates the insulation resistance regardless of the value of system impedance and the variance of noise. In addition, EKF effectively reduced the maximum absolute error and the root mean square error. A comparison of simulations 1 and 3, or of 2 and 4, revealed that the extended Kalman filtering algorithm markedly improves monitoring accuracy when the system is suffering from degraded insulation performance.

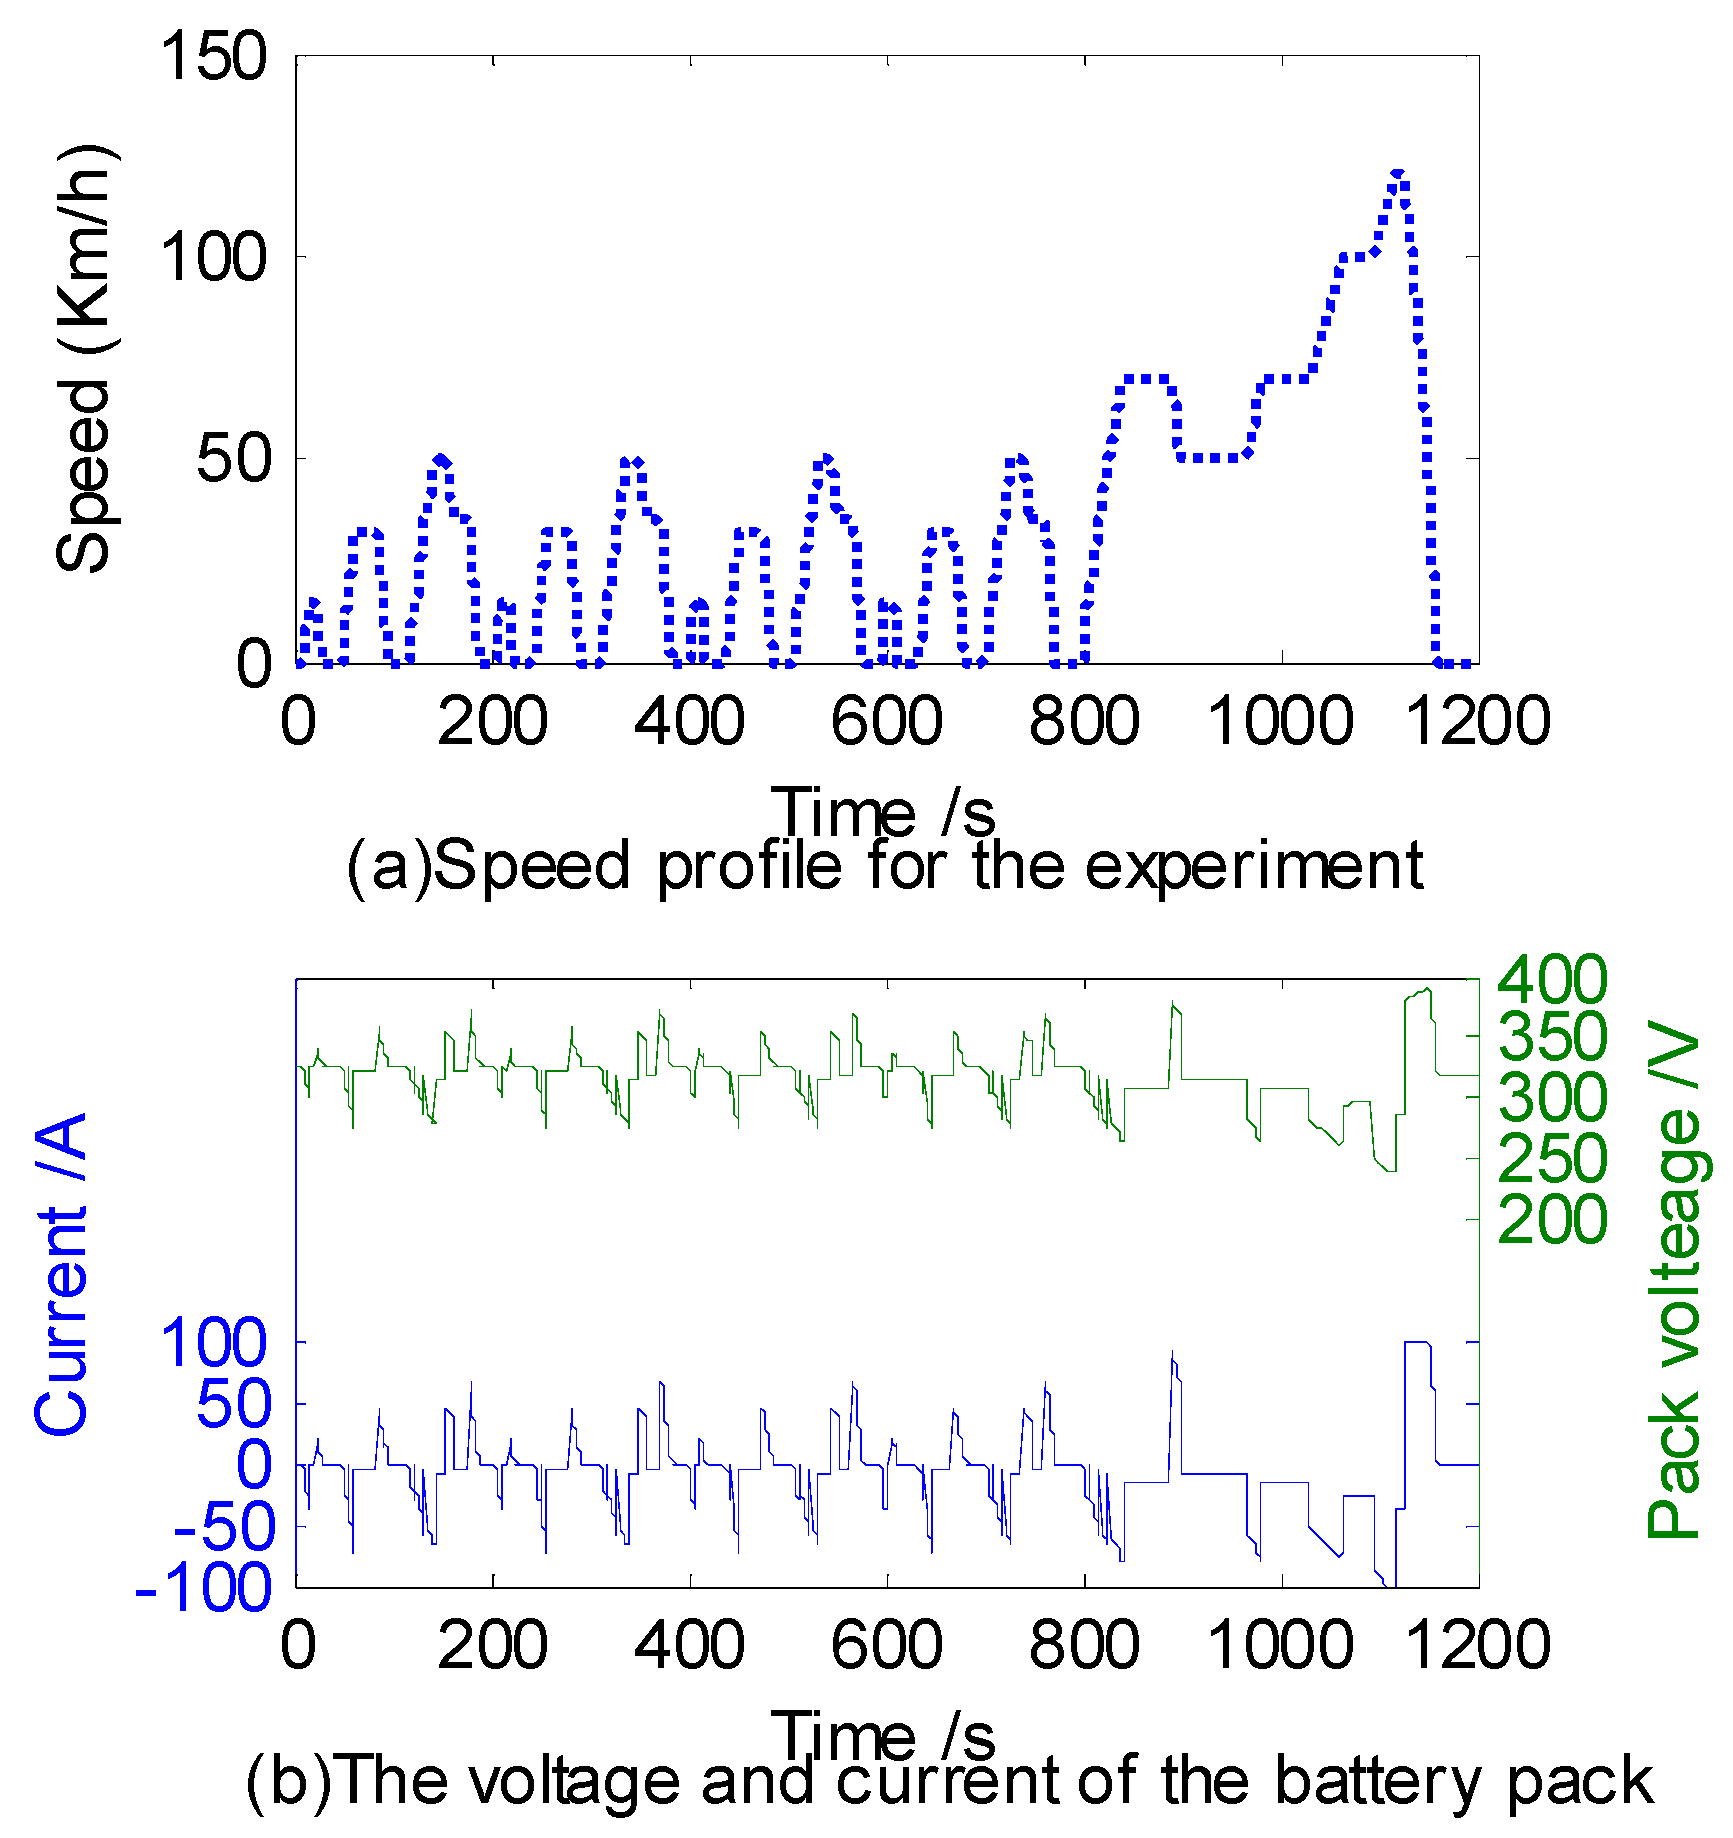
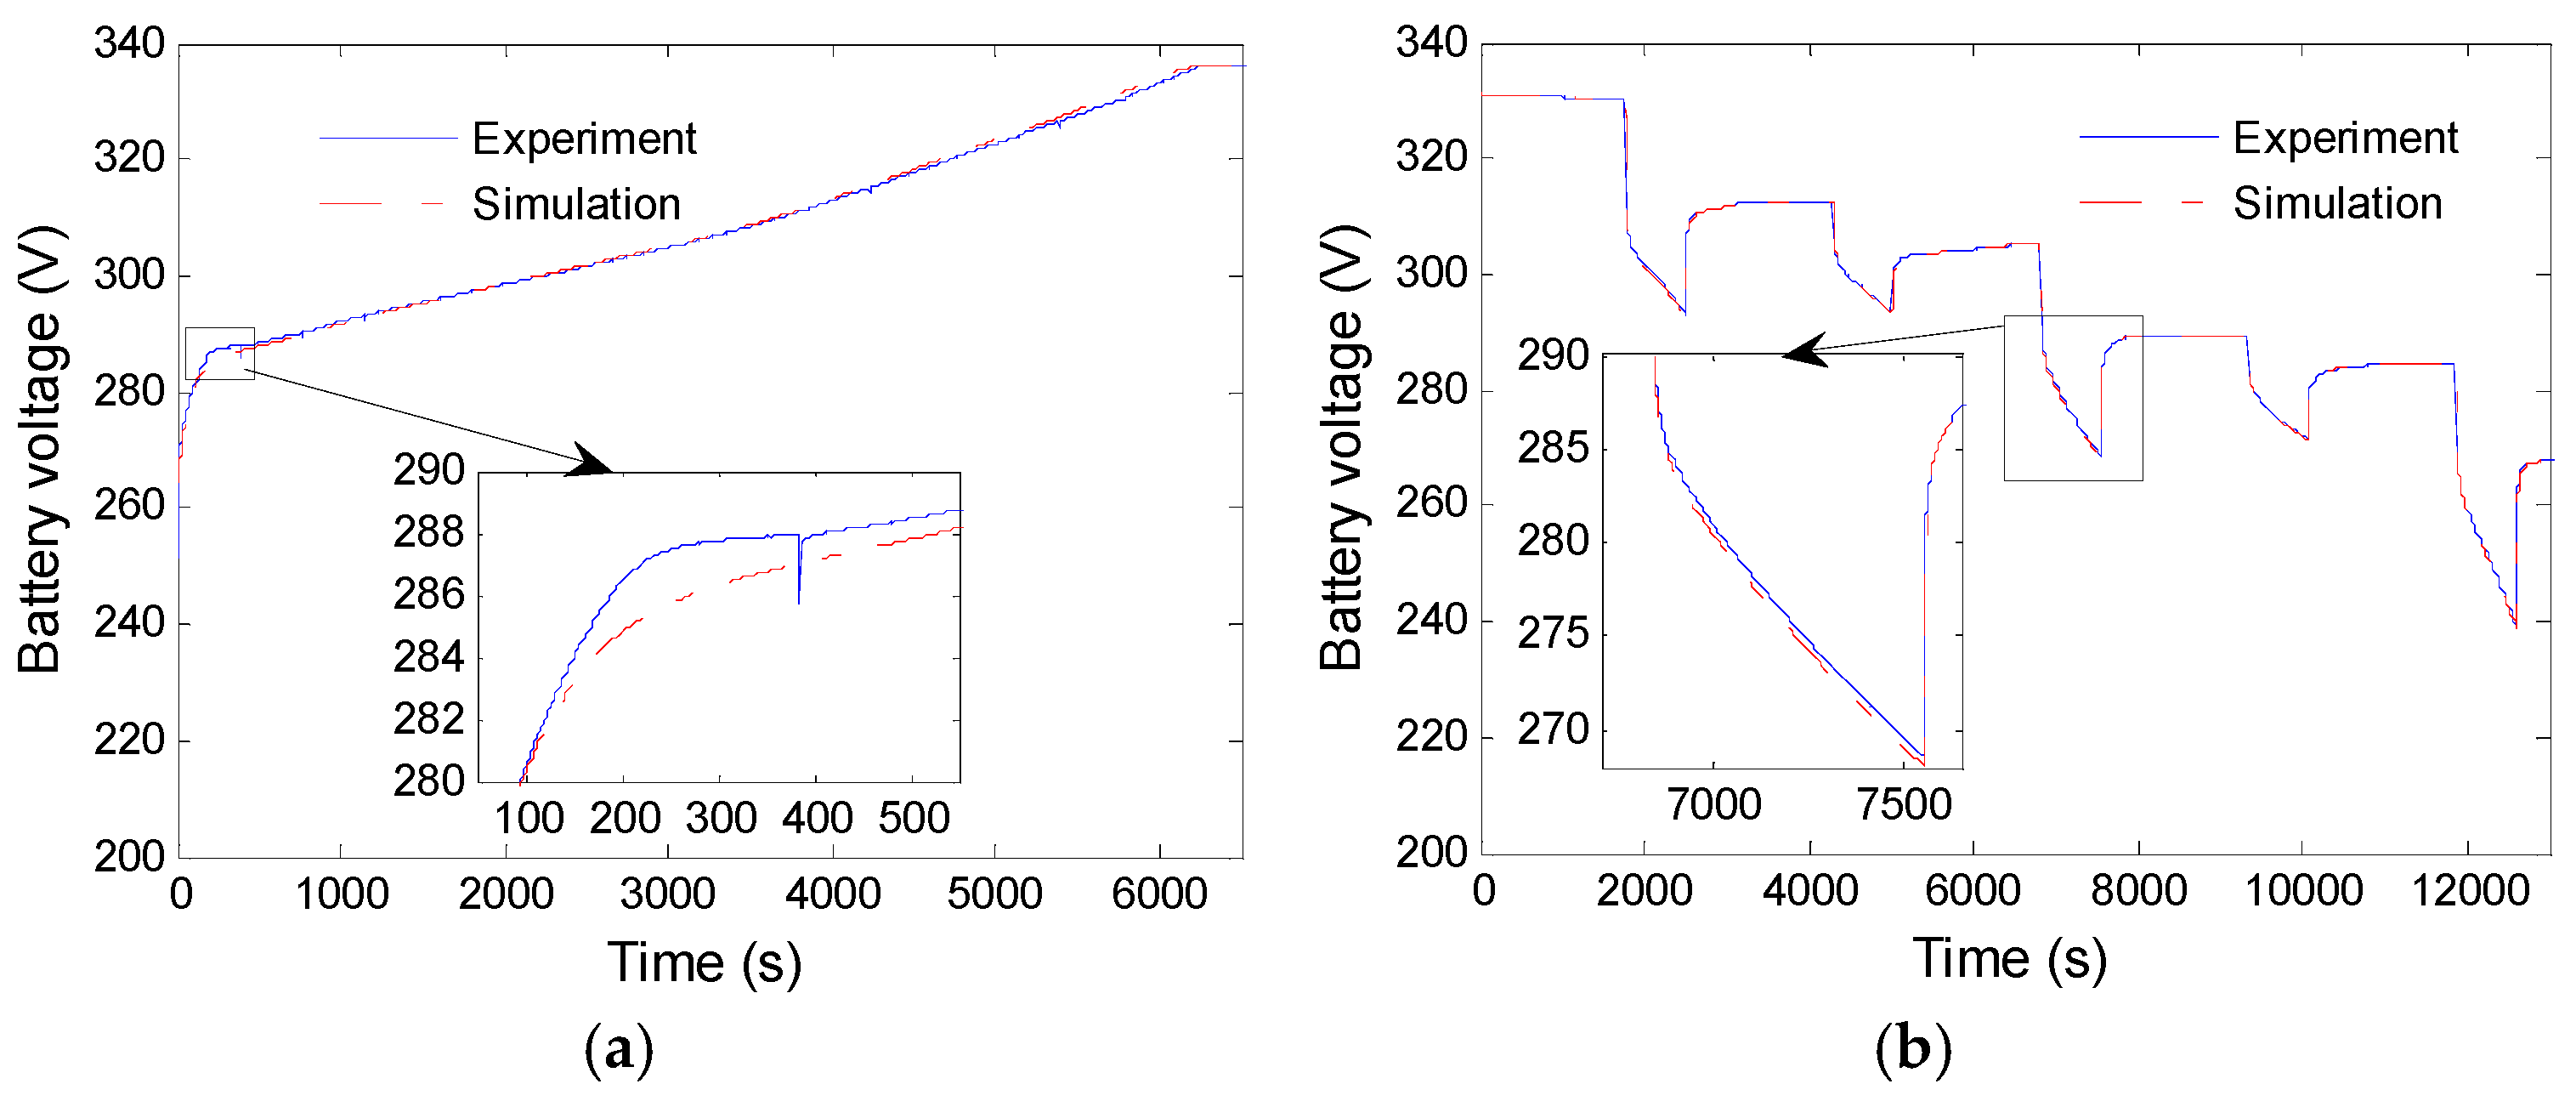
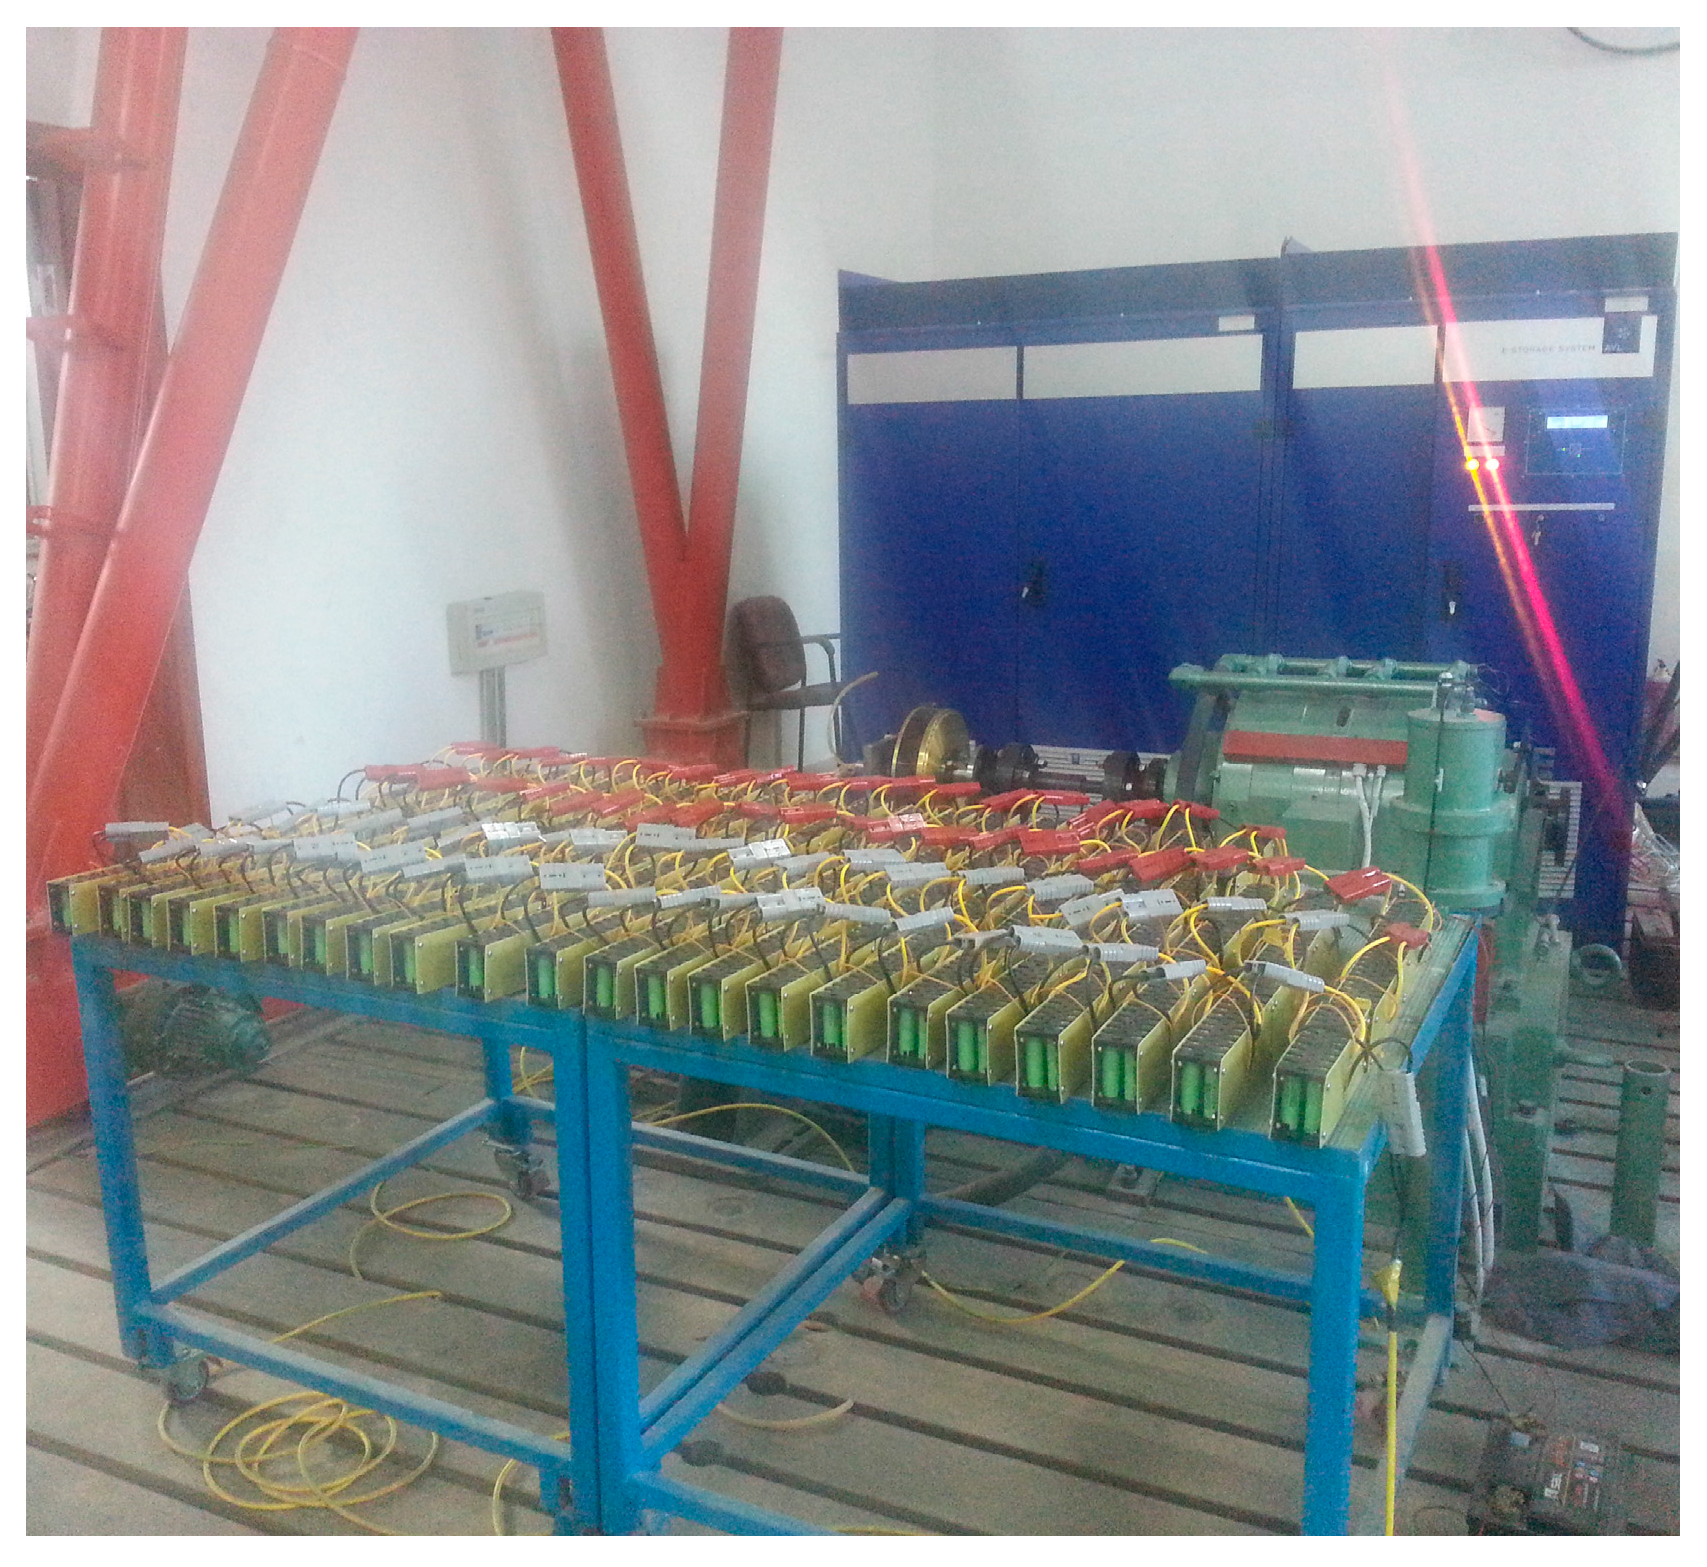
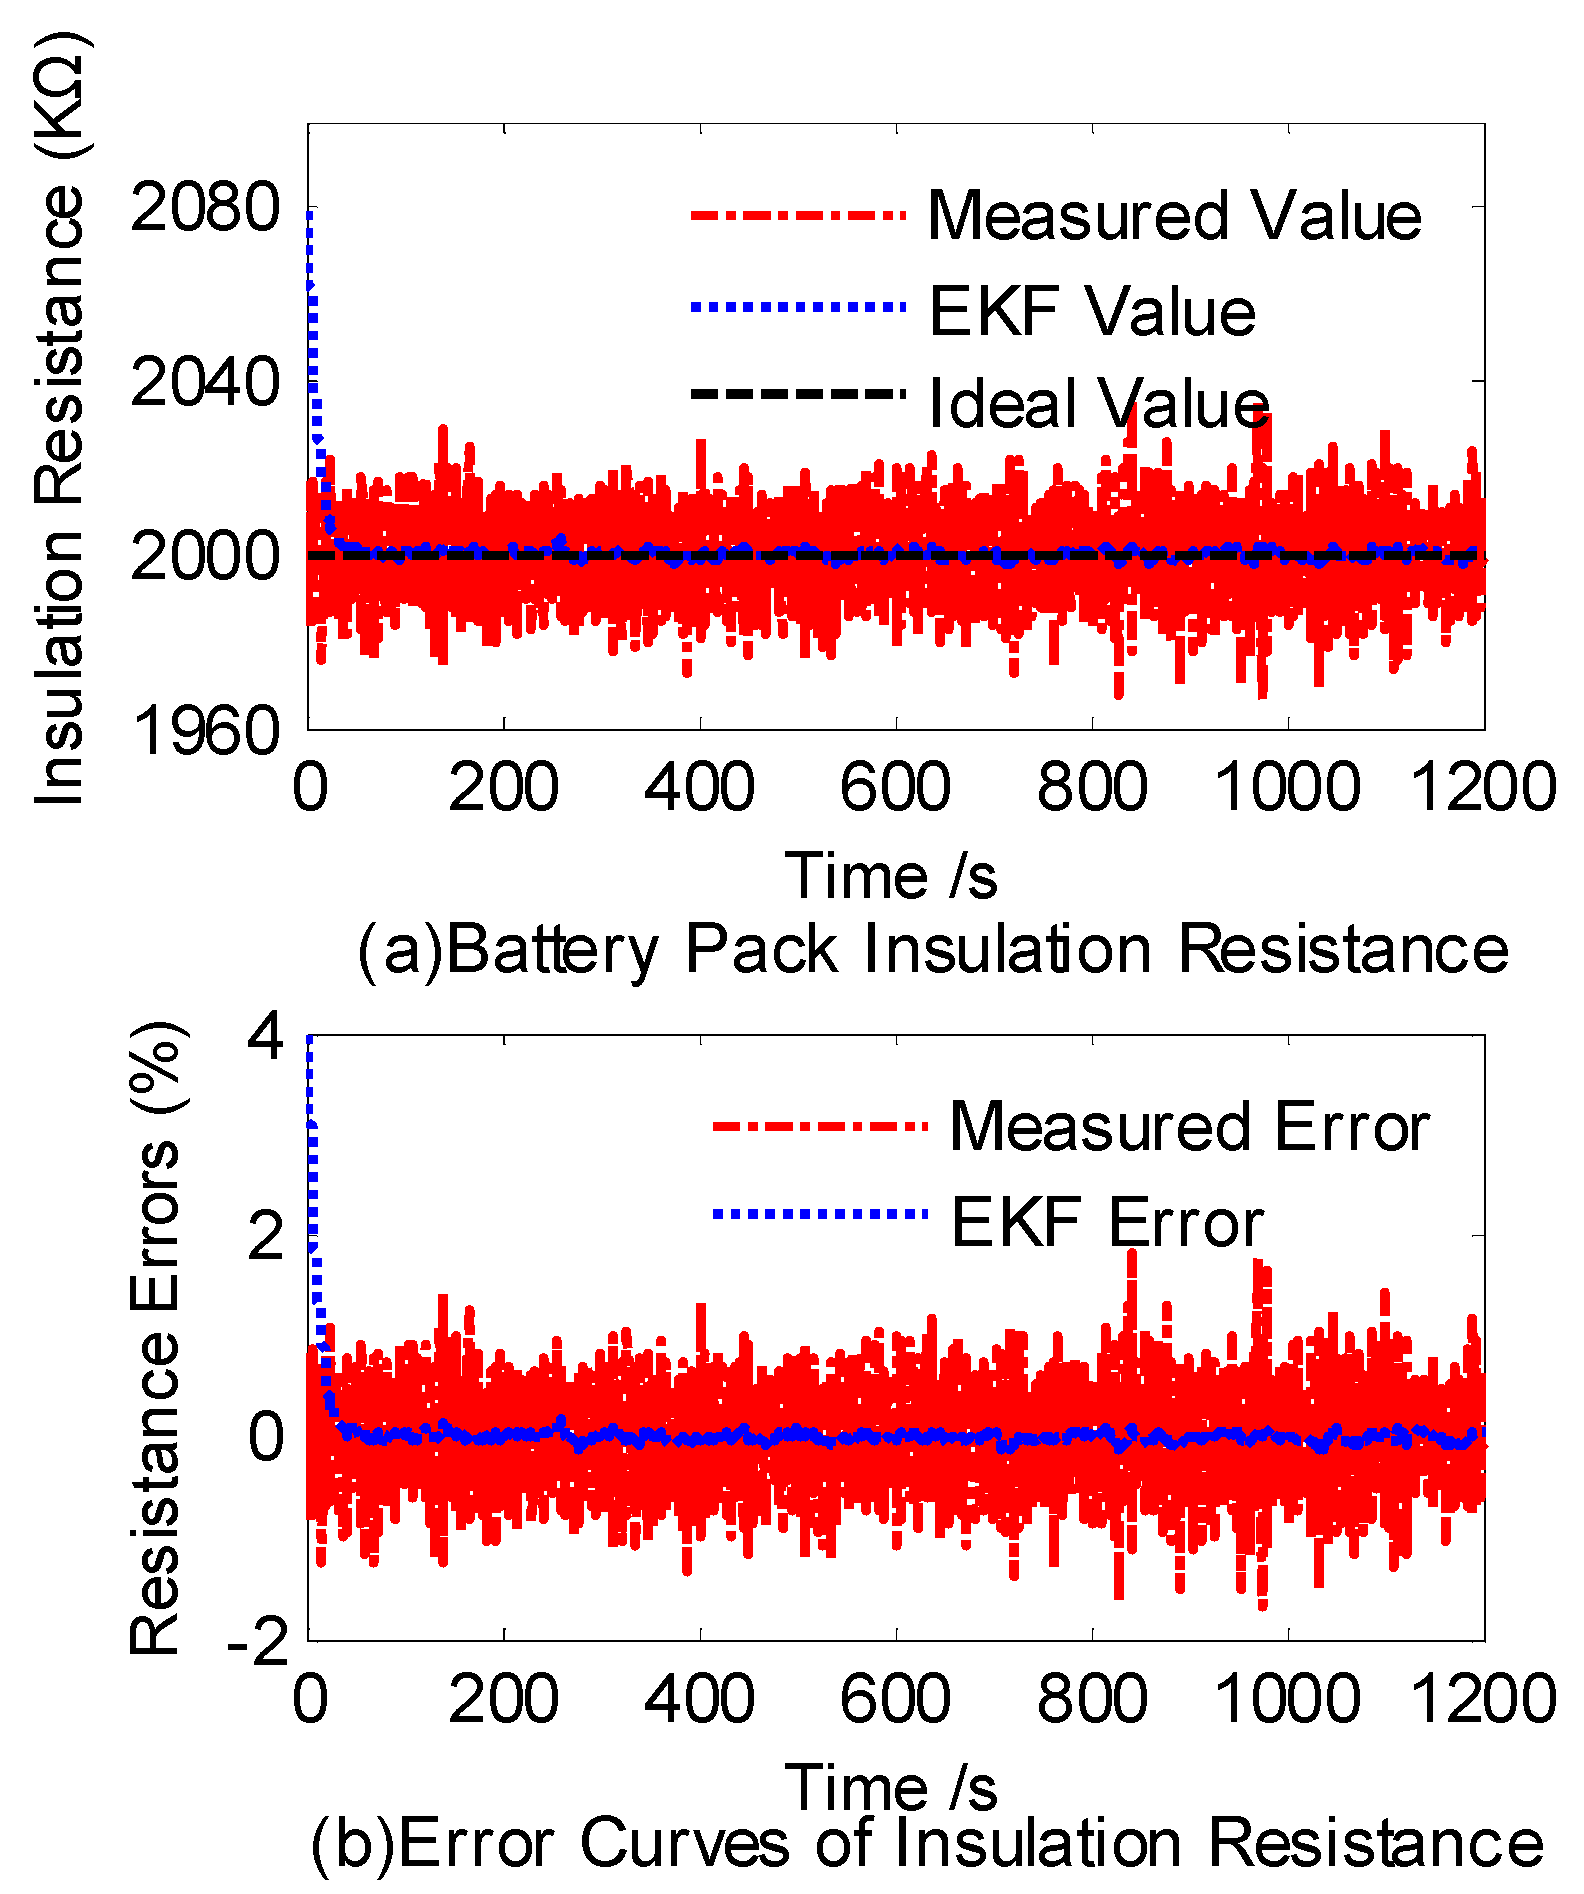
5. Analysis of Bench Test Results

To validate the superiority of the proposed model and the algorithm based on extended Kalman filtering, the insulation monitoring circuit based on this study was tested in an actual battery pack system. Figure 10 shows the 52-Ah, 296-V battery pack system, which was composed of 1600 battery cells (ICR18650 3.7 V/2.6 Ah) for the bench test. Within this pack, 20 cells were connected in parallel as a stack, and then 80 stacks were connected in a series. For the measuring circuit, R01 = 2000 KΩ, R02 = 2000 KΩ, Rs = 10 KΩ, and T = 1200 s. The electronic load was provided by AVL e-Storage Tester (https://www.avl.com/-/avl-e-storage). The working condition is shown in Figure 11a. Figure 11b shows the current and voltage of the battery pack.
In the first group of tests, a 2-MΩ resistor was connected in parallel between the battery pack and the vehicle chassis. As shown in Figure 12a, although the measured values were affected by measurement noise, the extended Kalman filtering algorithm reduced this influence. At the beginning of the measurement process, error quickly converged after only a few iterations. Figure 12b shows the measurement errors of the two methods. After k = 5 s, the error of the extended Kalman filtering algorithm was below 0.5%. The test results verified the feasibility of the proposed model for battery pack monitoring circuit and the effectiveness of the insulation monitoring algorithm based on extended Kalman filtering.
The key to insulation monitoring is maintaining the accurate measurement of system insulation resistance under external interference when the system is suffering from degraded insulation performance. Therefore, during the second group of tests, a 20-KΩ resistor was connected in parallel between the battery pack system and the vehicle chassis to simulate poor insulation resistance.
Figure 13a shows the measurement results of insulation resistance before and after adopting the extended Kalman filtering algorithm. As shown in Figure 13b, the highest error of the extended Kalman filtering algorithm, which can reach 30%, was generated during the initial period and stabilized within 5%. However, without the algorithm, the measurement error remained at approximately 20%. After calculation, the root mean square error was 8823.66 Ω without the extended Kalman filtering and decreased to 226.35 Ω with the extended Kalman filtering. Therefore, the extended Kalman filtering algorithm mitigates the majority of the error and improves measurement reliability. Under the same experimental conditions, the extended Kalman filtering algorithm significantly improves the measurement accuracy under degraded insulation performance while offering satisfactory robustness.

6. Conclusions

As seen from the results of the two groups of tests, when the vehicle was operated under complex working conditions, the insulation resistance monitoring circuit exhibited strong performance in mitigating interference regardless of the state of the system’s insulation resistance. Figure 12b and Figure 13b show that the extended Kalman filtering algorithm significantly improves the measurement accuracy while offering satisfactory robustness under degraded insulation performance. After t = 50 s, the error of the extended Kalman filtering algorithm was below 1.5%. However, without the algorithm, the measurement error remained at approximately 20%. Compared with the high-voltage AC signal, the low-voltage AC signal in this paper will not affect the safe use of the battery pack. Although the model has several limitations (for example, this method will slightly increase storage space and computation time), the experimental results show that the insulation monitoring circuit based on the extended Kalman filtering algorithm is effective and significantly improves estimation accuracy and robustness.

Acknowledgments

This research is funded by the Key Tackling Item in Science and Technology Department of Jilin Province (Grant No. 20150204017GX) and supported by Graduate Innovation Fund of Jilin University (Project 2016076).

Author Contributions

Chuanxue Song and Yulong Shao conceived and designed the experiments; Yulong Shao and Da Wang performed the experiments; Silun Peng analyzed the data; Fang Zhou and Cheng Chang contributed analysis tools; Yulong Shao and Da Wang wrote the paper.

Conflicts of Interest

The authors declare no conflict of interest.

References

  1. Jiang, J.S.; Ji, H. Study of Insulation Monitoring Device for DC System Based on Multi-switch Combination. In Proceedings of the 2009 Second International Symposium on Computational Intelligence and Design, Changsha, China, 12–14 December 2009. [Google Scholar]
  2. Li, C.S.; Luo, S.H.; Cole, C.; Spiryagin, M. An overview: Modern techniques of railway vehicle on-board health monitoring system. Veh. Syst. Dyn. 2017, 55, 1045–1070. [Google Scholar] [CrossRef]
  3. Wu, Z.-J.; Wang, L.-F. A novel insulation resistance monitoring device for Hybrid Electric Vehicle. In Proceedings of the 2008 IEEE Vehicle Power and Propulsion Conference, Harbin, China, 3–5 September 2008; pp. 1–4. [Google Scholar]
  4. Wei, X.; Bi, L.; Sun, Z. A method of insulation failure detection on electric vehicle based on FPGA. In Proceedings of the 2008 IEEE Vehicle Power and Propulsion Conference, Harbin, China, 3–5 September 2008. [Google Scholar]
  5. Piao, C.; Cong, T. Study on isolation monitoring of High-voltage battery system. Appl. Mech. Mater. 2010, 44–47, 571–575. [Google Scholar] [CrossRef]
  6. Zhang, G.; Jiang, J.-C.; Zhang, W.-G.; Zhang, C.-P.; Zhou, X.-Y. Research on online insulation detection in electric vehicle based on leakage current. J. Beijing Inst. Technol. 2011, 20 (Suppl. 2), 19–23. [Google Scholar]
  7. Jingxin, L.; Zhiqiang, W.; Yanqiang, F.; Yunyan, W.; Jiuchun, J. Research on insulation resistance on-line monitoring for electric vehicle. In Proceedings of the ICEMS 2005: 8th International Conference on Electrical Machines and Systems, Nanjing, China, 27–29 September 2005; pp. 814–817. [Google Scholar]
  8. Sepasi, S.; Ghorbani, R.; Liaw, B.Y. A novel on-board state-of-charge estimation method for aged Li-ion batteries based on model adaptive extended Kalman filter. J. Power Sources 2014, 245, 337–344. [Google Scholar] [CrossRef]
  9. Chen, Z.; Li, X.Y.; Shen, J.W.; Yan, W.S.; Xiao, R.X. A novel state of charge estimation algorithm for lithium-ion battery packs of electric vehicles. Energies 2016, 9, 15. [Google Scholar] [CrossRef]
  10. Xiong, R.; Gong, X.; Mi, C.C.; Sun, F. A robust state-of-charge estimator for multiple types of lithium-ion batteries using adaptive extended Kalman filter. J. Power Sources 2013, 243, 805–816. [Google Scholar] [CrossRef]
  11. Barillas, J.K.; Li, J.H.; Gunther, C.; Danzer, M.A. A comparative study and validation of state estimation algorithms for Li-ion batteries in battery management systems. Appl. Energy 2015, 155, 455–462. [Google Scholar] [CrossRef]
  12. Bressel, M.; Hilairet, M.; Hissel, D.; Bouamama, B.O. Extended Kalman filter for prognostic of proton exchange membrane fuel cell. Appl. Energy 2016, 164, 220–227. [Google Scholar] [CrossRef]
  13. Laroche, E.; Sedda, E.; Durieu, C. Methodological insights for online estimation of induction motor parameters. IEEE Trans. Control Syst. Technol. 2008, 16, 1021–1028. [Google Scholar] [CrossRef]
  14. Mohamed, M.R.; Ahmad, H.; Abu Seman, M.N.; Razali, S.; Najib, M.S. Electrical circuit model of a vanadium redox flow battery using extended Kalman filter. J. Power Sources 2013, 239, 284–293. [Google Scholar] [CrossRef]
  15. Hoffmann, N.; Fuchs, F.W. Minimal invasive equivalent grid impedance estimation in inductive-resistive power networks using extended Kalman filter. IEEE Trans. Power Electron. 2014, 29, 631–641. [Google Scholar] [CrossRef]
  16. Barre, A.; Deguilhem, B.; Grolleau, S.; Gerard, M.; Suard, F.; Riu, D. A review on lithium-ion battery ageing mechanisms and estimations for automotive applications. J. Power Sources 2013, 241, 680–689. [Google Scholar] [CrossRef]
  17. Maher, K.; Yazami, R. A study of lithium ion batteries cycle aging by thermodynamics techniques. J. Power Sources 2014, 247, 527–533. [Google Scholar] [CrossRef]
  18. Nejad, S.; Gladwin, D.T.; Stone, D.A. A systematic review of lumped-parameter equivalent circuit models for real-time estimation of lithium-ion battery states. J. Power Sources 2016, 316, 183–196. [Google Scholar] [CrossRef]
  19. Nikolian, A.; Firouz, Y.; Gopalakrishnan, R.; Timmermans, J.-M.; Omar, N.; van den Bossche, P.; van Mierlo, J. Lithium ion batteries—Development of advanced electrical equivalent circuit models for nickel manganese cobalt lithium-ion. Energies 2016, 9, 360. [Google Scholar] [CrossRef]
  20. Huria, T.; Ceraolo, M.; Gazzarri, J.; Jackey, R. High fidelity electrical model with thermal dependence for characterization and simulation of high power lithium battery cells. In Proceedings of the 2012 IEEE International Electric Vehicle Conference, Greenville, SC, USA, 4–8 March 2012. [Google Scholar]
  21. Guo, X.; Kang, L.; Yao, Y.; Huang, Z.; Li, W. Joint estimation of the electric vehicle power battery state of charge based on the least squares method and the Kalman filter algorithm. Energies 2016, 9, 100. [Google Scholar] [CrossRef]
  22. Wang, Y.J.; Zhang, C.B.; Chen, Z.H. An adaptive remaining energy prediction approach for lithium-ion batteries in electric vehicles. J. Power Sources 2016, 305, 80–88. [Google Scholar] [CrossRef]
  23. Farmann, A.; Waag, W.; Sauer, D.U. Adaptive approach for on-board impedance parameters and voltage estimation of lithium-ion batteries in electric vehicles. J. Power Sources 2015, 299, 176–188. [Google Scholar] [CrossRef]
  24. Seaman, A.; Dao, T.-S.; McPhee, J. A survey of mathematics-based equivalent-circuit and electrochemical battery models for hybrid and electric vehicle simulation. J. Power Sources 2014, 256, 410–423. [Google Scholar] [CrossRef]
  25. Gong, X.; Xiong, R.; Mi, C.C. Study of the characteristics of battery packs in electric vehicles with parallel-connected lithium-ion battery cells. IEEE Trans. Ind. Appl. 2015, 51, 1872–1879. [Google Scholar] [CrossRef]
  26. Sepasi, S.; Roose, L.R.; Matsuura, M.M. Extended Kalman filter with a fuzzy method for accurate battery pack state of charge estimation. Energies 2015, 8, 5217–5233. [Google Scholar] [CrossRef]
  27. Wang, L.M.; Cheng, Y.; Zhao, X.L. A LiFePO4 battery pack capacity estimation approach considering in-parallel cell safety in electric vehicles. Appl. Energy 2015, 142, 293–302. [Google Scholar] [CrossRef]
Figure 1. Total voltage curve of the battery pack.
Energies 10 00714 g001
Figure 2. Insulation detection model between the battery and chassis of an electric vehicle.
Energies 10 00714 g002
Figure 3. Principle of monitoring insulation resistance between the positive electrode and the chassis.
Energies 10 00714 g003
Figure 4. First-order resistor-capacitor (RC) equivalent circuit model.
Energies 10 00714 g004
Figure 5. Simscape model of the first-order RC equivalent circuit.
Energies 10 00714 g005
Figure 6. Eight cells connected in series to compose a stack.
Energies 10 00714 g006
Figure 7. Ten stacks connected in series to compose a pack.
Energies 10 00714 g007
Figure 8. Verification of the battery pack model: (a) Experimental and simulation charge curves under constant current/constant voltage (CC/CV) charging mode; (b) Experiment and simulation discharge curves under 0.5 C/1 C discharging mode.
Energies 10 00714 g008
Figure 9. Simulink model of insulation detection: (a) The overall model of the detection circuit; (b) The Simulink model of the extended Kalman filter (EKF) and the noise.
Energies 10 00714 g009
Figure 10. Battery pack and electronic load.
Energies 10 00714 g010
Figure 11. (a) Work condition; (b) Voltage and current.
Energies 10 00714 g011
Figure 12. Comparison and error analysis of insulation resistances (with 2 MΩ resistance). (a) Comparison of insulation resistances; (b) Error analysis of insulation resistances.
Energies 10 00714 g012
Figure 13. Comparison and error analysis of insulation resistances (with 20 KΩ resistance). (a) Comparison of insulation resistances; (b) Error analysis of insulation resistances.
Energies 10 00714 g013
Table 1. Results of the simulation. RF: Reference Resistor.
Simulation No.System Impedance RF (KΩ)Measure Noise VarianceMaximum Absolute Error (Ω)Root Mean Square Error (Ω)
without EKFwith EKFwithout EKFwith EKF
120008004780.31426.41974.5589.7
2200080723.7205.6277.377.9
3208004780.3427.81879.1206.4
42080723.7143.9256.238.5

