Mapping Urban Heat Demand with the Use of GIS-Based Tools

Abstract
1. Introduction
2. Materials and Methods
2.1. Tools
2.2. Required Inputs
2.3. Grid Characteristics
2.4. Description of Heat Demand Calculation Method
2.4.1. Main Equation
2.4.2. Heat Demand Coefficients
- post-war multi-family buildings: buildings usually built between 1945–1965 year in the traditional technology;
- residential blocks: apartment blocks technologies prefabricated usually built since the mid-60s.
2.5. Calculation of the Final Energy Consumption
2.6. Description of Heat Demand Forecasting Method
2.6.1. Short-Term Projections
2.6.2. Mid-Term Projections
3. Results and Discussion
3.1. Base Year Situation
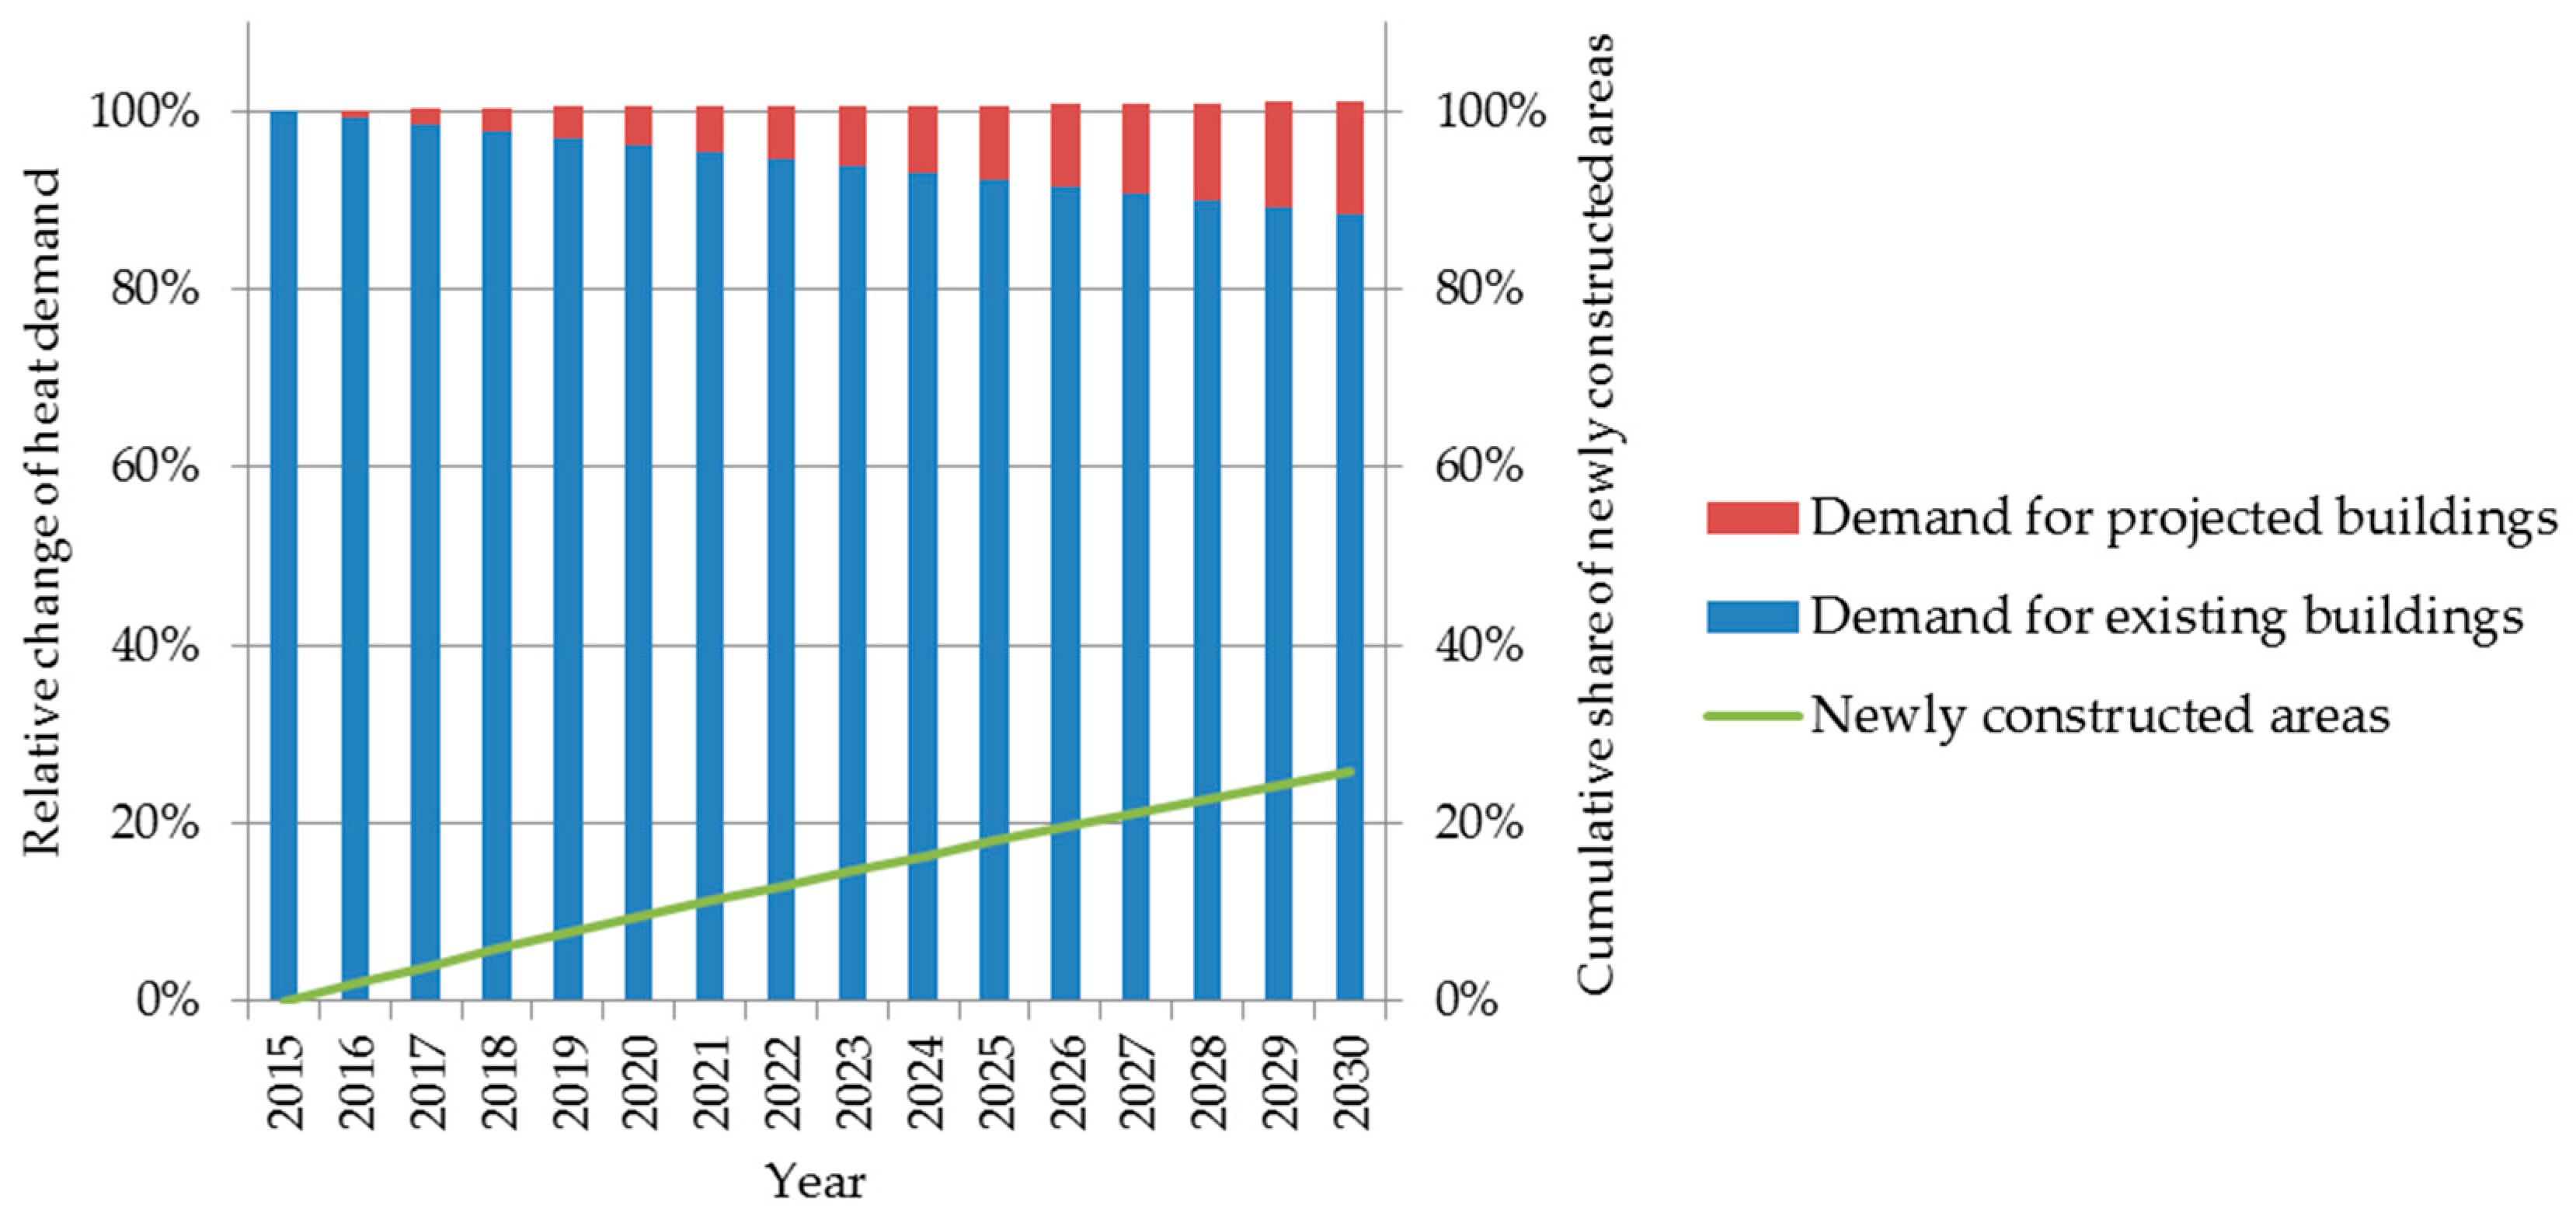
3.2. Demand Projections
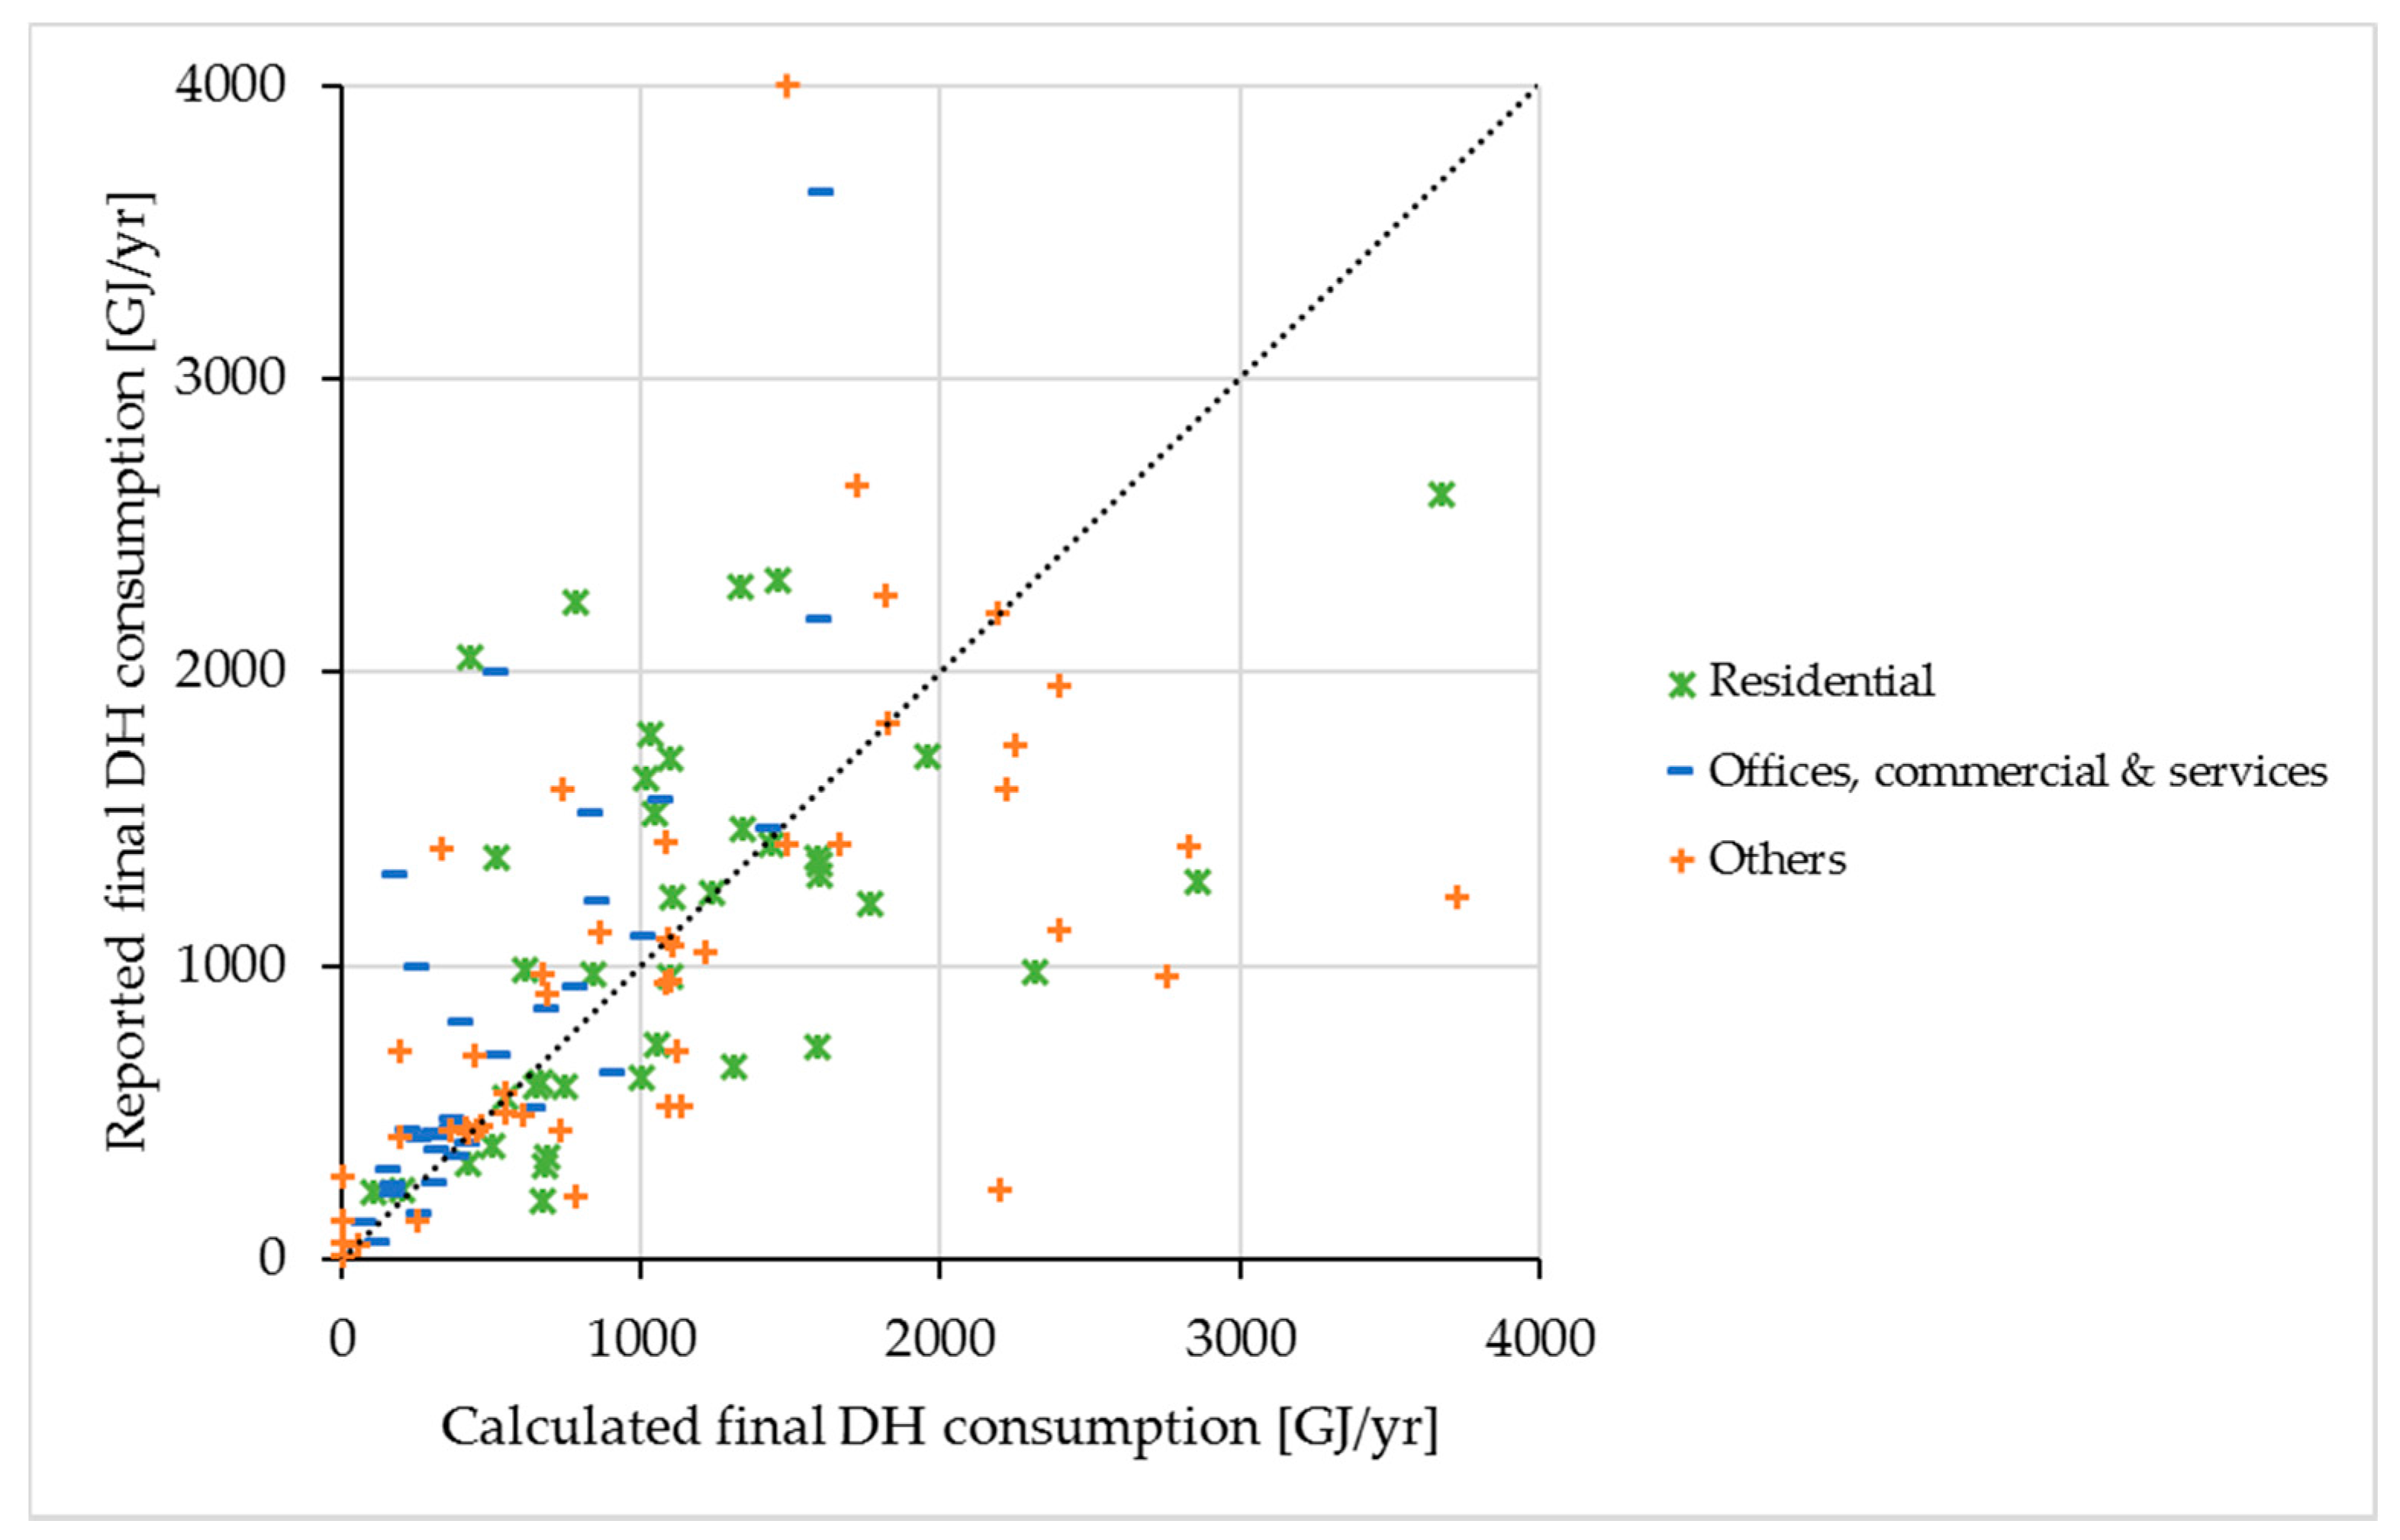
3.4. Validation of the Results
- (i)
- NMSE < 1.5
- (ii)
- FAC2 > 0.5.
4. Conclusions
Acknowledgments
Author Contributions
Conflicts of Interest
Nomenclature
| Af | total heated area of the building [m2] |
| Az | building area on the outer contour of the building [m2] |
| cf | heated area calibration ratio |
| d | annual demolishing rate of existing heated area [%] |
| eu | specific heat demand for energy service u in buildings per area [kWh/(m2⋅year)] |
| l | number of floors above ground level |
| Qu | useful heat demand for energy service u [kWh/year] |
| r | remaining building areas after modernization and demolishing [%] |
| y | number of years after the base year |
| annual thermo-modernization rate of the existing buildings area by classes [%] | |
| annual energy intensity improvement due to thermo-modernization [%] | |
| Superscript and Subscript | |
| b | building belonging to set B |
| cl | class of heat intensity within a building type belonging to set CL |
| k | grid cell belonging to set K |
| new | new construction after the base year 2015 |
| s | balance zone belonging to set S |
| t | building utility type belonging to set T |
| u | energy service including space heating (h), ventilation (ve) and domestic hot water preparation (w) |
References
- Wyrwa, A. An optimization platform for Poland’s power sector considering air pollution and health effects. Environ. Model. Softw. 2015, 74, 227–237. [Google Scholar] [CrossRef] [Scilit]
- Perera, D.W.U.; Winkler, D.; Skeie, N.-O. Multi-floor building heating models in MATLAB and Modelica environments. Appl. Energy 2016, 171, 46–57. [Google Scholar] [CrossRef] [Scilit]
- Evangelisti, L.; Guattari, C.; Gori, P. Energy retrofit strategies for residential building envelopes: An Italian case study of an early-50s building. Sustainability 2015, 7, 10445–10460. [Google Scholar] [CrossRef] [Scilit]
- Valdiserri, P.; Biserni, C.; Tosi, G.; Garai, M. Retrofit strategies applied to a tertiary building assisted by trnsys energy simulation tool. Energy Proced. 2015, 78, 765–770. [Google Scholar] [CrossRef] [Scilit]
- Valdiserri, P.; Biserni, C. Energy performance of an existing office building in the northern part of Italy: Retrofitting actions and economic assessment. Sustain. Cities Soc. 2016, 27, 65–72. [Google Scholar] [CrossRef] [Scilit]
- Gils, H.C.A. GIS-Based Assessment of the District Heating Potential in Europe; Deutsches Zentrum für Luft-und Raumfahrt (DLR): Graz, Austria, 2012. [Google Scholar]
- Persson, U.; Werner, S. Quantifying the heating and cooling demand in Europe. In STRATEGO Work Package 2; Halmstad University: Halmstad, Sweden, 2015. [Google Scholar]
- Bernd, M. Mapping the heating and cooling demand in Europe. In STRATEGO Work Package 2; University of Flensburg: Flensburg, Germany, 2015. [Google Scholar]
- Finney, K.N.; Sharifi, V.N.; Swithenbank, J.; Nolan, A.; White, S.; Ogden, S. Developments to an existing city-wide district energy network—Part I: Identification of potential expansions using heat mapping. Energy Convers. Manag. 2012, 62, 165–175. [Google Scholar] [CrossRef] [Scilit]
- IEE Project TABULA. Available online: http://episcope.eu/iee-project/tabula/ (accessed on 9 March 2017).
- Reiter, D.; Botzenhart, F.; Mühlich, P.; Hamacher, T.; Reuter, A. Developing a roadmap for the future energy infrastructure in Salzburg. In Proceedings of the 10th IAEE European Conference, Vienna, Austria, 7–10 September 2009. [Google Scholar]
- Törnros, T.; Resch, B.; Rupp, M.; Gündra, H. Geospatial analysis of the building heat demand and distribution losses in a district heating network. ISPRS Int. J. Geo-Inf. 2016, 5, 219. [Google Scholar] [CrossRef] [Scilit]
- Delmastro, C.; Mutani, G.; Schranz, L. The evaluation of buildings energy consumption and the optimization of district heating networks: A GIS-based model. Int. J. Energy Environ. Eng. 2016, 7, 343–351. [Google Scholar] [CrossRef] [Scilit]
- Mastrucci, A.; Baume, O.; Stazi, F.; Leopold, U. Estimating energy savings for the residential building stock of an entire city: A GIS-based statistical downscaling approach applied to Rotterdam. Energy Build. 2014, 75, 358–367. [Google Scholar] [CrossRef] [Scilit]
- Theodoridou, I.; Karteris, M.; Mallinis, G.; Papadopoulos, A.M.; Hegger, M. Assessment of retrofitting measures and solar systems’ potential in urban areas using geographical information systems: Application to a Mediterranean city. Renew. Sustain. Energy Rev. 2012, 16, 6239–6261. [Google Scholar] [CrossRef] [Scilit]
- Möller, B. A heat atlas for demand and supply management in Denmark. Manag. Environ. Qual. Int. J. 2008, 19, 467–479. [Google Scholar] [CrossRef] [Scilit]
- Petrovic, S.; Karlsson, K. Model for determining geographical distribution of heat saving potentials in Danish building stock. ISPRS Int. J. Geo-Inf. 2014, 3, 143–165. [Google Scholar] [CrossRef] [Scilit]
- Petrović, S.; Karlsson, K. Ringkøbing-Skjern energy atlas for analysis of heat saving potentials in building stock. Energy 2016, 110, 166–177. [Google Scholar] [CrossRef] [Scilit]
- Miejskie Przedsiębiorstwo Energetyki Cieplnej S.A. w Krakowie (MPEC). Annual Raport 2015; MPEC S.A.: Kraków, Poland, 2016. [Google Scholar]
- Guerreiro, C.; González, A.; de Leeuw, F.; Viana, M.; Horálek, J. Air Quality in Europe—2016 Report; European Environment Agency: Copenhagen, Denmark, 2016. [Google Scholar]
- REflex—Analysis of the European Energy System. Available online: http://reflex-project.eu/ (accessed on 16 March 2017).
- Wyrwa, A.; Strzelczyk, J.; Chen, Y.; Surówka, M. Mapa Ciepła dla Krakowa; Gmina Miejska Kraków: Krakow, Poland, 2016. (In Polish) [Google Scholar]
- Polish Ministry of Infrastructure and Development. Ordinance of 27 February 2015 on methodology for determining the energy performance of a building or part of a building and energy performance certificates. J. Laws 2015, 376, 1–62. [Google Scholar]
- McKenna, R.; Merkel, E.; Fehrenbach, D.; Mehne, S.; Fichtner, W. Energy efficiency in the German residential sector: A bottom-up building-stock-model-based analysis in the context of energy-political targets. Build. Environ. 2013, 62, 77–88. [Google Scholar] [CrossRef] [Scilit]
- Nägeli, C.; Jakob, M.; Sunarjo, B.; Catenazzi, G. A building specific economic building stock model to evaluate energy efficiency and renewable energy. In Proceedings of the CISBAT 2015, Lausanne, Switzerland, 9–11 September 2015. [Google Scholar]
- International Energy Agency (IEA); Organisation for Economic Co-operation and Development (OECD). Energy Technology Perspectives 2016: Towards Sustainable Urban Energy Systems; OECD/IEA: Paris, France, 2016. [Google Scholar]
- Local Data Bank. Available online: https://bdl.stat.gov.pl/BDL/dane/podgrup/temat (accessed on 20 April 2017).
- Recast, E.P.B.D. Directive 2010/31/EU of the European Parliament and of the Council of 19 May 2010 on the energy performance of buildings. Off. J. Eur. Union 2010, 18. [Google Scholar]
- Möller, B.; Werner, S. Quantifying the potential for district heating and cooling in EU member states. In STRATEGO Work Package 2; University of Flensburg: Flensburg, Germany, 2016. [Google Scholar]
- Łazęcki, A. Założenia do Planu Zaopatrzenia Gminy Miejskiej Kraków w Ciepło, Energię Elektryczną i Paliwa Gazowe; Gmina Miejska Kraków: Krakow, Poland, 2009. (In Polish) [Google Scholar]
- Łazęcki, A. Założenia do Planu Zaopatrzenia Gminy Miejskiej Kraków w Ciepło, Energię Elektryczną i Paliwa Gazowe; Gmina Miejska Kraków: Krakow, Poland, 2014. (In Polish) [Google Scholar]
- Mikołajuk, H.; Parciński, G.; Brasse, J.; Żarek, E.; Zaborska, D.; Wrońska, I.; Zatorska, M.; Bojanowska, H.; Stępniak, E. Katalog Elektrowni i Elektrociepłowni Zawodowych 2015 rok; Agencja Rynku Energii S.A.: Warszawa, Poland, 2016. (In Polish) [Google Scholar]
- Patryl, L.; Galeriu, D. Statistical Performances Measures—Models Comparison; CEA: Paris, France, 2011. [Google Scholar]
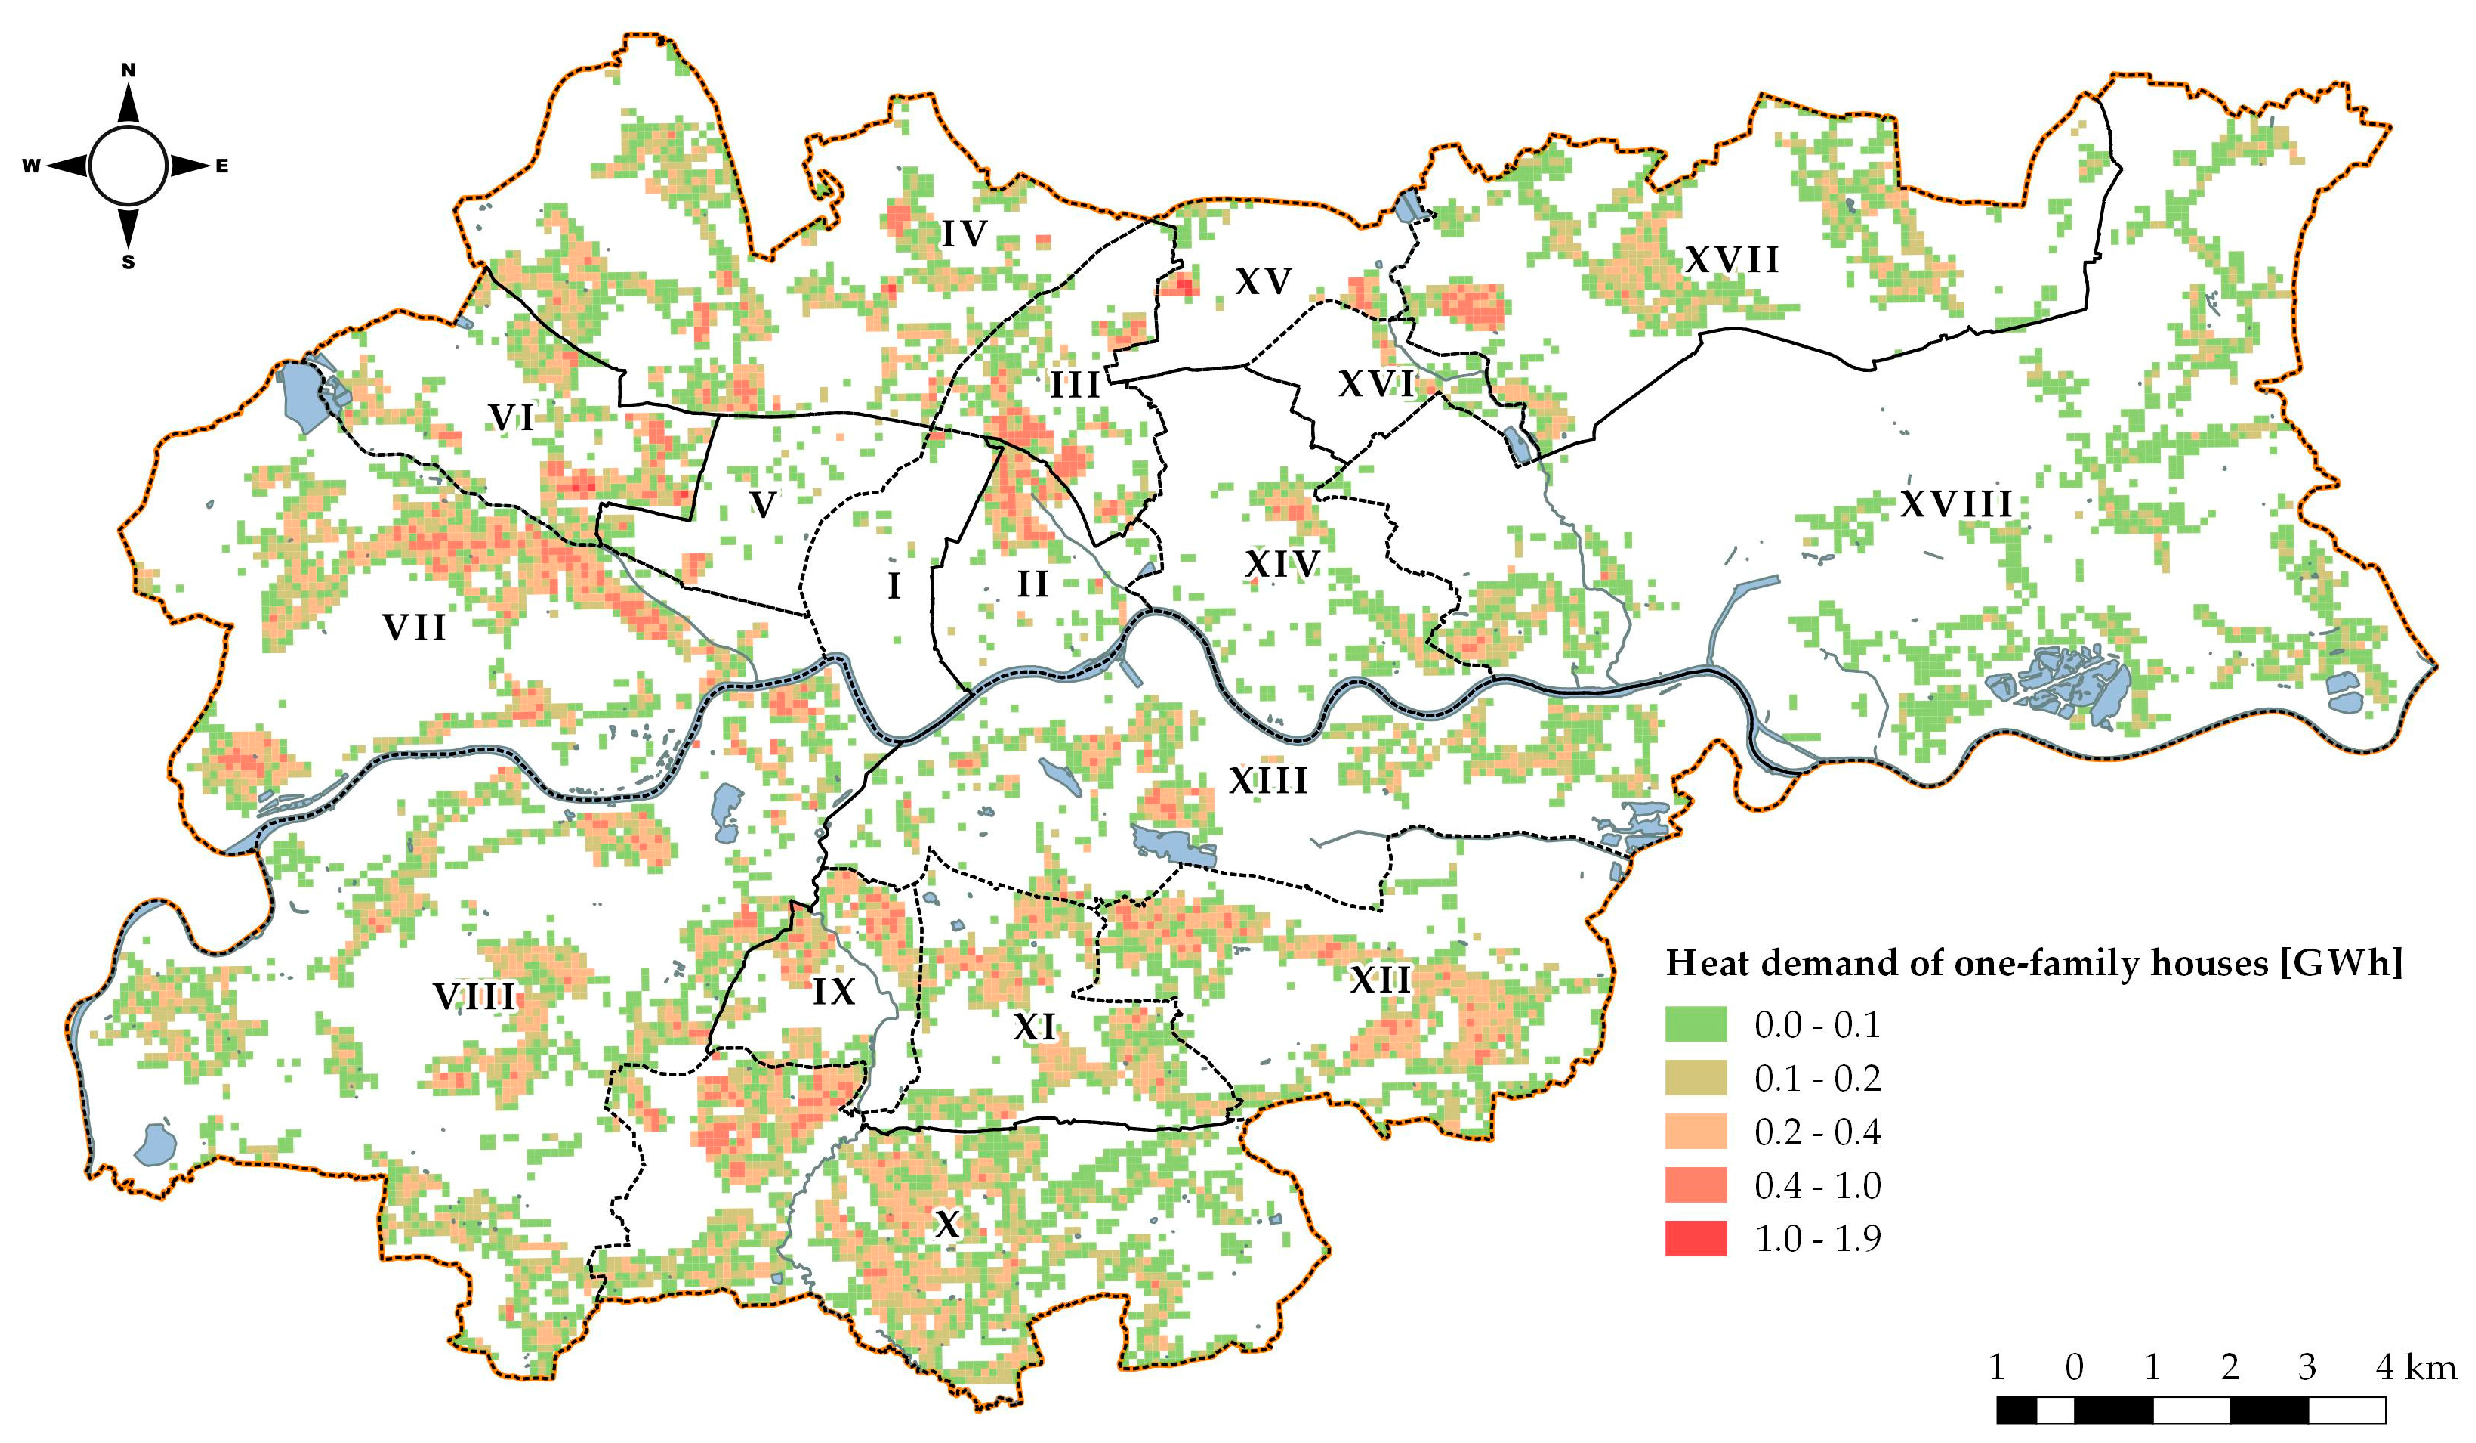
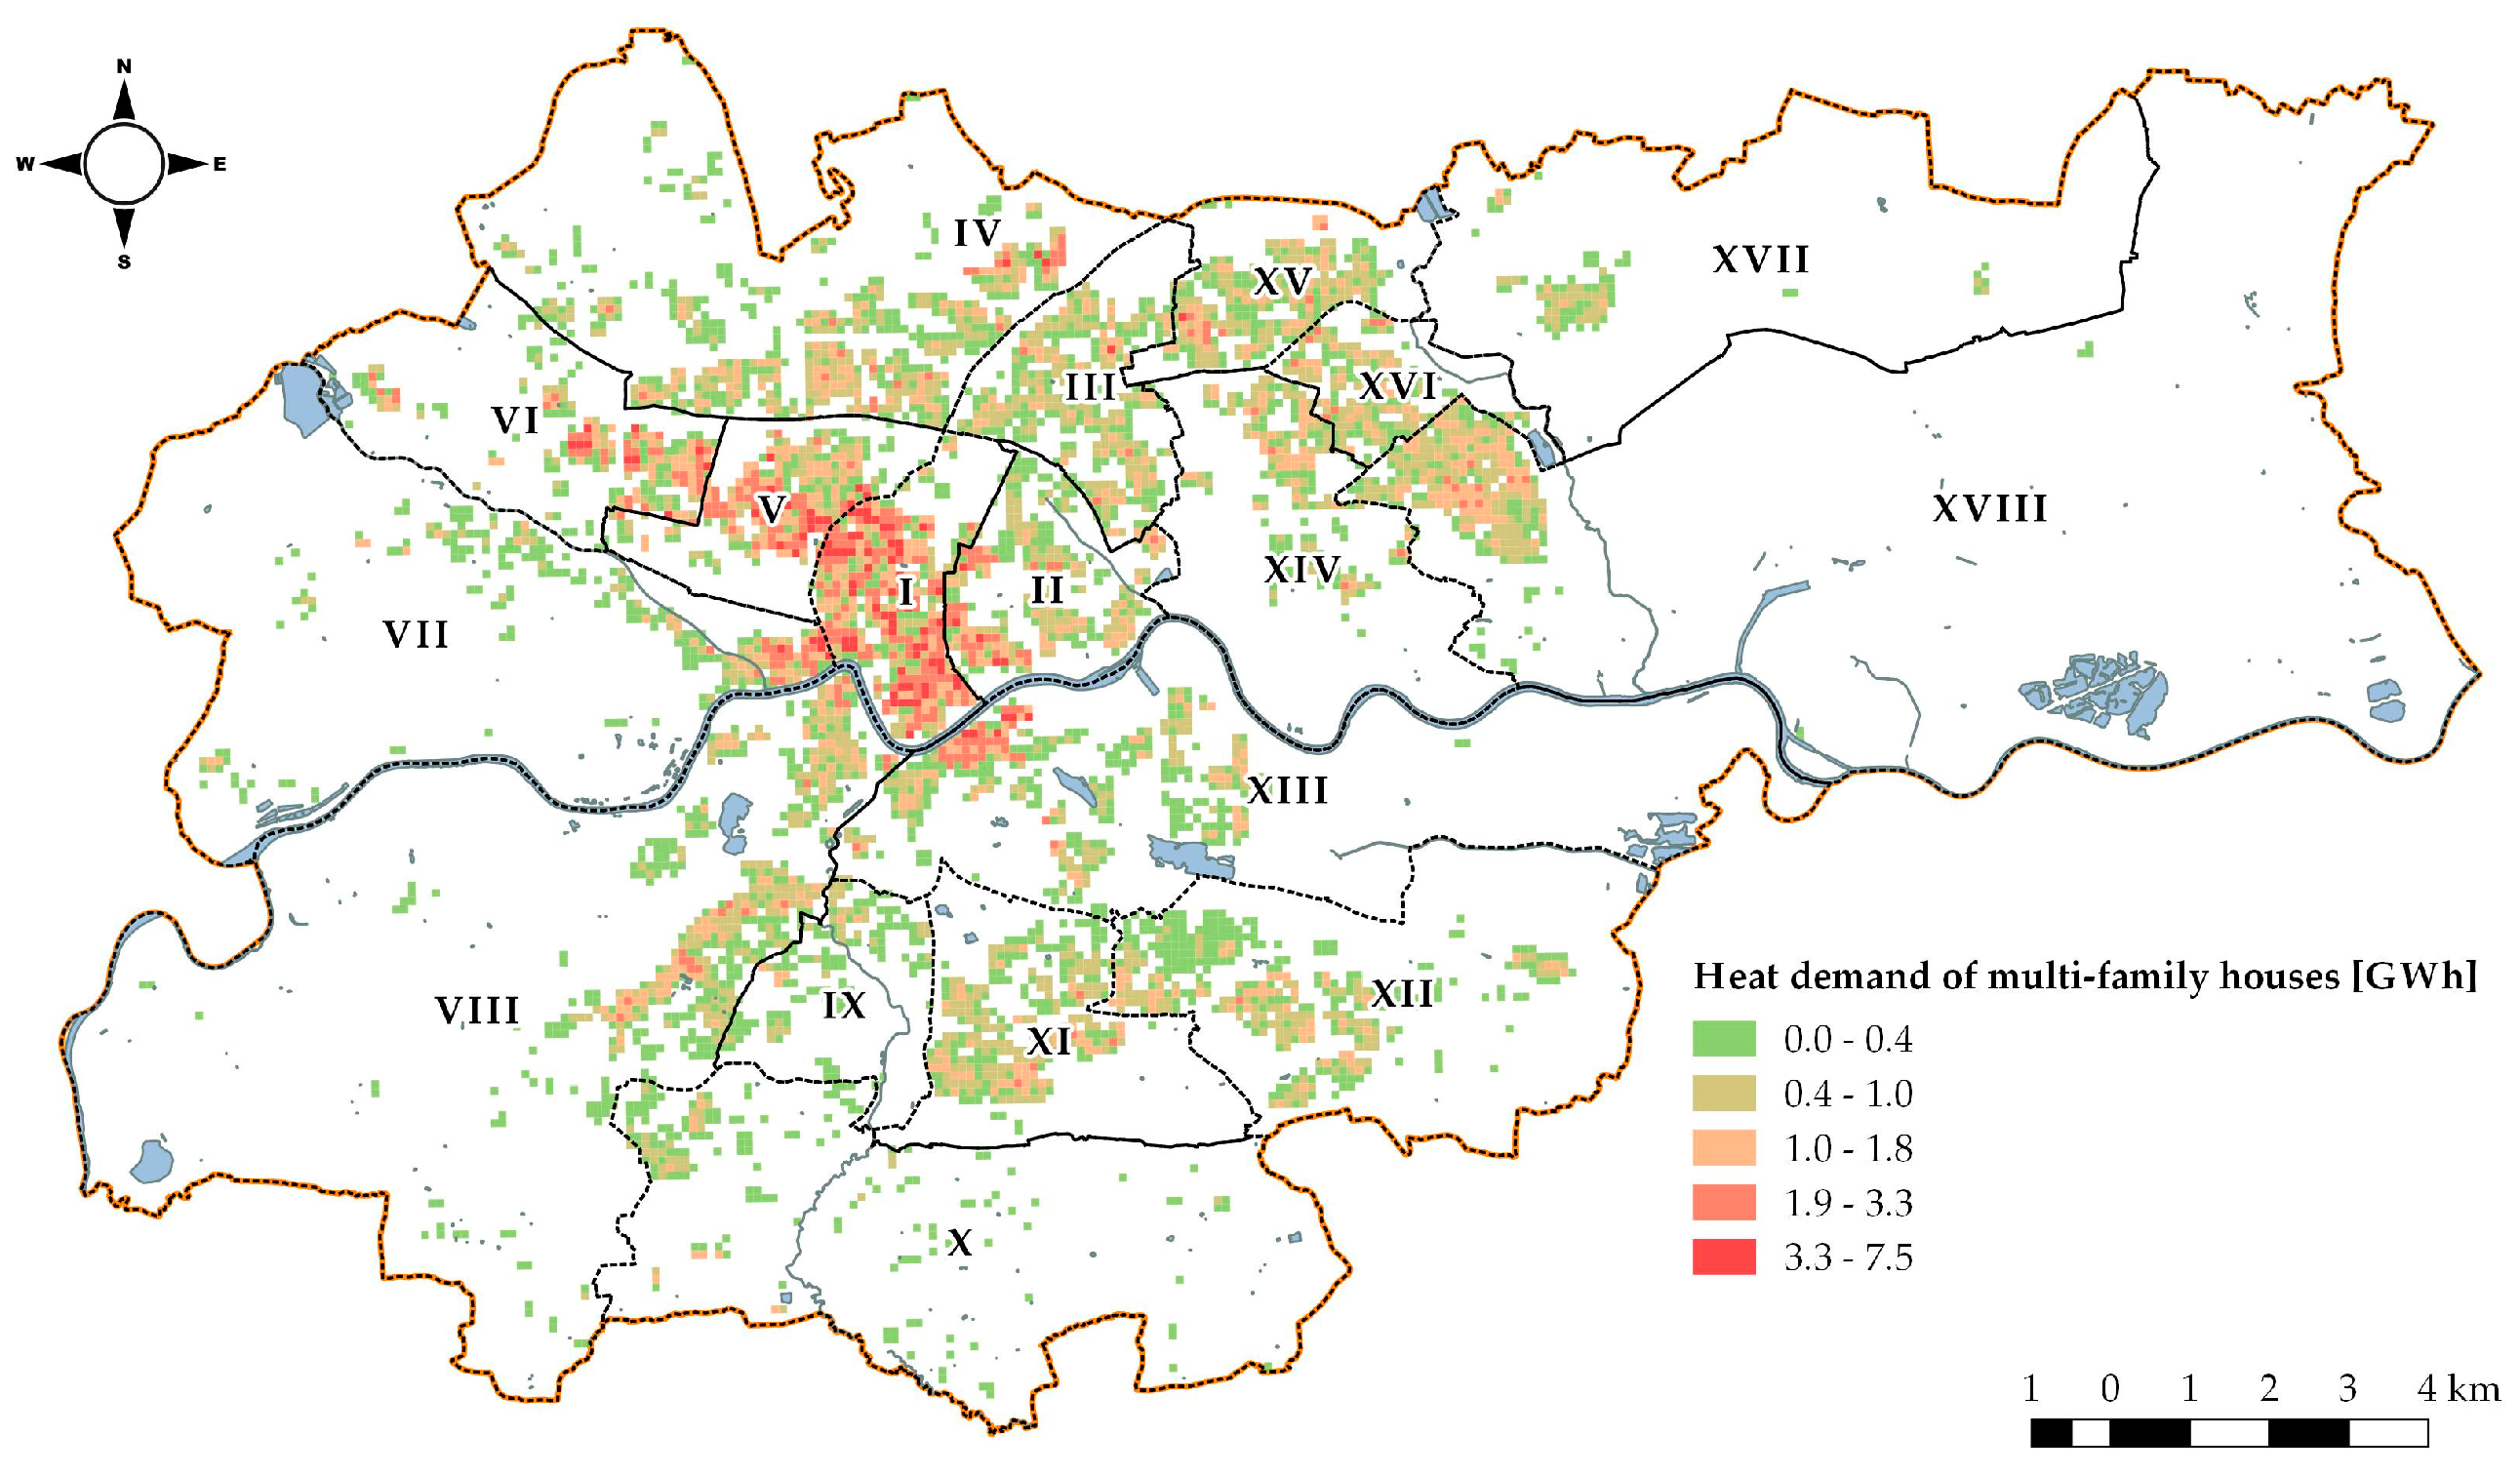
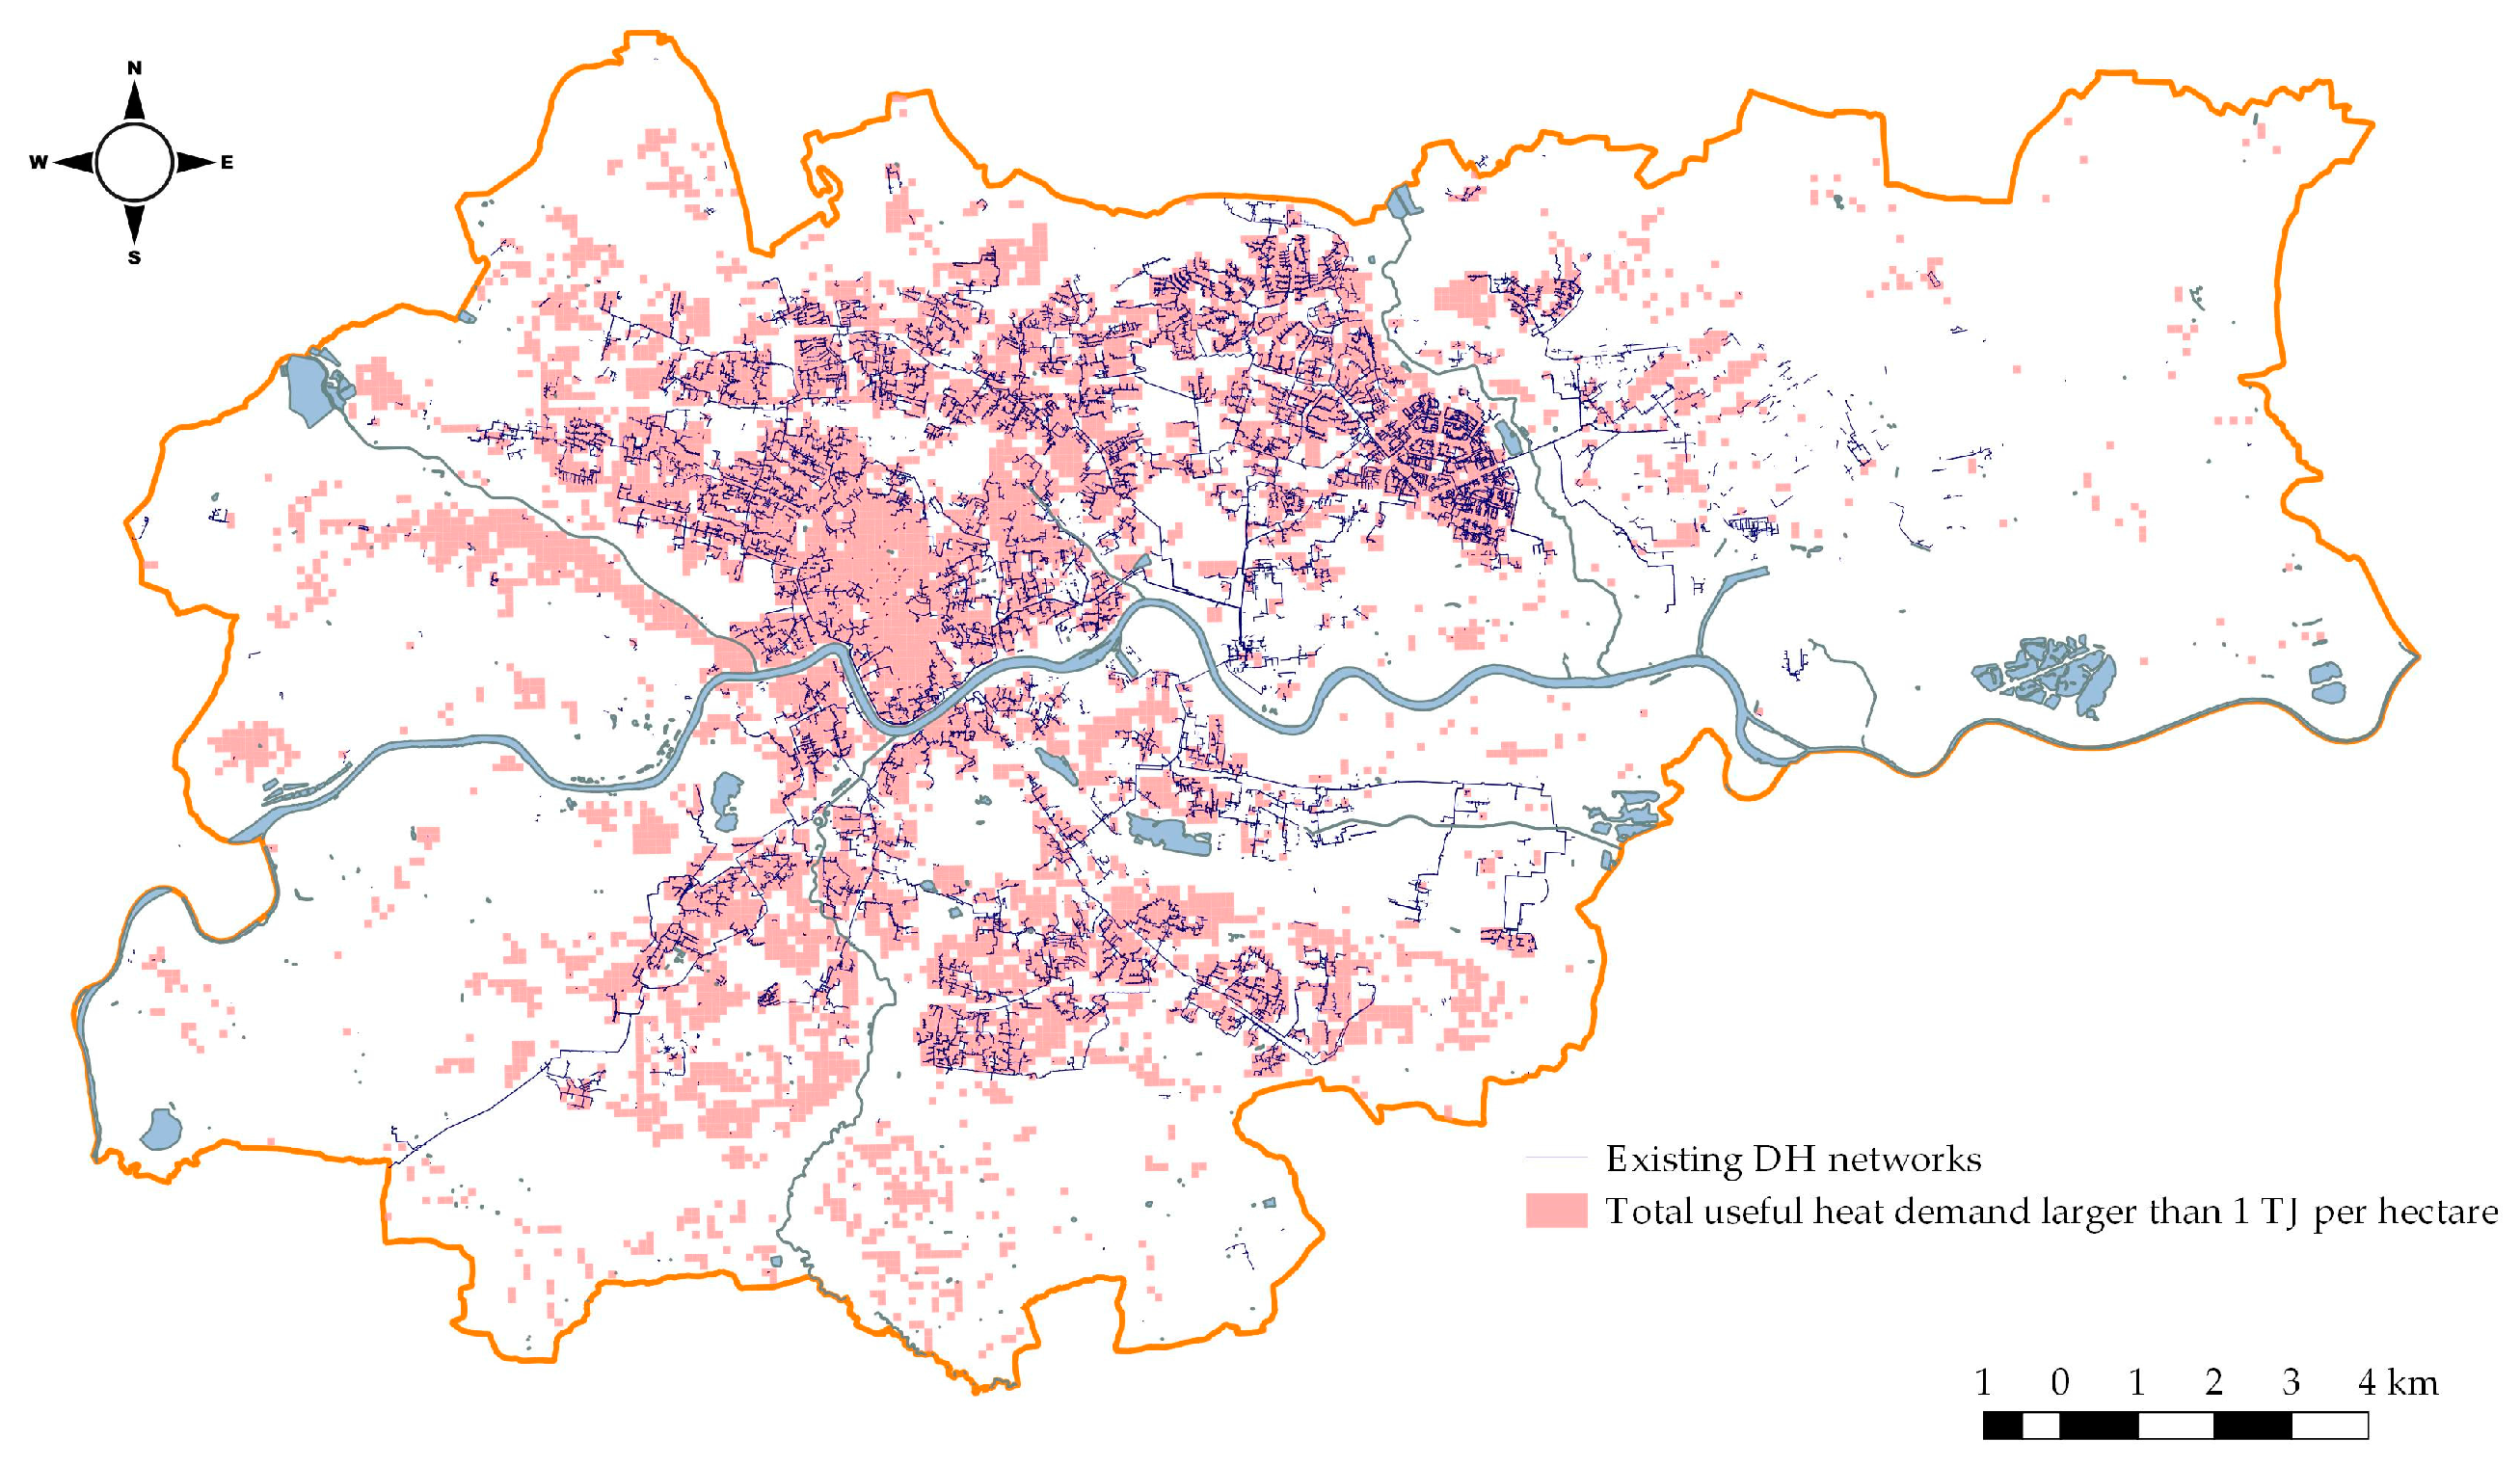
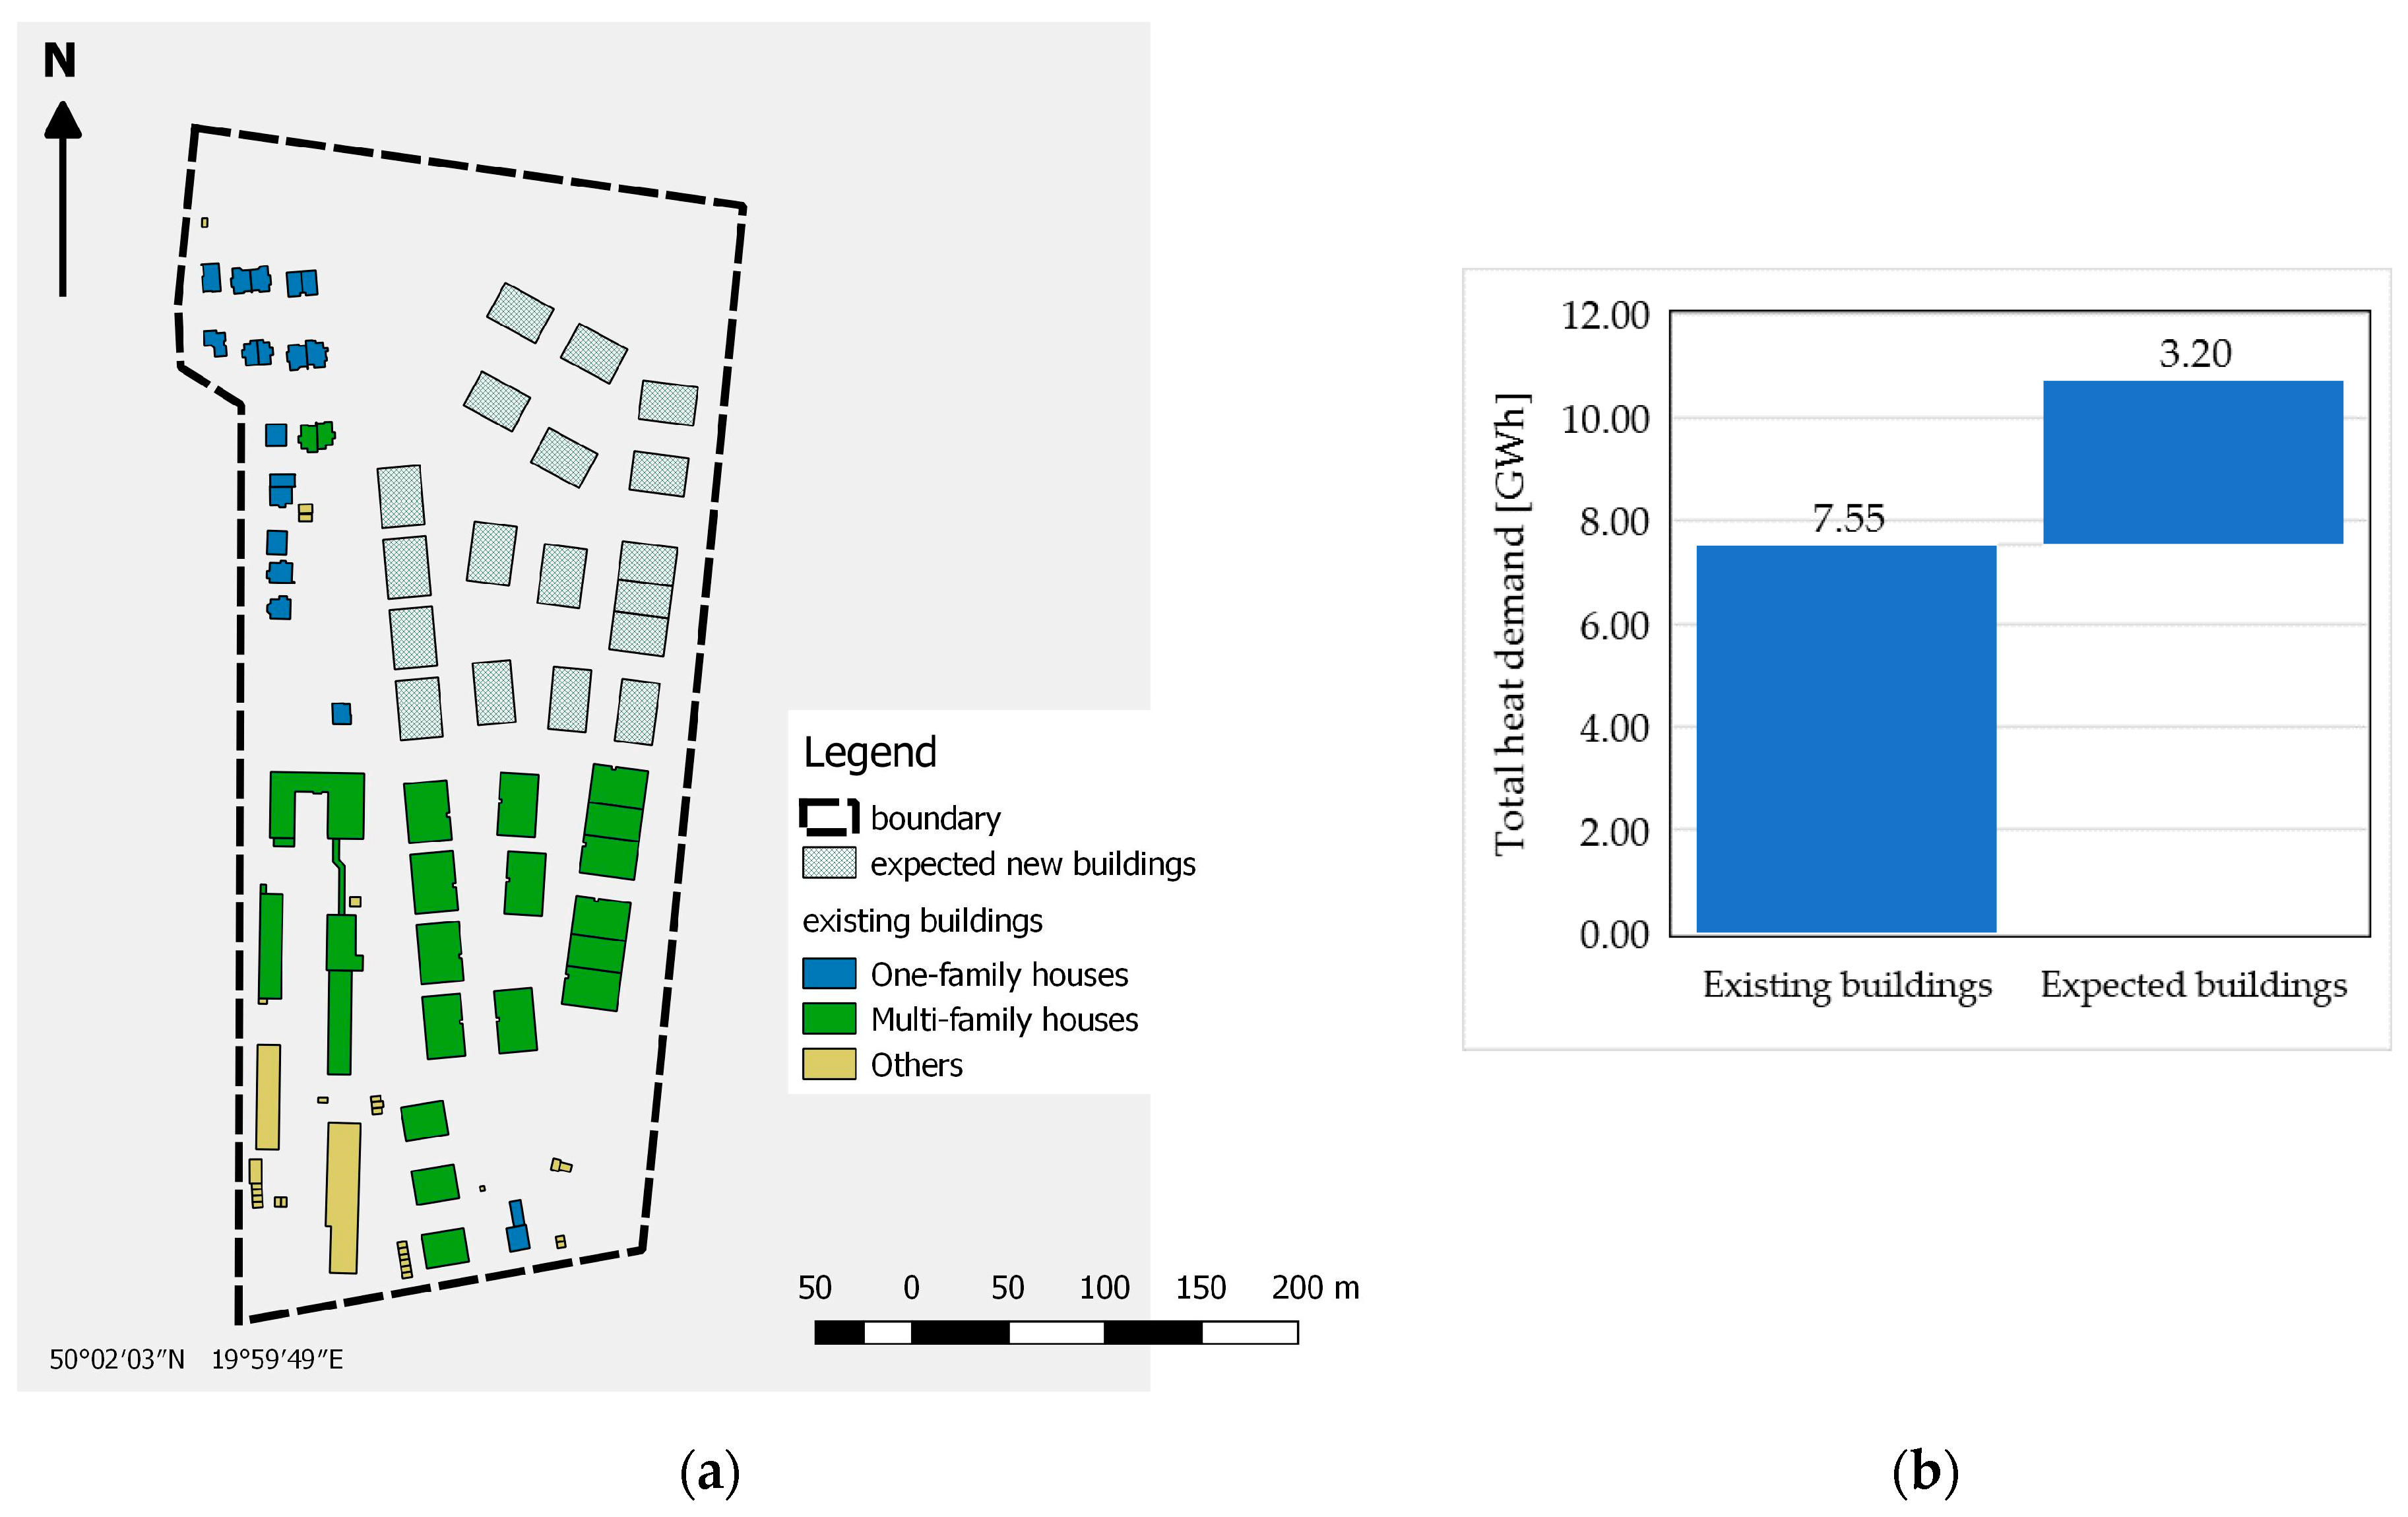


| Building Type (Code) | cf [-] | Specific Heat Demand [kWh/(m2⋅year)] | |||
|---|---|---|---|---|---|
| Non-specified area | Residential blocks since the mid-60s | Post-war multi-family buildings | |||
| One-family houses (BUBD01) | 0.79 | eh 1 | 184.1 | - | - |
| eve | 57.07 | - | - | ||
| ew | 24.09 | - | |||
| Two-family houses (BUBD02) | 0.76 | eh 1 | 162.15 | - | - |
| eve | 62.38 | - | - | ||
| ew | 27.53 | - | - | ||
| Multi-family houses (BUBD03) | 0.79 | eh 1 | 274.15 | 104.15 | 154.25 |
| eve | 41.22 | 38.74 | 39.02 | ||
| ew | 27.53 | 27.53 | 27.53 | ||
| Collective buildings (BUBD04) | 0.80 | eh 1 | 88.45 | - | - |
| eve | 44.52 | - | - | ||
| ew | 43.01 | - | - | ||
| Heating System Type | Efficiency of the Source | Efficiencies of Transmission, Regulation and Accumulation Process | Overall Efficiency |
|---|---|---|---|
| Coal boiler | 0.82 | 0.84 | 0.69 |
| Gas boiler | 0.95 | 0.84 | 0.80 |
| Oil boiler | 0.95 | 0.84 | 0.80 |
| Biomass boiler | 0.70 | 0.84 | 0.59 |
| Electric heating | 0.99 | 0.90 | 0.89 |
| District heating | 0.98 | 0.84 | 0.82 |
| Energy Carriers | 2008 | 2009 | 2010 | 2011 | 2012 | |||||
|---|---|---|---|---|---|---|---|---|---|---|
| District heat | 2611.1 | (36.6%) | 2545.8 | (35.9%) | 2565 | (34.9%) | 2571.9 | (36.3%) | 2600.0 | (36.1%) |
| Solid fuels | 399 | (5.6%) | 357.75 | (5.0%) | 316.5 | (4.3%) | 275.25 | (3.9%) | 234.0 | (3.2%) |
| Oil | 21 | (0.3%) | 22.75 | (0.3%) | 24.5 | (0.3%) | 26.25 | (0.4%) | 28.0 | (0.4%) |
| Natural gas | 1755.6 | (24.6%) | 1826.5 | (25.8%) | 1945.3 | (26.4%) | 1707.3 | (24.1%) | 1783.0 | (24.7%) |
| Electricity | 2351.4 | (32.9%) | 2335.2 | (32.9%) | 2507.1 | (34.1%) | 2510.7 | (35.4%) | 2564.0 | (35.6%) |
| Services | Useful Heat Demand | Final Energy Consumption | Final Energy Consumption Reported by MPEC 1 |
|---|---|---|---|
| Space heating | 8956 | 10,922 | 7945 |
| Building Function Types | MPE | R | FAC2 | NMSE |
|---|---|---|---|---|
| All buildings | 22.96 | 0.56 | 0.98 | 0.73 |
| Residential buildings 1 | 16.04 | 0.68 | 1.00 | 0.34 |
| Offices, commercial & services buildings 1 | −19.44 | 0.80 | 1.00 | 0.69 |
| Others | 20.61 | 0.58 | 0.98 | 0.71 |
© 2017 by the authors. Licensee MDPI, Basel, Switzerland. This article is an open access article distributed under the terms and conditions of the Creative Commons Attribution (CC BY) license (http://creativecommons.org/licenses/by/4.0/).
Share and Cite
Wyrwa, A.; Chen, Y.-k. Mapping Urban Heat Demand with the Use of GIS-Based Tools. Energies 2017, 10, 720. https://doi.org/10.3390/en10050720
Wyrwa A, Chen Y-k. Mapping Urban Heat Demand with the Use of GIS-Based Tools. Energies. 2017; 10(5):720. https://doi.org/10.3390/en10050720
Chicago/Turabian StyleWyrwa, Artur, and Yi-kuang Chen. 2017. "Mapping Urban Heat Demand with the Use of GIS-Based Tools" Energies 10, no. 5: 720. https://doi.org/10.3390/en10050720
APA StyleWyrwa, A., & Chen, Y.-k. (2017). Mapping Urban Heat Demand with the Use of GIS-Based Tools. Energies, 10(5), 720. https://doi.org/10.3390/en10050720