
Recycling COR-TEN® Sea Containers into Service Modules for Military Applications: Thermal Analysis


1
Defense University Center, Escuela Naval Militar, 36920 Marín, Spain
2
Industrial Engineering School, Campus Lagoas Marcosende, University of Vigo, 36310 Vigo, Spain
3
Armada Española, Escuela Naval Militar, 36920 Marín, Spain
*
Author to whom correspondence should be addressed.
Energies 2017, 10(6), 820; https://doi.org/10.3390/en10060820
Submission received: 1 June 2017
/
Revised: 13 June 2017
/
Accepted: 14 June 2017
/
Published: 17 June 2017
Abstract
:It is thought that there are 14 million standardised sea containers out of order, equal to 23.3 million twenty-foot equivalent unit (TEU), which could be devoted for other purposes. The COR-TEN®steel containers are the best, due to the features of the materials, to be used in applications intended for the accommodation of people. One of the uses is framed in the area of humanitarian help, as service modules in areas of social emergency. Moreover, the deployment of these kinds of modules is quite simple, as the Army is generally able to transport containers in its units. In this project we have selected three typologies of service modules and we have designed modules based on sea containers which can fit into these typologies. The container chosen to be recycled is the 1 TEU, to which the closings and divisions are defined, which must reflect the different typologies of the service modules chosen. Afterwards, a study of thermal charges is carried out on three different settings of service modules located in five locations spread in different climate areas. Throughout a thermal simulation in Trnsys® (V17, Thermal Energy System Specialists, LLC, Madison, WI, USA), the consumption and maximum demand of heat and cold are analysed. Based on these results, the best equipment to cover the energy demand of the modules analysed in this study could be chosen. Moreover, the results can be used to estimate the operational costs of the deployment of the modules.
1. Introduction
The reuse of sea containers as structures for construction seems to be an alternative from economic and design points of view [1,2,3]. The transformation of a transportation box into an inhabitable space requires technical and social development. Most of the sea containers are made of COR-TEN® [4] steel, which guarantees a high freight capacity and resistance to corrosion. Sea containers are very stable (they can be piled up to eight levels), cheap and very abundant. One and a half trillion containers are considered obsolete annually and are taken out of circulation [4,5].
The field of modular construction reuse and fitting sea freight containers opened—some years ago—a new market that has not stopped growing until recently. It is an attractive option, due to the low cost of the constructive elements and process, the building speed, the possibility of moving the containers using several means, and the high design versatility of designing modules which are independent energetically. Nowadays, there is a large market that makes use of these techniques, and with them, there are solutions ranging from single family homes to blocks of flats or offices.
What we should ask ourselves is if there are any other opportunities of taking advantage of the use of these containers in the sphere of the Armed Forces. The answer to this question can be guessed, as for some time, some companies have used the design of sea containers as a base for building modules as field hospitals, munitions warehouses, toilets, and even as water-treatment plants for the Army.
On the other hand, the Navy, unlike other units inside the Armed Forces, has the possibility of a prolonged projection over time, which requires the ships to provide a prolonged presence for long periods of time in remote places with no need of external support. It offers a capability which can not be compared to any non-governmental organisation (NGO) for the transportation of large volumes (humanitarian aid, medicine, infrastructures, etc.), in relatively short periods of time, to places where there have been natural disasters, the destruction of inhabited areas in times of war, or simply areas in a state of emergency for any reason. The Navy has demonstrated this capability on several occasions, for instance, after the earthquake in Haiti in 2010.
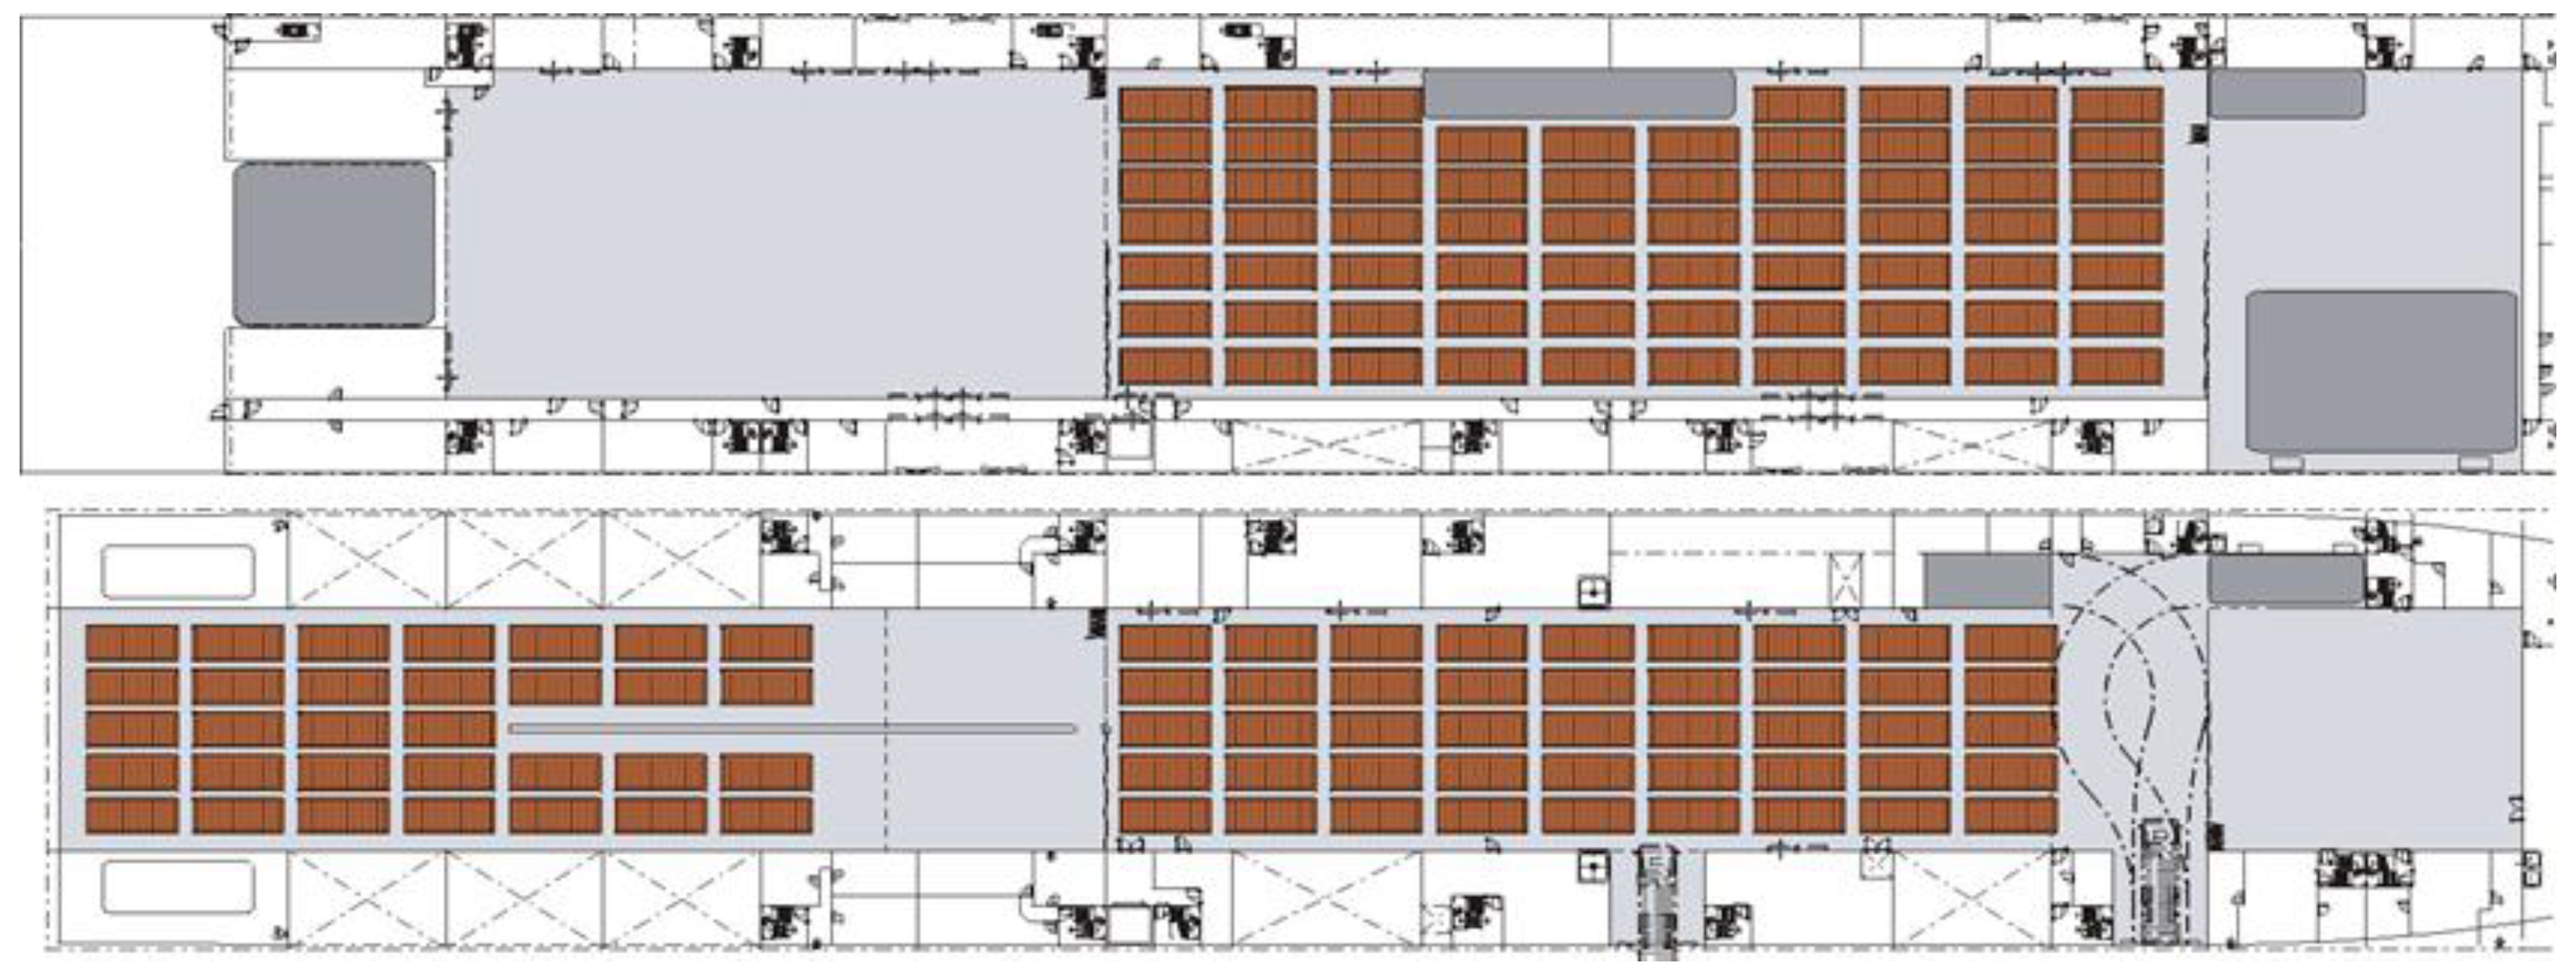
The Navy is, therefore, an interesting option for the transportation, building, and even maintenance and operation of facilities with similar features to the ones of the Army, which cannot transport so faraway through its own means, or doing so is more expensive. Indeed, the new ships of the Navy (Figure 1) have been designed bearing in mind the possibility of harbouring a large quantity of containers with a standard size of 1 twenty-foot equivalent unit (TEU).
The transportation of these kinds of modules is better via maritime means. In this sense, the Navy has an important capacity for the transportation of humanitarian aid to areas where there have been natural disasters or are at war.
It is important to carry out a thermal analysis of the service modules recycled as maritime containers. There are several articles in the literature which establish methodologies to carry out this analysis. Ulloa et al. [7,8] carried out a thermal analysis of the behaviour of caravans and leisure ships using similar methodologies.
Based on the above, we believe it is relevant to carry out a study of thermal demands in Trnsys® (V17, Thermal Energy System Specialists, LLC, Madison, WI, USA), which will offer two readings: on the one hand, it will belong to a latter project or projects that will assess the cost and viability of the refurbishment of maritime containers reused as service modules, and, similarly, it may belong to a more extensive study regarding the cost of acquisition of service modules to specialised companies. Therefore, this article involves the development of a methodology for thermal analysis first applied to service modules using a transient system simulation tool (Trnsys®).
2. Methodology
2.1. Container Description
The containers have been adaptedto assist the different needs which have been arising, thus resulting in ten main types [9]: Metal, Dry General-DV, High Cube-HC, Open Top-OT, Open Side-OS, Bulk-BLK, Flat-FLT, Refeer-RF, Insulating, and Tank. The average lifetime of a container ranges between seven and 14 years [10].
The selection of service modules was made based on the ones used by the Spanish Army and Royal Marines, supplied by the company ARPA [11]. To do so, the Technical Prescription Document of the Spanish Army for the purchase of several containers and modules [12] was used as a reference. This document will also be used as a reference in the cases where the product catalogue of the supplier does not include the technical data needed for the design of the model for the simulation.
Two criteria have been used for the selection of the elements of study: the usefulness and the technical interest. Three different configurations were established so that they could be useful in contingencies alike to the one lived in Haiti after the earthquake in 2010, or in Indonesia after the Sumatra-Andamán tidal wave, and, moreover, to have uses different enough among them so as to be worth studying.
Starting with these premises three configurations are selected among the offered ones in the ARPA catalogue [11], which will be used as the base to design the models to be studied: first aid module, shower module, and refrigeration module. The three of them measure the same as a 1 TEU container so as to be transported in Navy ships.
2.1.1. First Aid Module
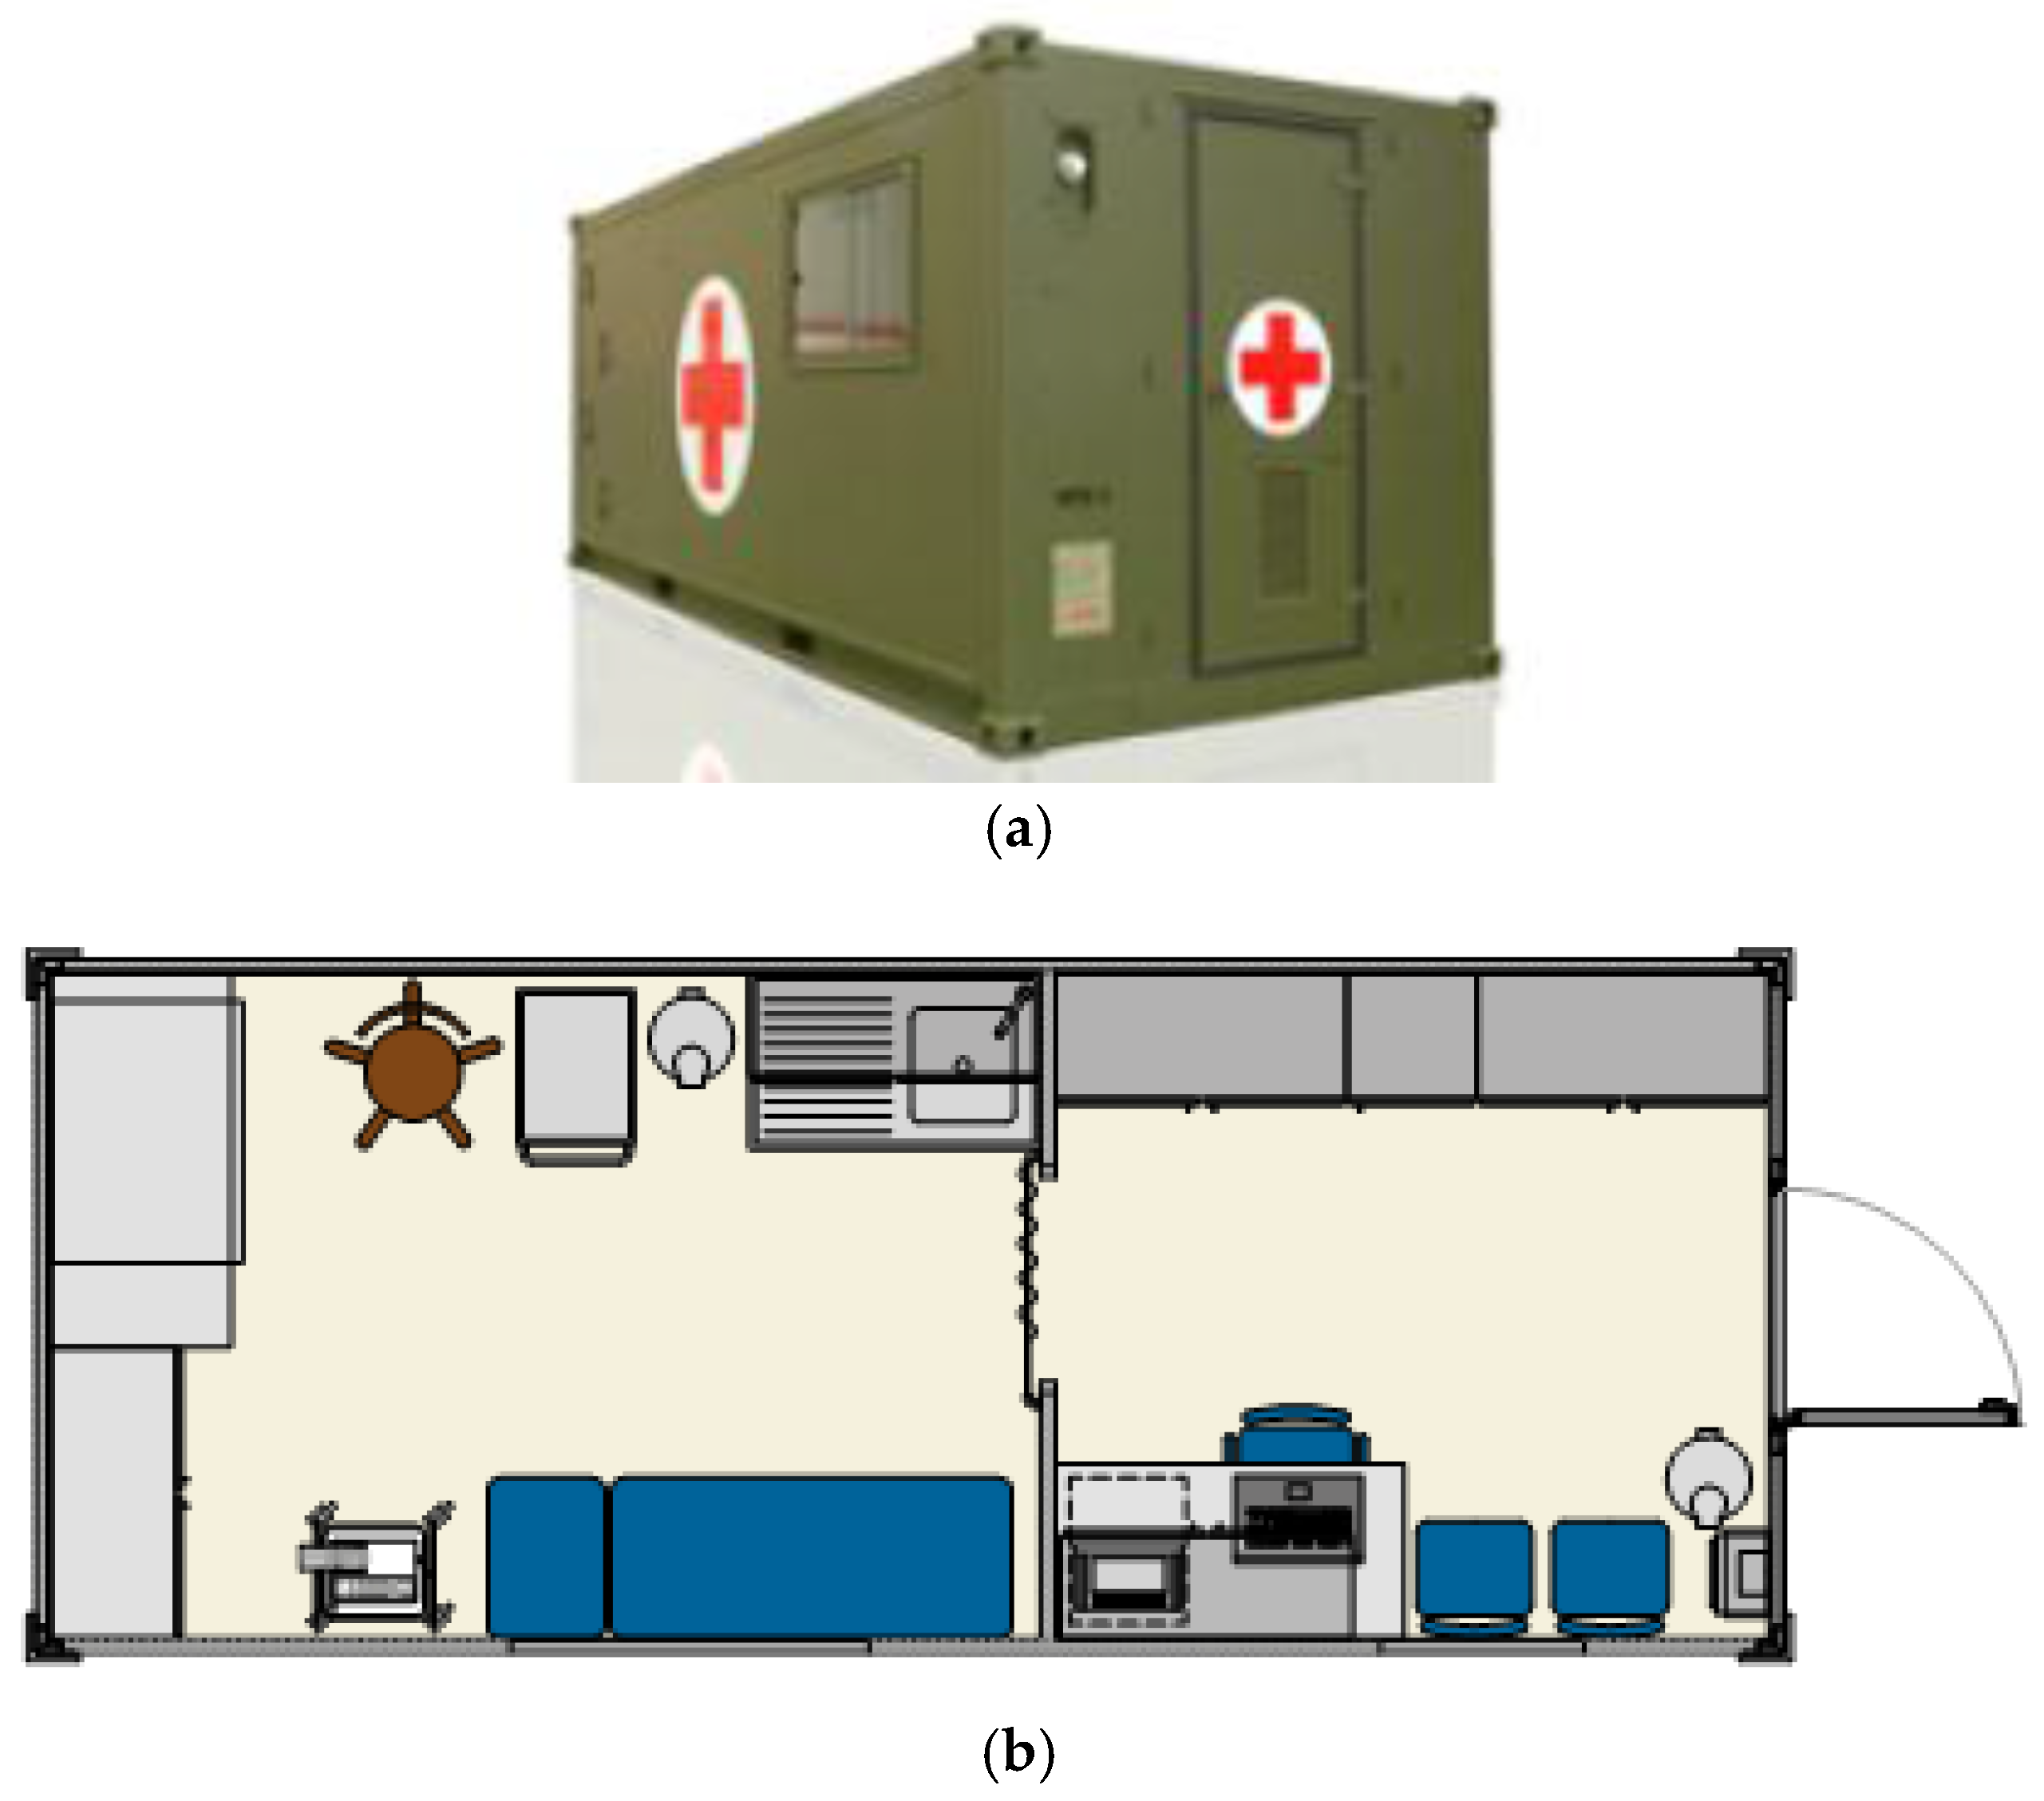
The first aid module (Figure 2) is the most basic one in an emergency contingent. It is a space designed for first aid medical assistance. The fixed or bulky elements in this equipment are the ones that will be taken into consideration when designing the parameters for the thermal simulation.
2.1.2. Shower Module
The shower module, despite not being as useful as the previous one, can be a very important help in maintaining a minimum level of hygiene. This aspect can be essential to avoid the spreading and infection of some illnesses. The choice of this configuration as a model for study is due to the fact that it is considered interesting with respect to the analysis of the energy demand necessarey to warm the water consumed.
2.1.3. Refrigeration Module
The refrigeration module, just as the shower module, could not be inside the priority elements of an emergency contingent. Nevertheless, from a thermal point of view, the difference of the work temperature of the inner air of this container makes the results of thermal demand to be very different from the former two study cases . It is important to point out the role of this container in the supply and maintenance of perishable food in long-term deployments.
It is worth pointing out that although these elements will be used as pattern models, not all of the features, equipment, or materials which define them will be present in the modules under study.
2.2. Container Modelling
For the design of the closings, three references have been taken into account: the second-hand container used as the base [13], the container of ARPA S.A.U., and the document of conditions of the Spanish Army [12].
The selected shipping container was a standard model of 1 TEU (20 feet long, eight feet wide, and eight feet and one inch high). It has total floor area of 14.77 m2 and a volume of 36.01 m3. The container geometry was defined with the Trimble SketchUp modelling software. The whole container was defined as a thermal zone. The rate of exterior glazing was 20.1%. The three kinds of modules were different among them for the enclosure and the operational temperatures. For the selection of these temperatures UNE-EN ISO 13790 [14] is used as a norm, which regulates the operational temperatures to maintain a thermal comfort state in different facilities in Spain.
2.2.1. First Aid and Shower Modules
Table 1 shows the features of the enclosure of the simulated container model. For the lateral panels and the roof it is agreed to define a sandwich-like wall with an outer steel layer, a layer of polyurethane as an insulating material, and an inner layer of galvanized steel. The floor is made, from outer to inner, of a steel layer, a polyurethane layer, a plywood layer, and a final aluminium layer. The layer walls were defined based on container wall materials of ARPA S.A.U. and the document of conditions of the Spanish Army [12].
These modules have a window (facing west) with an area of 0.84 m2 (1.2 m × 0.8 m) with an emission coefficient of 0.9 and an absorption coefficient of 0.6. The emissivity values were directly estimated by Trnsys®. The window materials are not relevant for the thermal simulation as the majority of the energy that will be transmitted through this surface is by radiation. Transmittance values were directly calculated in Trnsys® based on equivalent resistance models for layered walls.
In the case of the first aid modules the range of temperatures was selected as indicated in UNE-EN ISO 13790 [14] for a hospital (22 °C and 26 °C). For the shower module the same lower limit of temperature was selected (22 °C), the higher limit was not applied, as we want to avoid a thermal gap, apart from the fact that the use of domestic hot water (DHW) for showers increases the module temperature.
2.2.2. Refrigeration Module
The enclosures of the refrigeration module (Table 2) are different to the other two containers due to the working temperatures. The panels are made of a first outer steel layer, an intermediate insulating layer (three layers of polystyrene/polyurethane/polystyrene), and an inner steel layer. The refrigeration module does not have any kind of window.
In the refrigeration module two different scenarios of thermal demands were carried out: one with a temperature of −40 °C (using the module as a freezer) and another one with 10 °C (using the module as a refrigerator).
2.3. Regions of Study
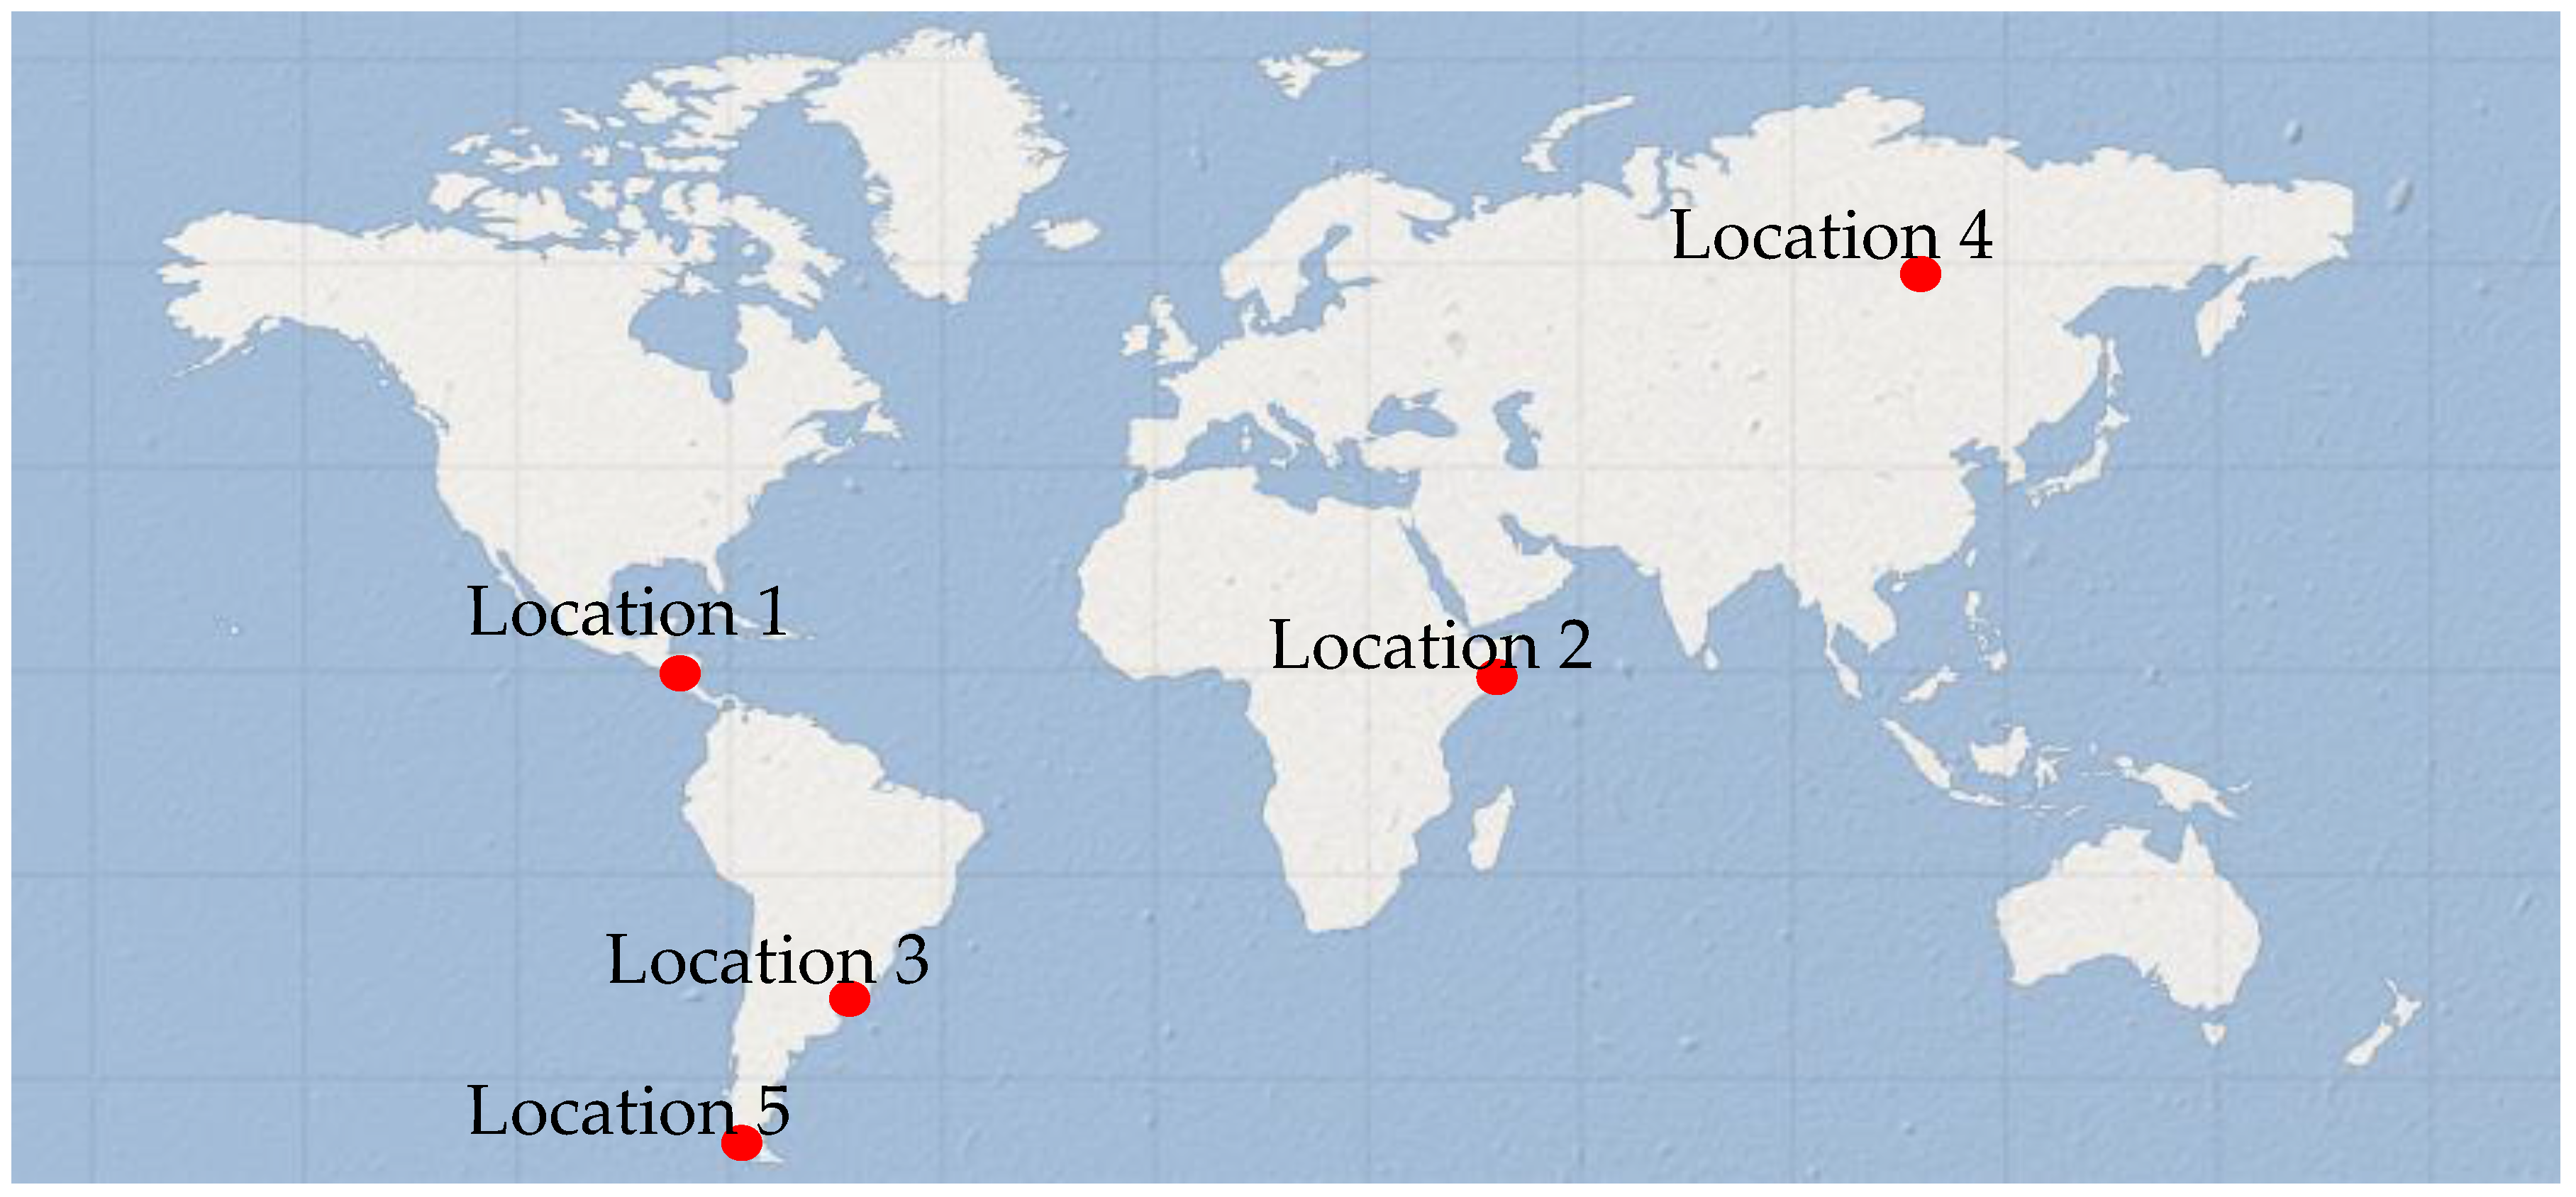
As this kind of module is going to be used in different areas, it is compulsory to carry out an analysis of the thermal needs in different scenarios. To do so, the globe devided into climate areas by Köppen-Geiger was chosen. This system divides the globe into five main regions based on thermal thresholds, limit data of temperatures and, in a general way, types of vegetation. These five regions are: Region A (tropical climate), Region B (dry climate), Region C (mild climate), Region D (continental climate), and Region E (polar climate) [15,16].
Based on the above, five locations were chosen to carry out the simulations (Figure 3):
- Location 1. Port-au-Prince, Haiti: A city located on the Caribbean Sea (region A), it was chosen for being an area with a high probability of earthquakes and hurricanes.
- Location 2. Yibuti, Yibuti: location in region B, in the Horn of Africa; it is a developing area, which features very extreme temperatures.
- Location 3. Colonia, Uruguay: Located in the South American continent, it is chosen just for the fact that is a location inside the third region of Köppen-Geiger (C).
- Location 4. Yakutsk, Russia: Located in Eastern Siberia, it is chosen for being one of the locations with the lowest temperatures in the world in winter. It corresponds to region D.
- Location 5. Puerto Williams, Chile: Apart from being one of the few locations in region E, it is interesting for the great difference of daylight in the different seasons of the year, a fact that will affect the results of the simulations.
The meteorological records (input in the simulation environment of Trnsys® were downloaded based on the Meteonorm data [17] in typical meteorogical year (TMY)-2 format.
2.4. Trnsys® Simulation Studio
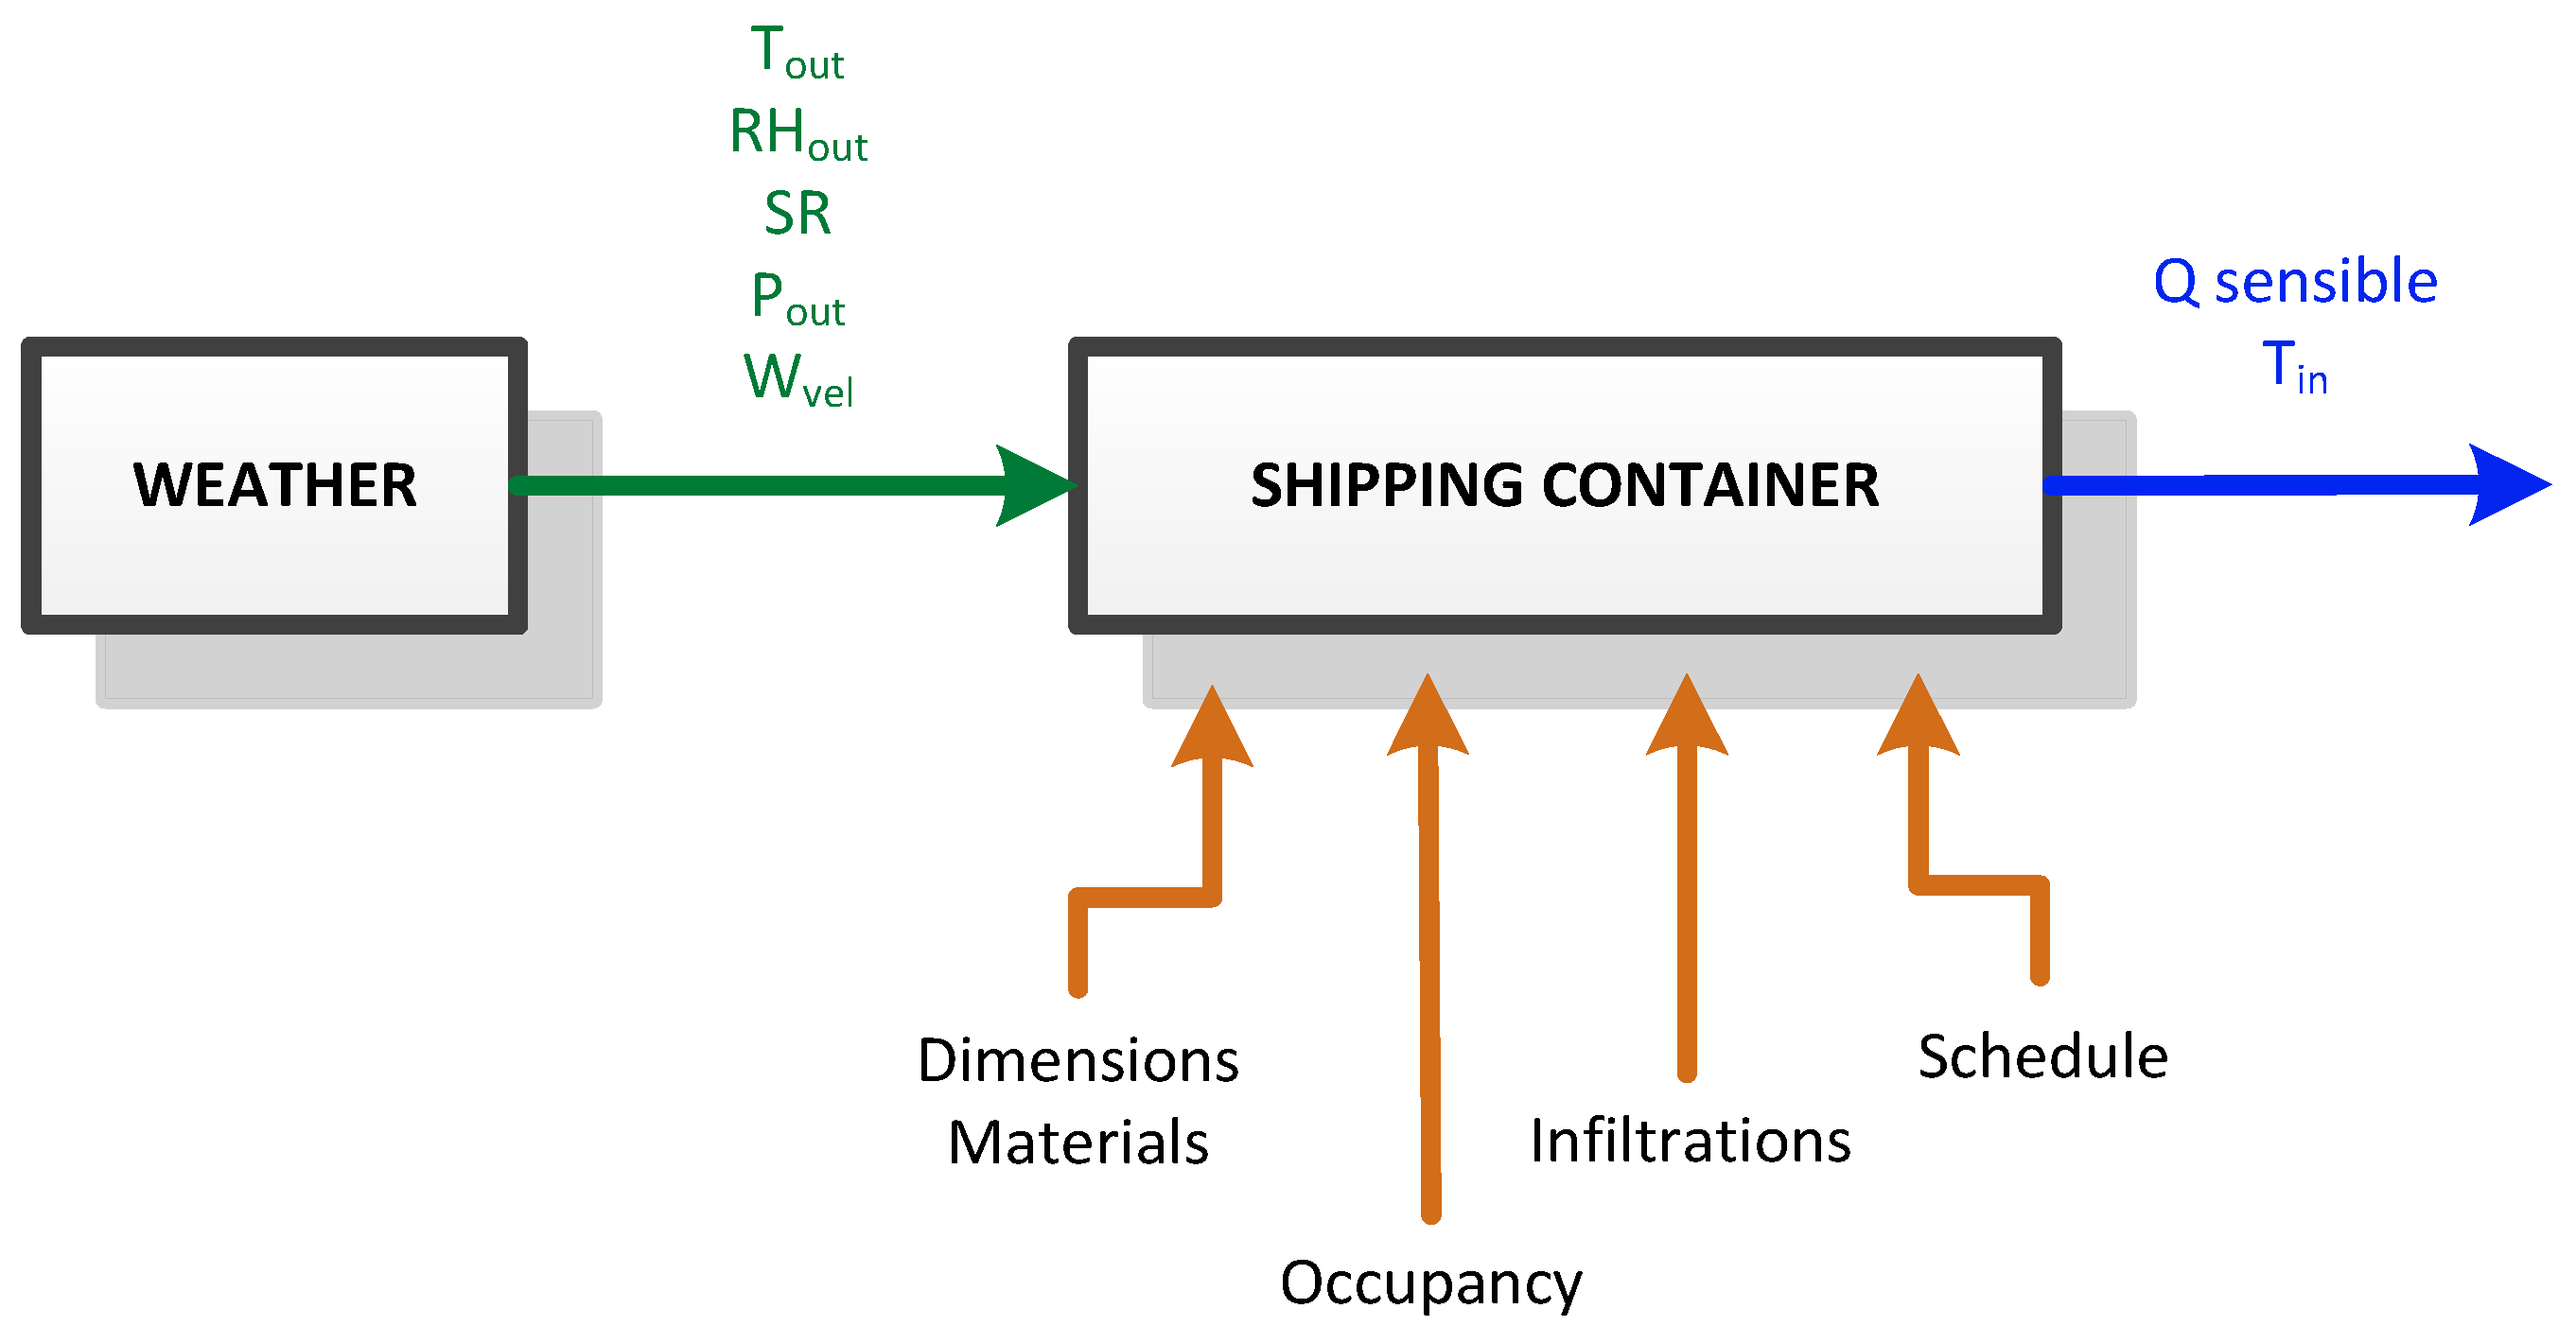
The conditions of the simulation were defined in Trnsys®, introducing the data of thermal gain, infiltrations, and occupancy of the modules (Figure 4).
The five weather variables included in the model are: temperature outdoor (Tout), relative humidity outdoor (RHout), solar radiation (SR), pressure outdoor (Pout), and wind velocity (Wvel). The outputs of the simulation are: Q sensible and temperature inside the module (Tin).
The estimation of thermal capacitance of the module was done based on the material in which the furniture is made (Equation (1)):
where is the capacitance of the materials of the furniture. In this case: air, aluminium, and stainless steel. These capacitances are calculated just as it appears in the Equation (2):
where is the mass; is the specific heat; is the density of the materials; and volume of the materials.
The values of thermal capacitances of the first aid, shower and refrigeration modules were 549.35 kJ/K, 522.62 kJ/K, and 199.50 kJ/K, respectively.
Input Trnsys® Model
In the first aid module, the thermal gain was estimated as corresponding to a maximum of five, and a minimum of zero, people based on a usage timetable of 12 h. The energy supplied by each person inside the module was calculated based on the norm ISO 7730 [18], which regulates standard data according to the activity level. ISO 7730 indicates, for the degree of activity chosen for this study (equivalent to seated, light work, or typing), a metabolic rate of 150 Watts or 510 BTU/h. The parameter of infiltrations (the renewal of air in the module) was estimated as based on previous projects [7], that is, a renewal of the 100% of the air every hour.
In the shower module, apart from the increase in occupancy, it must be taken into account that the hot water in the showers generates a heat cession to the environment. Based on experimental data, a value of 0.12 kW of thermal gain was estimated in the moments when the showers of the container are being used. Moreover, the increase of humidity that the use of showers generates will increase the ventilation of air forced during the periods when they are being used. To measure this we estimated a volume of water of 84.95 m3/h for each shower which, compared to the volume of the container (36.01 m3) equals 18.9 renewals of the volume of air per hour during the time when the showers are being used [19]. It was estimated that these air renewals would take place during the following 20 min after the end of use of the showers in the module. The timetable for using the module was estimated in three shifts of 1 h each (06:00, 13:00, and 20:00). The timetable is the same for all days of the week. As the module has eight showers, the maximum occupancy is eight people (150 W per person, according to the ISO 7730). Assuming that the people inside the module spend five min in the shower and five min changing clothes, so that the showers are not vacant until each user has consumed these 10 min, this container provides service to 144 people every day.
In the refrigeration container no thermal gain was established as the light will be normally switched off and it will only be on when somebody goes in at certain moments (apart from being LED-based, as in previous cases). No electrical appliances or people are included inside which could provide some thermal gain. A value of air renewal of 5% of the total volume every hour is chosen, which equals to a renewal of the 120% of the total volume every day, which is, in turn, the approximated value of a weighted arithmetic mean on a normal day when it is only opened just once or twice a day. In this module the forced ventilation will not be taken into account and will be characterised by the enclosure, the working temperatures, the infiltrations, and thermal capacitance.
3. Results and Discussion
Here we show the results corresponding to the simulation of thermal needs of the three modules
3.1. First Aid Module
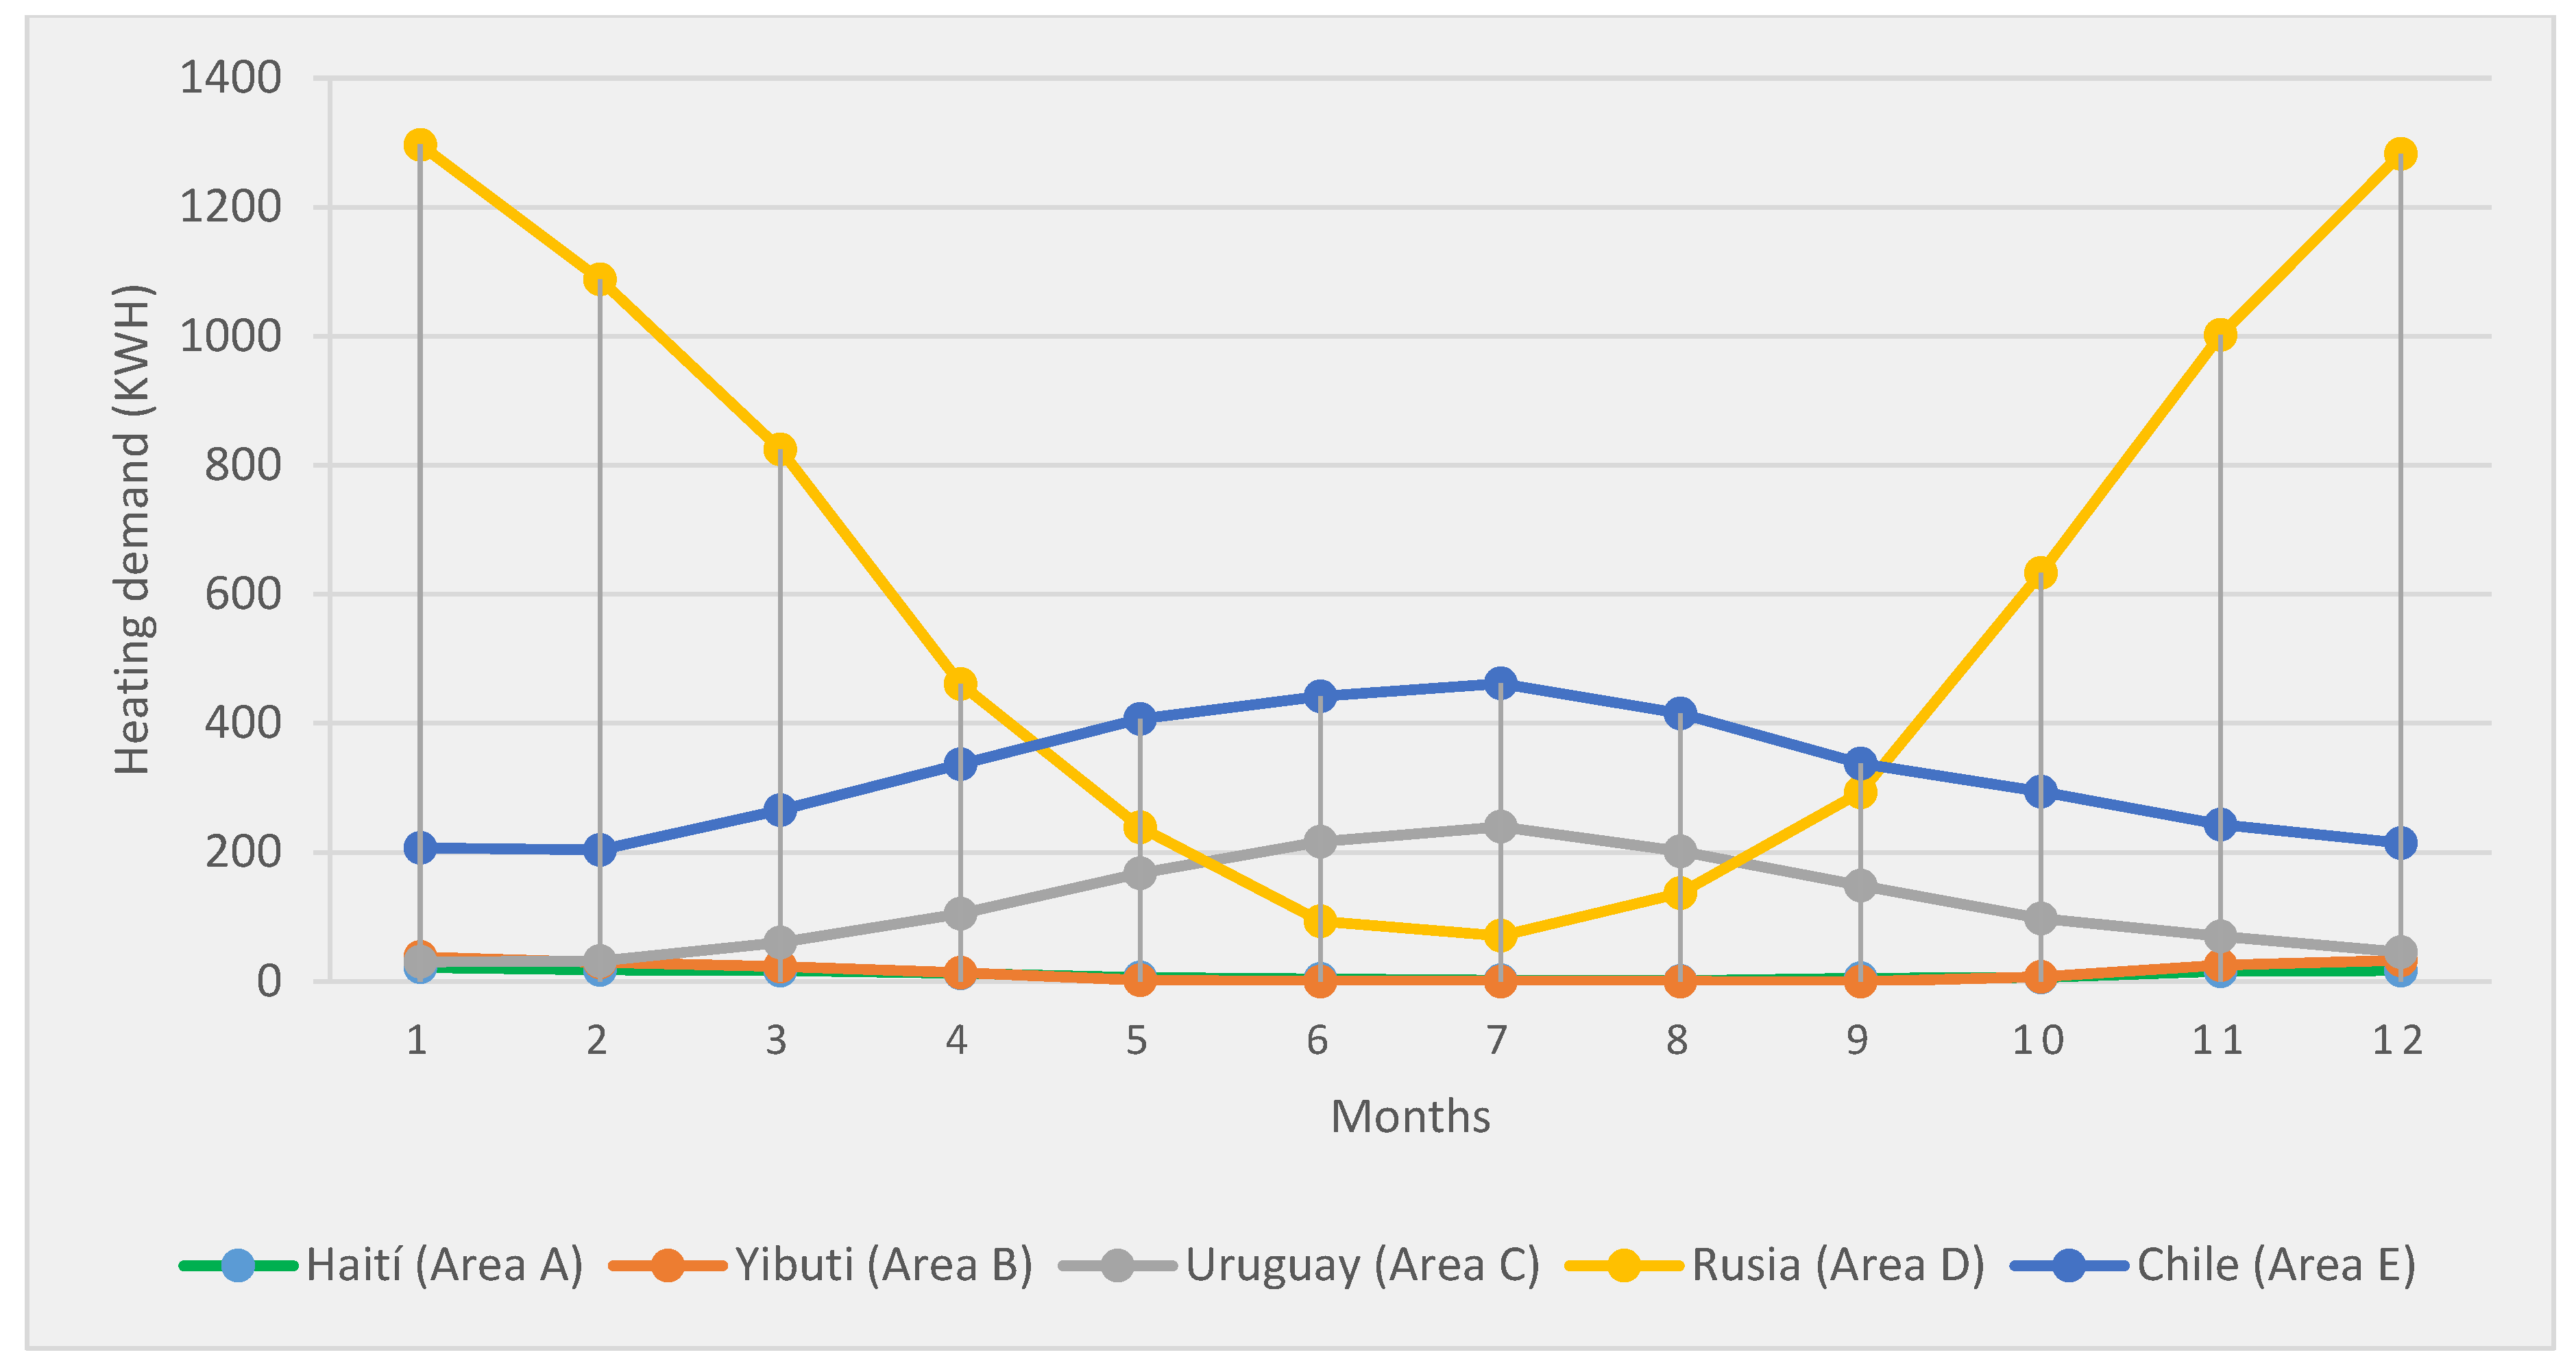
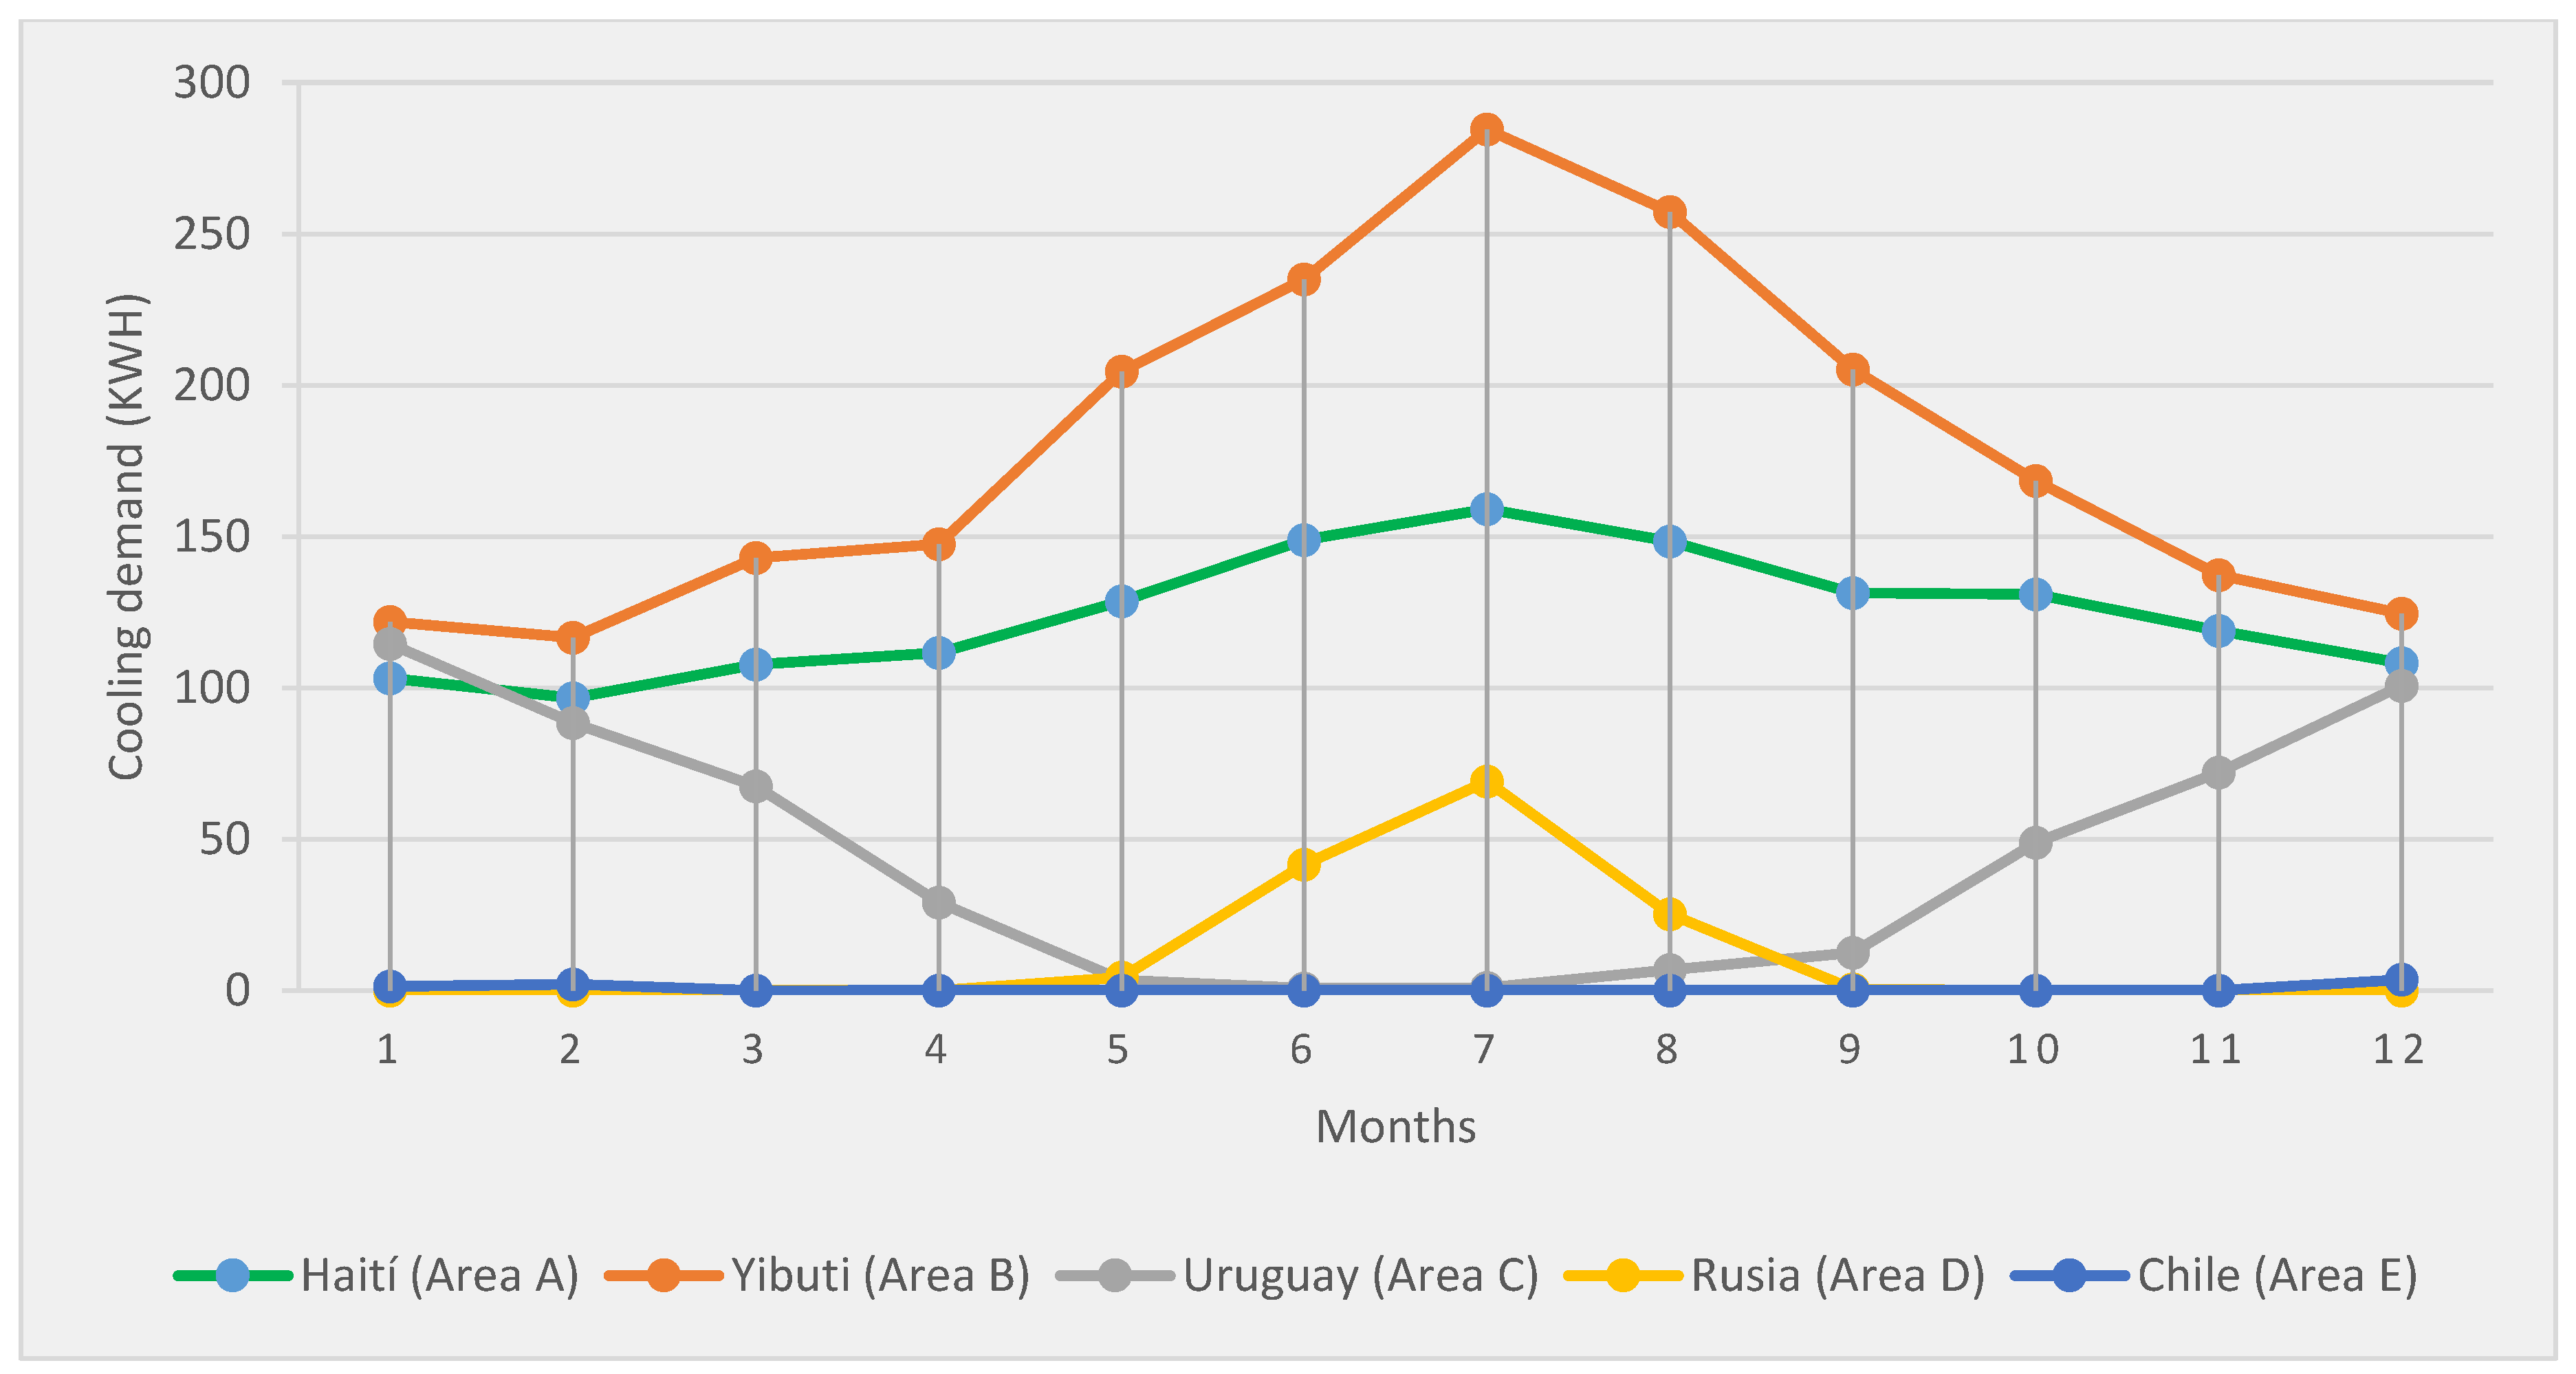
For the first aid module the demand of both heat and cold are studied, as a range of temperatures (22–26 °C) has been established (Figure 5 and Figure 6). In Table 3 the peak demand values (an important aspect for a latter selection of equipment) are shown.
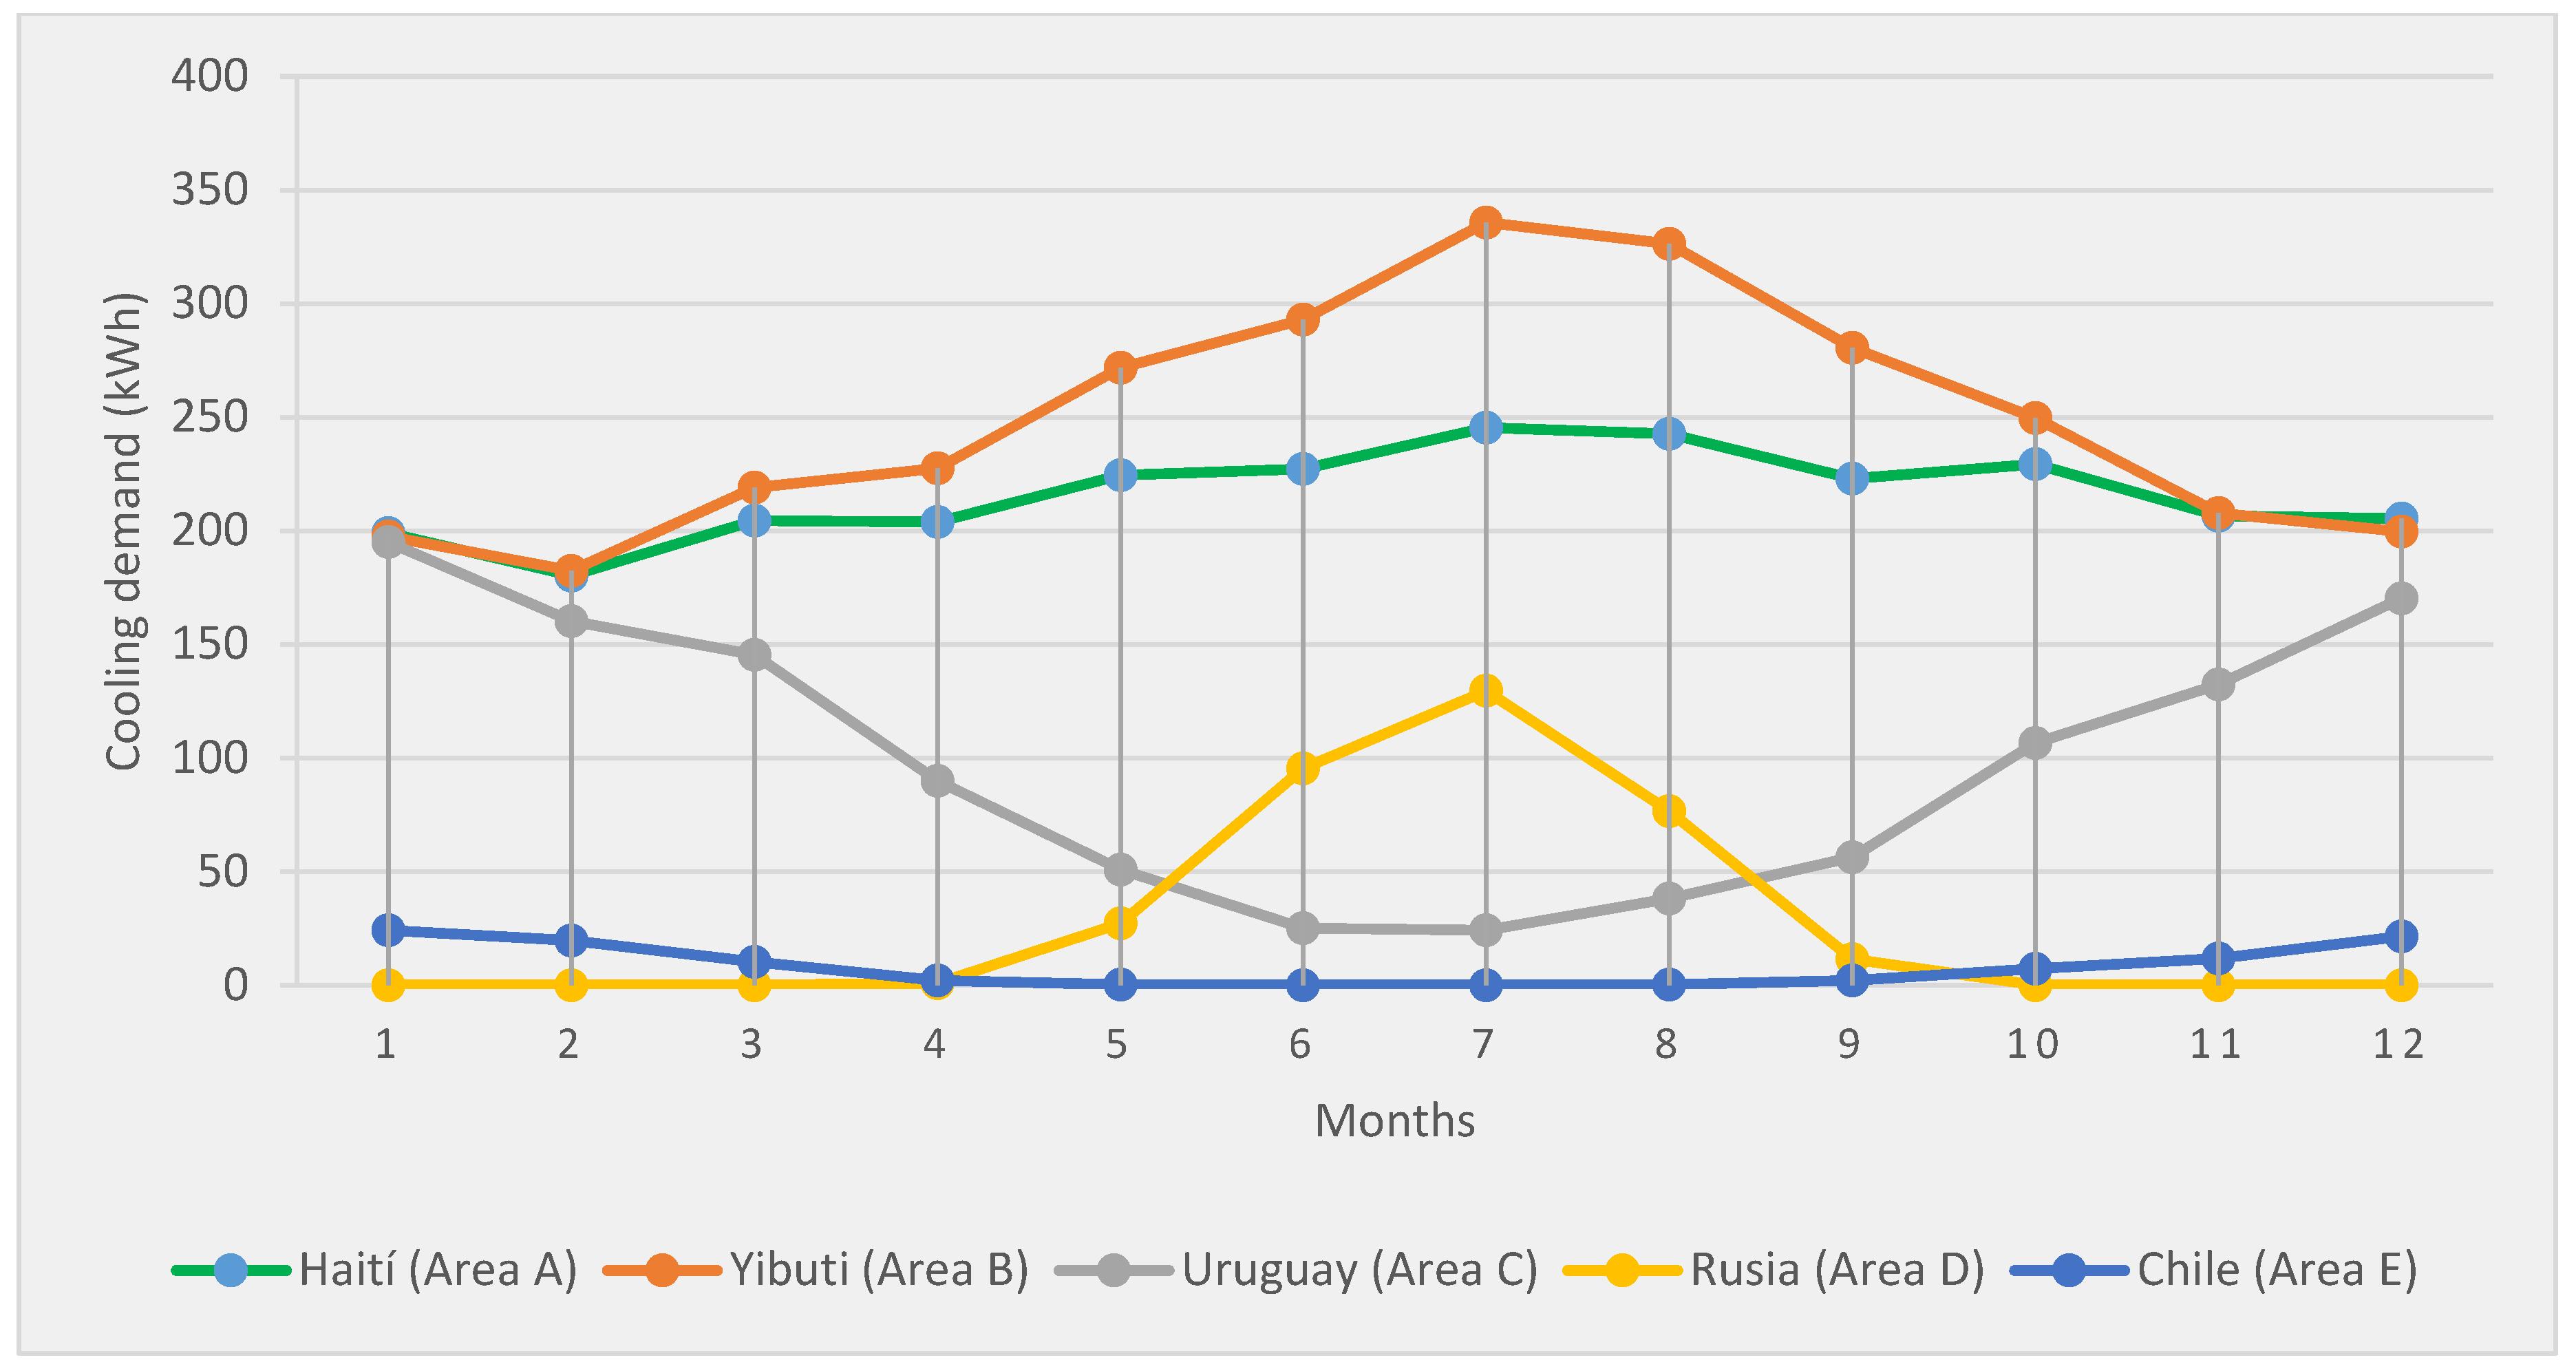
In zone A, as it was expected, a very low value of annual heating demand was estimated (123.12 kWh) in comparison to the cold demand (3093.21 kWh). The features of zone A in the Köpen-Geiger classification regarding the temperature are effectively reflected in the data obtained as it is confirmed that the monthly average temperature is never under 18 °C. Apart from this, the closeness to the sea is noted in the low temperature range between the minimum and maximum monthly temperatures.
In zone B, the annual heat demand is 171 kWh, whereas the annual refrigeration consumption goes up to 2145.53 kWh. In this region, the highest values of heat demand correspond to the months of winter (December–February). As it can be expected, the peak refrigeration demand is located in the summertime (June–August).
In zone C the maximum power value (790 W) is obtained in the months of July and August. It is not a very high peak in comparison to the rest of the central months of the year. Nevertheless, regarding consumption data there is a large difference between the central months of the year and the hottest months. This location is located in the southern hemisphere and the season of summer is during December, January, and February. The annual heating consumption is 1412.23 kWh, whereas the annual refrigeration demand is 545.25 kWh, a third of the heating consumption. Despite both systems being subdued to similar peak values, the consumption varies greatly. The cold and heat demand data match with what could be expected in the Köppen-Geiger zone C, corresponding to a mild climate similar to Spain. It is confirmed that the results obtained for heat demand match with the annual average of a home in Spain (taking into account the difference of the area and the operational temperature) [20].
In zone D, the peak value of heat demand goes up to 2190 W, due to the extreme temperatures reached in the cold months. There is a large variation of the peak demands between the hot and cold months. This result is the one that could be expected from an area in zone D of the Köppen-Geiger classificaiton. Moreover, in this case, as it is a region is Siberia, the average temperatures in the cold months drop much more than what is usual in other locations in the same zone. The annual heating demand is 7421.67 kWh, whereas the annual refrigeration demand is 140 kWh. The demand for cold is produced in the central months (May to August).
The location of Puerto Williams (zone E) makes this city the most southern in the world and the closest to the Antarctic continent, which explains the peak values of demand (Table 3). The consumption of the annual cooling system is virtually negligible (7 kWh annually). That is, based on the results we can infer that the refrigeration system is not going to be needed in this location.
Of the data obtained, it can be deduced that the heating demand increases in the locations of colder climates, although the temperatures in summertime are higher than the one in region E.
As it could be expected, the results of demand of maximum cold power increase when the climate is hotter. The peak demand value of refrigeration power appears in the location of region B. In this region there are higher temperatures than in other regions.
3.2. Shower Module
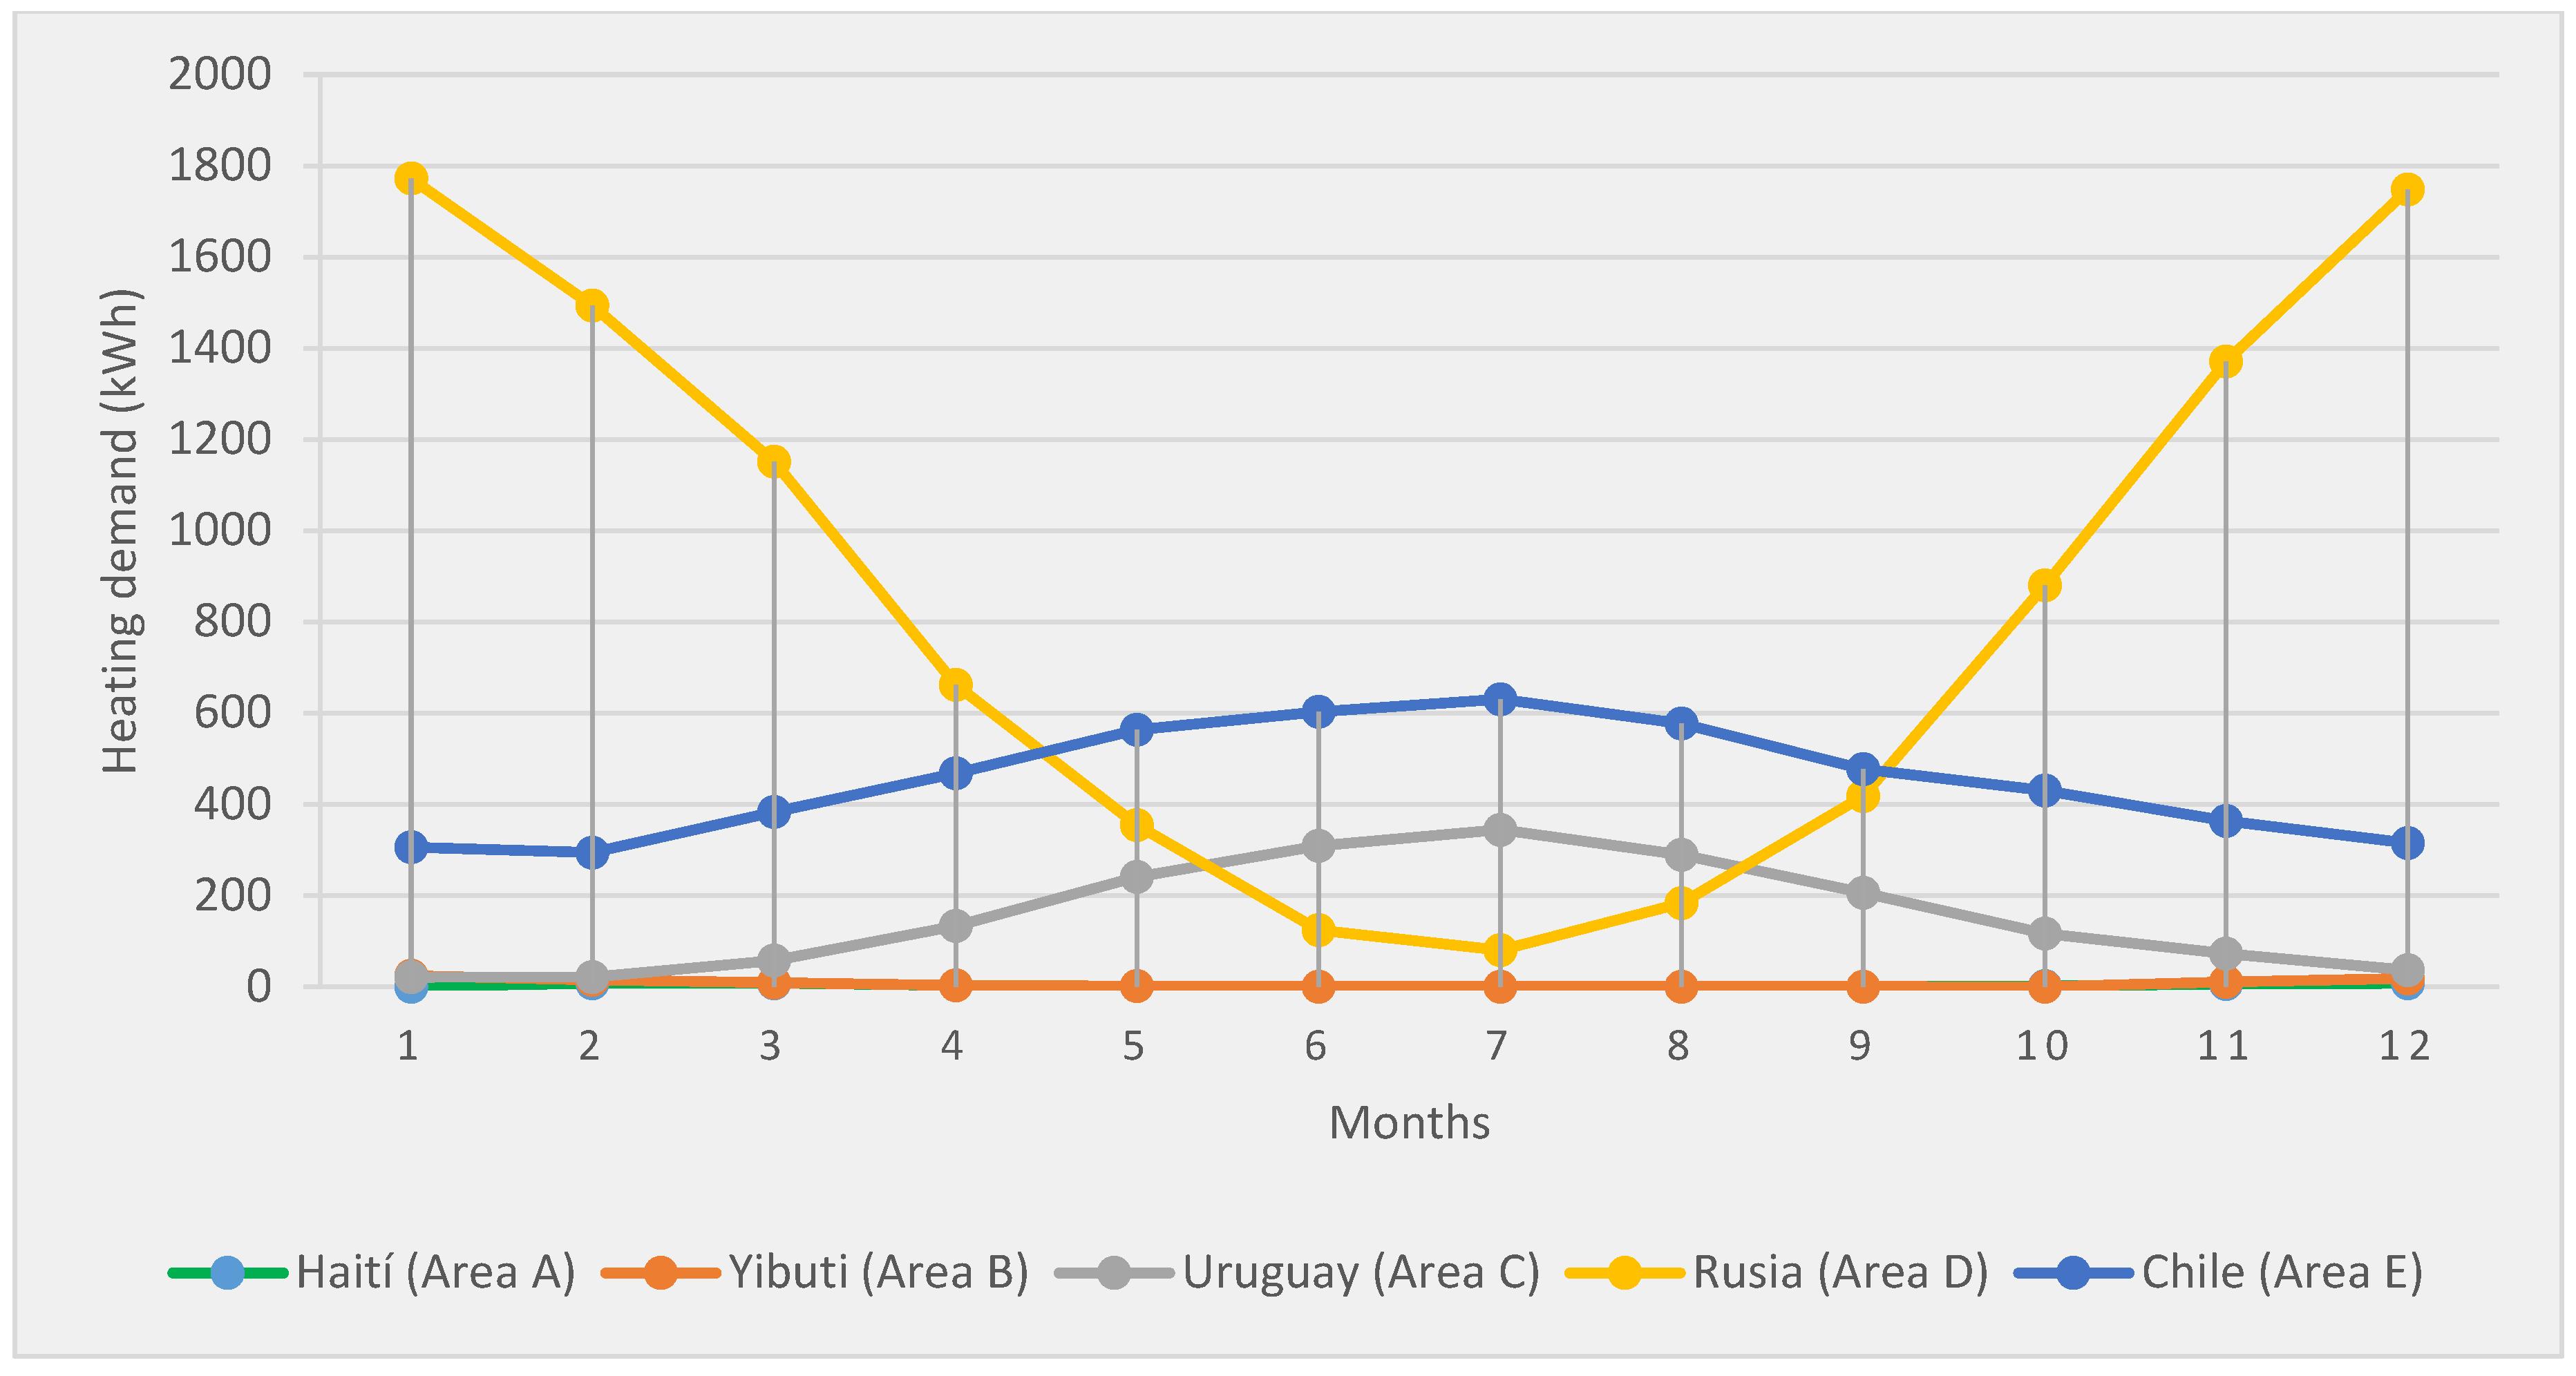
In the case of the shower module only the heat demand is taken into consideration as a high temperature limit was not established (Figure 7).
The annual consumption in zone A is 42.75 kWh, a value according to the temperature data recorded in the area (the minimum temperature value in the whole year is 18.85 °C). As it could be expected, in zone B the annual consumption is just 60.42 kWh.
In location C, with a similar climate to the Iberian Peninsula, the peak in heating demand is recorded in July. The annual consumption for this location is 1840.97 kWh, a value slightly higher than the one obtained for the same location in the simulation of the first aid module. This is due to the increase of the air renewal.
Regarding the location in Siberia (zone D), as it could be expected, the demand data increases. The maximum is recorded in January with a value of 4000 W (Table 4). It is confirmed that the difference of temperature throughout the year is going to require that the equipment chosen to cover the demand must be very powerful, although most of the months it will be used under its capacity. The total annual consumption is 10.2 MWh.
The heat demand in Puerto Williams (zone E) is virtually steady throughout the year. The demand peak is 1500 W (in July), whereas the maximum demand in the hottest month (January) is 970 W. The total annual consumption is estimated at 5406.73 kWh.
As in the first aid module, the heating demand increases in the locations with colder climates. Despite what could be assumed at first, it can be deduced from the data obtained that, even though they have more thermal gain than the first aid container, they are not enough to compensate for the forced renewal of air produced by the fan installed in this module. These renewals cause, in the coldest locations—where the exterior temperatures are lower—the power demand to increase. This is due to the fact that the fan introduces exterior air at a very low temperature inside the module. In the hotter locations, in which the air introduced inside the container has a higher temperature, this effect decreases, and even, in region A, is slightly inverted.
3.3. Refrigeration Module
3.3.1. Results with an Operational Temperature of −40 °C
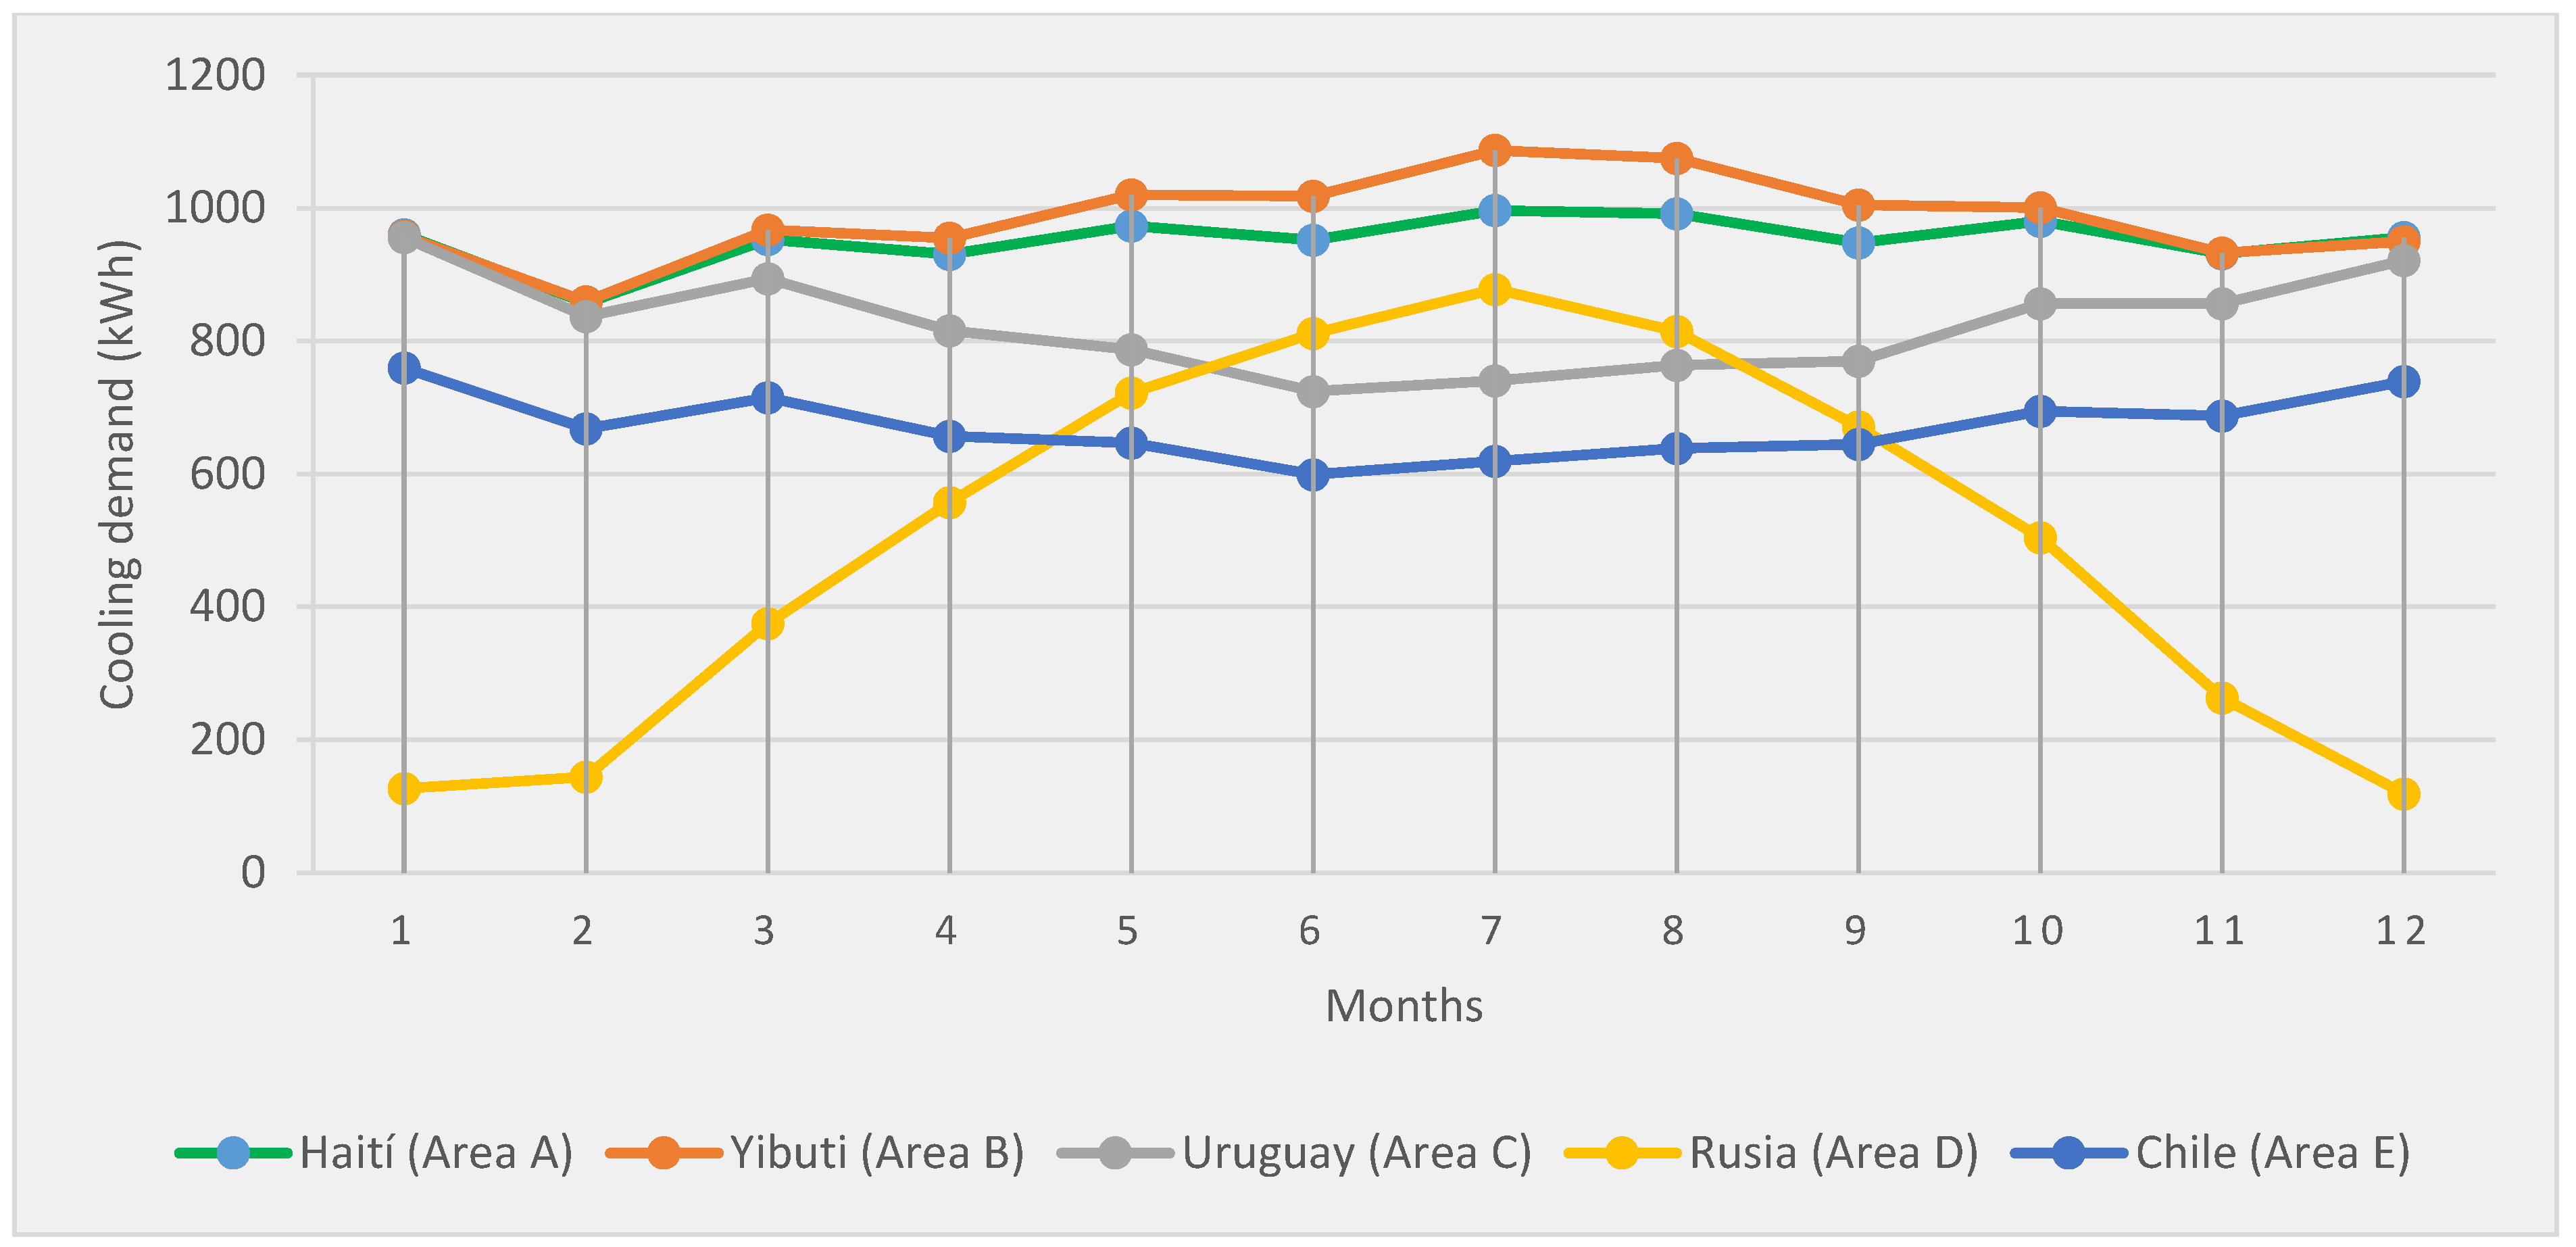
In zone A the consumption goes up to the 11.4 MWh annually. In zone B there is very little variation between the monthly demands (Figure 8), resulting in an estimated annual consumption of 11.8 MWh.
In zone C, just as in zone B, there is not much difference between the peak values of each month (Figure 8). The annual consumption in the unlikely case of the steady use of the container at −40 °C would be of 11.8 MWh.
In the case of Yakutsk (Russia, zone D), where we have already confirmed that the temperatures suffer large drops, the demand really shows notable difference in comparison to the ones obtained previously. The peak of maximum demand at −40 °C is recorded in July with a value of 1560 W (Table 4). In this region there is a large difference between the values in the different months (Figure 8). The annual demand is 985.02 kWh, virtually half of the previous locations.
As it can be observed in the Figure 9, the values of monthly demand in the zone E are very similar among them as it can be expected based on the features of this climate zone. The annual consumption in this zone is 8067.66 kWh.
3.3.2. Results with an Operational Temperature of 10 °C
The record of the maximum demand in this case is not interesting with respect to evaluating the equipment, which uses the maximum recorded power peak for the minimum working temperature.
In zone A the annual consumption inside is 2591.1 kWh. This record would correspond to a use of the container as a refrigerator and not as a freezer. This reflects, therefore, the minimum consumption for this location. The consumption produced in a mixed use (−15 °C) would be around 7000 kWh. It is deduced that, for this location, the needed equipment to satisfy the demand requires high power and it will also generate high consumption (Figure 9).
In the zone B the annual consumption with an operational temperature at 10 °C goes up to 2989 kWh. The combined consumption at an inside average temperature of −15 °C is estimated in 7394.5 kWh. It is confirmed that in this location it would also be expensive to keep refrigerating equipment that would maintain the allocated temperatures (Figure 9).
In zone C a large range in the consumption of the refrigerator at 10 °C can be noticed, reaching an annual consumption of 1193.53 kWh. The annual mixed consumption is estimated around 6496 kWh. The maximum record of cold demand at 10 °C is 480 W. This result is almost double of the smallest peak value recorded in the month of July.
In zone D it was observed that, to maintain a temperature of 10 °C inside, there was no need to switch on the equipment for more than half of the year (Figure 9). The annual demand of refrigeration in this case is estimated at 340.64 kWh. The mixed consumption would be 3162.83 kWh. Based on the results obtained, it can be deduced that in such a cold location it is not going to be expensive to operate a container like this. Therefore, sending a refrigeration module to a location in zone D in the case of catastrophe is not going to be a priority.
In zone E, the annual consumption at an operational temperature of 10 °C would be 98.36 kWh, whereas the mixed consumption at −15 °C would be around 4080 kWh. These results indicate that keeping a refrigerated container in this location would not be expensive (Figure 9). Nevertheless, its deployment would not be as useful as in the first locations (A, B, and C).
Just as in the analysis of refrigeration demand for the first aid module, it is observed that the demand increases in the regions with hotter climates. Nevertheless, when the module is used as a refrigerator the difference is not so large. This is due to the fact that the temperature inside the module is extremely low (−40 °C), which creates a large temperature gap and, therefore, the difference of these gaps among the regions is smaller.
4. Conclusions
A methodology to recycle sea containers into service modules has been established. Three typologies of service modules have been analysed and the corresponding modules have been designed based on sea containers made of COR-TEN® steel.
A thermal analysis of the design proposals has been carried out, analysing the energetic demands in very dissimilar places among them. The annual demands of cold and heat have been obtained for each location, and also the corresponding power peaks.
The results offer a previous vision of the viability and maintenance costs of such modules in different locations. The power peaks make choosing the refrigeration and heating equipment capable of coping with the thermal requirements easier. The annual consumption allows us to know the operative costs of such equipment working in the corresponding modules. Moreover, this methodology allows the Army to know the operational costs of sending this type of module to different locations.
As a future line of research, the results of this project could be used for the selection of the most suitable equipment. Nevertheless, other criteria would have to be taken into account in this selection. Probably, the techniques that help to make a decision are the best tool to carry out this future study.
Author Contributions
All authors contributed to this work.
Conflicts of Interest
The authors declare no conflict of interest.
References
- Schiavoni, S.; Sambuco, S.; Rotili, A.; D’Alessandro, F.; Fantauzzi, F. A nZEB housing structure derived from end of life containers: Energy, lighting and life cycle assessment. Build. Simul. 2017, 10, 165–181. [Google Scholar] [CrossRef]
- Copertaro, B.; Principi, P.; Fioretti, R. Thermal performance analysis of PCM in refrigerated container envelopes in the Italian context—Numerical modeling and validation. Appl. Therm. Eng. 2016, 102, 873–881. [Google Scholar] [CrossRef]
- Bernardo, L.F.A.; Oliveira, L.A.P.; Nepomuceno, M.C.S.; Andrade, J.M.A. Use of Refurbished Shipping Containers for the Construction of Housing Buildings: Details for the Structural Project. J. Civ. Eng. Manag. 2013, 19, 628–646. [Google Scholar] [CrossRef]
- Abrasheva, G.; Senk, D.; Häußling, R. Shipping containers for a sustainable habitat perspective. Rev. Métall. 2012, 109, 381–389. [Google Scholar] [CrossRef]
- Sawyers, P. Intermodal Shipping Containers Small Steel Buildings, 2nd ed.; Paul Sawyers: Washington, DC, USA, 2008. [Google Scholar]
- Rodero, J.; Buques de Guerra. Buque de Proyección Estratégica BPE/LHD Juan Carlos I (L-61). Available online: https://www.buquesdeguerra.com (accessed on 5 May 2017).
- Ulloa, C.; Porteiro, J.; Eguía, P.; Pousada-Carballo, J.M. Application model for a stirling engine micro-generation system in caravans in different european locations. Energies 2013, 6, 717–732. [Google Scholar] [CrossRef]
- Ulloa, C.; Eguía, P.; Miguez, J.L.; Porteiro, J.; Pousada-Carballo, J.M.; Cacabelos, A. Feasibility of using a Stirling engine-based micro-CHP to provide heat and electricity to a recreational sailing boat in different European ports. Appl. Therm. Eng. 2013, 59, 414–424. [Google Scholar] [CrossRef]
- Lun, Y.H.V. Green management practices and firm performance: A case of container terminal operations. Resour. Conserv. Recycl. 2011, 55, 559–566. [Google Scholar] [CrossRef]
- Islam, H.; Zhang, G.; Setunge, S.; Bhuiyan, M.A. Life cycle assessment of shipping container home: A sustainable construction. Energy Build. 2016, 128, 673–685. [Google Scholar] [CrossRef]
- ARPA. Mobile Campaign Equipment. Available online: www.arpaemc.com (accessed on 10 May 2017).
- Ministry of Defence, Air Force. Technical Specifications Sheet for Medical Shipping Containers. 2003. Available online: https://contrataciondelestado.es/wps/wcm/connect/21f9e0d0-71ad-4809-b538-499389fb3917/DOC20130627105348PLIEGO+DE+PRESCRIPCIONES+TECNICAS.pdf?MOD=AJPERES (accessed on 14 May 2017).
- International Organization for Standardization. ISO 1496-1—Series 1 Freight Containers—Specification and Testing. Part 1: General Cargo Containers for General Purposes; International Organization for Standardization: Geneva, Switzerland, 1990. [Google Scholar]
- International Organization for Standardization. ISO 13790, Energy Performance of Buildings: Calculation of Energy Use for Space Heating and Cooling; International Organization for Standardization: Geneva, Switzerland, 2008. [Google Scholar]
- Peel, M.C.; Finlayson, B.L.; McMahon, T.A. Updated world map of the Köppen-Geiger climate classification. Hydrol. Earth Syst. Sci. Discuss. 2007, 4, 439–473. [Google Scholar] [CrossRef]
- Kottek, M.; Grieser, J.; Beck, C.; Rudolf, B.; Rubel, F. World map of the Köppen-Geiger climate classification updated. Meteorol. Z. 2006, 15, 259–263. [Google Scholar] [CrossRef]
- Meteotest. Meteonorm. Available online: http://meteonorm.com/ (accessed on 14 May 2017).
- International Organization for Standardization. ISO 7730: 2005. Ergonomics of the Thermal Environment—Analytical Determination and Interpretation of Thermal Comfort Using Calculation of the PMV and PPD Indices and Local Thermal Comfort Criteria; International Organization for Standardization: Geneva, Switzerland, 2005. [Google Scholar]
- ASHRAE. Handbook-Fundamentals; American Society of Heating, Refrigerating and Air-Conditioning Engineers: Atlanta, GA, USA, 2009. [Google Scholar]
- Eurostat European Commission; Ministry of Industry, Energy and Tourism; Institute for Diversification and Saving of Energy (IDAE). Analysis of Energy Consumption in the Residential Sector in Spain. Final Report. SECH-SPAHOUSEC Project. 2011. Available online: http://www.madrid.es/UnidadesDescentralizadas/Sostenibilidad/EspeInf/EnergiayCC/03Energia/3cEdificios/3c06Repartidor/Fichero/Informe%20SPAHOUSEC_ACC.pdf (accessed on 10 May 2017).
Figure 1.
Freight configuration of containers in the ship Juan Carlos I of the Spanish Navy [6].
Figure 1.
Freight configuration of containers in the ship Juan Carlos I of the Spanish Navy [6].

Figure 2.
(a) Twenty-foot equivalent unit (TEU) module for first aid; and (b) the inside design of the TEU module for first aid [11].
Figure 2.
(a) Twenty-foot equivalent unit (TEU) module for first aid; and (b) the inside design of the TEU module for first aid [11].

Figure 3.
Locations of study based on the classification by Köppen-Geiger.

Figure 4.
Block diagram for Trnsys® modelling.

Figure 5.
Monthly heating demands (kWh) for the first aid module in the five locations.

Figure 6.
Monthly cooling demands (kWh) for the first aid module in the five locations.

Figure 7.
Monthly heating demands (kWh) for the shower module in the five locations.

Figure 8.
Monthly cooling demands (kWh) for the refrigeration module with an operational temperature of −40 °C (working as a freezer) in the five locations.
Figure 8.
Monthly cooling demands (kWh) for the refrigeration module with an operational temperature of −40 °C (working as a freezer) in the five locations.

Figure 9.
Monthly cooling demands (kWh) for the refrigeration module with an operational temperature of 10 °C in the five locations.
Figure 9.
Monthly cooling demands (kWh) for the refrigeration module with an operational temperature of 10 °C in the five locations.


Table 1.
Properties of each enclosure type for the first aid and shower modules.
| Wall Category | Wall Type | Transmittance (W/m2 K) | Thickness (mm) |
|---|---|---|---|
| External | Roof | 0.309 | 83 |
| Outer facade | 0.405 | 63 | |
| Boundary | Ground | 0.543 | 69 |
Table 2.
Properties of each enclosure type for the refrigeration module.
| Wall Category | Wall Type | Transmittance (W/m2 K) | Thickness (mm) |
|---|---|---|---|
| External | Roof and Outer facade | 0.275 | 98 |
| Boundary | Ground | 0.260 | 126 |
Table 3.
Peaks heating and cooling demands for the five areas.
| Area | Peak Heating Demand (W) | Peak Cooling Demand (W) |
|---|---|---|
| A | 410 | 740 |
| B | 430 | 1050 |
| C | 790 | 760 |
| D | 2190 | 600 |
| E | 1010 | 340 |
Table 4.
Peak demands for the five areas for the shower module and the refrigeration module.
| Area | Shower Module Peak Heating Demand (W) | Refrigeration Module Peak Cooling Demand (W) |
|---|---|---|
| A | 400 | 1650 |
| B | 470 | 1790 |
| C | 1100 | 1570 |
| D | 4000 | 1560 |
| E | 1500 | 1310 |
© 2017 by the authors. Licensee MDPI, Basel, Switzerland. This article is an open access article distributed under the terms and conditions of the Creative Commons Attribution (CC BY) license (http://creativecommons.org/licenses/by/4.0/).
Share and Cite
MDPI and ACS Style
Ulloa, C.; Arce, M.E.; Rey, G.; Míguez, J.L.; Hernández, J. Recycling COR-TEN® Sea Containers into Service Modules for Military Applications: Thermal Analysis. Energies 2017, 10, 820. https://doi.org/10.3390/en10060820
AMA Style
Ulloa C, Arce ME, Rey G, Míguez JL, Hernández J. Recycling COR-TEN® Sea Containers into Service Modules for Military Applications: Thermal Analysis. Energies. 2017; 10(6):820. https://doi.org/10.3390/en10060820
Chicago/Turabian StyleUlloa, Carlos, María Elena Arce, Guillermo Rey, José Luis Míguez, and José Hernández. 2017. "Recycling COR-TEN® Sea Containers into Service Modules for Military Applications: Thermal Analysis" Energies 10, no. 6: 820. https://doi.org/10.3390/en10060820
Note that from the first issue of 2016, this journal uses article numbers instead of page numbers. See further details here.