New Adaptive Reclosing Technique in Unbalanced Distribution System

School of IT Engineering, Yonam Institute of Technology, Jinju 52821, Korea
Energies 2017, 10(7), 1004; https://doi.org/10.3390/en10071004
Submission received: 9 June 2017
/
Revised: 12 July 2017
/
Accepted: 13 July 2017
/
Published: 15 July 2017
(This article belongs to the Section F: Electrical Engineering)
Abstract
:The conventional reclosing of a distribution system is performed after a fixed dead time. However, it may lead to the increased outage time due to delayed reclosing. To solve this problem, this paper proposes a new adaptive reclosing scheme. The electrostatic induction is analyzed under at during-fault and post-fault conditions. Based on this analysis, the method to judge the fault clearance using the load current is proposed. The reclosing is adaptively performed after fault clearance. The distribution system and reclosing scheme are modelled by the electromagnetic transient program (EMTP). The various simulations according to the unbalanced ratio and various fault conditions are performed and analyzed. The superiority of the proposed scheme is verified by comparing with the conventional reclosing method.
1. Introduction
Most faults that occur in the distribution system are transient. In order to recover quickly after fault current interruption, a reclosing is performed after a certain dead time. A recloser is a circuit-interrupting device for distribution systems in which the magnitudes of the fault currents are limited. Specifically, the operation sequence of a recloser in a conventional distribution system used by the Korea Electric Power Corporation has fixed dead times of 0.5 s and 15 s, as shown in Figure 1. The recloser is opened if the current increases due to fault occurrence. After the fixed dead time of 0.5 s has elapsed the first reclosing is attempted. If the fault is not cleared, the recloser is re-opened because of the large fault current, and the second reclosing is attempted after 15 s [1].
Distinguishing permanent faults from temporary faults in reclosing sequences is very important. However, conventional reclosing adopts a fixed dead time, irrespective of whether a fault is temporary or permanent in nature [2]. In transmission systems, various reclosing schemes have been proposed to detect fault clearance and reduce dead times [3,4,5,6,7,8,9,10,11,12,13]. However, these methods cannot be applied to distribution systems for several reasons, such as the configuration and short length of the distribution system. Only a small number of studies has been performed for the reclosing in distribution systems [14]. In [14], the wavelet transform was performed after which the total harmonic distortion was calculated. A disadvantage of [14] is the complicated calculation procedure. In this paper, the adaptive reclosing scheme with a simple calculation process will be proposed.
The Korean distribution system is a multi-grounded 22.9-kV Y-connected three-phase four-wire system [15]. Moreover, most distribution systems are operated in an unbalanced state [16,17,18,19,20,21,22,23]. Consequently, neutral currents can be generated by unbalanced loads during steady state operation. In other words, some neutral current will always flow in the neutral line. This means that although symmetrical faults occur in distribution systems, the neutral current will always flow in the neutral line. This paper analyses the phenomena induced by the neutral current. Based on this analysis, the new adaptive reclosing scheme using load current is proposed.
This paper proposes a new adaptive reclosing method in an unbalanced distribution system. Section 2 discusses the electrostatic induction between the neutral line and the distribution line based on equivalent circuits. In Section 3, the new adaptive reclosing scheme based on this analysis is discussed. Specially, the configuration of the distribution system for the new reclosing scheme and flow chart is discussed. Section 4 discusses the modeling and simulation results to verify the proposed adaptive reclosing scheme. Finally, conclusions derived from our study are presented in Section 5.
2. Electrostatic Induction between the Neutral Line and the Distribution Line
In this section, the electrostatic induction between the neutral line and the distribution line is discussed. Figure 2 shows the equivalent circuit after interruption of the fault current. Figure 2 assumes that faulty phase is Phase A, and the healthy phases are Phases B and C.
Even after the faulty section has been disconnected from the distribution line, the neutral current due to the unbalanced state is still flowing, because the normal current is supplied outside the faulty section. Due to the current flowing in the neutral line, the electrostatic induction phenomenon occurs between the neutral line and the distribution line.
In Figure 2, the current flowing in the neutral line is divided into three phase currents due to the electrostatic induction phenomenon:
The current flowing in the faulty Phase A due to electrostatic induction is as follows:
On the other hand, the currents flowing to the healthy Phases B and C are as follows:
The magnitude of mutual capacitance is very small, and hence the differences between reactance in (2) and (3) are also small. Determining the relative magnitudes of the currents flowing in each phase in (2) and (3), therefore, identifies the characteristic impedance of the line and the fault resistance. The fault resistance is usually smaller than the characteristic impedance of the line. Thus, during a fault, in (2) is larger than or in (3) because in (2) is smaller than in (3). If a fault is cleared, in (2) and or in (3) will have the same value.
In other words, in (2) has a large value during the fault; however, it will change to a small value in (3) after fault has been cleared. This characteristic will be utilized to detect fault clearance.
3. Adaptive Reclosing Scheme in the Unbalanced Distribution System
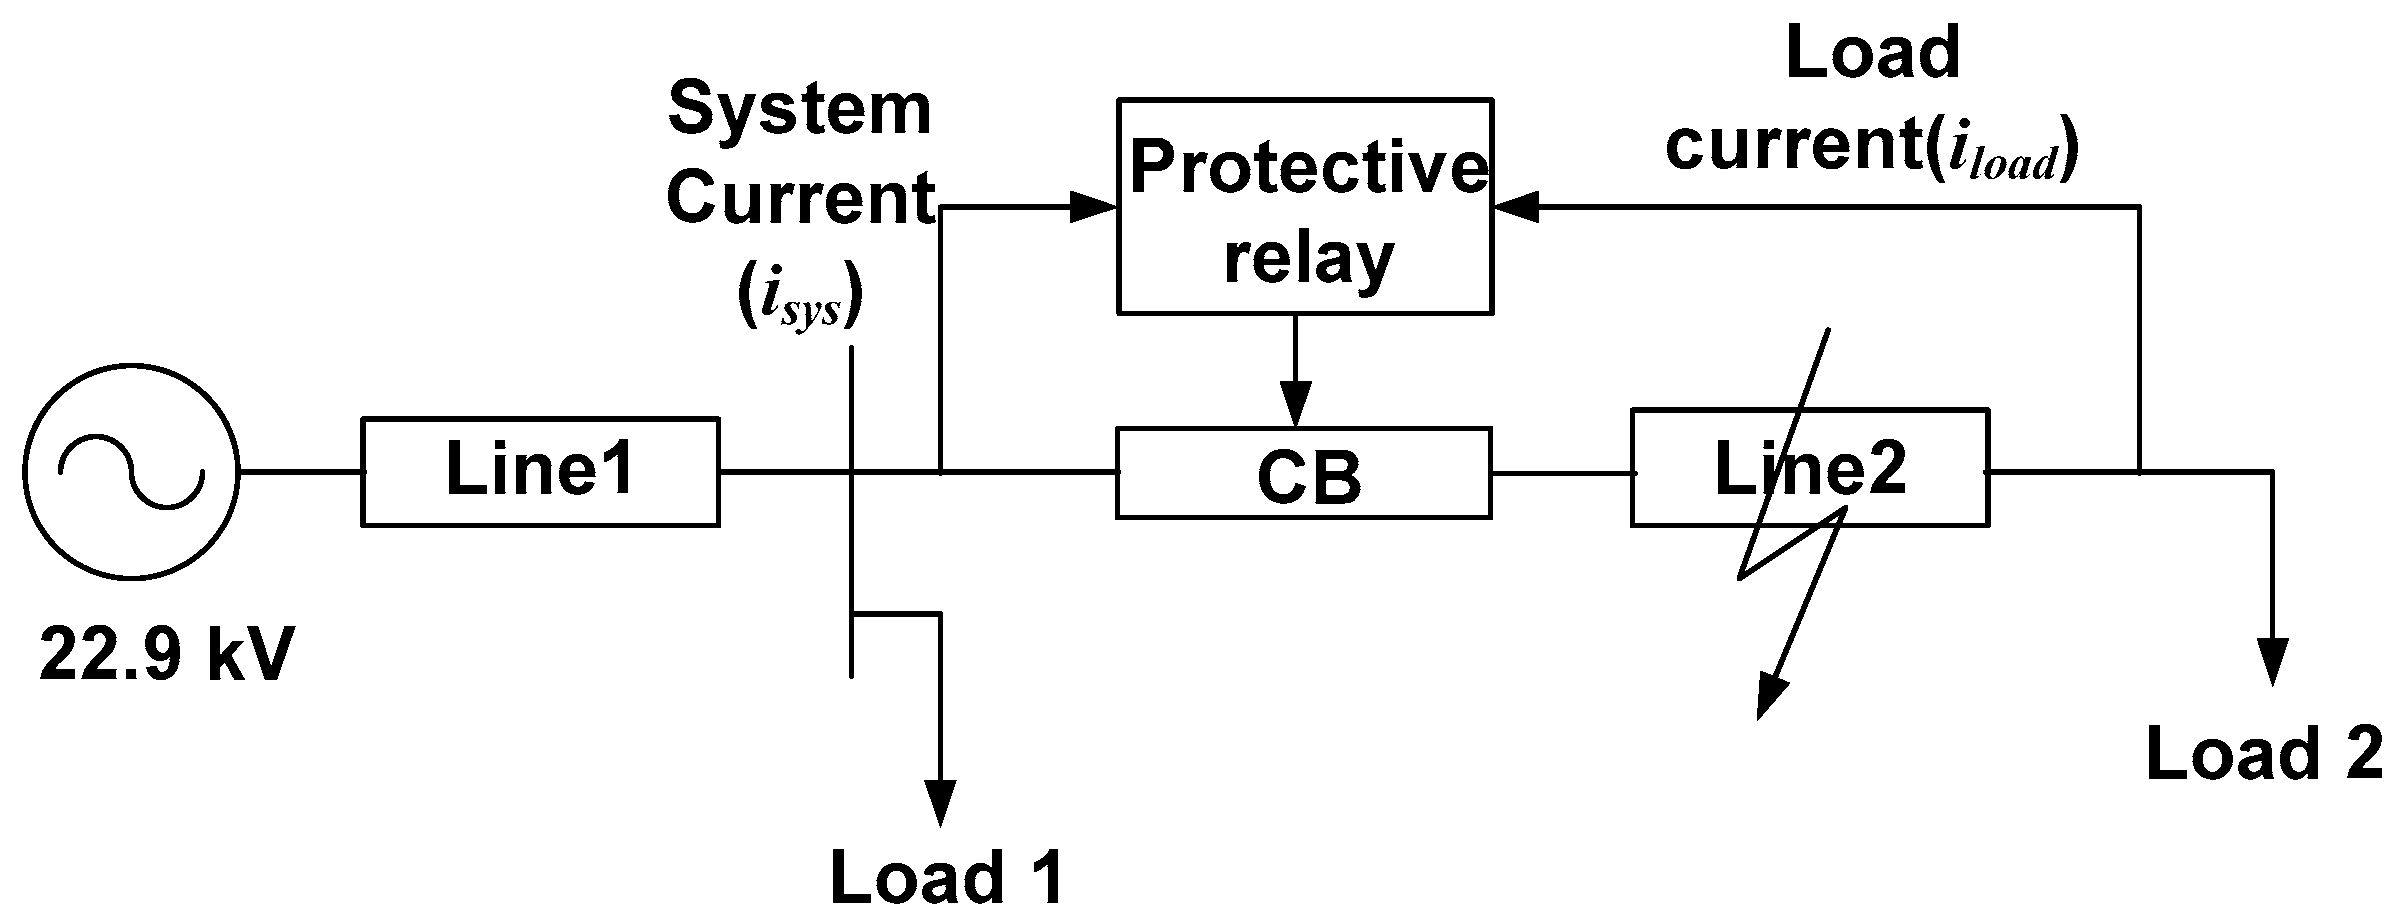
In this paper, we propose a new adaptive reclosing scheme. For this scheme, the system current (isys) and the load current (iload) are input to the protective relay, as shown in Figure 3. A communication method is also needed. In the case of the conventional recloser, if a fault occurs, the recloser automatically performs a reclosing operation after a certain dead time after the distribution line is interrupted. Because the recloser cannot perform adaptive reclosing, it is replaced by a protective relay and a circuit breaker (CB). The protection relay receives the system current and the load current and performs a specific process. Additionally, if it is determined that the fault is removed, it immediately sends a reclosing signal to the breaker.
The flowchart of the proposed adaptive reclosing scheme is presented in Figure 4. First, it calculates the root-mean-square (RMS) value after receiving the system current and load current as input. If the system current is greater than a certain value (α), the circuit breaker is opened to interrupt the distribution line due to fault occurrence.
As shown in Figure 2, the current flowing in the distribution line by the electrostatic induction phenomenon will flow to the load side. Therefore, in this paper, the load current is inputted to the protective relay and the RMS value of this current is calculated. Additionally, the absolute value of the differential of the RMS is calculated:
The time width, , between two samples has been selected by the sampling frequency to implement the proposed algorithm. In this paper, the sampling frequency is 120 samples/cycle. Therefore, is 0.0001389 s at 60 Hz. The sampling frequency can be selected by the developer of the protection algorithm. We have implemented the protection algorithm using EMTP software and a sampling frequency of 120 samples/cycle was selected. The measurement accuracy can be improved by this high sampling frequency. Figure 5 shows the variation of and from during-fault to post-fault. During fault, does not change, and hence, also does not change and maintains at zero. However, if the fault is cleared, the at the faulty phase increases because at the faulty phase must change to the small value. If increases above a certain value (β), the duration threshold is also increased. If the duration threshold is increased above a certain value (ε), it can be judged that the fault has finally been cleared. If the fault has been cleared, the reclosing is immediately performed without waiting for the fixed dead time of the conventional reclosing method.
When the fault has been cleared, increases from zero above a certain value (β). Because is calculated based on the movement of the data window, it takes a certain amount of time to increase this value above a certain value (β) and to reach the final value, as shown in Figure 5. Therefore, the proposed algorithm does not judge the fault clearance immediately after increases above a certain value (β). For example, the proposed algorithm does not judge the fault clearance by the increase of above a certain value (β) during a single sample owing to external effects such as measurement errors and noises. In other words, the proposed algorithm judges the fault clearance by the continuous increase of above a certain value (β) during a certain number of samples. As shown in Figure 5, the duration threshold is the item to judge this. A certain value (ε) in Figure 4 means a certain number of samples.
The proposed algorithm continuously receives the current values according to the sampling frequency. In addition, and are calculated using the received values. These values are calculated using the samples for a single cycle. The samples for one cycle form one data window. The data window moves to receive the next current sample. At this time, the current sample (j) is changed to the previous sample (j − 1) after the movement, and a data window is formed again using the newly received sample (j). This is the concept of “Moving data window” in Figure 4 and it is presented in detail in Figure 6. This paper proposes a reclosing algorithm based on the moving data window.
4. Simulations and Discussions
4.1. System Model and Implementation of the Proposed Method
The proposed adaptive reclosing scheme has been verified using the distribution system model in Figure 3. The capacities of Loads 1 and 2 are 1000 kW and 2000 kW. The length and line type of Lines 1 and 2 are 10 km and 95-mm2 aluminum conductor steel-reinforced cable.
The distribution systems were modelled by using EMTP/ATPDraw software (developed by Hans Kr. Høidalen, Norway). The proposed reclosing scheme was implemented using EMTP/MODELS [24,25]. The sampling frequency was 120 samples/cycle. The input and output between sub-models of EMTP/MODELS were assumed to be the communication method for load current input. The time delay in the communication was not considered. Figure 7 shows the implementation of the proposed method using EMTP/ATPDraw. The system and load currents were inputted to the protective relay MODELS. In protective relay MODELS, the proposed method is implemented using the language of EMTP/MODELS, which is similar to the FORTRAN language. After calculating the proposed method, the output signal was transmitted to the CB.
4.2. Simulation Conditions
In this paper, we report the simulations of the various fault conditions according to the unbalanced ratio. The unbalanced ratio is calculated by (5):
In the unbalanced state, the current magnitudes of the three phases are not the same. The maximum current indicates the largest phase current value among the three phases, and the minimum current indicates the smallest phase current value among the three phases. Currently, the distribution system of the Korea Electric Power Corporation (Naju, Korea) limits the unbalance ratio to less than 20% [15]. Therefore, the unbalanced ratios of 5% and 10% are selected. The single line-to-ground faults and three phase-to-ground faults were simulated. In addition, the various fault resistances, fault duration times and fault locations were simulated as shown in the Table 1. In Table 1, the percentage of the fault location indicates the distance from the bus to the fault point over the total line length of line 2. For all simulated cases, the fault occurrence time was 0.1 s. Therefore, the fault clearance is 0.433 s for 20 cycles and 0.766 s for 40 cycles. The total number of simulated cases was 108.
4.3. Simulation Results and Discussions
Table 2 shows the simulation results of all simulated cases. Regardless of the unbalanced ratio and fault conditions, the judgment of fault clearance was successfully performed in all cases and thus the reclosing was also successfully performed. The reclosing time was about 1/2 cycle after the fault clearance, and it can be seen that the reclosing was successfully performed without waiting for the fixed dead time of conventional reclosing. From Table 2, even at a low unbalanced ratio of 5%, we can conclude that the reclosing was adaptively performed after the judgment of fault clearance by the reclosing scheme proposed in this paper. Comparing the different fault types, we found that the reclosing was successfully performed regardless of the symmetrical or unsymmetrical fault because some current always flows in the neutral line due to the unbalanced state. For the fault resistance, it can be seen that the reclosing was successfully performed both for the high fault resistance case, with 100 Ω, and the low fault resistance case, with 0.1 Ω. With regards to the fault locations, we found that the reclosing was successfully performed according to the proposed adaptive reclosing scheme at faults near the source as well as faults near the load. In addition, if the fault duration time was the same, regardless of the unbalanced ratio, the fault type, the fault resistance and the fault location, it was confirmed that the reclosing was performed at the same time. In the case of a permanent fault, the reclosing was not performed.
As the unbalanced ratio becomes higher, the neutral current also becomes higher. As the neutral current increases, the value of , which is the current flowing to the load owing to the electrostatic induction, also increases. As the value of increases, , which is generated when is changed to a small value, also increases. Because the proposed algorithm is implemented based on the moving data window, it takes time to change to a high value. Because the length of the data window is constant, as the value of increases, the time taken to pass a certain value (β) decreases. Therefore, the reclosing time is slightly shorter for higher values of the unbalanced ratio.
A higher value of the fault location means that the fault location is farther from the bus and closer to the load. As the fault location becomes closer to the load, the length of the distribution line between the fault location and the load becomes shorter, and hence, the capacitor between the line and the neutral line becomes smaller. In Equation (2), decreases as the decreases. Because is the current flowing to the load, also decreases. As decreases, also decreases. Because the length of the data window is constant, as the value of decreases, the time taken to pass above a certain value (β) increases. Therefore, the reclosing time is slightly longer for higher values of the fault location.
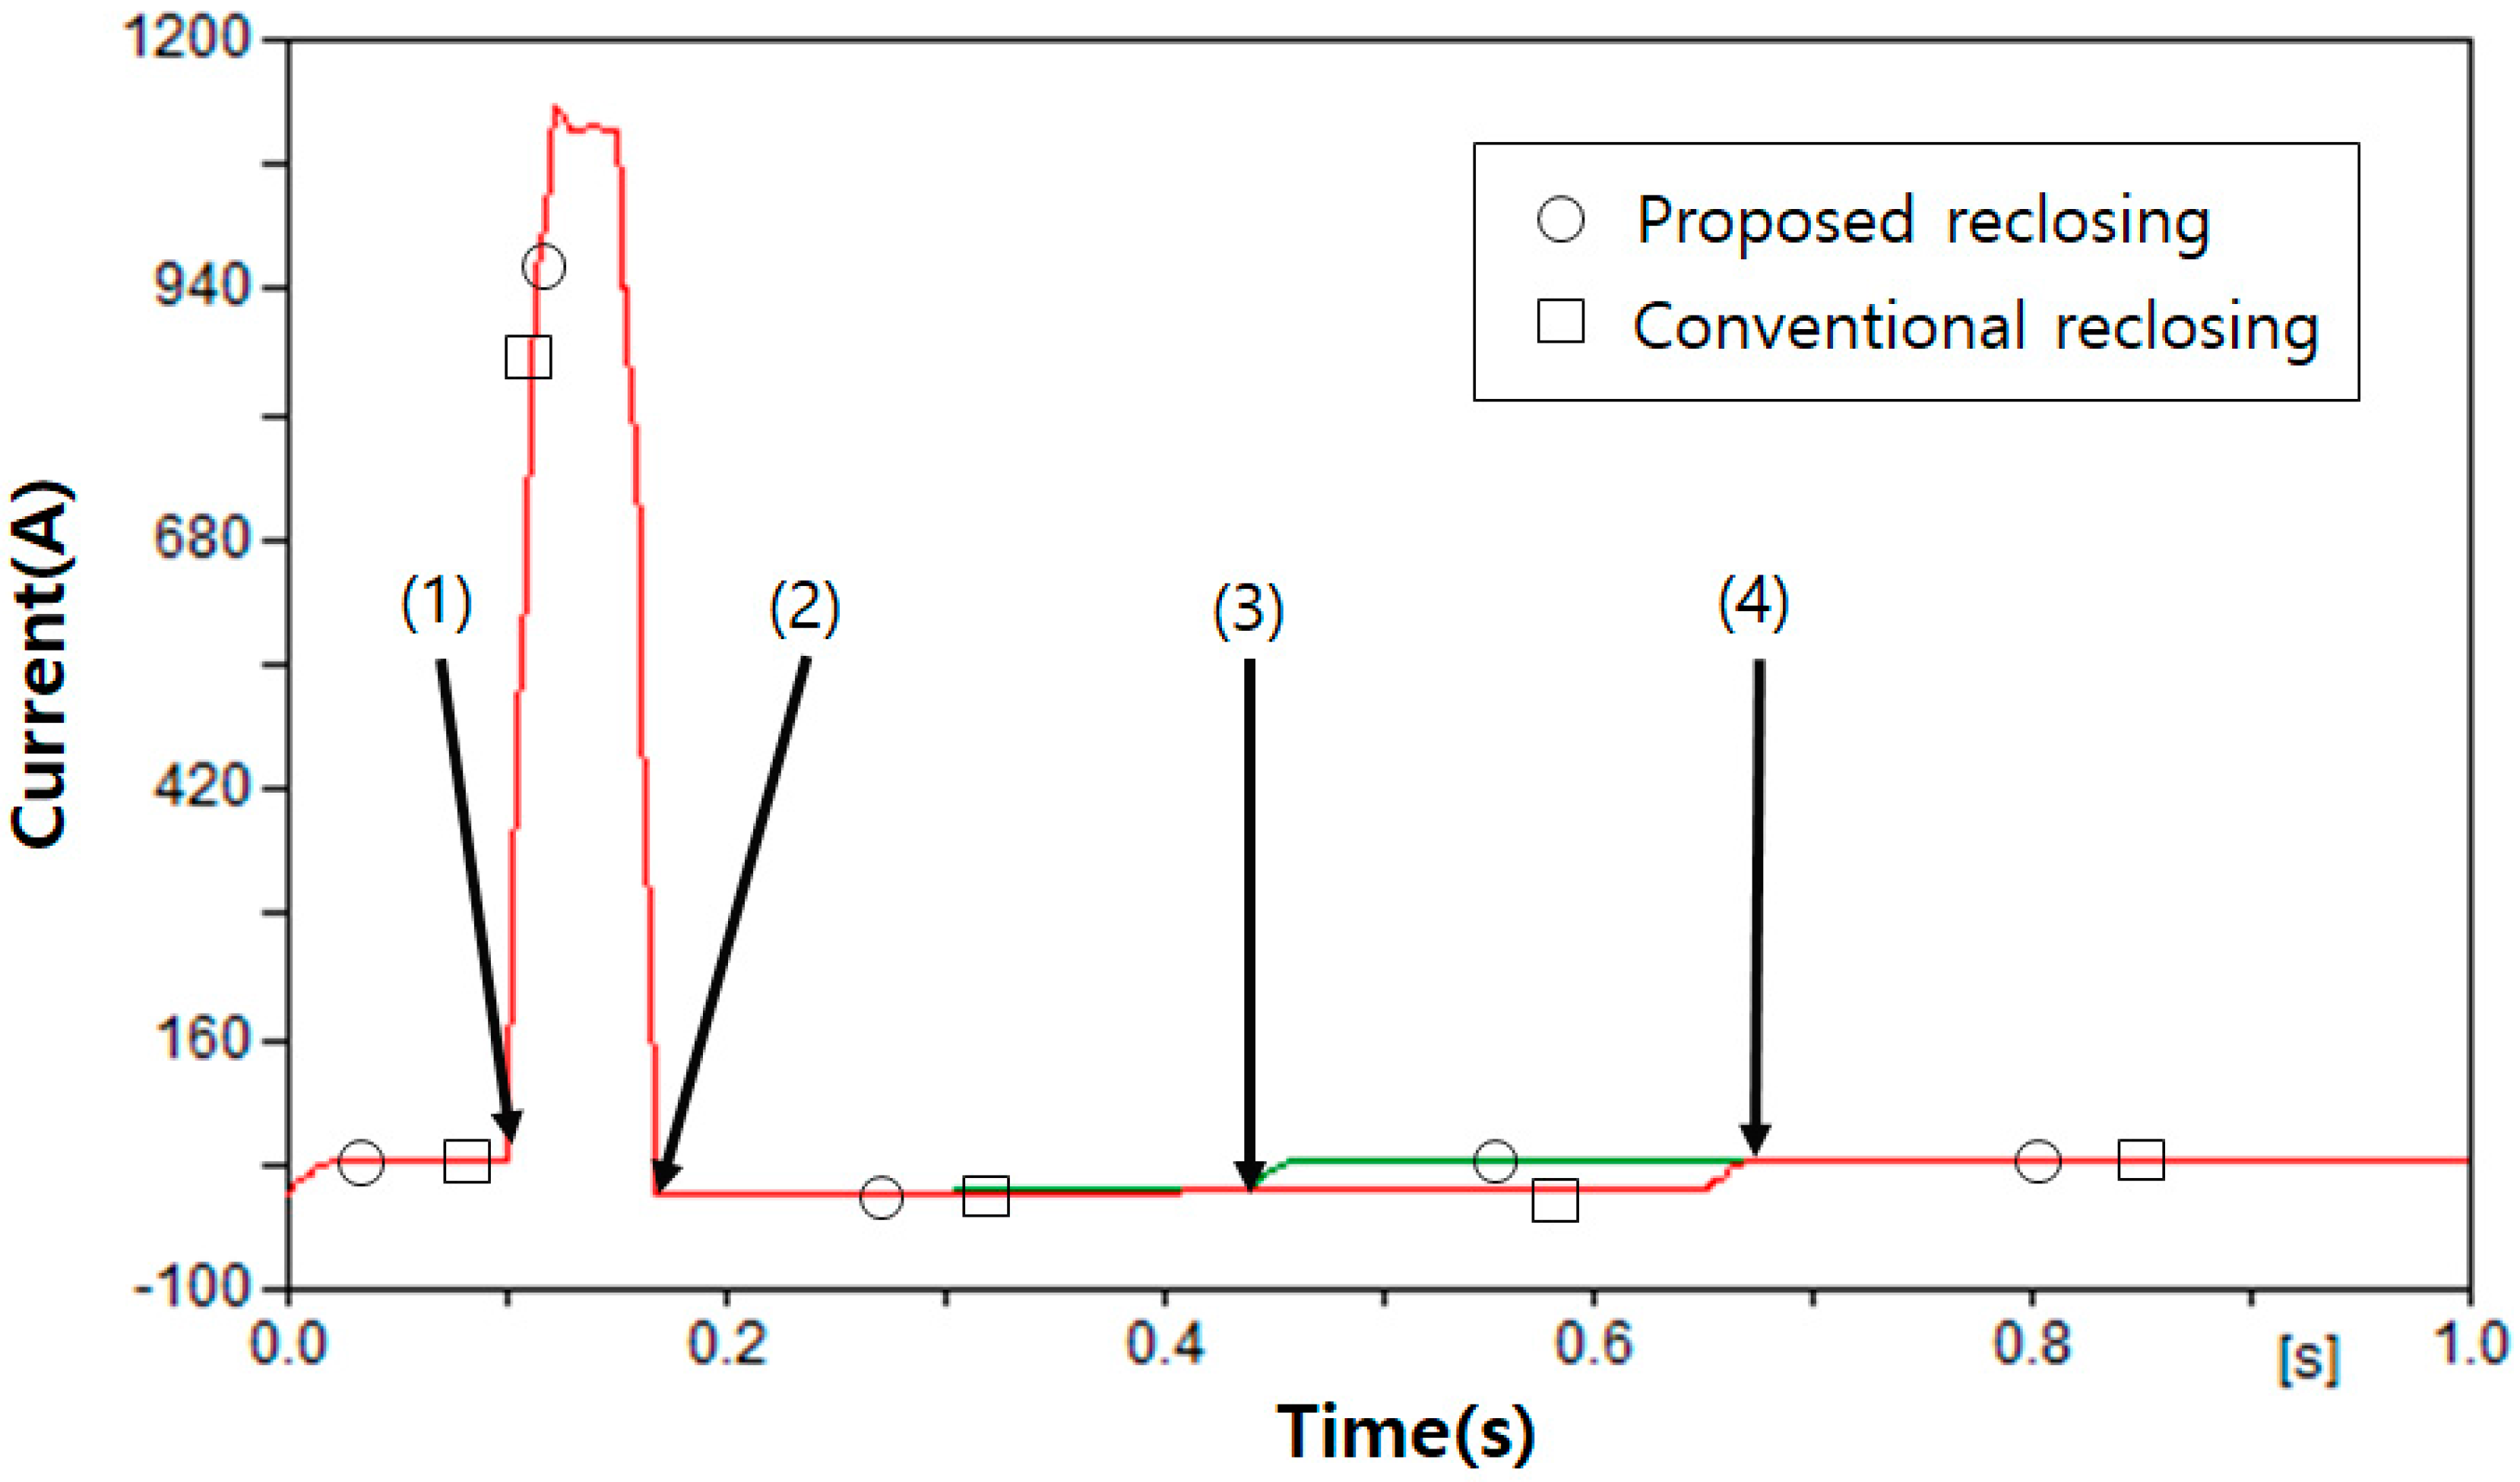
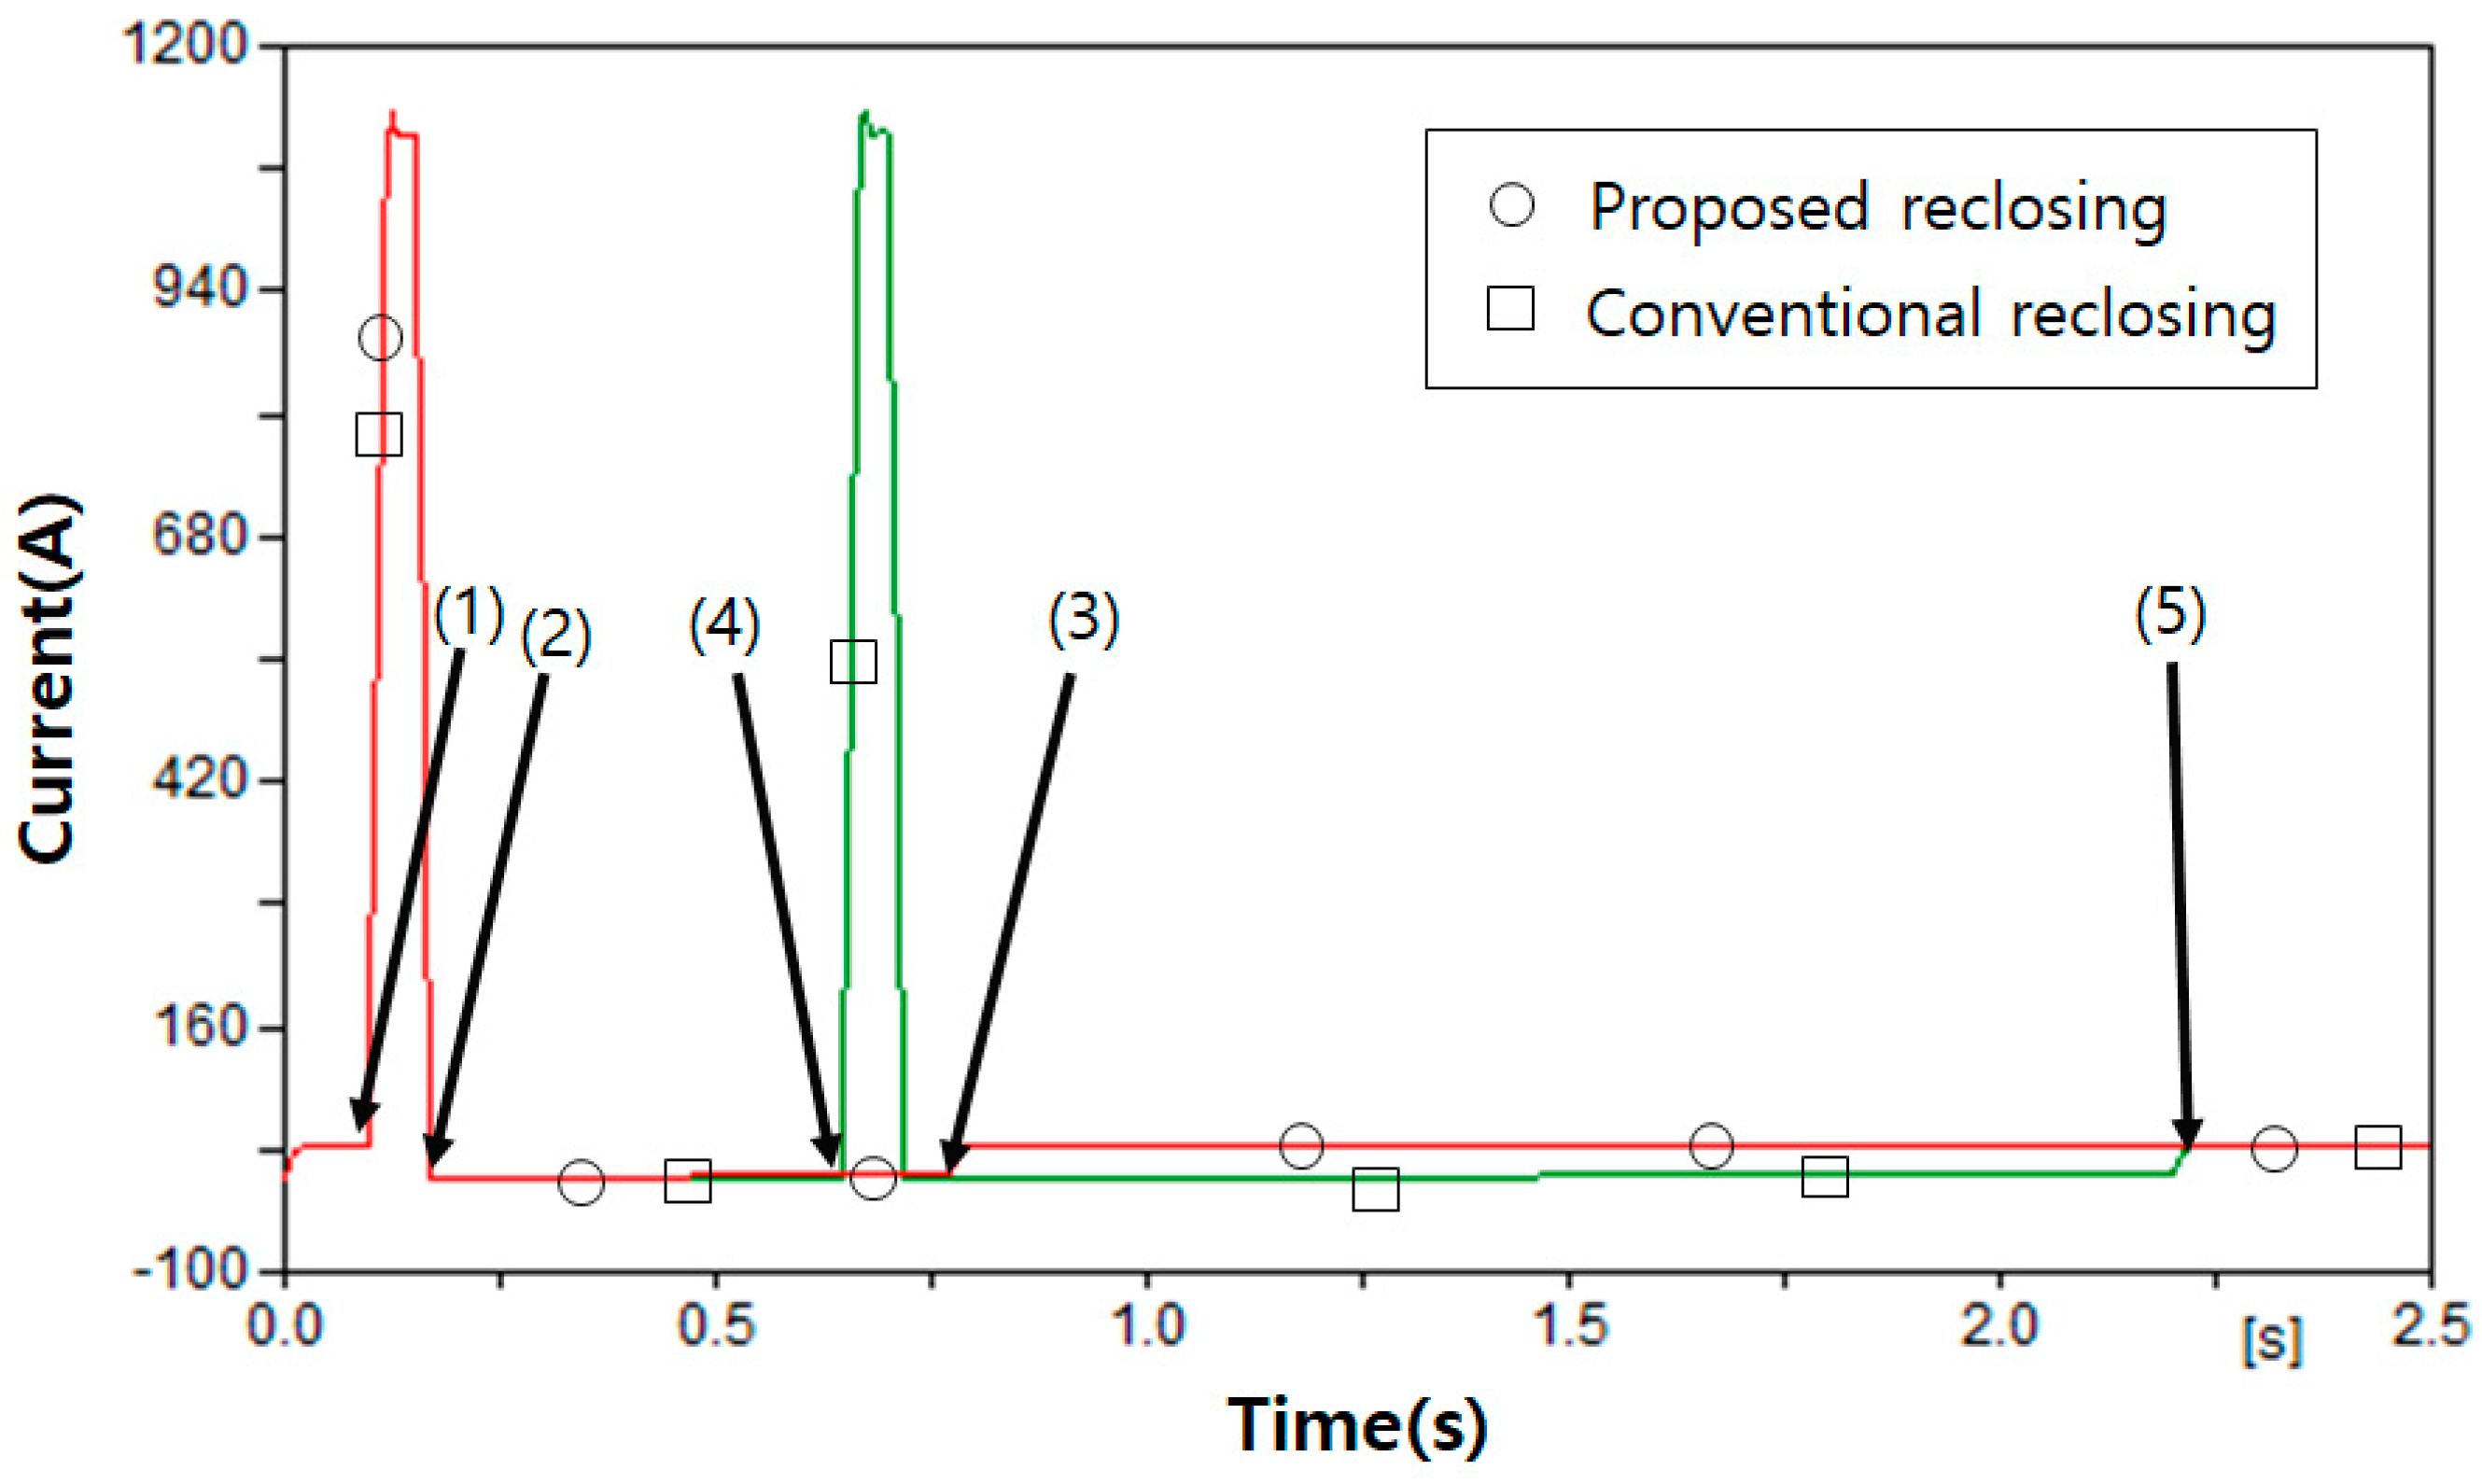
To verify the superiority of the proposed reclosing scheme, the simulation results in the proposed reclosing and that in the conventional reclosing method were compared. The fault conditions for comparison were an unbalanced ratio of 10 %, single line-to-ground fault, a fault resistance of 0.1 Ω and a fault location of 10 %. In the case of the conventional reclosing method, two reclosing attempts were made after fixed dead times of 0.5 and 15 s. In order to shorten the simulation time, the simulations are performed by reducing 15 s to 1.5 s. The meanings of the numbers in each figure are as follows:
- (1)
- Fault occurrence
- (2)
- Opening of the circuit breaker due to fault occurrence
- (3)
- Reclosing time at the proposed adaptive reclosing scheme
- (4)
- First reclosing attempt of the conventional reclosing method
- (5)
- Second reclosing attempt of the conventional reclosing method
Figure 8 and Figure 9 show and the RMS waveform of the system current when the fault duration time was 20 cycles. After the fault was removed in 0.433 s, increases above a certain value at 0.4385 s, and hence, the fault clearance was confirmed at 0.440 s. As shown in Figure 9, the reclosing in the proposed adaptive reclosing scheme was performed at 0.440 s after the determination of the fault clearance. However, in the case of the conventional reclosing method, the reclosing was performed at 0.65 s after the fixed dead time of 0.5 s. Therefore, outage time can be reduced by the proposed reclosing scheme.
Figure 10 shows when the fault duration time is 40 cycles. After the fault is cleared in 0.766 s, increases above a certain value at 0.7715 s. Using the proposed reclosing scheme, it is judged that the fault was cleared at 0.773 s, and the reclosing was immediately performed. The RMS waveform of the system current is presented in Figure 11. In the proposed reclosing method, the reclosing was successfully performed at 0.773 s, after which the normal current was supplied to the loads. In the conventional reclosing method, the first reclosing was attempted 0.65 s prior to fault clearance. Because the fault had not been removed, a large fault current flowed again and hence the CB opened again at 0.7 s. The second reclosing was successfully performed at 2.2 s after the fixed dead time of 1.5 s, and the steady current was supplied to the loads. The outage time was reduced about 1.45 s by the proposed reclosing scheme. If the fixed dead time of 15 s, set by the Korea Electric Power Corporation, is applied to the conventional reclosing method, the outage time can be further reduced by the proposed reclosing scheme.
Figure 12 shows during the cases of a permanent fault. This value did not change and remained at 0 because the fault was not cleared. Figure 13 shows the RMS waveform of the system current for a permanent fault. In the case of the proposed reclosing method, the reclosing was not attempted because the fault clearance judgment was not made. However, in the case of the conventional reclosing method, two numbers of reclosing were attempted and failed, and the CB was again opened. Due to the two reclosing attempts, a large fault current could flow to electrical installations such as lines and insulators, which could cause damage and shortening of the usuable life time.
5. Conclusions
Power distribution systems are usually operated in an unbalanced state due to load imbalance. Therefore, the neutral current always flows. In this paper, we propose an adaptive reclosing method based on the electrostatic induction phenomenon between the neutral line current and the distribution line. Based on the equivalent circuit of electrostatic induction, the differences between the faulty phase and the healthy phase are analyzed. Based on these results, we propose an adaptive reclosing method that determines the fault clearance using the increase of the absolute value of the differential of the load current and performs the reclosing.
In order to verify the proposed reclosing method, various simulations were performed according to the unbalanced ratio, fault type, fault resistance, fault duration time and fault location. We can conclude that reclosing can be successfully performed in all cases. In addition, the differences between the conventional reclosing method and the proposed method are compared. The results show that the outage time can be reduced by the proposed reclosing method.
Although the distribution system used in this paper is small, it is based on the configuration, line and load data of the distribution systems used by Korea Electric Power Corporation Therefore, it is a practical distribution system. In a large-scale and practical distribution systems, because the load capacity and the unbalanced ratio have larger values than in a small-scale and practical distribution system, more neutral current will flow. Therefore, the current flowing to the load due to the electrostatic induction phenomenon becomes larger, the absolute value of the differential of the load current also becomes larger. For this reason, the proposed method can be applied in a large-scale distribution system more easily.
Two challenges to realize the proposed method should be considered. The first challenge is a cost problem. The recloser in the conventional distribution system should be replaced by CB and a protective relay, as discussed in Section 3. This will require a high cost. The second challenge is the introduction of distributed generators. Nowadays, to establish a smart grid, the number of distribution systems with distributed generators is increasing. The method proposed in this paper cannot be applied to a distribution system with the distributed generators. If the distributed generators are connected to the load side, an islanding of distributed generators will occur after the breaker has been opened due to a fault. In this case, the distributed generators can directly inject the fault current into the fault point. If the distributed generators are separated from the distribution system following a fault, a reclosing method considering the separating and reconnecting of the distributed generators could be developed. If the distributed generators have a fault-ride through function and hence they are connected to the distribution systems during fault, a reclosing method could be developed considering the system voltage, frequency, and synchronism problems.
As a future study, we will look at the reclosing method in the unbalanced distribution system, considering the cost and the distributed generators.
Acknowledgments
This work was supported by a 2017 Yonam Institute of Technology grant.
Conflicts of Interest
The author declares no conflict of interest.
Nomenclature
| Neutral current | |
| ,, | Current flowing from the neutral line to Phases A, B and C, respectively |
| Voltage at the neutral line | |
| ,, | Mutual capacitance between the neutral line and Phases A, B and C, respectively |
| Characteristic impedance of the distribution line | |
| Fault resistance | |
| RMS value of the load current | |
| Absolute value of the differential of the RMS | |
| Present sample | |
| RMS value of the load current at the present sample | |
| RMS value of the load current at the previous sample | |
| Time interval between two samples | |
| Threshold value to detect the fault occurrence | |
| Threshold value to judge the fault clearance | |
| Duration threshold to finally determine the fault clearance |
References
- Seo, H.C. New Configuration and Novel Reclosing Procedure of Distribution System for Utilization of BESS as UPS in Smart Grid. Sustainability 2017, 9, 507. [Google Scholar] [CrossRef]
- Seo, H.C. New adaptive reclosing technique using second-order difference of THD in distribution system with BESS used as uninterruptible power supply. Int. J. Electr. Power Energy Syst. 2017, 90, 315–322. [Google Scholar] [CrossRef]
- Cho, G.J.; Park, J.K.; Sohn, S.H.; Chung, S.J.; Gwon, G.H.; Oh, Y.S.; Kim, C.H. Development of a Leader-End Reclosing Algorithm Considering Turbine-Generator Shaft Torque. Energies 2017, 10, 622. [Google Scholar]
- Keyvani, B.; Zadeh, M.K.; Lesani, H. Stability enhancement of multi-machine systems using adaptive reclosing of transmission lines. Int. J. Electr. Power Energy Syst. 2014, 62, 391–397. [Google Scholar] [CrossRef]
- Sadi, M.A.H.; Ali, M.H. Combined operation of SVC and optimal reclosing of circuit breakers for power system transient stability enhancement. Electr. Power Syst. Res. 2014, 106, 241–248. [Google Scholar] [CrossRef]
- Heo, J.Y.; Oh, Y.S.; Seo, H.C.; Kim, C.H. An Adaptive Autoreclosure Scheme with Reference to Transient Stability for Transmission Lines. J. Electr. Eng. Technol. 2015, 10, 795–803. [Google Scholar] [CrossRef]
- Luo, X.; Huang, C.; Jiang, Y. Improved digital algorithm for adaptive reclosing for transmission lines with shunt reactors. IET Gener. Transm. Distrib. 2016, 10, 2066–2070. [Google Scholar] [CrossRef]
- Park, J.; Kim, C.H.; Cho, G.; Sohn, S.H.; Chung, S. A Novel Reclosing Algorithm considering Turbine-Generator Shaft Torque. IEEE Trans. Power Deliv. 2017, 32, 703–712. [Google Scholar] [CrossRef]
- Wang, X.; Yang, J.; Liu, P.; Liu, W.; Yan, J.; Tang, Y.; He, H. Online Calculation for the Optimal Reclosing Time of Transmission Lines. Electr. Power Compon. Syst. 2016, 44, 1904–1916. [Google Scholar] [CrossRef]
- Terzija, V.V.; Radojevic, Z.M. Numerical algorithm for adaptive autoreclosure and protection of medium-voltage overhead lines. IEEE Trans. Power Deliv. 2004, 19, 554–559. [Google Scholar] [CrossRef]
- Ahn, S.P.; Kim, C.H.; Aggarwal, R.K.; Johns, A.T. An Alternative Approach to Adaptive Single Pole Auto-Reclosing in High Voltage Transmission Systems Based on Variable Dead Time Control. IEEE Trans. Power Deliv. 2001, 16, 676–686. [Google Scholar] [CrossRef]
- Vogelsang, J.; Romeis, C.; Jaeger, J. Real-Time Adaption of Dead Time for Single-Phase Autoreclosing. IEEE Trans. Power Deliv. 2016, 31, 1882–1890. [Google Scholar] [CrossRef]
- Zhalefar, F.; Zadeh, M.R.D.; Sidhu, T.S. A High-Speed Adaptive Single-Phase Reclosing Technique Based On Local Voltage Phasors. IEEE Trans. Power Deliv. 2015, 32, 1203–1211. [Google Scholar] [CrossRef]
- Park, J.H.; Seo, H.C.; Kim, C.H.; Rhee, S.B. Development of Adaptive Reclosing Scheme Using Wavelet Transform of Neutral Line Current in Distribution System. Electr. Power Compon. Syst. 2016, 44, 426–433. [Google Scholar] [CrossRef]
- Park, K.W.; Seo, H.C.; Kim, C.H.; Jung, C.S.; Yoo, Y.P.; Lim, Y.H. Analysis of the Neutral Current for Two-Step-Type Poles in Distribution Lines. IEEE Trans. Power Deliv. 2009, 24, 1483–1489. [Google Scholar] [CrossRef]
- Elsaiah, S.; Benidris, M.; Mitra, J. Analytical Approach for Placement and Sizing of Distributed Generators on Power Distribution System. IET Gener. Transm. Distrib. 2014, 8, 1039–1049. [Google Scholar] [CrossRef]
- Daratha, N.; Das, B.; Sharma, J. Coordination between OLTC and SVC for voltage regulation in unbalanced distribution system distributed generation. IEEE Trans. Power Syst. 2014, 29, 289–299. [Google Scholar] [CrossRef]
- Ghatak, U.; Mukherjee, V. A fast and efficient load flow technique for unbalanced distribution system. Int. J. Electr. Power Energy Syst. 2017, 84, 99–110. [Google Scholar]
- Gabr, M.A.; Ibrahim, D.K.; Ahmed, E.S.; Gilany, M.I. A new impedance-based fault location scheme for overhead unbalanced radial distribution networks. Electr. Power Syst. Res. 2017, 142, 153–162. [Google Scholar] [CrossRef]
- Flaih, F.M.; Lin, X.; Abd, M.K.; Dawoud, S.M.; Li, Z.; Adio, O.S. A New Method for Distribution Network Reconfiguration Analysis under Different Load Demands. Energies 2017, 10, 455. [Google Scholar] [CrossRef]
- Weckx, S.; Driesen, J. Load balancing with EV chargers and PV inverters in unbalanced distribution grids. IEEE Trans. Sustain. Energy 2015, 6, 635–643. [Google Scholar] [CrossRef]
- Abdelaziz, A.Y.; Hegazy, Y.G.; El-Khattam, W.; Othman, M.M. Optimal allocation of stochastically dependent renewable energy based distributed generators in unbalanced distribution networks. Electr. Power Syst. Res. 2015, 119, 34–44. [Google Scholar] [CrossRef]
- Borghetti, A.; Napolitano, F.; Nucci, C.A. Volt/var optimization of unbalanced distribution feeders via mixed integer linear programming. Int. J. Electr. Power Energy Syst. 2015, 72, 40–47. [Google Scholar] [CrossRef]
- Dommel, H.W. EMTP Theory Book; Bonneville Power Administration: Portland, OR, USA, 1986.
- Martin-Arnedo, J.; González-Molina, F.; Martinez-Velasco, J.A.; Adabi, M.E. EMTP Model of a Bidirectional Cascaded Multilevel Solid State Transformer for Distribution System Studies. Energies 2017, 10, 521. [Google Scholar] [CrossRef]
Figure 1.
Conventional reclosing procedure [1].
Figure 1.
Conventional reclosing procedure [1].

Figure 2.
Equivalent circuit after interruption of fault current.

Figure 3.
Configuration of the distribution system for the proposed adaptive reclosing scheme.

Figure 4.
Flowchart of the proposed adaptive reclosing scheme.

Figure 5.
Variation of and from during-fault to post-fault.

Figure 6.
Concept of moving data window.

Figure 7.
Implementation of the proposed method using EMTP/ATPDraw.

Figure 8.
when the fault duration time was 20 cycles.

Figure 9.
System current when the fault duration time was 20 cycles.

Figure 10.
when the fault duration time was 40 cycles.

Figure 11.
System current when the fault duration time was 40 cycles.

Figure 12.
under a permanent fault condition.

Figure 13.
System current under a permanent fault condition.


Table 1.
Simulation conditions.
| Unbalanced Ratio | Fault Type | Fault Resistance | Fault Duration Time | Fault Location |
|---|---|---|---|---|
| 5% | Single line-to-ground fault | 0.1 Ω | 20 cycles | 10% |
| 10% | Three phase-to-ground fault | 10 Ω | 40 cycles | 50% |
| 100 Ω | permanent | 90% |
Table 2.
Simulation results.
| Unbalanced Ratio (%) | Fault Type | Fault Resistance (Ω) | Fault Duration Time (Cycles) | Fault Location (%) | Reclosing Time (s) |
|---|---|---|---|---|---|
| 5 | Single line-to-ground fault | 0.1 | 20 | 10 | 0.441 |
| 50 | 0.441 | ||||
| 90 | 0.443 | ||||
| 40 | 10 | 0.775 | |||
| 50 | 0.775 | ||||
| 90 | 0.776 | ||||
| permanent | 10 | - | |||
| 50 | - | ||||
| 90 | - | ||||
| 10 | 20 | 10 | 0.441 | ||
| 50 | 0.441 | ||||
| 90 | 0.443 | ||||
| 40 | 10 | 0.775 | |||
| 50 | 0.775 | ||||
| 90 | 0.776 | ||||
| permanent | 10 | - | |||
| 50 | - | ||||
| 90 | - | ||||
| 100 | 20 | 10 | 0.441 | ||
| 50 | 0.441 | ||||
| 90 | 0.443 | ||||
| 40 | 10 | 0.775 | |||
| 50 | 0.775 | ||||
| 90 | 0.776 | ||||
| permanent | 10 | - | |||
| 50 | - | ||||
| 90 | - | ||||
| Three phase-to-ground fault | 0.1 | 20 | 10 | 0.441 | |
| 50 | 0.441 | ||||
| 90 | 0.443 | ||||
| 40 | 10 | 0.775 | |||
| 50 | 0.775 | ||||
| 90 | 0.776 | ||||
| permanent | 10 | - | |||
| 50 | - | ||||
| 90 | - | ||||
| 10 | 20 | 10 | 0.441 | ||
| 50 | 0.441 | ||||
| 90 | 0.443 | ||||
| 40 | 10 | 0.775 | |||
| 50 | 0.775 | ||||
| 90 | 0.776 | ||||
| permanent | 10 | - | |||
| 50 | - | ||||
| 90 | - | ||||
| 100 | 20 | 10 | 0.441 | ||
| 50 | 0.441 | ||||
| 90 | 0.443 | ||||
| 40 | 10 | 0.775 | |||
| 50 | 0.775 | ||||
| 90 | 0.776 | ||||
| permanent | 10 | - | |||
| 50 | - | ||||
| 90 | - | ||||
| 10 | Single line-to-ground fault | 0.1 | 20 | 10 | 0.440 |
| 50 | 0.440 | ||||
| 90 | 0.441 | ||||
| 40 | 10 | 0.774 | |||
| 50 | 0.774 | ||||
| 90 | 0.775 | ||||
| permanent | 10 | - | |||
| 50 | - | ||||
| 90 | - | ||||
| 10 | 20 | 10 | 0.440 | ||
| 50 | 0.440 | ||||
| 90 | 0.441 | ||||
| 40 | 10 | 0.774 | |||
| 50 | 0.774 | ||||
| 90 | 0.775 | ||||
| permanent | 10 | - | |||
| 50 | - | ||||
| 90 | - | ||||
| 100 | 20 | 10 | 0.440 | ||
| 50 | 0.440 | ||||
| 90 | 0.441 | ||||
| 40 | 10 | 0.773 | |||
| 50 | 0.773 | ||||
| 90 | 0.774 | ||||
| permanent | 10 | - | |||
| 50 | - | ||||
| 90 | - | ||||
| Three phase-to-ground fault | 0.1 | 20 | 10 | 0.440 | |
| 50 | 0.440 | ||||
| 90 | 0.441 | ||||
| 40 | 10 | 0.774 | |||
| 50 | 0.774 | ||||
| 90 | 0.775 | ||||
| permanent | 10 | - | |||
| 50 | - | ||||
| 90 | - | ||||
| 10 | 20 | 10 | 0.440 | ||
| 50 | 0.440 | ||||
| 90 | 0.441 | ||||
| 40 | 10 | 0.774 | |||
| 50 | 0.774 | ||||
| 90 | 0.775 | ||||
| permanent | 10 | - | |||
| 50 | - | ||||
| 90 | - | ||||
| 100 | 20 | 10 | 0.440 | ||
| 50 | 0.440 | ||||
| 90 | 0.441 | ||||
| 40 | 10 | 0.773 | |||
| 50 | 0.773 | ||||
| 90 | 0.774 | ||||
| permanent | 10 | - | |||
| 50 | - | ||||
| 90 | - |
© 2017 by the author. Licensee MDPI, Basel, Switzerland. This article is an open access article distributed under the terms and conditions of the Creative Commons Attribution (CC BY) license (http://creativecommons.org/licenses/by/4.0/).
Share and Cite
MDPI and ACS Style
Seo, H.-C. New Adaptive Reclosing Technique in Unbalanced Distribution System. Energies 2017, 10, 1004. https://doi.org/10.3390/en10071004
AMA Style
Seo H-C. New Adaptive Reclosing Technique in Unbalanced Distribution System. Energies. 2017; 10(7):1004. https://doi.org/10.3390/en10071004
Chicago/Turabian StyleSeo, Hun-Chul. 2017. "New Adaptive Reclosing Technique in Unbalanced Distribution System" Energies 10, no. 7: 1004. https://doi.org/10.3390/en10071004
Note that from the first issue of 2016, this journal uses article numbers instead of page numbers. See further details here.