
Transverse Thermoelectricity in Fibrous Composite Materials

Department of Mechanical Engineering, Temple University, Philadelphia, PA 19122, USA
*
Author to whom correspondence should be addressed.
Energies 2017, 10(7), 1006; https://doi.org/10.3390/en10071006
Submission received: 21 June 2017
/
Revised: 12 July 2017
/
Accepted: 12 July 2017
/
Published: 16 July 2017
(This article belongs to the Special Issue Thermoelectric Materials for Energy Conversion)
Abstract
:Transverse thermoelectric elements have the potential to decouple the electric current and the heat flow, which could lead to new designs of thermoelectric devices. While many theoretical and experimental studies of transverse thermoelectricity have focused on layered structures, this work examines composite materials with aligned fibrous inclusions. A simplified mathematical model was derived based on the Kirchhoff Circuit Laws (KCL), which were used to calculate the equivalent transport properties of the composite structures. These equivalent properties, including Seebeck coefficient, electrical conductivity, and thermal conductivity, compared well with finite element analysis (FEA) results. Peltier cooling performance was also examined using FEA, which exhibited good agreement to KCL model predictions. In addition, a survey was conducted on selected combinations of thermoelectric materials and metals to rank their transverse thermoelectricity with respect to the dimensionless figure of merit.
1. Introduction
Thermoelectric (TE) devices, which can achieve direct conversion between thermal and electric energies, are usually constructed from n-type and p-type semiconducting elements that are operated under the conventional longitudinal mode, where the electric current and the heat flux flow parallel to each other [1,2]. In contrast, TE devices may also be constructed from elements with transverse thermoelectricity, i.e., electric current can induce a heat flow in the perpendicular direction or vice versa [3,4]. Therefore, transverse TE can potentially decouple the electric current and heat flux, and thus enable new device designs such as thin-film coolers [5,6] and cascading transverse TE devices [7,8].
While most known thermoelectric materials have insignificant transverse Seebeck coefficients (the off-diagonal terms in the Seebeck coefficient matrix) [9,10,11,12], appreciable transverse TE effect could be achieved in composite structures with engineered microstructural anisotropy, such as lamella structures or a matrix material embedded with aligned fibers [1,3]. In the former case, a lamella structure can be constructed from alternating layers of two materials with different TE properties, e.g., a semiconductor and a metal, and may exhibit transverse Seebeck effect in the directions neither parallel nor perpendicular to the layer planes [4].
A framework describing the anisotropic transverse TE properties of the lamella configuration was initially developed by Babin et al. [3], and was further discussed by many other researchers [13,14,15]. This framework first utilized the Kirchhoff Circuit Laws (KCL) to calculate the equivalent properties in the directions parallel and perpendicular to the layer plane, and then employed a tensor transformation to obtain the properties in an arbitrary direction. The validity of this simplified mathematical model has been demonstrated by multiple studies using either finite element simulations [16,17] or experimental measurements [12,18,19,20,21,22,23,24,25,26,27]. In addition to the lamella configuration, composite materials with aligned one-dimensional (1-D) inclusions, as suggested by Goldsmid [1,4], are also good candidates for transverse TE. However, there are few studies on this topic in the open literature.
In the current study, we developed a simple KCL-based mathematical model to describe the transverse TE behavior of fibrous composite materials using an approach similar to that developed by Babin and others for lamella structures [13,14,15]. This simple KCL model was based on fibers with square cross-sections. The validity of this model was then confirmed by comparison to finite element analysis (FEA) results, which also indicated little difference between fibers with square and circular cross-sections. FEA was further conducted to show that appreciable cooling might be obtained at room temperature. Finally, we surveyed combinations of some thermoelectric materials and metals, and ranked their performance with respect to their figure of merit.
2. Mathematical Modeling
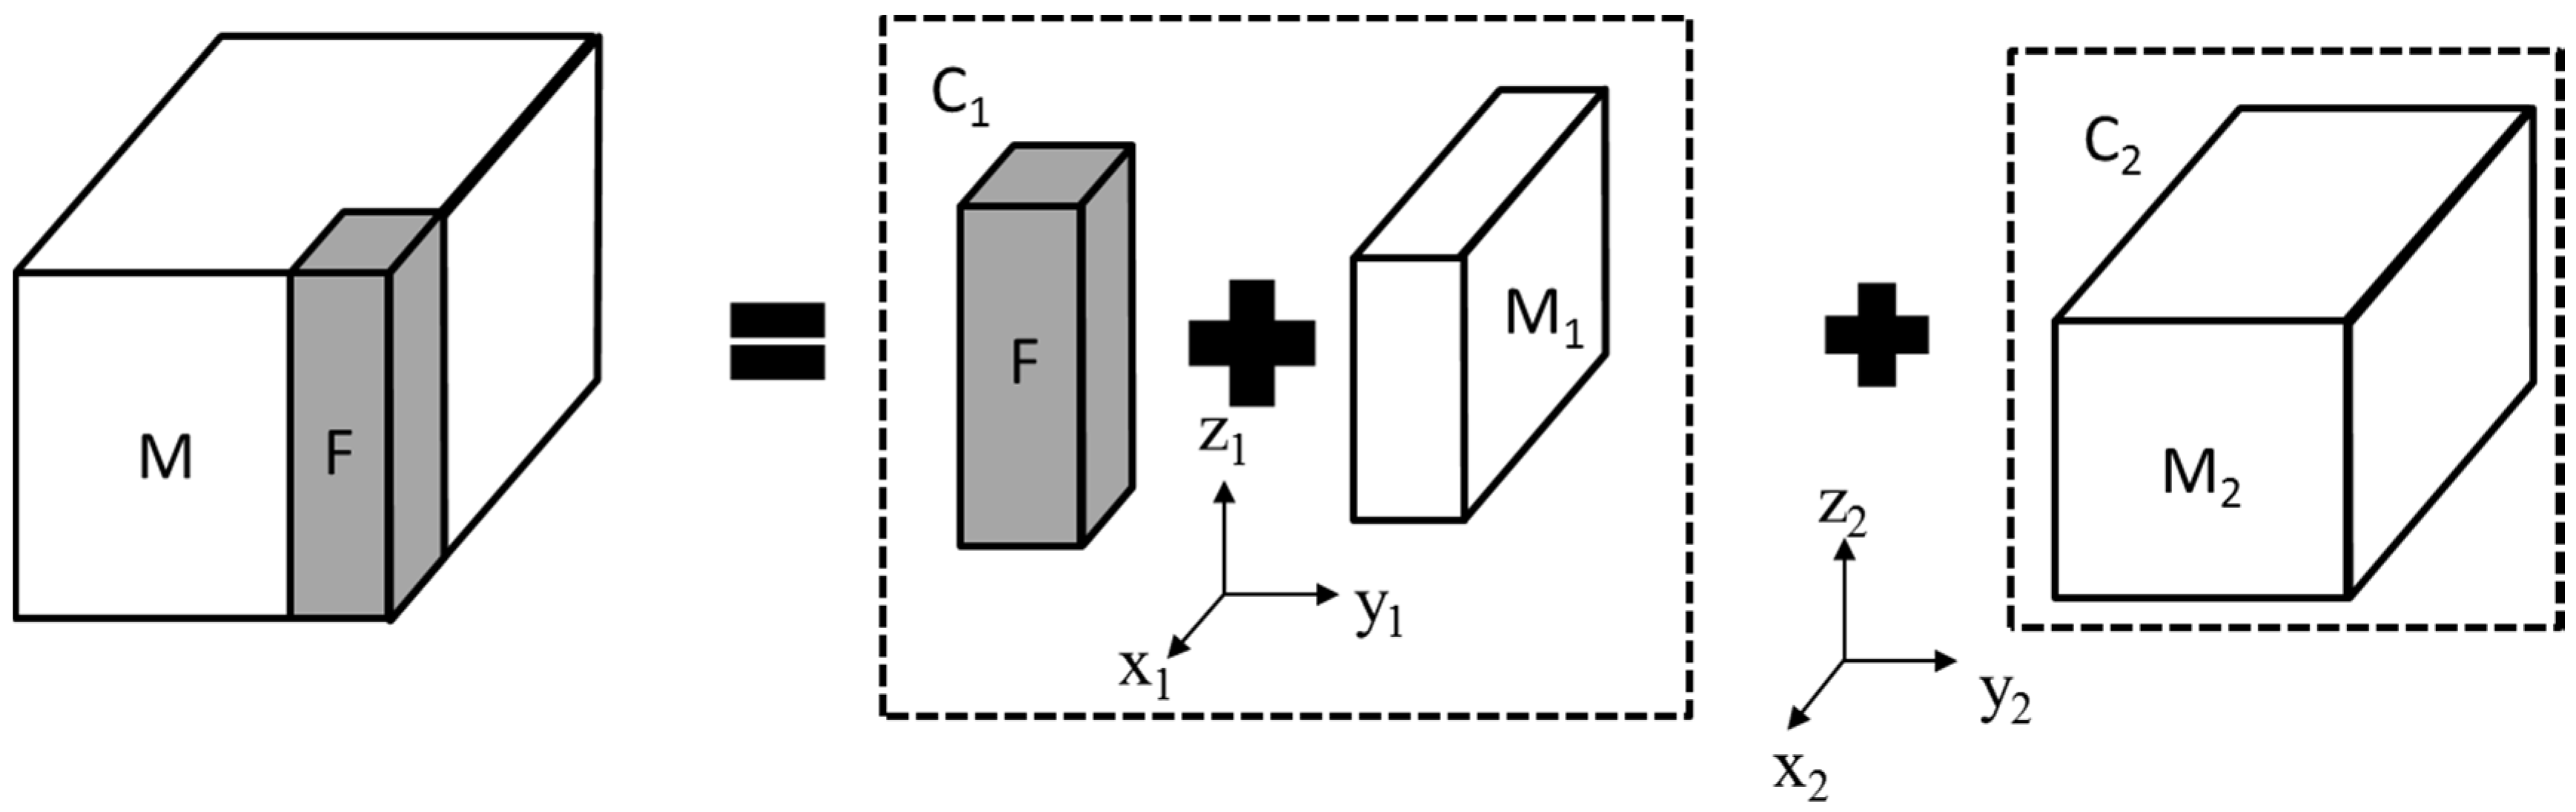
In order to examine the effective properties of a composite material with aligned fibers, a representative volume (unit cell) of the composite structure is studied (Figure 1). It is assumed that the composite structure is infinitely large and the fibers are continuous and uniformly distributed in the matrix. Therefore, the effects of external boundaries and fiber aspect ratio can be neglected. For the sake of simplicity, fibers are assumed to possess identical square cross-sections. The unit cell is further divided into two subunits: C1 consisting of the fiber phase (F) and part of the matrix (M1) and C2 consisting of the rest of the matrix (M2).
Using the principles of the Kirchhoff Circuit Laws (KCL) and following the steps described in our previous work [16], thermal conductivity, λ, electrical resistivity, ρ, and Seebeck coefficient, S, of subunit C1 in the three principle directions can be calculated as:
where x1, y1, z1 are coordinates of C1 as shown in Figure 1. Subscripts F and M denote the properties of the fiber phase and the matrix phase, respectively, and n is defined as:
where f is the volume fraction of the fiber phase in the unit cell. Similarly, the effective properties of the entire unit cell can be calculated from the effective properties of C1 and the properties of C2, such that:
where x2, y2, z2 are parallel to x1, y1, z1, respectively (Figure 1). It is important to note that in this step, subunit C1 is treated as a homogeneous body with its properties calculated from Equation (1) as previously described.
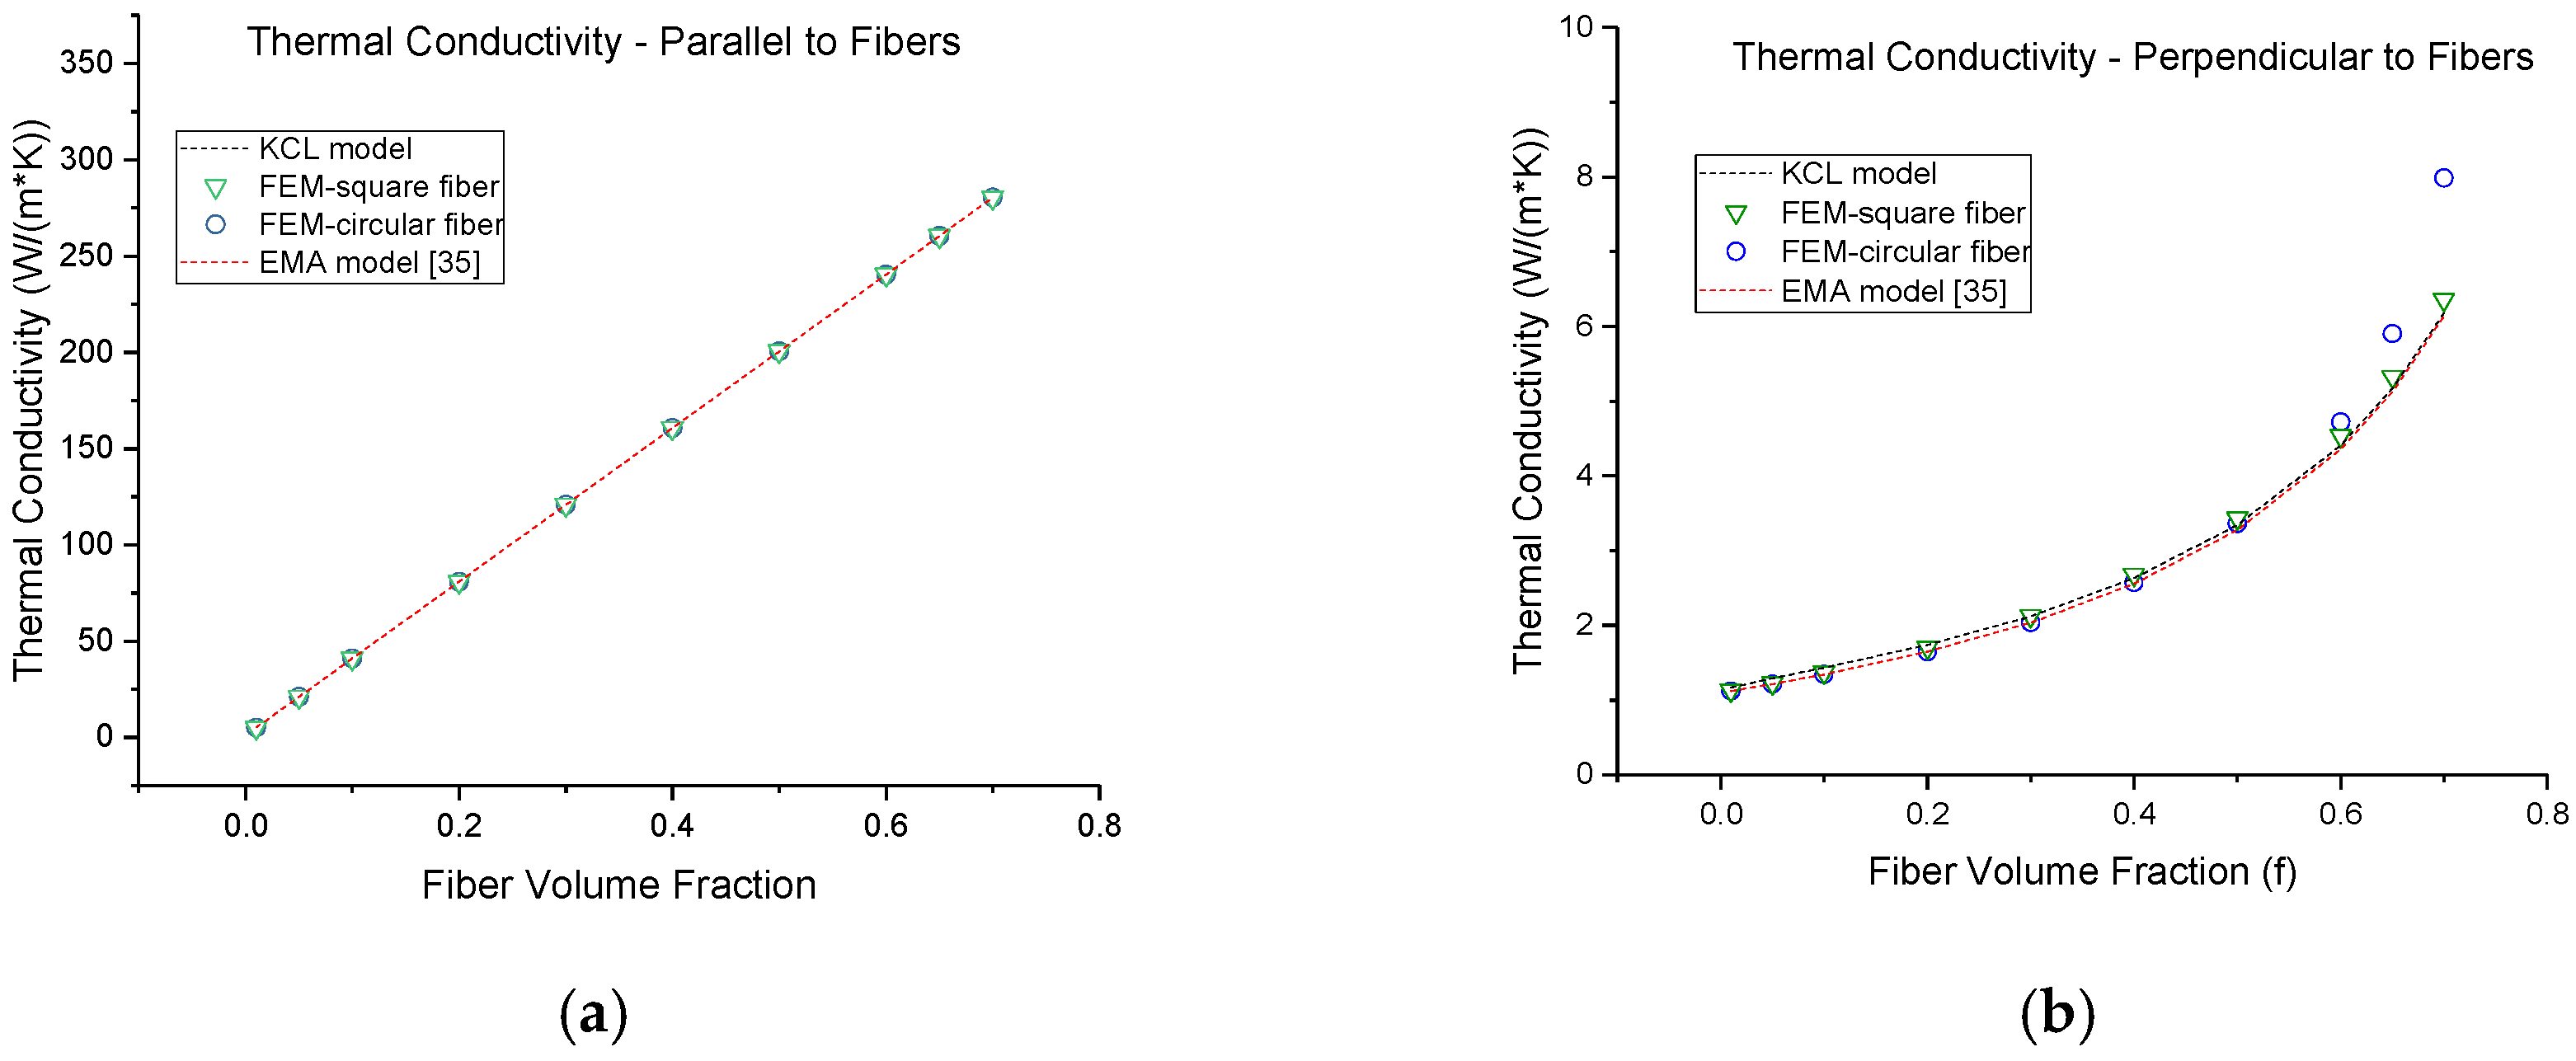
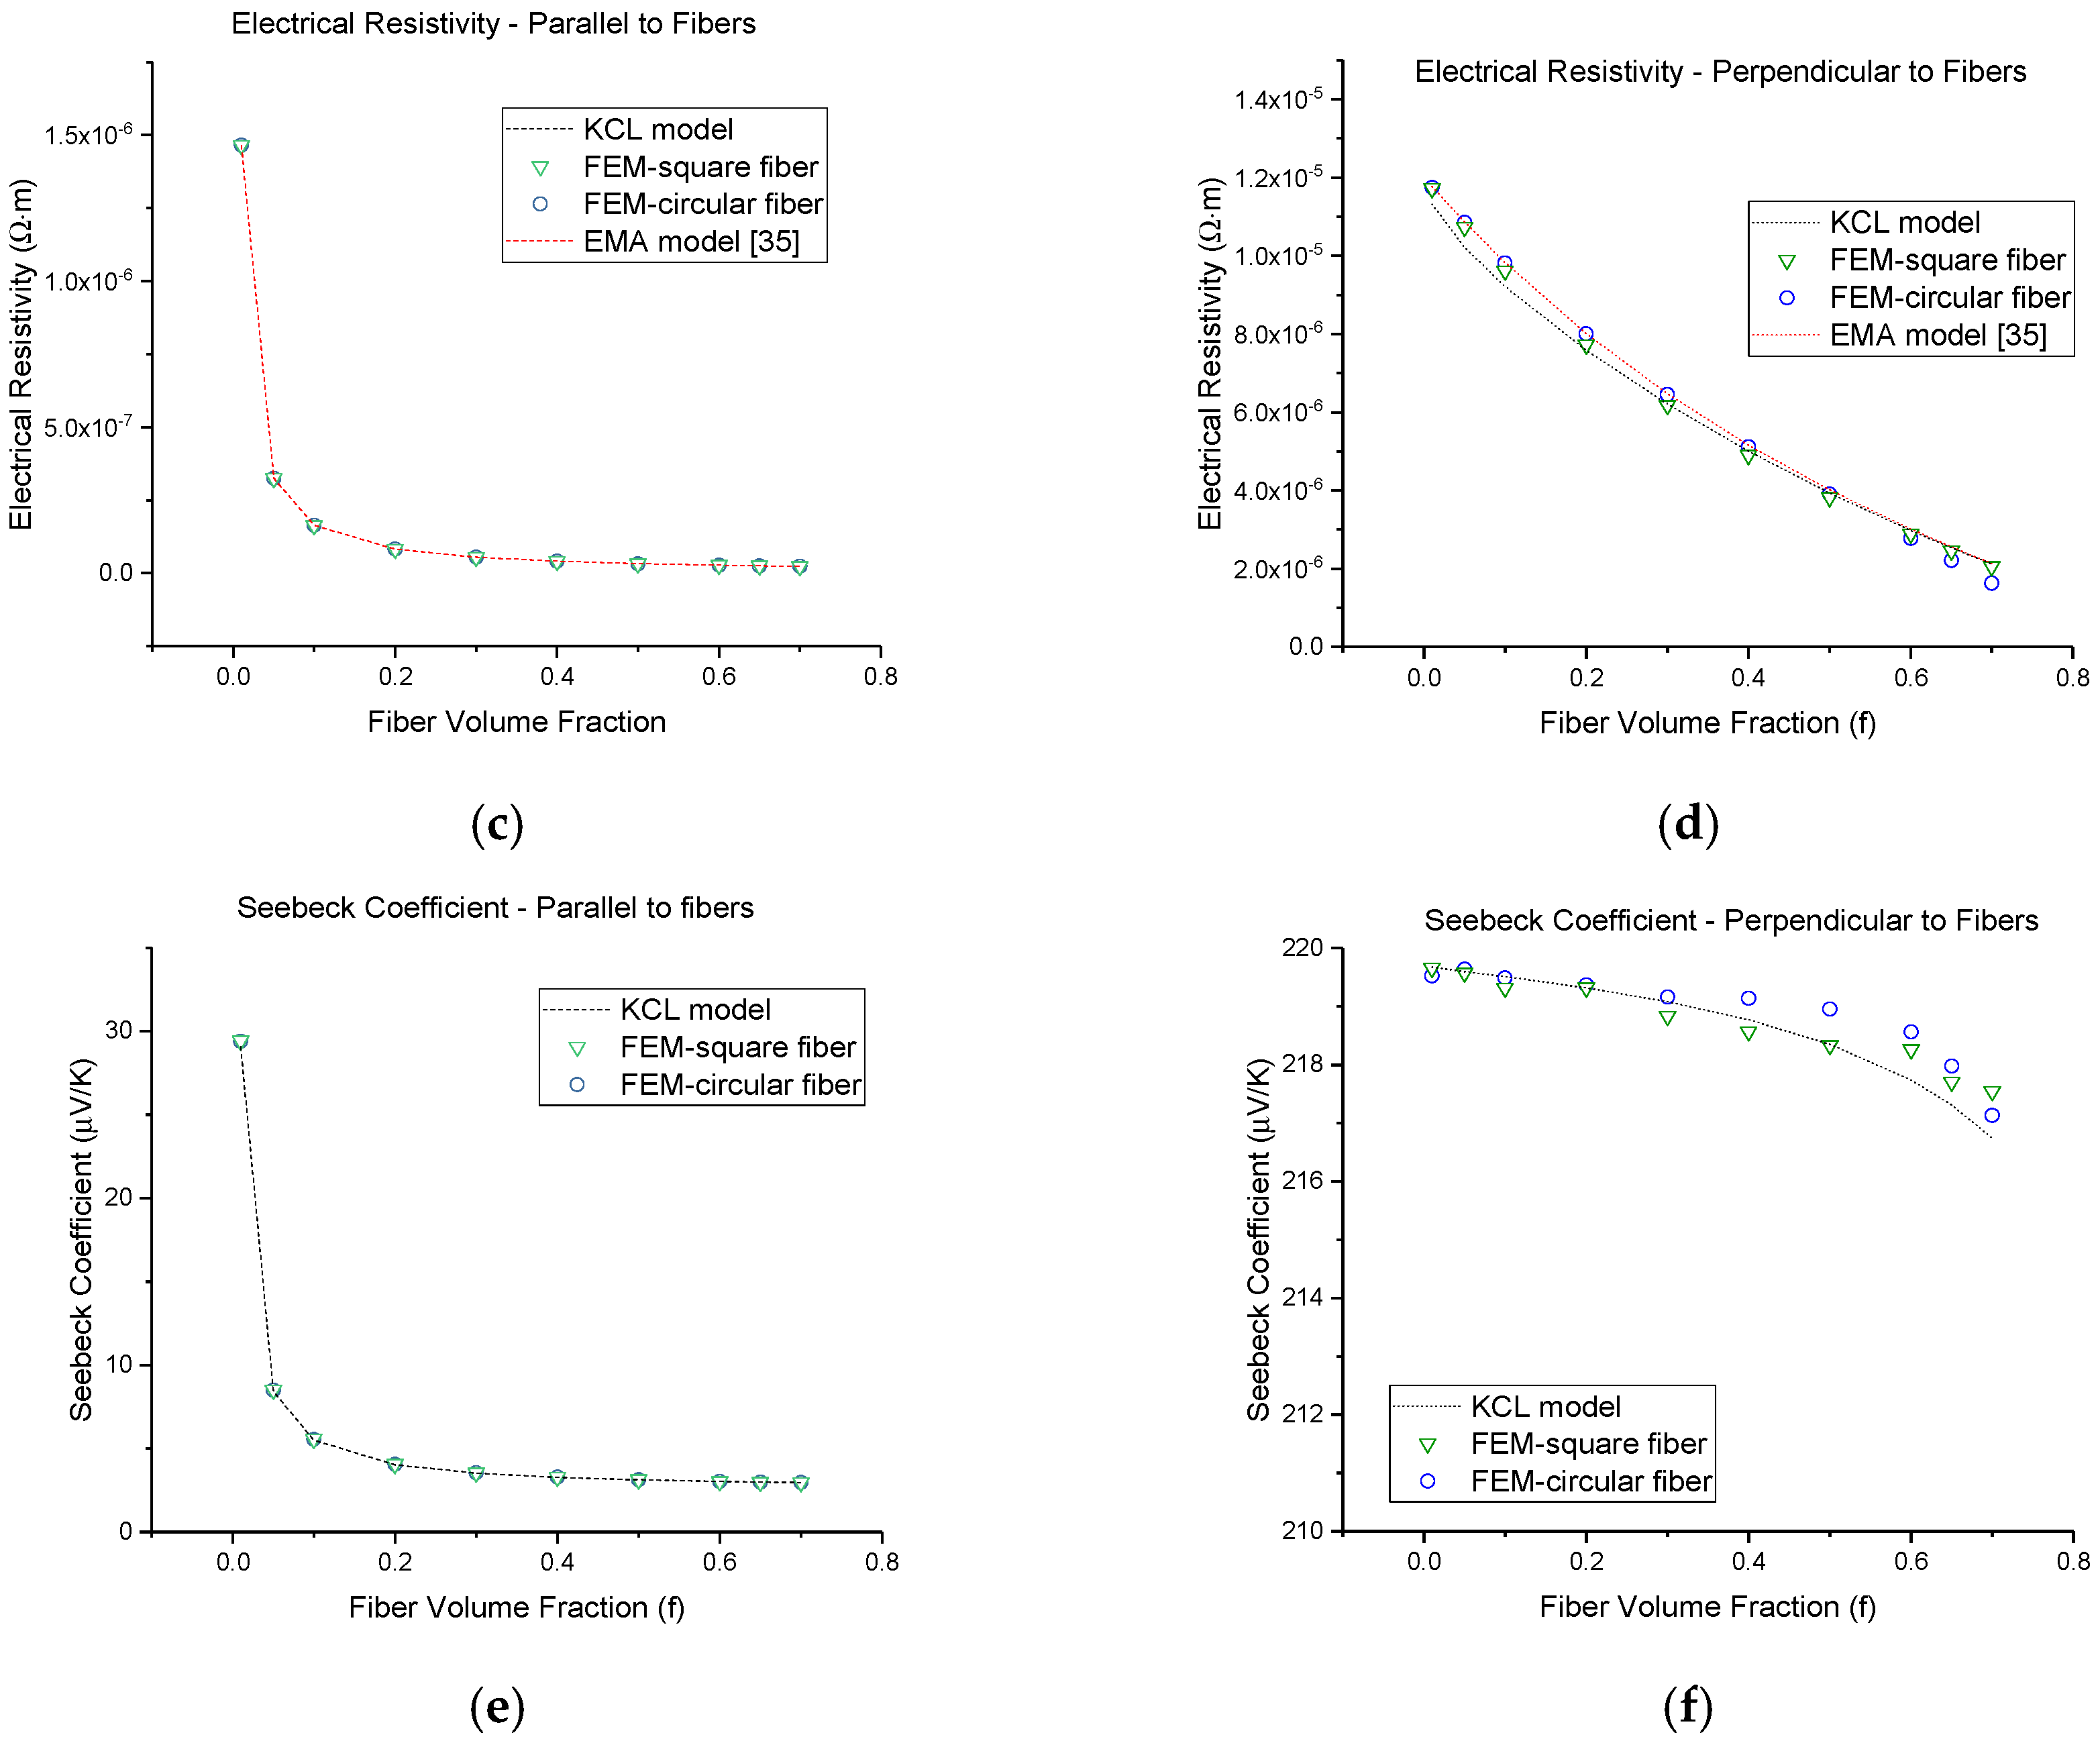
Using Equation (3), the effective properties in the directions parallel and perpendicular to the fibers are calculated at room temperature (300 K) for a hypothetical composite material fabricated from Bi0.5Sb1.5Te3 as the matrix and Cu as the fiber phase (Figure 2). Material properties are listed in Table 1. As shown in Figure 2, both the thermal conductivity and electrical conductivity in the parallel direction increase linearly with increasing volume fraction of the Cu fiber, while the conductivities in the perpendicular direction remain relatively unchanged. On the other hand, the Seebeck coefficient in the parallel direction decreases rapidly from 30 μV/K at f = 0.01 to 5 μV/K at f = 0.1 and remains lower than 5 μV/K with increasing fiber volume fraction. In contrast, the Seebeck coefficient in the perpendicular direction approaches that of the matrix phase (~220 μV/K, Table 1) at low fiber volume fractions, and decreases slightly with increasing f.
In order to confirm the validity of the KCL-based model, finite element analysis (FEA) was conducted using commercial FEA software (COMSOL Multiphysics, COMSOL Inc., Burlington, MA, USA). A unit cell similar to that shown in Figure 1 was constructed. Periodical boundary conditions, including flux and potential continuity for both electrical and thermal properties, were applied to simulate the infinitely large material. Bi0.5Sb1.5Te3 and Cu (Table 1) were used as the matrix and fiber materials. Fiber volume fraction, f, was varied between 0.01 and 0.7. In addition to fibers with square cross-sections, fibers with circular cross-sections were also studied. As shown in Figure 2, all FEA results of both square fibers and circular fibers agree fairly well with the KCL model predictions in both directions parallel and perpendicular to the fibers.
Figure 2 also shows the comparison to the effective conductivities estimated using the effective medium approach (EMA). Using the equations developed by Nan et al. [34] for predicting anisotropic thermal conductivity of composites with ellipsoidal inclusions, the effective thermal and electrical conductivities of the Bi0.5Sb1.5Te3 matrix-Cu fiber composite were calculated by extending the length-to-diameter ratio of the ellipsoidal inclusion to infinity. As shown in Figure 2, the KCL and EMA results also compare well.
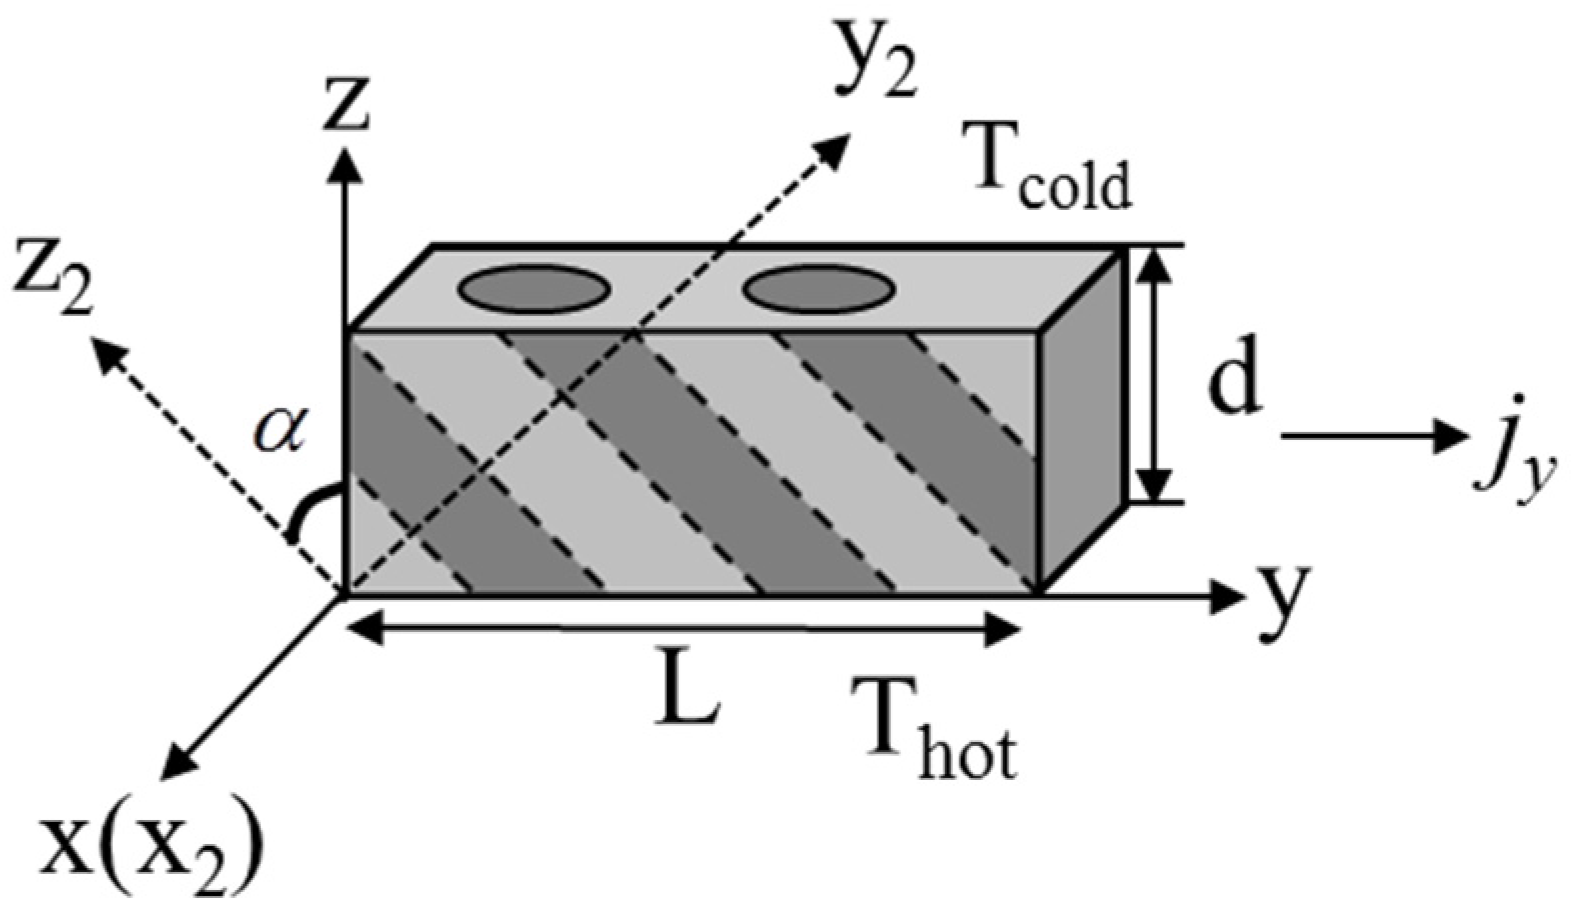
As previously discussed, a transverse TE element can be obtained by rotating the composite structure shown in Figure 1 by an angle of α about the x (or y) axis, where 0 < α < 90° (Figure 3). If the new coordinates are x, y, z, the TE properties can then be calculated as:
mwhere P = λ, ρ, and S. Assuming that the electric current flows in the y direction and the heat flux flows in the z direction, a transverse figure of merit, Ztrans, can be defined as [35]:
where is the transverse Seebeck coefficient, is the thermal conductivity in the z direction, and is the electrical resistivity in the y direction.
3. Cooling Performance
It can be shown that the coefficient of performance (COP) of a transverse TE device when operated in the refrigeration mode can be calculated as [3,35]:
where jy is the electrical current density in the y direction, Th is the heat sink temperature, ΔT is the temperature difference between the cooling surface and the heat sink, d is the device thickness, and L is the device length (Figure 3). A derivation of Equation (6) assumes a one-dimensional electrical current flow in the y direction and a heat flow in the z direction, which requires that the transverse TE element has a large length-to-thickness ratio (L/d) [17]. The maximum temperature difference, ΔTmax, is achieved when the COP approaches zero [16,35]:
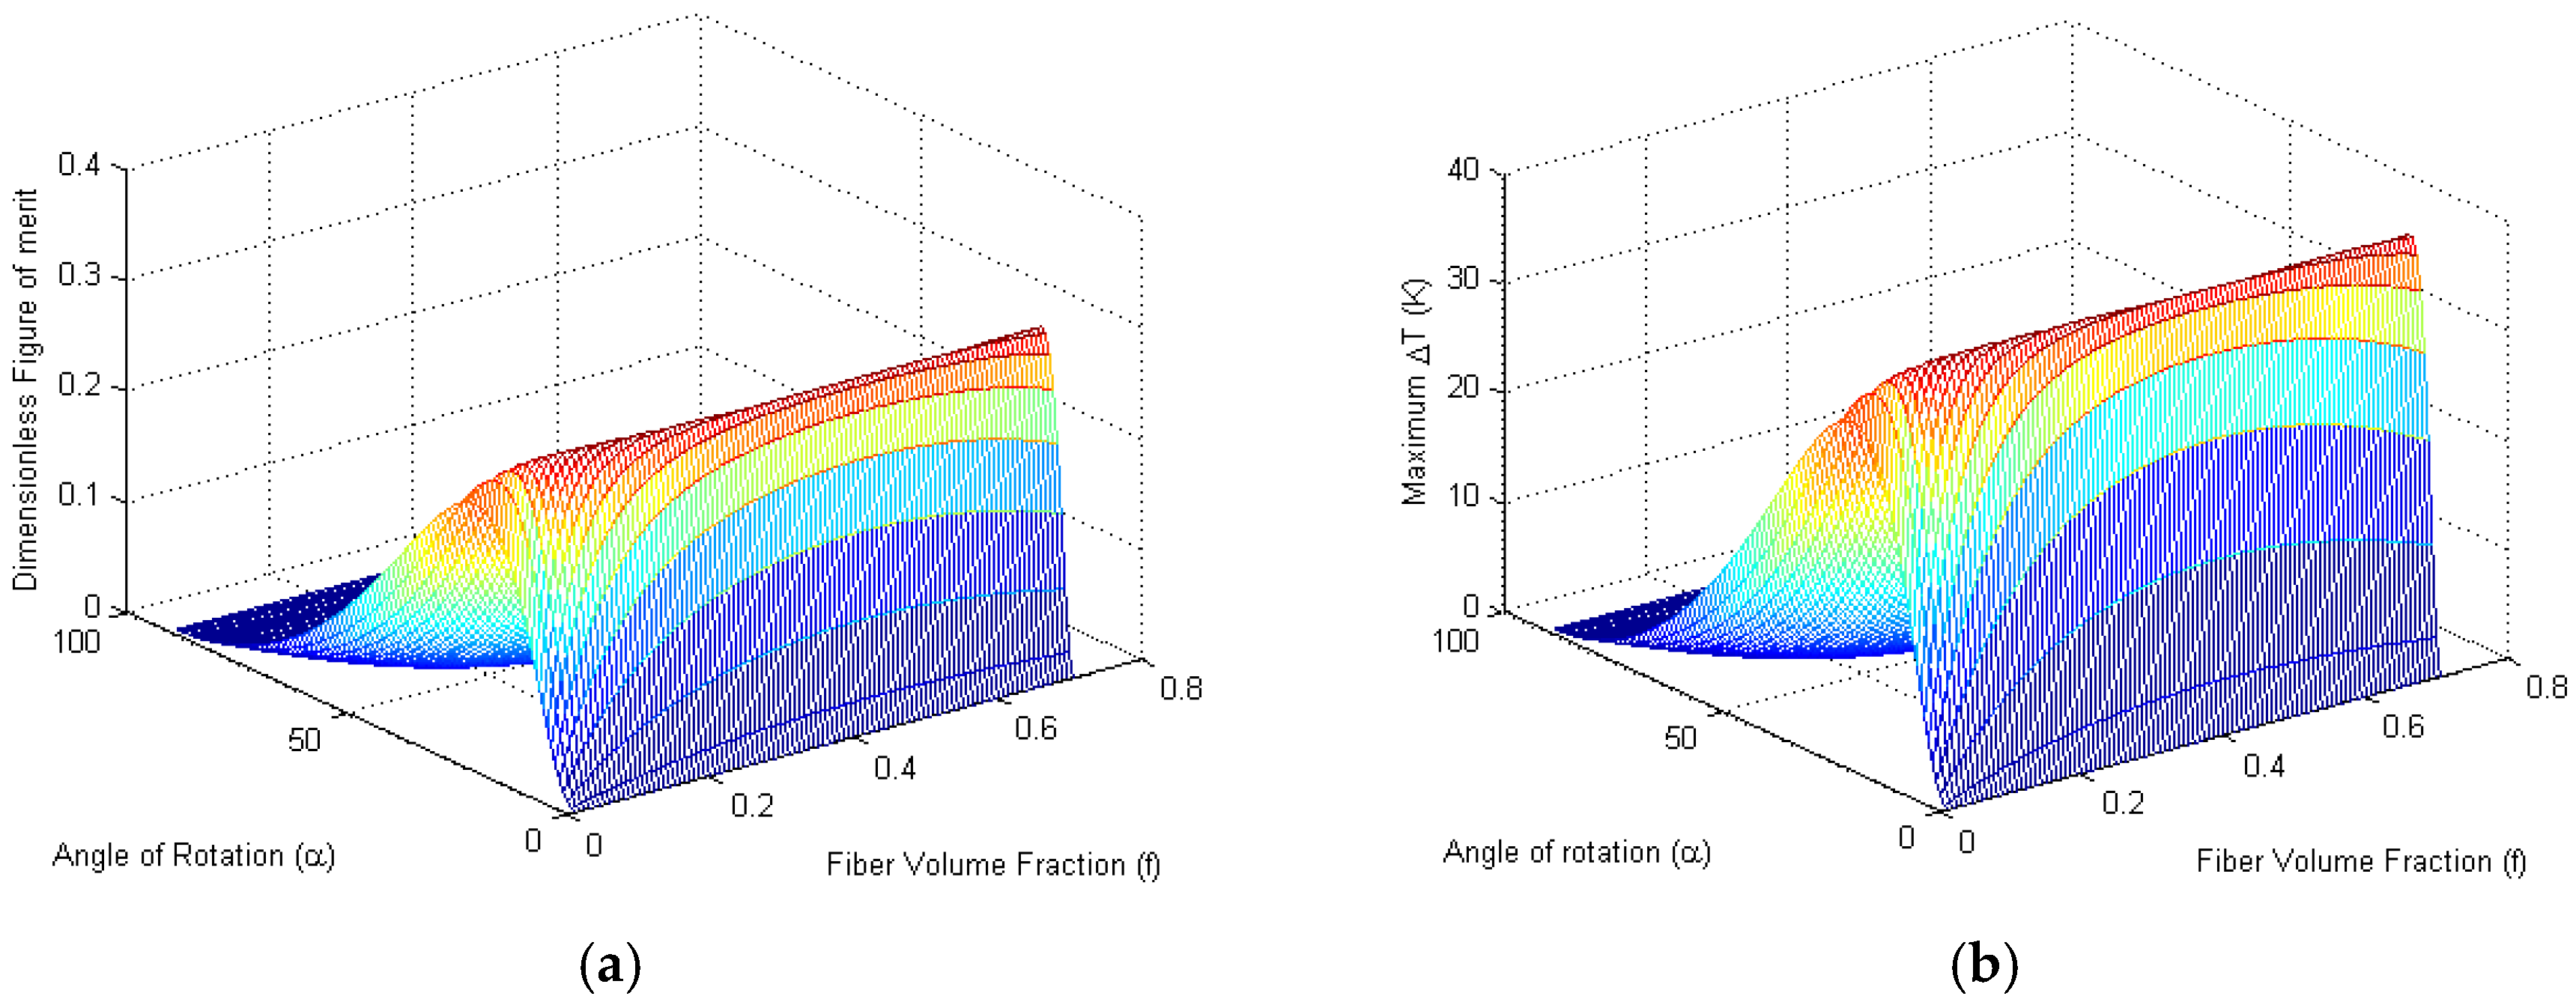
The ΔTmax and the dimensionless figure of merit (ZtransT) of the Bi0.5Sb1.5Te3 matrix-Cu fiber composite were calculated using Equations (6) and (7) with a fixed hot-side temperature (Th) of 300 K. As shown in Figure 4, both ΔTmax and ZtransT initially increase with increasing α (rotation angle, see Figure 3), and after reaching the peak values start to decrease as α further increases. For a given α, the effect of fiber volume fraction, f, is rather weak, especially for f > 0.1. This result implies that a moderate amount of cooling (ΔTmax > 30 K) can be theoretically obtained within a wide range of fiber volume fractions (0.1 < f < 0.7).
The cooling performance, in terms of the ΔTmax, of the Bi0.5Sb1.5Te3 matrix-Cu fiber composite was also investigated using FEA. The total volume of the model was 2 mm (x) × 500 mm (y) × 10 mm (z), with periodical boundary conditions applied in the x direction. An aspect ratio (L/d) of 50 was selected based on our previous study [16], which indicated that the end effect of the device on the temperature distribution became relatively small at a large device length-to-thickness ratio (L/d > 30). Five cases with fiber volume fractions ranging from 0.1 to 0.5 were examined. In each case, the diameter of the fibers was allowed to change to obtain different fiber volume fractions, and in all cases, the L/d ratios were greater than 40. The rotation angle was fixed at 10°, the hot-side temperature was fixed at 300 K, and the electrical current density in the y direction (jy, see Figure 3) was varied until ΔTmax in the z direction was found.
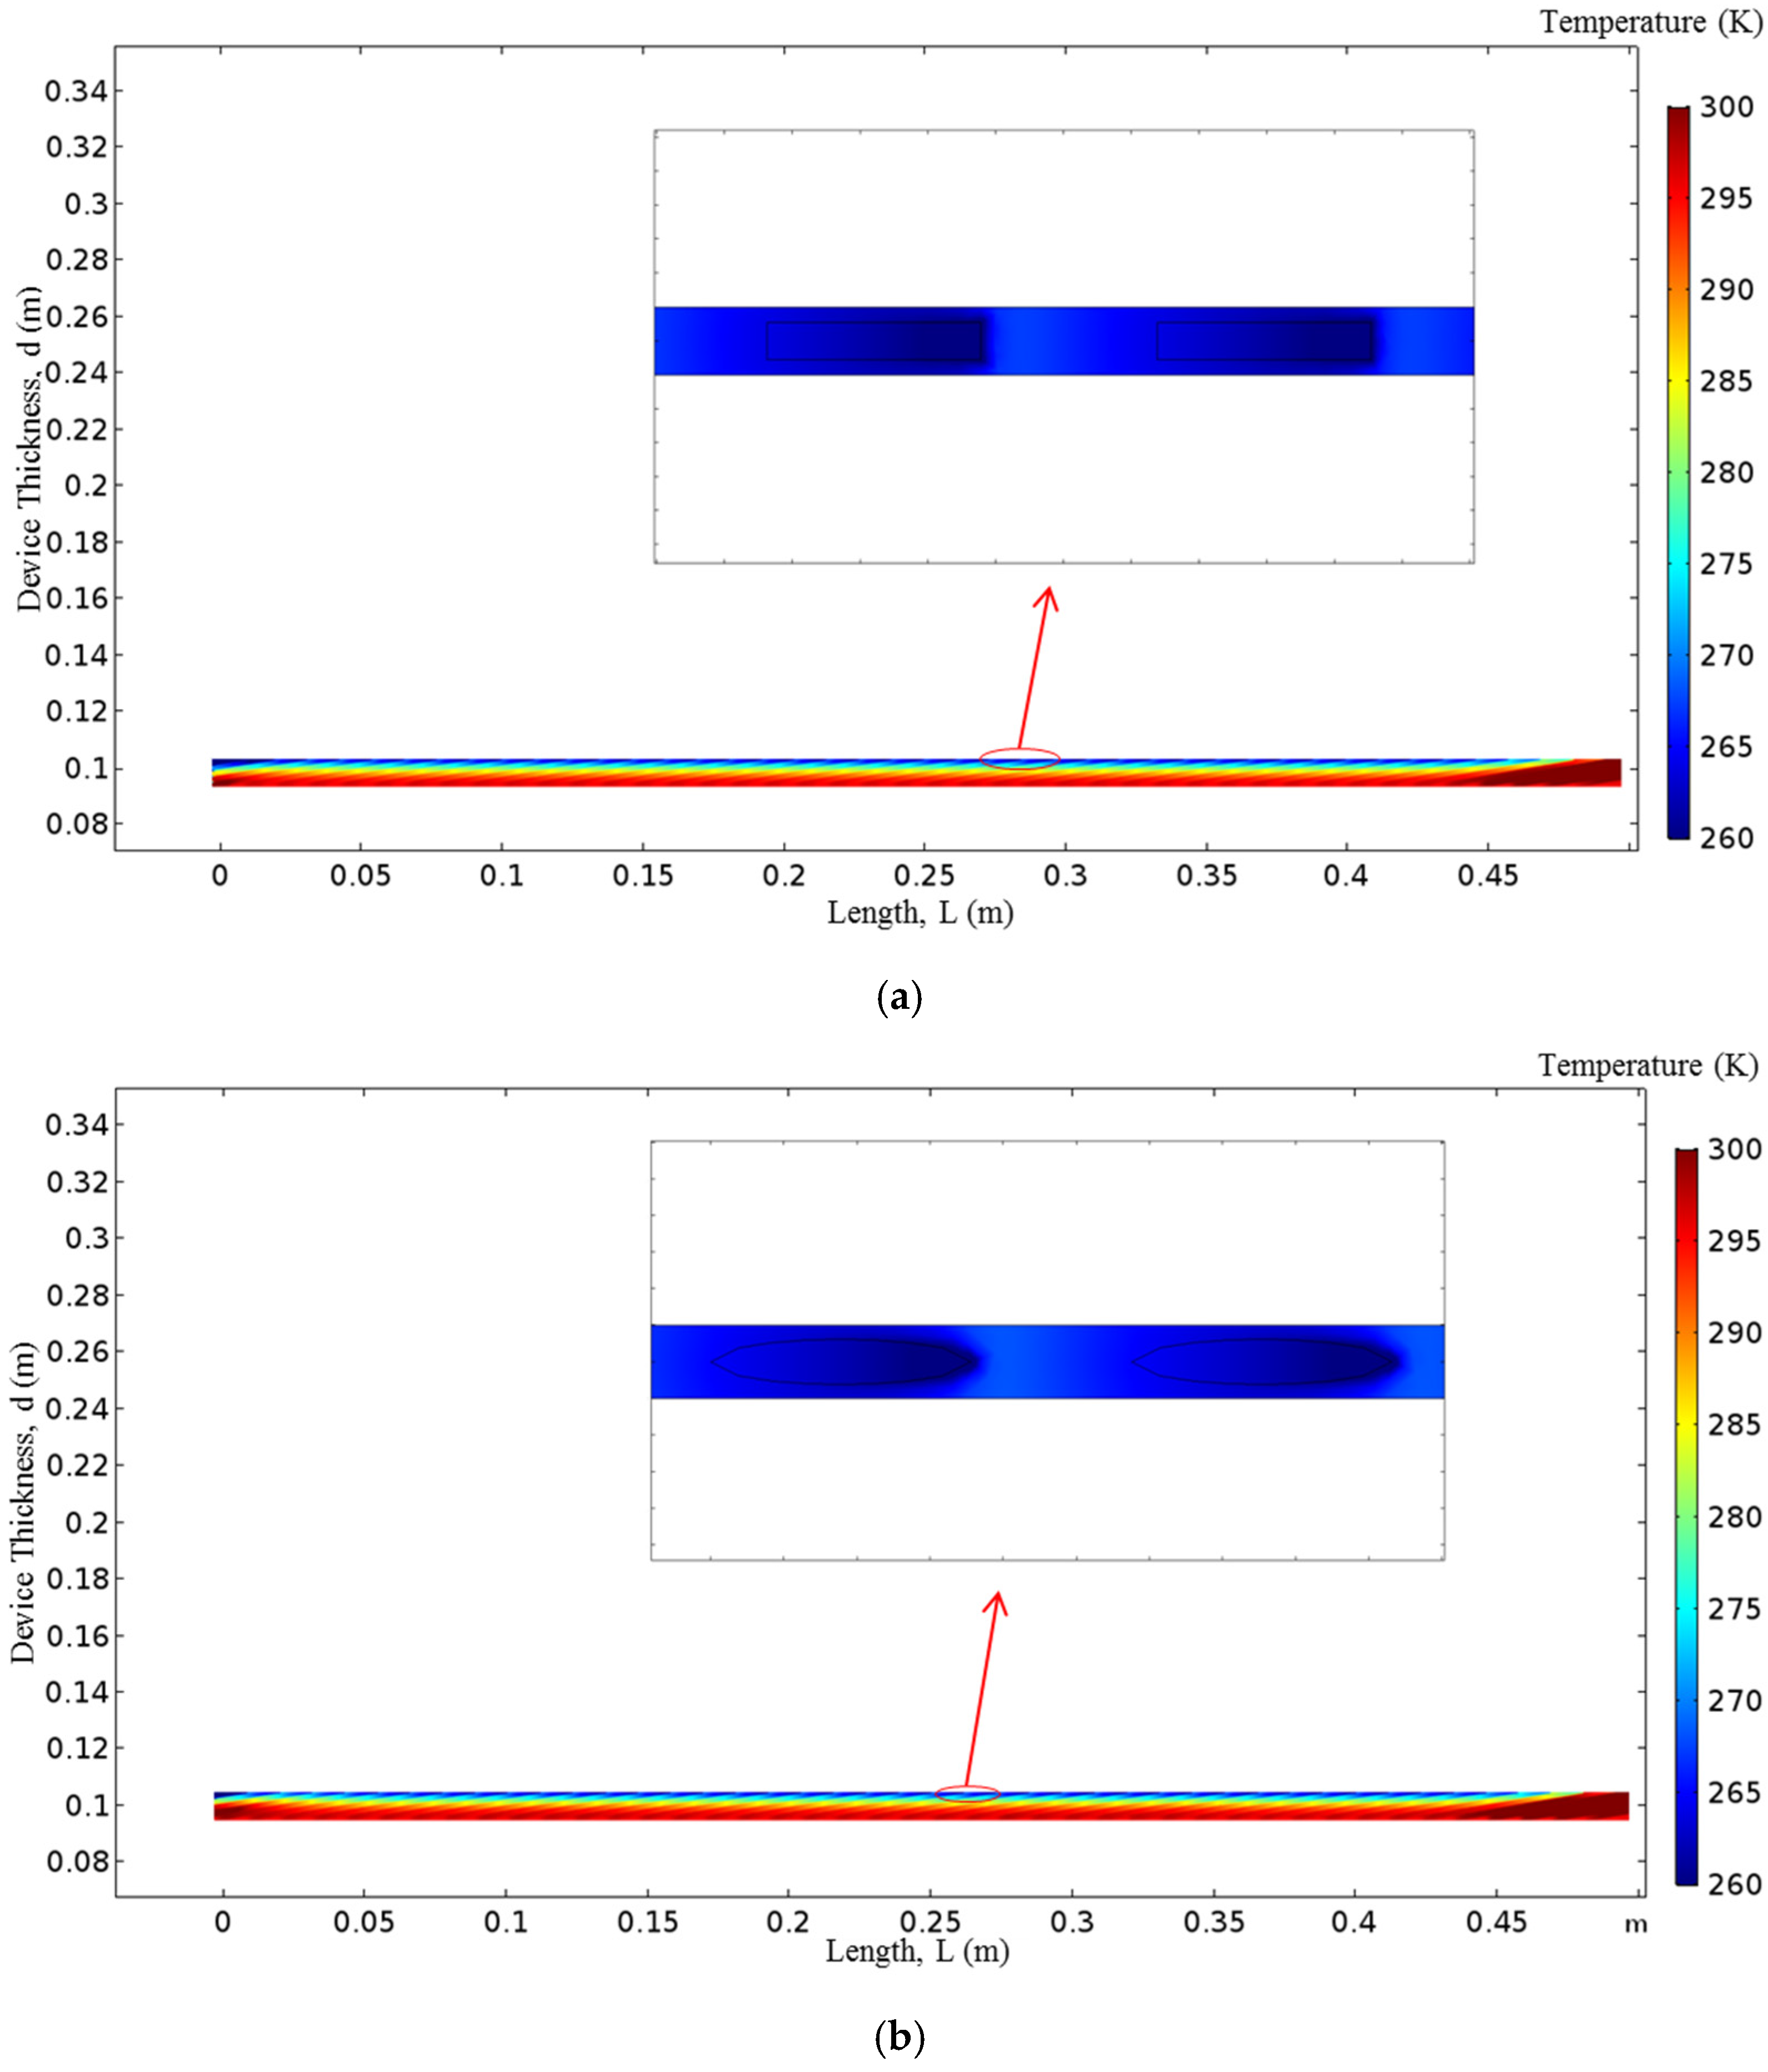
As an example, Figure 5 plots the temperature distribution when f = 0.3 for both square fibers (Figure 5a) and circular fibers (Figure 5b), where temperature gradients were established between the top (cold-side) and bottom (hot-side) surfaces. There exist some non-uniform regions near the ends of the device (near y = 0, or 500 mm) due to the device end effect as previously discussed [16]. The insets in Figure 5a, b illustrate the temperature distribution on the top surface in the uniform region, where small local temperature variations can be observed between the fiber and the matrix.
Table 2 compares the ΔTmax obtained from FEA simulation and the KCL model predictions for the five cases, where the rotational angle was fixed at 10°. The ΔTmax values in FEA cases were obtained by averaging the cold-side surface temperatures in the uniform region (Figure 5). In general, the two sets of data show good agreement. The ΔTmax decreases with increasing fiber volume fraction, f, except for f = 0.5 where a small increase in ΔTmax was observed. This is because ΔTmax is a nonlinear function of fiber volume fraction at a fixed rotational angle (Figure 4b). A larger discrepancy between the KCL model and the FEA results was observed at f = 0.1, indicating that the KCL approach may be less effective to model composites with low volume fiber fractions. The simplified KCL model assumes the unit cell as a homogeneous body and ignores any localized current at the fiber/matrix boundary. However, the localized current exists due to the dissimilar nature of the two phases and circulates at the phase boundary, which leads to additional Joule heating and reduces the cooling efficiency. Consequently, the ΔTmax values obtained from FEA, which took into account the localized circulating current, are always lower than the KCL predictions (Table 2). The effect of the circulating current is reduced as the composite becomes more homogeneous at higher fiber volume fraction. It is noted that the FEA result of ΔTmax on the circular fiber for f = 0.2 is higher than that of the square fiber (Table 2). This is possibly caused by numerical inaccuracies encountered during simulation.
Using Equations (3)–(5), the maximum ZtransT values were calculated for various combinations between some state-of-the-art thermoelectric materials and metals (Table 1). As first suggested by Goldsmid when discussing lamella structures [4], a good transverse TE composite may be constructed by selecting two phases with large contrasts in their transport properties. This principle should also be applicable to fibrous composites. In this study, the thermoelectric materials are selected as the matrix phases, and the metals are selected as the fiber inclusions (Table 3). Should the opposite configuration be used, the metals will form a continuous network and the thermoelectric effects will diminish due to the highly conductive nature of the metals.
For all three operating temperatures (300, 700 and 1000 K) included in Table 2, a fibrous inclusion of Ni seem to give the highest ZtransT values. Au, Ag, and Cu as the fiber phase show comparable contributions. At 300 K, other metals such as Al, Bi, In, Sn, and Pb also lead to non-trivial transverse figure of merits. Although the maximum ZtransT values listed in Table 2 are lower than the corresponding TE matrix materials, which is also true for lamella structures [4], transverse TE devices may have some practical advantages. For example, a transverse TE element only uses one type of semiconductor, i.e., p-type or n-type, while conventional TE devices require both p-type and n-type materials that possess compatible properties. On the other hand, the TE performance of the transverse elements could be further improved by introducing porosity to the less conducting phase [4], which are the thermoelectric materials in the cases included in Table 3, to sharpen the contrast in conductivities between the matrix and the fiber phases.
4. Conclusions
In this study, a mathematical model based on the Kirchhoff Circuit Laws (KCL) was developed to describe the effective thermoelectric properties, including thermal and electrical conductivities and Seebeck coefficient, of composite materials with aligned, uniformly distributed fiber inclusions. Comparisons to finite element analysis (FEA) results and EMA models (note: there is no EMA model for the Seebeck coefficient of fiber composites) indicate that the KCL-based model can predict the effective thermoelectric properties of fiber composite materials with relatively good accuracy. Unlike FEA, which requires a significant amount of computing effort, the simplified KCL model may be useful as a quick tool for material screening and prototype device design.
The cooling performance of composite materials utilizing Bi0.5Sb1.5Te3 as the matrix and Cu as the fiber phase was examined using both the KCL-based model and FEA, which also exhibited agreement. Moderate cooling (>30 K) near room temperature (300 K) may be theoretically achieved using this composite structure. Furthermore, predictions using the KCL approach indicate that non-trivial values of figure of merit (0.25–0.42) may be obtained when combining common thermoelectric materials and metals.
Acknowledgments
This work is supported by the Temple University Faculty Start-Up Fund.
Author Contributions
Fei Ren and Bosen Qian conceived and designed the project; Bosen Qian performed the mathematical modeling and finite element simulation; Bosen Qian and Fei Ren analyzed the data and wrote the paper.
Conflicts of Interest
The authors declare no conflict of interest.
Nomenclature
| F | Fiber Phase |
| M | Matrix phase |
| KCL | Kirchhoff Circuit Laws |
| COP | Coefficient of performance |
| f | Fiber volume fraction |
| λA | Thermal conductivity of material A |
| ρA | Electrical resistivity of material A |
| SA | Seebeck coefficient of material A |
| λx/y/z | Thermal conductivity in x, y, and z directions |
| ρx/y/z | Electrical resistivity in in x, y, and z directions |
| Sx/y/z | Seebeck coefficient in in x, y, and z directions |
| λij | Elements of thermal conductivity tensor |
| ρij | Elements of electrical resistivity tensor |
| Sij | Elements of Seebeck coefficient tensor |
| P | Material properties (λ, ρ, or S) |
| jy | Current density in y direction |
| L | Device length |
| d | Device thickness |
| α | Rotation angle of aligned fibers |
| Th | Heat sink temperature |
| Tc | Cooling surface temperature |
| ΔT | Temperature difference |
| Ztrans | Transverse figure of merit |
References
- Goldsmid, H.J. Materials for synthetic transverse thermoelectric devices. J. Thermoelectr. 2008, 4, 39–48. [Google Scholar]
- Hamid Elsheikh, M.; Shnawah, D.A.; Sabri, M.F.M.; Said, S.B.M.; Haji Hassan, M.; Ali Bashir, M.B.; Mohamad, M. A review on thermoelectric renewable energy: Principle parameters that affect their performance. Renew. Sustain. Energy Rev. 2014, 30, 337–355. [Google Scholar] [CrossRef]
- Babin, V.P.; Gudkin, T.S.; Dashevskii, Z.M.; Dashevskii, L.D.; Dudkin, E.K.; lordanishvili, E.K.; Kaidanov, V.I.; Kolomoets, N.V.; Narva, O.M.; Stil’bans, L.S. Anisotropic synthetic thermoelements and their maximum capabilities. Sov. Phys. Semicond. 1974, 8, 478–481. [Google Scholar]
- Goldsmid, H.J. Application of the transverse thermoelectric effects. J. Electron. Mater. 2011, 40, 1254–1259. [Google Scholar] [CrossRef]
- Xiong, F.; Zhang, H.; Jiang, Z.M.; Zhang, P.X. Transverse laser-induced thermoelectric voltages in tilted La2−XSrxCuO4 thin films. J. Appl. Phys. 2008, 104, 053118. [Google Scholar] [CrossRef]
- Takahashi, K.; Kanno, T.; Sakai, A.; Adachi, H.; Yamada, Y. Gigantic transverse voltage induced via off-diagonal thermoelectric effect in CaxCoO2 thin films. Appl. Phys. Lett. 2010, 97, 021906. [Google Scholar] [CrossRef]
- Putra, N.; Sukyono, W.; Johansen, D.; Iskandar, F.N. The characterization of a cascade thermoelectric cooler in a cryosurgery device. Cryogenics 2010, 50, 759–764. [Google Scholar] [CrossRef]
- Ma, M.; Yu, J. An analysis on a two-stage cascade thermoelectric cooler for electronics cooling applications. Int. J. Refrig. 2014, 38, 352–357. [Google Scholar] [CrossRef]
- Huber, W.M.; Li, S.T.; Ritzer, A.; Bäuerle, D.; Lengfellner, H.; Prettl, W. Transverse seebeck effect in Bi2Sr2CaCu2O8. Appl. Phys. A 1997, 64, 487–489. [Google Scholar] [CrossRef]
- Gallo, C.F.; Chandrasekhar, B.S.; Sutter, P.H. Transport properties of bismuth single crystals. J. Appl. Phys. 1963, 34, 144–152. [Google Scholar] [CrossRef]
- Zhao, K.; Zeng, H.; Xu, K.; Yu, H.; Li, G.; Song, J.; Shi, X.; Chen, L. Scanning thermoelectric microscopy of local thermoelectric behaviors in (Bi,Sb)2Te3 films. Phys. B Condens. Matter 2015, 457, 156–159. [Google Scholar] [CrossRef]
- Kanno, T.; Yotsuhashi, S.; Sakai, A.; Takahashi, K.; Adachi, H. Enhancement of transverse thermoelectric power factor in tilted Bi/Cu multilayer. Appl. Phys. Lett. 2009, 94, 061917. [Google Scholar] [CrossRef]
- MacDonald, D.K.C. Thermoelectricity: An Introduction to the Principles; Dover Publications: Mineola, NY, USA, 2006. [Google Scholar]
- Korolyuk, S.L.; Pilat, I.M.; Samoilovich, A.G.; Slipchenko, V.N.; Snarskii, A.A.; Tsar’kov, E.F. Anisotropic thermoelements. Sov. Phys. Semicond. 1972, 7, 502–507. [Google Scholar]
- Sampilovic, A.G.; Slipchenko, V.N. Investigation of the efficiency of anisotropic thermoelements. Sov. Phys. Semicond. 1975, 9, 1249–1251. [Google Scholar]
- Qian, B.; Ren, F. Cooling performance of transverse thermoelectric devices. Int. J. Heat Mass Transf. 2016, 95, 787–794. [Google Scholar] [CrossRef]
- Ali, S.A.; Mazumder, S. Computational study of transverse peltier coolers for low temperature applications. Int. J. Heat Mass Transf. 2013, 62, 373–381. [Google Scholar] [CrossRef]
- Lengfellner, H.; Kremb, G.; Schnellbögl, A.; Betz, J.; Renk, K.F.; Prettl, W. Giant voltages upon surface heating in normal YBa2Cu3O7−δ films suggesting an atomic layer thermopile. Appl. Phys. Lett. 1992, 60, 501–503. [Google Scholar] [CrossRef]
- Kanno, T.; Sakai, A.; Takahashi, K.; Omote, A.; Adachi, H.; Yamada, Y. Tailoring effective thermoelectric tensors and high-density power generation in a tubular Bi0.5Sb1.5Te3/Ni composite with cylindrical anisotropy. Appl. Phys. Lett. 2012, 101, 011906. [Google Scholar] [CrossRef]
- Kanno, T.; Takahashi, K.; Sakai, A.; Tamaki, H.; Kusada, H.; Yamada, Y. Detection of thermal radiation, sensing of heat flux, and recovery of waste heat by the transverse thermoelectric effect. J. Electron. Mater. 2014, 43, 2072–2080. [Google Scholar] [CrossRef]
- Sakai, A.; Kanno, T.; Takahashi, K.; Tamaki, H.; Adachi, H.; Yamada, Y. Enhancement in performance of the tubular thermoelectric generator (TTEG). J. Electron. Mater. 2012, 42, 1612–1616. [Google Scholar] [CrossRef]
- Reitmaier, C.; Walther, F.; Lengfellner, H. Power generation by the transverse seebeck effect in Pb-Bi2Te3 multilayers. Appl. Phys. A 2011, 105, 347–349. [Google Scholar] [CrossRef]
- Zahner, T.; Förg, R.; Lengfellner, H. Transverse thermoelectric response of a tilted metallic multilayer structure. Appl. Phys. Lett. 1998, 73, 1364–1366. [Google Scholar] [CrossRef]
- Reitmaier, C.; Walther, F.; Lengfellner, H. Transverse thermoelectric devices. Appl. Phys. A 2010, 99, 717–722. [Google Scholar] [CrossRef]
- Fischer, K.; Stoiber, C.; Kyarad, A.; Lengfellner, H. Anisotropic thermopower in tilted metallic multilayer structures. Appl. Phys. A Mater. Sci. Proc. 2004, 78, 323–326. [Google Scholar] [CrossRef]
- Kyarad, A.; Lengfellner, H. Al-si multilayers: A synthetic material with large thermoelectric anisotropy. Appl. Phys. Lett. 2004, 85, 5613. [Google Scholar] [CrossRef]
- Kyarad, A.; Lengfellner, H. Transverse peltier effect in tilted Pb-Bi2Te3 multilayer structures. Appl. Phys. Lett. 2006, 89, 192103. [Google Scholar] [CrossRef]
- Ren, F.; Wang, H.; Menchhofer, P.A.; Kiggans, J.O. Thermoelectric and mechanical properties of multi-walled carbon nanotube doped Bi0.4Sb1.6Te3 thermoelectric material. Appl. Phys. Lett. 2013, 103, 221907. [Google Scholar] [CrossRef]
- Gaultois, M.W.; Sparks, T.D.; Borg, C.K.H.; Seshadri, R.; Bonificio, W.D.; Clarke, D.R. Data-driven review of thermoelectric materials: Performance and resource considerations. Chem. Mater. 2013, 25, 2911–2920. [Google Scholar] [CrossRef]
- Burkov, A.T.; Vedernikov, M.V. Thermoelectric properties of metallic materials. In CRC handbook of Thermoelectrics; CRC Press: Boca Raton, FL, USA, 1995. [Google Scholar]
- CRC Handbook of Chemistry and Physics, 97th ed.; CRC Press/Taylor & Francis: Boca Raton, FL, USA, 2017.
- ASM Handbook, Properties of Pure Metals, Properties and Selection: Nonferrous Alloys and Special-Purpose Materials; ASM International: Almere, The Netherlands, 1990; pp. 1099–1201.
- Efunda. Available online: http://www.efunda.com/home.cfm (access on 16 July 2017).
- Nan, C.-W.; Birringer, R.; Clarke, D.R.; Gleiter, H. Effective thermal conductivity of particulate composites with interfacial thermal resistance. J. Appl. Phys. 1997, 81, 6692–6699. [Google Scholar] [CrossRef]
- Nolas, G.S.; Sharp, J.; Goldsmid, H.J. Thermoelectrics: Basic Principles and New Materials Developments; Springer: Berlin, Germany, 2001. [Google Scholar]
Figure 1.
Schematic of a unit cell used in the KCL model.

Figure 2.
Thermal conductivity, electrical resistivity, and Seebeck coefficient as a function of fiber volume fraction in directions parallel and transverse to the fiber inclusions.
Figure 2.
Thermal conductivity, electrical resistivity, and Seebeck coefficient as a function of fiber volume fraction in directions parallel and transverse to the fiber inclusions.


Figure 3.
Schematic showing a piece of the fibrous composite tilted on an angle α about the x-axis.

Figure 4.
KCL model results of the Bi0.5Sb1.5Te3 matrix-Cu fiber composite as a function of fiber volume fraction and the angle of rotation: (a) ZtransT at 300 K, and (b) the maximum ΔT when the hot-side temperature is fixed at 300 K.
Figure 4.
KCL model results of the Bi0.5Sb1.5Te3 matrix-Cu fiber composite as a function of fiber volume fraction and the angle of rotation: (a) ZtransT at 300 K, and (b) the maximum ΔT when the hot-side temperature is fixed at 300 K.

Figure 5.
Temperature profiles of transverse fibrous thermoelectric device. (a) Square fiber inclusion; (b) cylindrical fiber inclusion.
Figure 5.
Temperature profiles of transverse fibrous thermoelectric device. (a) Square fiber inclusion; (b) cylindrical fiber inclusion.


Table 1.
Material properties used in this study.
| Material | T (K) | S (μV/K) | ρ (Ω·m) | λ (W·m−1·K−1) | Reference |
|---|---|---|---|---|---|
| Bi0.5Sb1.5Te3 | 300 | 220.00 | 1.20 × 10⁻⁵ | 1.10 | [28] |
| PbTe | 700 | 236.00 | 2.25 × 10⁻⁵ | 1.44 | [29] |
| Si0.2Ge0.8 | 1000 | 232.00 | 2.48 × 10⁻⁵ | 2.56 | [29] |
| Bi | 300 | −110.00 | 1.05 × 10⁻⁶ | 8.20 | [10] |
| Pb | 300 | −1.05 | 2.13 × 10⁻⁷ | 35.30 | [30,31] |
| In | 300 | 1.68 | 8.40 × 10⁻⁸ | 83.70 | [30,32] |
| Sn | 300 | −1.00 | 1.05 × 10⁻⁷ | 62.50 | [30,32] |
| Al | 300 | −1.66 | 2.62 × 10⁻⁸ | 247.00 | [30,32] |
| Ni | 300 | −19.50 | 7.20 × 10⁻⁸ | 90.70 | [30,31] |
| 700 | −25.80 | 1.70 × 10⁻⁷ | 72.20 | [30,33] | |
| 1000 | −29.90 | 4.20 × 10⁻⁷ | 71.80 | [30,33] | |
| Cu | 300 | 1.83 | 1.67 × 10⁻⁸ | 400.00 | [30,31] |
| 700 | 2.83 | 3.83 × 10⁻⁸ | 372.50 | [30,31] | |
| 1000 | 5.36 | 7.92 × 10⁻⁸ | 357.00 | [30,31] | |
| Ag | 300 | 1.51 | 1.63 × 10⁻⁸ | 429.00 | [30,31] |
| 700 | 2.82 | 4.21 × 10⁻⁸ | 404.00 | [30,31] | |
| 1000 | 7.95 | 6.52 × 10⁻⁸ | 379.00 | [30,31] | |
| Au | 300 | 1.94 | 2.01 × 10⁻⁸ | 317.00 | [30,31] |
| 700 | 2.86 | 5.82 × 10⁻⁸ | 291.00 | [30,31] | |
| 1000 | 3.85 | 8.85 × 10⁻⁸ | 270.00 | [30,31] |
T: Temperature; S: Seebeck coefficient; ρ: Electrical resistivity; λ: Thermal conductivity.
Table 2.
Comparison of ΔTmax between the KCL model and FEA simulations.
| Fiber Volume Fraction (f) | KCL Model | FEA Simulation | |
|---|---|---|---|
| Square Fiber | Circular Fiber | ||
| 0.1 | 38.0 K | 31.8 K | 31.8 K |
| 0.2 | 34.1 K | 31.6 K | 32.7 K |
| 0.3 | 32.0 K | 31.4 K | 31.2 K |
| 0.4 | 31.3 K | 31.2 K | 30. 6 K |
| 0.5 | 31.7 K | 32.3 K | 31.8 K |
Table 3.
Maximum ZtransT values for various combinations of thermoelectric matrices and metal fibers.
Table 3.
Maximum ZtransT values for various combinations of thermoelectric matrices and metal fibers.
| Temperature (K) | Matrix Material | Fiber Material | Fiber Volume Fraction (f) | Rotation Angle (α, Degree) | ZtransT |
|---|---|---|---|---|---|
| 300 K | Bi0.5Sb1.5Te3 | Ni | 0.40 | 12.60 | 0.35 |
| Al | 0.50 | 8.10 | 0.32 | ||
| Au | 0.55 | 7.20 | 0.32 | ||
| Ag | 0.51 | 6.30 | 0.31 | ||
| Cu | 0.56 | 6.30 | 0.31 | ||
| Bi | 0.40 | 34.20 | 0.31 | ||
| In | 0.39 | 13.50 | 0.29 | ||
| Sn | 0.40 | 15.30 | 0.28 | ||
| Pb | 0.38 | 19.80 | 0.27 | ||
| 700 K | PbTe | Ni | 0.36 | 15.30 | 0.42 |
| Au | 0.48 | 7.20 | 0.35 | ||
| Cu | 0.48 | 7.20 | 0.33 | ||
| Ag | 0.43 | 8.10 | 0.33 | ||
| 1000 K | Si0.2Ge0.8 | Ni | 0.37 | 20.70 | 0.27 |
| Au | 0.36 | 10.80 | 0.26 | ||
| Ag | 0.40 | 9.00 | 0.25 | ||
| Cu | 0.37 | 9.90 | 0.25 |
© 2017 by the authors. Licensee MDPI, Basel, Switzerland. This article is an open access article distributed under the terms and conditions of the Creative Commons Attribution (CC BY) license (http://creativecommons.org/licenses/by/4.0/).
Share and Cite
MDPI and ACS Style
Qian, B.; Ren, F. Transverse Thermoelectricity in Fibrous Composite Materials. Energies 2017, 10, 1006. https://doi.org/10.3390/en10071006
AMA Style
Qian B, Ren F. Transverse Thermoelectricity in Fibrous Composite Materials. Energies. 2017; 10(7):1006. https://doi.org/10.3390/en10071006
Chicago/Turabian StyleQian, Bosen, and Fei Ren. 2017. "Transverse Thermoelectricity in Fibrous Composite Materials" Energies 10, no. 7: 1006. https://doi.org/10.3390/en10071006
Note that from the first issue of 2016, this journal uses article numbers instead of page numbers. See further details here.