Article

Economic Optimization of Component Sizing for Residential Battery Storage Systems

1
Department of Electrical and Computer Engineering, Technical University of Munich (TUM), 80333 Munich, Germany
2
Electrical and Computer Engineering, University of Alberta, Edmonton, AB T6G 1H9, Canada
3
Electrical Engineering and Computer Science, VSB-Technical University Ostrava, 70800 Ostrava, Czech Republic
*
Author to whom correspondence should be addressed.
Energies 2017, 10(7), 835; https://doi.org/10.3390/en10070835
Submission received: 7 May 2017 / Revised: 6 June 2017 / Accepted: 12 June 2017 / Published: 22 June 2017
(This article belongs to the Section D: Energy Storage and Application)

Abstract

:
Battery energy storage systems (BESS) coupled with rooftop-mounted residential photovoltaic (PV) generation, designated as PV-BESS, draw increasing attention and market penetration as more and more such systems become available. The manifold BESS deployed to date rely on a variety of different battery technologies, show a great variation of battery size, and power electronics dimensioning. However, given today’s high investment costs of BESS, a well-matched design and adequate sizing of the storage systems are prerequisites to allow profitability for the end-user. The economic viability of a PV-BESS depends also on the battery operation, storage technology, and aging of the system. In this paper, a general method for comprehensive PV-BESS techno-economic analysis and optimization is presented and applied to the state-of-art PV-BESS to determine its optimal parameters. Using a linear optimization method, a cost-optimal sizing of the battery and power electronics is derived based on solar energy availability and local demand. At the same time, the power flow optimization reveals the best storage operation patterns considering a trade-off between energy purchase, feed-in remuneration, and battery aging. Using up to date technology-specific aging information and the investment cost of battery and inverter systems, three mature battery chemistries are compared; a lead-acid (PbA) system and two lithium-ion systems, one with lithium-iron-phosphate (LFP) and another with lithium-nickel-manganese-cobalt (NMC) cathode. The results show that different storage technology and component sizing provide the best economic performances, depending on the scenario of load demand and PV generation.

1. Introduction and Related Work

Battery energy storage systems (BESS) are considered for a variety of applications in modern power grids [1]. As these systems decline drastically in cost, commercial and customer interest for this type of storage is growing. As a result, the combination of residential photovoltaic (PV) systems with battery storage (“PV-battery energy storage systems”, PV-BESS) and grid connection (grid-connected PV-BESS) have attained significant growth rates [2,3,4].
Such systems enable customers to avoid the retail electricity tariff for all energy fostered by surplus PV generation via buffering in the BESS, instead of selling surplus power at the feed-in tariff. This is a potentially profitable scenario in countries where the electricity retail tariff exceeds PV feed-in tariffs, e.g., Australia, Canada, regions in the USA, and multiple countries in Europe. Academia has analyzed the economic value of PV-BESS for various individual systems [5,6,7], and small but positive business cases seem to be in reach for specific usage scenarios. In addition, several online tools are available free of charge and are capable of analyzing the benefit for specific BESS with respect to load and PV size variation [8,9,10,11]. These multiple approaches provide a sensitivity analysis for given BESS systems but are unable to guide residential customers to find the economically best-suited storage and inverter combination for their specific needs.
Despite the fact that PV-BESS is still a niche market at present, various automotive companies have started to enter the market and have announced products with drastically lower price tags, e.g., Tesla, Mercedes-Benz, and Nissan [12,13,14], making PV-BESS potentially economic in multiple regions around the world [4].
Interestingly, currently available and announced PV-BESS rely on different battery technologies and show a strong variation of storage size [15]. At a first glance, there appears to be a market trend towards lithium-ion based systems with storage capacity above 5 kWh coupled with inverter sizes of nominal power (PN) often exceeding PN = 3 kW [3]. Nevertheless, lead-acid (PbA) systems still hold an appreciable market share of over 10% for new system installations, and there is a strong competition within the category of lithium-ion batteries within which different cell chemistries differ significantly in performance, cost, and aging [3].
Despite the market availability of these various systems, there is still an obvious lack of accurate quantitative assessment tools to determine return on investment (ROI)-optimal storage solutions for individual households with particular PV generation and load demand. The methods and evaluation tools presented in this paper will help to determine the best-suited storage technology and system dimensioning for a variety of BESS application settings.
While most existing studies assess the economic value of residential battery storage using sensitivity analysis, there is lack of system size optimization studies considering technology specific parameters and aging information [16]. Nevertheless, numerous significant contributions in the literature describe the usage of optimization routines for storage dispatch and size optimization in a distinct but related context. Their overview is presented in Table 1.
Complex optimization approaches can be applied to storage dispatch optimization in various use cases. Although this helps to reveal possible operation modes of a system, such approaches often require extensive computational resources and may fail to find a globally optimal solution.
Geth et al. [22] show an optimization method for the best positioning and sizing of energy storage in distribution grids. Using a multi-objective optimization method, the authors find an optimized dispatch operation strategy for multiple households with respect to BESS profit generation via energy market trading. They also provide a detailed discussion of concerns of distribution system operators related to security of the energy service, e.g., using voltage control.
In a subsequent work, Tant et al. [23] demonstrate how complex optimization methods can be applied to find the best-suited battery storage system for PV integration in a given distribution grid. The authors analyze in detail the storage dispatch optimization using PbA and lithium-ion batteries. However, this work focuses on multi-objective optimization for peak shaving and voltage regulation, rather than on aspects relevant to a single household cost optimization.
Recent work by Merei et al. [21] concentrates on commercial applications of BESS. The authors use sensitivity analysis to study the maximization of energy self-consumption via storage integration. The techno-economic analysis reveals that, for most commercial applications, BESS is not favored economically when battery degradation is taken into account. Other previous work by Magnor and Sauer [17] and Merei et al. [24] analyzed the optimal sizing of storage in the context of island grids and home storage systems. A genetic algorithm-based method allows the modelling of a non-linear set of equations including battery-aging models. However, the solver results may not find a globally optimal solution to the described problem, and the studies do not provide design rules for future storage systems.
In contrast, others have used sensitivity studies to reveal the optimal size of storage system components. For example, Weniger et al. [19] provide a detailed analysis of power conversion efficiency of state-of-art battery home storage inverters. However, this work does not consider the economic impact of component sizing. Muenzel et al. [18] investigate the economics of residential storage systems with a dynamic programming derived operation strategy and screen payback periods achievable for several storage system sizes in Australia. Using generalized parameters for the inverter, cost, and degradation of an unspecified litium-ion battery type, they anticipate a positive return on investment in the near future. In general, such sensitivity analyses commonly fail if various parameters are to be screened and optimized at the same time.
This issue can be effectively resolved using linear optimization approaches, which have been successfully applied to energy storage optimization. For example, Lauingera et al. provide a framework for electrical and thermal storage integration in households [20]. Based on linear programming, the energy dispatch of a residential building is optimized. However, this work does not consider the sizing optimization of storage and periphery, and battery storage aging is not part of the model.
In contrast to the aforementioned publications, this work conducts a comprehensive power flow analysis, implements technology-specific battery degradation, and presents a highly reproducible and easily adaptable linear optimization approach to assess both the cost and the maximum profit attainable for residential BESS. Parameterized with conditions matching the German regulatory framework as well as detailed cost and aging information for three commonly deployed battery technologies (a PbA and two lithium-ion systems), this approach allows the best storage type and power electronics size to be selected for households with rooftop-mounted PV generators. The presented results also provide design rules applicable to residential PV-BESS around the world.
The remainder of this paper is organized as follows: Section 2 introduces the system layout and parameters necessary as input for the subsequent optimization procedure. The linear programming methodology, including equations and constraints for optimization, is described in Section 3. The subsequent Section 4 describes obtained results and discusses the findings. The final Section 5 summarizes major conclusions and outlines possible directions for future research.

2. Photovoltaic-Battery Energy Storage Systems Layout, Storage Model and Parametrization

This section summarizes all parameters relevant for BESS optimization. It describes the system layout, overviews technical parameters of the storage systems under investigation, and specifies the economic framework considered in this study.

2.1. System Layout

The schematic diagram of Figure 1 shows the system configuration as well as electrical connections and power flows for the PV-BESS system under study. All variables necessary for subsequent modeling are explained in more detail later, along with the definition of the optimization problem. The arrows in Figure 1 indicate the directions of power flows allowed for all component links. For this work, the optimization approach is confined to an alternate current (AC) coupling of battery storage, which offers the broadest flexibility in system design and is also suitable for the retrofitting of existent PV installations [6]. It is worth mentioning that a variety of different direct current (DC) system coupling topologies (e.g., generator coupled or converter link topology) have also been proposed for PV-BESS. Although such differing topologies have their individual strengths and weaknesses, an overall consistent trend for choice of best technology and storage system sizing is expected [6].

2.2. Storage System Technical Parameters, Cost Assumptions and Battery Aging Model

This study analyzes the economic potential and technical capabilities of three commonly used battery technologies for PV-BESS; a typical vented PbA system and two lithium-ion systems with lithium-iron-phosphate (LFP) and lithium-nickel-manganese-cobalt (NMC) cathodes, respectively.
Table 2 provides an overview of the characteristic parameters for the individual technologies under investigation (Appendix A provides a more detailed survey of common performance data and citations to literature references for all battery technologies under consideration). It is worth mentioning here that data on aging and lifetime predictions are highly sensitive to various influencing factors (e.g., cell construction type, sealing quality, electrolyte additives) and test conditions. Furthermore, the values are likely to vary between batteries of individual manufacturers. However, it is not the focus of this work to question the correctness of the available lifetime data. The trends are well in accordance with the literature, and lifetime estimations derived in this work match well with the expert knowledge of BESS manufacturers.
The battery efficiency ( η b a t t ) is given as an averaged number of round trip Watt-hour retention using typical low charge and discharge rates of 0.1 C (capacity-rate) and ambient temperature (approximately 25 °C). These conditions correspond well to the scenarios commonly present for a typical home storage system. Self-discharge ( S D b a t t ) values considered in the optimization model are also listed in Table 1 and taken into account during simulations. However, having relatively small values, self-discharge plays a minor role, especially for the lithium-ion based battery chemistries.
In contrast, the aging of storage devices cannot be neglected. In fact, the deterioration of storage is a major cost driver during storage operation. It is common to differentiate between cyclic and calendric aging processes for battery degradation, as described in detail for PbA [25] and lithium-ion batteries [26]. The battery cyclic and calendric lifetime indicators ( L i f e C y c 80 % ; L i f e C a l 80 % ) specify a battery usage scenario, until a certain capacity fade for a battery cell becomes evident. As obvious from the nomenclature, values provided in the table are linked to the remaining state of health (SOH) of 80% nominal capacity, matching a typical replacement criterion for automotive applications. In this paper, we use a simple estimate for solely time-dependent calendric aging processes as well as a charge throughput-dependent cyclic aging model. The values of calendric lifetime ( L i f e C a l 80 % ) provide a reference value for storage degradation to 80% SOH at 20 °C temperature, when no charge throughput is applied. To describe the cyclic aging ( L i f e C y c 80 % ) caused by energy throughput in the battery storage, a correlation with full equivalent cycles (FEC), based on the definition by Fuchs et al. [27], is used:
FEC = 0.5 × 1 t S O C ( t ) d t   0.5 × | P b a t t | d t E b a t t n o m .
The factor of 0.5 results from the conversion of charge throughput to full cycle counting consisting of one charging and one discharging process. SOC denotes the state of charge, P b a t t the power flow via the battery, and E b a t t n o m the nominal energy capacity of the battery. A theoretical maximum charge throughput is defined via L i f e C y c 80 % , i.e., the number of F E C until 80% capacity is reached if there were no calendric aging. To formulate battery aging for subsequent modeling, the following equations are derived:
a g i n g c a l = Δ t L i f e C a l 80 % .
a g i n g c y c = 0.5 × | P b a t t | d t L i f e C y c 80 % × E b a t t n o m .
In accordance with Schmalstieg et al. [28], a superposition principle is used to estimate the overall aging:
a g i n g t o t = a g i n g c a l + a g i n g c y c .
As such, a parameter value of a g i n g t o t = 0 corresponds to a fresh, unused battery, whereas at a g i n g t o t = 1 , the remaining capacity of the battery is 80% of its original value as a result of calendric time and battery use. Further use of the storage system with a g i n g t o t > 1 might be allowed if the replacement of storage is set to a remaining capacity below 80%, as further described below. A detailed analysis and validation of battery performance and aging models in the context of such techno-economic applications is given in [29].
Table 2 also summarizes the economic parameters of the storage system. In this study, the investment costs of different battery types for BESS and the inverter coupling are analyzed independently. The values listed in the table are derived from a recent detailed market survey with n = 445 storage systems using a fit to the systems with lowest purchase prices [15]. They are discussed in more detail in a separate publication [30]. We attribute the lower fixed price for NMC storage compared to the price offset determined for LFP and PbA systems mainly to synergy effects attainable for storage systems that have been developed for the electric vehicle automotive market (relying mostly on NMC-based battery chemistry).
For the sole battery storage investment without an inverter, the following price structure is considered:
C B a t t ( E b a t t n o m ) = C f i x + C v a r , B a t × E b a t t n o m .
where C B a t t represents the price of the battery, C f i x is the fixed price including all peripheries and housing of storage, and C v a r , B a t is the energy specific price of a storage system. The storage maintenance cost within the battery lifetime is negligible and not considered herein. Furthermore, the separate installation cost of the storage system is not taken into account; such costs are strongly linked to the PV installation cost and may vary strongly for individual households. For the inverter systems, the following assumptions are made: one way conversion efficiency η i n v = 97.5 % , calendric life of 20 years, and a variable cost of approximately C v a r , i n v = 155   / k W (see also Table 3). Data used was derived from an internet market survey on standalone DC/AC inverters and expert interviews with leading brand inverter manufacturers [15,31]. As most PV-BESS package batteries and inverters are in one casing, no separate fixed costs for inverters are assumed but are given as part of the overall storage fixed cost C f i x .
As such, the overall cost C s t o r a g e for the energy storage system including battery storage with energy content E b a t t n o m , inverter with nominal power P i n v n o m , and all peripherals cost C f i x totals to:
C s t o r a g e ( E b a t t n o m , P i n v n o m ) = C b a t t e r y ( E b a t t n o m ) + C i n v e r t e r ( P i n v n o m ) = C f i x + C v a r , b a t t × E b a t t n o m + C v a r , i n v × P i n v n o m .

2.3. Economic and Legal Framework for Battery Energy Storage Systems

For the economic framework refer to Table 4. A retail energy price of 28.69 ct€/kWh and feed-in tariff of 12.31 ct€/kWh are assumed, in accordance with a retail price analysis and EEG (“Erneuerbare Energien Gesetz”—German renewable energies act), which granted feed-in tariffs for PV installations in Germany for 2016 [32,33]. Furthermore, in accordance with German regulations, a feed-in limit of f n o E E S = 70 % has to be taken into account for all residential PV installations. This means that power exceeding the feed-in limit P f e e d , m a x = f n o E E S × P p e a k , P V may not be injected from the household back to the grid. Instead, this additional power can be either stored in a battery or an unfavorable curtailment becomes effective (i.e., regulatory forced dissipative energy loss at the PV generator/inverter). It is worth mentioning that, for storage installations taking advantage of a government funded subsidy program on home storage systems, the PV grid feed-in regulation is enforced with a more strict curtailment rate of 50% [34]. For such partially subsidized systems, a discount of storage system investment may be obtained. As such, for subsidized systems with discount rate r s u b s i d y , the storage investment cost is given as:
C s t o r a g e s u b s i d y = C storage × ( 1 r s u b s i d y ) .

3. Linear Optimization of Photovoltaic-Battery Energy Storage Systems

The structure of the optimization problem addressed in this study can be represented by a mathematical model. The objective function and the constraints have linear relationships, meaning that the effect of changing a decision variable is proportional to its magnitude. This makes linear programming (LP) well suited to solve the optimization problem considered here, due to the linearity of the decision variable on electricity price, feed-in tariff, and other parameters. While some aspects of battery system operation are not linear, they can be linearized to fit the requirements of LP. e.g., models of BESS aging processes can be reductively applied to obtain a linearized degradation function. In addition, linear optimization provides unambiguous, repeatable results with modes and controllable computational effort, compared to other optimization methods typically based on heuristics or meta-heuristics.
The economically optimal battery storage component sizing for a household equipped with PV and an energy storage system is obtained using LP. The load demand and PV-generation profiles considered in this study cover one full year, to capture all seasons with their characteristic, distinct patterns of PV-generation, storage, and grid energy transfers. As the intent is to minimize electricity cost and maximize the revenue generation on the profit side, two types of profits are considered: the profit attainable by feeding energy into the grid, and the avoided cost stemming from the reduced need to purchase energy when a storage system is installed. On the annual cost side, a fraction of the total cost of the energy storage system C t o t is considered. This fraction is determined based on a battery storage technology-specific aging analysis as further described below. The presented cost flow analysis takes into account the discounted storage cost caused by degradation.
Data used for simulations was averaged with a resolution of Δ t r e s = 15   min , a value that provides a reasonable compromise between the accuracy of the obtained results and computational speed [35]. As such, the one-year simulation time frame covers a total of 35040 time intervals, indexed with variable i .
All variables and parameters considered in this study are described in 
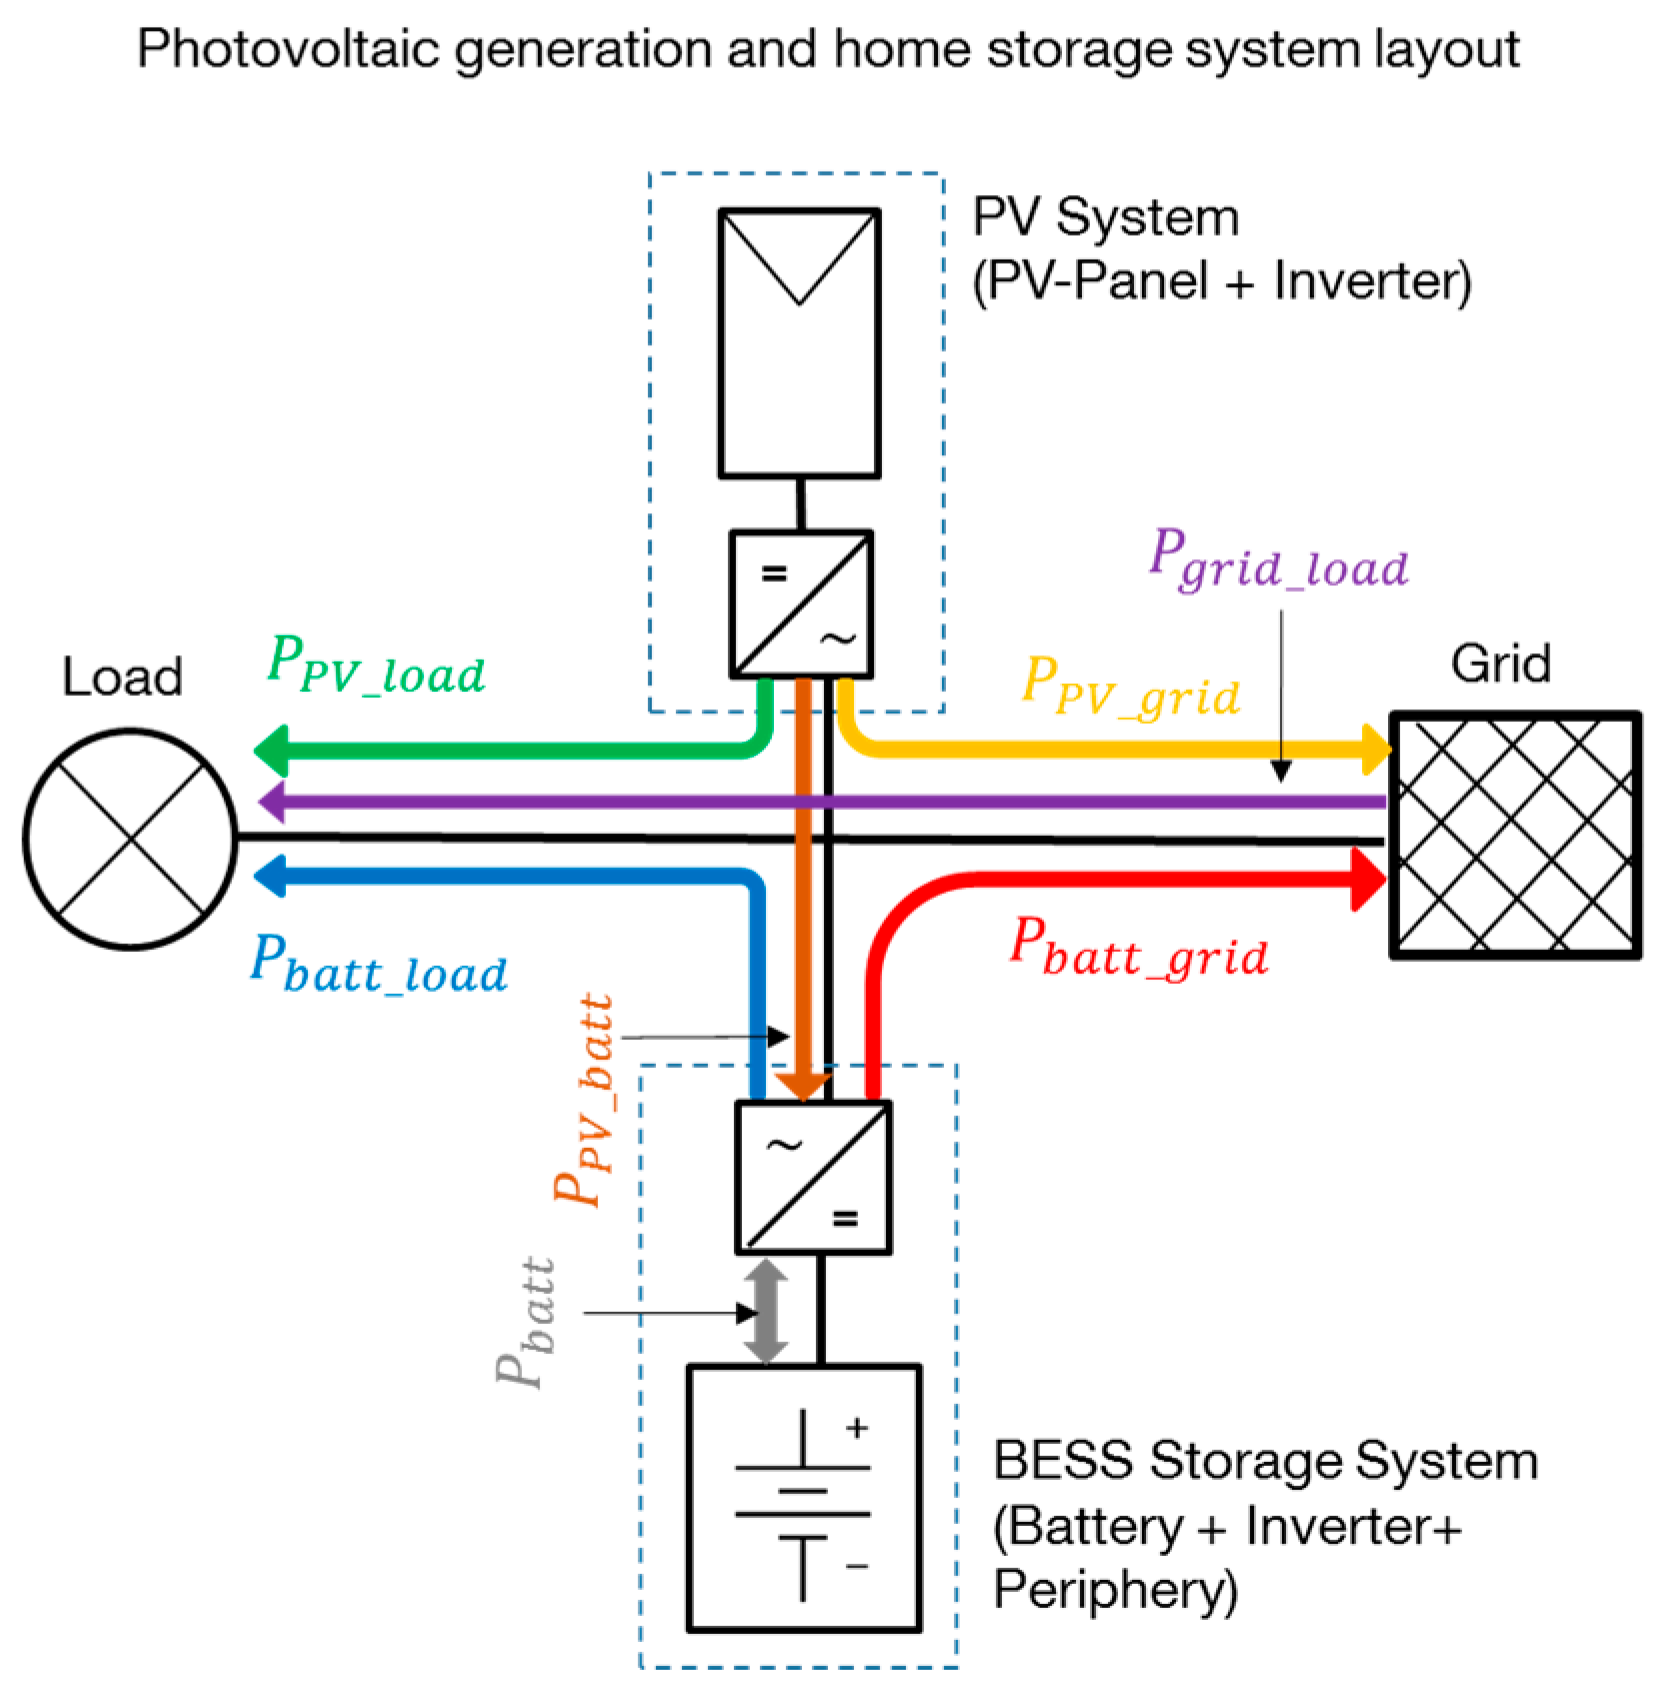
Table 5. The locally generated PV power ( P p v i ) is first used to satisfy the local demand. When the local power production is greater than the demand, the surplus power is preferably transferred to the battery ( P p v b a t t i ) and stored for later use. If there is still additional energy available, the surplus power is injected into the grid ( P p v g r i d i ) or curtailed via feed-in limitation ( P c u r t a i l i ). The following equation considers all power flows from the PV generator:
P p v i = P p v l o a d i + P p v b a t t i + P p v g r i d i + P c u r t a i l i .
To avoid back-feeding of power injected into the grid from PV system owners, a feed-in limitation is enforced. Any power above the limitation threshold value must be discarded as a curtailment loss, i.e.,
P p v g r i d i + P c u r t a i l i P f e e d , m a x .
To meet the electrical demand ( P l o a d i ) the system first attempts to use power from local generation ( P p v l o a d i ). If this is not sufficient, power is drained from the battery ( P b a t t l o a d i ). As the last resource, the system draws power from the grid ( P g r i d l o a d i ). Consequently, demand is comprised of the following three components:
P l o a d i = P p v l o a d i + P b a t t l o a d i + P g r i d l o a d i .
The bidirectional power flow from the storage inverter to the battery is stored in an auxiliary variable ( P b a t t i ) and correlated with the inverter efficiency η i n v :
P b a t t i = ( η i n v × P p v b a t t i ) 1 η i n v × ( P b a t t l o a d i   + P b a t t g r i d i ) .
where η i n v is the average one-way efficiency of the inverter. The reciprocal efficiencies are the battery charge power P p v b a t t i   and the discharge power P b a t t l o a d i + P b a t t g r i d i , both limited by the nominal power flow from the inverter to the battery:
0 P p v b a t t i   P i n v n o m .
0 P b a t t l o a d i + P b a t t g r i d   P i n v n o m .
where P i n v n o m corresponds to the inverter nominal size. The battery energy content at time step i ( E b a t t i ) satisfies the recurrence relation:
E b a t t i = ( E b a t t i 1 × S D b a t t d ) + ( η b a t t × P b a t t i × 1 h Δ t r e s ) .
where S D b a t t represents the self-discharge factor of the battery and d = 96 is a conversion factor of the number of time steps per day. The energy content of the storage system is further confined by an upper boundary that decreases upon usage and aging according to the SOH:
E b a t t i E b a t t u s e a b l e × S O H i .
The SOH is defined as the irreversible capacity fade over time, related to the nominal battery capacity, and E b a t t u s e a b l e is a fraction of the total energy content of the battery installed:
E b a t t u s e a b l e = E batt nom × ( S O C m a x S O C m i n ) .
For battery usage in stationary and automotive applications, it is useful to define an end of life (EOL) criterion, which is often linked to the SOH with a certain percentage value α R e p l a c e [36]. This percentage value also defines the time of battery replacement:
EOL S O H t = E O L α R e p l a c e .
In many cases, α replace = 80 % or 70 % is used for automotive applications. However, lower values are often stated for less demanding residential storage applications [6,37]. In this study, α replace = 60 % is used as the replacement parameter, matching e.g., the warranty conditions of the Tesla® Powerwall product. Using the definition of a g i n g t o t = 1   at   S O H = 80 % , the SOH condition reads:
SOH = 1 a g i n g t o t × 0.2 .
The time evolution of SOH also satisfies the recurrence relation:
S O H i = S O H i 1 ( a g i n g c a l i + a g i n g c y c i ) × 0.2 .
Using Equations (1) and (2), the calendric and cyclic aging can be estimated as:
a g i n g c a l i = i × Δ t res L i f e C a l 80 % .
a g i n g c y c i = a g i n g c y c i 1 + 0.5 × | P b a t t i × Δ t r e s | E b a t t i × 1 L i f e C y c 80 % .
As such, the additional cyclic aging degradation of time step i is estimated by the energy throughput in that time step ( P b a t t j × Δ t r e s ) divided by the energy content of the system E b a t t i . Additionally, it is normalized with the factor 0.5 and the technology specific cycle life indicator   L i f e C y c 80 % . Similarly, the SOC can be expressed as:
S O C i = E b a t t i E b a t t u s e a b l e × S O H i .
The optimal solution must satisfy all constraints described above. It aims to reduce the overall cost by minimizing the expenses for energy purchase and the implicit cost caused by battery degradation. This cost model is divided into three components, i.e.,
minimize   C t o t = C b u y _ e n e r g y R s e l l _ e n e r g y + C s t o r a g e _ d e g s u b s i d y   .
subject to constraints in equations and inequalities (8)–(22).
The first component C b u y _ e n e r g y comprises the cost of energy purchased from the grid, while the second component R s e l l _ e n e r g y is the revenue from PV energy generation exported to the grid. These two components are evaluated as follows:
C b u y _ e n e r g y = i C b u y × P g r i d l o a d i .
R s e l l _ e n e r g y = i C s e l l × ( P p v g r i d i + P b a t t g r i d ) .
where C b u y and C s e l l are the retail electricity price and feed-in tariff, respectively. The third component estimates the home storage system degradation cost that can be represented as:
C s t o r a g e _ d e g s u b s i d y = Δ S O H / ( 1 α R e p l a c e ) × C b a t t e r y s u b s i d y ( E b a t t n o m ) + C i n v e r t e r s u b s i d y ( P i n v n o m ) × Δ t / T i n v
where   Δ t denotes the timespan covered with the simulation (here one year) and Δ S O H the total battery aging. The full battery related cost is then calculated in consideration of the initial installation investment cost and the 22% subsidy scheme available in the German market.
For economic assessment, the cash flow for a household with the best-sized PV-BESS installed is compared against the cash flow for a household with the same PV-generation but no storage system installed. Therefore, the energy expenses, feed-in remuneration, and storage degradation cost for a PV-HESS household are related to the energy expenses and feed-in remuneration for a household with no storage:
R s a v i n g s B E S S = ( C b u y e n e r g y B E S S + R s e l l e n e r g y B E S S C s t o r a g e _ d e g s u b s i d y ) ( C b u y E n e r g y n o S t o r a g e + R s e l l e n e r g y n o S t o r a g e ) .
For profitability analysis, we derive the yearly ROI that can be calculated considering the battery’s savings in each year of operation, the initial investment cost, and the storage system life:
R O I = R s a v i n g s B E S S C s t o r a g e s u b s i d y C s t o r a g e s u b s i d y .

4. Results and Discussion

Optimization was performed for the three battery technologies (PbA, LFP, and NMC) with the parameters listed in Table 2. The load profiles were based on a reference smart meter-recorded dataset obtained from HTW Berlin and averaged to 15 min intervals [
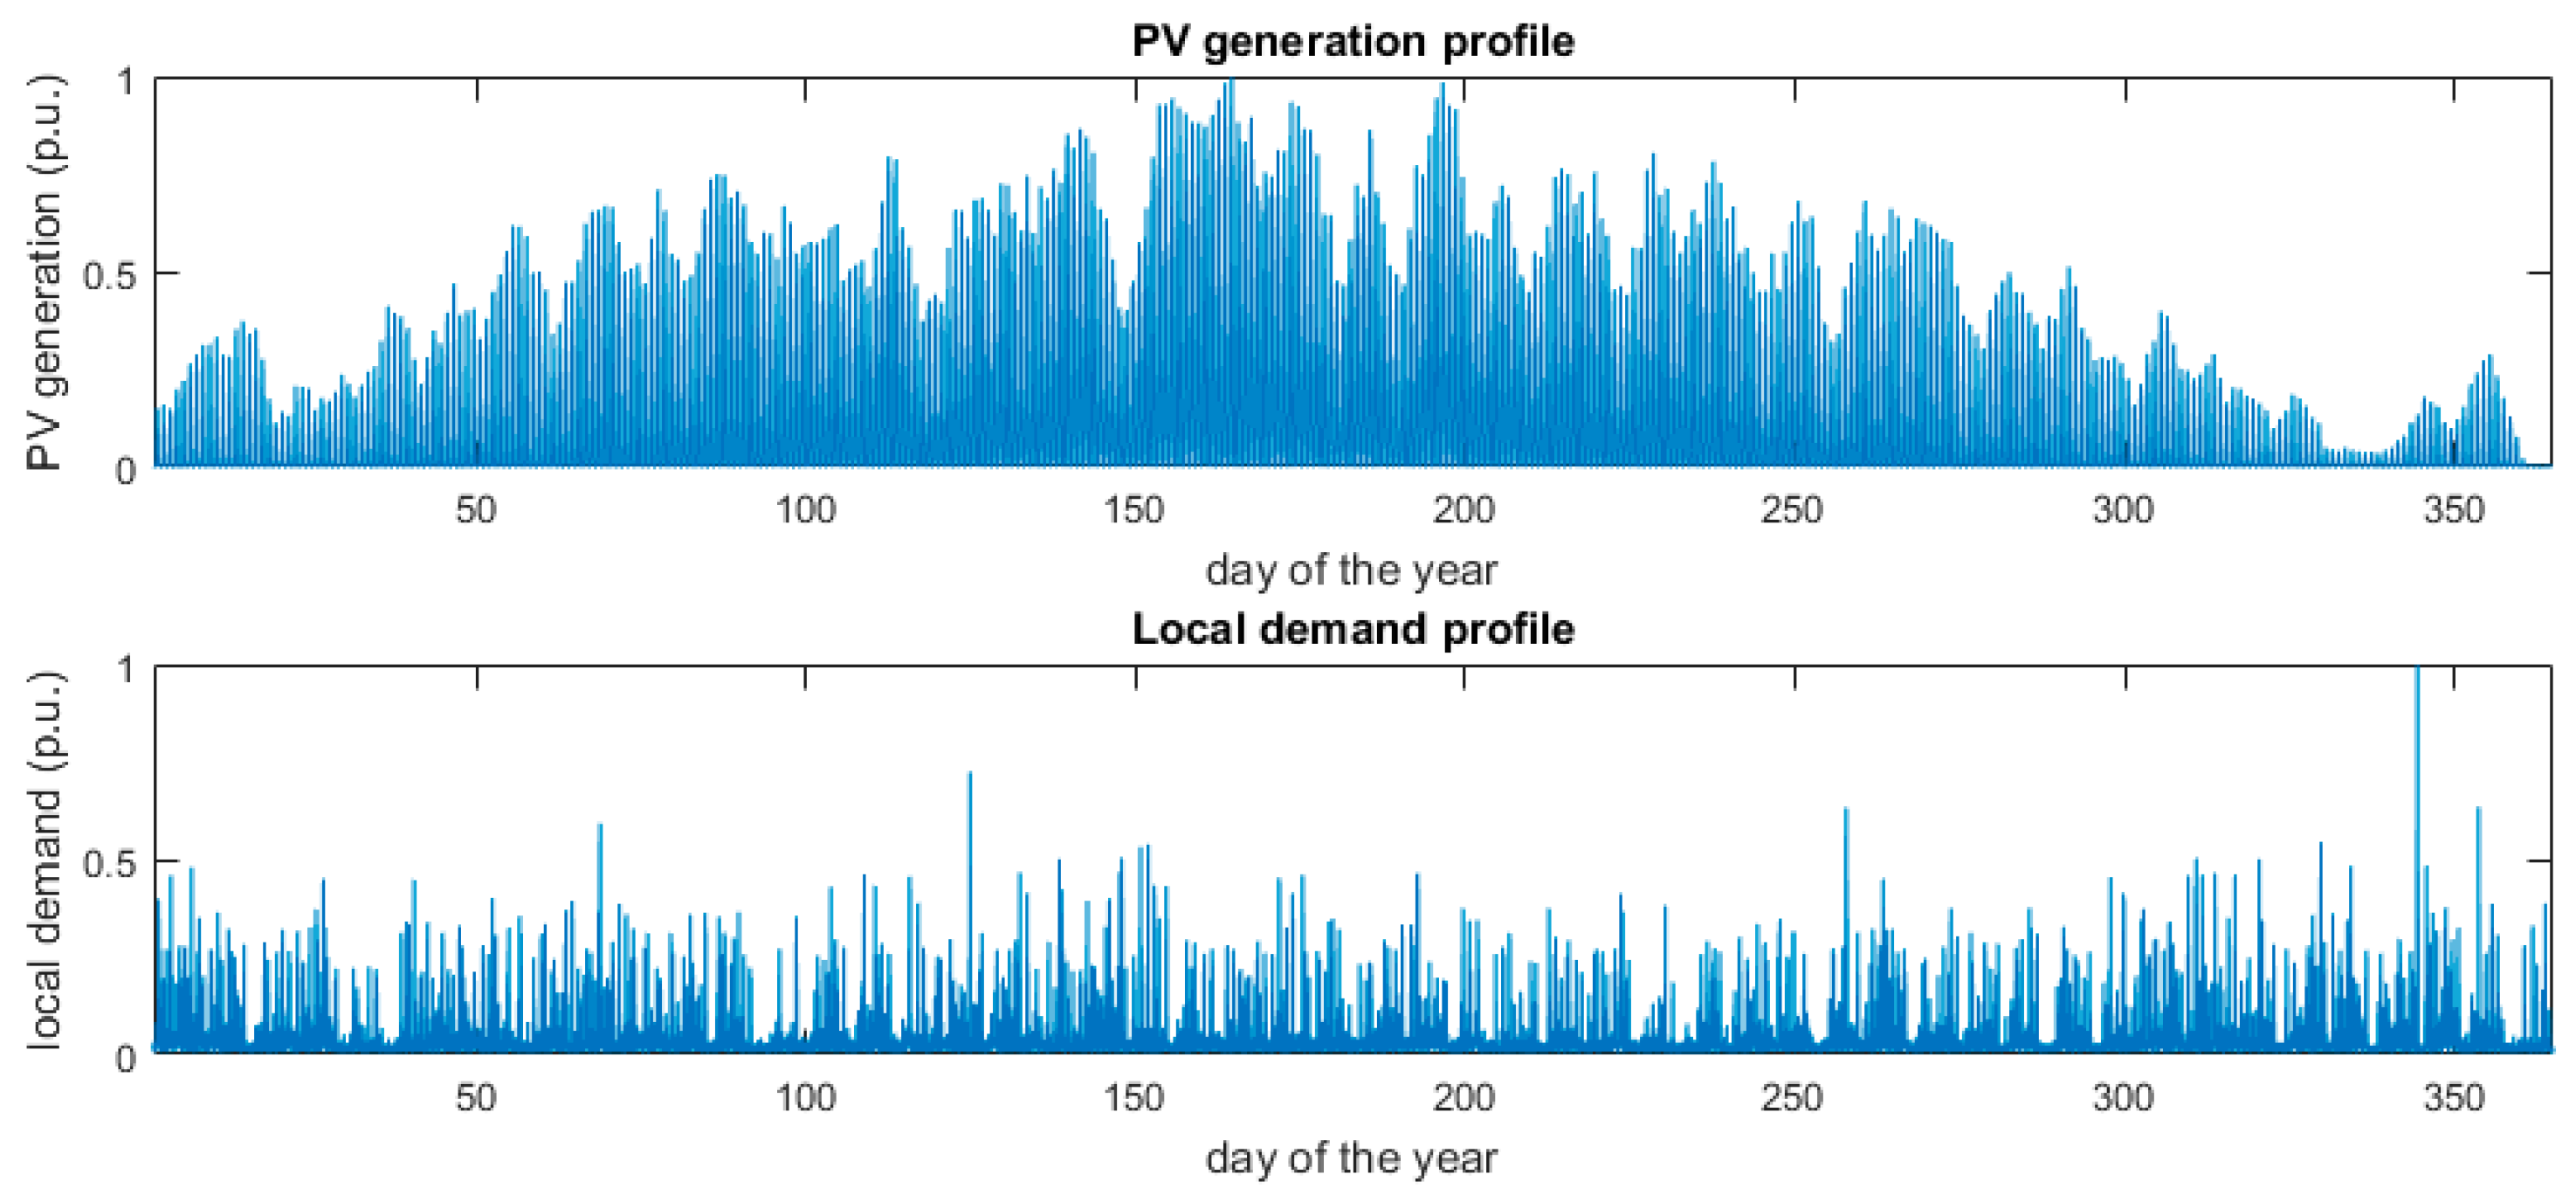
38]. The PV-generation data was acquired for one full year (2014) using a rooftop-mounted solar generator in downtown Munich, Germany. The profile data is shown in Appendix B. The one second resolution PV-generator output power data was normalized to the peak power of the system and preprocessed by averaging over the timeframes of 15 min. To obtain a variation of load demand and PV-generation profiles, both time series were linearly scaled to the desired values.
The linear optimization was implemented in MATLAB® (MathWorks, Natick, MA, USA) code using a dual-simplex algorithm, which is based on a conventional simplex algorithm on the dual problem [39]. Each one year system simulation (with co-optimization of storage and inverter size, and a 15-min time resolution for all power flows in the system) took approximately 300–800 s on a Dell® (Dell Inc, Round Rock, TX, USA) XPS 15 system with Intel i7, depending on the number of iterations necessary for the linear optimization.
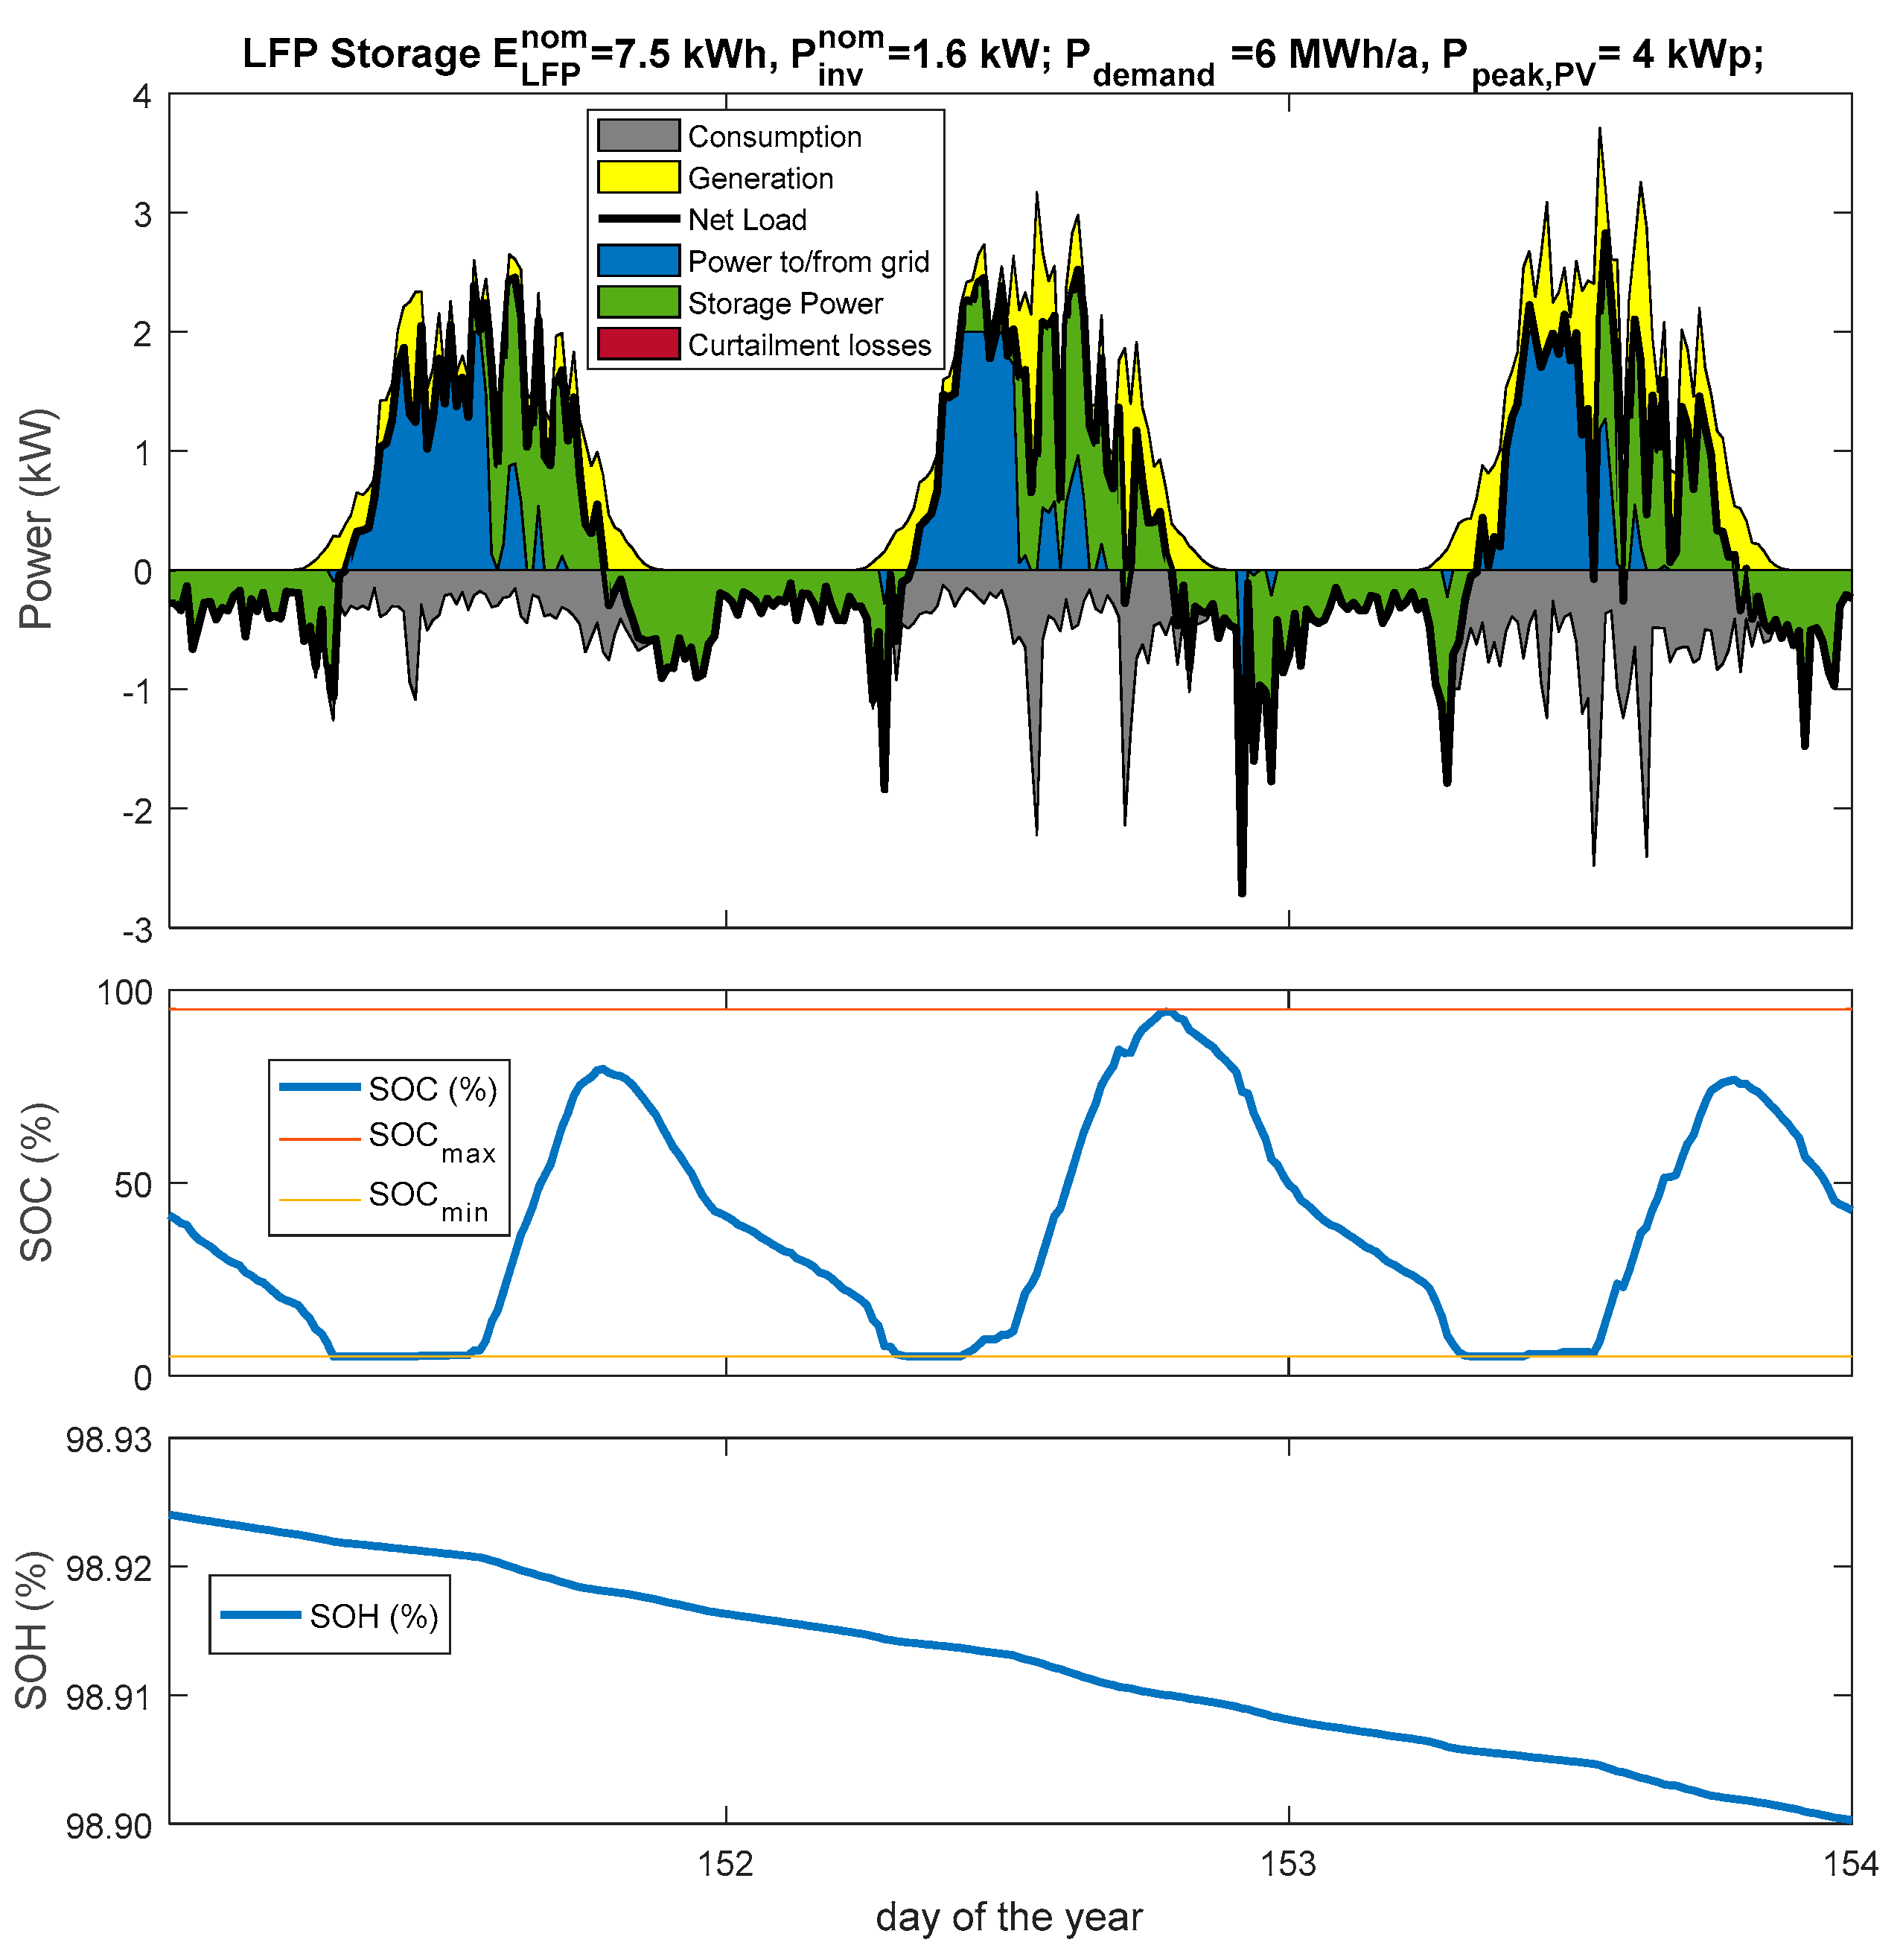
A detailed analysis is conducted for an exemplary PV-BESS system using LFP battery chemistry for a typical four-person household (annual load of 6 MWh) and a small size PV-generator (PV size of 4 kWp). For this case, the one-year optimization calculates the optimal storage size of E b a t t n o m = 7.5   kWh and inverter nominal power of P i n v n o m = 1.6   kW . Figure 2 shows the power flows for an exemplary three-day period during summer (first week of June) within the system using these optimally sized components. The top panel shows the local household consumption (grey area below zero), the PV generated power (yellow area above zero), as well as power flow covered by the storage system (green area). The second and third panels show the evolution of SOC and SOH during the same time span, clearly showing the periodically changing charge level of the storage system and its gradual degradation.
It can be seen that the optimization process maximizes profit using the full capacity of the storage system: it charges the battery up to the maximum allowed SOC during daytime and fully drains it over nigh. For almost all tested scenarios, linear programming using complete data of load and generation successfully avoids curtailment losses. To achieve this optimal operation of BESS, the generated power is sometimes split. This can be observed during the second day shown in Figure 2; power is partly fed to the grid ( p P V g r i d   2   kW ) and partly used to charge the battery at a rate limited by the inverter size ( p b a t t i n o u t     1.6   kW ) . At all times, the resulting storage charging strategy favors the lowest cost, i.e., it prefers battery usage over curtailment of energy or power exchange with the grid, whenever possible. Furthermore, self-discharge losses are kept at a minimum by charging the battery in the later period of the day (except when feed-in limitations would induce curtailment). A closer look at the spiky loads for the second day shown in the figure reveals that there are short time periods when power is drawn from the grid, despite the fact that the battery is still above its minimal SOC. This can be explained by the limited size of the inverter (here P i n v n o m = 1.6   kW ) that does not allow full load saturation from the battery. In fact, a more powerful inverter would allow further reduction of the amount of energy drawn from the grid, but these small savings would not justify the additional cost of a larger inverter.
The third plot in Figure 2 shows the evolution of battery degradation during the three-day timespan; a continuous degradation progress (calendric aging) superimposed to additional charge throughput dependent degradation (cyclic aging) is apparent, albeit at a very slow rate.
Over the course of one year, the investigated storage system executes 202 FEC and provides electricity cost savings of about 238 €, when compared to a household with no storage system installed. Note that the storage system does not execute a full cycle each day, a fact that is common to all storage systems and that can be mainly attributed to seasonal patterns.
Using Equation (7) for this optimally sized system, the cost of the subsidized storage system can be estimated as:
C s t o r a g e s u b s i d y ( LFP ,   7.5   kWh ,   1.6   kW ) = ( C fix , LFP + C var , LFP × 7.5   kWh ) × ( 1 r s u b s i d y ) + ( C var , inv × 1.6   kW ) ) × ( 1 r s u b s i d y ) 5743   + 193   = 5936   .
At the same time, due to the continuous calendric aging and daily cycling of the battery system, the SOH is reduced by 1.79% over the course of one year. When considering this degradation, the value of the storage system is reduced according to Equation (26):
C s t o r a g e _ d e g s u b s i d y = Δ S O H / ( 1 α R e p l a c e ) × C b a t t e r y s u b s i d y ( E batt nom ) + C i n v e r t e r s u b s i d y ( P i n v n o m ) × Δ t / T i n v = 1.79 % 40 % × 5743   + 193   × 1 20 267   .
As a result, the overall ROI of the system is:
R O I = R s a v i n g s B E S S C s t o r a g e _ d e g s u b s i d y = 238   267   267   = 10.86 % .
This calculation reveals that, for the example parameter setting chosen here (4 kWp PV and 6 MWh annual load demand), even the optimally sized LFP storage system does not provide positive ROI. A closer look at the literature on the economics of PV-BESS systems confirms that such negative ROI is well in line with other studies based on similar parameters [5,6]. It should be noted that in contrast to this work, most other studies discuss the scenario of future rising electricity retail prices resulting in positive ROI numbers. To achieve positive ROI for this specific storage system, the price for the 7.5 kWh battery would need to drop by about 12% at below 5100 € (instead of 5743 € assumed here).
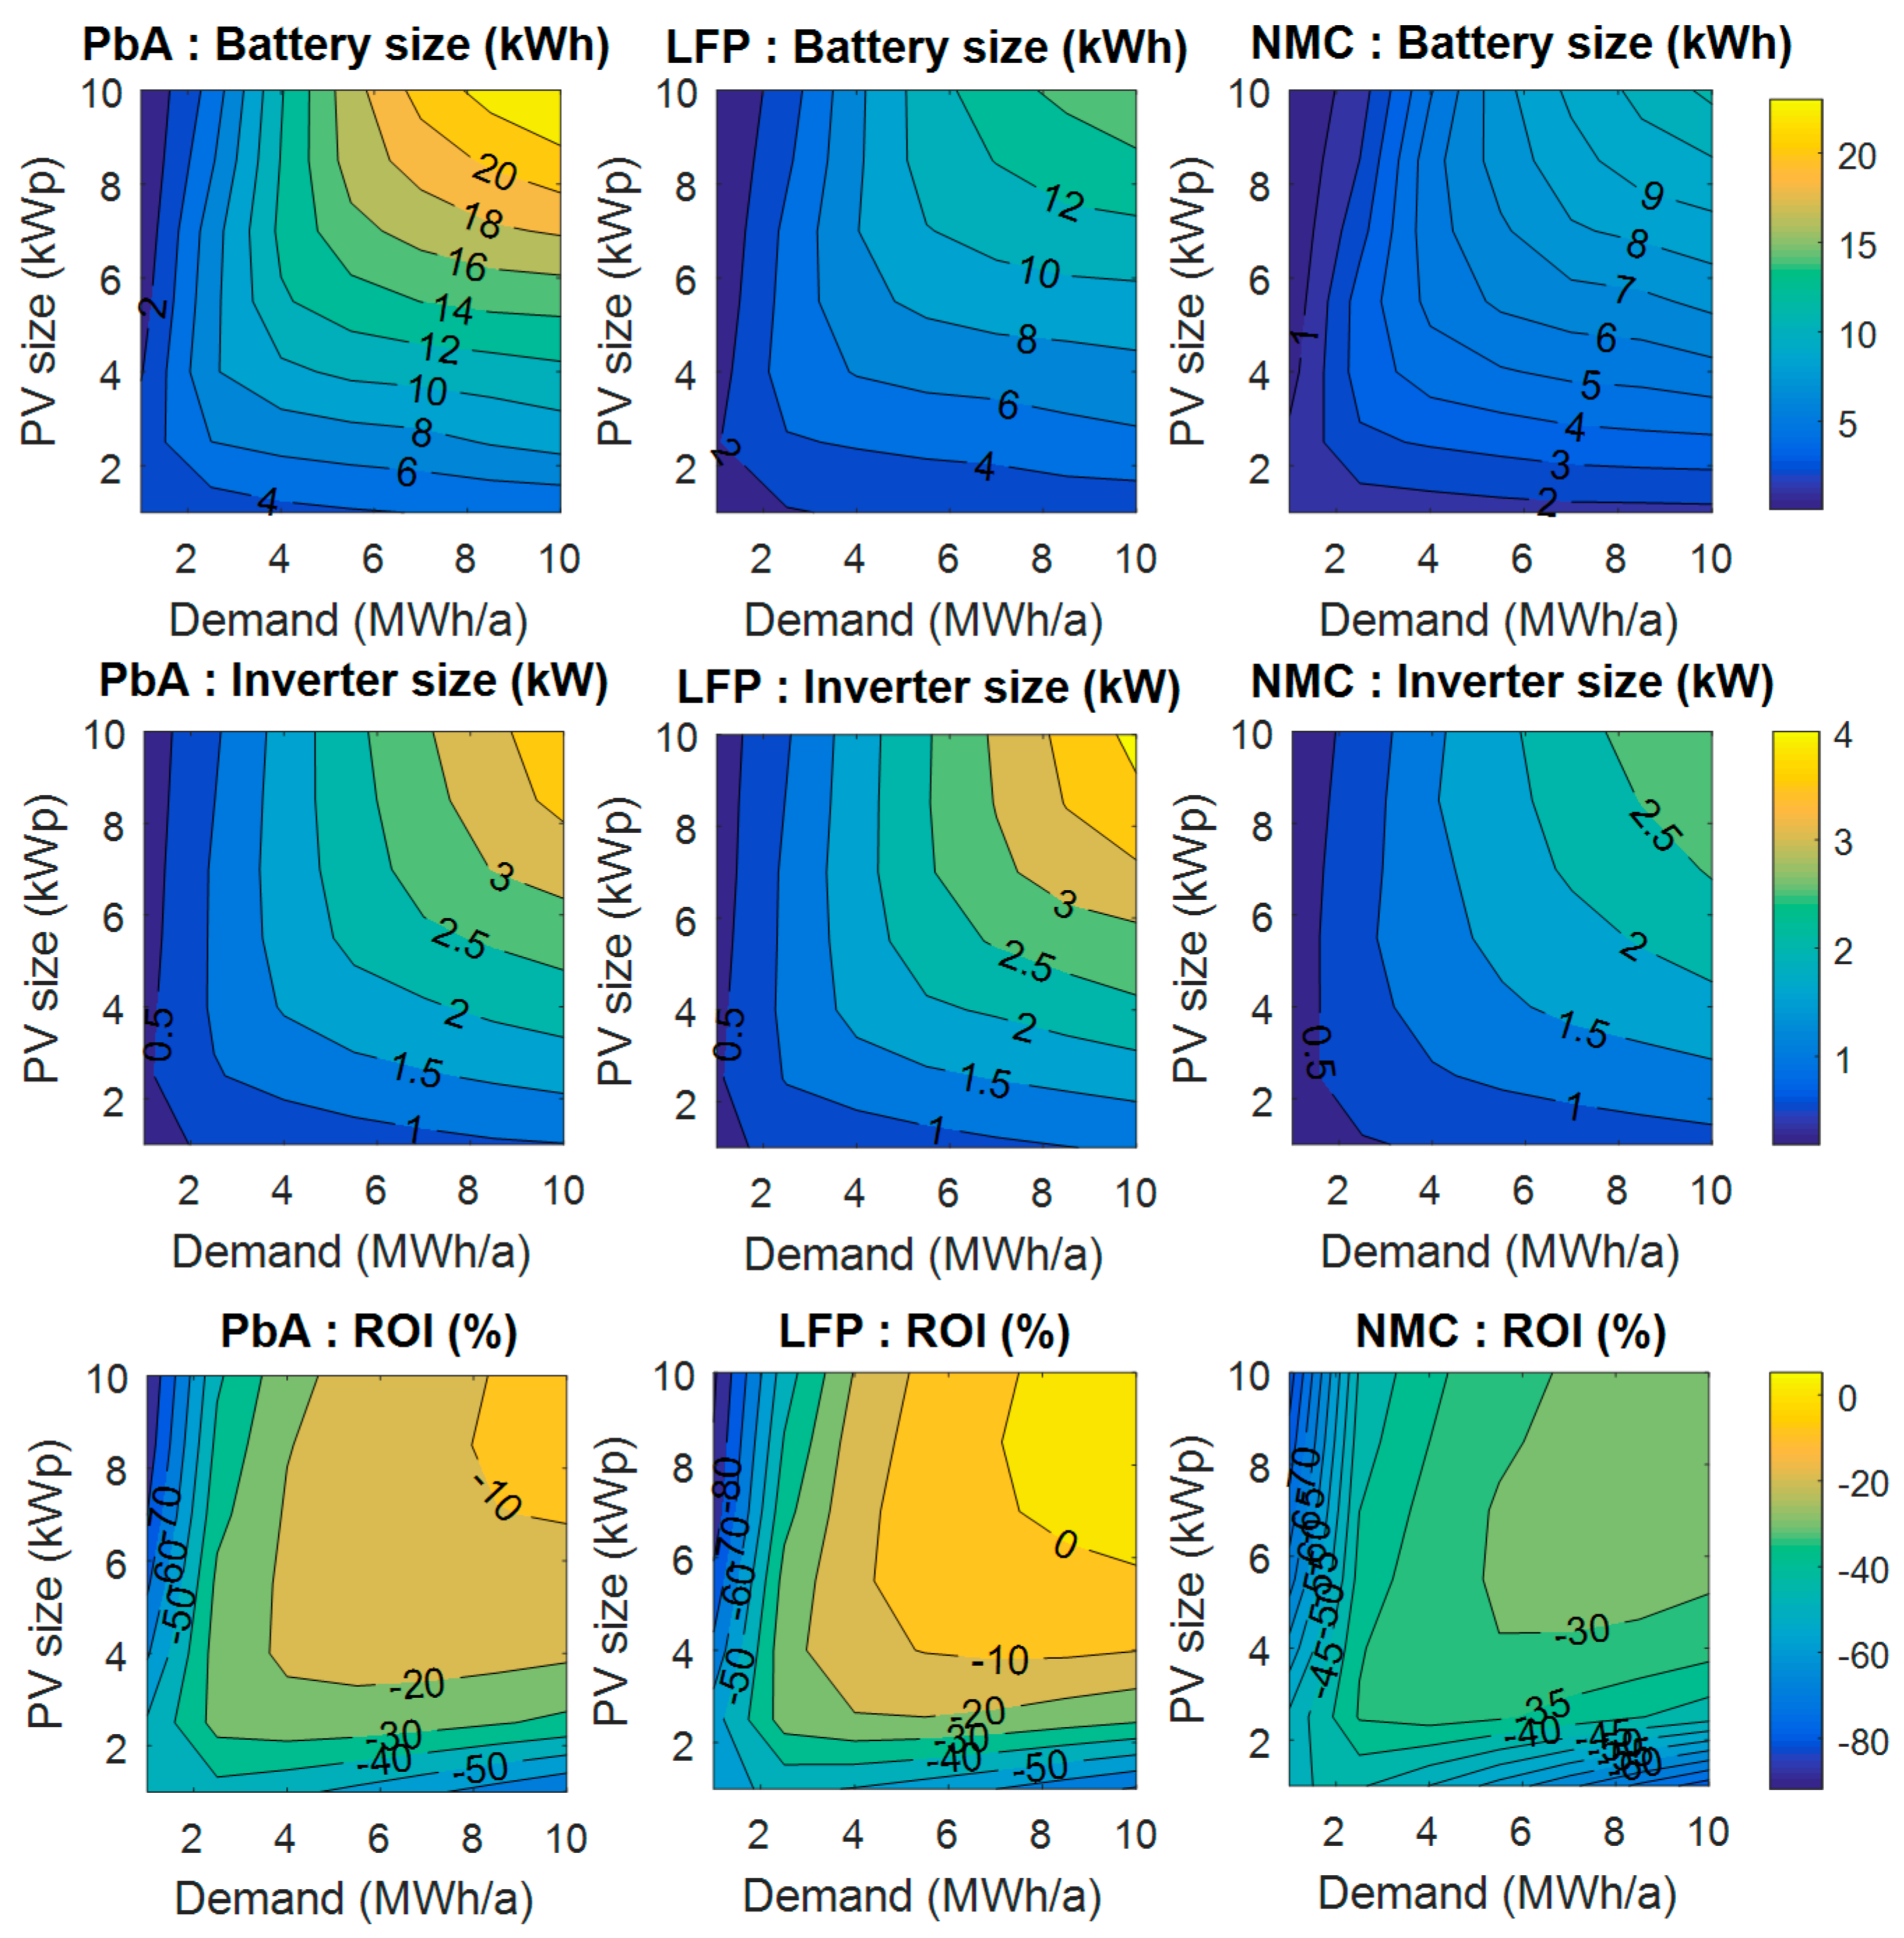
For a more systematic comparison of the three examined battery technologies, consider the group of contour plots shown in Figure 3. Optimization runs were performed for a variety of load demand and PV-generation values using all three battery systems (PbA on the left, LFP in the middle, and NMC on the right). The upper row of plots shows the optimal size of the respective battery, whereas the three plots in the middle row reveal the optimal inverter size for each storage system. The bottom row depicts the resulting maximum attainable ROI for the three systems. They compare the profit attainable for a household with a PV-BESS against the cost and revenue for a household with a PV system only.
As an overall trend, homes with large load and PV size require BESS with increased storage and inverter size. For the PbA technology, significantly larger systems are economically favored in comparison to lithium-ion based systems. This can be attributed to a lower average price per kWh of PbA batteries compared to the alternatives. However, it should be noted that only 50% of the installed battery capacity is usable for PbA systems due to a smaller usable SOC range for this technology (see also Table 2).
Interestingly, the optimal nominal power of the inverter systems remains low. With the cost assumed in this work, the ratio between storage capacity and nominal inverter size should be chosen at values as low as 0.25 kW/kWh for optimal ROI results. Currently, ratios of 1 kW/kWh are often used in commercial systems. Thus, this finding can be used as a guideline for cost reduction of future residential BESS.
A general trend of better ROI for large PV and high load demand can also be observed. This can be explained when analyzing the cost structure of storage with a fixed offset price for the battery housing and periphery. As such, larger installations reduce the overall cost per installed kWh of storage.
In direct comparison, and using the battery parameters chosen herein, the LFP storage systems appear to be economically superior to both NMC and PbA systems for most tested scenarios. In fact, there is a small area, for PV systems > 6 kWp and a yearly load greater than 6 MWh, where slightly positive ROI values can be achieved with today’s costs. This shows that there is a good chance of BESS becoming economically viable with PV systems in the near future. Potentially increased retail electricity tariffs will further improve the ROI of a residential storage system installed in 2016. More importantly, the prices of storage systems are rapidly declining. A recent report listed 20% annual reduction in 2015 [3], and this cost decline is expected to continue in the following years, making future BESS likely more economically feasible. As a result, the ROI values shown here will likely turn positive within the next few years.
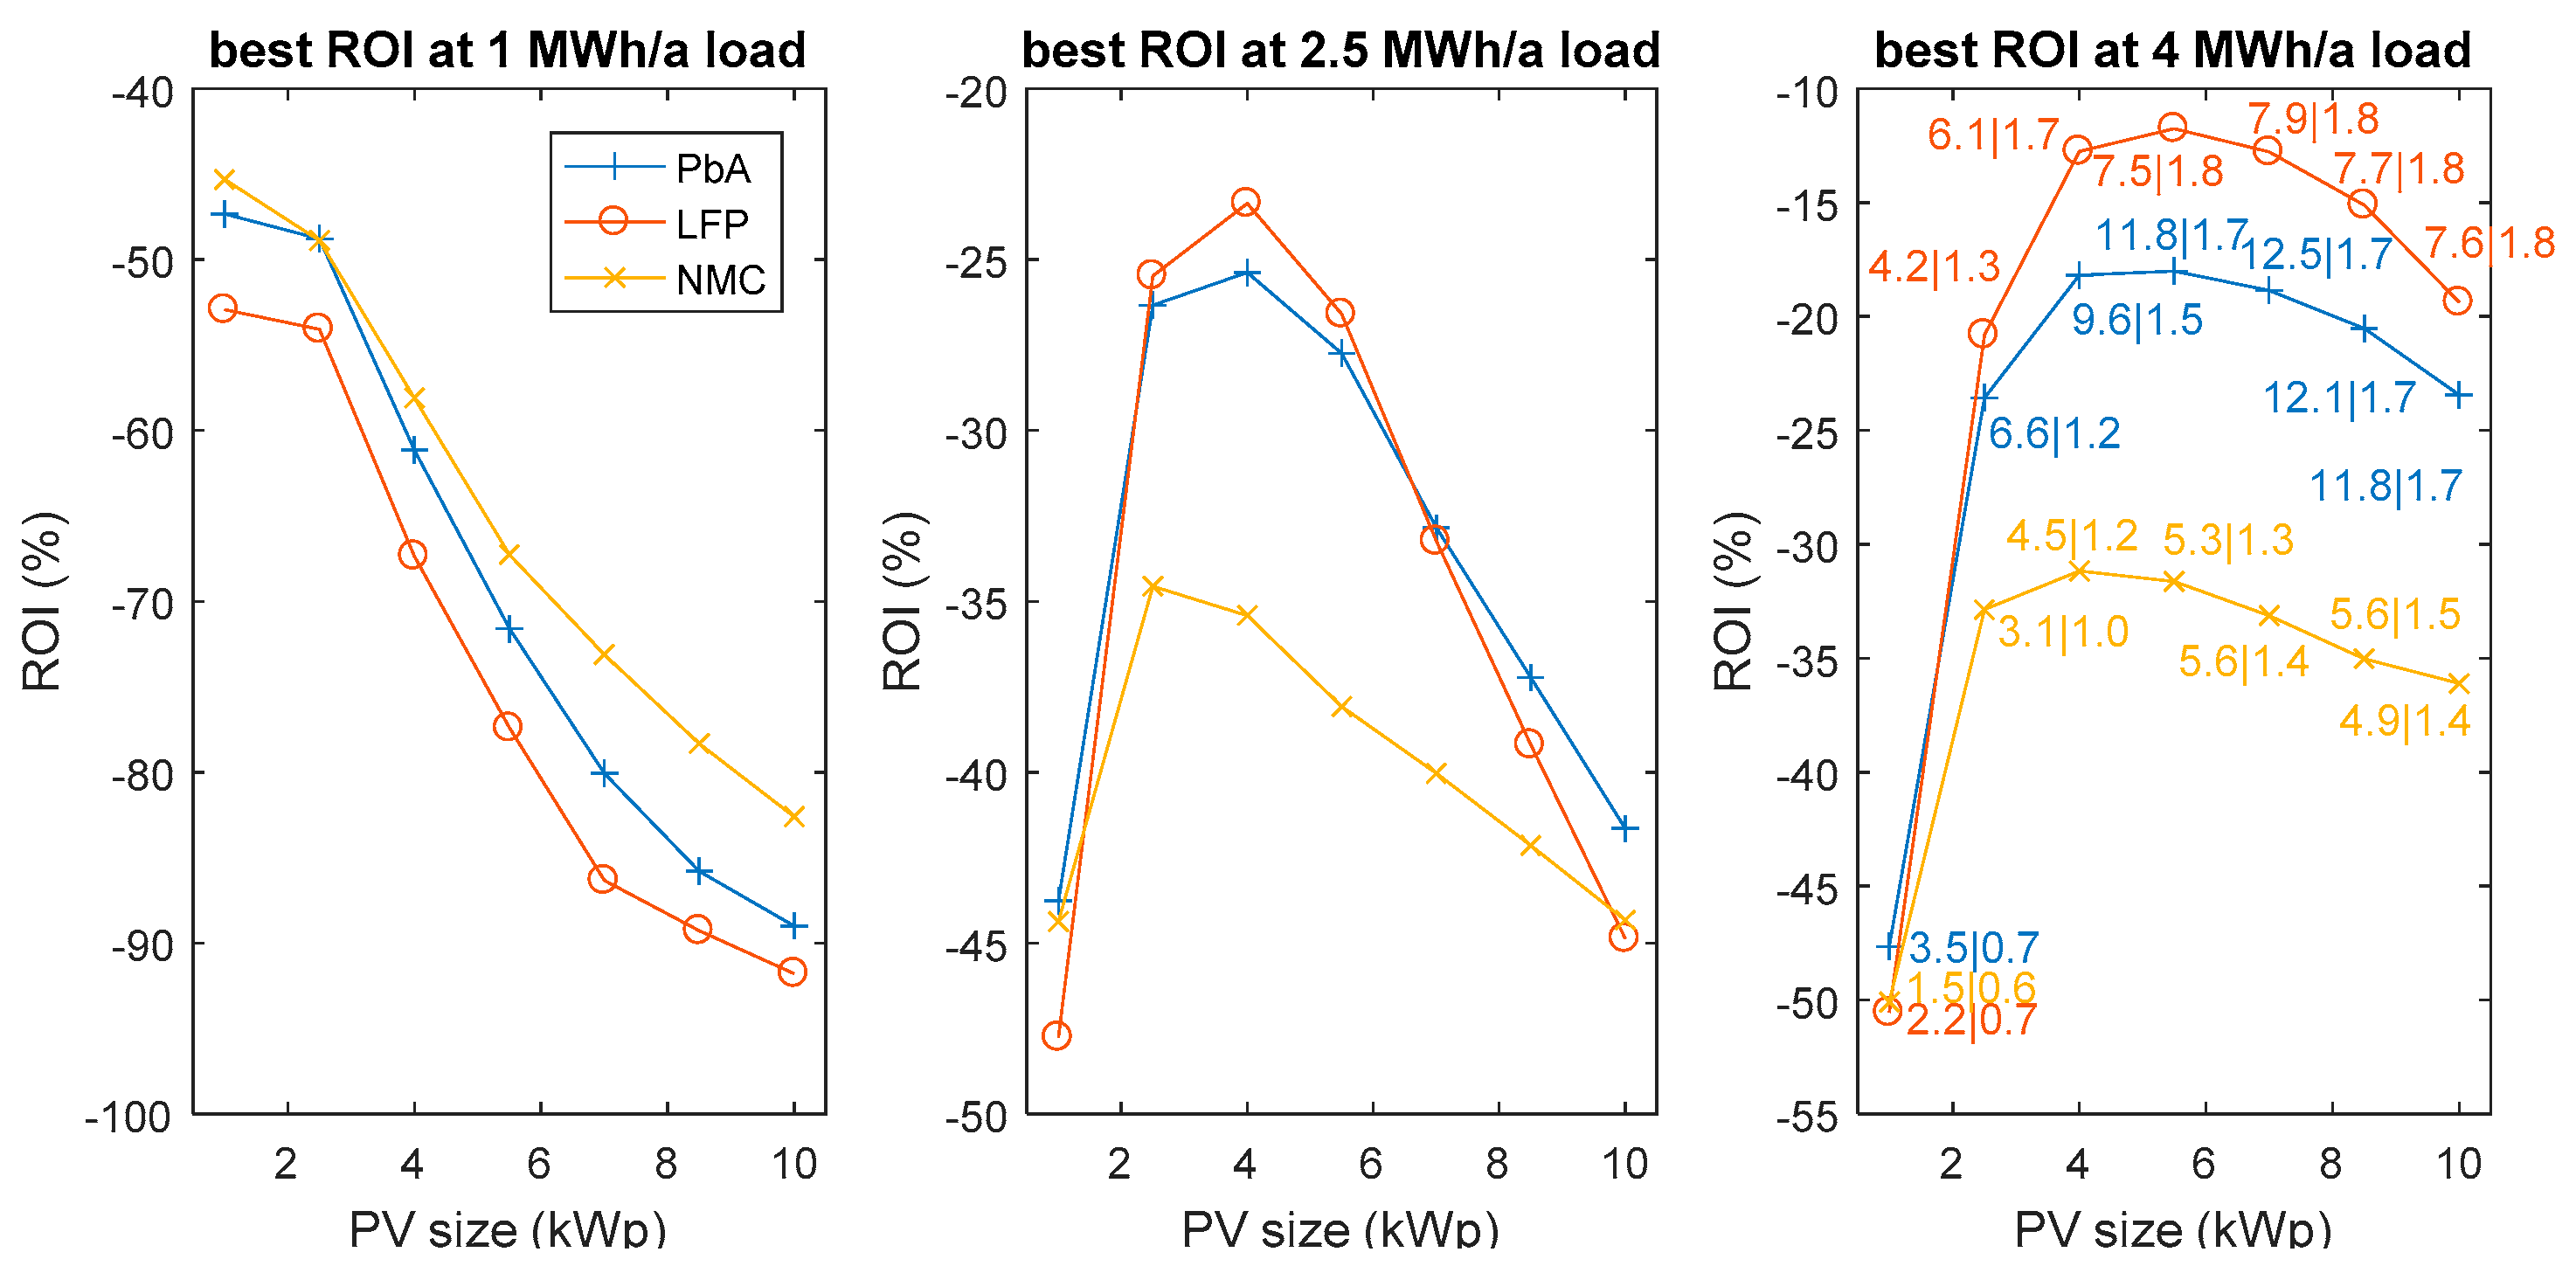
Refer to Figure 4 and Table 6 for a detailed comparison among the examined battery storage technologies. The three graphs depict the economically most favored settings in example cases with 1, 2.5, and 4 MWh annual load demand. The inset numbers in the right panel indicate the optimum sizing of battery and inverter for each simulation scenario (the first number indicates the optimum size of the storage system in kWh, the second number the nominal size of the inverter in kW). The overall shape of the ROI curves reveals the existence of scenario specific peaks. When a small PV generator is used, most generated power is used directly by local consumption. As the amounts of grid feed-in are small, storage cannot add much value to the system, and aging related costs clearly dominate the overall price of the storage systems. On the other hand, for very large PV installations, a significant portion of the local demand can be covered from PV-generation without storage. As self-supply levels are high, storage provides only small additional benefits. Interestingly, for different combinations of PV size and household power demand, PbA and NMC storage might be favored over a LFP storage solution. While for very small households the NMC system operates at the lowest cost, LFP surpasses PbA and NMC for households at 4 MWh annual load demand. For loads of 2.5 MWh LFP or PbA storage can be economically most viable, depending on the PV system size.
The fact that NMC performs best for small load demands and PV-generation can be attributed to the significantly lower fixed battery cost of NMC-based BESS systems. This advantage is most prominent for small storage system sizes ( 2   kWh ). Despite the more than 2.5-fold higher specific cost of the LFP system compared to PbA (752 €/kWh vs. 271 €/kWh), its better aging performance, higher conversion efficiency, and the increased usable SOC range makes it superior in most cases, especially if the battery has to withstand an increased number of FEC. Only for cases where the optimally sized PbA systems undergo less than or equal to 100 FEC per year, PbA may outcompete LFP, a scenario found at ratios of PV-generation to local demand of 2   kWp / MWh or higher.
To validate the optimization results presented in this study, we conducted 1-s resolved time series analyses of power flows using an in house developed storage assessment tool SimSES [5,6]. All performed comparisons match well, confirming the validity of results and analysis presented in this paper. For example, for LFP cell chemistry, the results of one year simulations for all tested load and PV generation cases differ by less than 0.5% for SOH and less than 3% for ROI. Such small deviations can be attributed to coarser discretization of validation points within the tool (0.5 kW inverter size and 0.5 kWh storage size) and to slight differences in the storage operational strategy, which was not optimized when using the validation tool.

5. Conclusions and Future Work

This article describes a linear optimization approach to find the most cost-effective BESS dimensioning matching a variety of residential load demand and local PV generation profiles. To allow a direct comparison of one PbA and two lithium-ion batteries, the optimization problem formulated in this work maximizes the electricity cost savings while minimizing the storage specific degradation costs.
The optimization provides unambiguous, repeatable results with controllable computational effort and reveals the best suited sizing of battery storage and the inverter based on present retail price information. Within the tested scenarios, the best economical results have been attained using LFP storage systems at high load demand (>6 MWh annual demand) and local generation (>6 kWp PV generation). However, it must be clearly stated that, considering the storage degradation and price information as presented in this work, the profit attainable remains very small and peaks at ROI = 5% per anum. In fact, the ROI values remain negative for most considered scenarios. Nevertheless, a comparison of the three storage systems reveals that different storage technologies perform best for specific combinations of PV generation and local demand. Optimally sized NMC storage systems appear most economical for households with very small local demand (2 MWh/a), whereas PbA-based systems show some advantages for a mid-scale demand (2.5 MWh) and high PV generation (>7.5 kWp). At higher local electricity demand ( 4 MWh) coincident with higher PV generation ( 3 kWp), LFP batteries provide better results than PbA and NMC.
The obtained results can be used also to determine the optimal ratio of power electronics sizing (rated power of the inverter) to the installed battery capacity. For example, for a typical residential scenario of 4 kWp PV and annual local demand of 6 MWh, about 0.25 kW rated power per 1 kWh installed battery capacity shows optimal performance. This detailed analysis of optimal power-to-energy ratio could also be taken as a guideline for designing new, more cost-effective BESS products. In many actual cases, power electronic components appear to be oversized and do not properly match the needs of typical residential customers. This aspect will be of significant importance in other BESS applications, e.g., the provision of primary control reserve, industrial peak-shaving, and storage integration to micro grids. The application and extension of the method presented herein to these other applications will be tackled in the near future.
As a general remark, it is important to note that, considering the current typical cost of storage and retail energy tariff valid in Germany for 2016, most scenarios do not favor storage system installation over a sole PV system. Nevertheless, future electricity price evolution is likely to reverse this trend. The increased customer independence achieved using BESS may be profitable only in the long run under the assumption of rising retail electricity tariffs. In general, storage may provide additional value by stacking other applications, e.g., provision of uninterrupted power supply or energy market trading via cloud based pooling of battery storage systems.
Although this work uses parameters corresponding to German market conditions and regulations, the described methodology can be easily adapted to other countries that use feed-in and retail electricity tariff models, e.g., (in parts of) Australia, Canada, France, Greece, and many others. German regulations for the PV to grid feed-in limit and the complex scheme for storage systems subsidies results in various constraints and challenging model scenarios. The adaption to other regions is the subject of the present work.
This work is limited to the optimization of storage systems using historical data on specific load demand and PV generation profiles. A well parameterized energy management controller for a BESS will also need accurate forecasting of load demand and PV generation [40] to achieve the best operation. Although such forecasting tasks are outside the scope of this work, they will be considered and used for energy management strategies in future.

Acknowledgments

The authors acknowledge financial support from the Technical University Munich and Nanyang Technological University funded International Center for Energy Research (ICER) Project and the Bavarian funded EEBatt project, the Science without Border PhD grant (BEX 13301/13-6), and the Natural Sciences and Engineering Research Council (NSERC) of Canada. This work was also supported by the German Research Foundation (DFG) and the Technical University of Munich (TUM) in the framework of the Open Access Publishing Program.

Author Contributions

Holger C. Hesse established the mathematical framework for the techno-economic analysis of energy storage systems. Rodrigo Martins developed the optimization model and executed the simulation experiments. Maik Naumann and Cong Nam Truong contributed to the result analysis and sensitivity study. Petr Musilek and Andreas Jossen provided overall guidance for the study and contributed with many fruitful discussions on the methodology. Holger C. Hesse wrote the paper with contributions of all co-authors.

Conflicts of Interest

The authors declare no conflict of interest.

Abbreviations

BESSBattery energy storage system
EOLEnd of life
LFPLithium-ion battery with graphite anode and iron (Fe)-phosphate cathode
LPLinear programming (mixed integer LP)
NMCLithium-ion battery with graphite anode and nickel-manganese-cobalt cathode
PbALead (Pb)-(sulfuric)-acid battery
PVPhotovoltaic generator
ROIReturn on invest
SOHBattery state of health

Appendix A

Table A1. Literature review for battery performance parameters used in this study. For all table fields the value used for simulations is given first. In some cases, other values are given in brackets—these are for information to the reader only, but not further used in the paper.
ParameterVariableUnitPbALFPNMC
Battery round trip efficiency η b a t t %85 [41,42] *
(80 [43])
98 [41,42] *
(95 [43])
95 [43] **
Battery self-discharge S D %/day0.17 [41]
(0.2 [1,44]
0.1 [1])
0.02 [41,42] *
(0.33 [44]
0.1 [1,44])
0.02 [45]
Calendric lifetime L i f e C a l 80 % (years)10 [41]
(5 [1]
8 [46])
15 [1]
(12–20+ [42])
13 [44,45]
Cyclic lifetime L i f e C y c 80 % FEC1500 [46] ***
(200–1300 [1,41])
10,000 [45] ****
(6000 [42,47]
1000–10,000+ [1,48])
4500 [29]
(700–1000 [49])
* Experiments conducted at the following parameters: 1/10 C, 25 °C, 50% SOC; ** Experiments conducted at the following parameters: 1 C, 25 °C, 50% SOC; *** Derived at 50% DoD; **** Tested at 60–100% DoD.

Appendix B

Figure A1. PV generation and load profile used for this simulation study. Both profiles are scaled according to the scenarios described in the paper. The load profile was taken from [38].
Energies 10 00835 g005

References

  1. Luo, X.; Wang, J.; Dooner, M.; Clarke, J. Overview of current development in electrical energy storage technologies and the application potential in power system operation. Appl. Energy 2015, 137, 511–536. [Google Scholar] [CrossRef]
  2. Nykvist, B.; Nilsson, M. Rapidly falling costs of battery packs for electric vehicles. Nat. Clim. Chang. 2015, 5, 329–332. [Google Scholar] [CrossRef]
  3. Kairies, K.; Haberschusz, D.; van Ouwerkerk, J.; Strebel, J.; Wessels, O.; Magnor, D.; Badeda, J.; Sauer, D. Wissenschaftliches Mess—Und Evaluierungsprogramm Solarstromspeicher: Jahresbericht 2016; Speicher Monitoring: Aachen, Germany, 2016. [Google Scholar]
  4. Fitzgerald, G.; Mandel, J.; Morris, J. The Economics of Battery Energy Storage. 2015. Available online: http://www.rmi.org/ELECTRICITY_BATTERY_VALUE (accessed on 26 October 2016).
  5. Naumann, M.; Karl, R.C.; Truong, C.N.; Jossen, A.; Hesse, H.C. Lithium-ion Battery Cost Analysis in PV-household Application. Energy Procedia 2015, 73, 37–47. [Google Scholar] [CrossRef]
  6. Truong, N.C.; Naumann, M.; Karl, C.R.; Müller, M.; Jossen, A.; Hesse, C.H. Economics of Residential Photovoltaic Battery Systems in Germany: The Case of Tesla’s Powerwall. Batteries 2016, 2, 14. [Google Scholar] [CrossRef]
  7. Garimella, N.; Nair, N.K.C. Assessment of battery energy storage systems for small-scale renewable energy integration. In Proceedings of the TENCON 2009–2009 IEEE Region 10 Conference, Singapore, 23–26 January 2009. [Google Scholar]
  8. Quaschning, V. Unabhängigkeitsrechner. 2015. Available online: pvspeicher.htw-berlin.de/unabhaengigkeitsrechner/ (accessed on 9 February 2017).
  9. Benz, M. Online-Rechner für SENEC.IES Stormspeicher. Available online: www.speicher-rechnen.de (accessed on 4 May 2017).
  10. Piepenbrinck, A. E3/DC System Calculator. Available online: http://s10.e3dc.com/E3dcWeb/SystemCalculator/syscalc.php (accessed on 4 May 2017).
  11. Varta-storage GmbH. Varta-Storage Berechnungstool. 2017. Available online: https://www.varta-storage.com/de/produkte/heimspeichersysteme/berechnungstool.html (accessed on 4 May 2017).
  12. Tesla Motors. The Tesla Home Battery. Available online: https://www.tesla.com/powerwall (accessed on 4 May 2017).
  13. Mercedes-Benz. Mercedes-Benz Energy Storage. Available online: https://www.mercedes-benz.com/en/mercedes-benz-energy/products/ (accessed on 4 May 2017).
  14. Nissan. xStorage by Nissan-Clean Power Energy. 2017. Available online: https://www.nissan.co.uk/experience-nissan/electric-vehicle-leadership/xstorage-by-nissan.html (accessed on 4 May 2017).
  15. Fuhs, M. Marktübersicht Home-Speicher. PV-Magazine 2016, 2016, 35–39. [Google Scholar]
  16. Hoppmann, J.; Volland, J.; Schmidt, T.S.; Hoffmann, V.H. The economic viability of battery storage for residential solar photovoltaic systems–A review and a simulation model. Renew. Sustain. Energy Rev. 2014, 39, 1101–1118. [Google Scholar] [CrossRef]
  17. Magnor, D.; Sauer, D.U. Optimization of PV Battery Systems Using Genetic Algorithms. Energy Procedia 2016, 99, 332–340. [Google Scholar] [CrossRef]
  18. Muenzel, V.; Mareels, I.; Hoog, J.D.; Vishwanath, A.; Kalyanaraman, S.; Gort, A. PV generation and demand mismatch: Evaluating the potential of residential storage. In Proceedings of the 2015 IEEE Power & Energy Society Innovative Smart Grid Technologies Conference (ISGT), Washington, DC, USA, 18–20 February 2015. [Google Scholar]
  19. Weniger, J.; Tjaden, T.; Bergner, J.; Quaschning, V. Sizing of Battery Converters for Residential PV Storage Systems. Energy Procedia 2016, 99, 3–10. [Google Scholar] [CrossRef]
  20. Lauinger, D.; Caliandro, P.; van Herle, J.; Kuhn, D. A linear programming approach to the optimization of residential energy systems. J. Energy Storage 2016, 7, 24–37. [Google Scholar] [CrossRef]
  21. Merei, G.; Moshövel, J.; Magnor, D.; Sauer, D.U. Optimization of self-consumption and techno-economic analysis of PV-battery systems in commercial applications. Appl. Energy 2016, 168, 171–178. [Google Scholar] [CrossRef]
  22. Geth, F.; Tant, J.; Haesen, E.; Driesen, J.; Belmans, R. Integration of energy storage in distribution grids. In Proceedings of the 2010 IEEE Power and Energy Society General Meeting, Providence, RI, USA, 25–29 July 2010; pp. 1–6. [Google Scholar]
  23. Tant, J.; Geth, F.; Six, D.; Tant, P.; Driesen, J. Multiobjective battery storage to improve PV integration in residential distribution grids. IEEE Trans. Sustain. Energy 2013, 4, 182–191. [Google Scholar] [CrossRef]
  24. Merei, G.; Berger, C.; Sauer, D.U. Optimization of an off-grid hybrid PV-Wind-Diesel system with different battery technologies using genetic algorithm. Sol. Energy 2013, 97, 460–473. [Google Scholar] [CrossRef]
  25. Schiffer, J.; Sauer, D.; Bindner, H.; Cronin, T.; Lundsager, P.; Kaiser, R. Model prediction for ranking lead-acid batteries according to expected lifetime in renewable energy systems and autonomous power-supply systems. J. Power Sources 2007, 168, 66–78. [Google Scholar] [CrossRef]
  26. Vetter, J.; Novák, P.; Wagner, M.R.; Veit, C.; Möller, K.-C.; Besenhard, J.O.; Winter, M.; Wohlfahrt-Mehrens, M.; Vogler, C.; Hammouche, A. Ageing mechanisms in lithium-ion batteries. J. Power Sources 2005, 147, 269–281. [Google Scholar] [CrossRef]
  27. Fuchs, G.; Lunz, B.; Leuthold, M.; Sauer, D.U. Technology Overview on Electricity Storage, Overview on the Potential and on the Deployment Perspectives of Electricity Storage Technologies. 2012. Available online: http://www.sefep.eu/activities/projects-studies/120628_Technology_Overview_Electricity_Storage _SEFEP_ISEA.pdf (accessed on 16 June 2016).
  28. Schmalstieg, J.; Käbitz, S.; Ecker, M.; Sauer, D.U. A holistic aging model for Li(NiMnCo)O2 based 18650 lithium-ion batteries. J. Power Sources 2014, 257, 325–334. [Google Scholar] [CrossRef]
  29. Goebel, C.; Hesse, H.; Schimpe, M.; Jossen, A.; Jacobsen, H.-A. Model-based Dispatch Strategies for Lithium-Ion Battery Energy Storage applied to Pay-as-Bid Markets for Secondary Reserve. IEEE Trans. Power Syst. 2016. [Google Scholar] [CrossRef]
  30. Hesse, H.; Müller, M. Price and Market Trends for Battery Stationary Storage Systems. Unpublished work. 2017. [Google Scholar]
  31. Photovoltaik4all. Available online: http://www.photovoltaik4all.de/en/wechselrichter (accessed on 7 September 2016).
  32. Bundesverband der Energie-und Wasserwirtschaft e.V. BDEW Strompreisanalyse Mai. 2016. Available online: https://www.bdew.de/internet.nsf/res/886756C1635C3399C1257FC500326489/$file/160524_BDEW _Strompreisanalyse_Mai2016.pdf (accessed on 4 May 2017).
  33. Bundesnetzagentur. Dateneldungen und EEG-Vergütungssätze für Photovoltaikanlagen. 2017. Available online: https://www.bundesnetzagentur.de/DE/Sachgebiete/ElektrizitaetundGas/Unternehmen_ Institutionen/ErneuerbareEnergien/Photovoltaik/DatenMeldgn_EEG-VergSaetze/DatenMeldgn_EEG-VergSaetze_node.html (accessed on 4 May 2017).
  34. KfW Bank. Förderprogram Erneuerbare Energien-Speicher. 2016. Available online: https://www.kfw.de/Download-Center/F%C3%B6rderprogramme-(Inlandsf%C3%B6rderung)/PDF-Dokumente/6000002700_M_275_Speicher.pdf (accessed on 14 July 2016).
  35. Beck, T.; Kondziella, H.; Huard, G.; Bruckner, T. Assessing the influence of the temporal resolution of electrical load and PV generation profiles on self-consumption and sizing of PV-battery systems. Appl. Energy 2016, 173, 331–342. [Google Scholar] [CrossRef]
  36. Wenzl, H.; Baring-Gould, I.; Kaiser, R.; Liaw, B.Y.; Lundsager, P.; Manwell, J.; Ruddell, A.; Svoboda, V. Life prediction of batteries for selecting the technically most suitable and cost effective battery. In Selected Papers from the Ninth European Lead Battery Conference; Elsevier: Amsterdam, The Netherlands, 2005; Volume 144, pp. 373–384. [Google Scholar]
  37. Battke, B.; Schmidt, T.S.; Grosspietsch, D.; Hoffmann, V.H. A review and probabilistic model of lifecycle costs of stationary batteries in multiple applications. Renew. Sustain. Energy Rev. 2013, 25, 240–250. [Google Scholar] [CrossRef]
  38. Quaschning, V. Representative Electrical Load Profiles of Residential Buildings in Germany with a Temporal Resolution of One Second; HTW Berlin—University of Applied Sciences: Berlin, Germany, 2015. [Google Scholar]
  39. Nocedal, J.; Wright, S. Numerical Optimization; Springer Science & Business Media: New York, NY, USA, 2006. [Google Scholar]
  40. Rodway, J.; Musilek, P.; Lozowski, E.; Prauzek, M.; Heckenbergerova, J. Pressure-based prediction of harvestable energy for powering environmental monitoring systems. In Proceedings of the 2015 IEEE 15th International Conference on Environment and Electrical Engineering (EEEIC), Rome, Italy, 10–13 June 2015. [Google Scholar]
  41. Sterner, M.; Stadler, I. Energiespeicher. Bedarf, Technologien, Integration, 1st ed.; Springer: Berlin/Heidelberg, Germany, 2014. [Google Scholar]
  42. European Society for Clinical Nutrition and Metabolism (ESPEN). Potentiale Elektrochemischer Speicher in Elektrischen Netzen in Konkurrenz zu Anderen Technologien und Systemlösungen (ESPEN); EFZN Project Report; ESPEN: Goslar, Germany, 2016. [Google Scholar]
  43. Jossen, A.; Weydanz, W. Moderne Akkumulatoren Richtig Einsetzen, 1st ed.; Reichardt: Untermeitingen, Germany, 2006. [Google Scholar]
  44. Reddy, T. Linden’s Handbook of Batteries, 4th ed.; McGraw-Hill: New York, NY, USA, 2011. [Google Scholar]
  45. Naumann, M.; Keil, P. TUM institute for electrical storage technology internal calendric aging studies. Unpublished work.
  46. GNB Industrial Power. Handbuch für Verschlossene Gel-Blei-Batterien; Exide Technologies GmbH.: Büdingen, Germany, 2013. [Google Scholar]
  47. Sony Energy Devices Corporation. Sony Energy Devices Quality, Operations and Management. Available online: http://www.sonyenergy-devices.co.jp/en/csr/quality.php (accessed on 4 May 2017).
  48. Omar, N.; Monem, M.A.; Firouz, Y.; Salminen, J.; Smekens, J.; Hegazy, O.; Van Mierlo, J. Lithium iron phosphate based battery—Assessment of the aging parameters and development of cycle life model. Appl. Energy 2014, 113, 1575–1585. [Google Scholar] [CrossRef]
  49. Schuster, S.; Bach, T.; Fleder, E.; Müller, J.; Brand, M.; Sextl, G.; Jossen, A. Nonlinear aging characteristics of lithium-ion cells under different operational conditions. J. Energy Storage 2015, 1, 44–53. [Google Scholar] [CrossRef]
Figure 1. Schematic illustration of the investigated alternate current (AC) topology photovoltaic-battery energy storage systems coupling. Arrows indicate the direction of possible power flows between the individual components.
Energies 10 00835 g001
Figure 2. Power flow analysis for a three-day period using lithium-iron-phosphate (LFP) battery chemistry: load and power flows within the system (top); time correlated evolution of battery state of charge (middle); and resulting state of health (SOH) decline (bottom).
Energies 10 00835 g002
Figure 3. Graphical representation of the optimization results using contour plots: from top to bottom, the panels show optimum battery size, inverter size, and corresponding maximum attainable return on investment (ROI) for a variation of yearly load demand and local PV generation. From left to right, three battery technologies (lead-acid (PbA), LFP, and lithium-nickel-manganese-cobalt (NMC)) are depicted.
Energies 10 00835 g003
Figure 4. ROI comparison of optimally sized battery energy storage systems at varying PV size for three battery technologies (NMC, PbA, and LFP). Depending on the annual household load demand (left: 1 MWh/a, center: 2.5 MWh/a, right: 4 MWh/a) different technologies are favored. The inset numbers in the right panel indicate the optimum sizing of battery and inverter for each simulation scenario.
Energies 10 00835 g004
Table 1. Non-comprehensive overview of literature in the field of battery energy storage system (BESS) analysis and optimization.
ApplicationType/Focus of ResearchReferences
VehicleEconomic analysis[2]
ResidentialMarket analysis[3,15]
Techno-economic analysis[5,6,7,16]
Online economic estimation tools[8,9,10,11]
Size optimization (genetic algorithm)[17]
Optimization of power flow (dynamic programming)[18]
Inverter size (sensitivity analysis)[19]
Co-optimization of electricity and thermal energy flow[20]
CommercialTechno-economic analysis[21]
Other/grid levelBESS for distribution grid support[22,23]
BESS microgrid support[24]
Various/comparison of applicationsTechnical review[1]
Economic value assessment[4]
Table 2. Performance parameters of BESS using three different battery technologies. The data was derived from a literature survey (see Appendix A). Terms state of charge (SOC) and full equivalent cycles (FEC) are further explained in the text.
ParameterUnitBattery Technology
PbALFPNMC
η b a t t : Battery round-trip efficiency%859895
S D b a t t : Self-discharge per day%0.170.020.02
( S O C m i n S O C m a x ): Usable SOC%50–100%5–95%5–95%
L i f e C a l 80 % : Calendric life indicator in years(years)101513
L i f e C y c 80 % : Cycle life indicator in FEC(FEC)150010,0004500
C v a r , b a t : Variable battery price€/kWh271752982
C f i x : Fixed price for storage (price for housing, cooling, and periphery)11821723580
Table 3. Inverter performance and price information derived from literature survey [15,31].
Inverter DataUnitValue
η i n v : Average one way inverter efficiency%97.5
T i n v : Assumed inverter lifetime in years(years)20
C v a r , i n v : Cost of inverter per nominal power€/kW155
Table 4. Remuneration and retail energy prices for households in Germany (2016), and legal framework for PV-grid feed-in.
Economic and Legal FrameworkVariableValue
Retail energy price c b u y 28.69 ct€/kWh
Feed-in energy reimbursement tariff c s e l l 12.31 ct€/kWh
Maximum feed-in ratio (without BESS subsidy) f n o E E S 0.7
Maximum feed-in ratio (with BESS subsidy) f E E S 0.5
Government subsidy rate for storage systems r s u b s i d y 0.22
Table 5. Variables and parameters used for the battery modeling and optimization routines.
Battery Modelling ParameterVariableUnitConstraints/Comments
Load demand (historical data) P l o a d i kW 0 ; input data
PV power generated (historical data) P p v i kW 0 ; input data
Nominal power of the battery inverter P i n v n o m kWsubject to optimization
Nominal battery capacity E b a t t n o m kWhsubject to optimization
Bidirectional power flow from/to the battery P b a t t i kWresult of optimization
PV power fed to the load P p v l o a d i kW 0 ; see Equations (8) and (10)
PV power stored in the battery P p v b a t t i kW 0 ; see Equation (8)
PV power exported to the grid P p v g r i d i kW 0 ; see Equation (8)
Power transferred from the battery to the load P b a t t l o a d i kWsee Equation (10)
Power exported from the battery to the grid P b a t t g r i d i kW 0 ; see Equation (13)
Power imported from the grid to the load P g r i d l o a d i kW 0 ; see Equation (10)
Surplus power-curtailed according to regulations P c u r t a i l i kW 0 ; see Equation (9)
State of health S O H i p.u.see Equations (18) and (19)
Battery energy content at time i E b a t t i kWhsee Equations (14) and (15)
State of charge S O C i p.u.[ S o C m i n ; S o C m a x ]
Table 6. Return on investment (ROI) optimal sizing of battery and inverter for an average four person household (load demand of 4 MWh/a).
PV Size (kWp)12.545.578.510
PbA battery (kWh)3.516.619.5711.7612.4612.1011.82
Inverter for PbA system (kW)0.671.181.551.691.731.721.69
LFP battery (kWh)2.234.186.127.507.947.687.56
Inverter for LFP system (kW)0.691.261.661.751.801.781.76
NMC battery (kWh)1.523.104.515.275.605.634.89
Inverter for NMC system (kW)0.560.951.191.321.381.461.41

