Research on Inverter Integrated Reactive Power Control Strategy in the Grid-Connected PV Systems

1
Province-Ministry Joint Key Laboratory of Electromagnetic Field and Electrical Apparatus Reliability, School of Electrical Engineering, Hebei University of Technology, Tianjin 300130, China
2
Department of Electrical Engineering, National Chin-Yi University of Technology, Taichung 41170, Taiwan
*
Author to whom correspondence should be addressed.
Energies 2017, 10(7), 912; https://doi.org/10.3390/en10070912
Submission received: 6 April 2017
/
Revised: 7 June 2017
/
Accepted: 26 June 2017
/
Published: 3 July 2017
(This article belongs to the Section F: Electrical Engineering)
Abstract
:In order to solve the problems caused by the susceptibility to changing weather conditions and the complex load conditions of photovoltaic (PV) systems, and the fact a single target inverter control strategy cannot effectively mitigate large voltage fluctuations at point of common coupling (PCC), an integrated reactive power control strategy for PV inverters is proposed. According to the weather and load conditions, this strategy is divided into four control modes: normal operation control mode, reverse power control mode, cloudy control mode and night control mode. The four control modes switch between each other under the specific switching rules to ensure an appropriate quantity of reactive power injection or consumption in the PV inverter. The effects of the four control modes in isolated operation were significant. The deviation rate of PCC voltage from its standard value was mitigated at about 2% under the integrated control strategy. Therefore, the proposed control strategy has a high application value in improving power quality and maximizing utilization of PV inverters.
1. Introduction
As a representative example of the rapid development of renewable energy sources, the installed capacity of photovoltaic (PV) systems is rapidly rising around the world [1,2]. Therefore, research on the technology related to PV systems is becoming a hotspot for researchers in different nations. Before studying it, which mode that PV system is operated in should be clear. There are three different operation modes for PV systems: grid-forming, grid-feeding and grid-supporting. Grid-forming mode is mainly applied to off-grid PV systems. The main difference between grid-feeding and grid-supporting is that PV inverter performs like the ideal current source delivering power to the grid in grid-feeding mode, while it operates as the current source controlled by an active and reactive power reference value to adjust grid voltage in the other mode [3]. In this paper PV system operated in grid-supporting mode is mainly discussed. Aside from the clean energy delivered by PV systems, the problems and threats to safe operation of the power grid caused by grid-connected PV systems are also causing widespread concern of many scholars and researchers. Among these problems and threats, the power quality problems represent a majority [4,5].
It is well known that the magnitude of the power supplied by PV systems depends largely on the weather conditions of the outside world. If there are rapid changes in the degree of sun irradiance, the output power of the PV system will fluctuate significantly. Study in [6] showed that rapid voltage changes over 5% may occur in a PV system in cloudy weather (that is, the rapid changes in the degree of sun irradiance due to the weather). According to GB/T12326-2008 [7], this level of voltage fluctuations cannot exist in a PV system. Therefore, to guarantee the safety and stability in PV systems, it is necessary to use an appropriate voltage/reactive power control strategy to mitigate these rapid voltage fluctuations [8,9].
At present, there are many studies on voltage/reactive power control strategies for PV inverters. The power factor control [10,11,12,13] and the Reactive power-Voltage (Q-V) droop control [14,15,16,17] method are two widely used PV inverter control strategies. In addition, a strategy of combining several PV inverters to enhance the control effect was proposed in [18]. In [19], on the basis of Q-V droop control, the active power was introduced as a control variable, forming an Active power-Reactive power-Voltage (P-Q-V) combination droop control strategy. Although these single target/mode control strategies achieved good control effects in the experiments, their control effects on voltage fluctuation have to be strengthened in the face of changing weather conditions and complex load conditions.
In references [20,21,22], the reactive power coordination and optimization control methods by static Var compensator/static Var generator (SVC/SVG), and inverter were proposed, which could reduce the power consumption of reactive power compensation devices. A control strategy was proposed in [23], which completely converted the PV inverter into a static reactive power generator (SVG, also known as a STATCOM, which means Static Synchronous Compensator) to reduce power losses in grid line. These methods controlled the point of common coupling (PCC) voltage by using external reactive power compensation devices. Although they presented good results, they would not only increase the cost of the devices, but reduce the efficiency of PV systems and disturb the safety of PV system as well.
Weather and load conditions are varied during the operation of PV systems, so the control strategy can also form targeted control methods based on different weather and load conditions. In reference [24], a multi-mode control strategy was proposed, which includes three kinds of operation modes—dynamic compensation mode, droop control mode and slope control mode—and each control mode was formulated according to the characteristics of specific conditions. Good results were achieved in the corresponding experiments, but there was no discussion on the control method of the inverter during night-time, the problem of idle inverters at night remained unsolved.
In addition to the voltage deviations caused by voltage fluctuations, the power factor, the total harmonic distortion rate (THD) and other indicators are included in the power quality as well, which can also be optimized by the PV inverter under a certain control strategy. Xavier et al. [25] proposed an adaptive current control strategy for PV inverters using the Proportional Resonant (PR) controller to eliminate the harmonic in the grid. In [26], a power angle control method of the PV system was proposed, which not only reduced the THD in the grid, but also compensated the reactive power and improved the power factor.
Based on the analysis above, an integrated reactive power control strategy for PV inverter is presented. This integrated control strategy contains normal operation control mode, reverse power control mode, cloudy control mode and night control mode, so that it can carry out targeted controls for different weather and load conditions. Based on the data of the sun irradiance and temperature in the PV systems, published by the U.S. National Renewable Energy Laboratory [27], simulations were conducted. Simulation results demonstrated the effectiveness of integrated control strategy in improving the power quality.
2. Control Strategy
The proposed integrated control strategy is introduced in this section. The integrated control strategy is divided into four parts, which are normal operation control mode, reverse power control mode, cloudy control mode and night control mode to deal with different weather or load conditions. The purpose of these four control methods is to mitigate voltage fluctuations in the PV systems, and to maintain the stability of the entire grid. The reactive power consumption or injection is carried out in the PV inverter to eliminate voltage fluctuations. In integrated control strategy, the upper limit of the reactive power capacity is set as follows:
where Smax is rated apparent power capacity in PV inverter, and PDC is real-time output of PV system. In integrated control strategy, amount of reactive power injected or consumed at any time cannot exceed this upper limit Qmax. If the calculated value of reactive power by following parts of the control mode exceeds Qmax at a certain time, Qmax is considered to be the reference reactive power output in PV inverter.
2.1. Normal Operation Control Mode
The normal operation defined in this paper refers to the situation when the PV system works stably, and there are no large fluctuations in the weather and load conditions over a short period. The general idea of the normal operation control mode is to maintain stability, and the control target is the PCC voltage in PV system. During the normal operation in PV system, a large amount of active power is supplied to load, and the reactive power capacity is relatively limited, so in the normal operation control mode, if the deviation between PCC voltage and its standard value is relatively small, the quantity of reactive power injection or consumption is 0. The larger the rate of deviation of the voltage from its standard value, the greater the quantity of reactive power injected or consumed, until the upper reactive power output limit is reached. The principle of normal operation control mode can be expressed as below:
where, and are the two voltage lower limit indicators set by users. and are the two voltage upper limit indicators set by users. is the measurement value of PCC voltage.
In practical applications, the following example can be used for reference of the setting of the lower limit and the upper limit of voltage. For example, the standard value of PCC voltage in a PV system is 300 V. The tolerance of the grid to PCC voltage fluctuations is ±5%, so the normal range of the PCC voltage is 285 V–315 V. For the purpose of achieving maximum reactive power output when the voltage exceeds a specified limit, and can be set to 285 V and 315 V. can be set to a value between 285 V–300 V, such as 290 V. can be set to a value between 300 V–315 V, such as 310 V. Of course, the lower and the upper limits of the voltage must be set according to the practical situations of the PV system, and do not necessarily need to be symmetrical about the standard PCC voltage value. If the PCC voltage beyond the standard value does a great harm to the PV system and the grid, and can be set smaller, and vice versa.
The first step in the normal operation control mode is to set the four voltage limit indicators , , and according to the practical situation of the PV system. These four indicators represent the tolerance of the PV system to the fluctuation range of PCC voltage. After that, upper limit of the reactive power capacity Qmax can be calculated by using the Equation (1). Then the output value of reactive power in PV inverter can be obtained according to Equation (2).
2.2. Reverse Power Control Mode
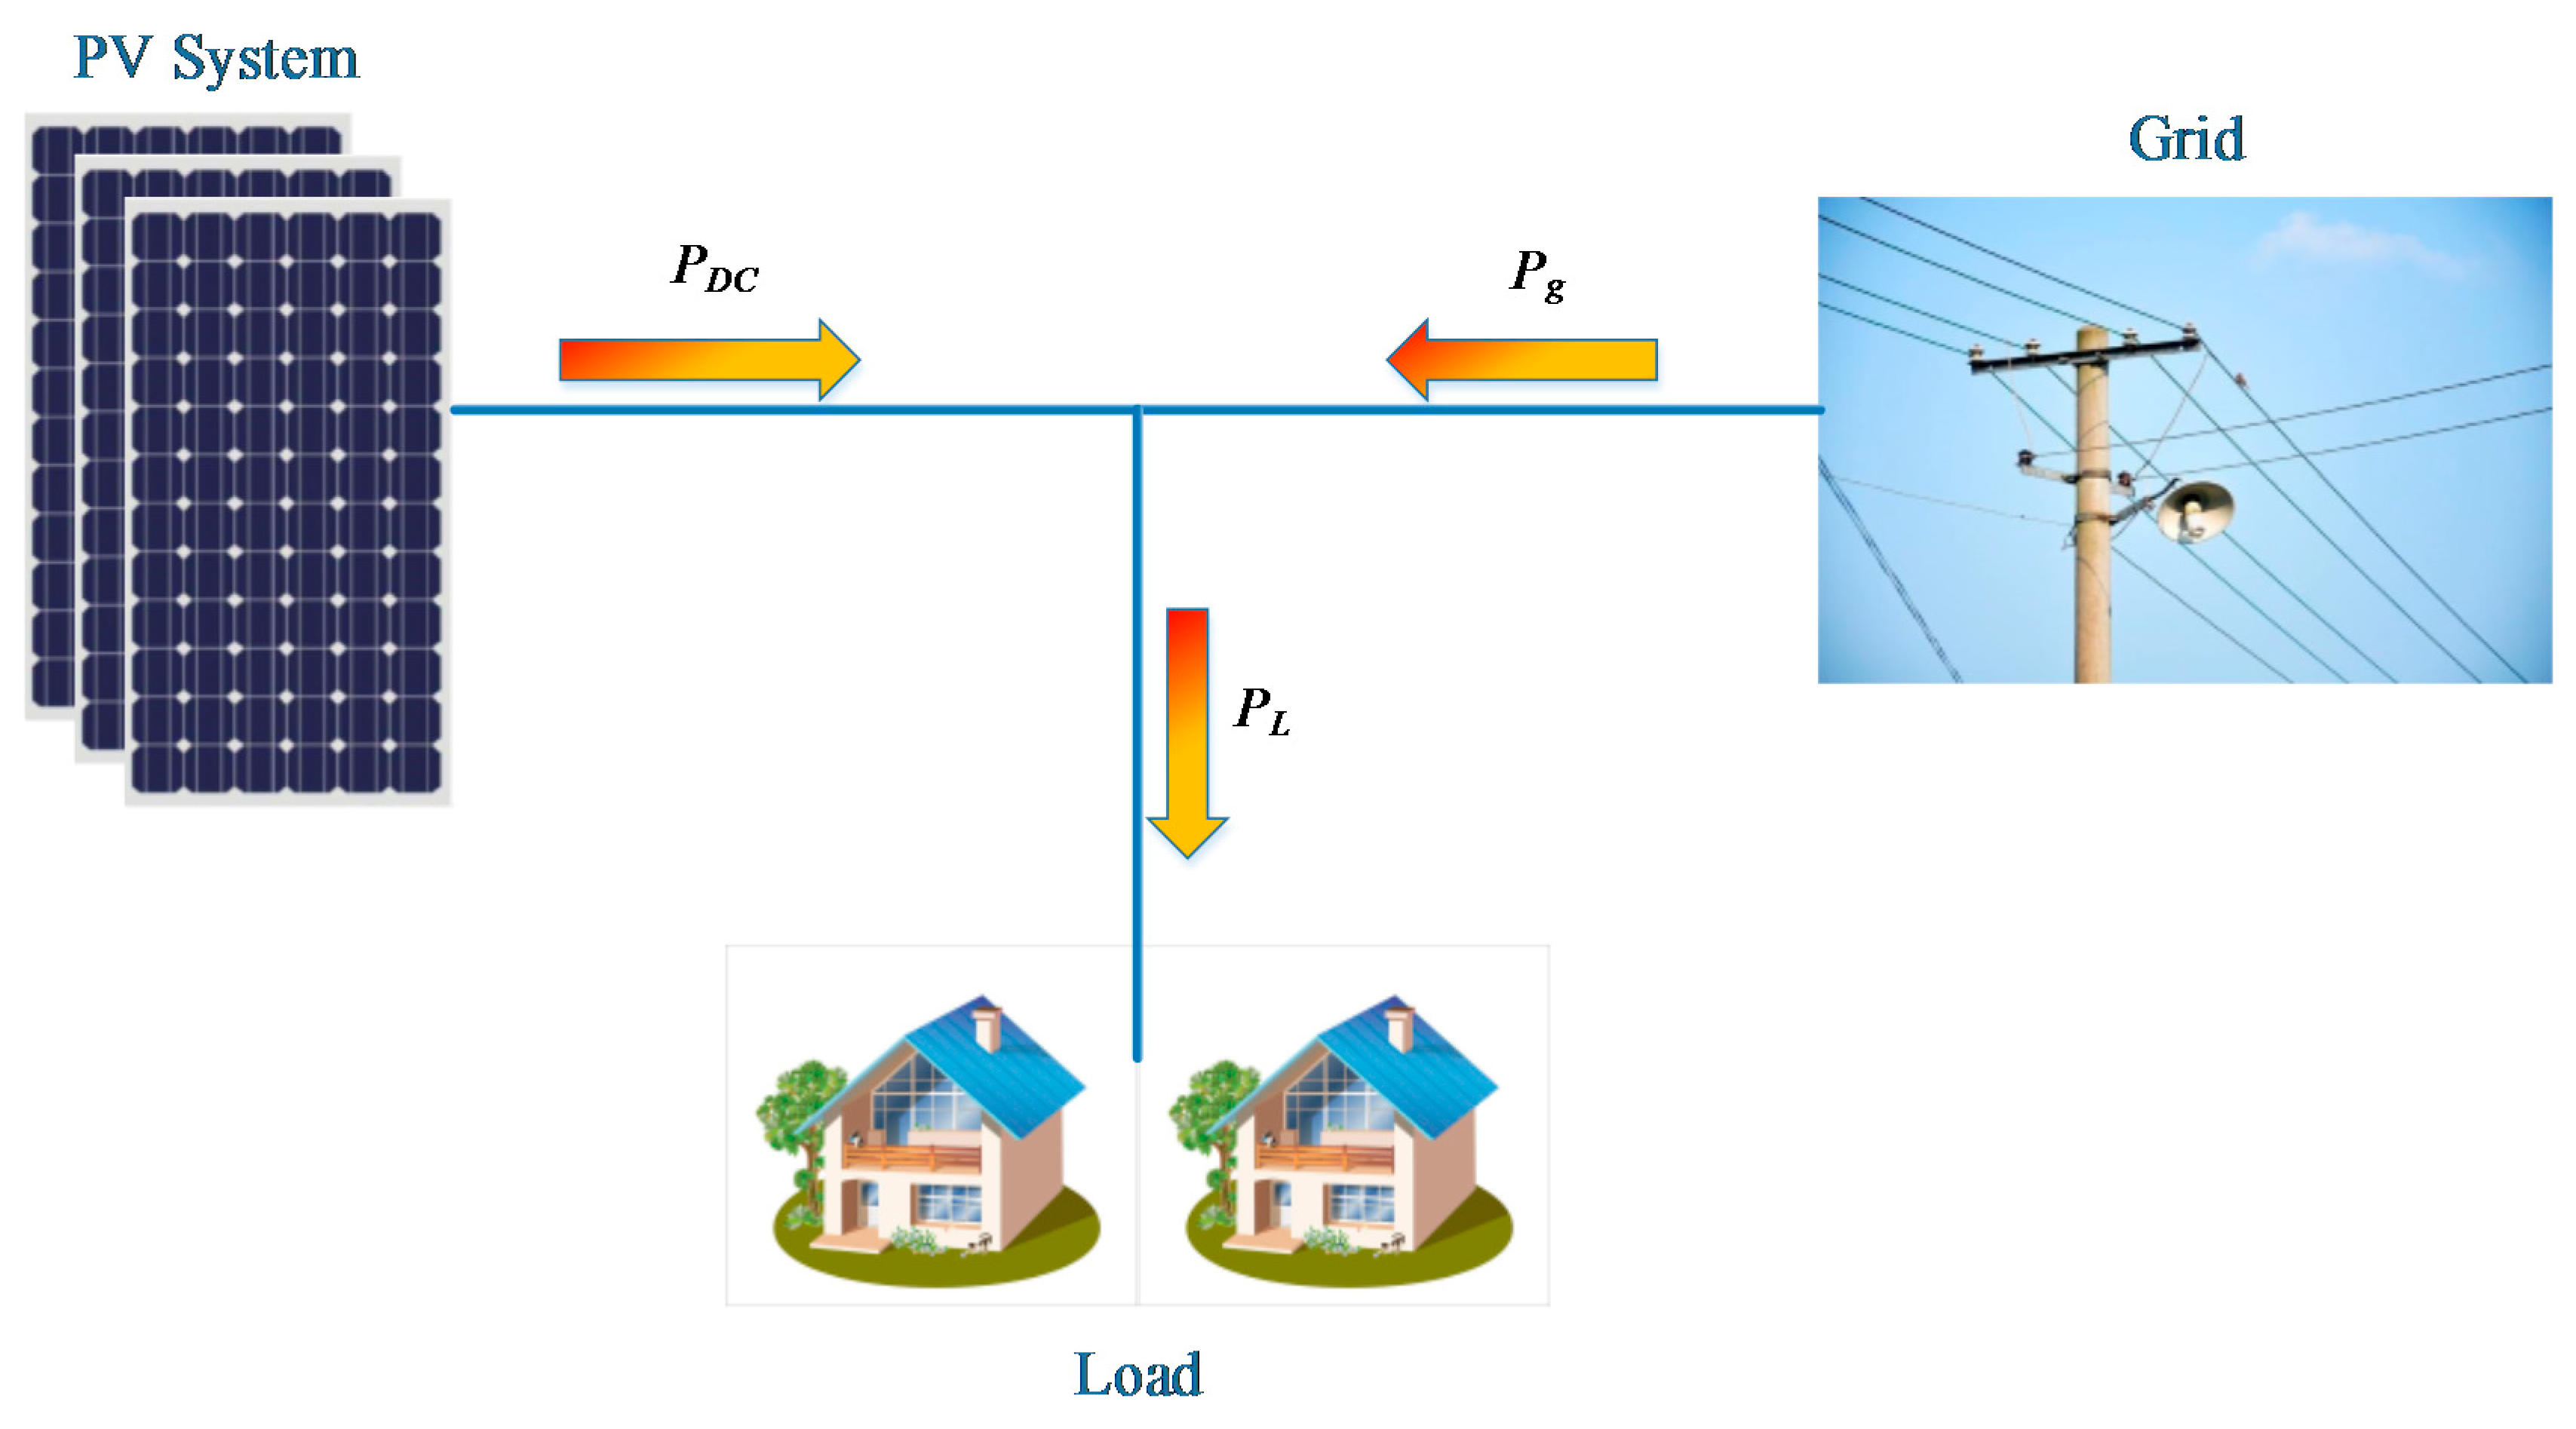
Once reverse power is occurred in PV system, PV inverter should adopt the reverse power control mode. Firstly, the relevant circumstances about reverse power are introduced as follows [28,29]: a simplified power system is shown in Figure 1, which consists of power grid, load and the PV system. The consumption power of load is , and output from PV system is . Under normal circumstances, there is . In other words, the PV system cannot supply all the power consumption of load, the power of grid is also needed. This amount of power is as follows:
But for a variety of reasons, the active power consumed by the load is suddenly reduced till , so becomes a negative value. This amount of power is also known as reverse power, denoted as . When a reverse power situation occurs, the PCC voltage will greatly rise due to changes in the power flow. Therefore, it is requisite to put forward relevant control mode for mitigation of voltage rise.
Under the premise of no active power waste in PV system, appropriate reactive power consumption need to be carried out to mitigate the voltage rise. To calculate appropriate amount for reactive power consumption, the concept of active and reactive voltage sensitivity proposed in literature [30] is introduced here.
The active voltage sensitivity is defined as follows: Inject active power only (N kW) into grid-connected PV system. Compute the change in PCC voltage . Then:
The reactive voltage sensitivity is defined as follows: Inject reactive power only (M kVar) into grid-connected PV system. Compute the change in PCC voltage . Then:
If the line reactance is X and the line resistance is R, the injection or consumption of reactive power is generally better for improving the voltage quality for high X/R lines, and vice versa [31].
Based on the description above, a reverse power control mode is proposed, that is, the amount of the reactive power consumption can be obtained using the expression given below:
where is measured PCC voltage, is standard PCC voltage, is the reactive voltage sensitivity.
In addition, if , the amount of reactive power consumption is .
2.3. Cloudy Control Mode
In cloudy weather, since there are rapid fluctuations of sun irradiance, the output of PV system may significantly decrease from a higher position, or substantially rise from a lower position. This will cause different phenomena, such as PCC voltage decreases or rises. Therefore, the control target of the cloudy control mode can be set as the change rate of the PV system output, that is . The quantity of reactive power injection or consumption can be obtained using the expression given below. When the calculated value from the Equation (7) is positive, reactive power injection is carried out for the grid, while reactive power is consumed from the grid when the calculated value from the Equation (7) is negative:
where is measured PCC voltage, is standard PCC voltage, is the reactive voltage sensitivity, is the regulation factor.
Because of the different conditions of and in the PV system under cloudy conditions, in order to achieve more comprehensive control effects, the regulation factor is introduced in the cloudy control mode:
where is the output change rate of the PV system, is the active voltage sensitivity.
When θ is positive, if is also positive, it is indicated that in the case of beyond the standard value, is still rapidly increasing. At this point, θ can increase the reactive power consumption calculated by the Equation (7) to mitigate the fast rising trend of VPCC. If is negative, it is indicated that is under the standard value, but is in a rapid increase, so has a trend to rise. At this point, θ can reduce the reactive power injection calculated by Equation (7) to prevent excessive regulation.
When the θ is negative, if the is also negative, it is indicated that in the case of VPCC under the standard value, is still rapidly decreasing. At this point, θ can increase the reactive power injection calculated by the Equation (7) to mitigate the rapid decline of . If is positive, it is indicated that is beyond the standard value, but is in a rapid decline, so has a trend to decrease. At this point, θ can reduce the reactive power consumption calculated by Equation (7) to prevent excessive regulation.
In this way, through the introduction of the regulation factor θ, the common control of both and is achieved in the cloudy control mode. So the cloudy control mode can effectively deal with the various situations that may occur in cloudy weather in the PV system.
2.4. Night Control Mode
In many inverter control strategies, the night-time is usually a neglected period of time. Since there is no active power output in the PV system at night, there is no need to control the inverter. However, under this way of thinking, the PV inverter is not operating for about 50% of the time.
The internal structure of the PV inverter is a full-bridge inverter composed of IGBT modules and a capacitor on the DC side. This structure is basically the same as the currently used reactive power compensation device SVG (static Var generator) [32,33]. Therefore, if a reasonable control mode is adopted, the PV inverter can also realize the function of reactive power compensation in SVG.
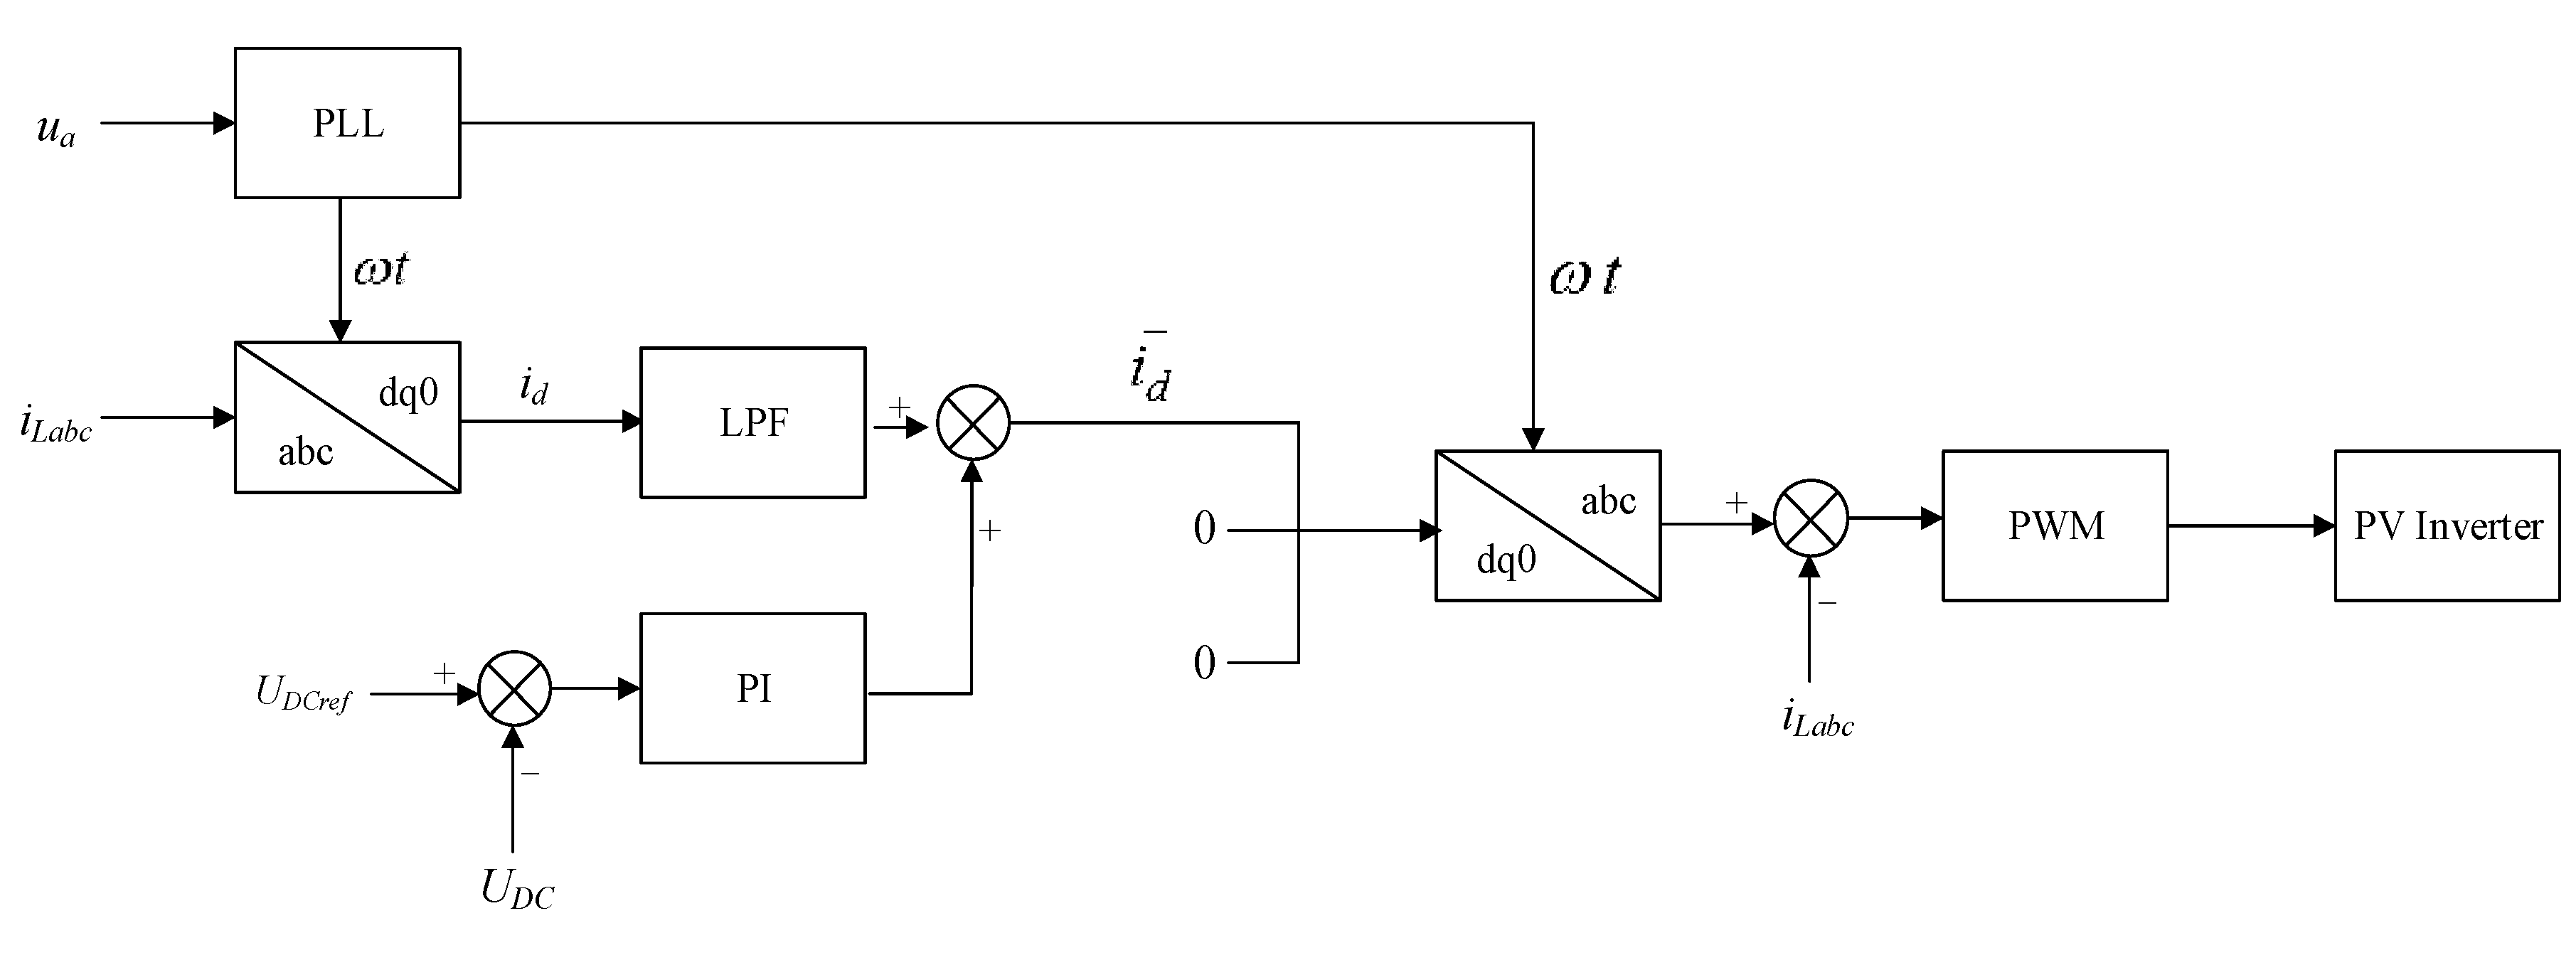
Therefore, in order to solve the problems that the PV inverters are idle at night, the night control mode is specially formulated. That is, utilizing the PV inverter as a SVG to provide dynamic compensation of reactive power for the power grid. Figure 2 shows the structure of night control mode.
According to Figure 2, the inputs of the control structure are , , and . is the phase A PCC voltage. is the three-phase current at load. is the reference DC voltage. is the measured DC voltage.
The operation flow of the night control mode is as follows:
- Step 1:
- Obtain the phase A PCC voltage , and gain the phase reference value in the phase locked loop (PLL) circuit by .
- Step 2:
- With the help of , completes the converting from the stationary abc coordinate system to the synchronous rotating dq coordinate system to get .
- Step 3:
- is filtered through the low-pass filter and then added with the reference value obtained by the PI controller after is compared with to get .
- Step 4:
- and two 0-valued signals are converted from the synchronous rotation dq coordinate system to the stationary abc coordinate system. After comparing with , the control waveforms of PWM are formed to control the PV inverter accordingly.
In Figure 2, the principle that reactive power compensation can be performed by night control mode is as follows: after the conversion to the synchronous rotating dq coordinate system, filtering by low pass filter and then the conversion from the synchronous rotation dq coordinate system to the stationary abc coordinate system, fundamental active component of the is obtained. Then comparing this fundamental active components with the , all the reactive components of that need to be compensated are obtained. Control the PV inverter to generate a current which has the equal size and the opposite direction of the reactive components to eliminate all the reactive components of , and then the reactive power compensation is achieved.
Furthermore, as seen in Figure 2, it can be found that the PV inverter under the night control mode can realize the function of an active power filter (APF) when the load current in the grid contains harmonic components, since all the reactive components and harmonic components are obtained after comparing the fundamental active components with the .We can control the PV inverter to generate a current which has the equal size and the opposite direction of the reactive components and the harmonic components to eliminate all the reactive components and the harmonic components of , and then the reactive power compensation and the harmonic elimination are all achieved.
It should be noted that, due to the fact the main tasks of the normal working control mode, the reverse power control mode and the cloud control mode are active power transmission and stability maintenance of the PCC voltage, these three modes cannot track the harmonic current, so the function of grid harmonic elimination is only available in night control mode. In other words, under the other three control modes except night control mode, it can only be ensured that the THD of the current which is generated by PV system is consistent with relevant codes in the grid. In night control mode, the PV inverter can also eliminate the harmonics generated by other devices in the grid which is reflected in the simulation results in the Section 4.5.
In addition, in night control mode, the meaning of the word “night” is not just a narrow sense of the time range after the sun sets, and it should be a broad understanding as a period of time when there is no or barely no power generated by PV system, since even during the day-time, in extreme weather PV systems may not be operating.
The conclusion is that the proposed night control mode can operate under all situations that PV systems are in a non-operating state. In order to describe these situations accurately, the active output lower limit of the PV system can be defined by the users. When the output of PV system satisfies the following condition, it is considered that the PV system is in a non-operating state and the night control mode is executed:
2.5. Switching between Different Control Modes
As mentioned above, the integrated control strategy is divided into four modes. The operating conditions of these four control modes are different, and their control targets are not all the same. Thus, a certain rule which clarifies the specific situations of different control modes must be developed to switch to the appropriate control mode. The four control modes should be sorted according to importance before developing the rule.
In this paper, the top three control modes in importance are reverse power control mode, cloudy control mode and night control mode. Only when every condition of these three control modes is not satisfied, the normal operation control mode is come into activation. The different control modes are switched as follows:
- (1)
- The upper limit of reverse power ,the change rate limit of active power and the lower limit of output in PV system are set by the users.
- (2)
- During the operation of PV system, detect whether the reverse power has exceeded the upper limit. If , switch to the reverse power control mode. if , continue to the process below.
- (3)
- Detect whether the change rate of the output in PV system is over the set value. If , switch to the cloudy control mode. If , continue to the process below.
- (4)
- Detect whether the output in PV system is lower than the lower limit set by users. If , switch to the night control mode. If , continue to the process below.
- (5)
- The activation of the normal operation control mode is to detect none of the conditions above is satisfied. In fact, according to the process and results of the following experiments, the PV system is in normal operation in the majority of cases. Therefore, the PV inverter may operate under normal operation control mode, and then the corresponding control mode can be switched to when certain conditions of other three control modes are satisfied.
In order to describe the process of switching more vividly, the operation flow of switch method between different control modes in Figure 3 is designed.
3. Control Structure
3.1. Basic Control Structure
It can be concluded from the previous descriptions that in the other three control modes except night control mode, the operation mode of PV system is grid-supporting. The PV inverter can be viewed as a current source that is controlled by a dynamically varying reference active and reactive power. By changing the reference values, the PV inverter can be controlled to carry out power injection and voltage adjustment.
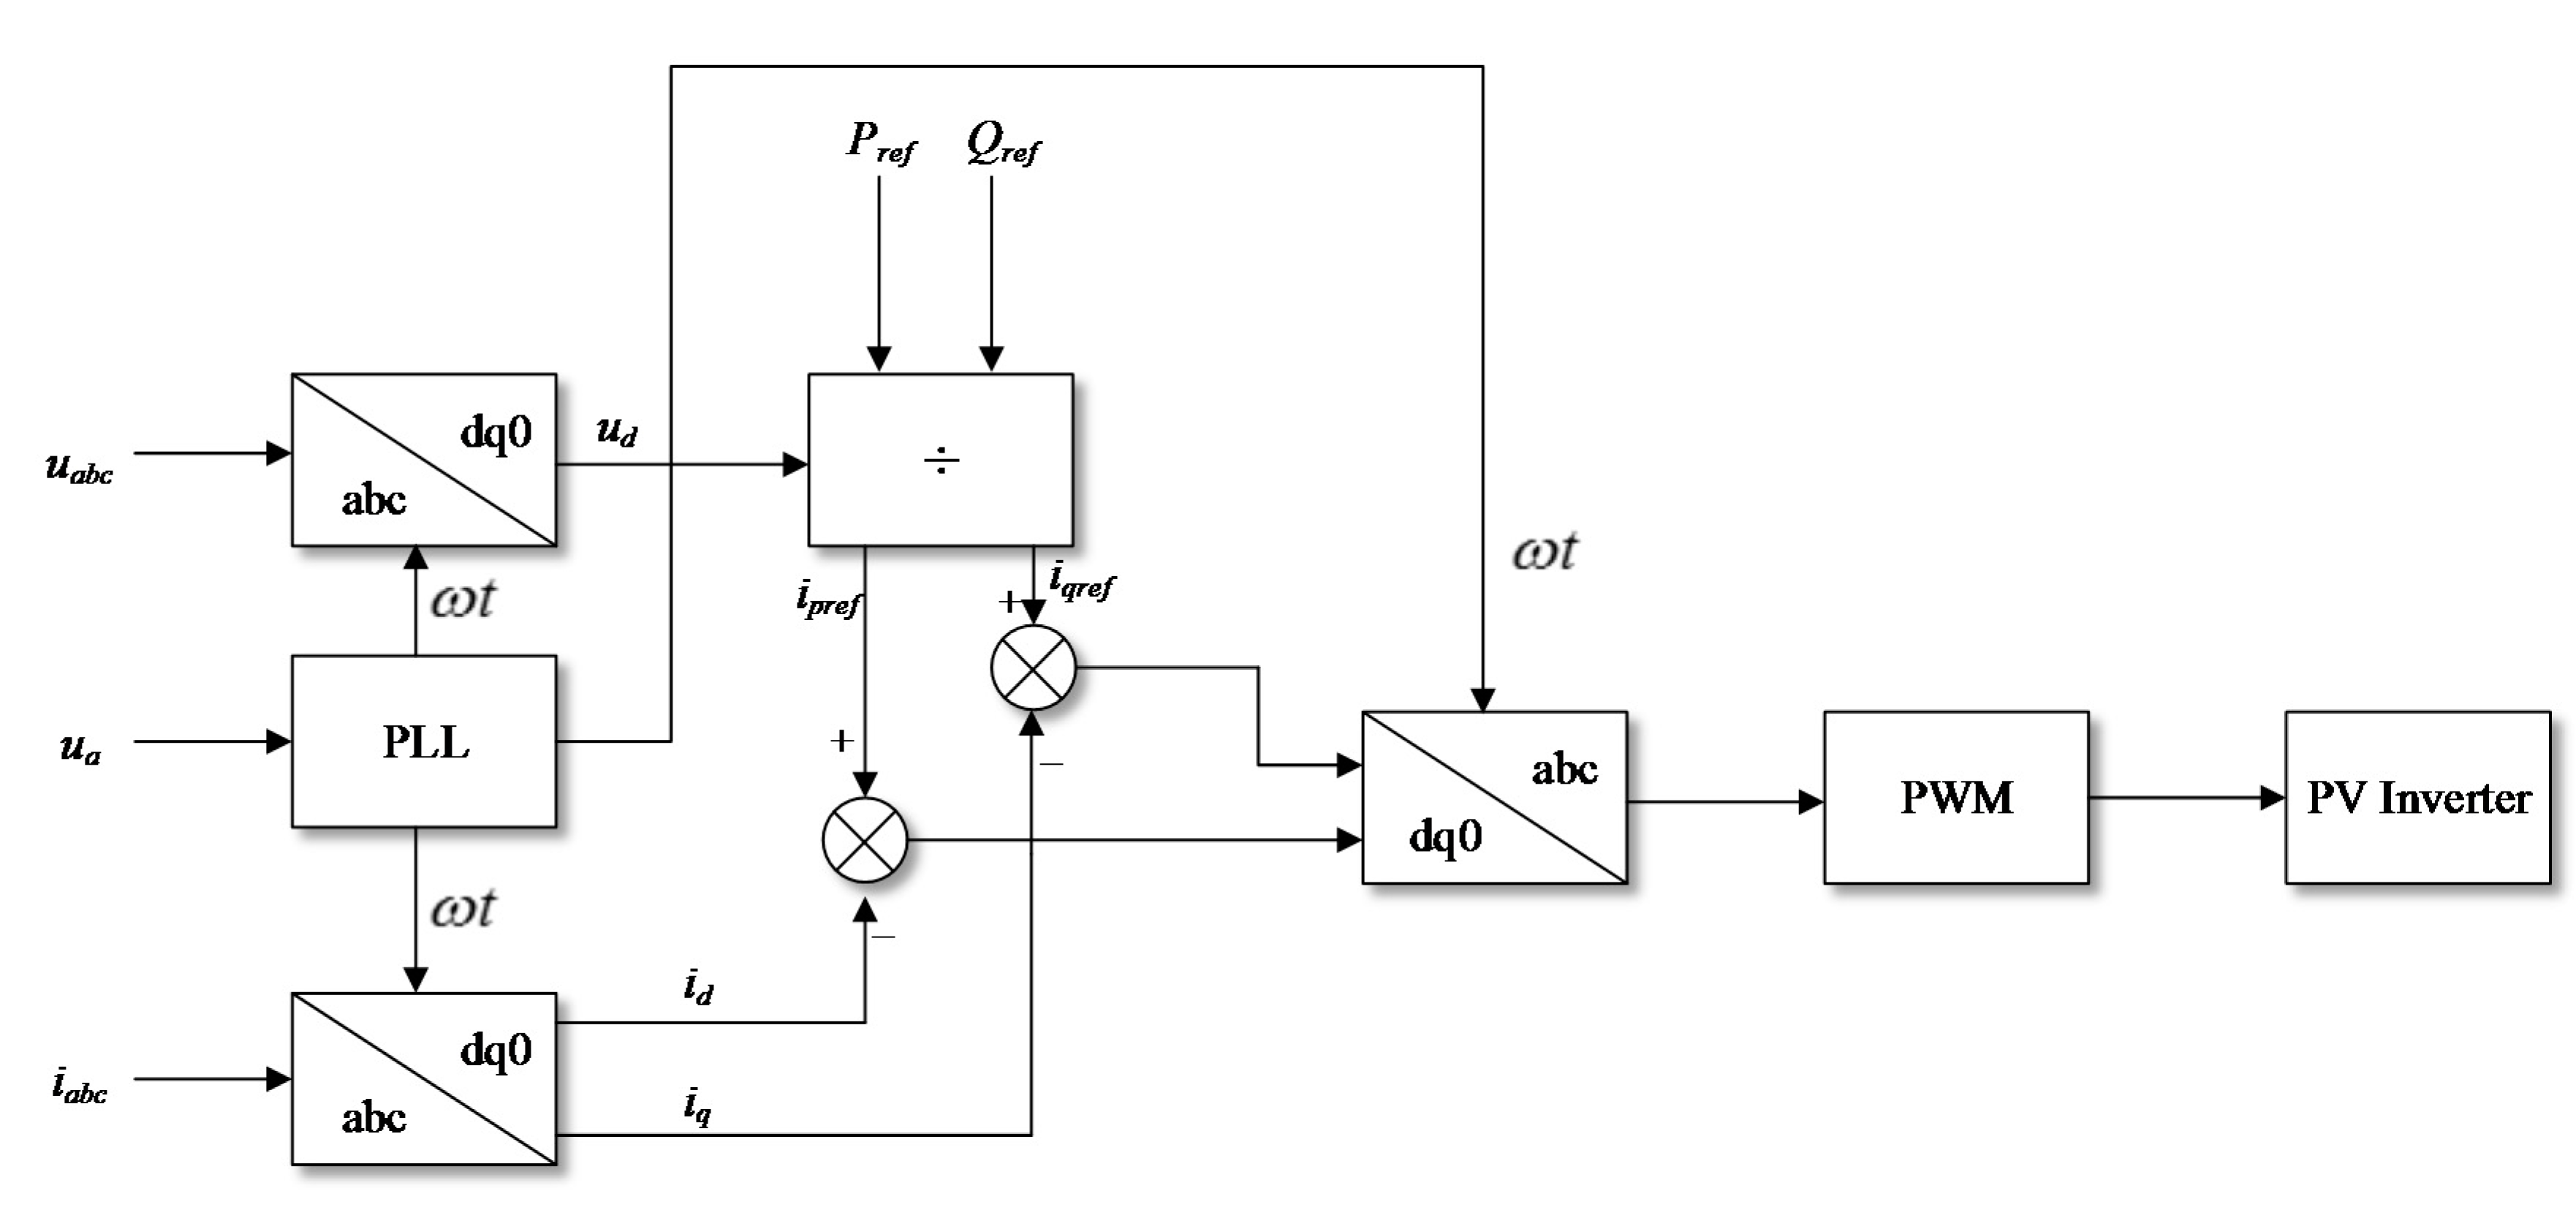
Therefore, structure of the three control modes is designed as Figure 4. The other three control modes except night control mode can use this control structure to control the PV inverter effectively.
In Figure 4, the inputs of the control structure are PCC voltage and current in three-phase and , reference active power and reference reactive power . and are obtained directly from PCC. For the purpose of maximizing the generation efficiency in PV system, the actual power output in PV system is regarded as . is derived from the calculated values of the above Equations (2), (6) or (7).
The operation flow of the control structure is as follows:
- Step 1:
- Obtain the three-phase PCC voltage and current (i.e., and ), and gain the phase reference value in the phase locked loop (PLL) circuit by .
- Step 2:
- With the help of , and complete the converting from the stationary abc coordinate system to the synchronous rotating dq coordinate system to get , and .
- Step 3:
- and are obtained after the division between , and .
- Step 4:
- and are converted from the synchronous rotating dq coordinate system to the stationary abc coordinate system after compared with and . Then the control waveform of PWM is formed to control the PV inverter accordingly.
It is worth mentioning that, the calculation of and from and is as follows:
Since and meet the following condition:
and there is , so and can be obtained by the expressions as follows:
3.2. Evaluation Indicators of The Power Quality
As the relevant codes of grid and PV systems are multifaceted, evaluation indicators of control effects under a certain control strategy should not be limited to a single aspect. In this paper, a comprehensive concept: power quality is defined to evaluate the control effects of integrated reactive power control strategy. The power quality is mainly composed of three specific indicators: voltage deviation, power factor and THD, as described below:
- (1)
- Voltage deviationThe operating indicators and the service life of various power equipment are designed based on their rated voltage. If the actual grid voltage deviates from its standard value, the operation safety and service life of power equipment will be damaged. The greater the voltage deviation, the greater the damage to the power equipment. The voltage deviation can be obtained using the expression given below:where, is the voltage deviation, is measured PCC voltage, is standard PCC voltage.
- (2)
- Power factorPower factor reflects the proportion of active power in apparent power. If power factor remains at a low level, the operation efficiency of power equipment is greatly reduced, and the power loss in the transmission line increases greatly. The power factor can be obtained using the expression given below:where, is the power factor, is active power, is active power.
- (3)
- THDTHD is used to describe the proportion of the harmonic components in the grid. In the grid, there are a lot of power electronic devices such as converters that produce harmonic components in the operation, resulting in increased power losses of other power equipment. The THD can be obtained using the expression given below.where, is the total harmonic distortion rate, is the order of the highest harmonics, is RMS (Root Mean Square) value of harmonic components, which is replaced by when calculating the THD of the current and is replaced by when calculating the THD of the voltage.
With reference to the relevant codes of the state grid in China [34,35], the requirements for voltage deviation, power factor and THD are shown in Table 1. In subsequent simulation experiments, the codes that the power quality of the integrated reactive power control strategy must meet are specified in Table 1.
4. Simulation Results
To test the control effects in integrated control strategy, following simulations were carried out as follows. In these simulations, the environmental data (such as sun irradiance and temperature) of the PV system was based on the measured weather data in the solar station published by the U.S. Department of Energy’s Renewable Energy Laboratory [24]. Load and grid operation models were set up according to the specific circumstances in different experiments.
As the integrated control strategy contains four kinds of control modes, in the course of experiments, the four control modes were tested separately. Then, the effectiveness of the integrated control strategy was proved in the simulation on four control modes combined by the switch method shown in Figure 4. All the simulation results were compared with the results from traditional power factor control strategy. The details about the simulations are as follows.
4.1. Simulations on Normal Operation Control Mode
The following simulation environment was set up to test the control effects under normal operation control mode:
- (1)
- Sun irradiance and ambient temperature changed slowly and smoothly. Specifically, sun irradiance was slowly changed at about 1000 W/m2, and ambient temperature was changed within the range of [25 °C, 30 °C] smoothly.
- (2)
- The load was basically unchanged during the simulation.
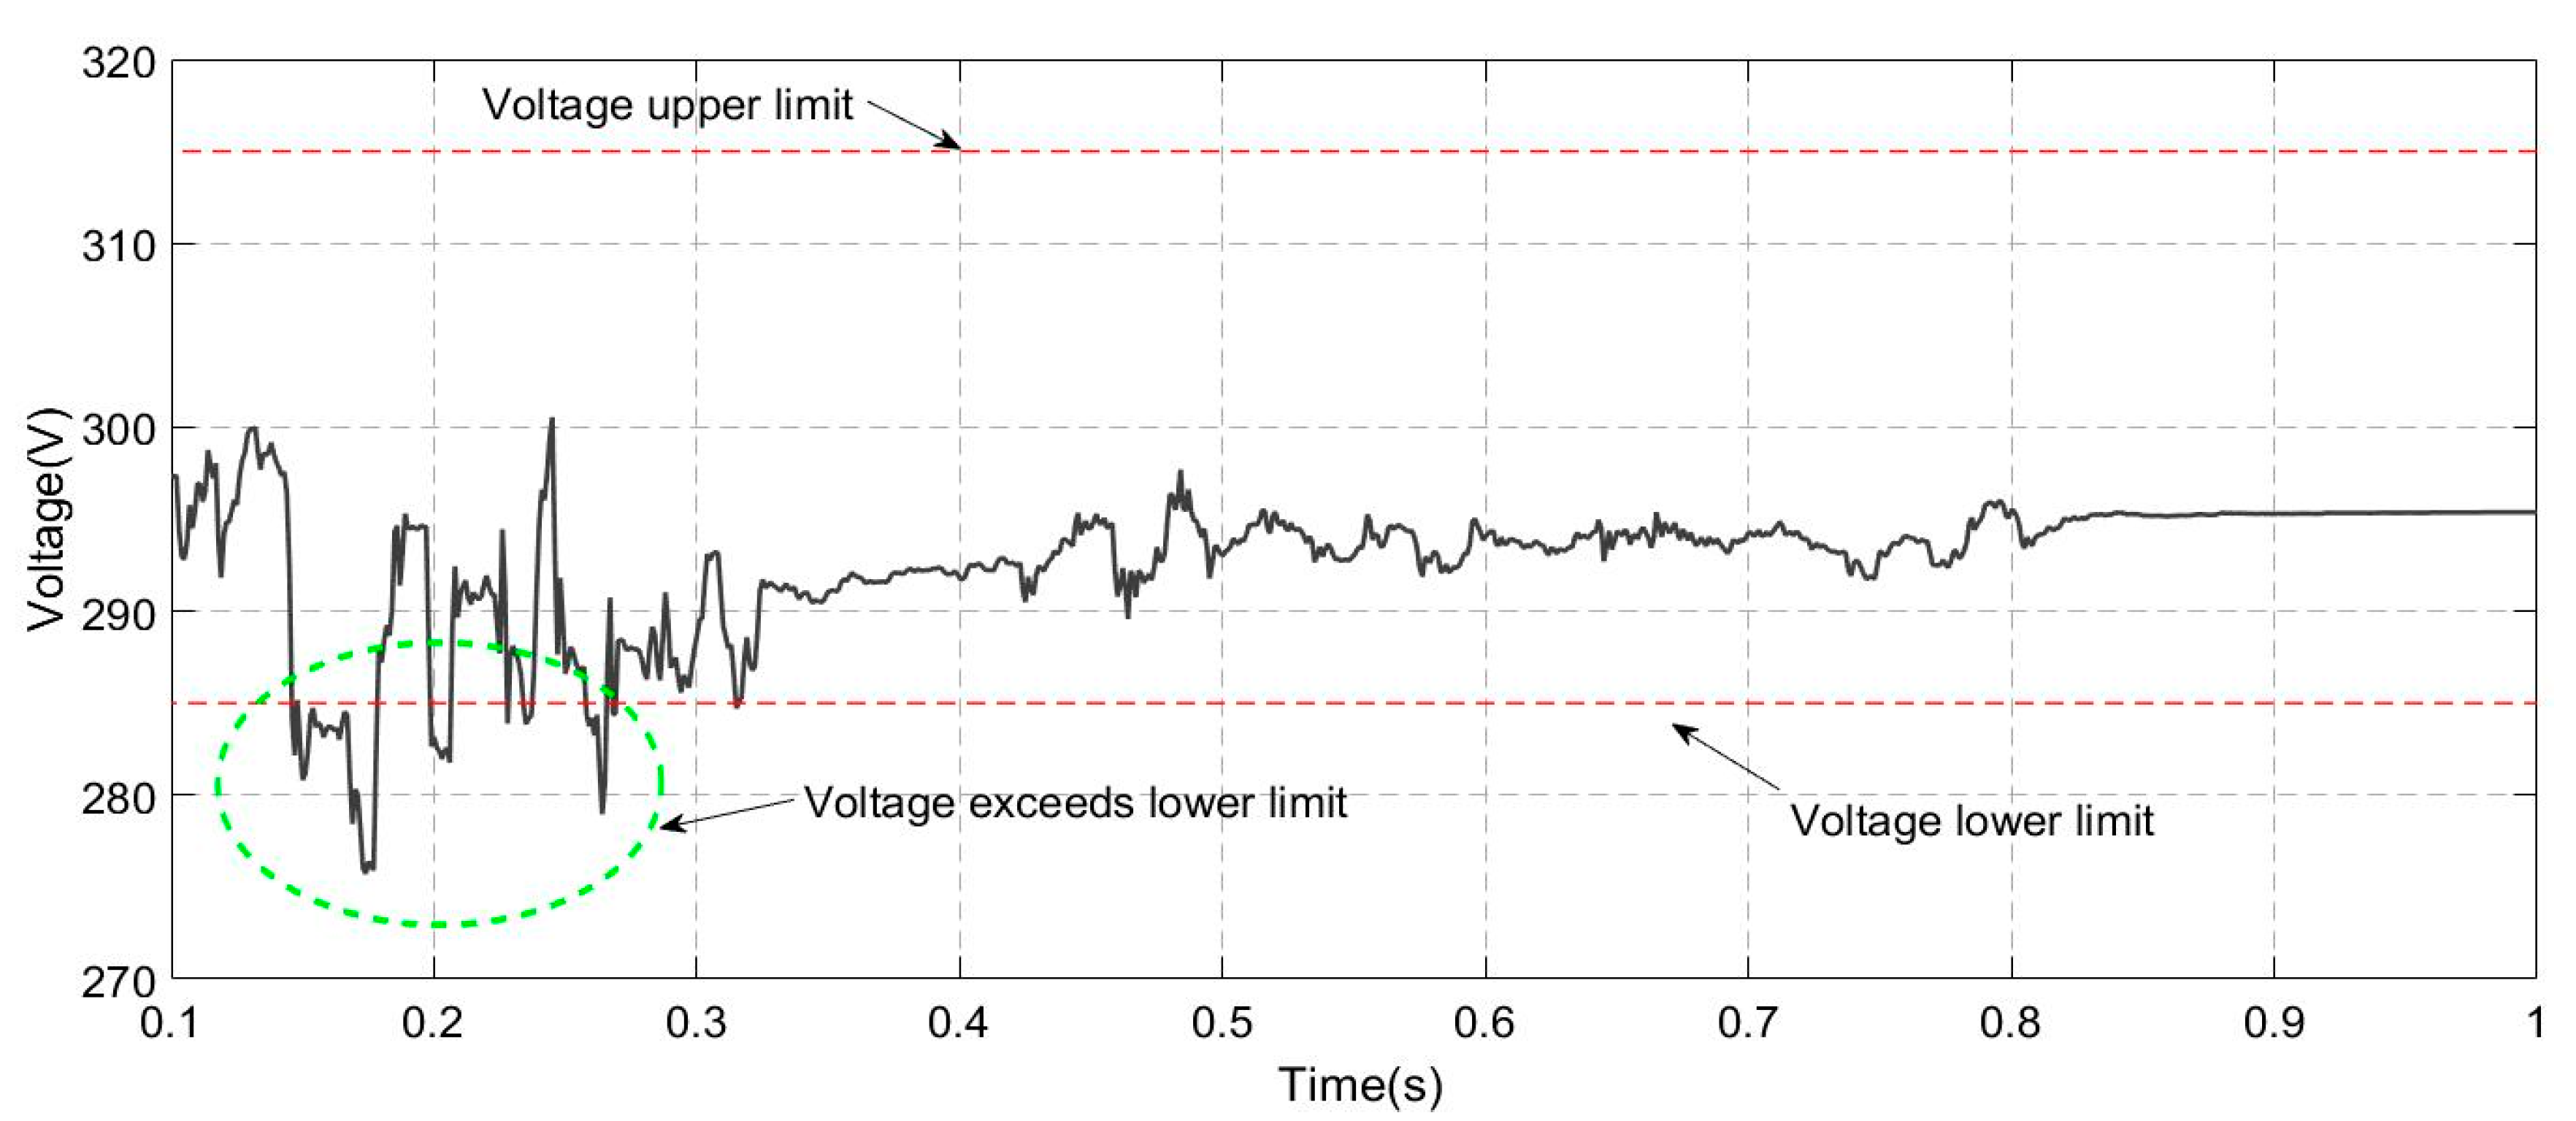
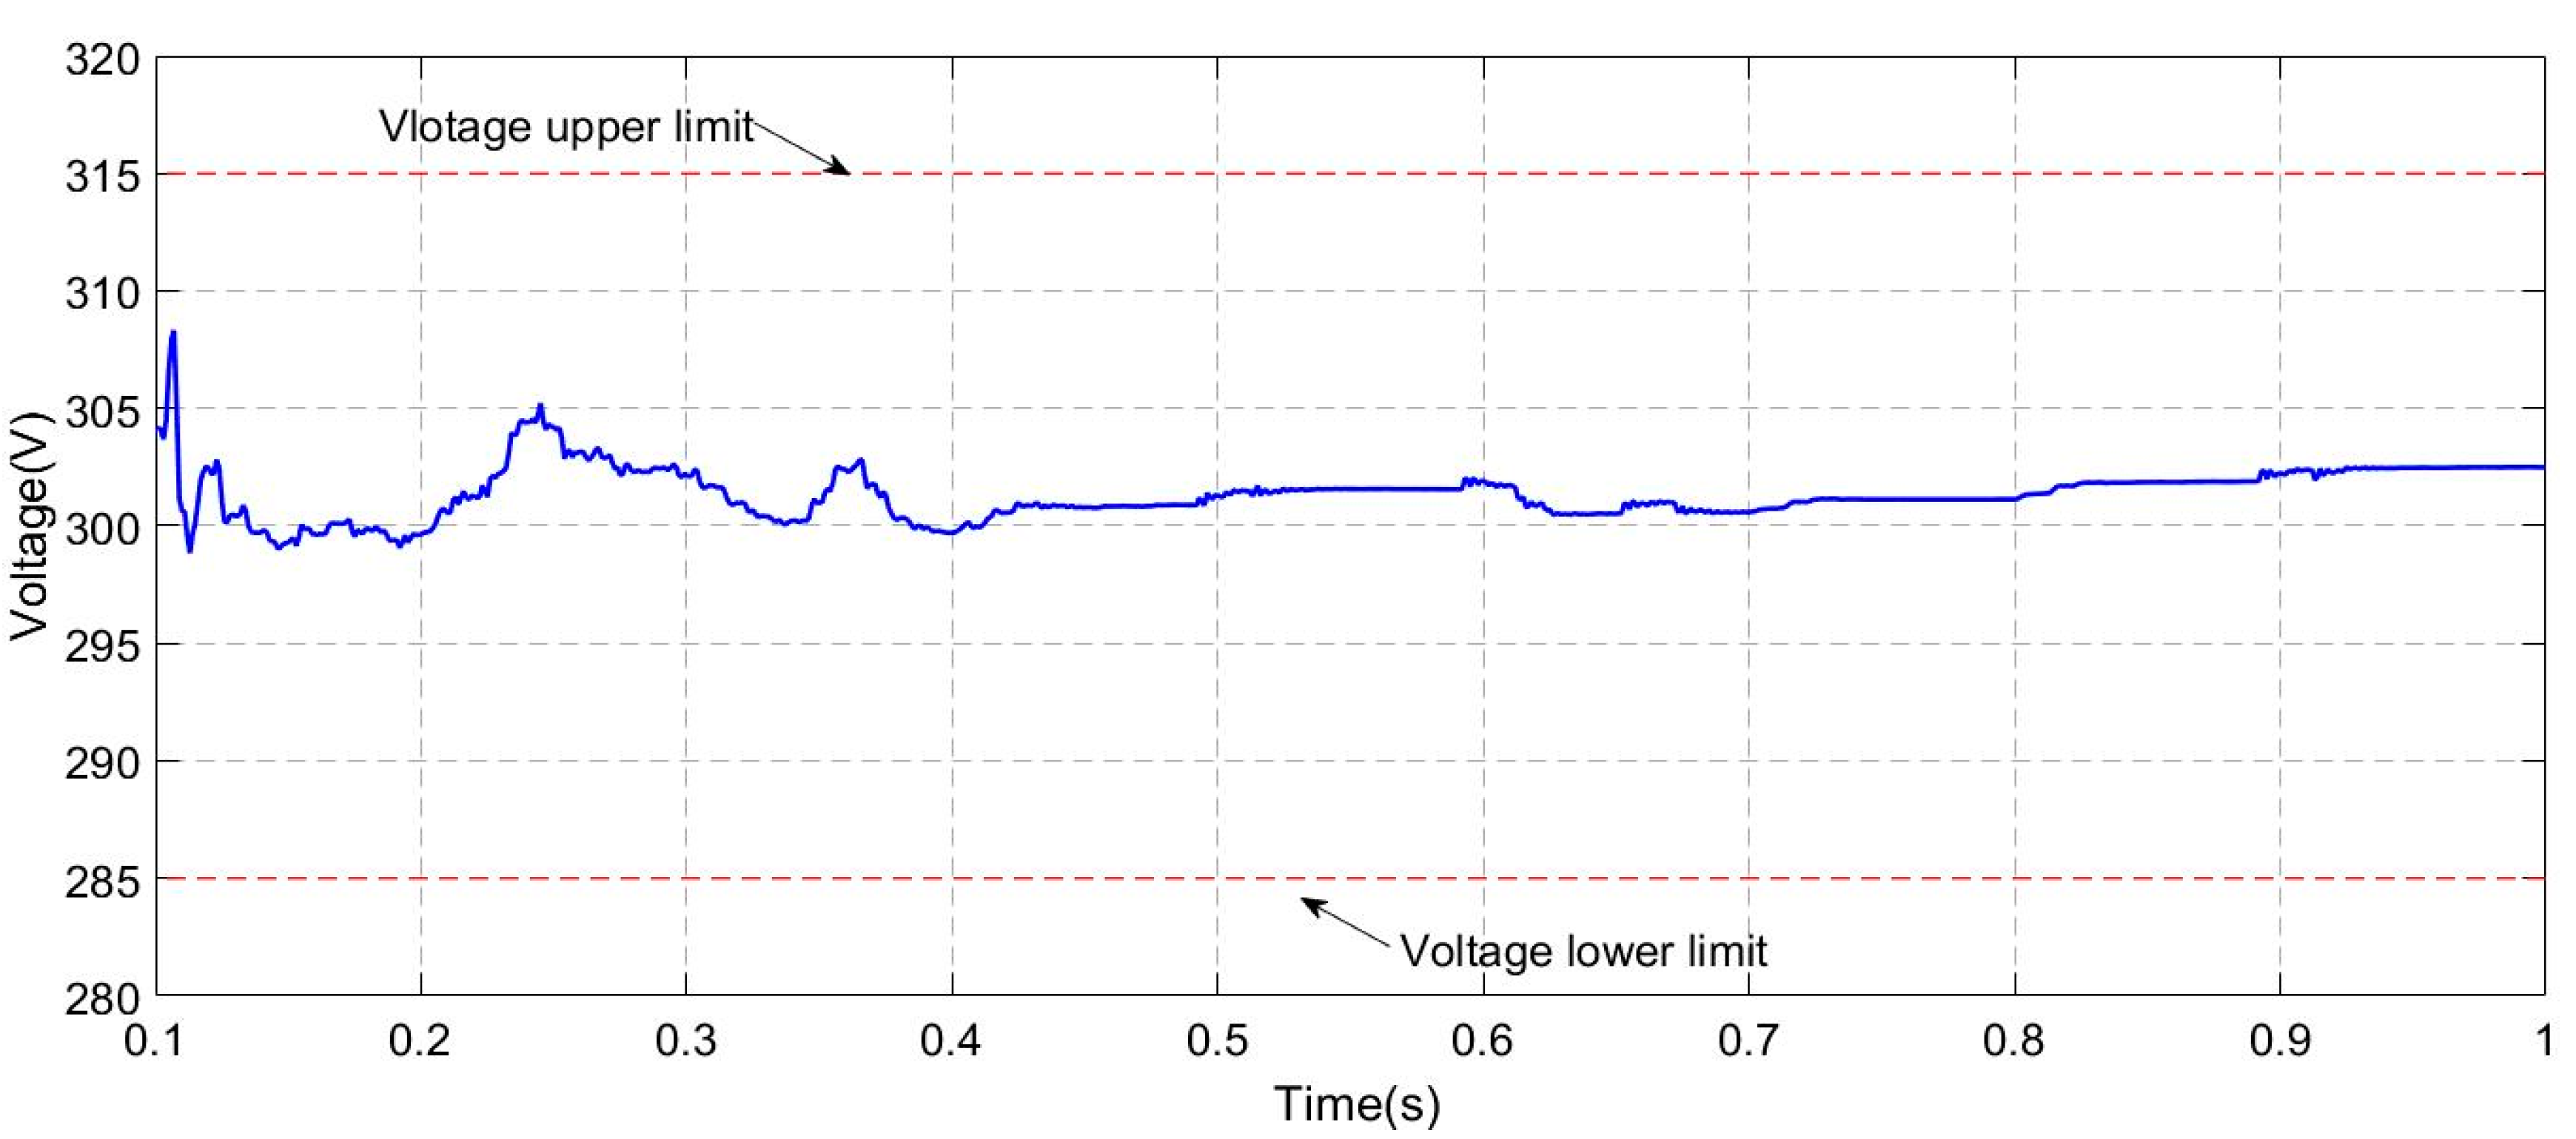
In Figure 5 and Figure 6, the gray and blue curves were the waveforms of under the power factor control strategy and the proposed normal operation control mode, and the two red dotted lines were the upper and lower limits of the allowable voltage fluctuations. The allowable fluctuations range of was set to ±5% in simulation. Since the standard value of was 300 V, the upper and lower limits of the allowable fluctuation were set to 315 V and 285 V.
As shown in Figure 5, fell under the lower limit of the allowable fluctuations in multiple times under power factor control strategy which was not allowed in the operation of the PV system.
As shown in Figure 6, did not exceed the upper and lower limits in the simulation. More precisely, was strictly controlled in a small range of [298 V, 309 V], and remained at about 303 V in the latter part of the simulation under normal operation control mode. The simulation results above proved that the proposed normal operation control mode is helpful for safety and stableness of the PV system by mitigating the fluctuations.
4.2. Simulations on Reverse Power Control Mode
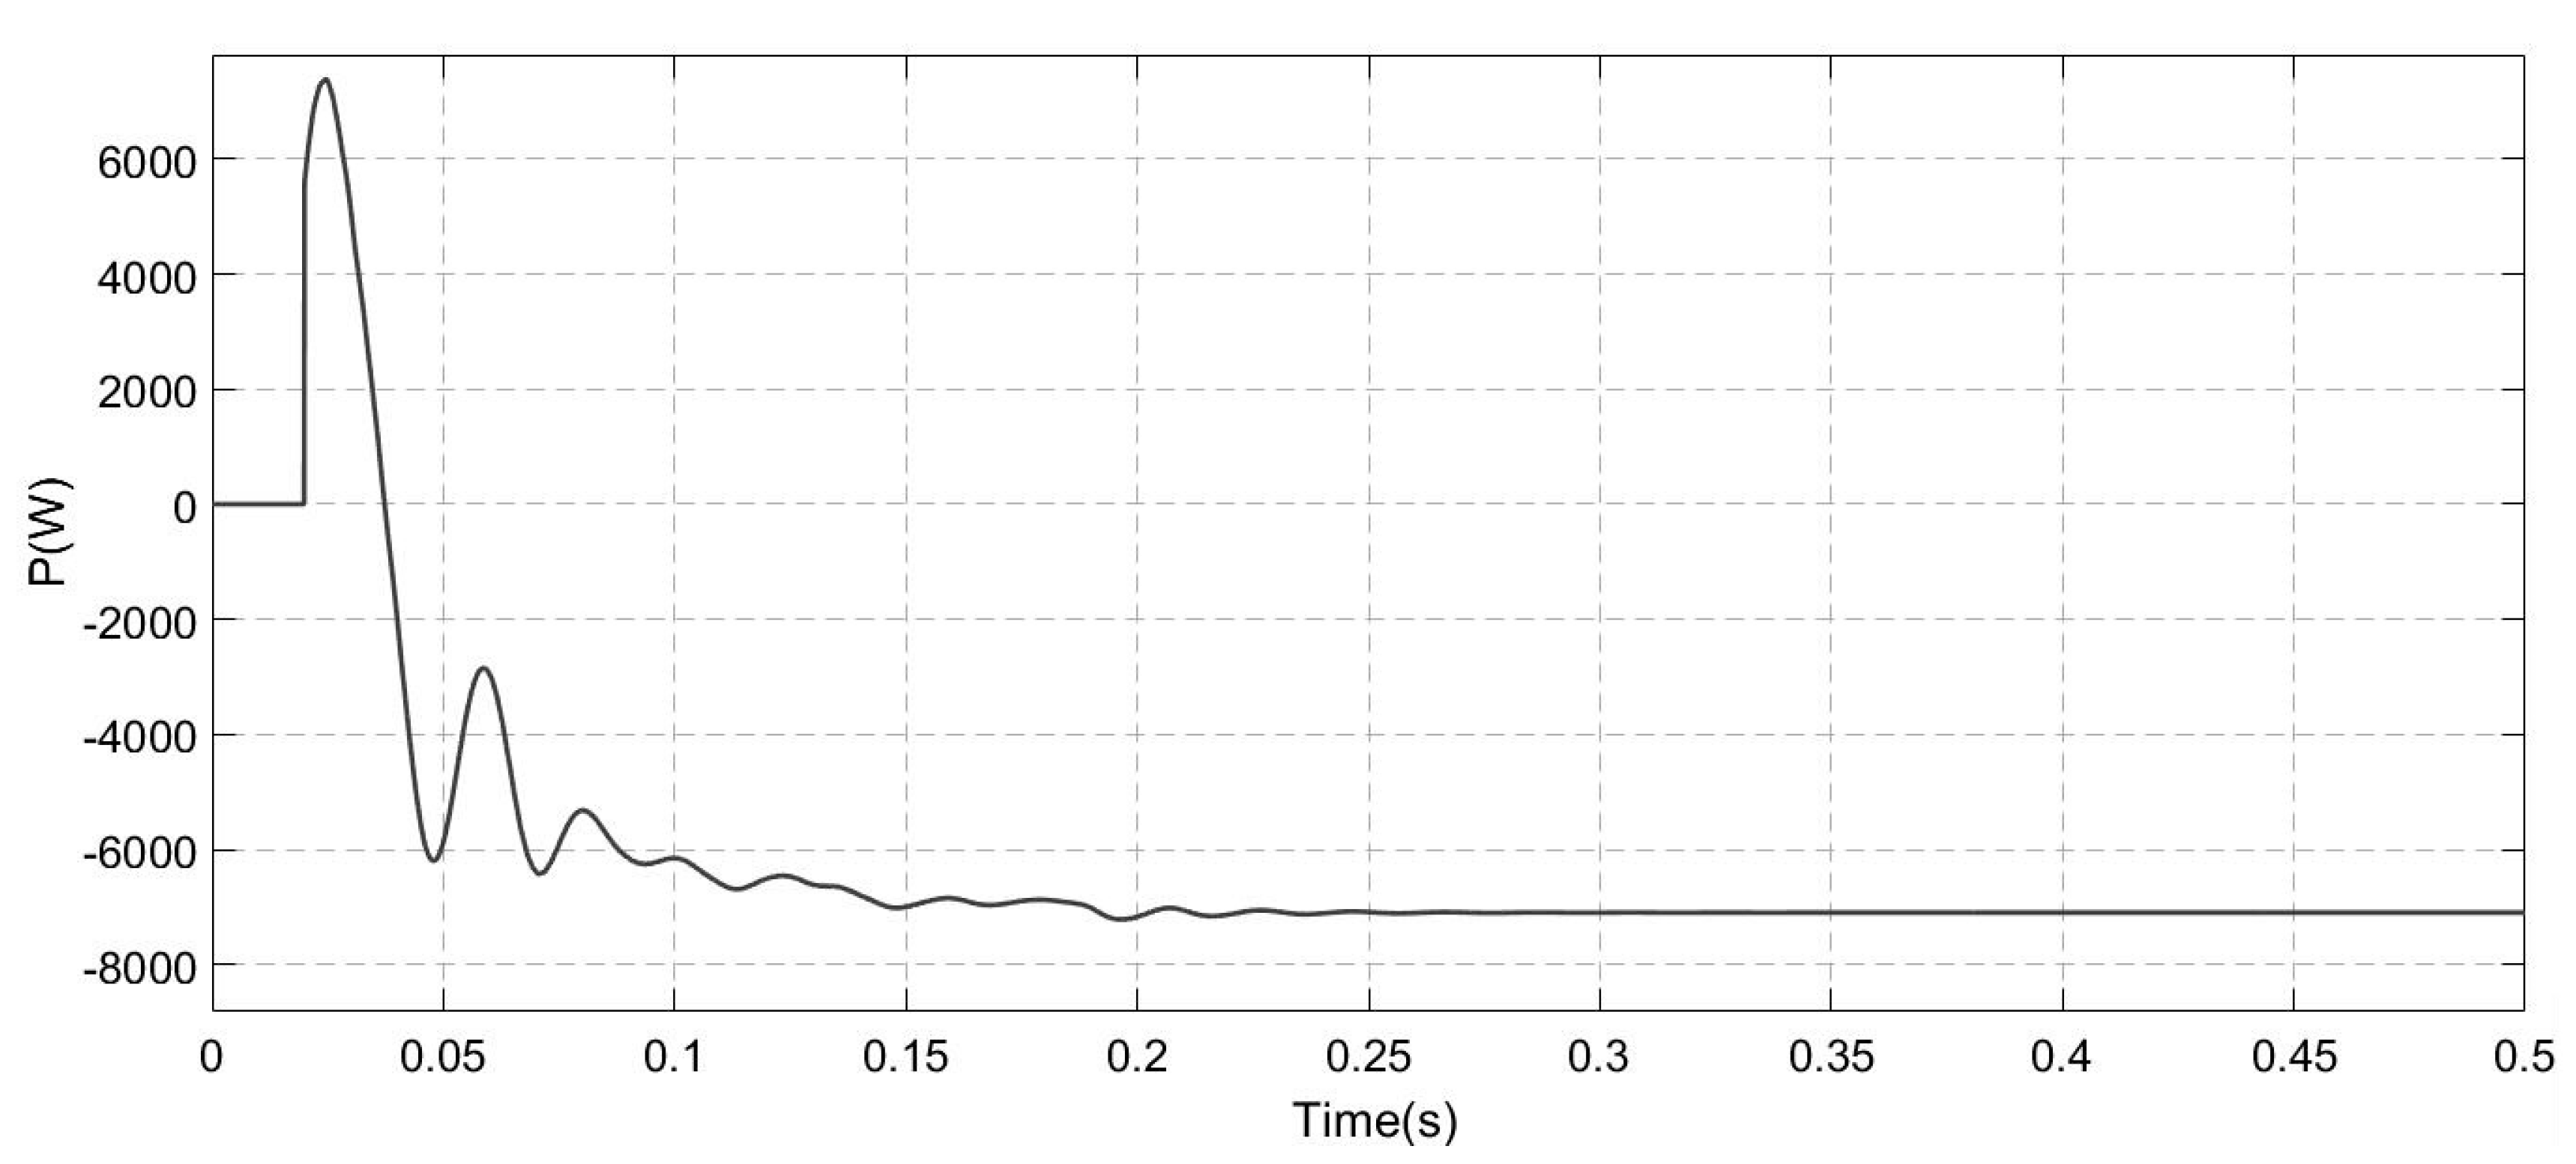
The effect of reverse power control mode was verified by the following simulations: the waveform of active power in PCC was shown in Figure 7. Positive power value in Figure 7 represented the normal direction of the power flow, while negative power value meant the presence of reverse power.
The active power consumption of load was less than active power output from PV system , so the reverse power occurred which was about 7 kW.
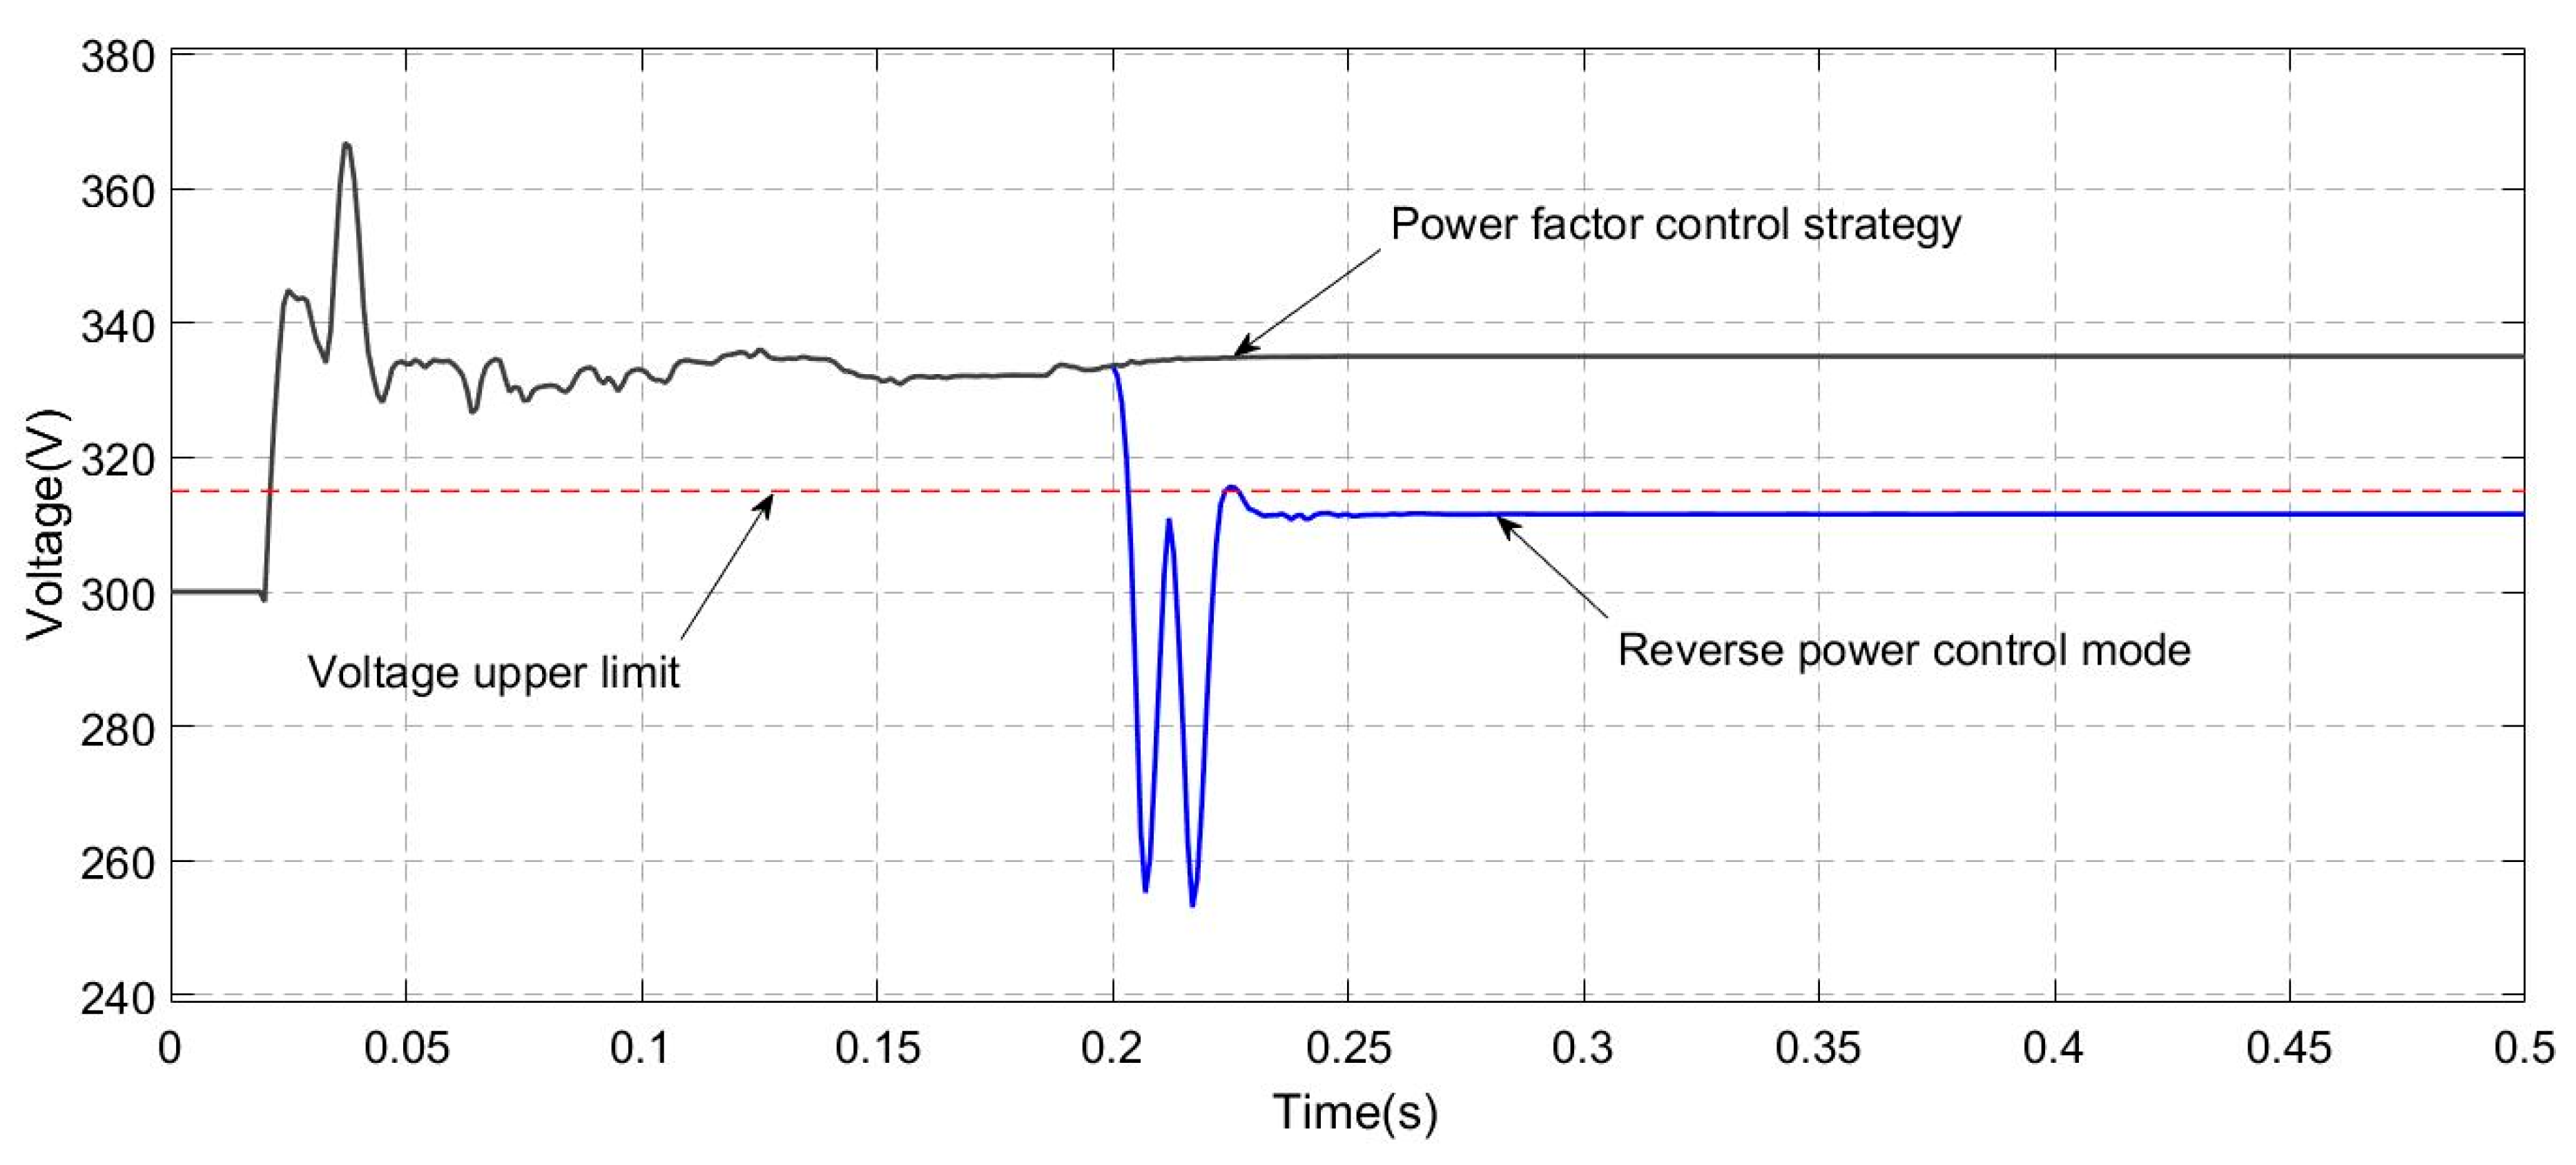
The waveforms of under power factor control strategy and the proposed reverse power control mode were shown in Figure 8.
The standard value of was set at 300 V, the upper limit of voltage fluctuation was set to 105% (i.e., the upper limit of voltage fluctuation is 315 V.) which was shown by red dotted line in Figure 8. The gray curve was the waveform of under the power factor control strategy. It can be seen that, due to the emergence of reverse power, rose over the upper limit which was 315 V, and ultimately stabilized at about 335 V. The rate of deviation from the standard value was as high as 11.67%. The blue curve was the waveform of under the proposed reverse power control mode which came into operation at 0.2 s. When the proposed reverse power control mode came into operation at 0.2 s, was only dropped significantly after fluctuating for a short period of time (about 0.03 s). was stabilized at around 311.5 V, and the deviation rate was reduced to 3.83%.
The quantity of reactive power consumed was calculated from Equation (6), as shown in Figure 9. After the proposed reverse power control mode came into operation at 0.2 s, the quantity of reactive power consumed was 20 kVar which was a value of Var after 0.2 s in Figure 9.
The proposed reverse power control mode had a significant effect on the mitigation of rise caused by the reverse power, and the deviation rate was decreased by 7.84% compared to power factor control strategy. Reaction time was only 0.03 s, which showed that the control mode can adapt to real-time voltage control needs of a rapidly changing PV system.
4.3. Simulations on Cloudy Control Mode
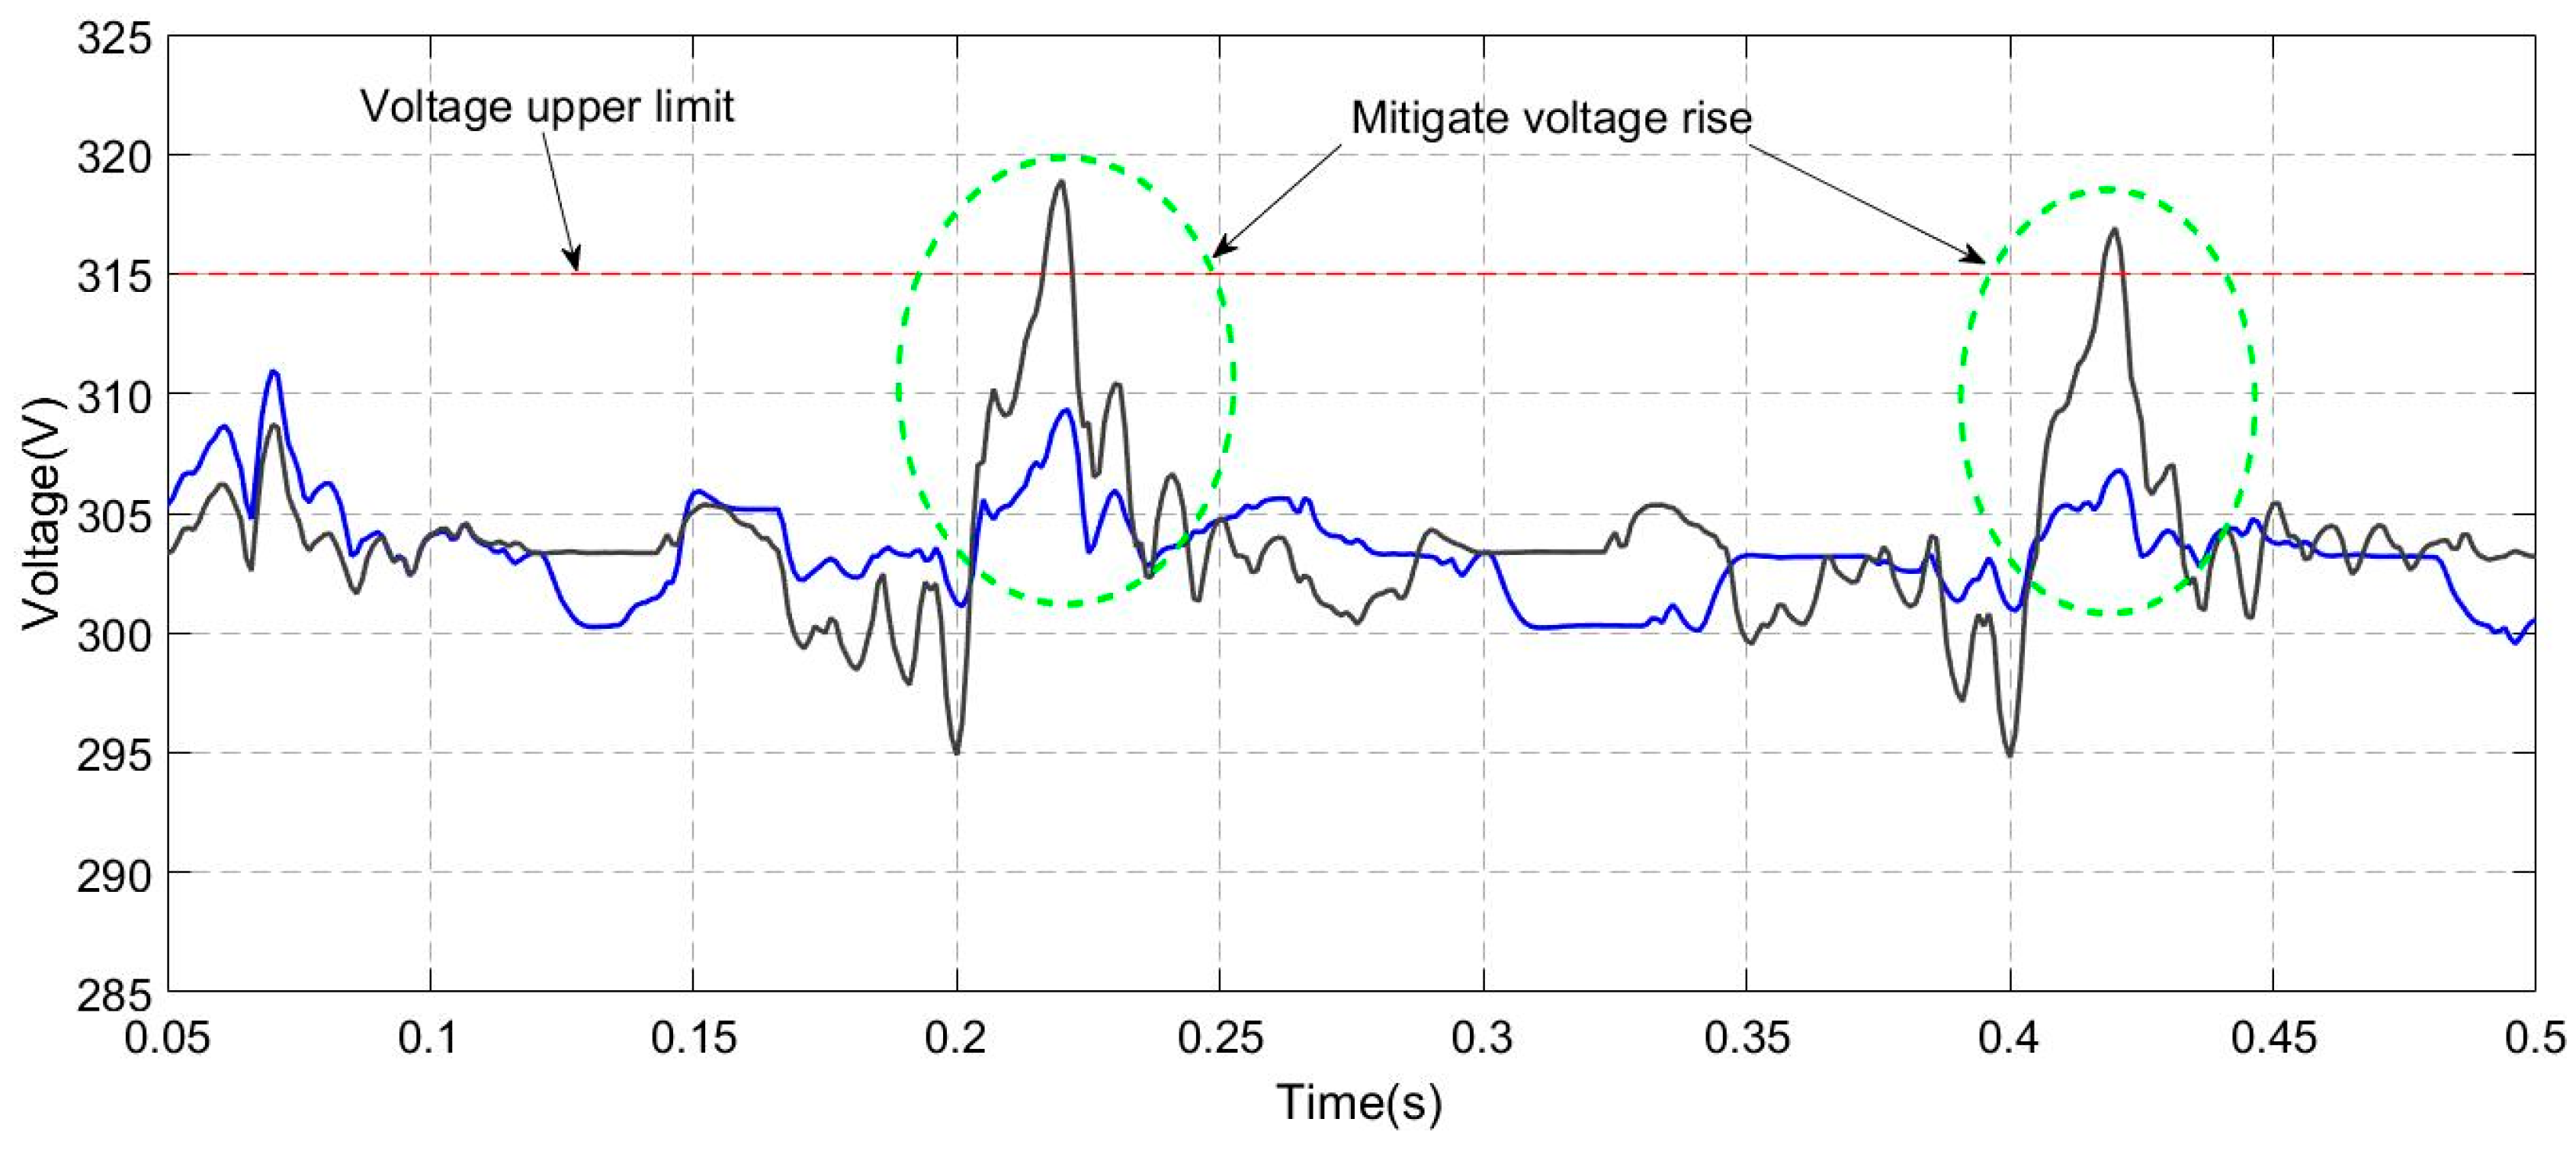
The following simulation environment is designed as follows in the process of the experimental verification of the cloudy control mode. That is, high change rates of the PV system output caused by substantial increase in the degree of sun irradiance at 0.2 s and 0.4 s.
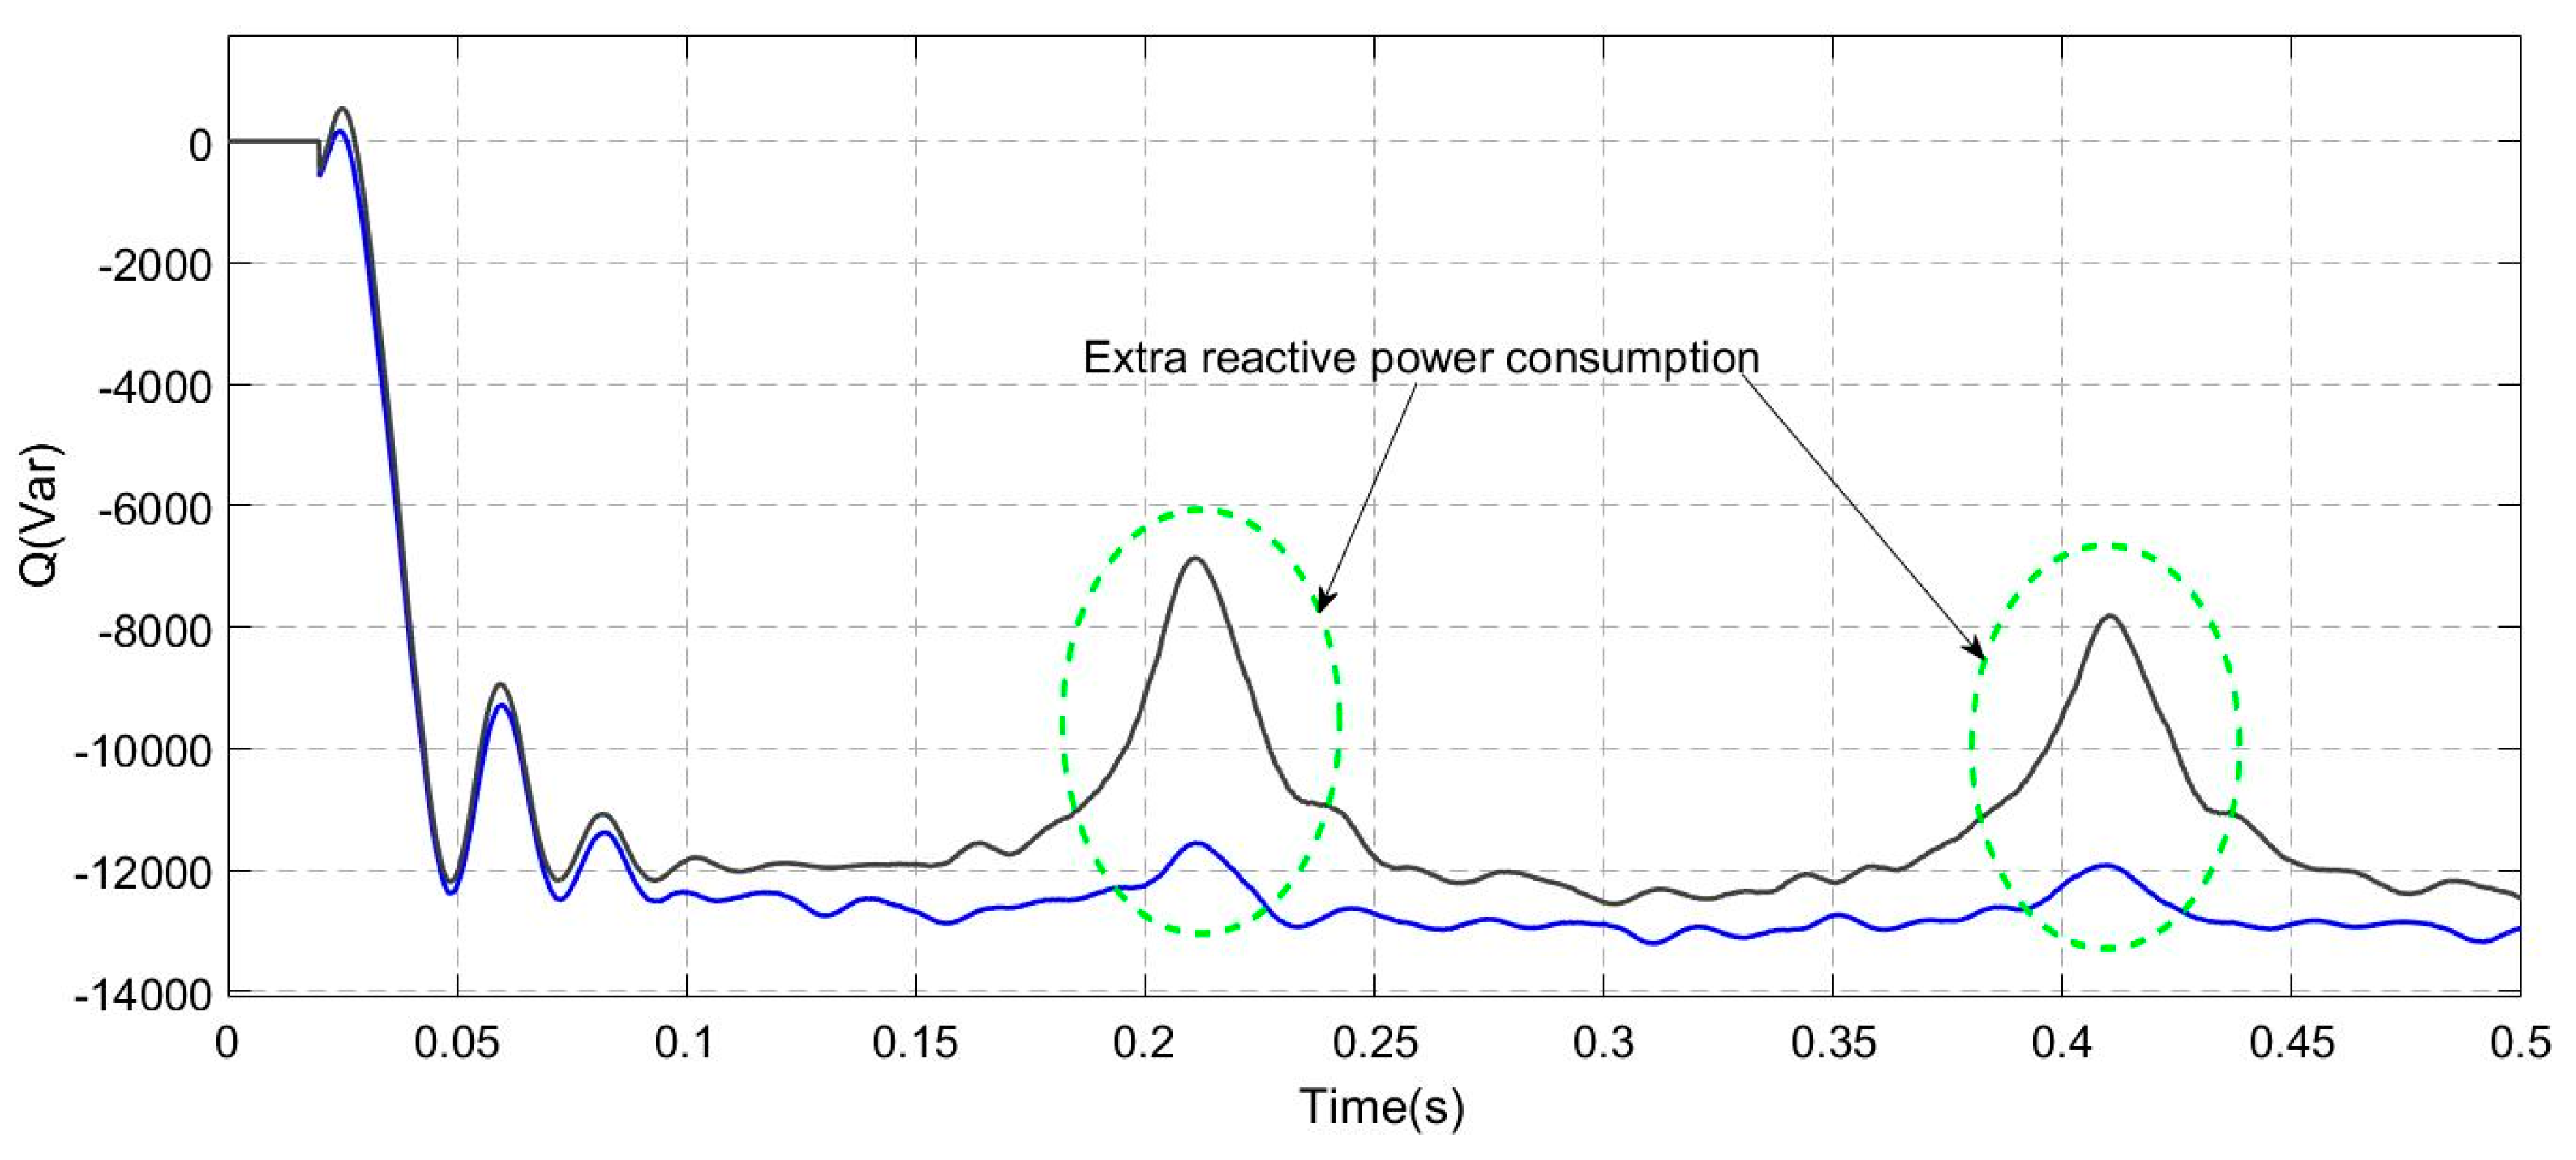
In this experimental environment, the results in Figure 10 and Figure 11 were obtained. In Figure 10, the gray and blue curves were the waveforms of the under the power factor control strategy and the proposed cloudy control mode. In the time range of 0.2 s–0.25 s and 0.4 s–0.45 s, over the upper limit occurred two times caused by the sudden increase of under power factor control strategy. The maximum deviation rate from the standard value of was about 6.33%. While in another simulation under the proposed cloudy control mode, the fluctuations of was obviously mitigated, and the deviation rate was limited to less than 2.83%.
In Figure 11, the gray and blue curves were the waveforms of reactive power consumption under the power factor control strategy and the proposed cloudy control mode.
In the time range of 0.2 s–0.25 s and 0.4 s–0.45 s under the proposed cloudy control mode, there were about 5 kVar additional reactive power consumption in PV inverter compared with the power factor control strategy. This was the reason why the cloudy control mode could effectively mitigate the fluctuations of .
4.4. Simulations on Night Control Mode
The control structure shown in Figure 2 was established in the simulation environment to verify the effect of improvement in voltage quality under the night control mode. The results are shown in Figure 12 and Figure 13.
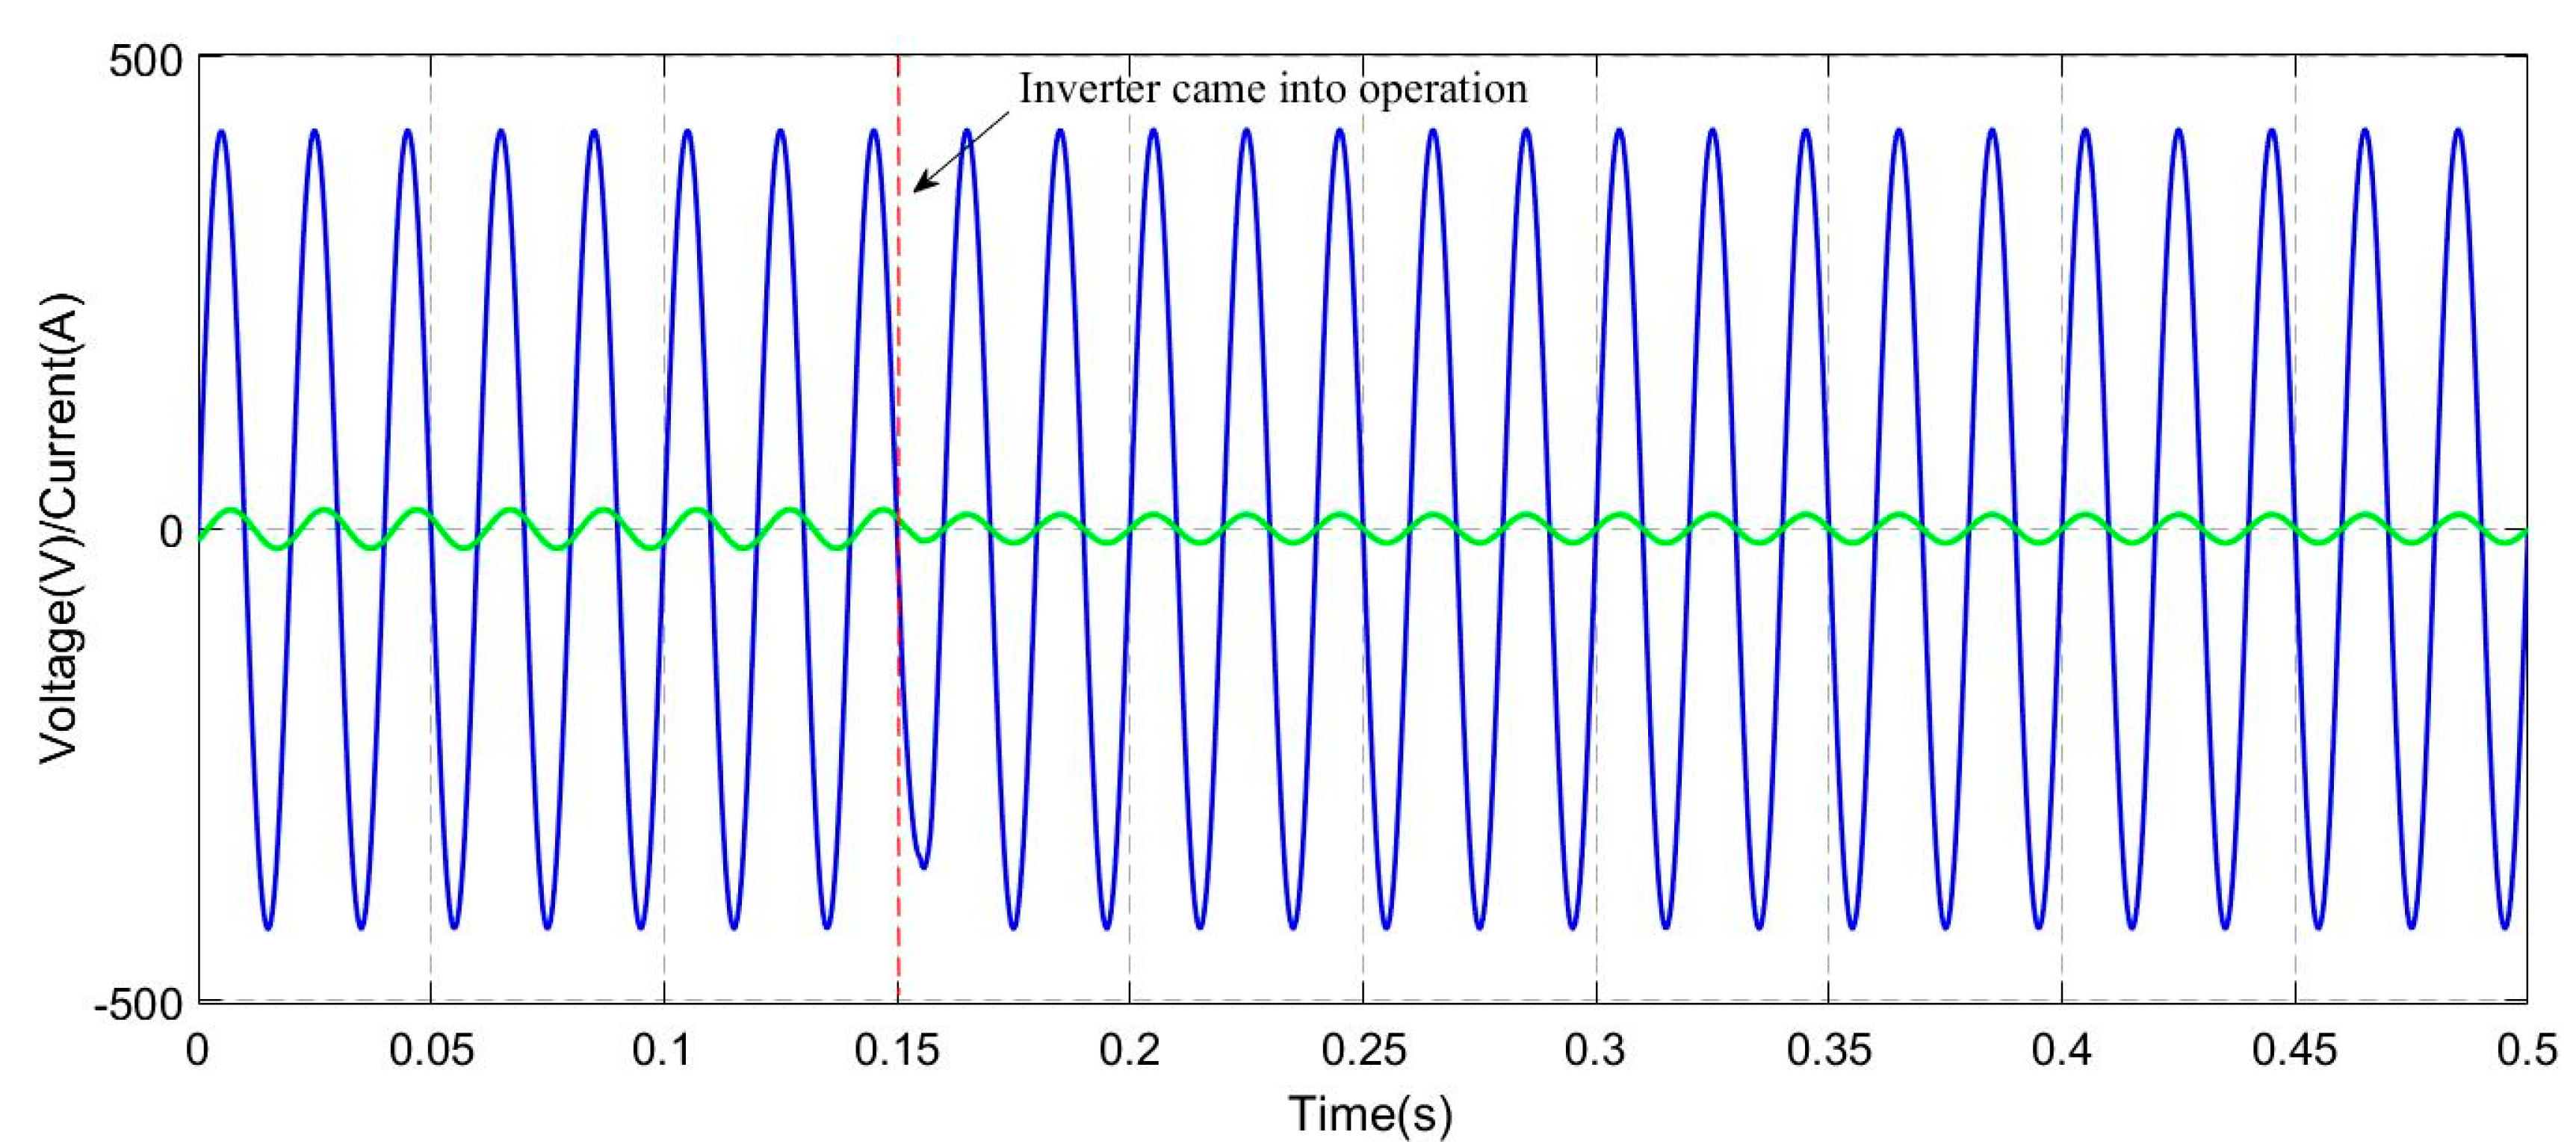
In the simulations, there was a resistance-inductance load. The consumption of load in active power and reactive power was 11 kW and 5 kVar. At 0.15 s, PV inverter controlled by the proposed night control mode came into operation, and the compensation of reactive power was carried out.
In the time range of 0 s–0.15 s, the phase angle of load current lagged behind the phase angle of voltage due to the resistance-inductance load. This showed that due to the existence of reactive power in power grid, power factor and power quality at load were significantly reduced which must be treated. At 0.15 s, the PV inverter came into operation. The power factor at the load was increased, and the phase angles of voltage and current were approximately identical, which indicated the effectiveness of the proposed night control mode in improving the power quality.
The waveform of phase difference between voltage and current is shown in Figure 13. In 0 s–0.15 s, the phase angle difference was maintained at about 36 degrees, that is, the power factor at the load was at a low level of 0.809. After the PV inverter came into operation at 0.15 s, the phase angle was reduced approximately to 0° (i.e., the power factor is approximately 1), and the reaction time was only about 0.025 s.
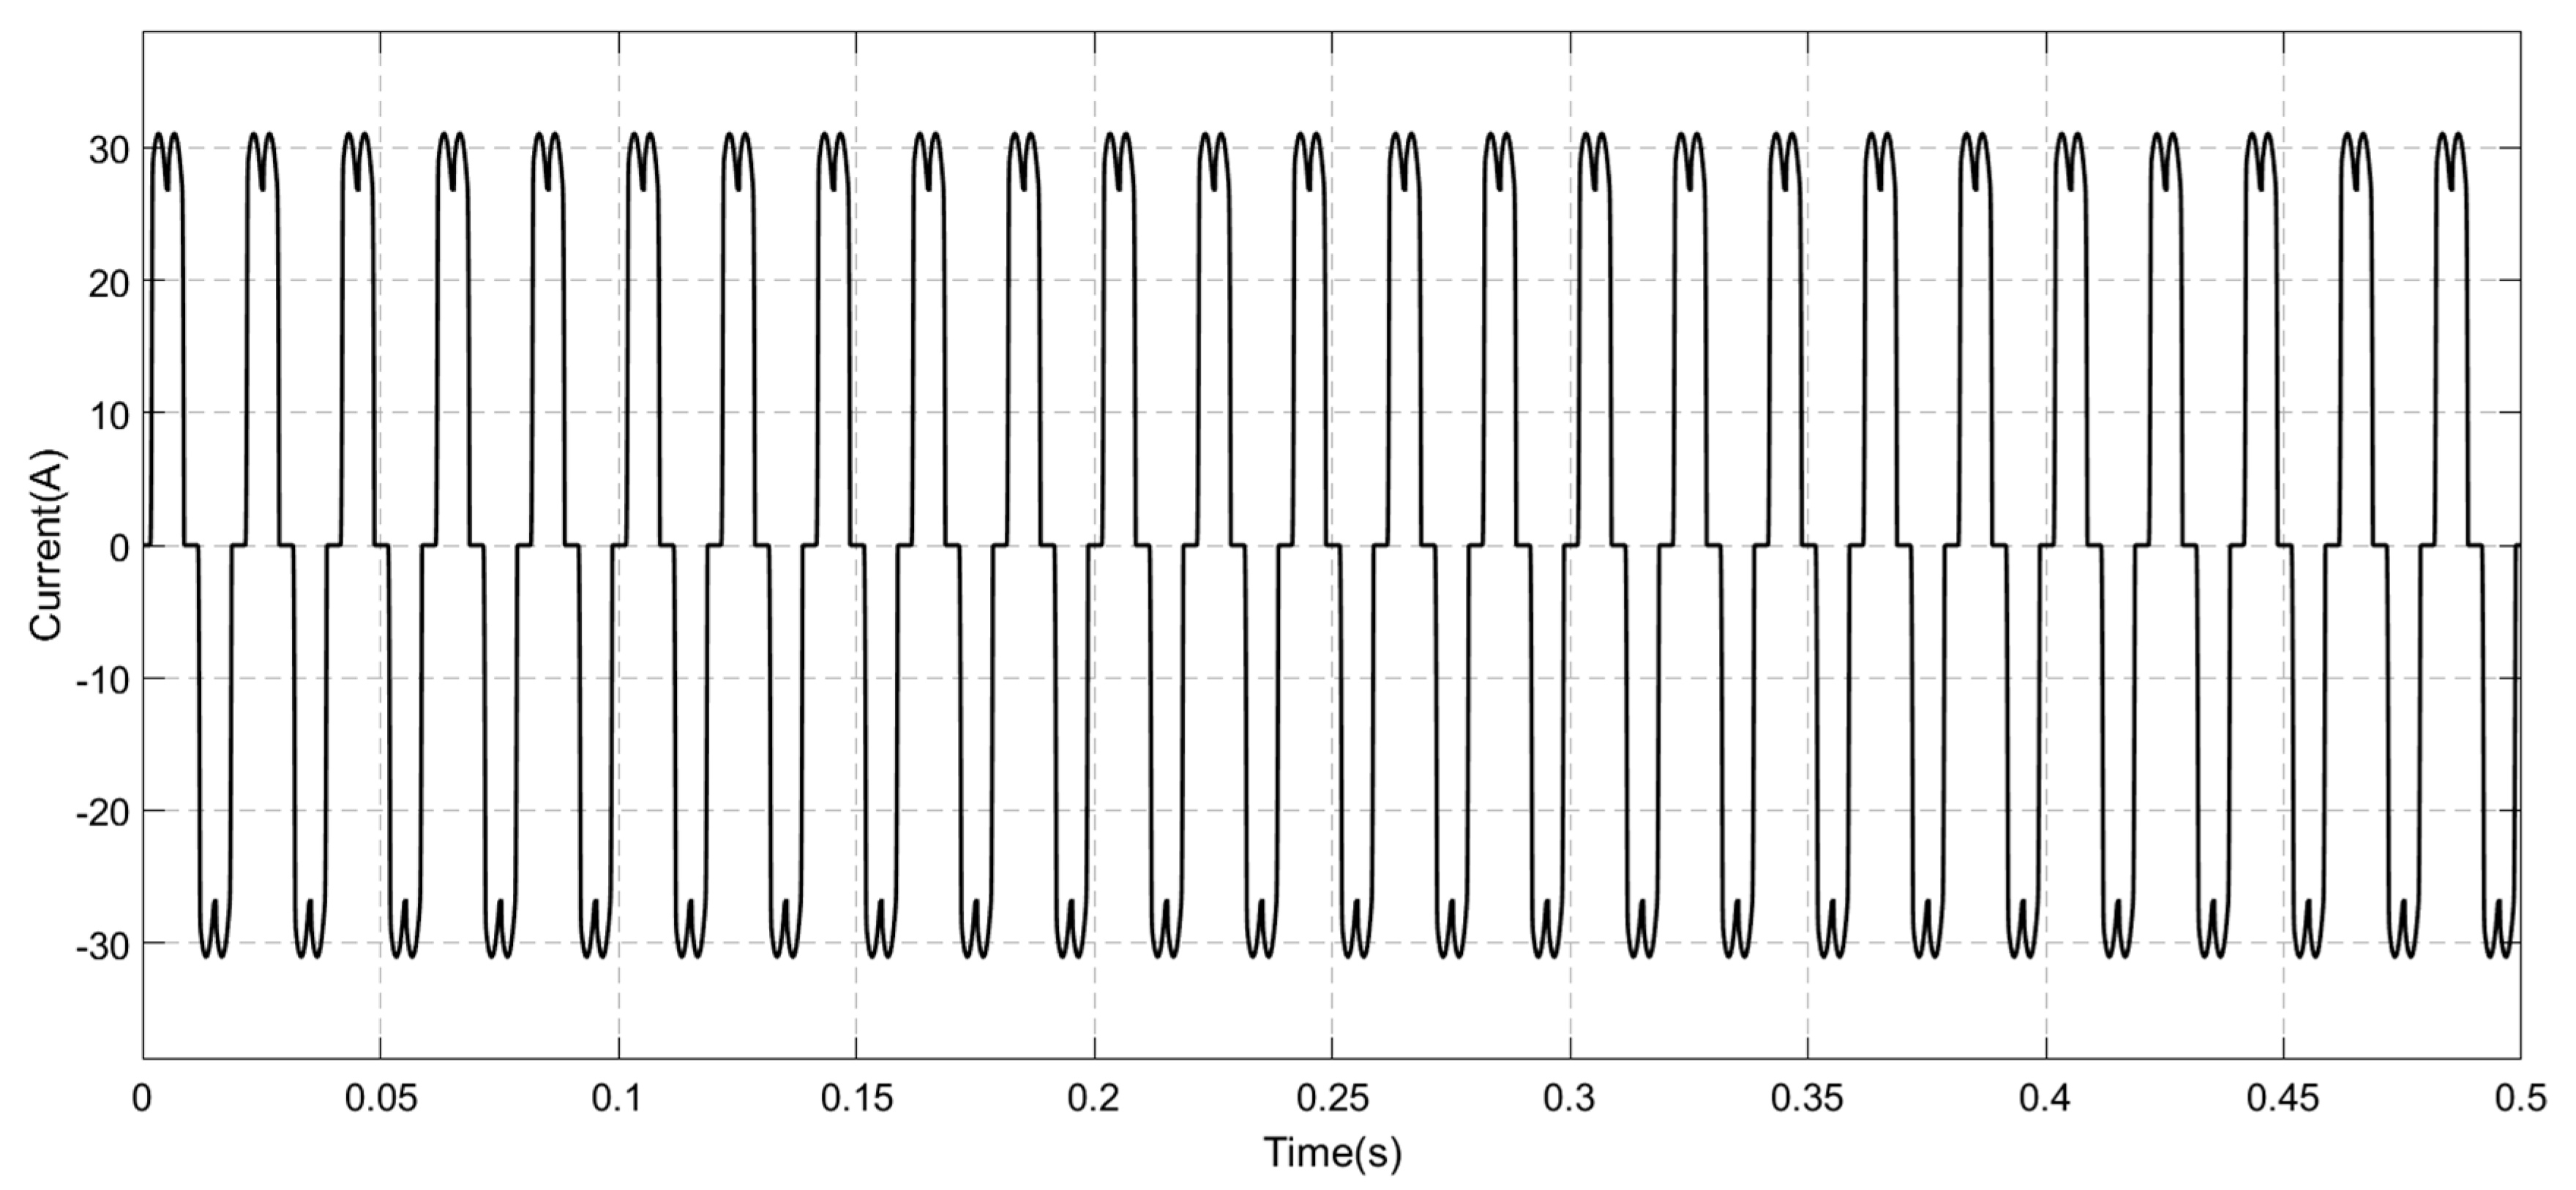
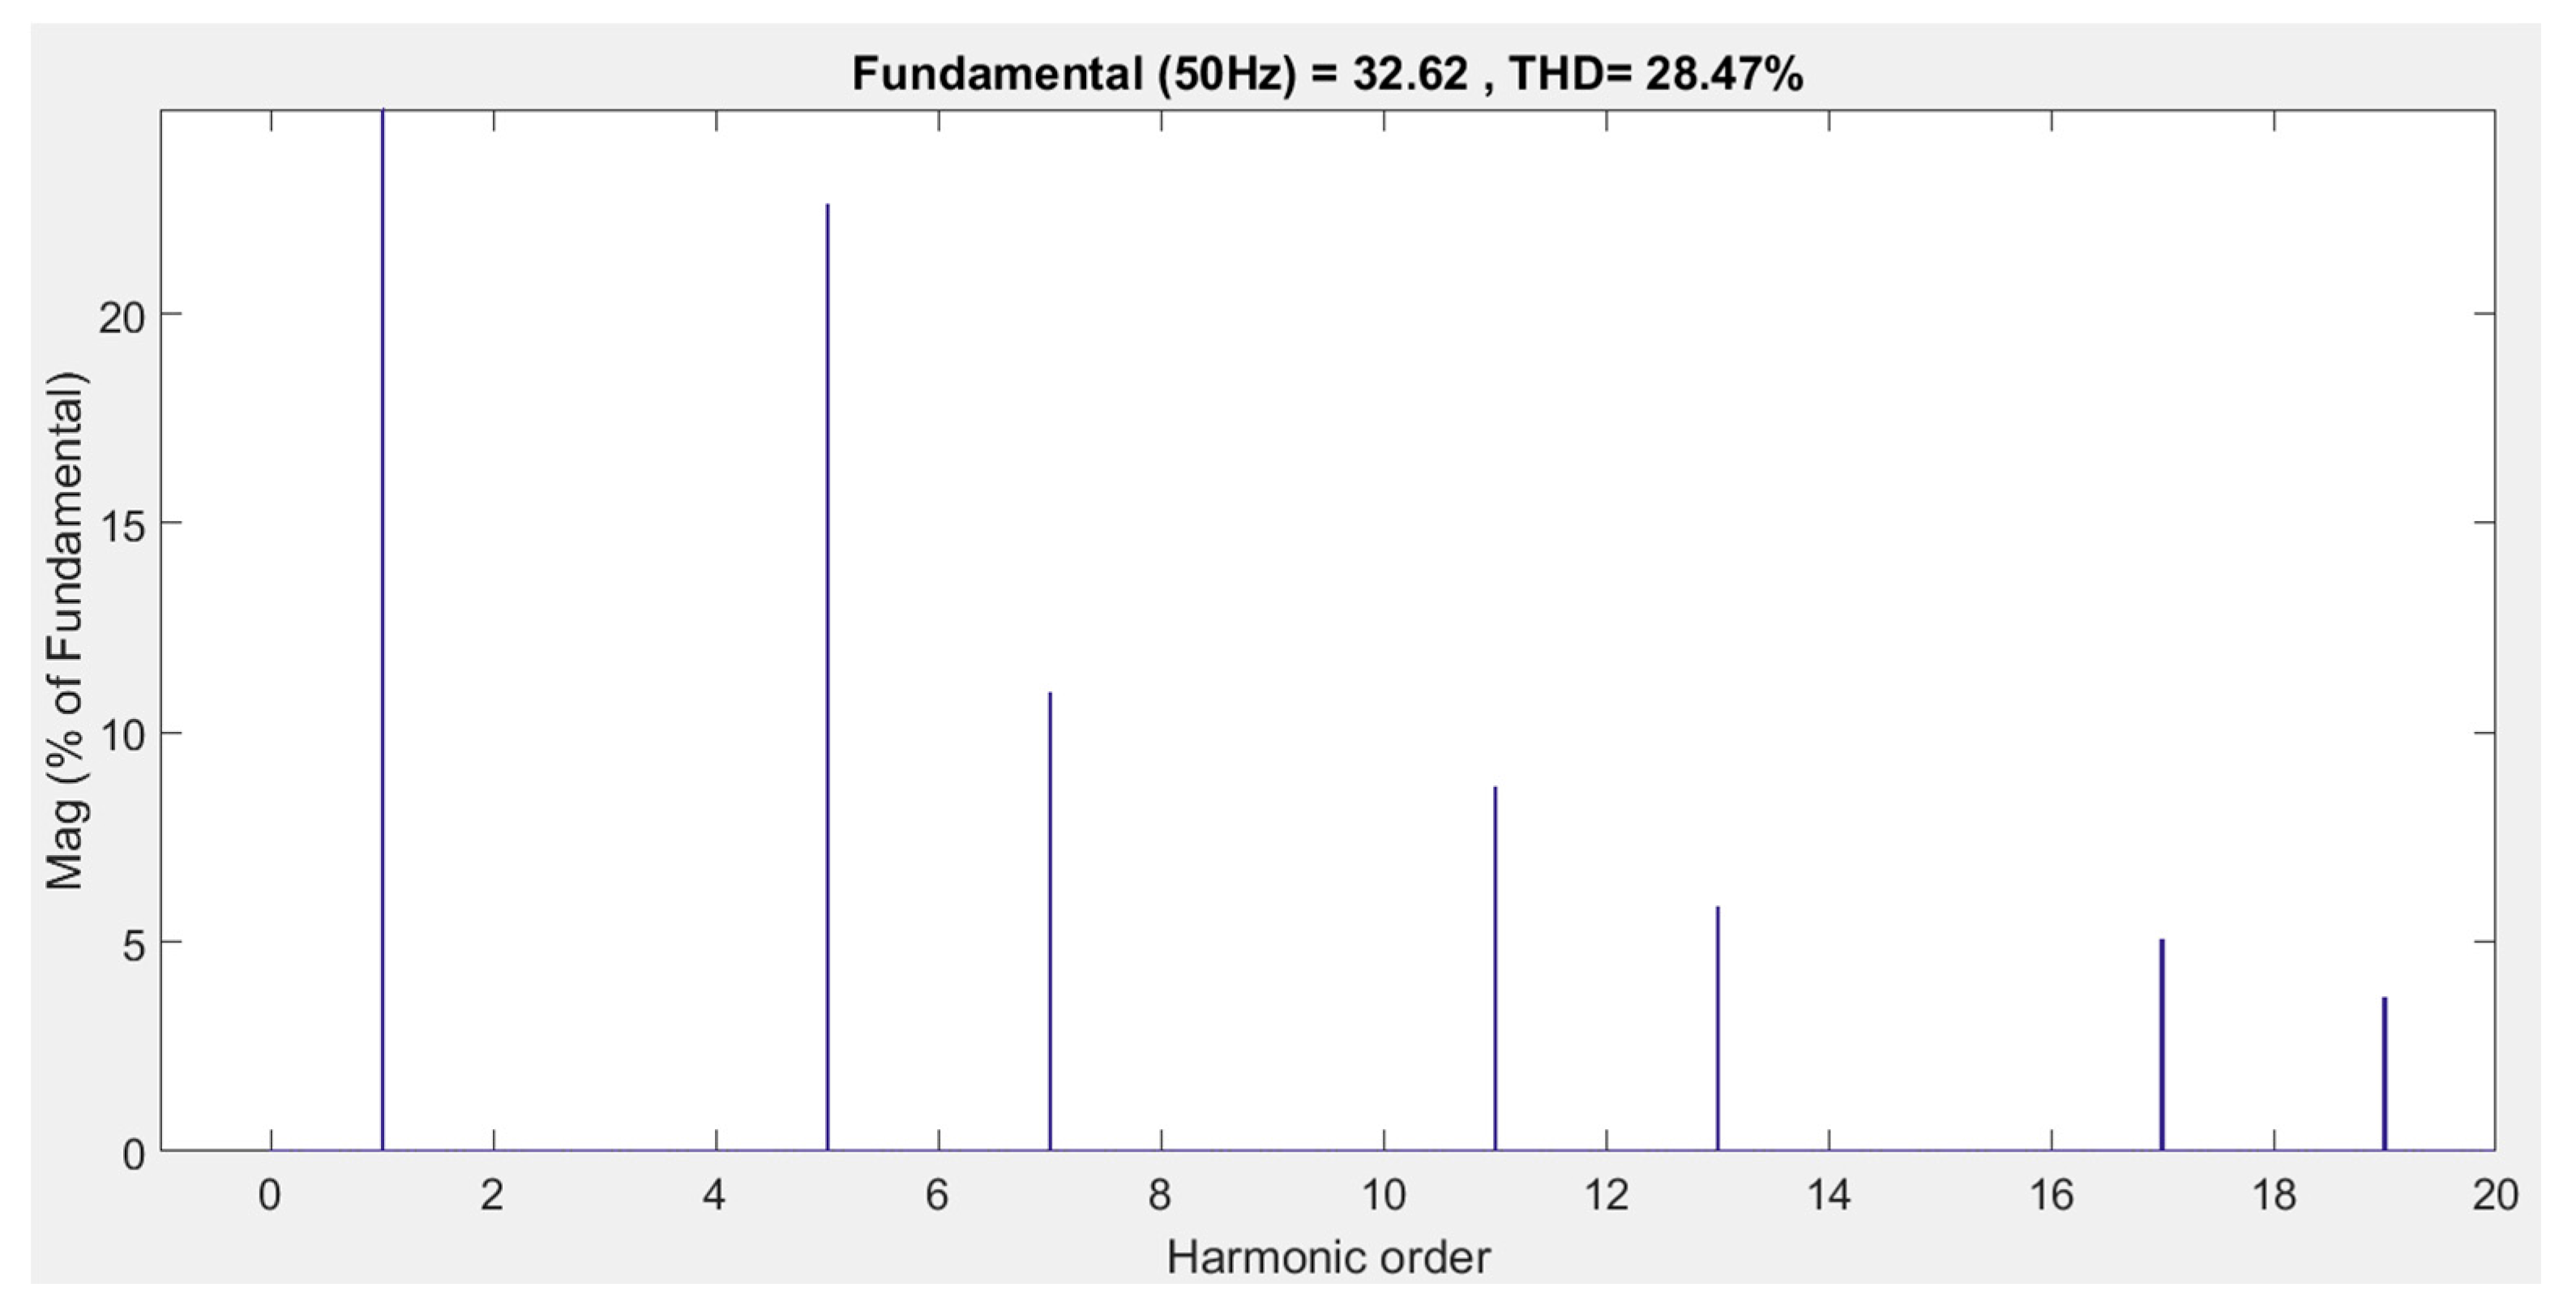
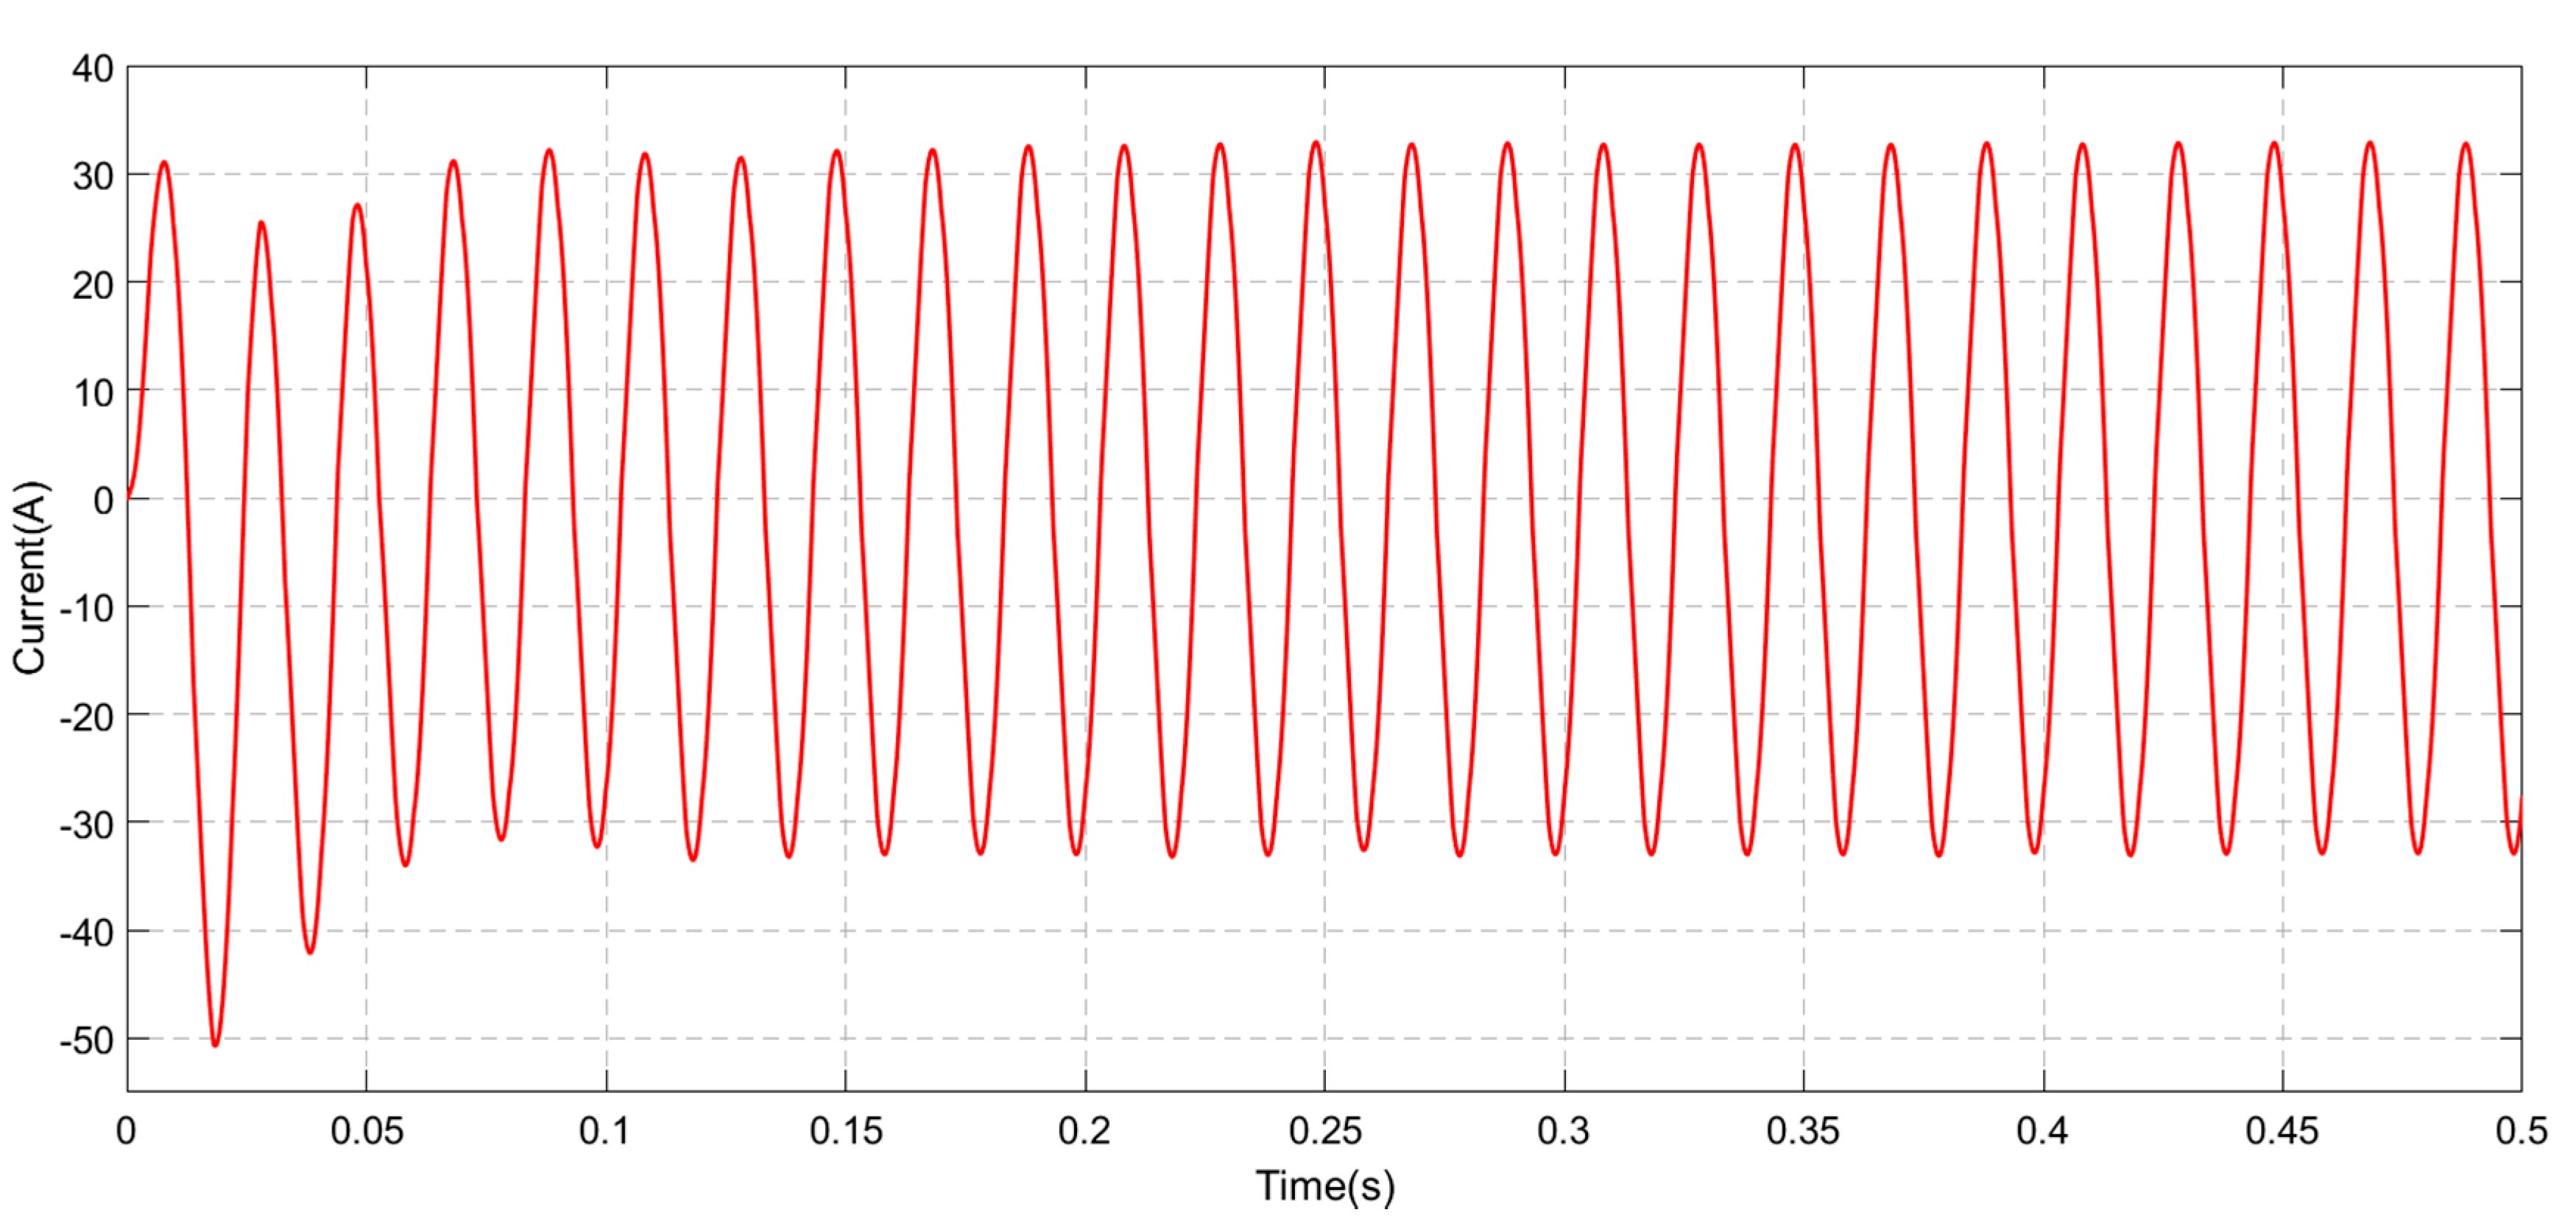
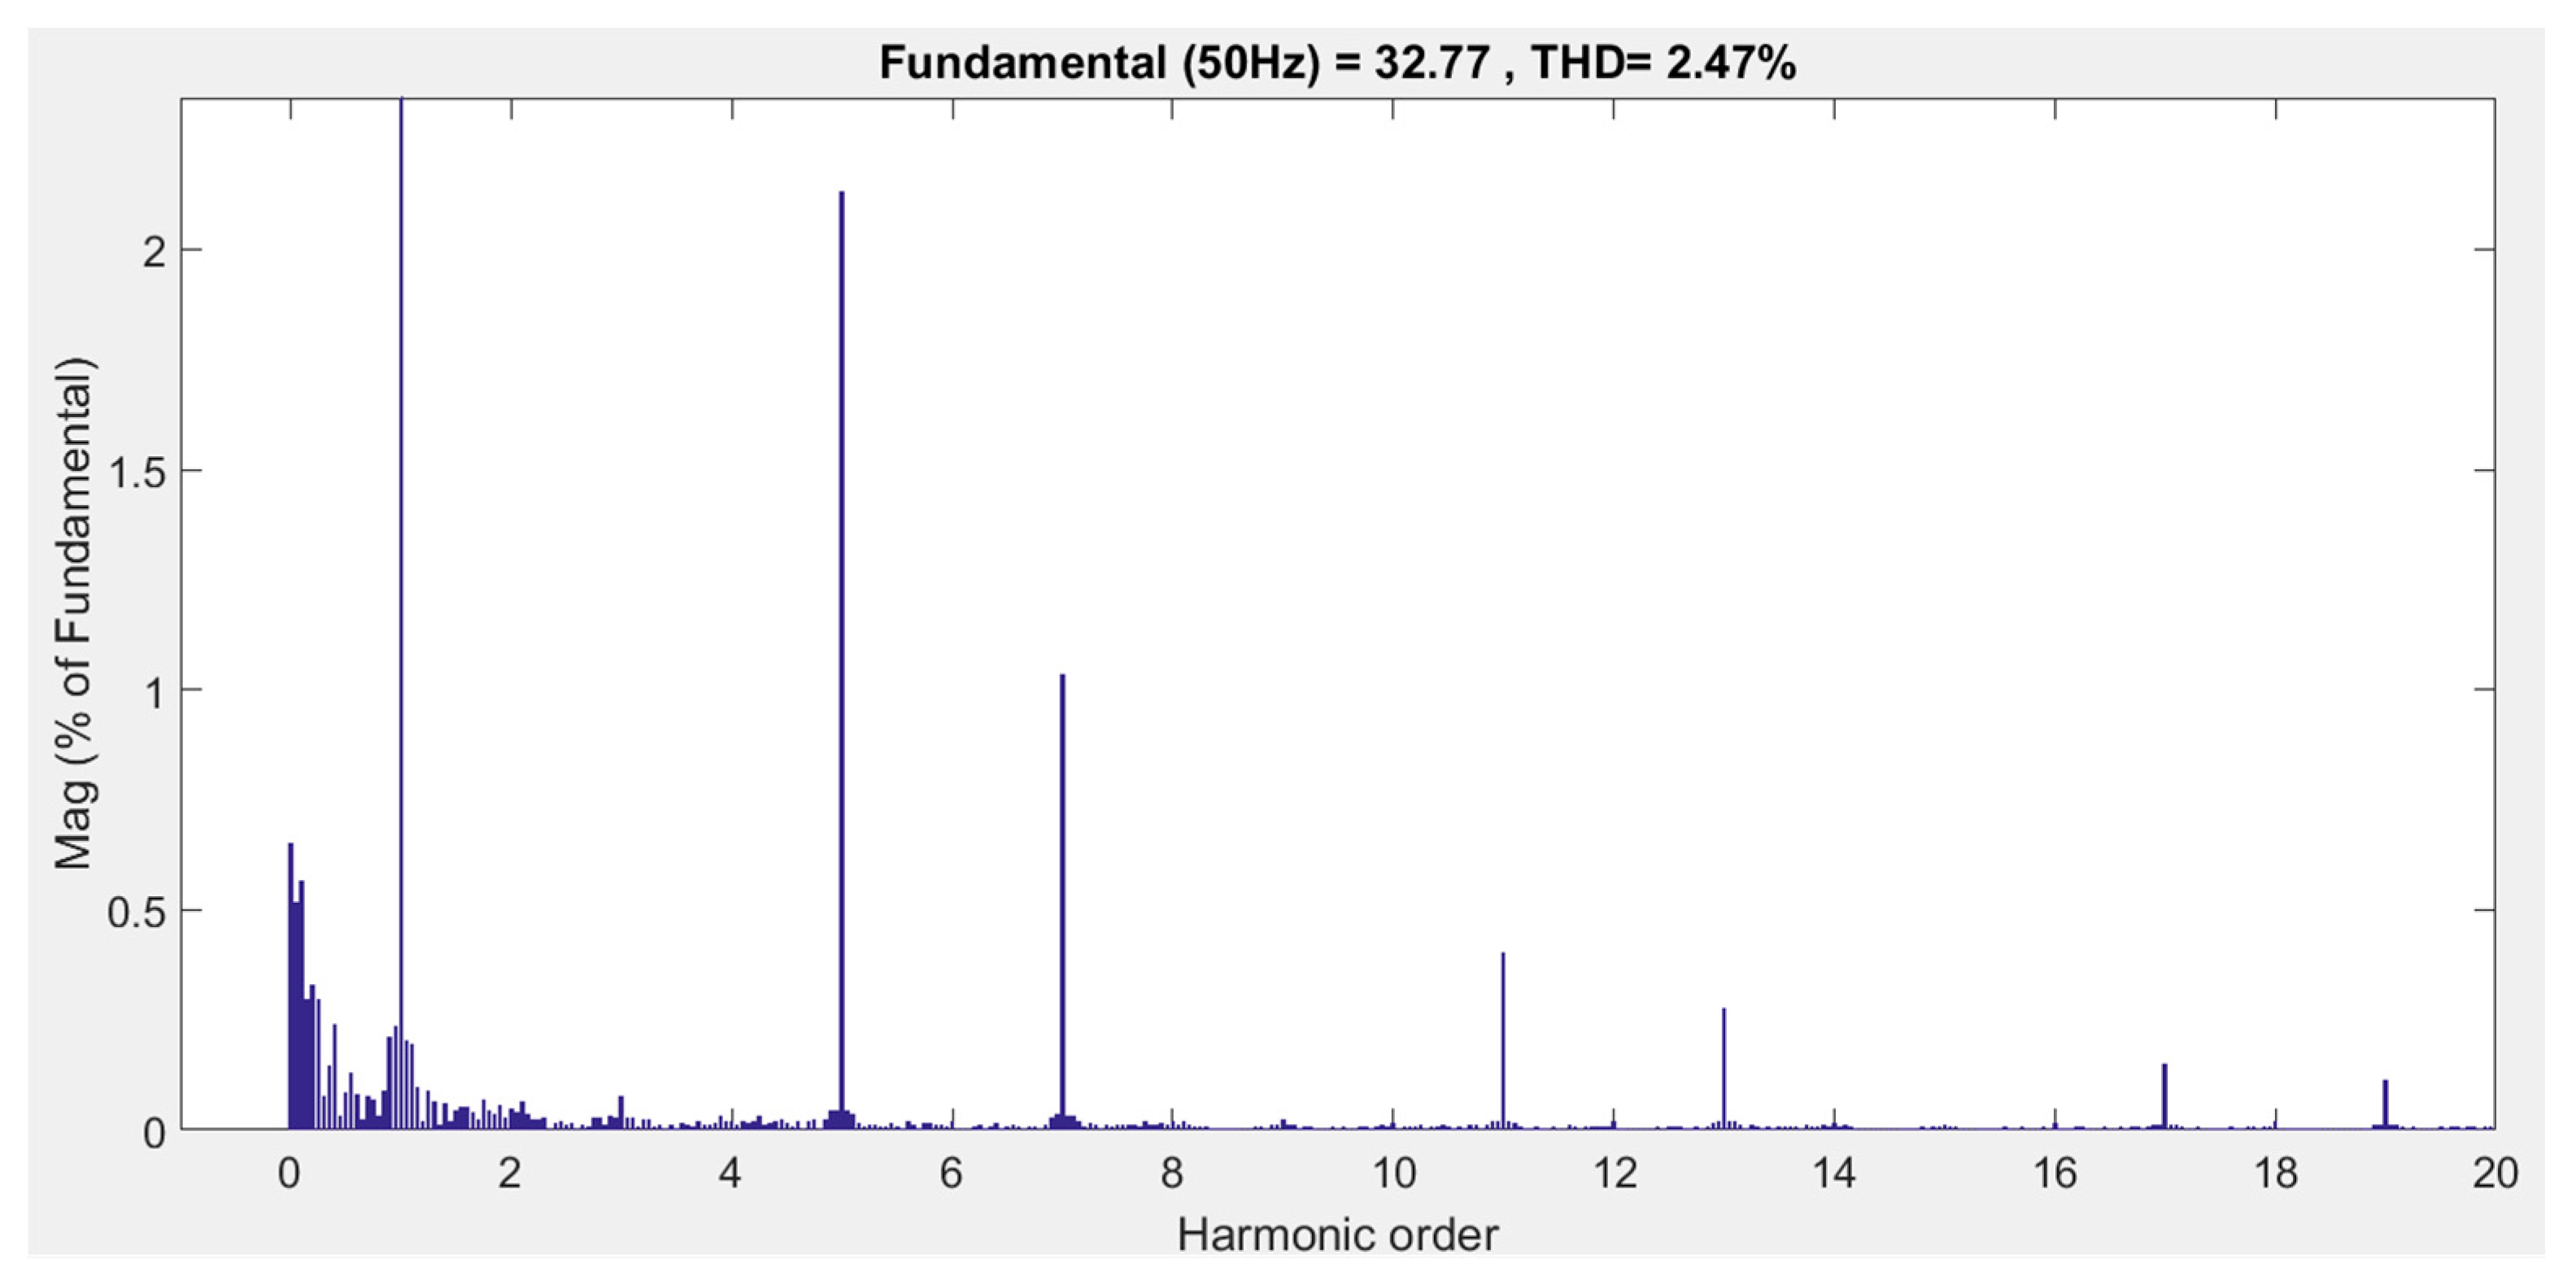
Furthermore, extra simulation experiments were carried out to illustrate the effect on harmonic elimination in the grid under the night control mode. In the simulations, the harmonic source composed of the Resistance-Inductance (RL) rectifier was added as a load of the grid, the harmonic contents of the load currents were measured respectively when the PV inverter was unconnected and was connected to the grid. The concrete results in Figure 14, Figure 15, Figure 16 and Figure 17 were obtained.
As can be seen from Figure 14 and Figure 15, due to the harmonic produced by the RL rectifier in the grid, a large quantity of harmonic components appeared in the load current, and the distortion in the current waveform was apparent. THD of the load current reached 28.47%, which was well over the codes of the grid (5%). In Figure 16 and Figure 17, waveforms of the grid currents were significantly improved with the PV inverter under the night control mode. The THD of the load current was reduced to 2.47%, which was under the codes of the grid. The above results showed that under the night control mode, the PV inverter could not only improve the power factor in the grid, but also help to eliminate the harmonic components in the grid.
4.5. Simulations on Integrated Control Strategy
The four control modes of the integrated control strategy had been simulated in Section 4.1, Section 4.2, Section 4.3 and Section 4.4, and the effectiveness of each control mode was proved. The overall control effects of the integrated control strategy were tested in the following simulations. Weather data, such as sun irradiance and temperature, were derived from the measured weather data in the PV system, which was published by National Renewable Energy Laboratory. Data used for these experiments were collected in 6 March 2017, the time span of the data was from 6:28 to 17:56. The results in Figure 18 and Figure 19 were obtained.
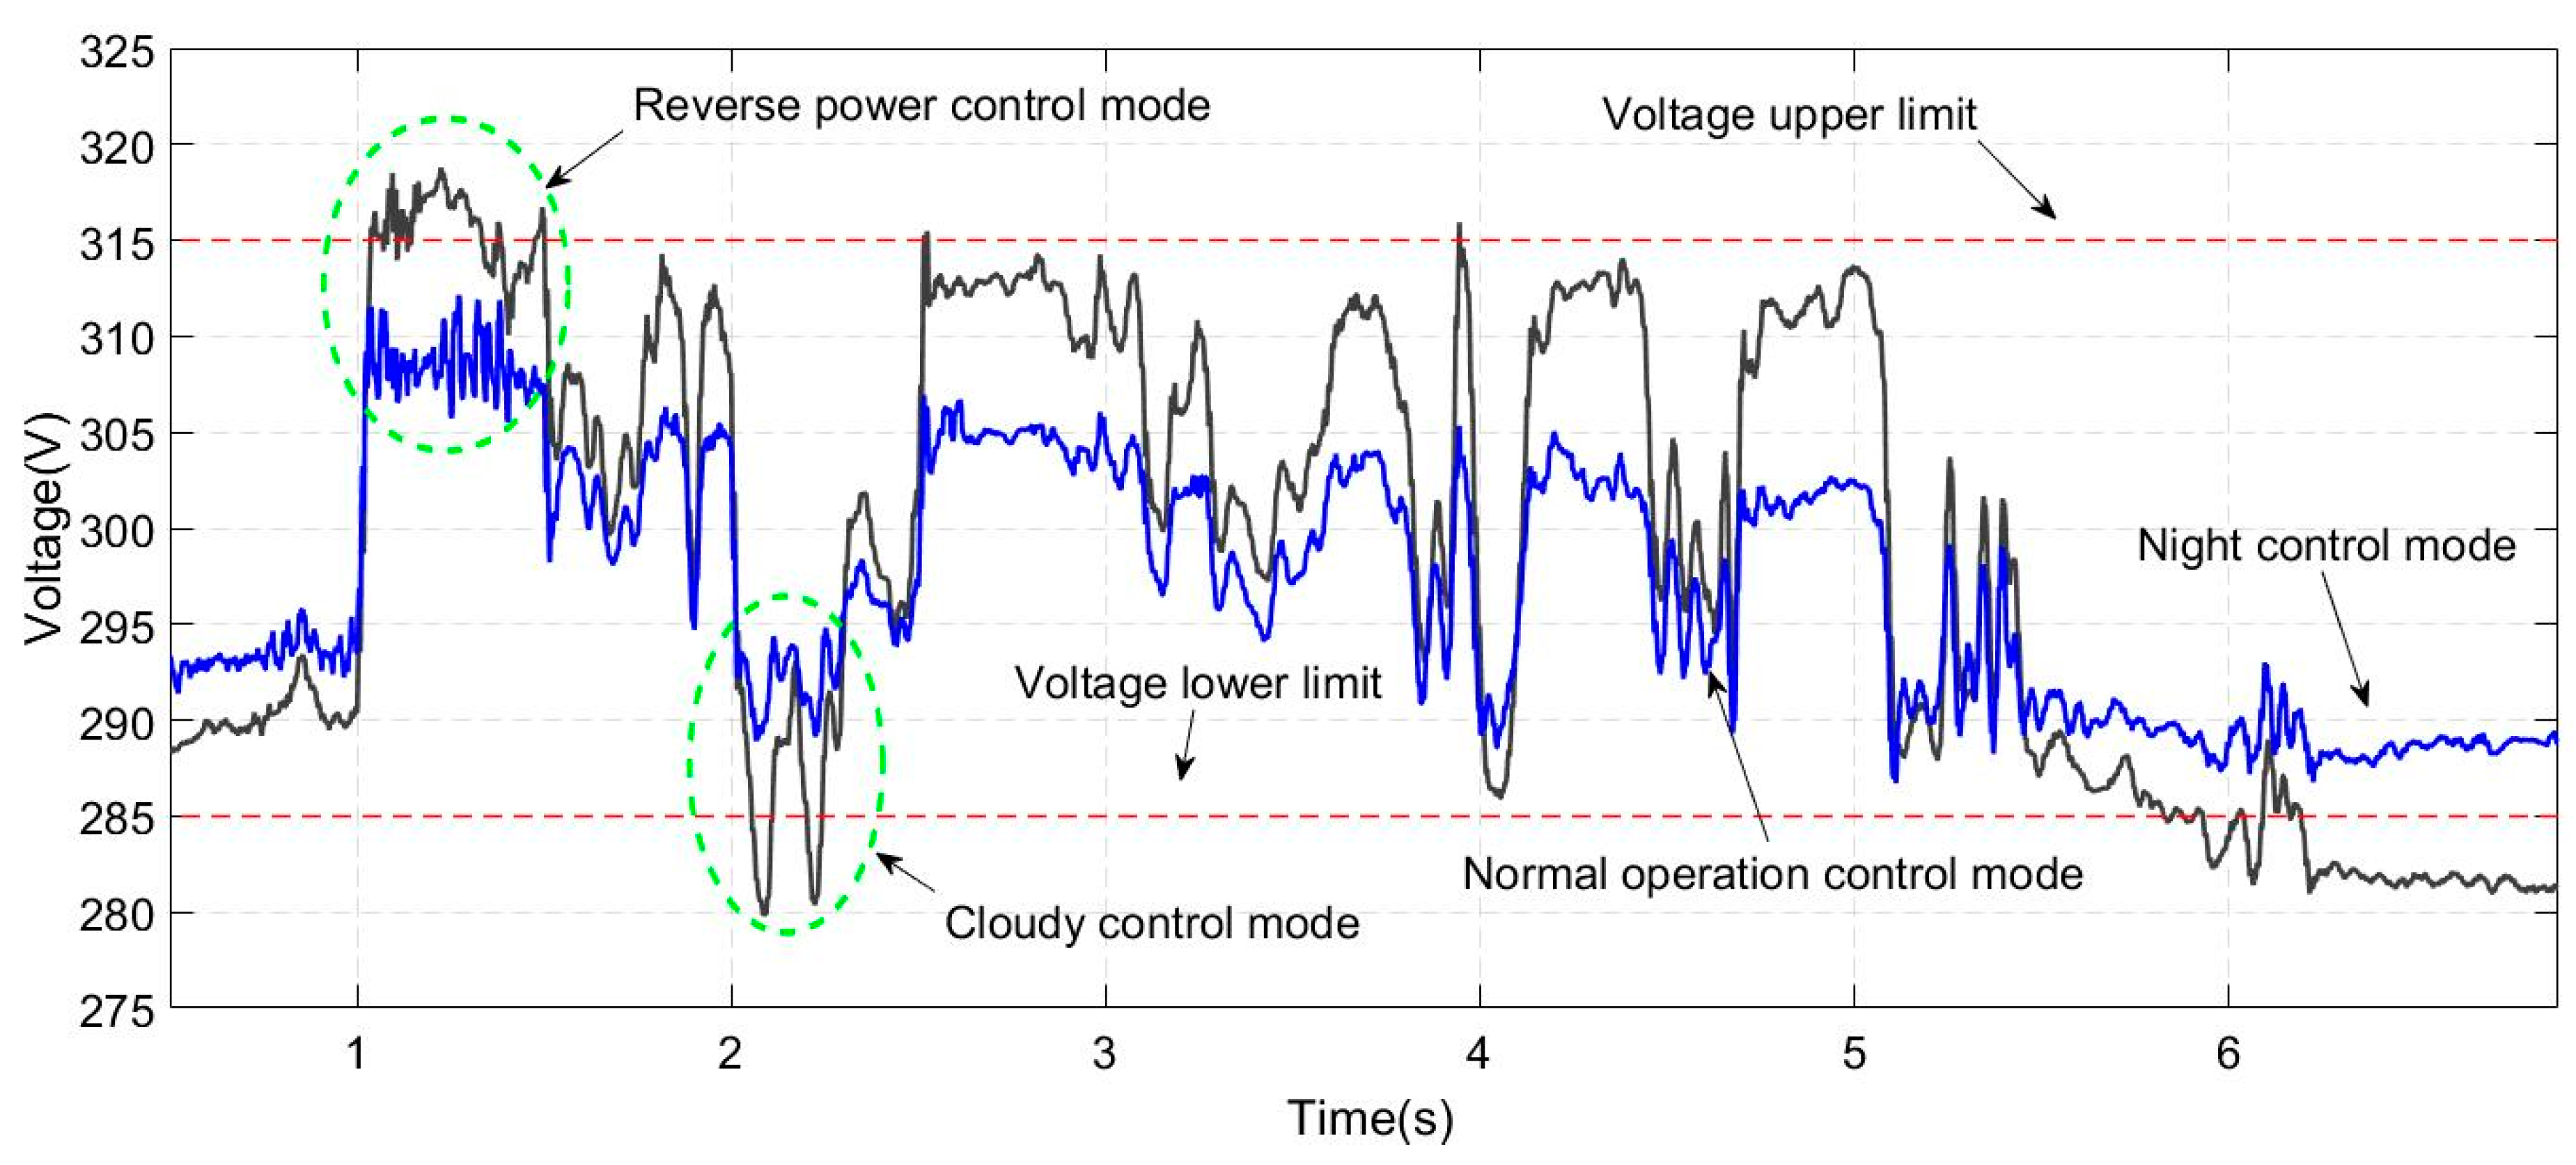
The standard value of was 300 V. The gray and blue curves are the waveforms of the under the power factor control strategy and the proposed integrated control strategy. The upper and lower red dotted lines represent the upper and lower limits of the allowable voltage fluctuations (315 V and 285 V).
According to Figure 18 and Figure 19, in 0 s–0.1 s and 5.5 s–6.8 s, the PV system was cut off from the grid under power factor control strategy due to the low sun irradiance in the morning and evening. Because of the low power quality in the grid, was maintained at a low level (about 290 V). According to the situation, the proposed integrated control strategy was switched to the night control mode which converted the PV inverter into SVG to carry out reactive power compensation for the grid. The power quality was improved, and was supported to near 295 V.
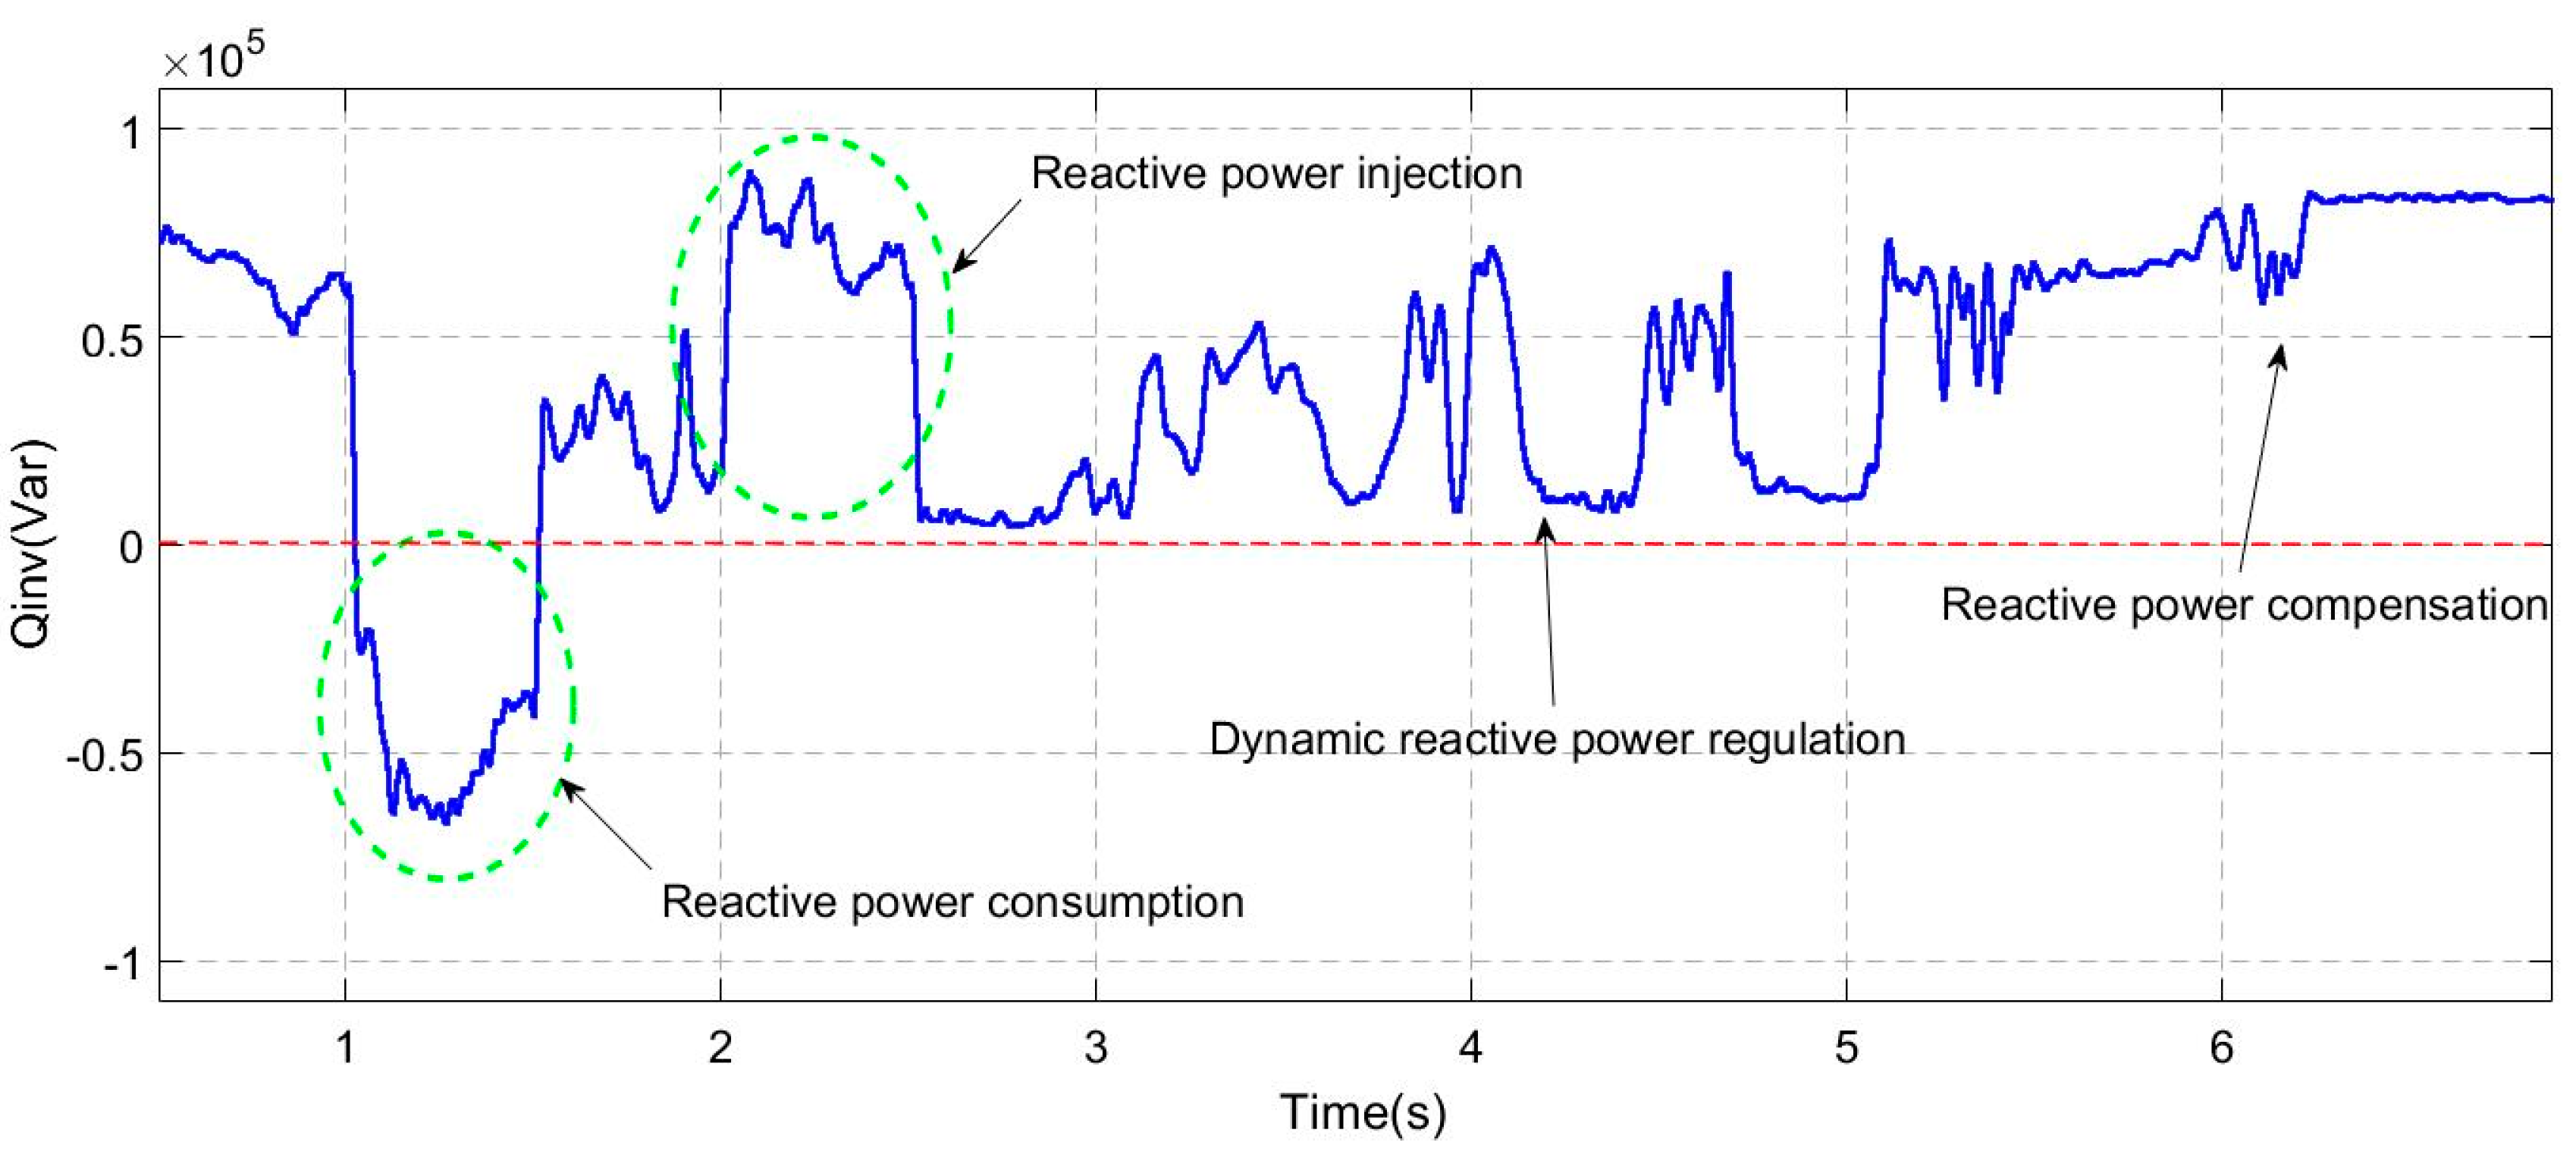
In 1 s–1.5 s, due to the rapid increase in sun irradiance and the less power consumption of the load, and the emergence of reverse power is observed. rose beyond the upper limit of the voltage fluctuations. The peak value of was about 318 V. While the integrated control strategy switched to the reverse power control mode, and mitigated rise by reactive power consumption (about 65 kVar). was limited to 310 V, and the deviation rate was reduced to less than 3%.
In 2 s–2.5 s, the output of the PV system instantly reduced because of the sudden drop in sun irradiance in cloudy weather. was reduced to lower than the lower limit of the allowable voltage fluctuation. The lowest value of was about 280 V. While the proposed integrated control strategy switched to the cloudy control mode, and supported by reactive power injection (about 85 kVar). was supported to 290 V, and the deviation rate was reduced to less than 3%.
In 2.5 s–5.5 s, the operation of the PV system was relatively stable. Affected by the changes of the sun irradiance and the changes of the load, deviated from its standard value. The deviation rate was over 3%. While the proposed integrated control strategy switched to the normal operation control mode, and carried out reactive power regulation in the PV inverter. The deviation rate was mitigated at about 2%.
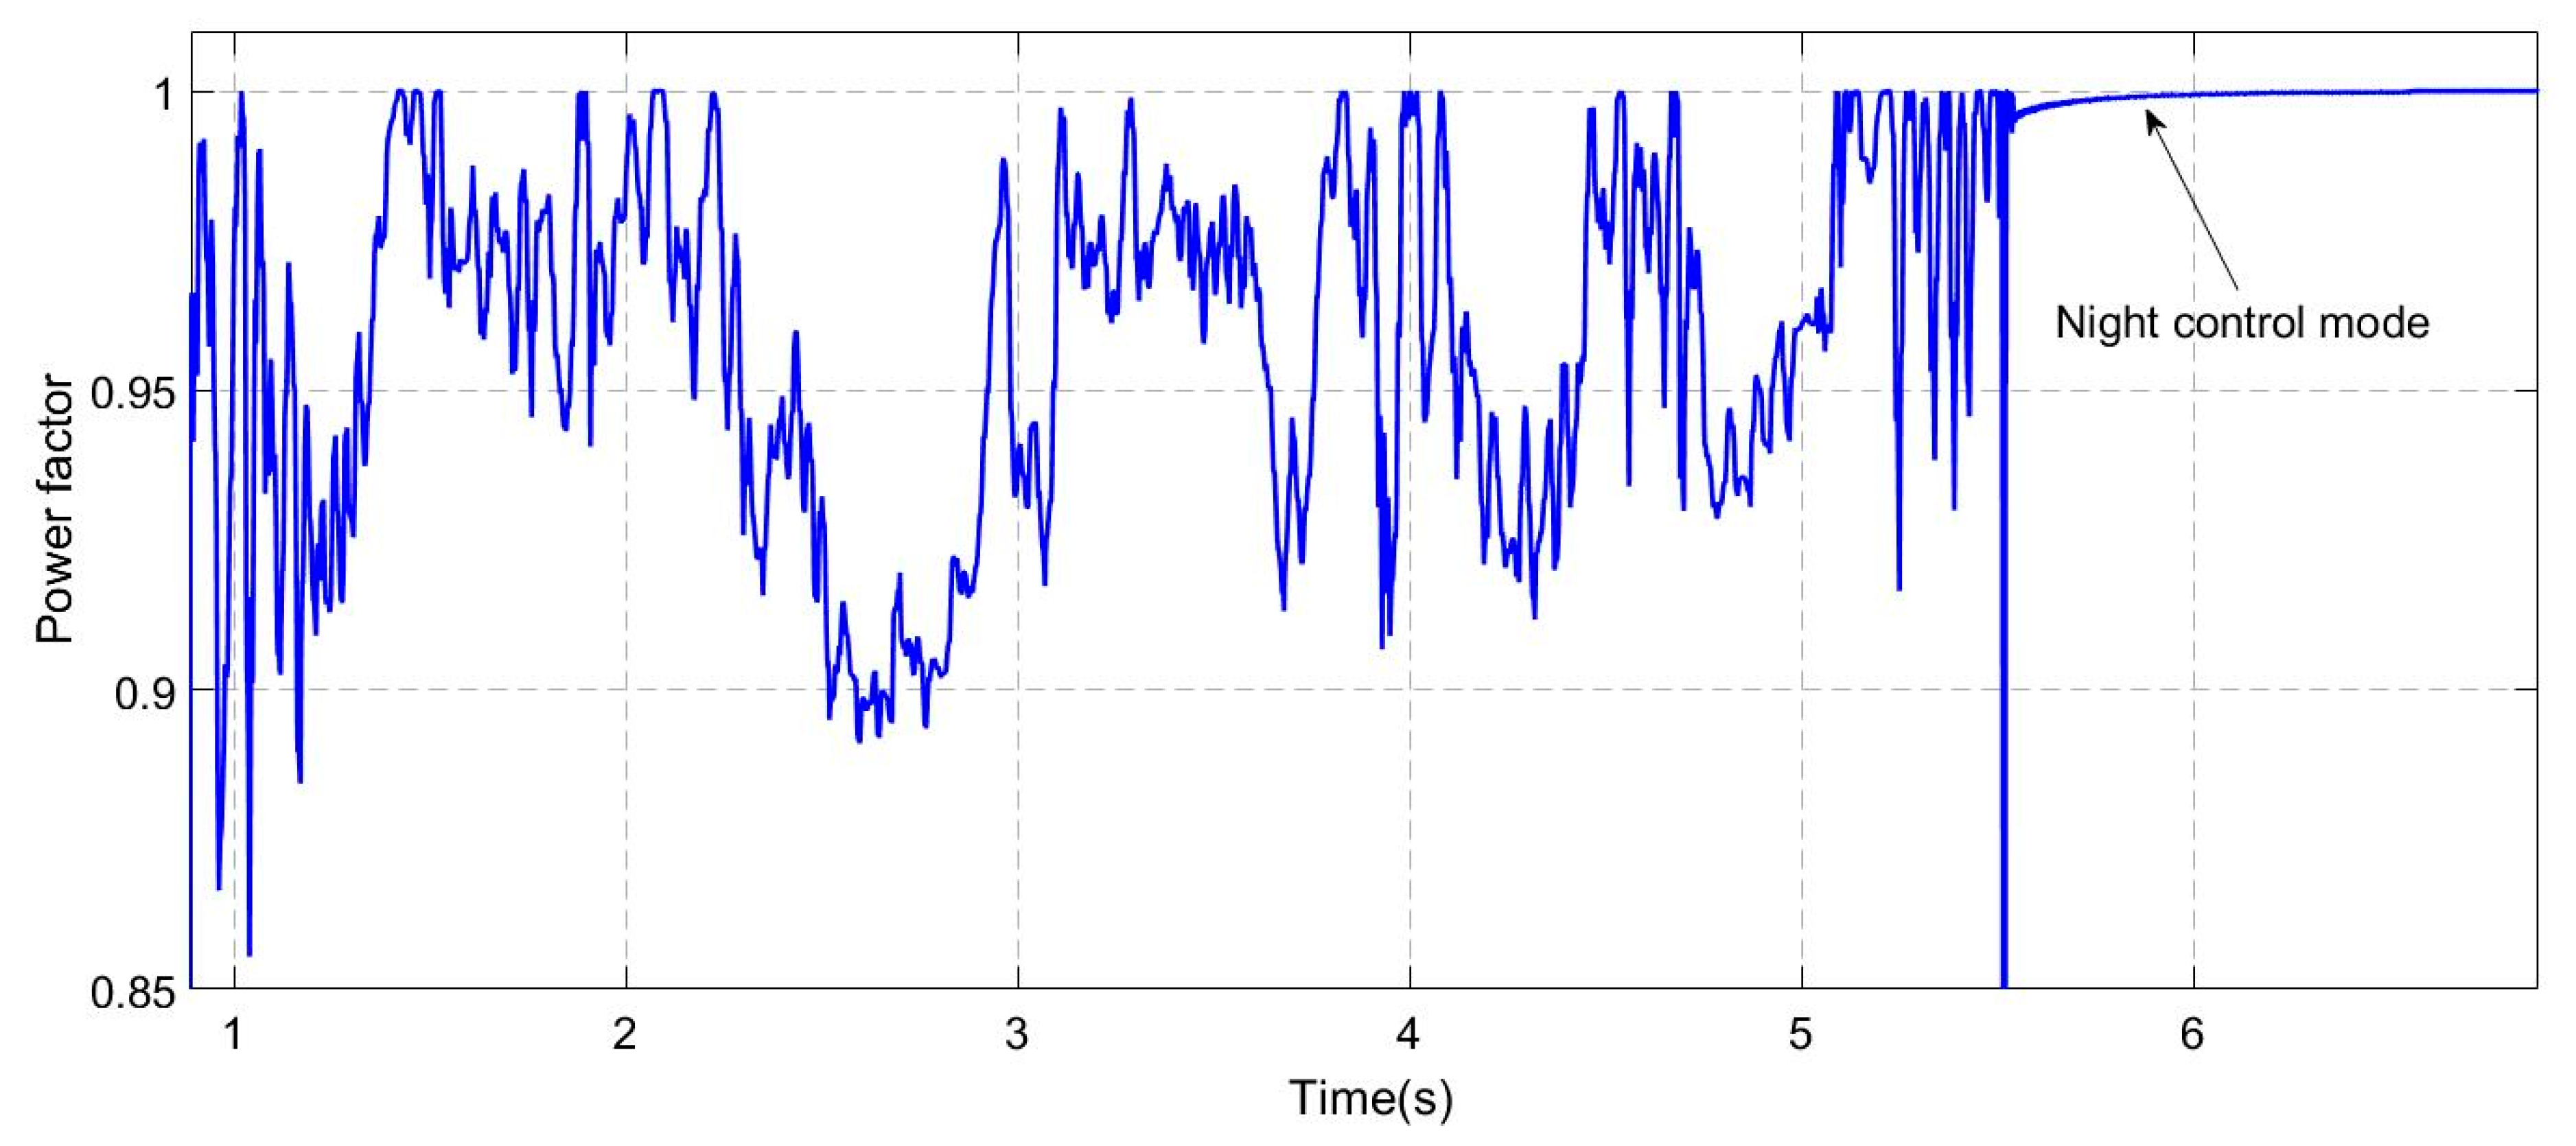
As in Figure 20, the power factor at load was increased approximately to 1 after a very short period of time under the night control mode. While in the operation of other three control modes, although there were some fluctuations, the power factor at load was still controlled over 0.9. The results above demonstrated the effectiveness of the proposed strategy on improving power factor.
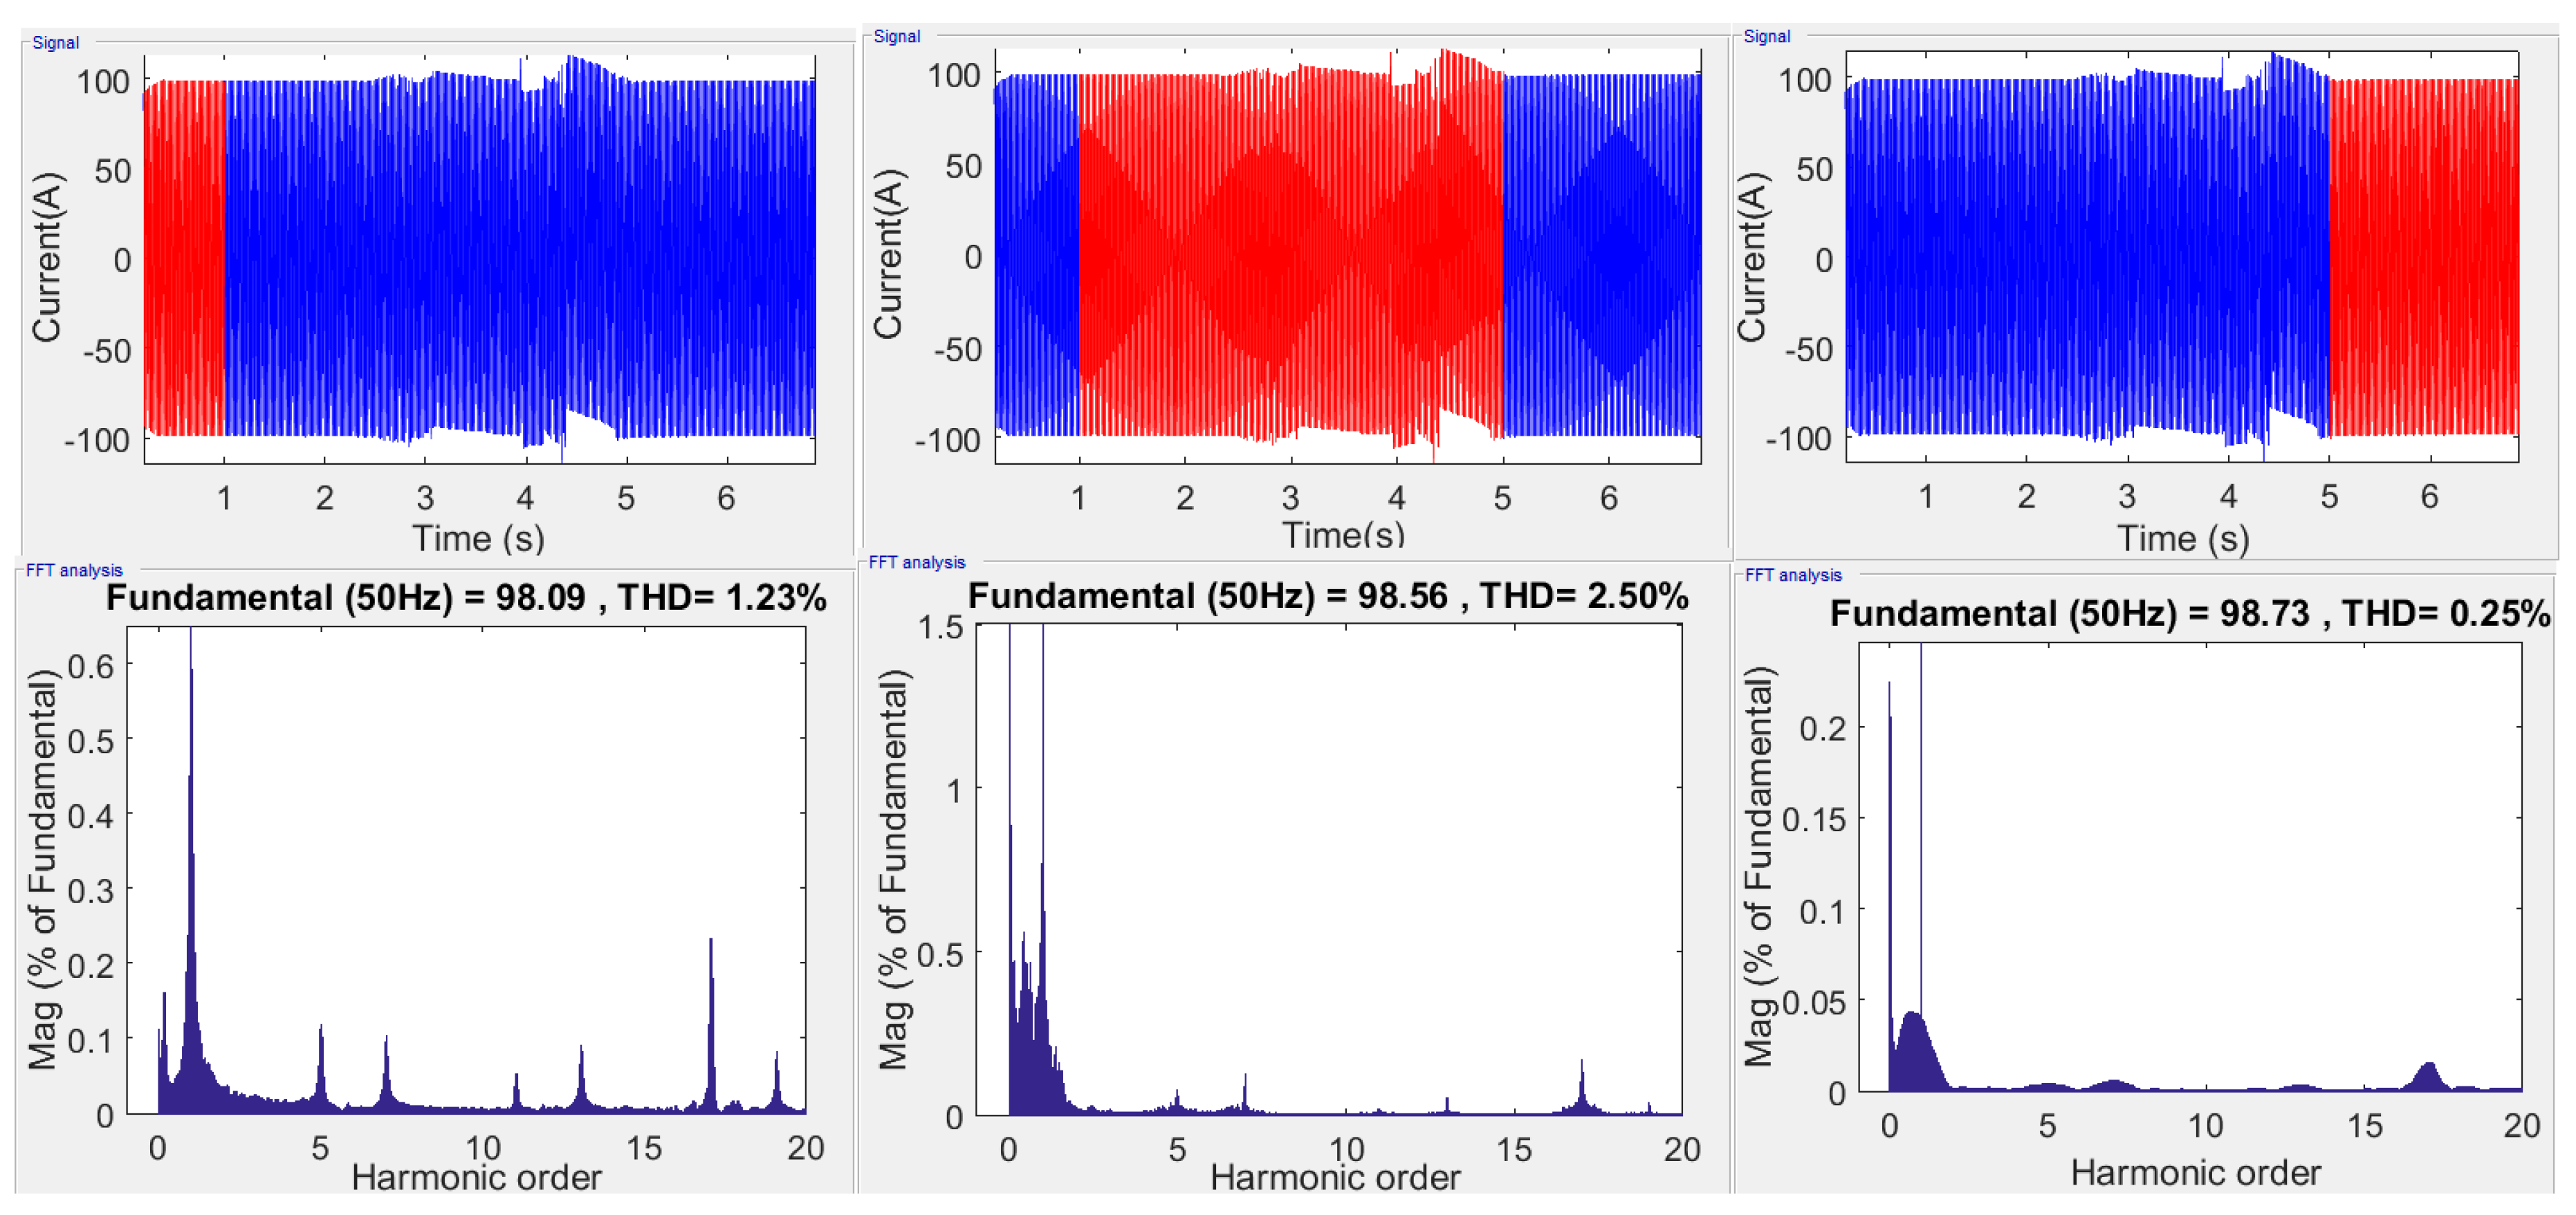
According to Figure 21, the THD of the load current was under the codes of the grid (5%) at all time. In 0.2 s–1 s and 5 s–6.8 s, the PV inverter was controlled under the night control mode, and the THDs were 1.23% and 0.25%. In 1 s–5 s, the PV inverter was controlled under the other three control modes except night control mode. Although the harmonic elimination were not the main task of these three control modes, the THD of the load current still remained at a low level which is 2.5%. The results above proved the effectiveness of integrated control strategy on harmonic elimination.
Based on the analysis above, it can be concluded that in the face of changing environmental factors and complex load factors, the proposed strategy can mitigate the fluctuations of the PCC voltage in a small range by injecting or consuming the reactive power. During the night-time or other conditions when the PV system is not in operation, the PV inverter can be converted into SVG and APF. This can not only improve power quality of the grid, but maximize utilization of PV inverter as well.
5. Conclusions
After the simulations on the proposed normal operation control mode, reverse power control mode, cloud control mode, night control mode and integrated control strategy, the following conclusions are obtained:
- (1)
- The effects of four proposed control modes in isolated operation were significant. The voltage fluctuations could be mitigated within about 0.03 s. The reactive power compensation and the harmonic elimination could be carried out under the night control mode. The power factor at load was increased approximately to 1 and the THD was reduced to 2.47%.
- (2)
- Different control modes switched smoothly in operation of integrated control strategy. The voltage deviation of was limited at about 2%. The power factor was maintained over 0.9, and the THD was controlled less than 2.5%. The security and stability of grid-connected PV system was guaranteed even in changing weather situations and complex load conditions.
- (3)
- In the non-working period of the PV system, such as the night, the proposed integrated control strategy controls the PV inverter to increase power factor of the grid. This not only can improve power quality in the grid, but can maximize utilization of PV system components as well.
Acknowledgments
This work was supported by the National Science and Technology Supporting Plan of China (No. 2015BAA09B01), the Science and Technology Plan of Hebei Province of China (No. 14214503D) and the Colleges and Universities in Hebei Province Science and Technology Research Youth Fund (No. QN2015111).
Author Contributions
Hua Li collected the data and performed simulation analysis. Che Wen designed the study and wrote the manuscript. Kuei-Hsiang Chao and Ling-Ling Li helped edit the manuscript. All the authors contributed to the writing of the final research paper.
Conflicts of Interest
The authors declare no conflict of interest.
References
- European Photovoltaic Industry Association (EPIA). EPIA Market Report 2011; Technical Report; European Photovoltaic Industry Association: Brussels, Belgium, 2011. [Google Scholar]
- Pinto, R.; Mariano, S.; Calado, M.R.; De Souza, J.F. Impact of rural grid-connected photovoltaic generation systems on power quality. Energies 2016, 9, 739. [Google Scholar] [CrossRef]
- Vinayagam, A.; Swarna, K.S.V.; Khoo, S.Y.; Oo, A.T.; Stojcevski, A. PV based microgrid with grid-support grid-forming inverter control-(simulation and analysis). Smart Grid Renew. Energy 2017, 8, 1–30. [Google Scholar] [CrossRef]
- Masters, C.L. Voltage Rise: The big issue when connecting embedded generation to long 11 kV overhead lines. Power Eng. J. 2002, 16, 5–12. [Google Scholar] [CrossRef]
- Yazdani, A.; Dash, P.P. A control methodology and characterization of dynamics for a photovoltaic (PV) system interfaced with a distribution network. IEEE Trans. Power Deliv. 2009, 24, 1538–1551. [Google Scholar] [CrossRef]
- Alam, M.J.E.; Muttaqi, K.M.; Sutanto, D. A novel approach for ramp-rate control of solar PV using energy storage to mitigate output fluctuations caused by cloud passing. IEEE Trans. Energy Convers. 2014, 29, 507–518. [Google Scholar]
- Power Quality-Voltage Fluctuation and Flicker; GB/T12326-2008; General Administration of Quality Supervision, Inspection and Quarantine of P.R.C.: Beijing, China, 2008.
- Ding, G.; Gao, F.; Tian, H.; Ma, C. Adaptive DC-link voltage control of two-stage photovoltaic inverter during low voltage ride-through operation. IEEE Trans. Power Electron. 2016, 31, 4182–4194. [Google Scholar] [CrossRef]
- Collins, L.; Ward, J.K. Real and reactive power control of distributed PV inverters for overvoltage prevention and increased renewable generation hosting capacity. Renew. Energy 2015, 81, 464–471. [Google Scholar] [CrossRef]
- Pan, Q.; Xu, Y.; Xie, X.; Huang, D. Coordination control system and method for reactive compensation of the distributed PV power station based on reactive power source. Electr. Meas. Instrum. 2015, 52, 101–106. [Google Scholar]
- Wang, Z.; Chen, H.; Wang, J.; Begovic, M. Inverter-less hybrid voltage/var control for distribution circuits with photovoltaic generators. IEEE Trans. Smart Grid 2014, 5, 2718–2728. [Google Scholar] [CrossRef]
- Aida, S.; Ito, T.; Iwamoto, S.; Kitada, R.; Ariyoshi, N. Voltage control using PV power factor, static capacitor, and transformer tap for large PV penetration. Electr. Eng. Jpn. 2014, 134, 957–965. [Google Scholar] [CrossRef]
- Ishimaru, M.A.; Tamachi, H.; Komami, S. Positive effect of constant leading power factor operation of PV in power system. Electr. Eng. Jpn. 2015, 190, 9–20. [Google Scholar] [CrossRef]
- Smith, J.W.; Sunderman, W.; Dugan, R.; Seal, B. Smart Inverter Volt/Var Control Functions for High Penetration of PV on Distribution Systems. In Proceedings of the IEEE/PES Power Systems Conference and Exposition (PSCE), Phoenix, AZ, USA, 20–23 March 2011; pp. 1–6. [Google Scholar]
- Lv, Z.-P.; Sheng, W.-X.; Jiang, W.-Q.; Liu, H.-T.; Yang, L. Frequency dividing droop controllers with the function of voltage stabilization and circulation control. Proc. Chin. Soc. Electr. Eng. 2013, 33, 1–9. [Google Scholar]
- Katiraei, F.; Iravani, M.R. Power management strategies for a micro grid with multiple distributed generation units. IEEE Trans. Power Syst. 2006, 21, 1821–1831. [Google Scholar] [CrossRef]
- Augustine, S.; Lakshminarasamma, N.; Mishra, M.K. Control of photovoltaic-based low-voltage DC micro grid system for power sharing with modified droop algorithm. IET Power Electron. 2016, 9, 1132–1143. [Google Scholar] [CrossRef]
- Viawan, F.A.; Karlsson, D. Voltage and reactive power control in systems with synchronous machine-based distributed generation. IEEE Trans. Power Deliv. 2008, 23, 1079–1087. [Google Scholar] [CrossRef]
- Moawwad, A.; Khadkikar, V.; Kirtley, J.L. A new P-Q-V droop control method for an interline photovoltaic (I-PV) power system. IEEE Trans. Power Deliv. 2013, 28, 658–668. [Google Scholar] [CrossRef]
- Pachanapan, P.; Inthai, P. Micro static var compensator for over-voltage control in distribution networks with high penetration of rooftop photovoltaic systems. Appl. Mech. Mater. 2016, 839, 54–58. [Google Scholar] [CrossRef]
- Senjyu, T.; Miyazato, Y.; Yona, A.; Urasaki, N. Optimal distribution voltage control and coordination with distributed generation. IEEE Trans. Power Deliv. 2008, 23, 1236–1242. [Google Scholar] [CrossRef]
- Akermi, S.; Hidouri, N.; Sbita, L. A Static Var Compensator Controlled Topology for A Grid Connected Photovoltaic System. In Proceedings of the Renewable Energy Congress (IREC), Hammamet, Tunisia, 25–27 March 2014; pp. 1–7. [Google Scholar]
- Varma, R.K.; Rahman, S.A.; Vanderheide, T. New control of PV solar farm as STATCOM (PV-STATCOM) for increasing grid power transmission limits during night and day. IEEE Trans. Power Deliv. 2015, 30, 755–763. [Google Scholar] [CrossRef]
- Alam, M.J.E.; Muttaqi, K.M.; Sutanto, D. A multi-mode control strategy for var support by solar PV inverters in distribution networks. IEEE Trans. Power Syst. 2014, 30, 1316–1326. [Google Scholar] [CrossRef]
- Xavier, L.S.; Cupertino, A.F.; Resende, J.T.; Mendes, V.F.; Pereira, H.A. Adaptive current control strategy for harmonic compensation in single-phase solar inverters. Electr. Power Syst. Res. 2017, 142, 84–95. [Google Scholar] [CrossRef]
- Palanisamy, K.; Kothari, D.P.; Mishra, M.K.; Meikandashivam, S.; Jacob, R.I. Effective utilization of unified power quality conditioner for interconnecting PV modules with grid using power angle control method. Int. J. Electr. Power 2013, 48, 131–138. [Google Scholar] [CrossRef]
- Solar Radiation Research Laboratory, Golden, CO, USA. NREL. Available online: http://www.nrel.gov/midc/srrl_bms/ (accessed on 8 March 2017).
- Liang, N.-Y. Research on Reverse Power Flow Detection Algorithm in PV Power System. Master’s Thesis, Tianjin University, Tianjin, China, 2013. [Google Scholar]
- Dhar, S.; Dash, P. An adaptive threshold based new active islanding protection scheme for multiple PV based micro grid application. IET Gener. Transm. Distrib. 2017, 11, 118–132. [Google Scholar] [CrossRef]
- Kashem, M.A.; Ledwich, G. Distributed generation as voltage support for single wire earth return systems. IEEE Trans. Power Deliv. 2004, 19, 1002–1011. [Google Scholar] [CrossRef]
- Muttaqi, K.M.; Ledwich, G. DG Impact on Rural Lines: Voltage Control and Line Protection Issues. In Proceedings of the International Symposium Distributed Generation: Power System Market Aspects, Stockholm, Sweden, 11–13 June 2001. [Google Scholar]
- Prakash, L.; Sundaram, A.M.; Durairaj, K. Digital implementation of a constant frequency hysteresis controller for dual mode operation of an inverter acting as a PV-grid interface and STATCOM. Turk. J. Electr. Eng. Comput. Sci. 2016, 24, 4406–4428. [Google Scholar] [CrossRef]
- Dhanapal, S.; Anita, R. Voltage and frequency control of stand alone self-excited induction generator using photovoltaic system based STATCOM. J. Circuits Syst. Comput. 2016, 25, 1–25. [Google Scholar] [CrossRef]
- Quality of Electric Energy Supply-Harmonics in Public Supply Network; GB/T14549-1993; China State Bureau of Technical Supervision: Beijing, China, 1993.
- Power Quality-Deviation of Supply Voltage; GB/T12325-2008; General Administration of Quality Supervision, Inspection and Quarantine of P.R.C.: Beijing, China, 2008.
Figure 1.
Simplified power system.

Figure 2.
Structure of night control mode.

Figure 3.
Operation flow of the switching method between different control modes.
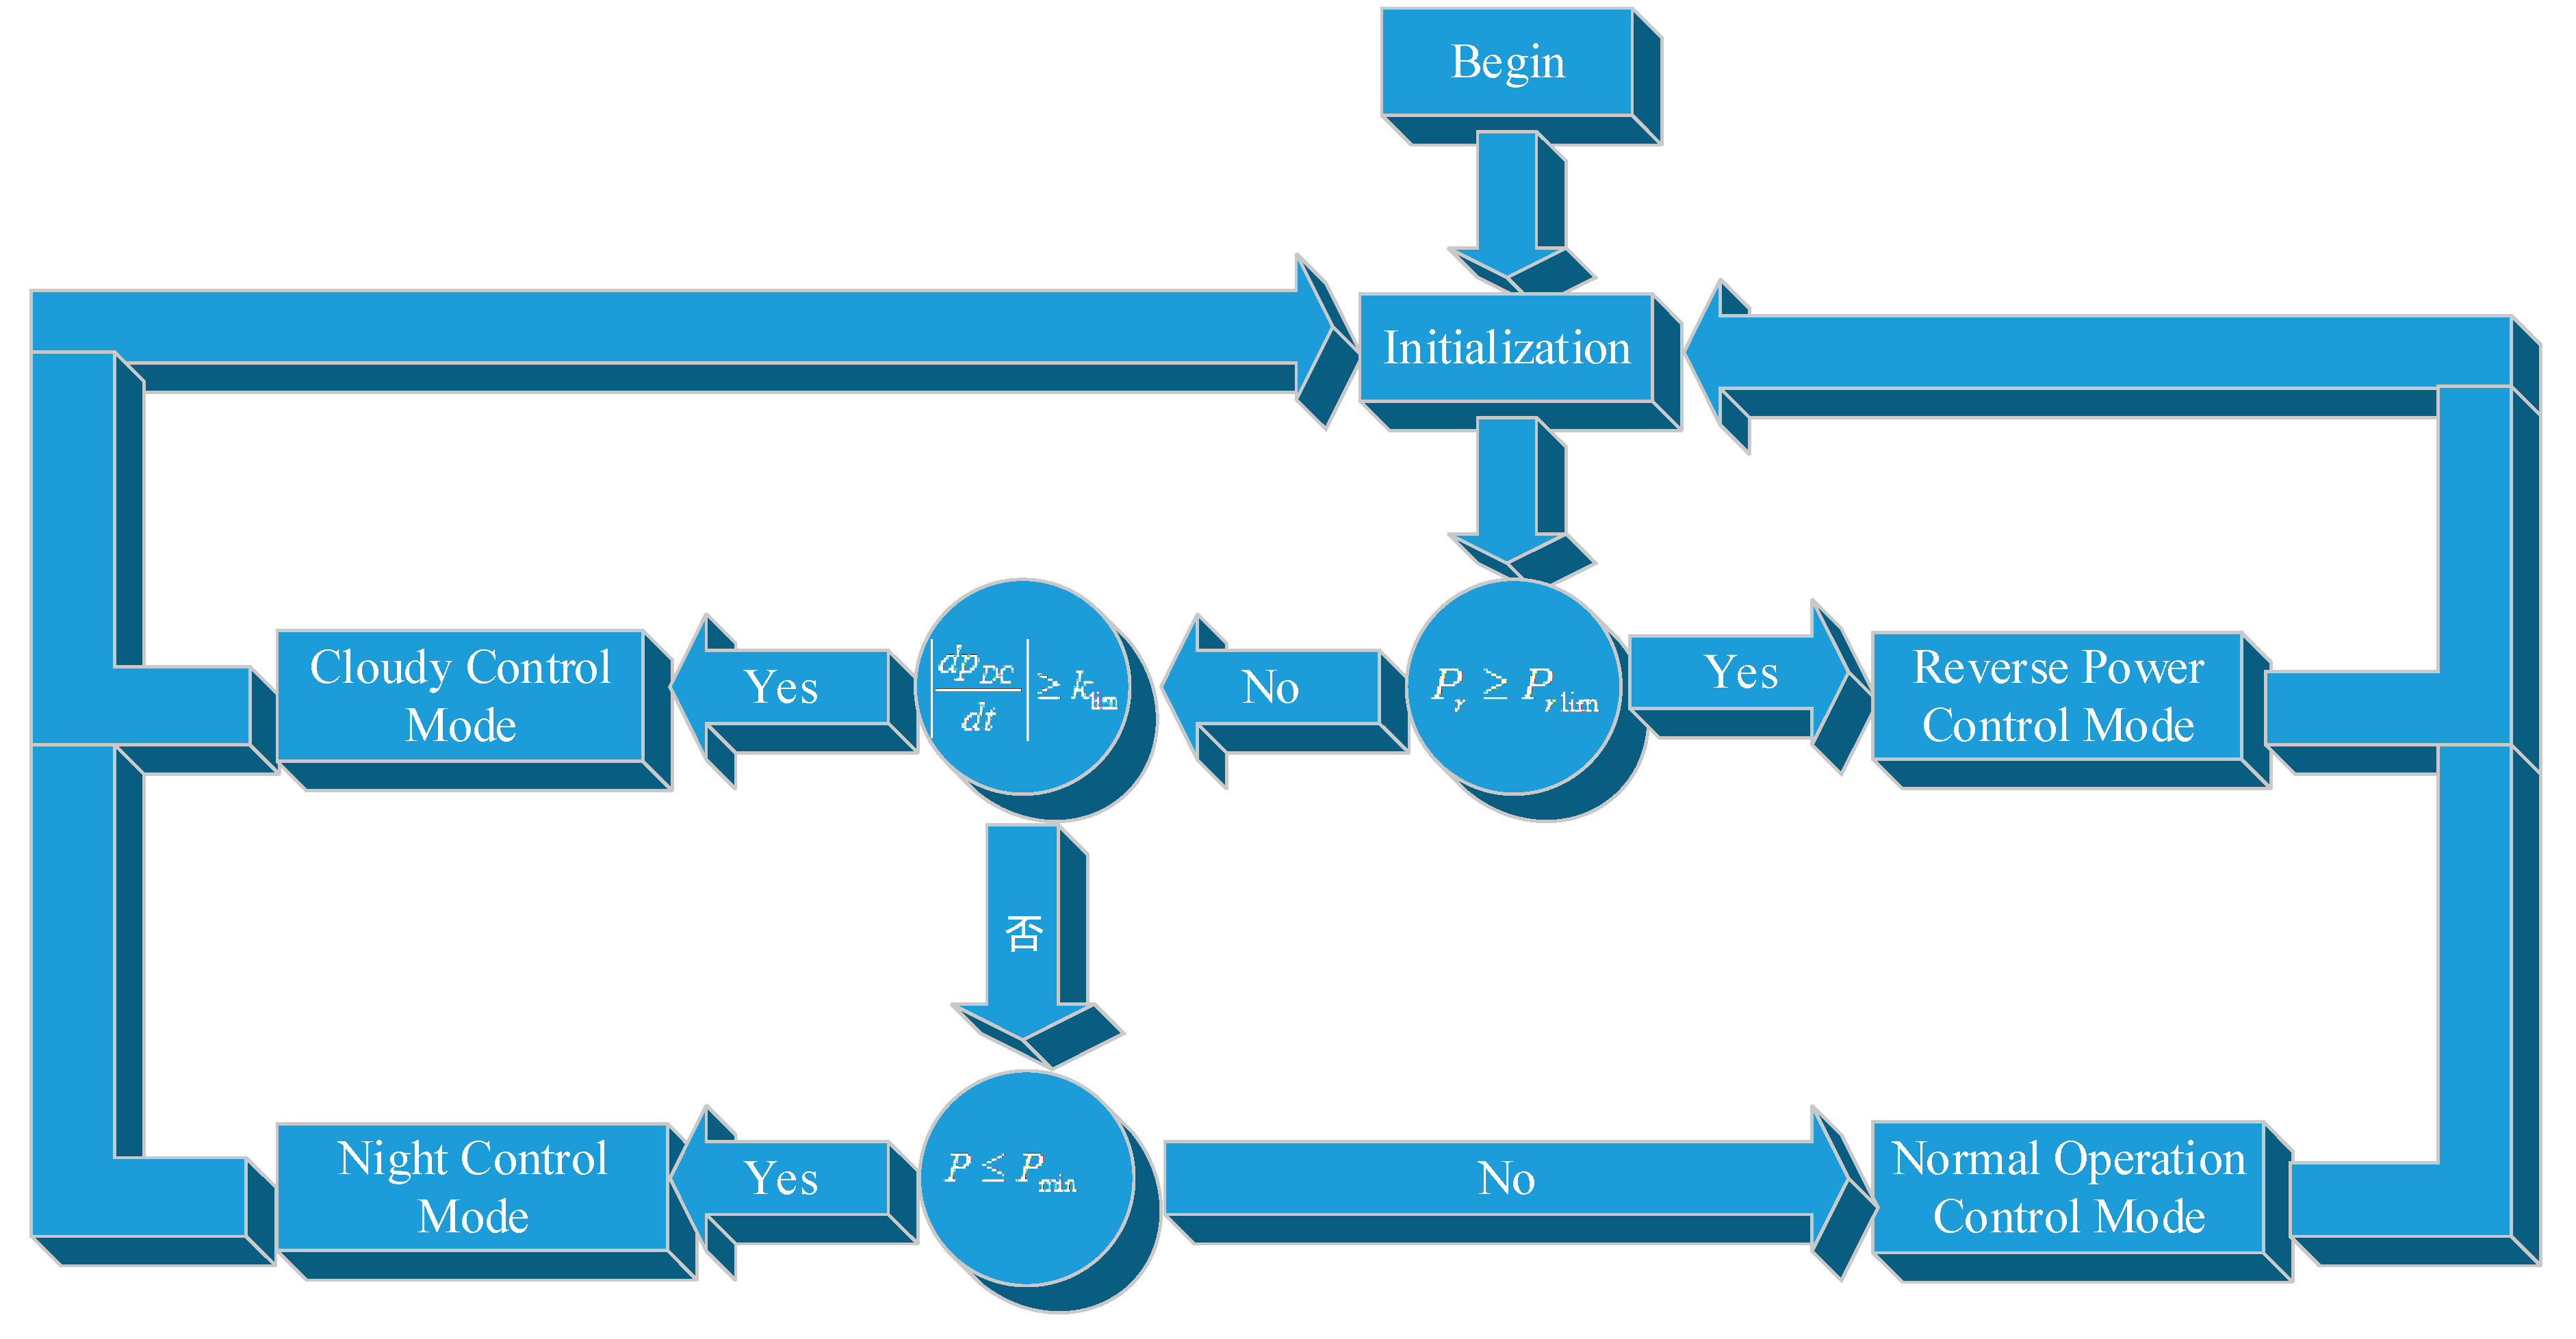
Figure 4.
Structure diagram of the other three control modes except night control mode.

Figure 5.
The waveform of under power factor control strategy.

Figure 6.
The waveform of under normal operation control mode.

Figure 7.
Waveform of active power in PCC.

Figure 8.
The waveforms of under power factor control strategy and reverse power control mode.

Figure 9.
Waveform of reactive power consumption in PV inverter under reverse power control mode.
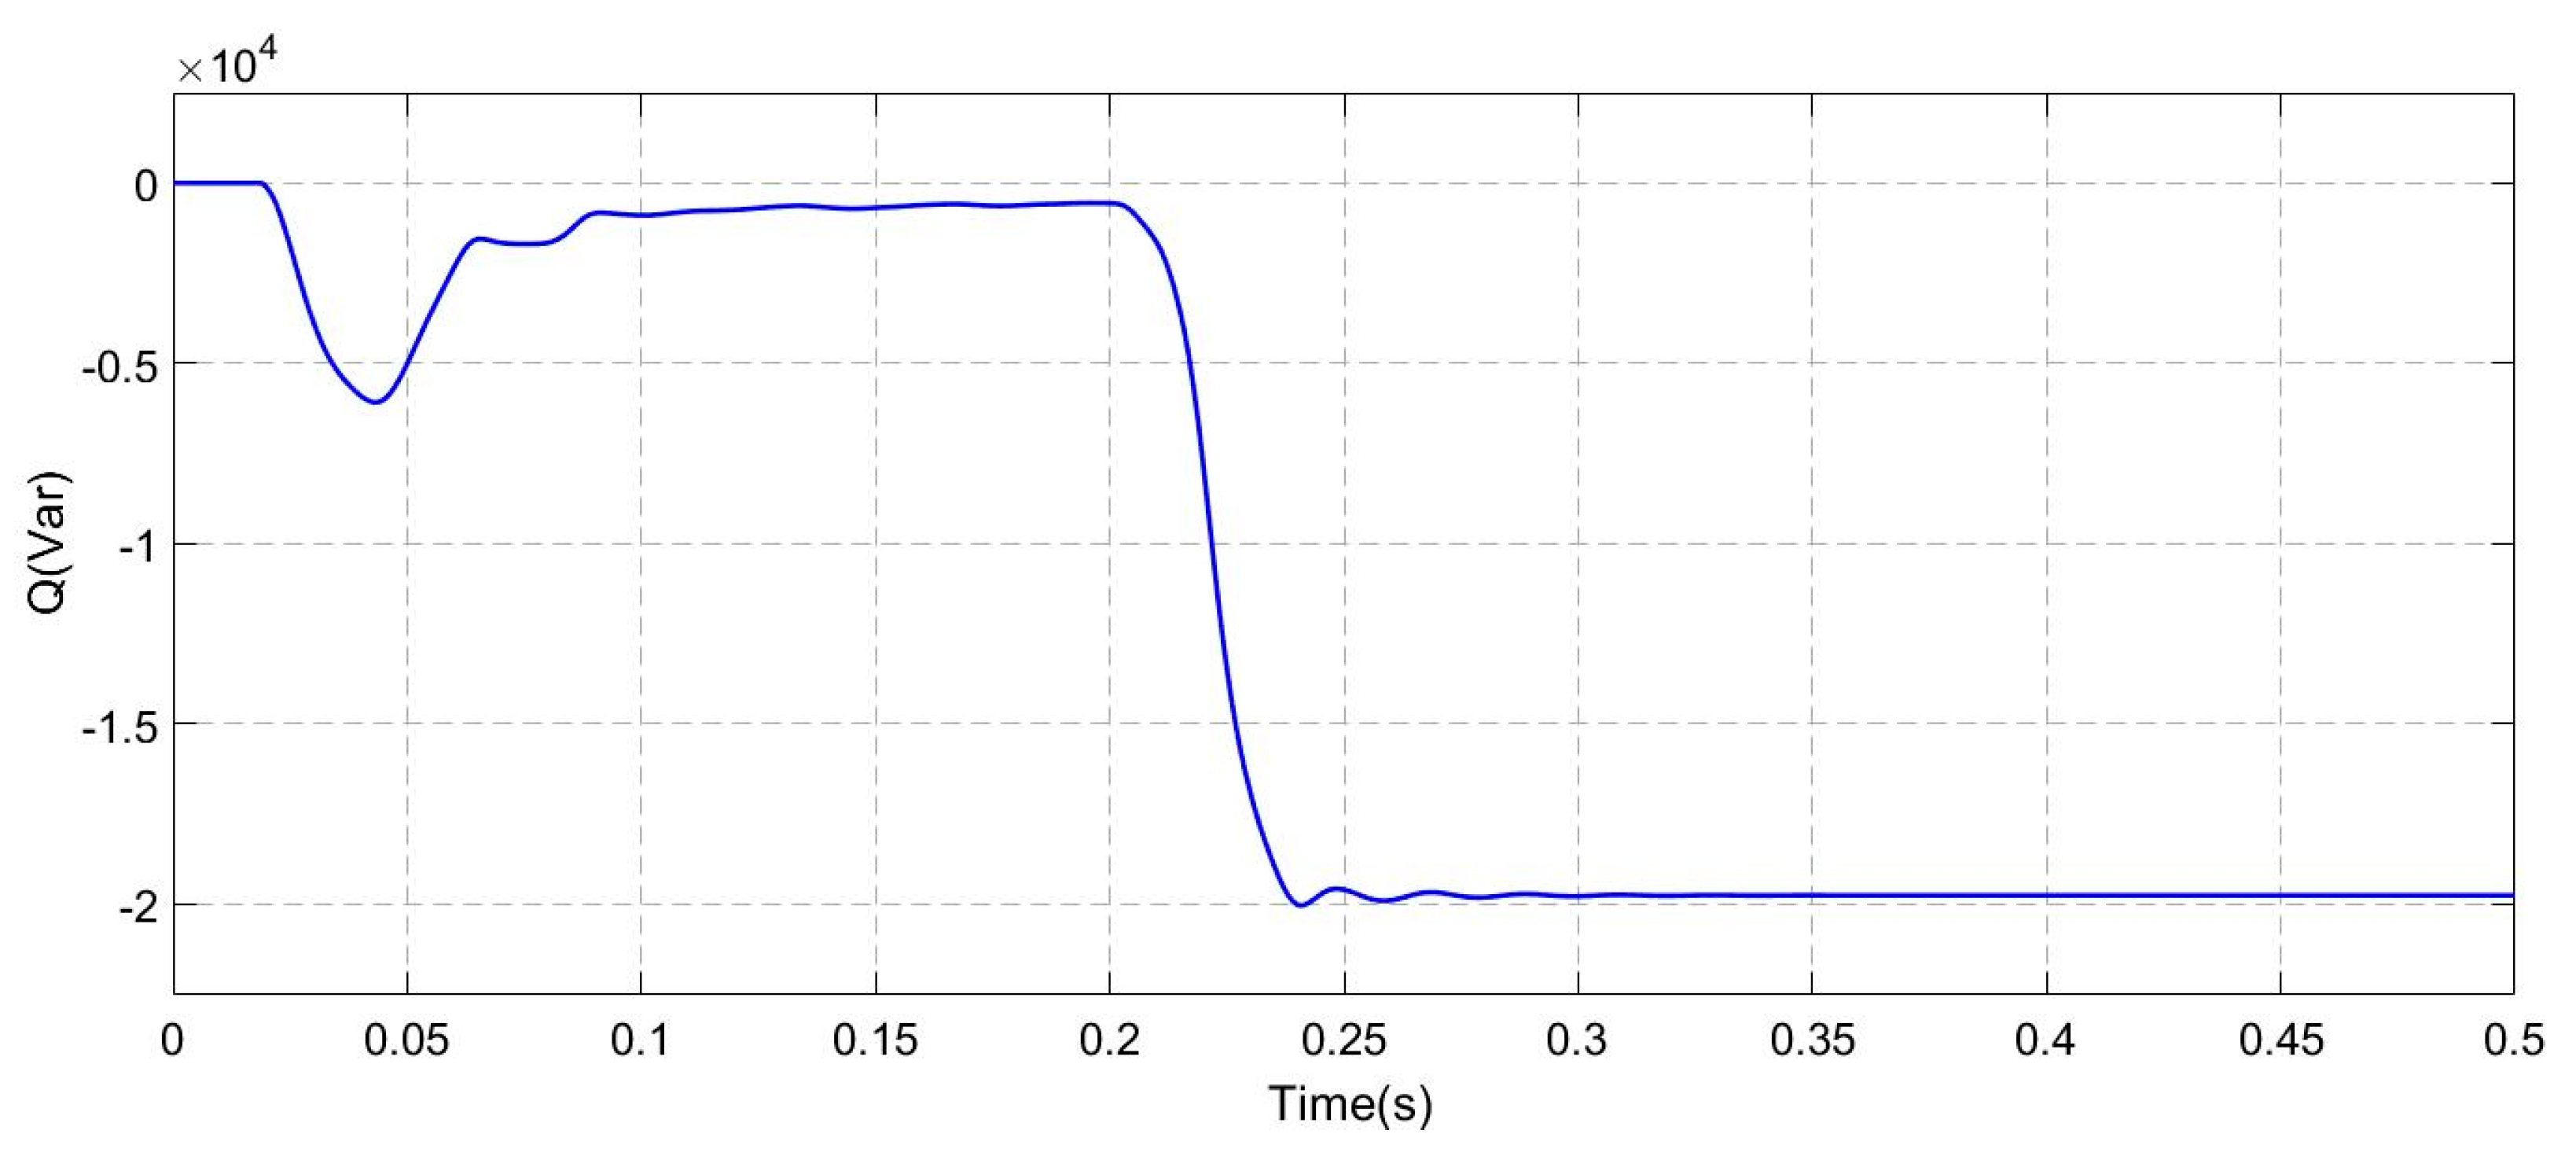
Figure 10.
The waveforms of under power factor control strategy and cloudy control mode.

Figure 11.
Waveforms of reactive power consumption in PV inverter under power factor control strategy and cloudy control mode.
Figure 11.
Waveforms of reactive power consumption in PV inverter under power factor control strategy and cloudy control mode.

Figure 12.
Waveforms of phase A voltage and current at load.

Figure 13.
Waveform of phase difference between voltage and current.
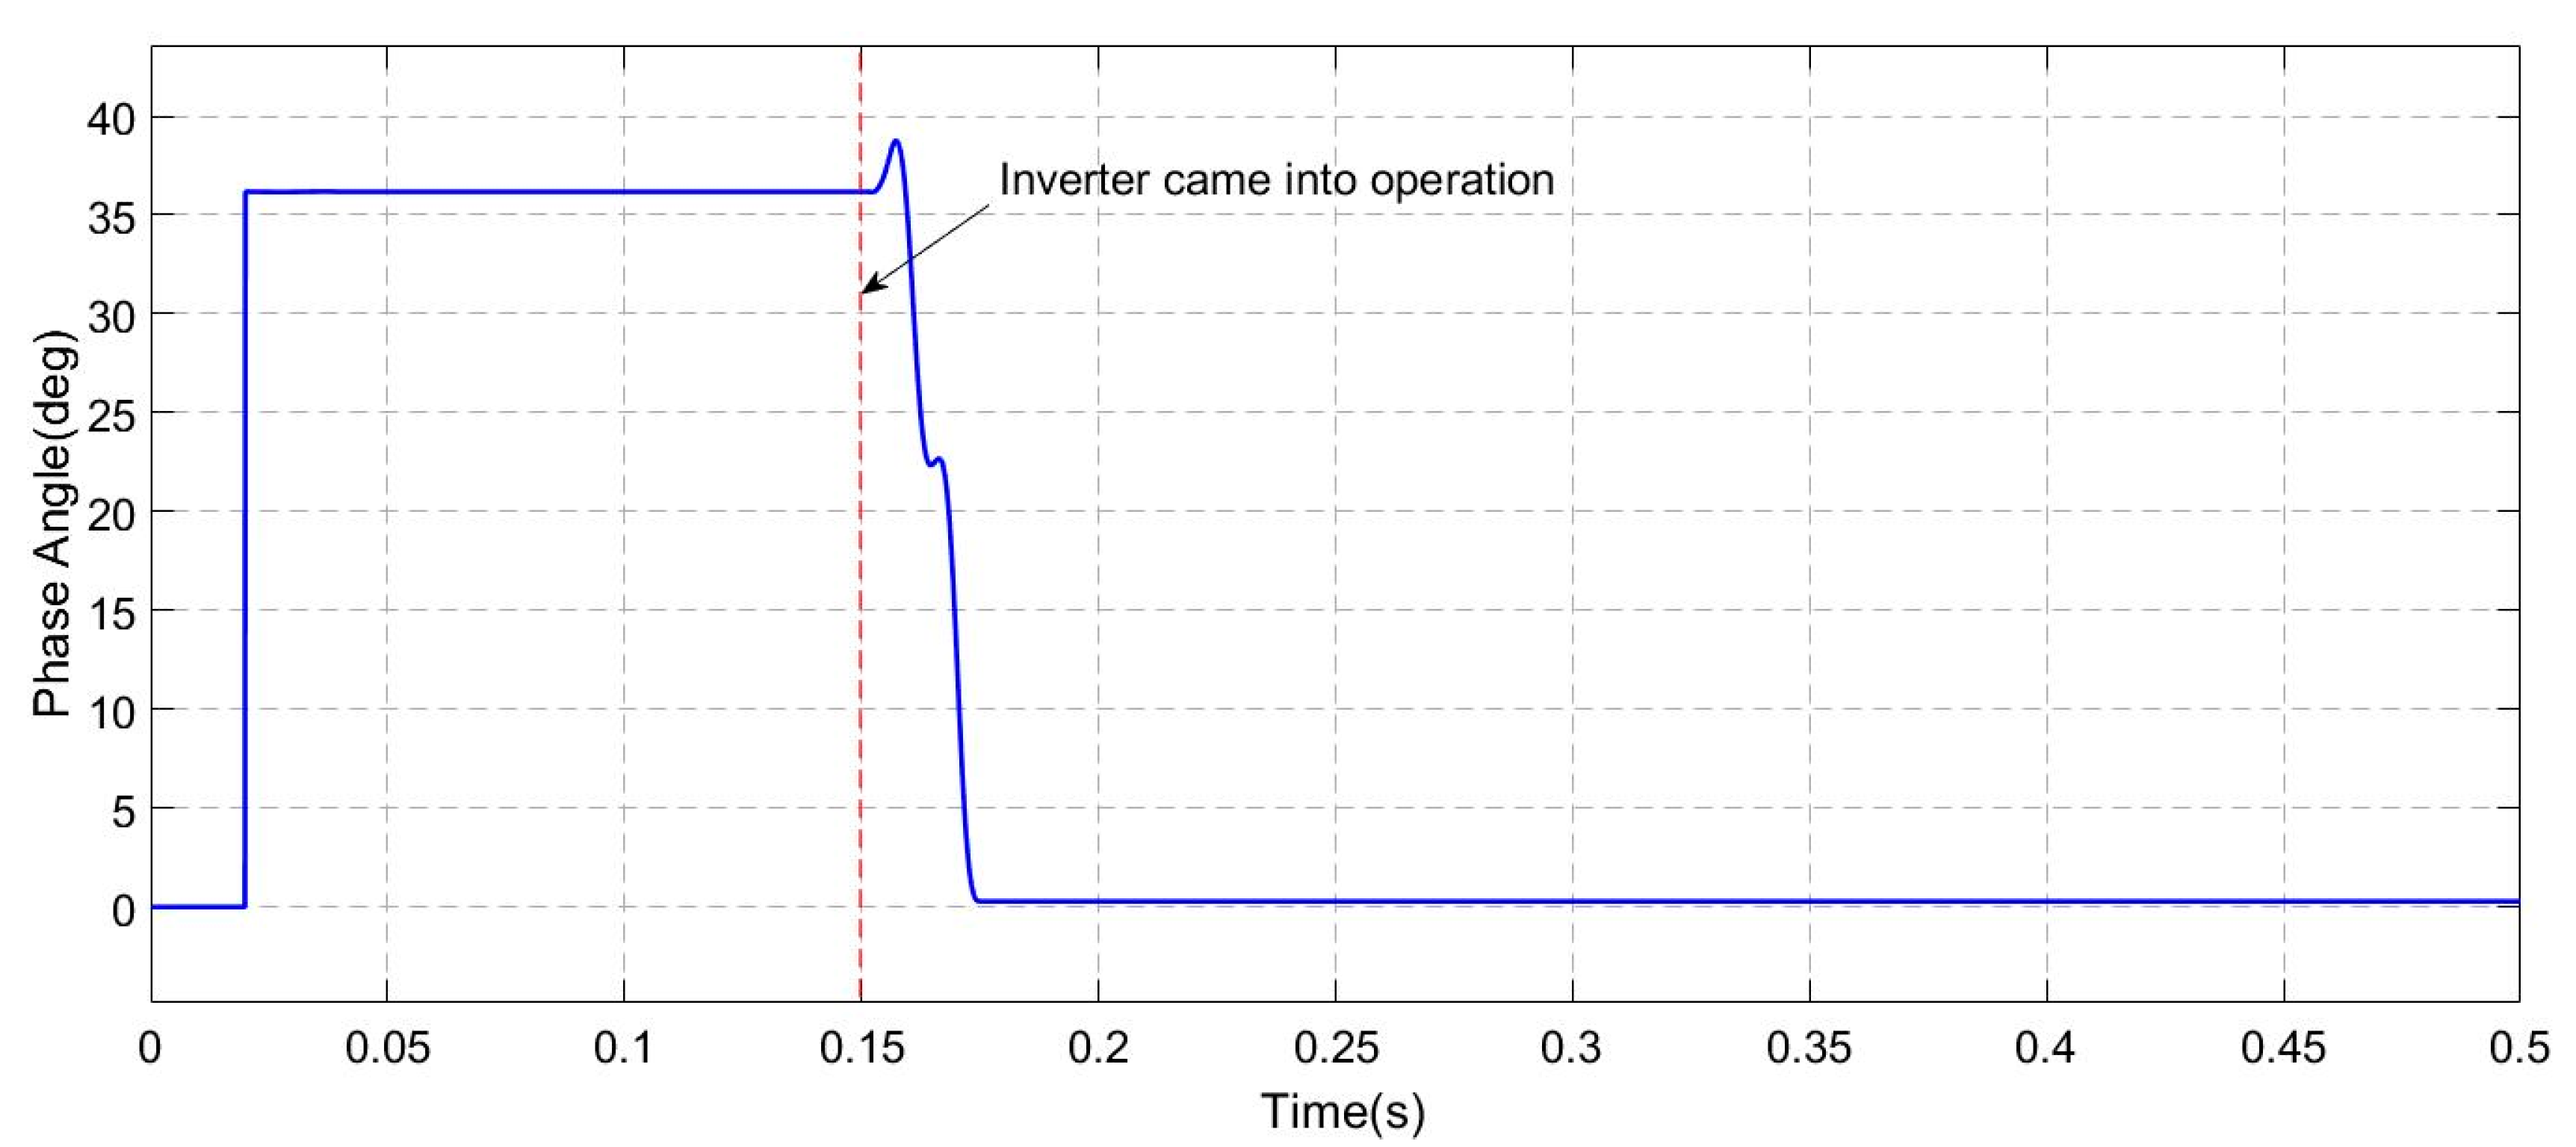
Figure 14.
Waveform of load current without PV inverter.

Figure 15.
Harmonic diagram of load current without PV inverter.

Figure 16.
Waveform of load current with PV inverter.

Figure 17.
Harmonic diagram of load current with PV inverter.

Figure 18.
Waveforms of under power factor control strategy and integrated control strategy.

Figure 19.
Waveform of reactive power in PV inverter under integrated control strategy.

Figure 20.
Waveform of power factor at load.

Figure 21.
Harmonic diagram of load current under integrated control strategy.

Table 1.
Codes of Power Quality Evaluation.
| Evaluation Indicators | Value (%) |
|---|---|
| THD | <5 |
| Odd harmonic distortion | <4 |
| Even harmonic distortion | <2 |
| Power factor | >90 |
| Voltage deviation | <±5 |
Table 2.
Specific settings in parameters.
| Parameters | Standard Value of | kp | ki | ||||
|---|---|---|---|---|---|---|---|
| Value | 300 V | 290 V | 295 V | 305 V | 310 V | 0.05 | 0.01 |
© 2017 by the authors. Licensee MDPI, Basel, Switzerland. This article is an open access article distributed under the terms and conditions of the Creative Commons Attribution (CC BY) license (http://creativecommons.org/licenses/by/4.0/).
Share and Cite
MDPI and ACS Style
Li, H.; Wen, C.; Chao, K.-H.; Li, L.-L. Research on Inverter Integrated Reactive Power Control Strategy in the Grid-Connected PV Systems. Energies 2017, 10, 912. https://doi.org/10.3390/en10070912
AMA Style
Li H, Wen C, Chao K-H, Li L-L. Research on Inverter Integrated Reactive Power Control Strategy in the Grid-Connected PV Systems. Energies. 2017; 10(7):912. https://doi.org/10.3390/en10070912
Chicago/Turabian StyleLi, Hua, Che Wen, Kuei-Hsiang Chao, and Ling-Ling Li. 2017. "Research on Inverter Integrated Reactive Power Control Strategy in the Grid-Connected PV Systems" Energies 10, no. 7: 912. https://doi.org/10.3390/en10070912
Note that from the first issue of 2016, this journal uses article numbers instead of page numbers. See further details here.