An Enhanced Empirical Wavelet Transform for Features Extraction from Wind Turbine Condition Monitoring Signals


1
School of Mechanical and Electrical Engineering, Henan University of Technology, Zhengzhou 450001, China
2
School of Engineering, Newcastle University, Newcastle upon Tyne NE1 7RU, UK
3
Hunan Province Cooperative Innovation Centre for Wind Power Equipment and Energy Conversion, Hunan Institute of Engineering, Xiangtan 411104, China
4
School of Marine Science and Technology, Northwestern Polytechnical University, Xi’an 710072, China
*
Author to whom correspondence should be addressed.
Energies 2017, 10(7), 972; https://doi.org/10.3390/en10070972
Submission received: 25 May 2017
/
Revised: 17 June 2017
/
Accepted: 5 July 2017
/
Published: 11 July 2017
(This article belongs to the Section I: Energy Fundamentals and Conversion)
Abstract
:Feature extraction from nonlinear and non-stationary (NNS) wind turbine (WT) condition monitoring (CM) signals is challenging. Previously, much effort has been spent to develop advanced signal processing techniques for dealing with CM signals of this kind. The Empirical Wavelet Transform (EWT) is one of the achievements attributed to these efforts. The EWT takes advantage of Empirical Mode Decomposition (EMD) in dealing with NNS signals but is superior to the EMD in mode decomposition and robustness against noise. However, the conventional EWT meets difficulty in properly segmenting the frequency spectrum of the signal, especially when lacking pre-knowledge of the signal. The inappropriate segmentation of the signal spectrum will inevitably lower the accuracy of the EWT result and thus raise the difficulty of WT CM. To address this issue, an enhanced EWT is proposed in this paper by developing a feasible and efficient spectrum segmentation method. The effectiveness of the proposed method has been verified by using the bearing and gearbox CM data that are open to the public for the purpose of research. The experiment has shown that, after adopting the proposed method, it becomes much easier and more reliable to segment the frequency spectrum of the signal. Moreover, benefitting from the correct segmentation of the signal spectrum, the fault-related features of the CM signals are presented more explicitly in the time-frequency map of the enhanced EWT, despite the considerable noise contained in the signal and the shortage of pre-knowledge about the machine being investigated.
1. Introduction
As faults occurring in wind turbines (WTs) can degrade power generation performance, prolong downtime, increase maintenance costs, and even lead to catastrophic failure if they cannot be detected and repaired in time [1], WT condition monitoring (CM) is been attracting increasing interest in recent years from both academic and industrial communities. In essence, the purpose of CM is to detect the turbine faults at their early developing stage and thus allow sufficient lead-time to schedule cost-effective maintenance [2,3]. However, it is not easy to achieve reliable CM of a WT. This is because WTs are subjected to constantly varying loads. Moreover, nowadays almost all large modern WTs operate at variable speeds in order to keep high power generation efficiency and maximize power output. Consequently, the CM signals collected from WTs are usually nonlinear and non-stationary over time. In contrast to the feature extraction from linear stationary signals (e.g., the CM signals collected from those steam turbines that operate at a constant rotational speed and are subjected to constant load), to extract fault-related features from nonlinear and nonstationary WT CM signals will be more difficult; thus it requests more advanced signal processing techniques [4,5].
Previously, many signal processing methods such as spectral kurtosis (SK), short-time Fourier Transform (STFT), Wigner-Ville distribution (WVD), wavelet transform, and S-transform have been developed for processing non-stationary CM signals [6,7,8,9,10]. The SK is a statistical tool used to indicate the presence of series of transients and their locations in the frequency domain. It was applied to detect the tooth crack occurring in a WT planetary gear in [11]. The STFT is more informative than the Fourier Transform attributed to the application of a sliding window function. However, due to the application of a constant window function, the time and frequency resolutions of the STFT results are limited to Heisenberg’s uncertainty principle. The WVD suffers from a similar problem, and, moreover, the WVD is also limited owing to the presence of the cross-term interferences in the result. To overcome the time and frequency resolution issues suffered by the STFT and WVD, wavelet transform was proposed later on. It provides unique multi-resolution analysis of non-stationary signals and therefore significantly benefits the CM of those machines operating under variable conditions. However, the wavelet transform is still a linear method, which is not adaptive to the local features of nonlinear CM signals. Consequently, it meets difficulty in extracting the local nonlinear features from CM signals. The S-transform takes advantage of both the STFT and wavelet transform. It is more efficient than the wavelet transform method in computation and more powerful than the STFT in feature extraction [7]. However, it inherits the disadvantage of both pioneer tools, i.e., it is not locally adaptive either. To address these issues, many signal processing approaches that are adaptive to local signal features have been developed in recent years such as empirical mode decomposition (EMD) and its extended form, local mean decomposition (LMD). These EMD-based techniques seem to provide an effective solution for extracting the local nonlinear features from CM signals [12]. However, the EMD-based techniques are constrained by the following factors in practical applications [13]:
- the recursive calculations lower the computational efficiency of the EMD algorithms;
- the error developed in envelope estimation will spread in the recursive calculation results and consequently decrease the accuracy of the decomposition;
So far, the aforementioned issues have not been fully addressed despite lots of attempts to mitigate them [16,17,18,19].
Recently, an alternative signal decomposition method, namely the Empirical Wavelet Transform (EWT), was proposed in order to tackle these issues [20]. In contrast to the EMD, the EWT is more efficient in signal decomposition as its calculation is non-recursive [21]. Moreover, the application of the wavelet filtering technique in the EWT makes it more robust against background noise [20]. In addition, thanks to the application of the wavelet filtering technique, the modes derived from the EWT are narrow-banded functions with fewer mixed modes. Such a merit makes the EWT a potentially powerful tool for extracting time-frequency features from nonlinear and non-stationary CM signals. However, it is different from the fully data-driven EMD method that does not require any pre-knowledge about the signal being processed, the implementation of the EWT requests to pre-set the number of modes and the frequency boundaries of each individual mode. This is always difficult, especially when lacking pre-knowledge about the objective being investigated. However, inappropriate definitions of the values of these parameters could lead to the inaccurate extraction of the signal features, thus misleading WT CM. To address this issue, an enhanced EWT method is proposed in this paper. It is assumed that:
- (1)
- the valid information of a signal is dominated by those frequency components with significant amplitudes; and
- (2)
- those frequency components with significant amplitudes can be readily identified from the envelope of the original frequency spectrum of the signal.
The details of the research are reported below.
2. Fundamental Theory and Limitations of the EWT
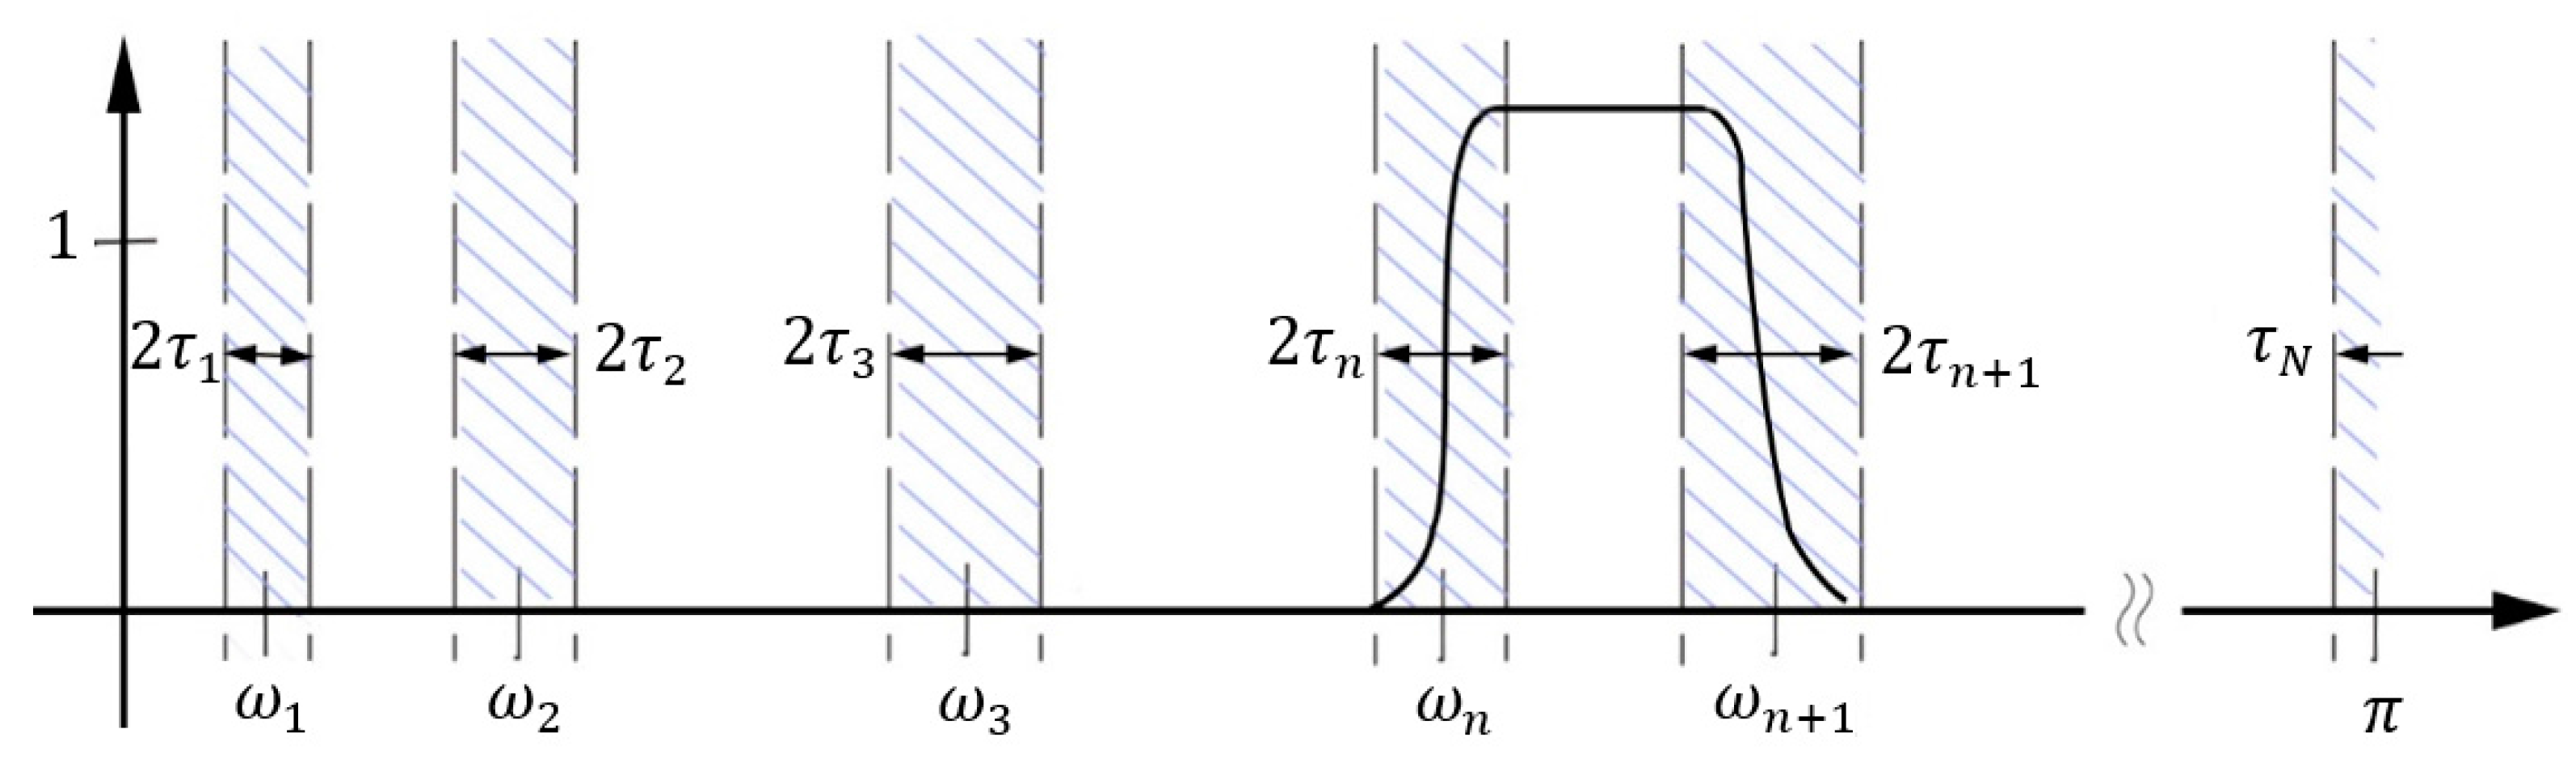
The EWT was proposed originally in order to use a family of wavelets to extract the amplitude modulated-frequency modulated (AM-FM) components in the signal [20]. According to [20], such AM-FM components have a compact support Fourier spectrum. As shown in Figure 1, the separation of different EWT mode functions is equivalent to segmenting the frequency spectrum of the signal and then applying filtering corresponding to each detected support.
Assume the Fourier support [0, π] is segmented into a limited number of contiguous segments. Use to denote mode boundaries between each segment, as shown in Figure 1. Then, the segment is expressed as . Accordingly, the spectrum of the original signal can be written as . Centered around each , a transition phase of width is defined. Then, the empirical scaling function and the empirical wavelets can be respectively defined as [20]:
where is an arbitrary function that satisfies:
There are many functions that can satisfy these properties. In [22], it is defined as:
Regarding the setting of , the simplest way is to set its value to be linear proportional to , i.e., , where the parameter must satisfy the following equation to meet the requirement of tight frame, i.e.,:
Substituting into (1) and (2) gives:
Subsequently, apply the spectrum segment parameters to (6) and (7) to construct the empirical wavelet filter bank. Then, the detail coefficients of the EWT of signal are given by the inner products of and the empirical wavelets , i.e.,:
The approximation coefficients of the EWT of signal are given by the inner product of and the scaling function :
The reconstruction of signal is:
Accordingly, the empirical mode is given by:
Attributed the merit of extracting the AM-FM components from nonlinear, non-stationary signals, the EWT has been identified as a potential powerful tool for dealing with the nonlinear and non-stationary CM signals, particularly those collected from variable speed machines (e.g., WTs). However, the EWT also has some drawbacks that limit its application to WT CM, which are as follows.
● The number of modes
In comparison with the EMD, the EWT allows the number of modes to be defined in advance so that the signal decomposition results are more controllable than those by the EMD. In theory, the right number of modes is dependent on the number of AM-FM components contained in the signal. This implies that the nonlinear signal features cannot be correctly extracted once inappropriate number of modes is defined. For example, in [20] local maxima in the Fourier spectrum were directly used to segment the spectrum. Such a segmentation method is too simple to guarantee the effectiveness of feature extraction because it does not provide a reasonable method to define the number of modes.
● Mode bandwidth boundary detection
Wavelet filtering is a key technique adopted by the EWT. As mentioned above, a linear proportional bandwidth is used to construct all filters with different central frequencies. This is not a fully adaptive bandwidth definition method, which could result in undesired signal decomposition results. Thus an adaptive bandwidth is critical to ensure the accuracy of the signal decomposition results. However, it was not considered in the conventional EWT.
3. Enhanced Empirical Wavelet Transform
In order to address the aforementioned issues existing in the conventional EWT, an enhanced EWT is proposed in this paper. It is characterized by the application of a more reliable technique to segment the frequency spectrum of the signal. The new segmentation technique will perform the envelope analysis of the signal spectrum first. Then, a hard thresholding technology is applied to trim the obtained envelope curve. From the trimmed envelope curve, the principal frequency components contained in the signal can be readily identified, which are used for determining the number of EWT modes and the frequency boundaries of each mode. Such a spectrum segmentation method is easy to implement without requiring lots of calculations. For example, assuming a CM signal , the spectrum segmentation method used in its enhanced EWT analysis can be implemented by following the steps:
- Step 1.:
- Implement the Fourier transform of , i.e.,where denotes the half number of data contained in signal .
- Step 2:
- Detect the local extra values of .
- Step 3:
- Generate the envelope curve of the Fourier spectrum by using the cubic spline interpolation method.
- Step 4:
- Calculate the following thresholdwhere and are respectively the maximum and minimum magnitudes in the frequency spectrum and is inversely proportional to the signal-to-noise (SNR). Herein, the constant is used to control the level of the threshold, i.e., the larger the value of , the higher the level of the threshold tends to be. In this paper, was taken to be 0.1 based on the assumption that the signal-to-noise ratio of WT CM signals is higher than 85 dB and .
- Step 5:
- Trim the envelope curve using the calculated threshold and detect all extras in the trimmed envelope curve.
- Step 6:
- Locate all local maximum points. The number of them is used to define the number of EWT modes, and their frequencies are used to define the central frequencies of the modes.
- Step 7:
- Locate all the local minimal points and sort them in ascending order, i.e., . They are used to segment the frequency spectrum.
From the above description, at least two merits of the proposed segmentation method can be inferred, i.e.,
- (1)
- attributed to the trimming process that is implemented at Step 5, the number of modes can be readily determined based on the actual situation of the signal;
- (2)
- since the local extras in the trimmed envelope curve are applied to define the boundaries of the modes, spectrum segmentation can be easily implemented.
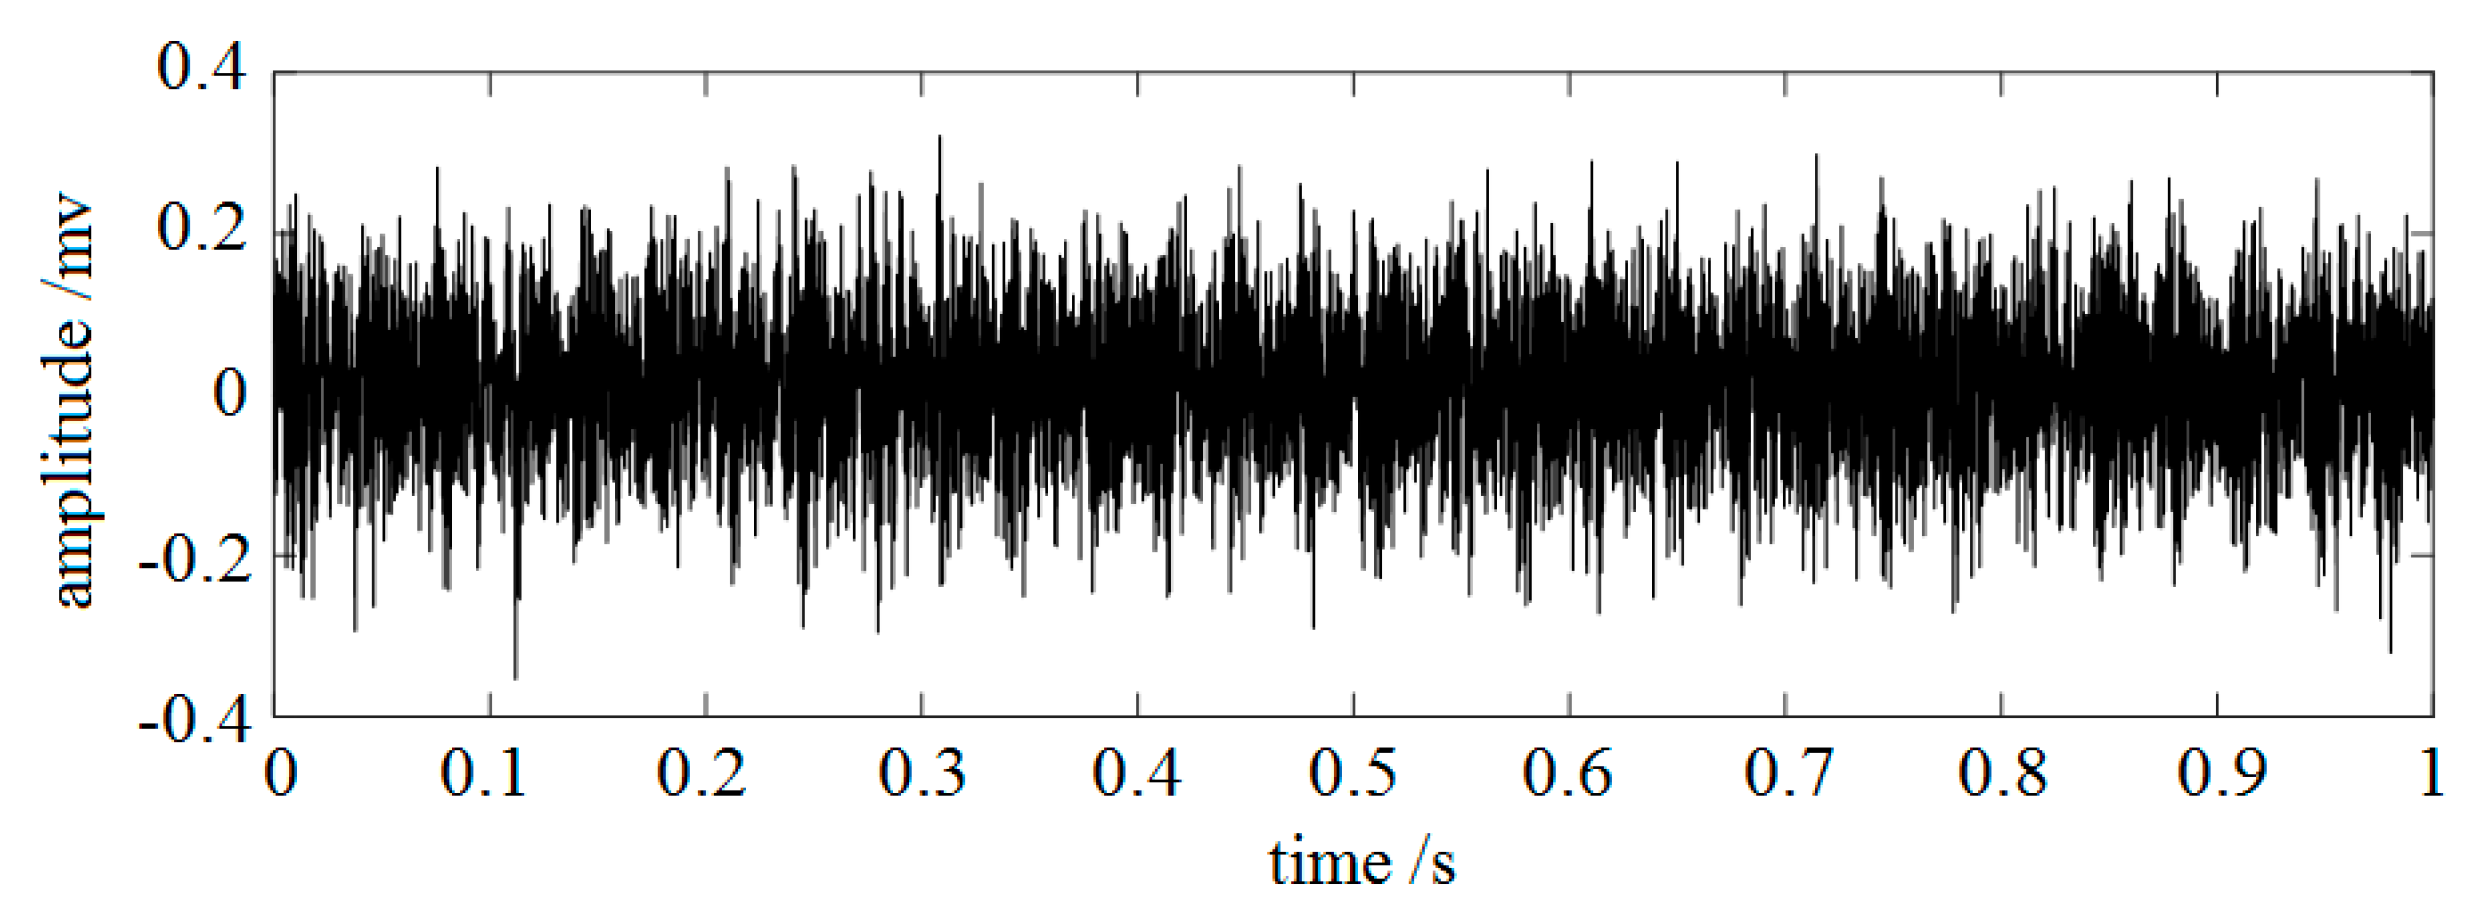
In the following, to ease understanding a real bearing CM signal is employed as an example to demonstrate the above segmentation method. The time waveform of the signal is shown in Figure 2. Firstly, conduct the Fourier transform of the signal. Its frequency spectrum and the corresponding envelope curve are shown in Figure 3a. Secondly, calculate the value of the threshold using (15) and obtain Threshold = 2. Then, use the threshold to trim the envelope curve. The trimmed envelope curve is shown in Figure 3b.
Subsequently, segment the frequency spectrum based on the trimmed envelope curve by using the methods described at stages 6 and 7. The results are also plotted in Figure 3b, where the frequency boundaries of the modes are indicated by the dash lines. From Figure 3b, it is seen that the frequency spectrum of the signal is segmented into 11 portions, which are indicated by the boundaries of the six principal modes.
In order to prove the rationality of the segmentation results obtained above, correlation analysis between the raw signal and the signals that are constructed by using the EWT modes is performed. It is presumed that the more modes are used to construct the signal, the more the reconstructed signal will be correlated with the raw signal. To obtain a clear variation tendency of the resultant correlation efficient against the number of modes being used for signal reconstruction, pre-set the number of modes to be 11 and decompose the signal in Figure 2 by using the conventional EWT. Then, reconstruct the signal by using the obtained mode functions and calculate the correlation coefficient of the reconstructed signal and the raw signal by using the equation:
where increases from 1 to 11, denoting the number of modes used for signal reconstruction. indicates the correlation efficient between the raw signal and the reconstructed signal using mode functions.
The variation tendency of the resultant correlation coefficient ratio against the number of modes is shown in Figure 4.
From Figure 4, it is seen that the resultant correlation coefficient increases gradually with the increasing number of modes until it reaches about one when the number of modes is 11. Moreover, it is interestingly found that obvious step increase happens when 1, 2, 4, 6, 8, and 10. This implies that these six modes are the components that carry the most important features of the signal. Thus, the signal reconstructed by using these six modes can effectively describe the major features of the raw signal. Obviously, such a result is in agreement with the results obtained using the proposed segmentation method. Thus, through this example, it can be said that the proposed segmentation method is valid in detecting the optimal modes of the signal.
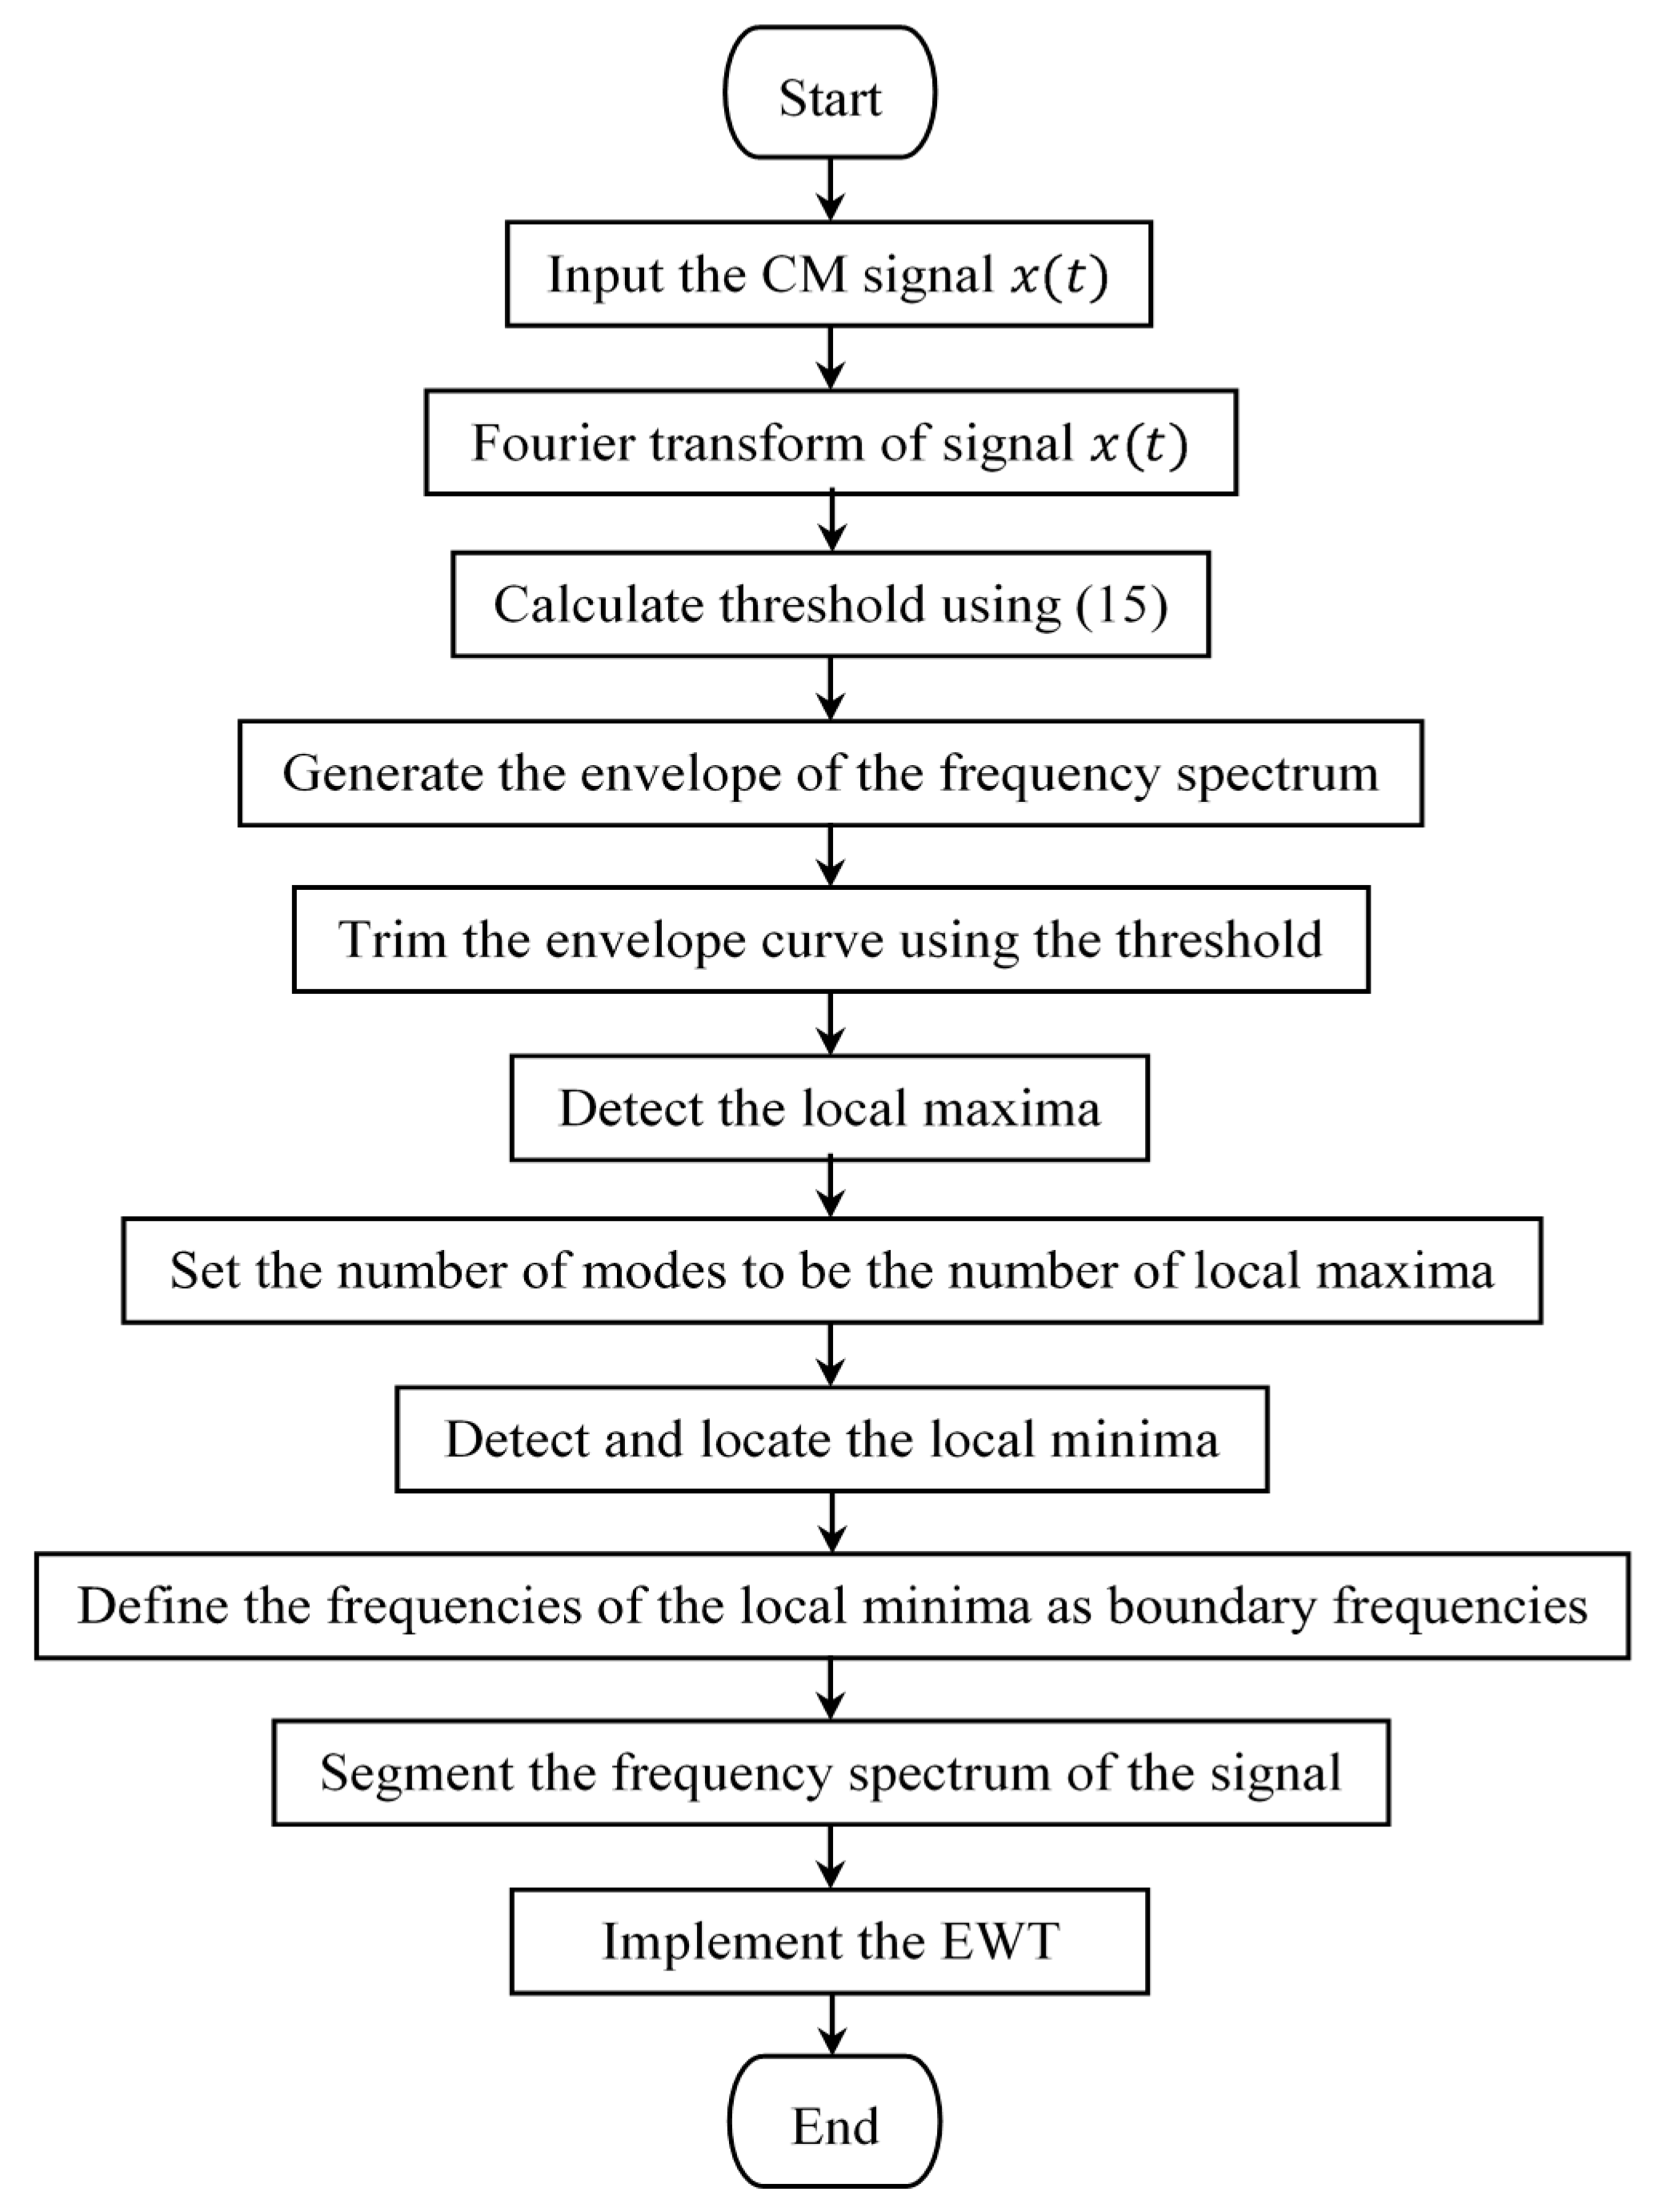
Based on the proposed segmentation method, an enhanced EWT algorithm is developed. Its flowchart is shown in Figure 5.
4. Verification Tests of the Enhanced EWT
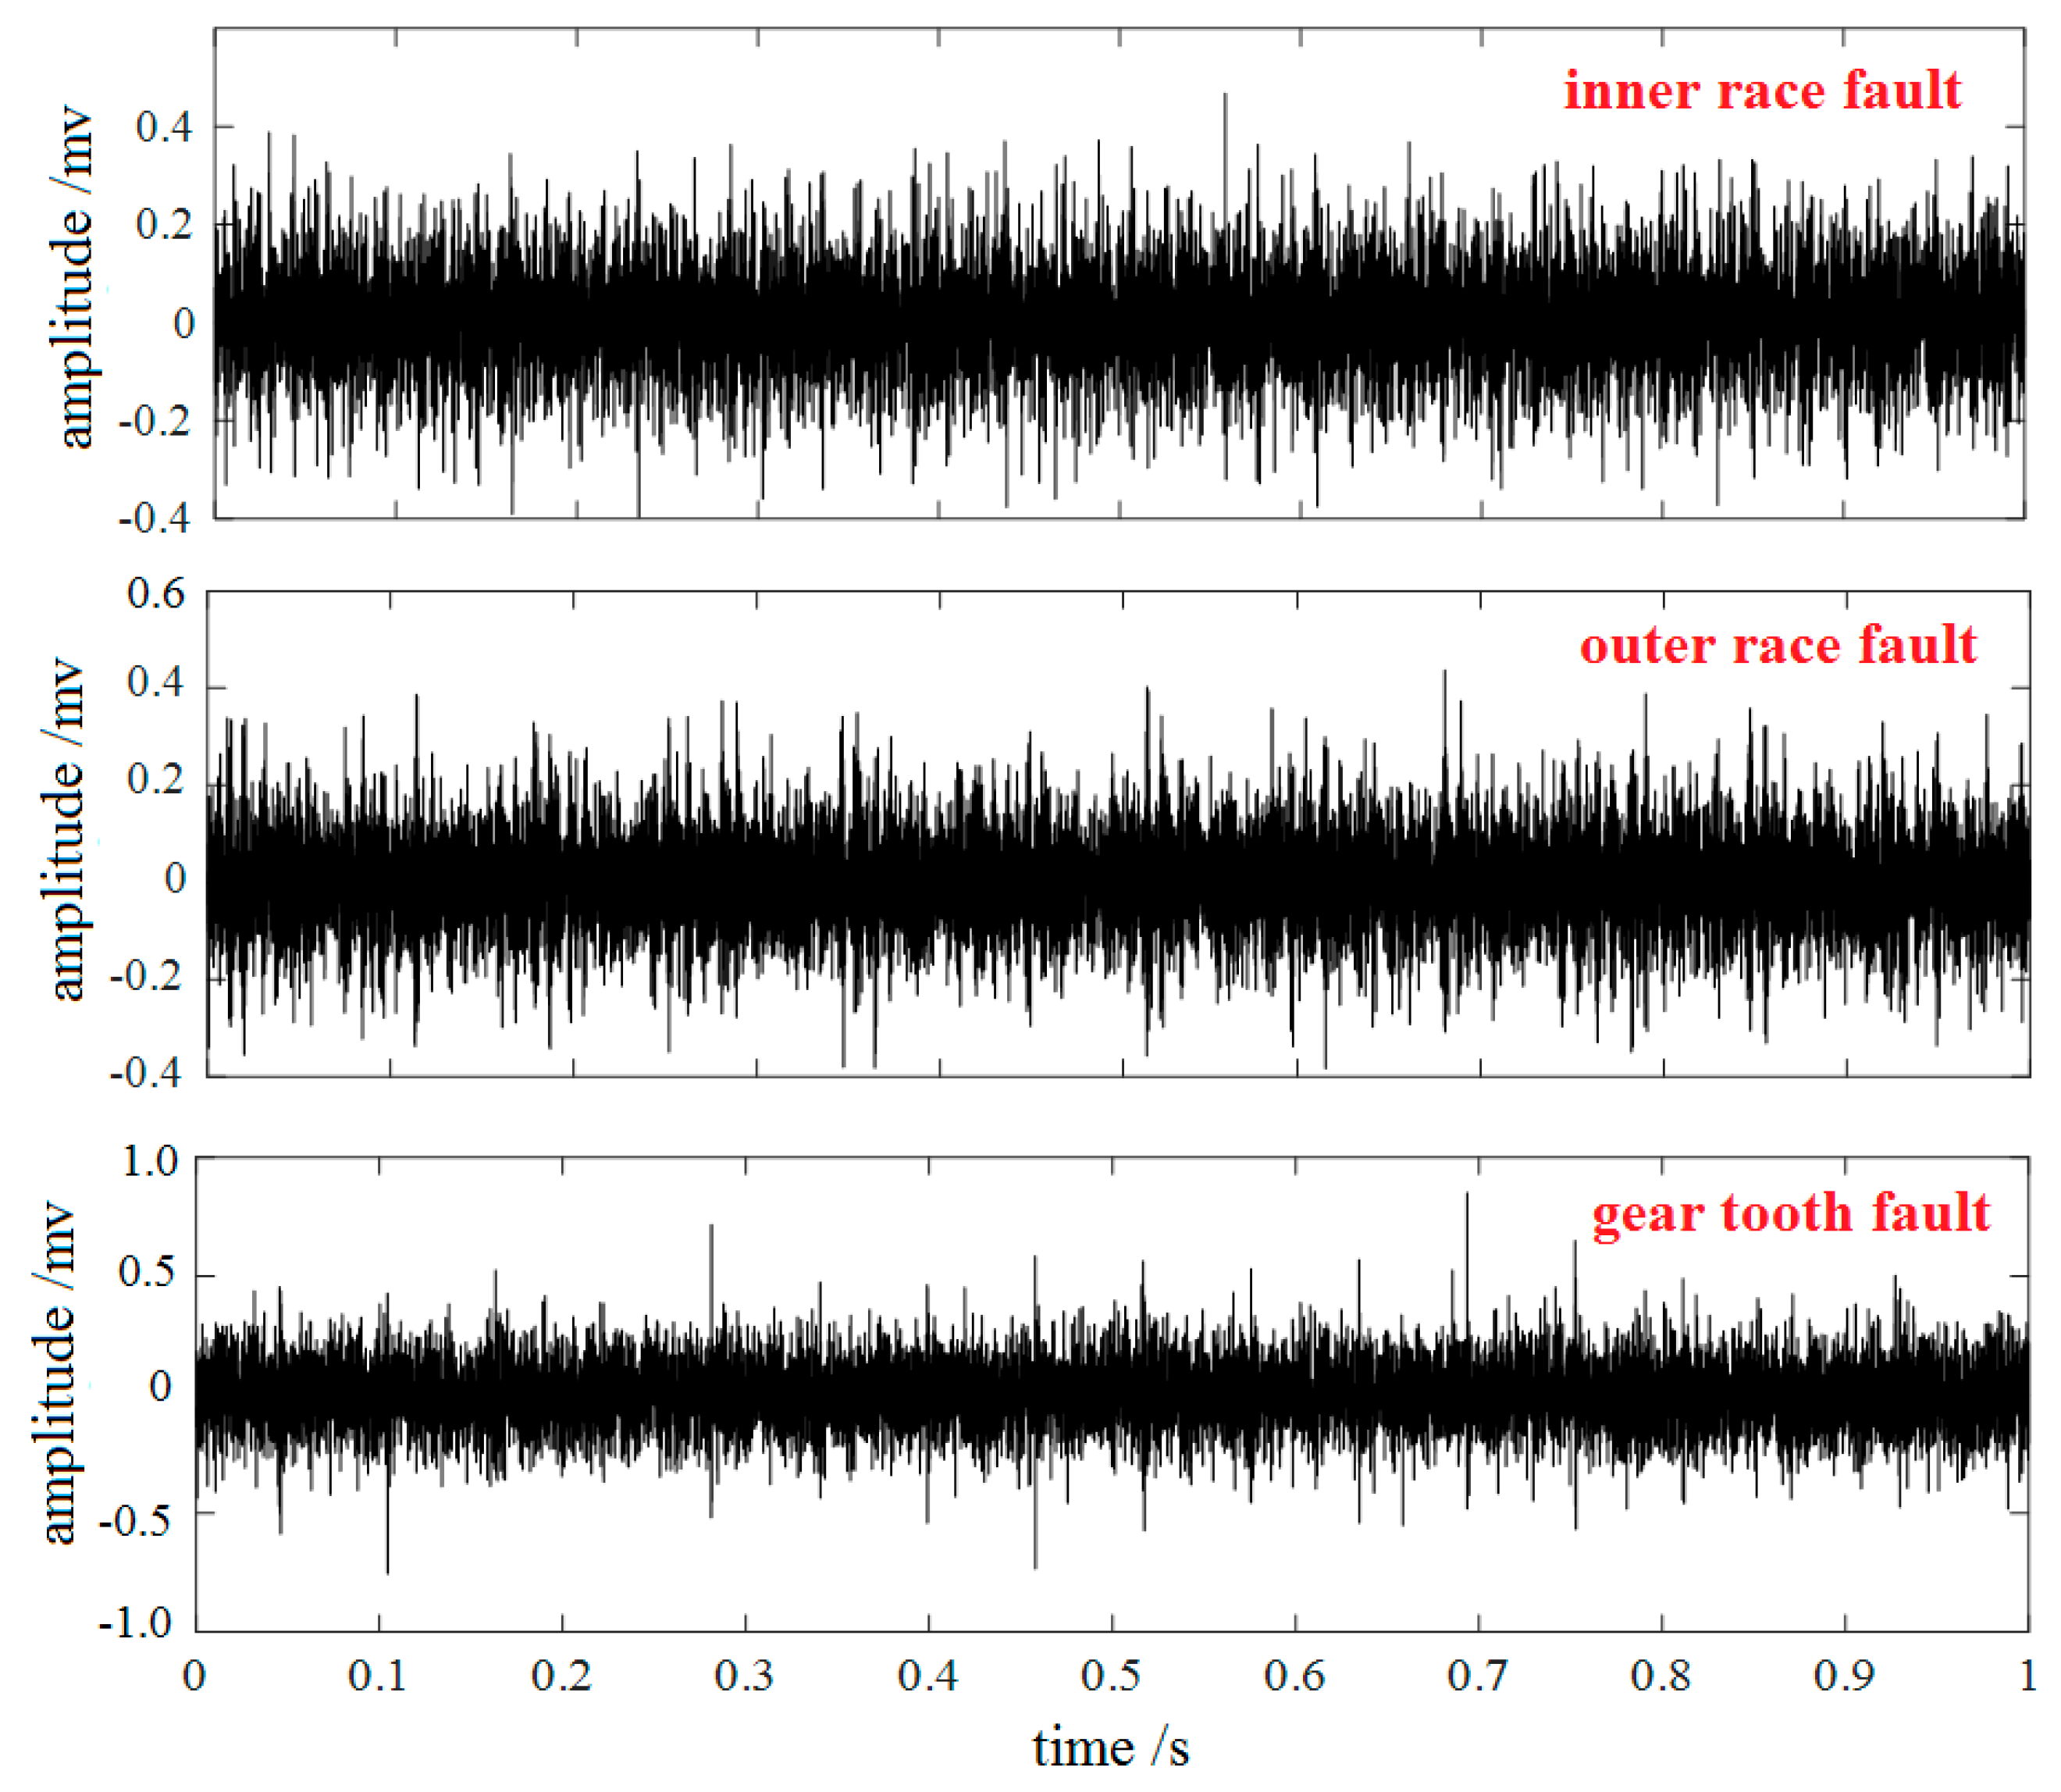
In order to verify the enhanced EWT, two bearing and one gear vibration signals that are open for research [23,24] were adopted for testing in this section. The time waveforms of these three signals are collectively shown in Figure 6. Herein, it is worth to note that in the figure
- the bearing data were collected from a test rig consisting of a motor speed controller, a 2 HP motor, and a generator [23]. Both inner race and outer race faults were emulated on the motor bearing of the test rig. The acceleration signals were collected by using a sampling frequency of 12 kHz when the motor rotated at 1750 rev/min;
- the gear vibration data were collected from a test rig consisting of a gearbox, a load mechanism, a triaxial accelerometer, and four shock absorbers [24]. The accelerometer was installed on the case of the gearbox. The acceleration signals were recorded by using a sampling frequency of 16 KHz when the input shaft of the gearbox rotated at 1400 rev/min.
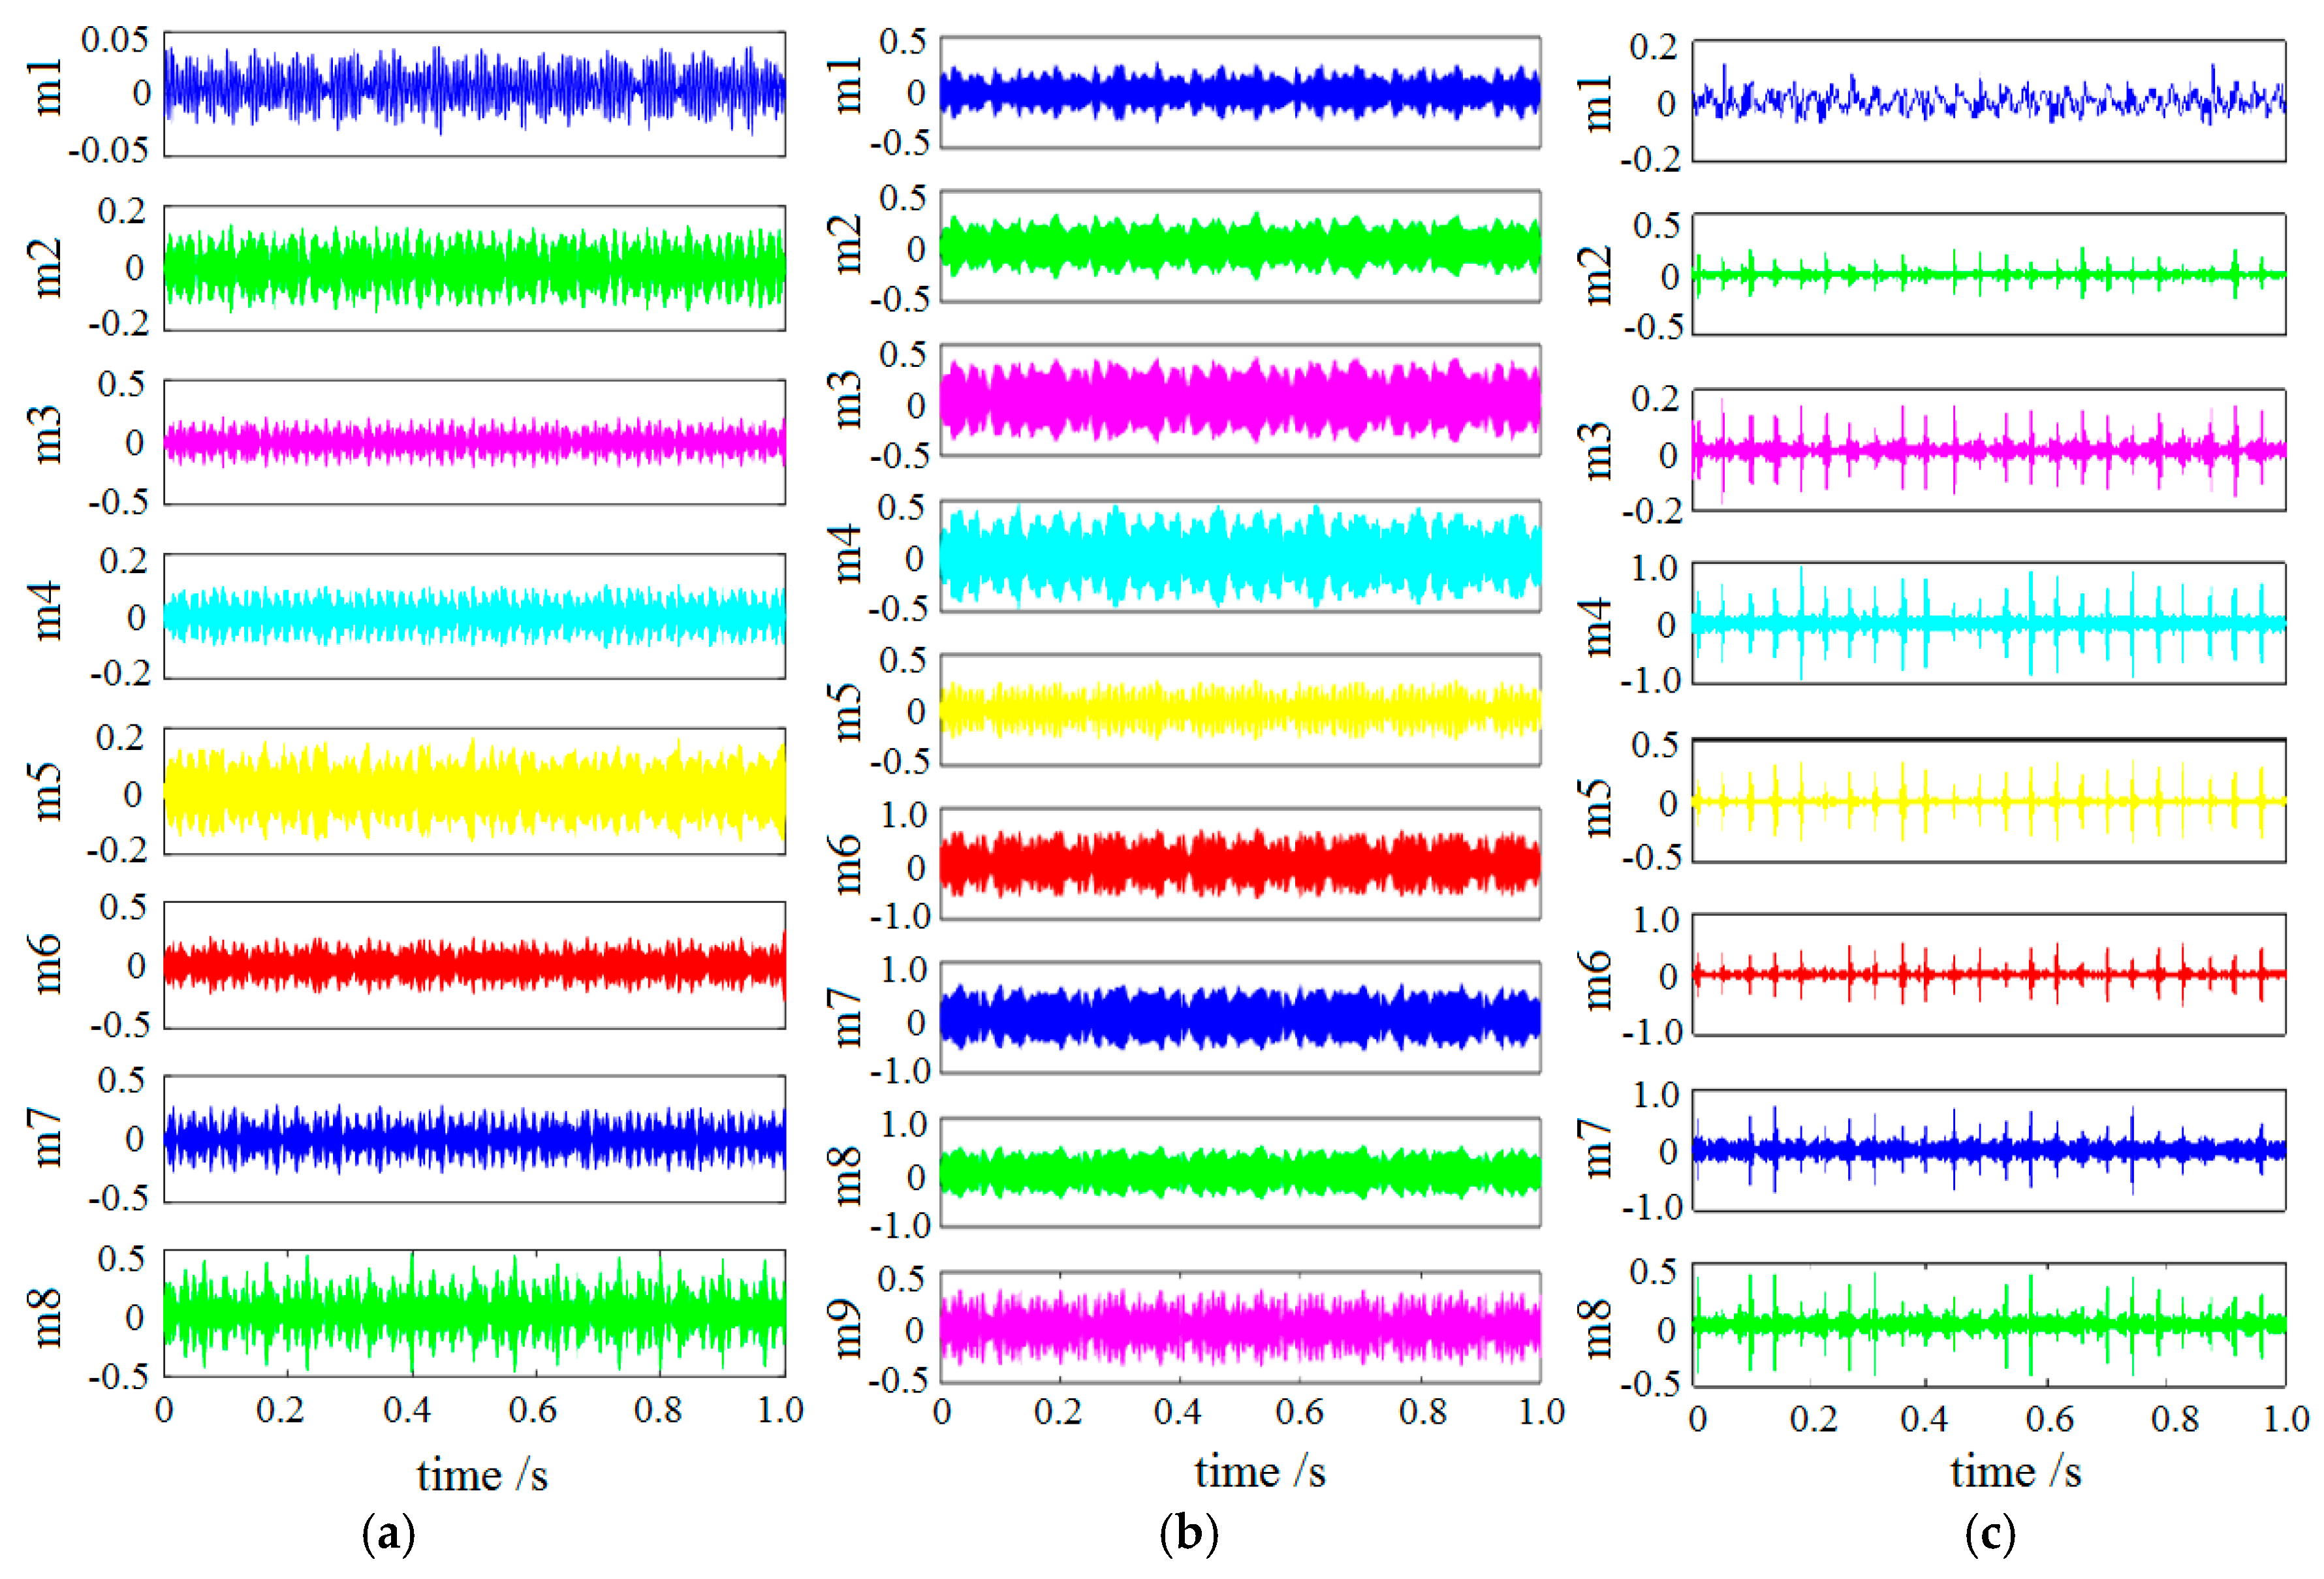
From Figure 6, it is seen that strong background noise exists in all three vibration signals. As a consequence, the impact features that indicate faults can be perceived from the signal waveforms, however difficult to interpret. Therefore, the enhanced EWT was applied to process the signals, and the primary modes derived from the EWT are shown in Figure 7, where ‘m’ denotes the -th EWT mode. Considering the detailed description of the signal spectrum segmentation process has been given in Section 3, the segmentation of the frequency spectra of these three signals will not be depicted once again in order to keep this paper concise.
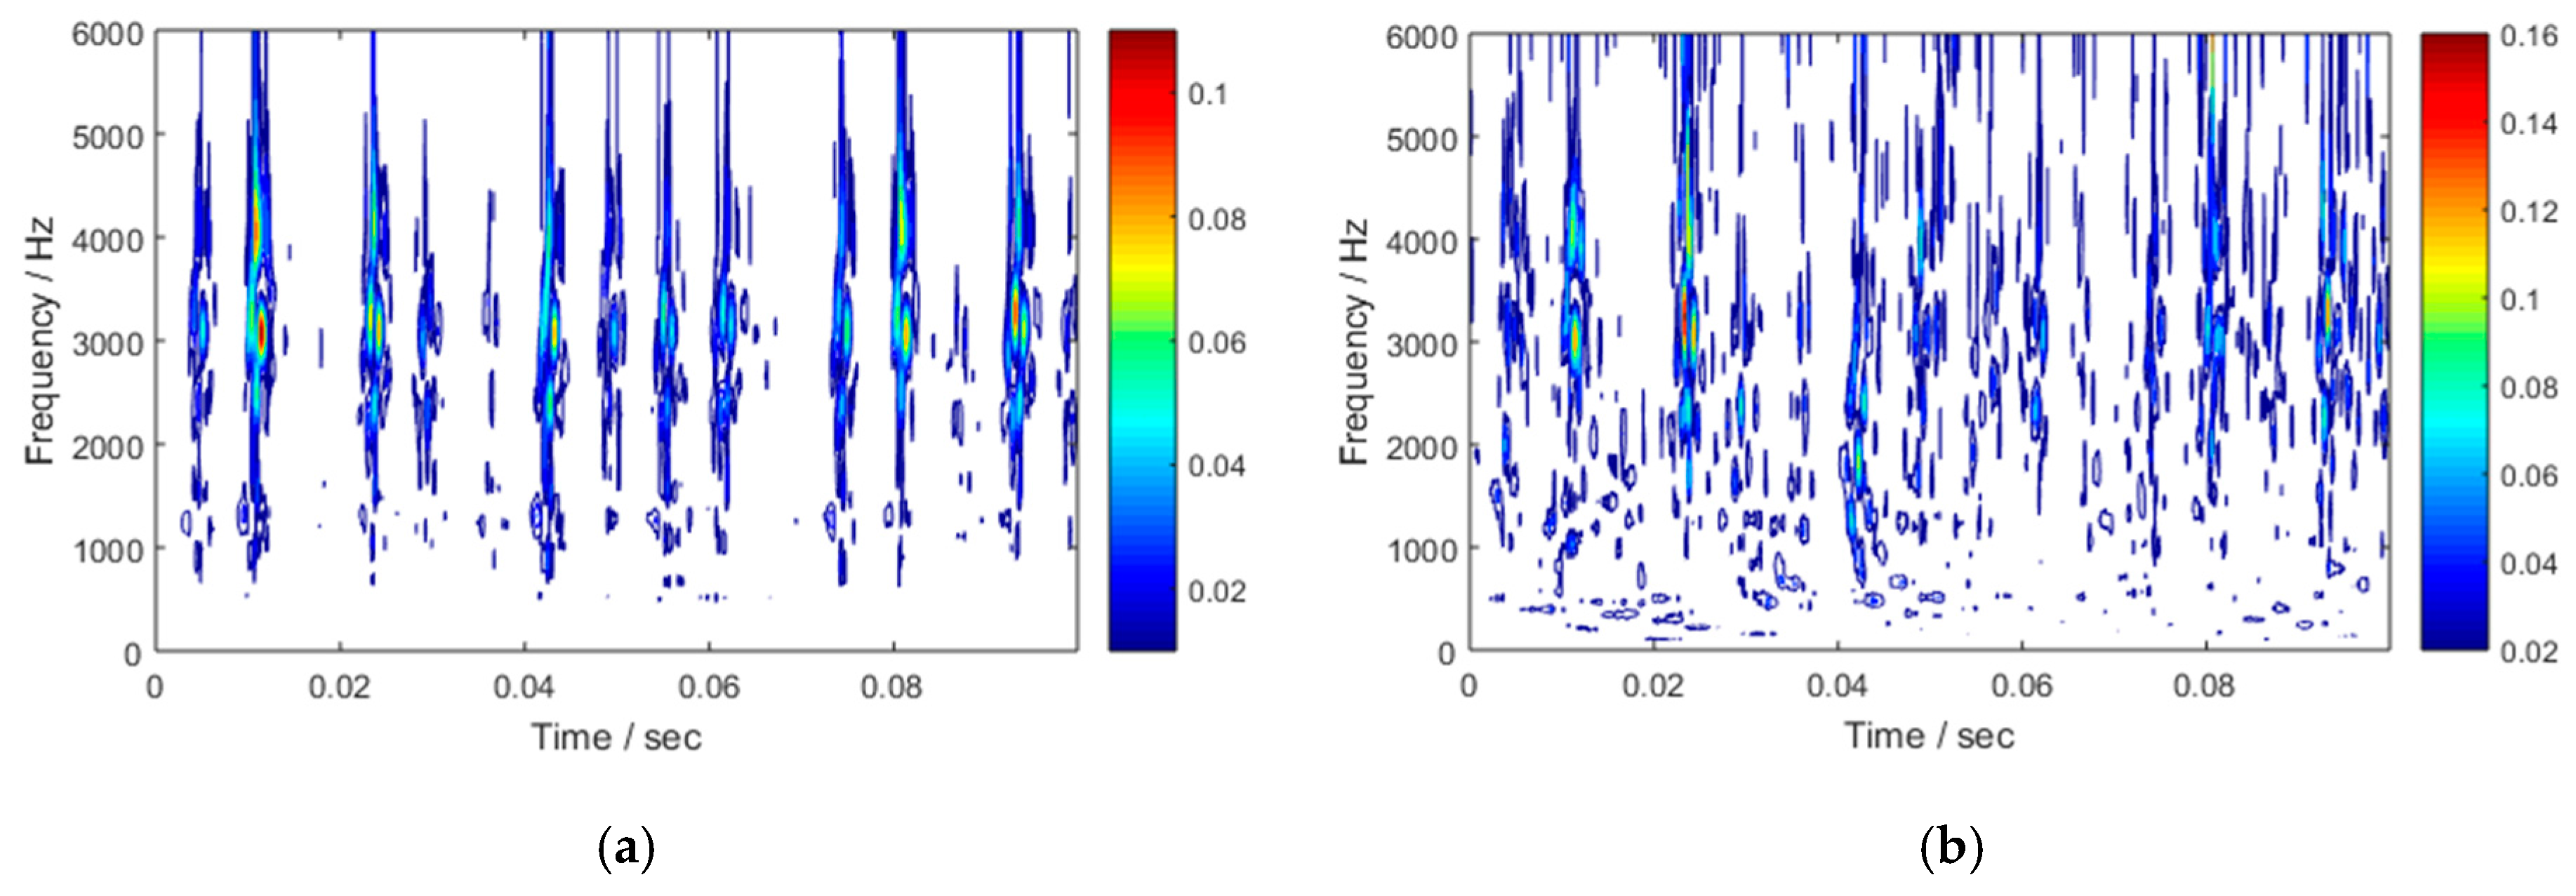
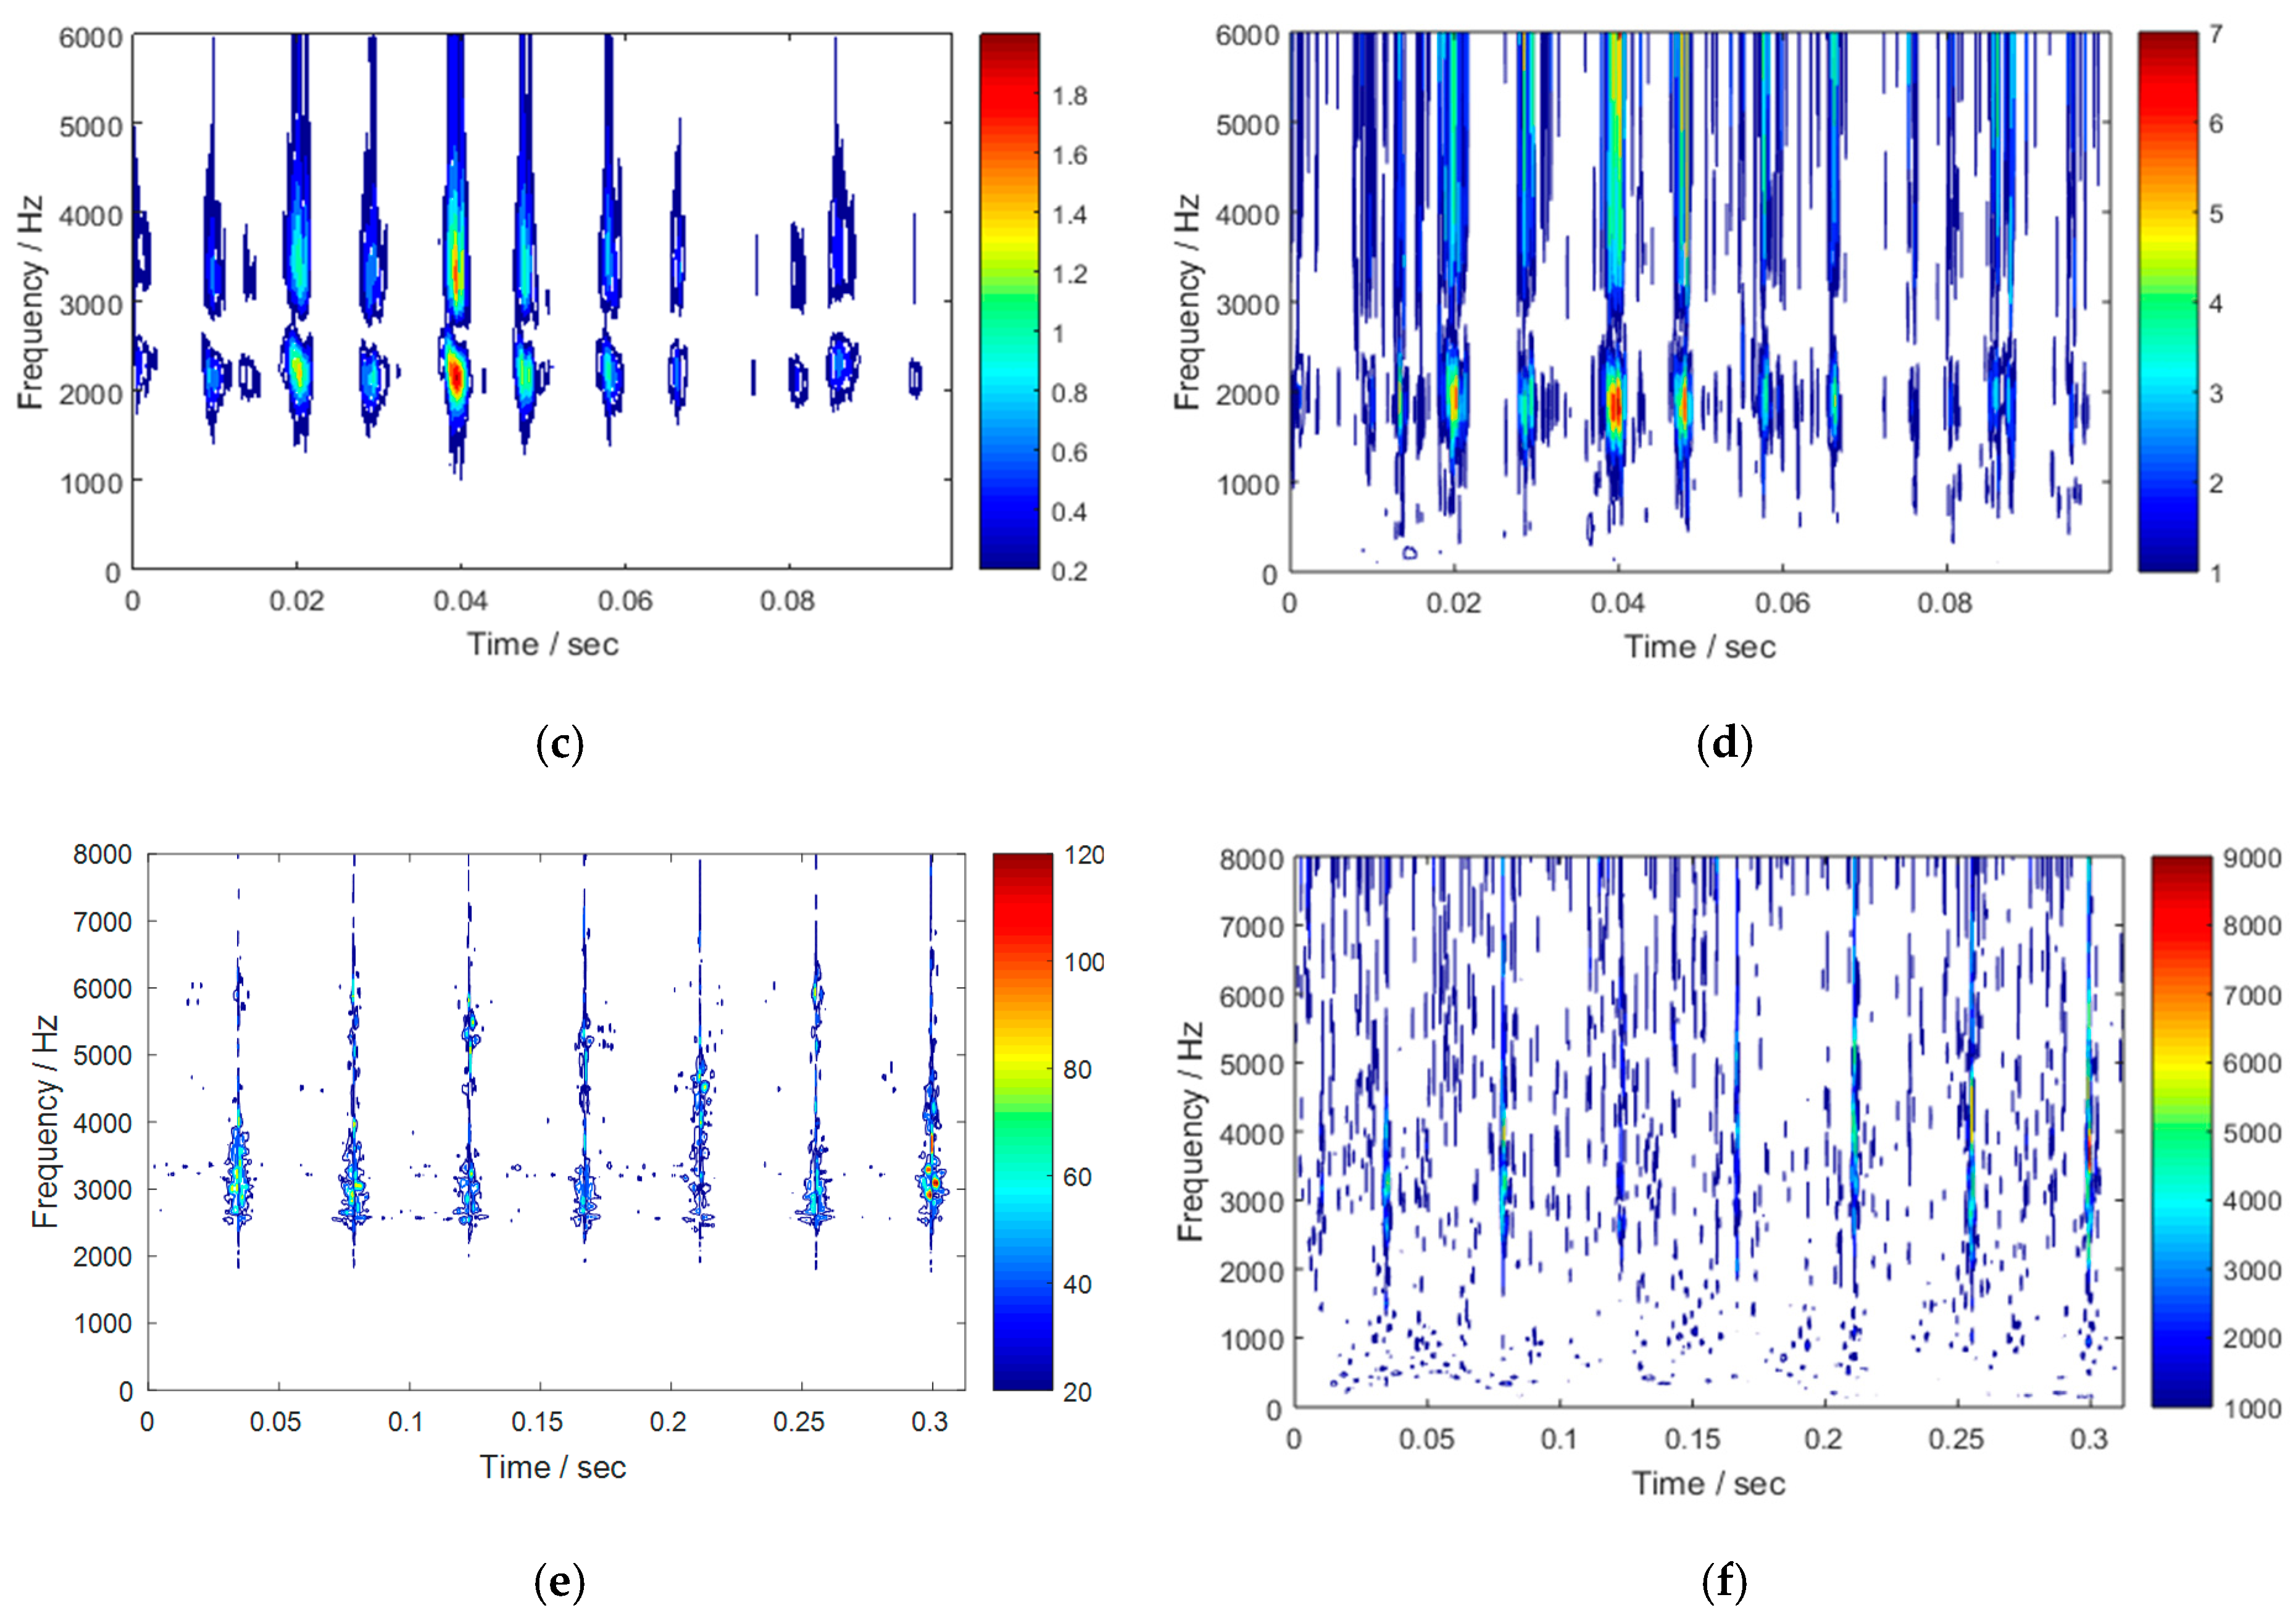
Following this, in order to precisely describe the fault-related features, the time-frequency maps of the three signals are calculated by performing the Hilbert transform of the mode functions shown in Figure 7. Limited by computer memory, only the first 0.1 s data in Figure 7a,b and the first 0.31 s data in Figure 7c are processed in the time-frequency analysis. The corresponding results are shown in Figure 8, where the time-frequency maps obtained by using the conventional EWT are illustrated, as well for facilitating comparison. The conventional EWT is implemented by following the method described in [20].
The comparison of the results shown in Figure 8 discloses the following, which are attributed to the application of the proposed spectrum segmentation method:
- (1)
- the fault-related periodic impact features contained in the signals have been explicitly detected by the enhanced EWT. From the clear time intervals between these periodic impact features, the characteristic frequency of the fault can be easily estimated, and, therefore, the type of the fault can be correctly diagnosed without any difficulty once the specification parameters of the bearing and gear are known. By contrast, the impact features are smeared or even buried by background ‘noise’ in the time-frequency maps derived by the conventional EWT. As a consequence, the time intervals between them are not easy to estimate. That inevitably increases the difficulty of signal interpretation;
- (2)
- the majority of interference components that are present in the conventional EWT results are absent from the time-frequency maps derived from the enhanced EWT. This significantly highlights the principal frequency components while it depresses the unimportant interference and noise items in the signal, thus making the time-frequency maps of the signal more tidy and comprehensible.
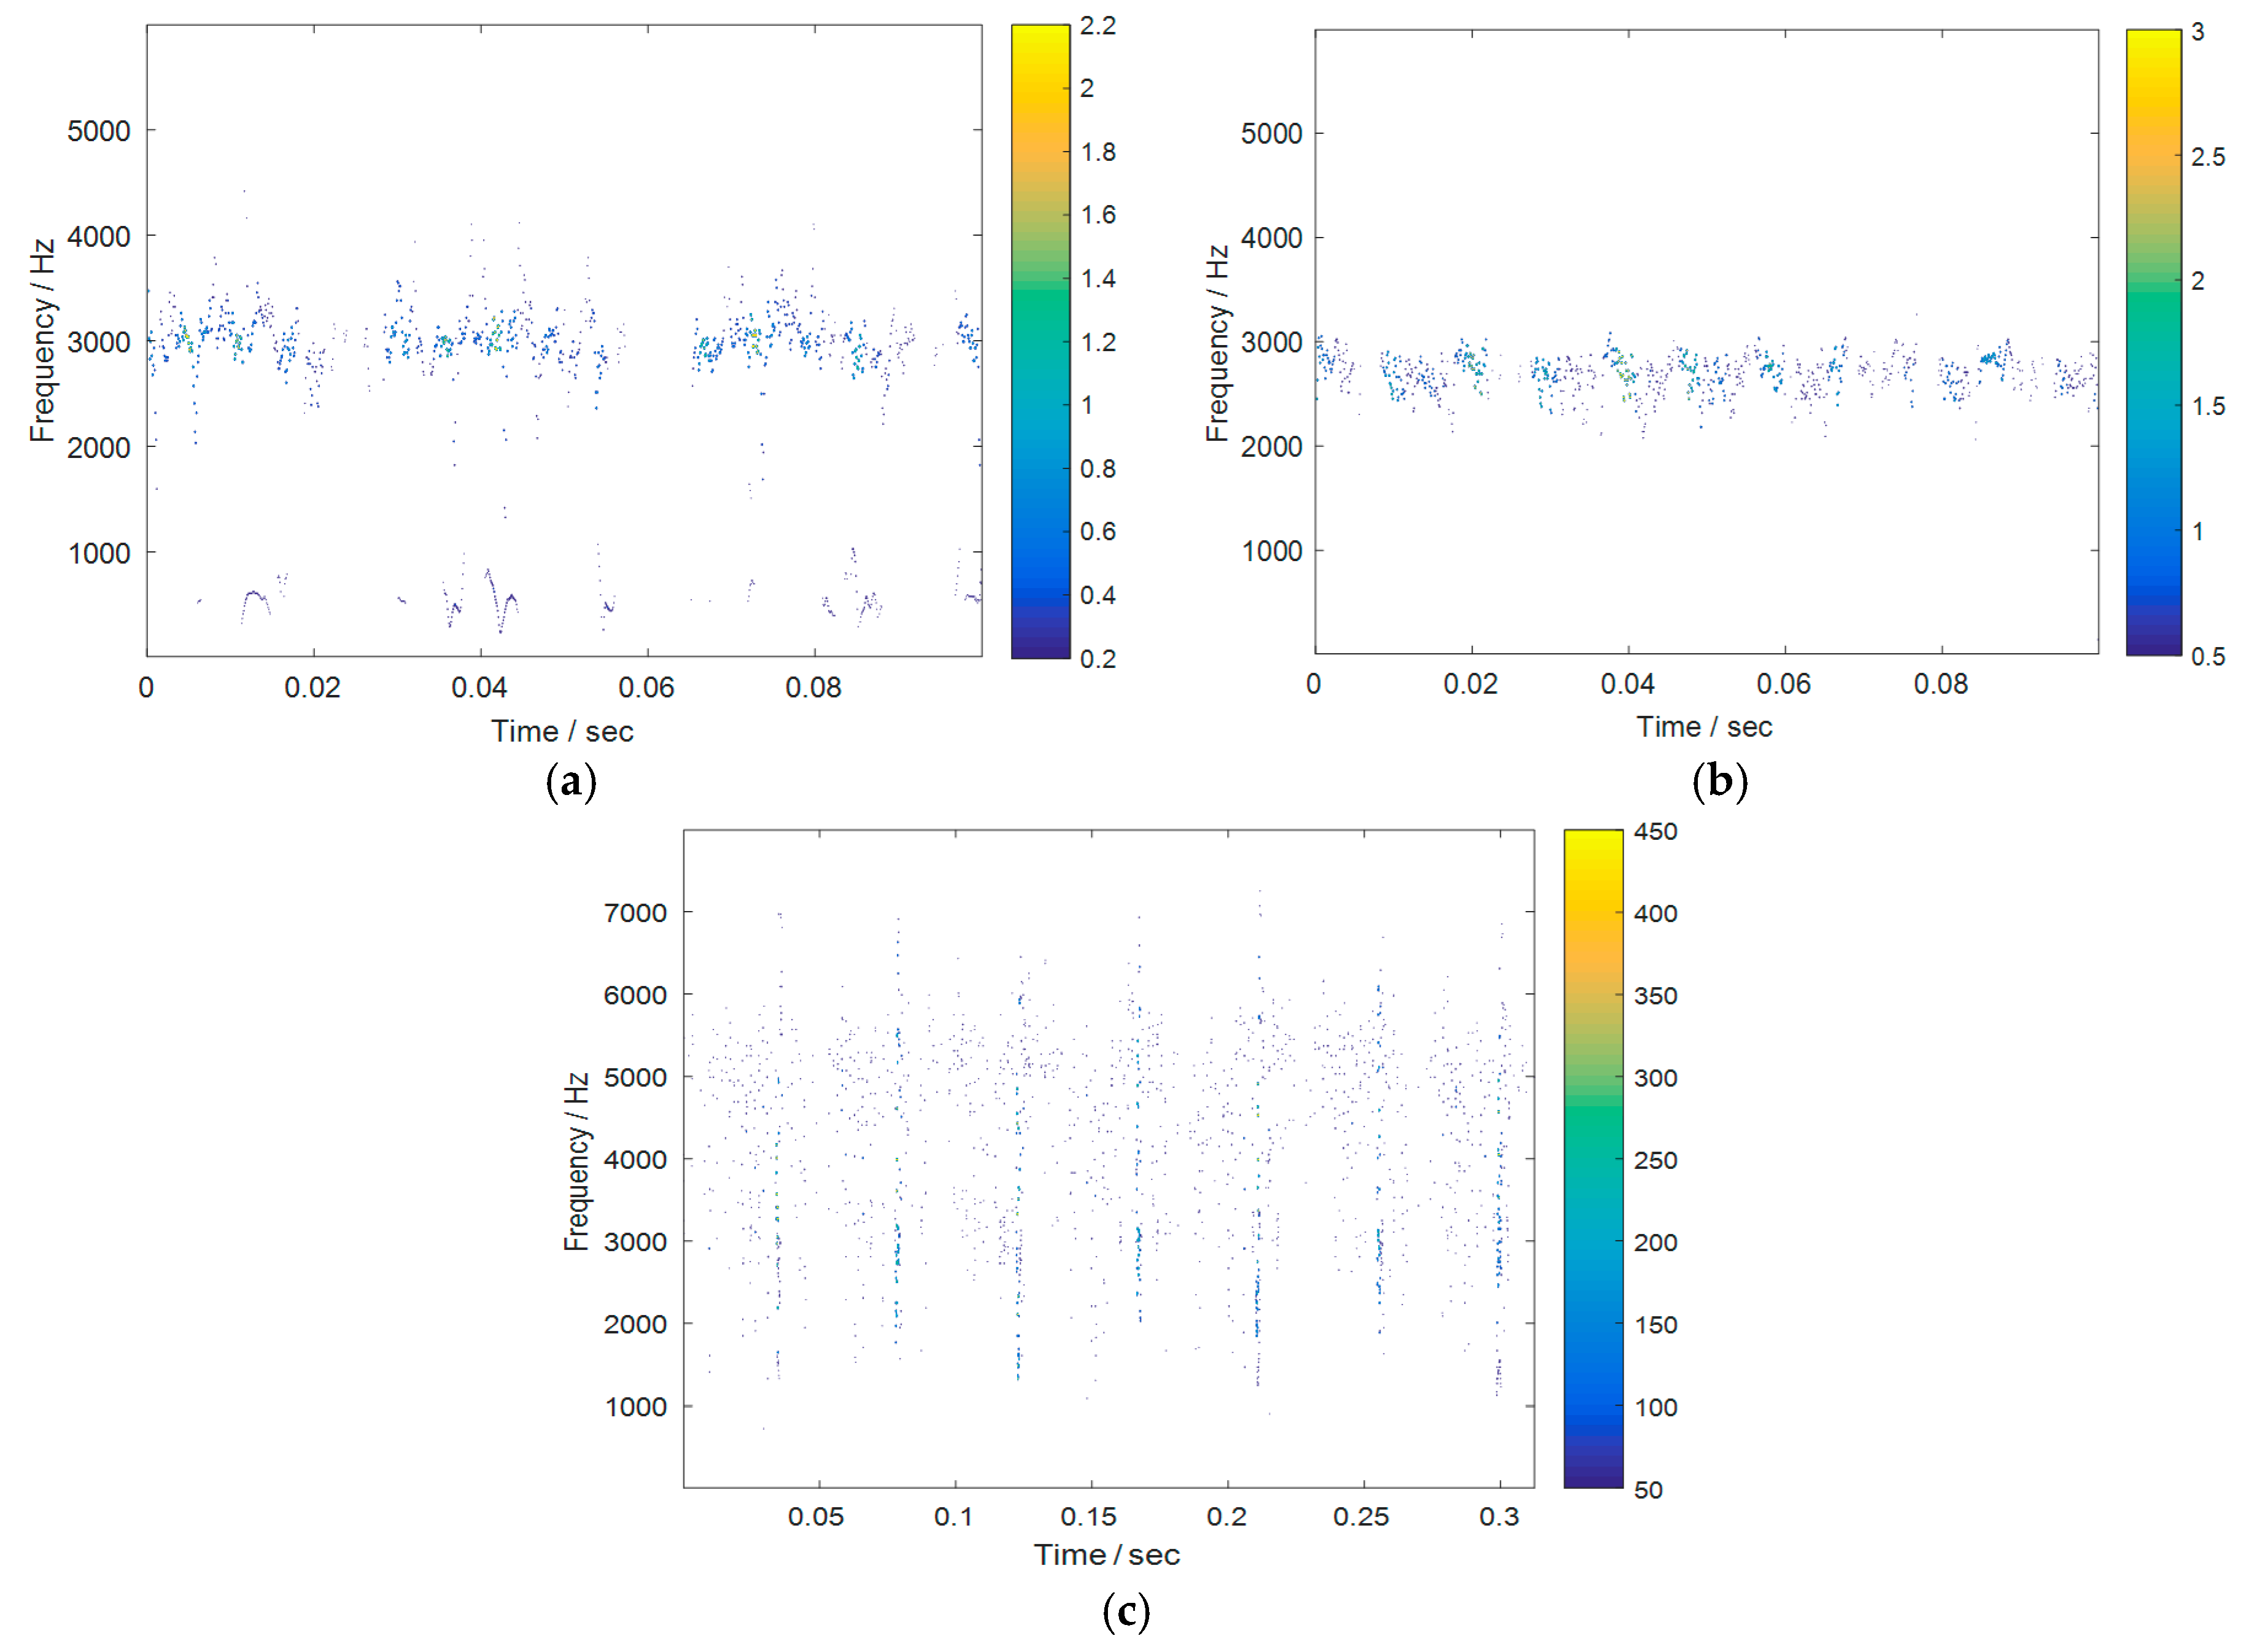
Subsequently, the comparison of the enhanced EWT and the EMD is also conducted in order to further demonstrate the superiority of the enhanced EWT over the EMD in feature extraction from nonlinear and non-stationary WT CM signals. The corresponding EMD results for the three signals in Figure 6 are shown in Figure 9.
From Figure 9, it is clearly seen that the fault-related impact features have not been successfully extracted by the approach of the EMD, especially when the impact features in the signals are still weak at the incipient fault stage. However, they all have been correctly extracted by the enhanced EWT.
From this example, it can be concluded that, in contrast to the conventional EWT and the EMD, the enhanced EWT does provide a more powerful tool to precisely extract the time-frequency features of nonlinear WT drive train CM signals; and the precise and tidy time-frequency features derived from the enhanced EWT will be very helpful in the process of achieving reliable WT CM results.
5. Conclusions
The EWT has shown superiorities to the EMD in both signal decomposition and feature extraction. However, the accuracy of the EWT results is highly dependant on the correct settings of the number of modes and the frequency boundaries of each individual mode. In order to develop a feasible and reliable method for addressing this issue, an enhanced EWT is proposed and experimentally verified in this paper. From the work depicted above, the following conclusions are drawn:
- The conventional EWT is lowered due to lacking an appropriate method to segment the frequency spectrum of the signal being investigated. Consequently, the frequency spectrum of the signal could not be segmented properly. Inappropriate segmentation of the signal spectrum would not only decrease the computing efficiency of the EWT, but also lower the accuracy of feature extraction;
- With the aid of the proposed spectrum segmentation method, the number of modes and the frequency boundaries of every EWT mode can be readily determined. Moreover, it can be guaranteed that every EWT mode derived by using the enhanced method will have an exact physical meaning that corresponds to either WT operation or structural integrity features. By contrast, unidentified information could be included in the results by the conventional EWT, which would raise the difficulty of signal interpretation or even mislead WT CM;
- The experiment has shown that the fault-related time-frequency features of the signals can be more precisely extracted by the enhanced EWT, despite the considerable noise contained in the signals and the lack of pre-knowledge about the machine being investigated. This suggests that in contrast to the conventional EWT, the enhanced EWT needs less manual participation and thus has potential to be a fully data driven WT CM signal processing technique.
Acknowledgments
The work reported in the paper was supported by the Research Project of the State Key Laboratory of Mechanical System and Vibration MSV201702 and the Chinese Natural Science Foundation with the reference numbers of 11632011 and 11472103.
Author Contributions
Pu Shi and Wenxian Yang conceived the method and analyzed the data; Meiping Sheng and Minqing Wang provided the data and contributed in the process of paper revision; Wenxian Yang and Pu Shi wrote the paper.
Conflicts of Interest
The authors declare no conflict of interest.
References
- Yang, W.; Tavner, P.J.; Tian, W. Wind Turbine Condition Monitoring based on an Improved Spline-Kernelled Chirplet Transform. IEEE Trans. Ind. Electron. 2015, 62, 6565–6574. [Google Scholar] [CrossRef]
- Yang, W.; Little, C.; Tavner, P.; Court, R. Data-driven technique for interpreting wind turbine condition monitoring signals. IET Renew. Power Gener. 2014, 8, 151–159. [Google Scholar] [CrossRef]
- Barton, J.P.; Watson, S.J. Analysis of electrical power data for condition monitoring of a small wind turbine. IET Renew. Power Gener. 2013, 7, 341–349. [Google Scholar] [CrossRef]
- Yang, W.; Tavner, P.; Crabtree, C.; Feng, Y.; Qiu, Y. Wind turbine condition monitoring: Technical and commercial challenges. Wind Energy 2014, 17, 673–693. [Google Scholar] [CrossRef]
- Tchakoua, P.; Wamkeue, R.; Ouhrouche, M.; Slaoui-Hasnaoui, F.; Tameghe, T.A.; Ekemb, G. Wind Turbine Condition Monitoring: State-of-the-Art Review, New Trends, and Future Challenges. Energies 2014, 7, 2595–2630. [Google Scholar]
- Antoni, J. The spectral kurtosis: A useful tool for characterising non-stationary signals. Mech. Syst. Signal Process. 2006, 20, 282–307. [Google Scholar] [CrossRef]
- Yang, W.; Little, C.; Court, R. S-Transform and its contribution to wind turbine condition monitoring. Renew. Energy 2014, 62, 137–146. [Google Scholar] [CrossRef]
- Sheen, Y.T. An envelope analysis based on the resonance modes of the mechanical system for the bearing defect diagnosis. Measurement 2010, 43, 912–934. [Google Scholar] [CrossRef]
- He, W.; Jiang, Z.N.; Feng, K. Bearing fault detection based on optimal wavelet filter and sparse code shrinkage. Measurement 2009, 42, 1092–1102. [Google Scholar] [CrossRef]
- Chiementin, X.; Bolaers, F.; Dron, J.P. Early Detection of Fatigue Damage on Rolling Element Bearings Using Adapted Wavelet. ASME J. Vib. Acoust. 2007, 129, 495–506. [Google Scholar] [CrossRef]
- Barszcz, T.; Randall, R.B. Application of spectral kurtosis for detection of a tooth crack in the planetary gear of a wind turbine. Mech. Syst. Signal Process. 2009, 23, 1352–1365. [Google Scholar] [CrossRef]
- Li, H.; Zhang, Y.; Zheng, H. Hilbert-Huang transform and marginal spectrum for detection and diagnosis of localized defects in roller bearings. J. Mech. Sci. Technol. 2009, 23, 291–301. [Google Scholar] [CrossRef]
- Van, M.; Kang, H.J.; Shin, K.S. Rolling element bearing fault diagnosis based on non-local means de-noising and empirical mode decomposition. IET Sci. Meas. Technol. 2014, 8, 571–578. [Google Scholar] [CrossRef]
- Huang, N.E.; Shen, Z.; Long, S.R.; Wu, M.C.; Shih, H.H.; Zheng, Q.; Yen, N.C.; Tung, C.C.; Liu, H.H. The empirical mode decomposition and the Hilbert spectrum for nonlinear and non-stationary time series analysis. Proc. R. Soc. 1998, 903–995. [Google Scholar] [CrossRef]
- Yang, Y.; Cheng, J.S.; Zhang, K. An ensemble local means decomposition method and its application to local rub-impact fault diagnosis of the rotor systems. Measurement 2012, 45, 561–570. [Google Scholar] [CrossRef]
- Wu, Z.H.; Huang, N.E. Ensemble empirical mode decomposition: A noise assisted data analysis method. Adv. Adapt. Data Anal. 2009, 1, 1–41. [Google Scholar] [CrossRef]
- Rilling, G.; Flandrin, P.; Goncalvès, P. On Empirical Mode Decomposition and Its Algorithms. Available online: http://perso.ens-lyon.fr/patrick.flandrin/NSIP03 (accessed on 10 July 2017).
- Li, R.; He, D. Rotational machine health monitoring and fault detection using EMD-based acoustic emission feature quantification. IEEE Trans. Instrum. Meas. 2012, 61, 990–1001. [Google Scholar] [CrossRef]
- Yang, W.; Court, R.; Tavner, P.; Crabtree, C. Bivariate empirical mode decomposition and its contribution to wind turbine condition monitoring. J. Sound Vib. 2011, 330, 3766–3782. [Google Scholar] [CrossRef]
- Gilles, J. Empirical Wavelet Transform. IEEE Trans. Signal Proc. 2013, 61, 3999–4010. [Google Scholar] [CrossRef]
- Kedadouche, M.; Thomas, M.; Tahan, A. A comparative study between Empirical Wavelet Transforms and Empirical Mode Decomposition Methods: Application to bearing defect diagnosis. Mech. Syst. Signal Process. 2016, 81, 88–107. [Google Scholar] [CrossRef]
- Daubechies, I. Ten Lectures on Wavelets; Society for Industrial and Applied Mathematics: Philadelphia, PA, USA, 1992. [Google Scholar]
- Case Western Reserve University Bearing Data Center Website. Case Western Reserve University. Available online: http://csegroups.case.edu/bearingdatacenter/pages/apparatus-procedures (accessed on 12 November 2014).
- Rafiee, J.; Arvani, F.; Harifi, A.; Sadeghi, H.M. Intelligent condition monitoring of a gearbox using artificial neural network. Mech. Syst. Signal Process. 2007, 21, 1746–1754. [Google Scholar] [CrossRef]
Figure 1.
Illustration of spectrum segmentation by Empirical Wavelet Transform (EWT).

Figure 2.
An example of normal bearing condition monitoring (CM) signal.

Figure 3.
Trimming process of the signal spectrum: (a) frequency spectrum and envelope curve; (b) trimmed envelope curve.
Figure 3.
Trimming process of the signal spectrum: (a) frequency spectrum and envelope curve; (b) trimmed envelope curve.
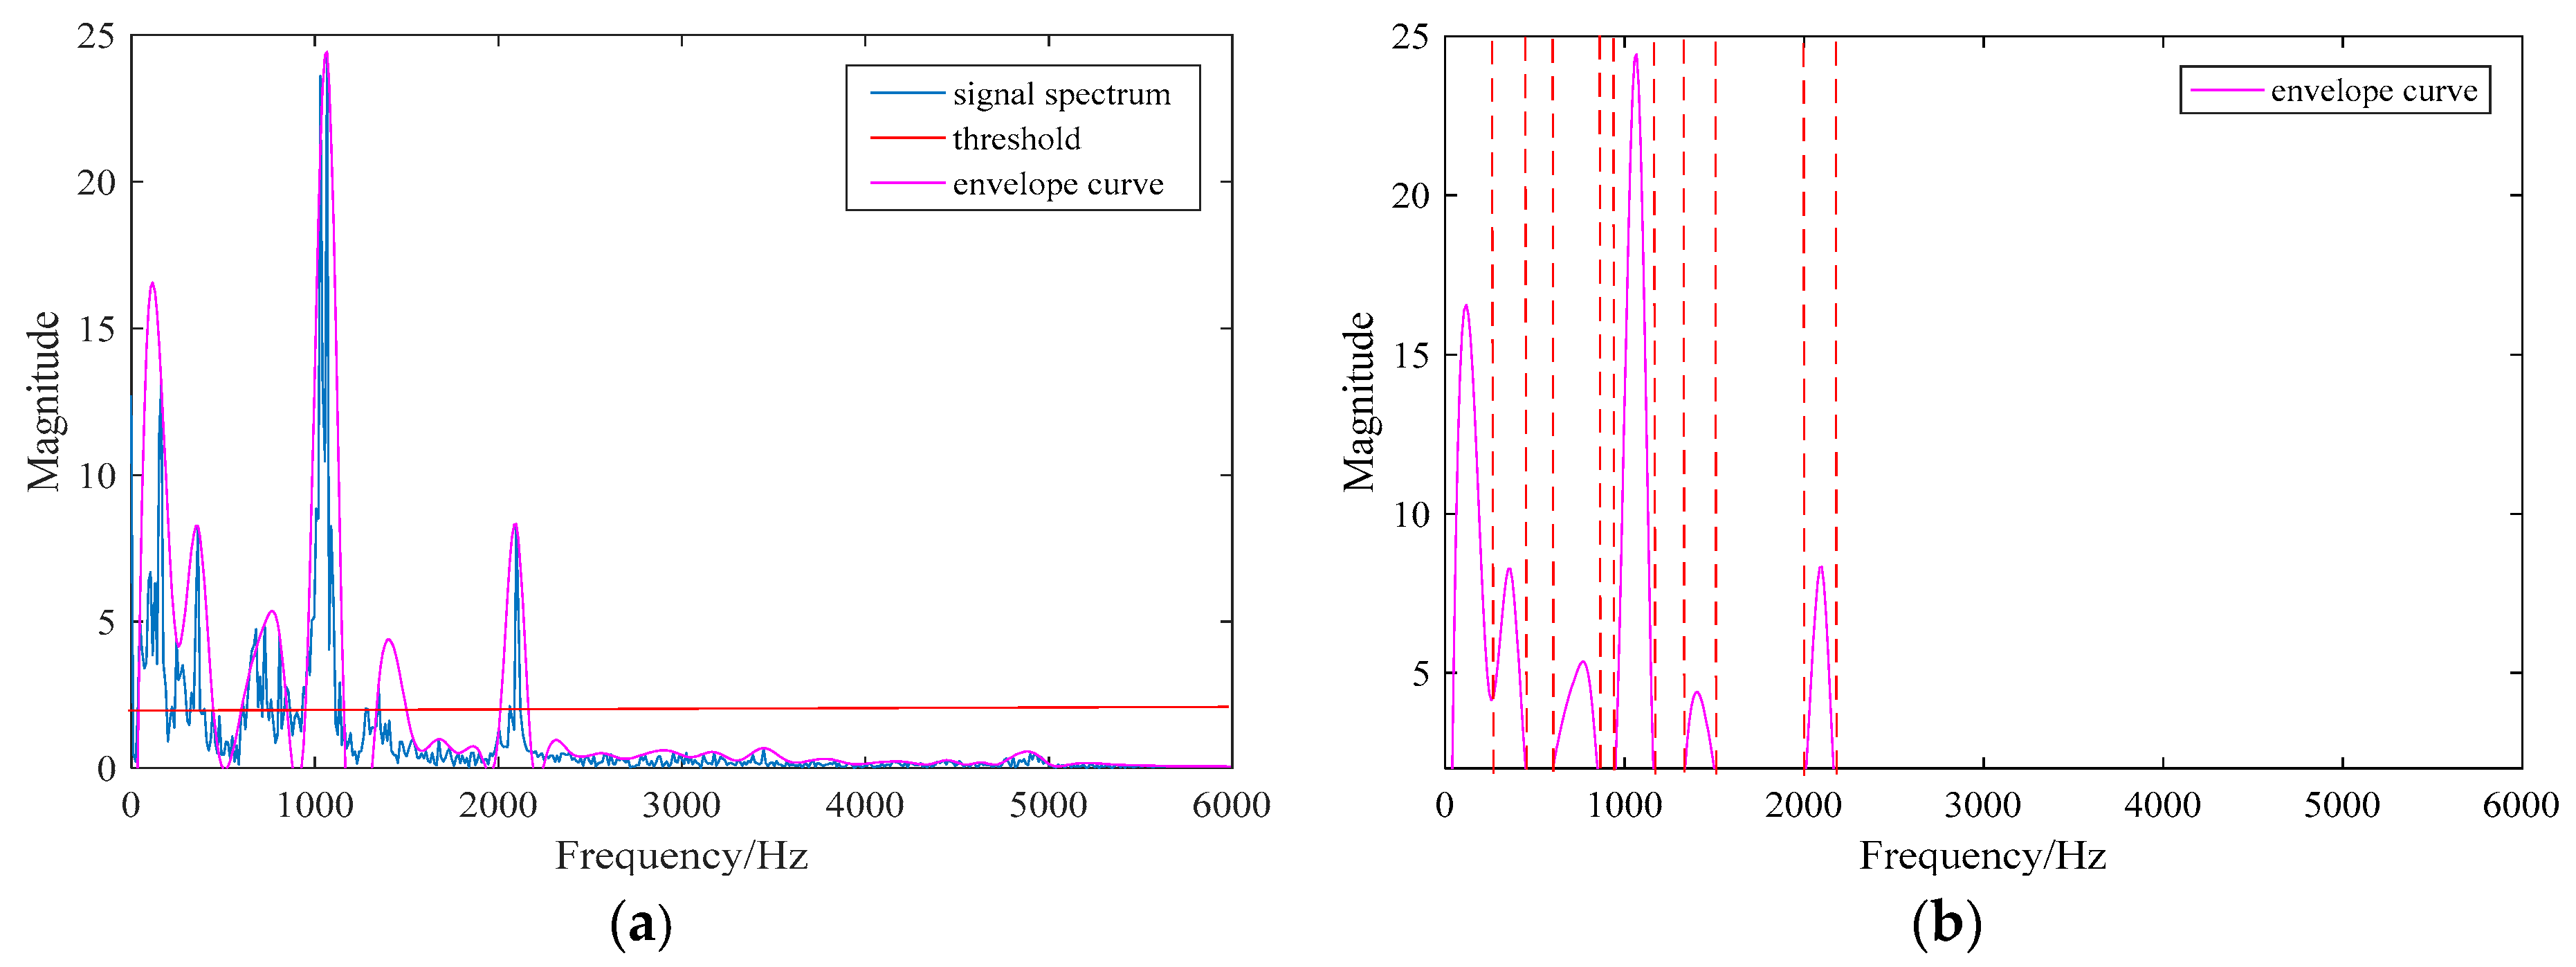
Figure 4.
Variation tendency of the correlation coefficient ratio.
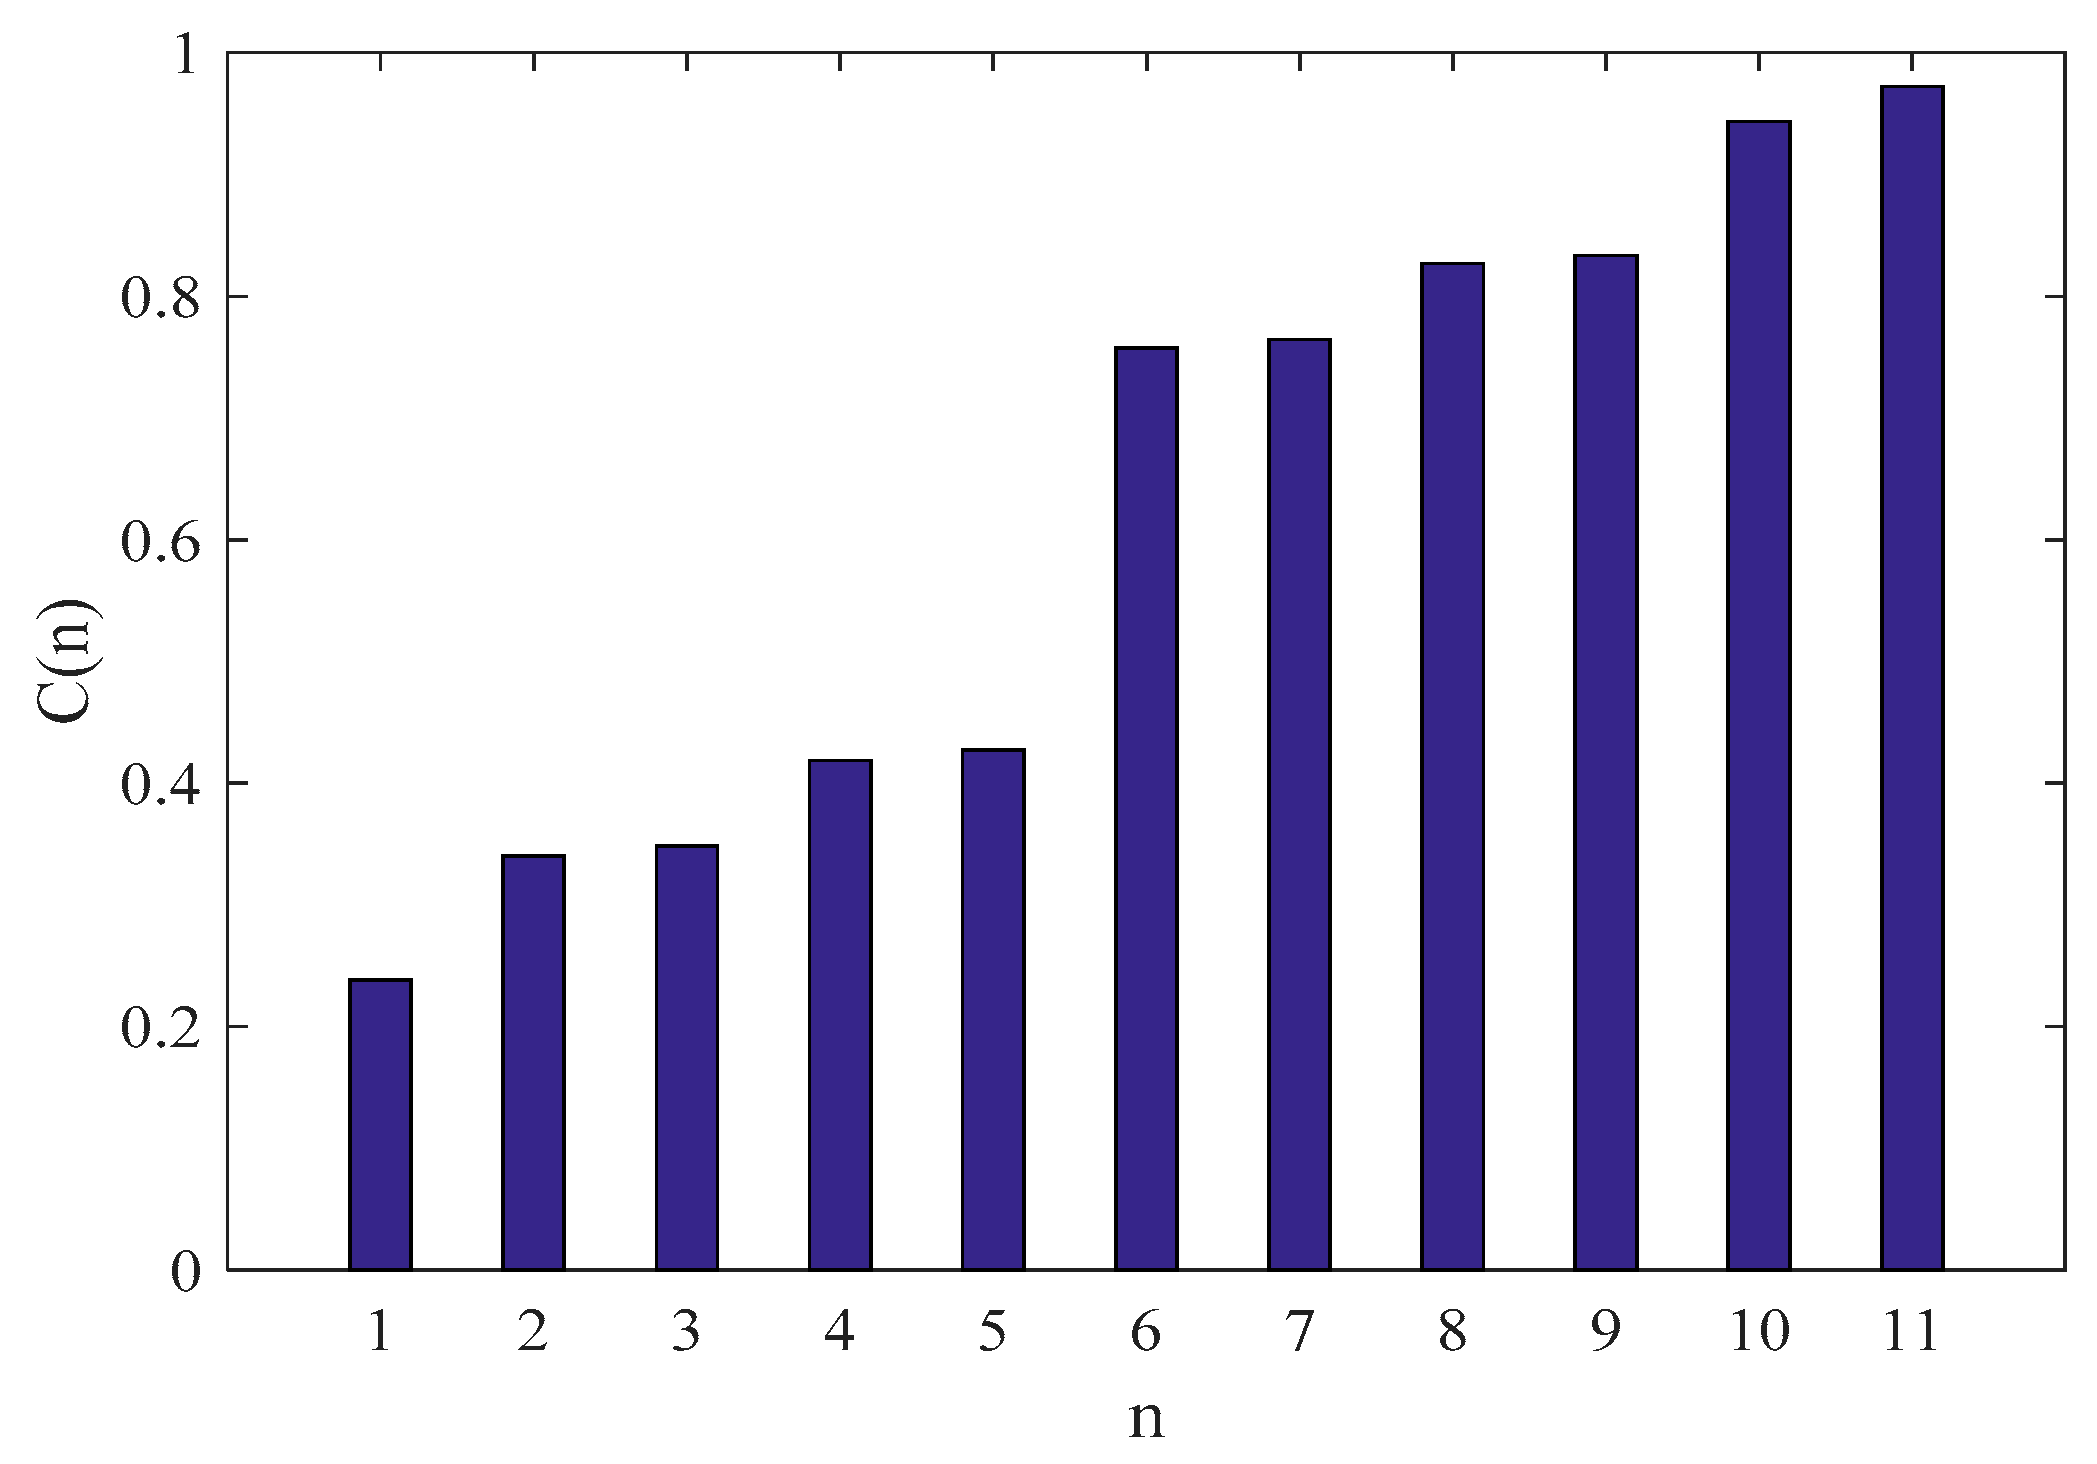
Figure 5.
Flowchart of the enhanced EWT.

Figure 6.
Vibration signals collected under different drive train faulty conditions.

Figure 7.
The signal decomposition results derived using the enhanced EWT: (a) inner race fault; (b) outer race fault; (c) gear tooth fault
Figure 7.
The signal decomposition results derived using the enhanced EWT: (a) inner race fault; (b) outer race fault; (c) gear tooth fault

Figure 8.
The comparison of the enhanced EWT and the conventional EWT: (a) Inner race fault—enhanced EWT; (b) Inner race fault—conventional EWT; (c) Outer race fault—enhanced EWT; (d) Outer race fault—conventional EWT; (e) Gear tooth fault—enhanced EWT; (f) Gear tooth fault—conventional EWT.
Figure 8.
The comparison of the enhanced EWT and the conventional EWT: (a) Inner race fault—enhanced EWT; (b) Inner race fault—conventional EWT; (c) Outer race fault—enhanced EWT; (d) Outer race fault—conventional EWT; (e) Gear tooth fault—enhanced EWT; (f) Gear tooth fault—conventional EWT.


Figure 9.
Time-frequency analysis of the signals in Figure 6 by the Empirical Mode Decomposition (EMD): (a) Inner race fault—EMD; (b) Outer race fault—EMD; (c) Gear tooth fault—EMD.
Figure 9.
Time-frequency analysis of the signals in Figure 6 by the Empirical Mode Decomposition (EMD): (a) Inner race fault—EMD; (b) Outer race fault—EMD; (c) Gear tooth fault—EMD.

© 2017 by the authors. Licensee MDPI, Basel, Switzerland. This article is an open access article distributed under the terms and conditions of the Creative Commons Attribution (CC BY) license (http://creativecommons.org/licenses/by/4.0/).
Share and Cite
MDPI and ACS Style
Shi, P.; Yang, W.; Sheng, M.; Wang, M. An Enhanced Empirical Wavelet Transform for Features Extraction from Wind Turbine Condition Monitoring Signals. Energies 2017, 10, 972. https://doi.org/10.3390/en10070972
AMA Style
Shi P, Yang W, Sheng M, Wang M. An Enhanced Empirical Wavelet Transform for Features Extraction from Wind Turbine Condition Monitoring Signals. Energies. 2017; 10(7):972. https://doi.org/10.3390/en10070972
Chicago/Turabian StyleShi, Pu, Wenxian Yang, Meiping Sheng, and Minqing Wang. 2017. "An Enhanced Empirical Wavelet Transform for Features Extraction from Wind Turbine Condition Monitoring Signals" Energies 10, no. 7: 972. https://doi.org/10.3390/en10070972
Note that from the first issue of 2016, this journal uses article numbers instead of page numbers. See further details here.