State-of-Charge Estimation with State-of-Health Calibration for Lithium-Ion Batteries


Department of Electrical Engineering, National Sun Yat-sen University, 70 Lienhai Rd., Kaohsiung 80424, Taiwan
*
Author to whom correspondence should be addressed.
Energies 2017, 10(7), 987; https://doi.org/10.3390/en10070987
Submission received: 15 June 2017
/
Revised: 8 July 2017
/
Accepted: 9 July 2017
/
Published: 13 July 2017
(This article belongs to the Special Issue Energy Management, Control, and System Architectures for Electric Vehicle Applications)
Abstract
:This research is focused on state-of-charge (SOC) estimation with state-of-health (SOH) calibration for lithium-ion batteries on the basis of the coulomb counting method. The proposed approach intends to present an easy-to-use solution with high accuracy for estimating battery statuses without the need for demanding calculations or hard-earned databases. To estimate the SOC of an aged battery more accurately, the degradation of its full capacity has to be taken into account. By scheduling the battery’s charging/discharging current and monitoring the battery’s status, the existing full capacity can be updated regularly by regular calibration or occasionally by partial calibration, in which the charging/discharging rates are normalized with the latest updated full capacity to agree with the battery’s statuses. To exclude the misestimation caused by current measuring error, the SOC is reset to 0% when the battery is exhausted and 100% for a fully charged battery. With an updated SOH, the battery C-rate is re-scaled accordingly. Experimental tests are carried out to demonstrate that the proposed approach can provide an accurate online indication of batteries’ SOCs. With an implanted error of 0.3% in current measuring, the SOC estimation error can always be less than 1.905% after a number of SOH calibrations.
1. Introduction
Rechargeable batteries play an important role as primary energy storage devices in daily life, since the battery material and manufacturing process have been significantly improved in recent decades. Among all the kinds of rechargeable batteries, lithium-ion batteries have high energy and power densities as well as a long lifespan, and thus are employed in various high power and energy applications, especially in electrical vehicles (EVs) [1,2,3]. In practice, battery cells are connected in series to obtain a higher voltage and in parallel to deliver a larger current. For the battery power system in EVs, battery cells are arrayed to form a battery power bank for the required higher power and energy. The mileage range can be estimated with the state-of-charge (SOC) of the battery bank under a given driving pattern [4]. In other words, an accurate SOC estimation can provide reliable results to the battery management system (BMS) to utilize the stored energy more efficiently.
In general, the manufacturers give the product specifications on a new battery cell. Due to the limitations of manufacturing, there is always a slight discrepancy in capacity among the newly formatted cells, even among the same model of batteries from the same production. In practical applications, the inconsistency of batteries’ capacities can be alleviated by a sorting process [5,6]. A compromise has to be made between the consistency and the production cost. As a result, the battery’s nominal capacity provided by the manufacturer is usually marked with a tolerance which cannot be ignored. On the other hand, for aged batteries which may have experienced different operating conditions, the capacity degradation can be different from one to another [7,8].
The chemical status of a battery in not measurable for a battery that is under operation. For most applications, the SOC estimation and the state-of-health (SOH) evaluation with necessary protections are the essential functions of a BMS [9,10,11]. The SOC indicates the existing charge, and the SOH reflects the maximum capacity of a battery. In practice, the full capacity of a battery is degraded after a number of cyclic charging-discharging periods, meaning that the maximum accessible charge of a battery is continually reduced, thus affecting the accuracy of the SOC estimation. Therefore, a more dependable SOH evaluation will provide a more accurate SOC estimation, leading to a reliable BMS, and in turn enhancing the endurance of the battery power.
Many SOC and SOH estimation methods have been proposed in the literature [12]. Among these methods, the electrochemical impedance spectroscopy (EIS) approach has been verified to be effective [13,14], but it is inapplicable to online applications. On the other hand, adaptive systems quantify the real-time status to adapt to the non-linear system of a battery with non-intrusive approaches, such as the extended Kalman filter (EKF), artificial neutral network (ANN), and fuzzy logic (FL) [15,16,17,18]. These adaptive systems quickly deal with the nonlinearities of battery behaviors and present good accuracy. Nevertheless, adaptive systems highly depend on the specific battery’s databases or an accurate equivalent-circuit model, which may result in demanding calculations.
This paper proposes an approach on the basis of coulomb counting to provide an accurate and easy-to-use method to monitor a battery’s status [19]. Batteries’ SOHs are updated by monitoring their operating voltages and currents without disrupting the system operation. For the present high-power battery systems, which are generally constructed with modularized battery sets in series and in parallel, the SOH calibration can be made in the partial-load or light-load periods. The SOC estimation can be calibrated to be more accurate with the latest SOH without the need for additional databases of the battery, which may vary with different chemistries. The SOC estimation is verified by a test system which allows for the charging or discharging current of batteries to be individually controlled.
2. Definitions of SOH and SOC
In practice, the manufacturer provides the nominal capacity of a battery through processes of formation and sorting under specified conditions to ensure the consistency of the products. However, the actual full capacity of a new battery may still differ from its nominal capacity due to limited engineering or business processes. For this reason, the original full capacity, Qf, of a new battery is obtained by averaging the full capacities tested from several charging/discharging cycles. When a battery begins on cyclic charging/discharging operations, inevitable aging will lead to performance deterioration, decreasing the full capacity, QM. For a lithium-ion battery, QM represents the existing maximum accessible charge of a battery, which can be acquired by cumulating the battery charges from either an empty-to-full or a full-to-empty phase since the trivial difference between the maximum chargeable and releasable capacities on subsequent phases can be ignored. To indicate the extent of degradation of the battery’s capacity, an index of the SOH is defined as the percentage of the existing full capacity relative to the original full capacity.
For an old battery, the capacity degradation results in not only the decrement in QM but also in the miscalculation of the SOC estimation. By taking the capacity degradation into consideration, an index of the SOC is defined as the percentage of the estimated capacity, Qe, relative to the present full capacity.
where Δts is the accumulation time of the coulomb counting, iBx is the battery current, and QM is the updated full capacity from the last calibration. Evidently, the accuracy of SOC estimation highly depends on the battery’s SOH, since its full capacity degrades continually. Without any calibration, the SOC will be misestimated along with the dynamically changed SOH.
3. Charging and Discharging Rates
To normalize charging/discharging rates against batteries’ capacities, the notion of C-rate is introduced to represent a rate of a current relative to the full capacity of a battery. Continually discharged by a current of 1 C, a fully charged battery can last for one hour to the end-of-discharge point. For a given C-rate, the charging/discharging current is calculated according to the battery’s nominal capacity, which is usually regarded as a constant without taking into consideration any possible capacity degradation. However, the battery capacity decays as the operating time elapses, leading to the miscalculation of charging/discharging currents with C-rates. In other words, the same C-rate may represent different currents of a battery with a same original nominal capacity but with different SOHs.
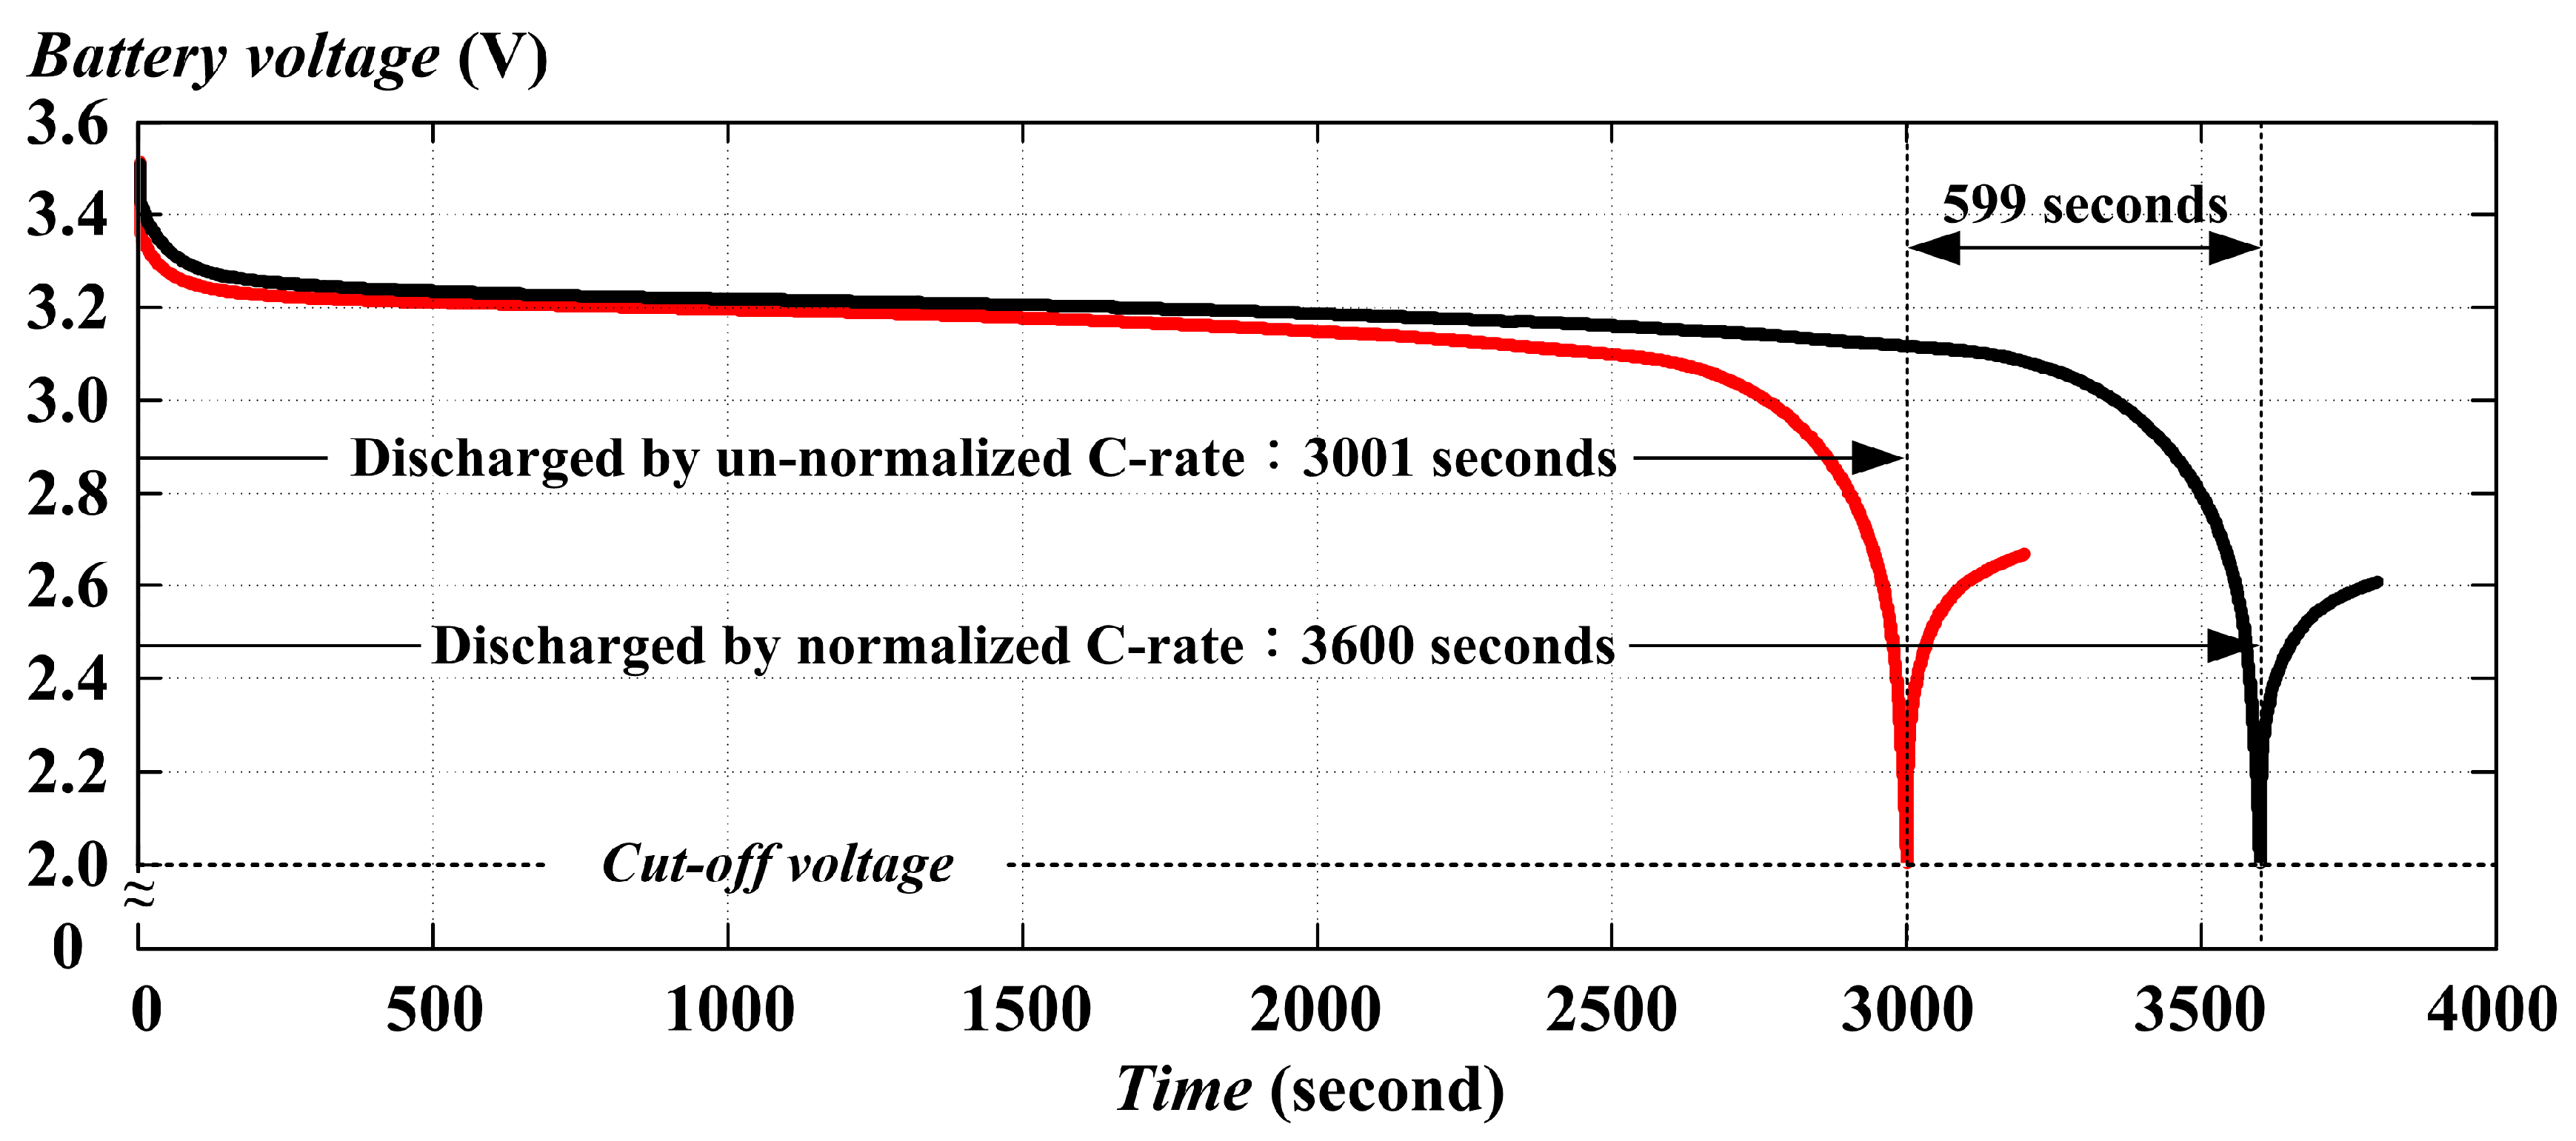
Figure 1 illustrates two discharging curves with normalized and un-normalized rates of 1 C, respectively, for a fully charged battery. The tested battery has nominal capacity of 2.3 Ah claimed by the manufacturer, but its full capacity has been degraded to 1.93 Ah. Hence, the discharging currents for normalized and un-normalized rates of 1 C should be 1.93 A and 2.30 A, respectively. As a result, the discharging duration of the battery discharged by the normalized C-rate is equal to one hour, while the curve with the un-normalized 1 C reaches the cut-off voltage by 3001 s. For this reason, the charging or discharging C-rate has to be normalized with the newly calibrated SOH.
4. Calibration Procedures
4.1. Regular Calibration
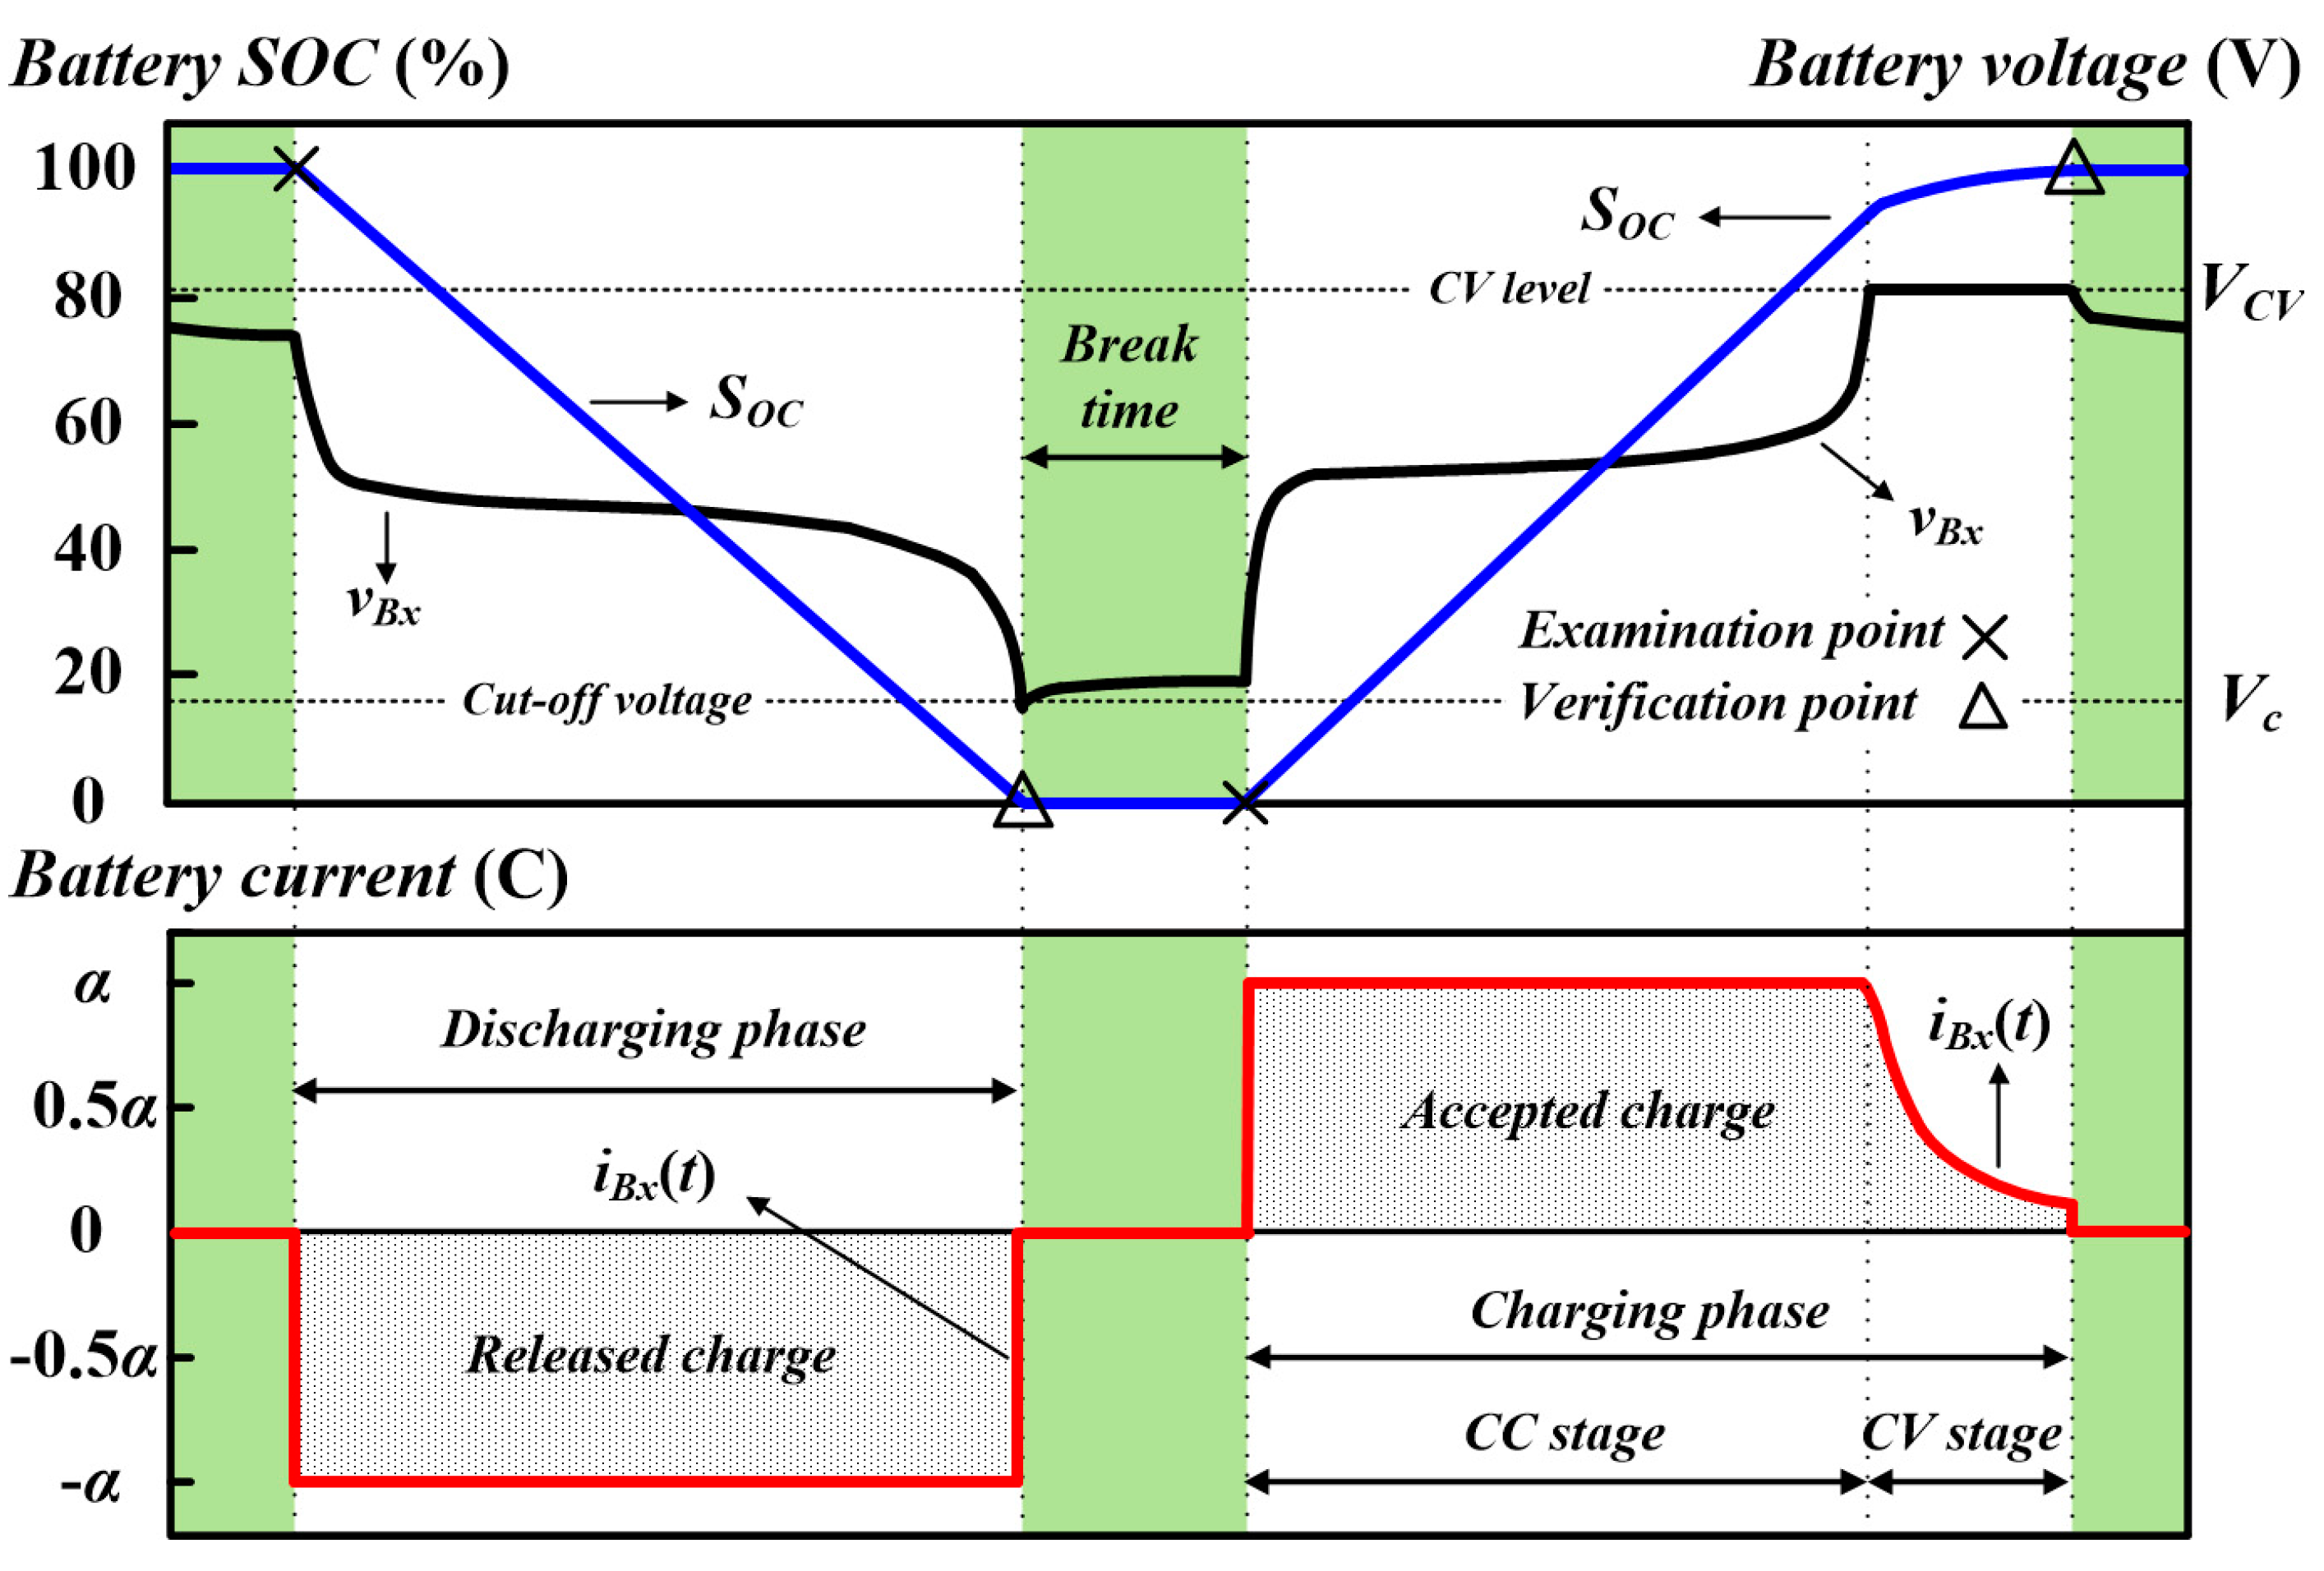
Figure 2 shows the regular calibration procedure used to obtain the latest full capacity to renew the SOH, and then to correct the SOC accordingly. For calibration, the battery is charged by the constant-current/constant-voltage (CC-CV) scheme, and is discharged with a constant current. The battery current, iBx, which is positive for charging and negative for discharging, is designated according to practical operating conditions. A break time between charging and discharging phases renders the battery’s open-circuit voltage (OCV). In Figure 2, a fully charged battery is first discharged by a constant rate of α C. The battery voltage decreases to the designated cut-off voltage, where the battery is regarded as empty. In the charging phase, the empty battery is charged by a constant charging rate of α C. The battery charge is accumulated with an increased terminal voltage at the CC stage. When the battery voltage goes up to a designated CV level, the charging current decreases gradually by holding the terminal voltage at the constant. The charging phase ends once the charging current has decreased to 0.1 C at the CV stage. With such a relatively small current, the battery is regarded as fully charged. As a result, the maximum releasable and chargeable capacities can be obtained by performing a regular calibration procedure. For lithium-ion batteries, the difference between the obtained maximum releasable capacity and chargeable capacity is trivial, and thus can be ignored. Therefore, the full capacity can be obtained by either the discharging phase or charging phase of the regular calibration.
4.2. Partial Calibration
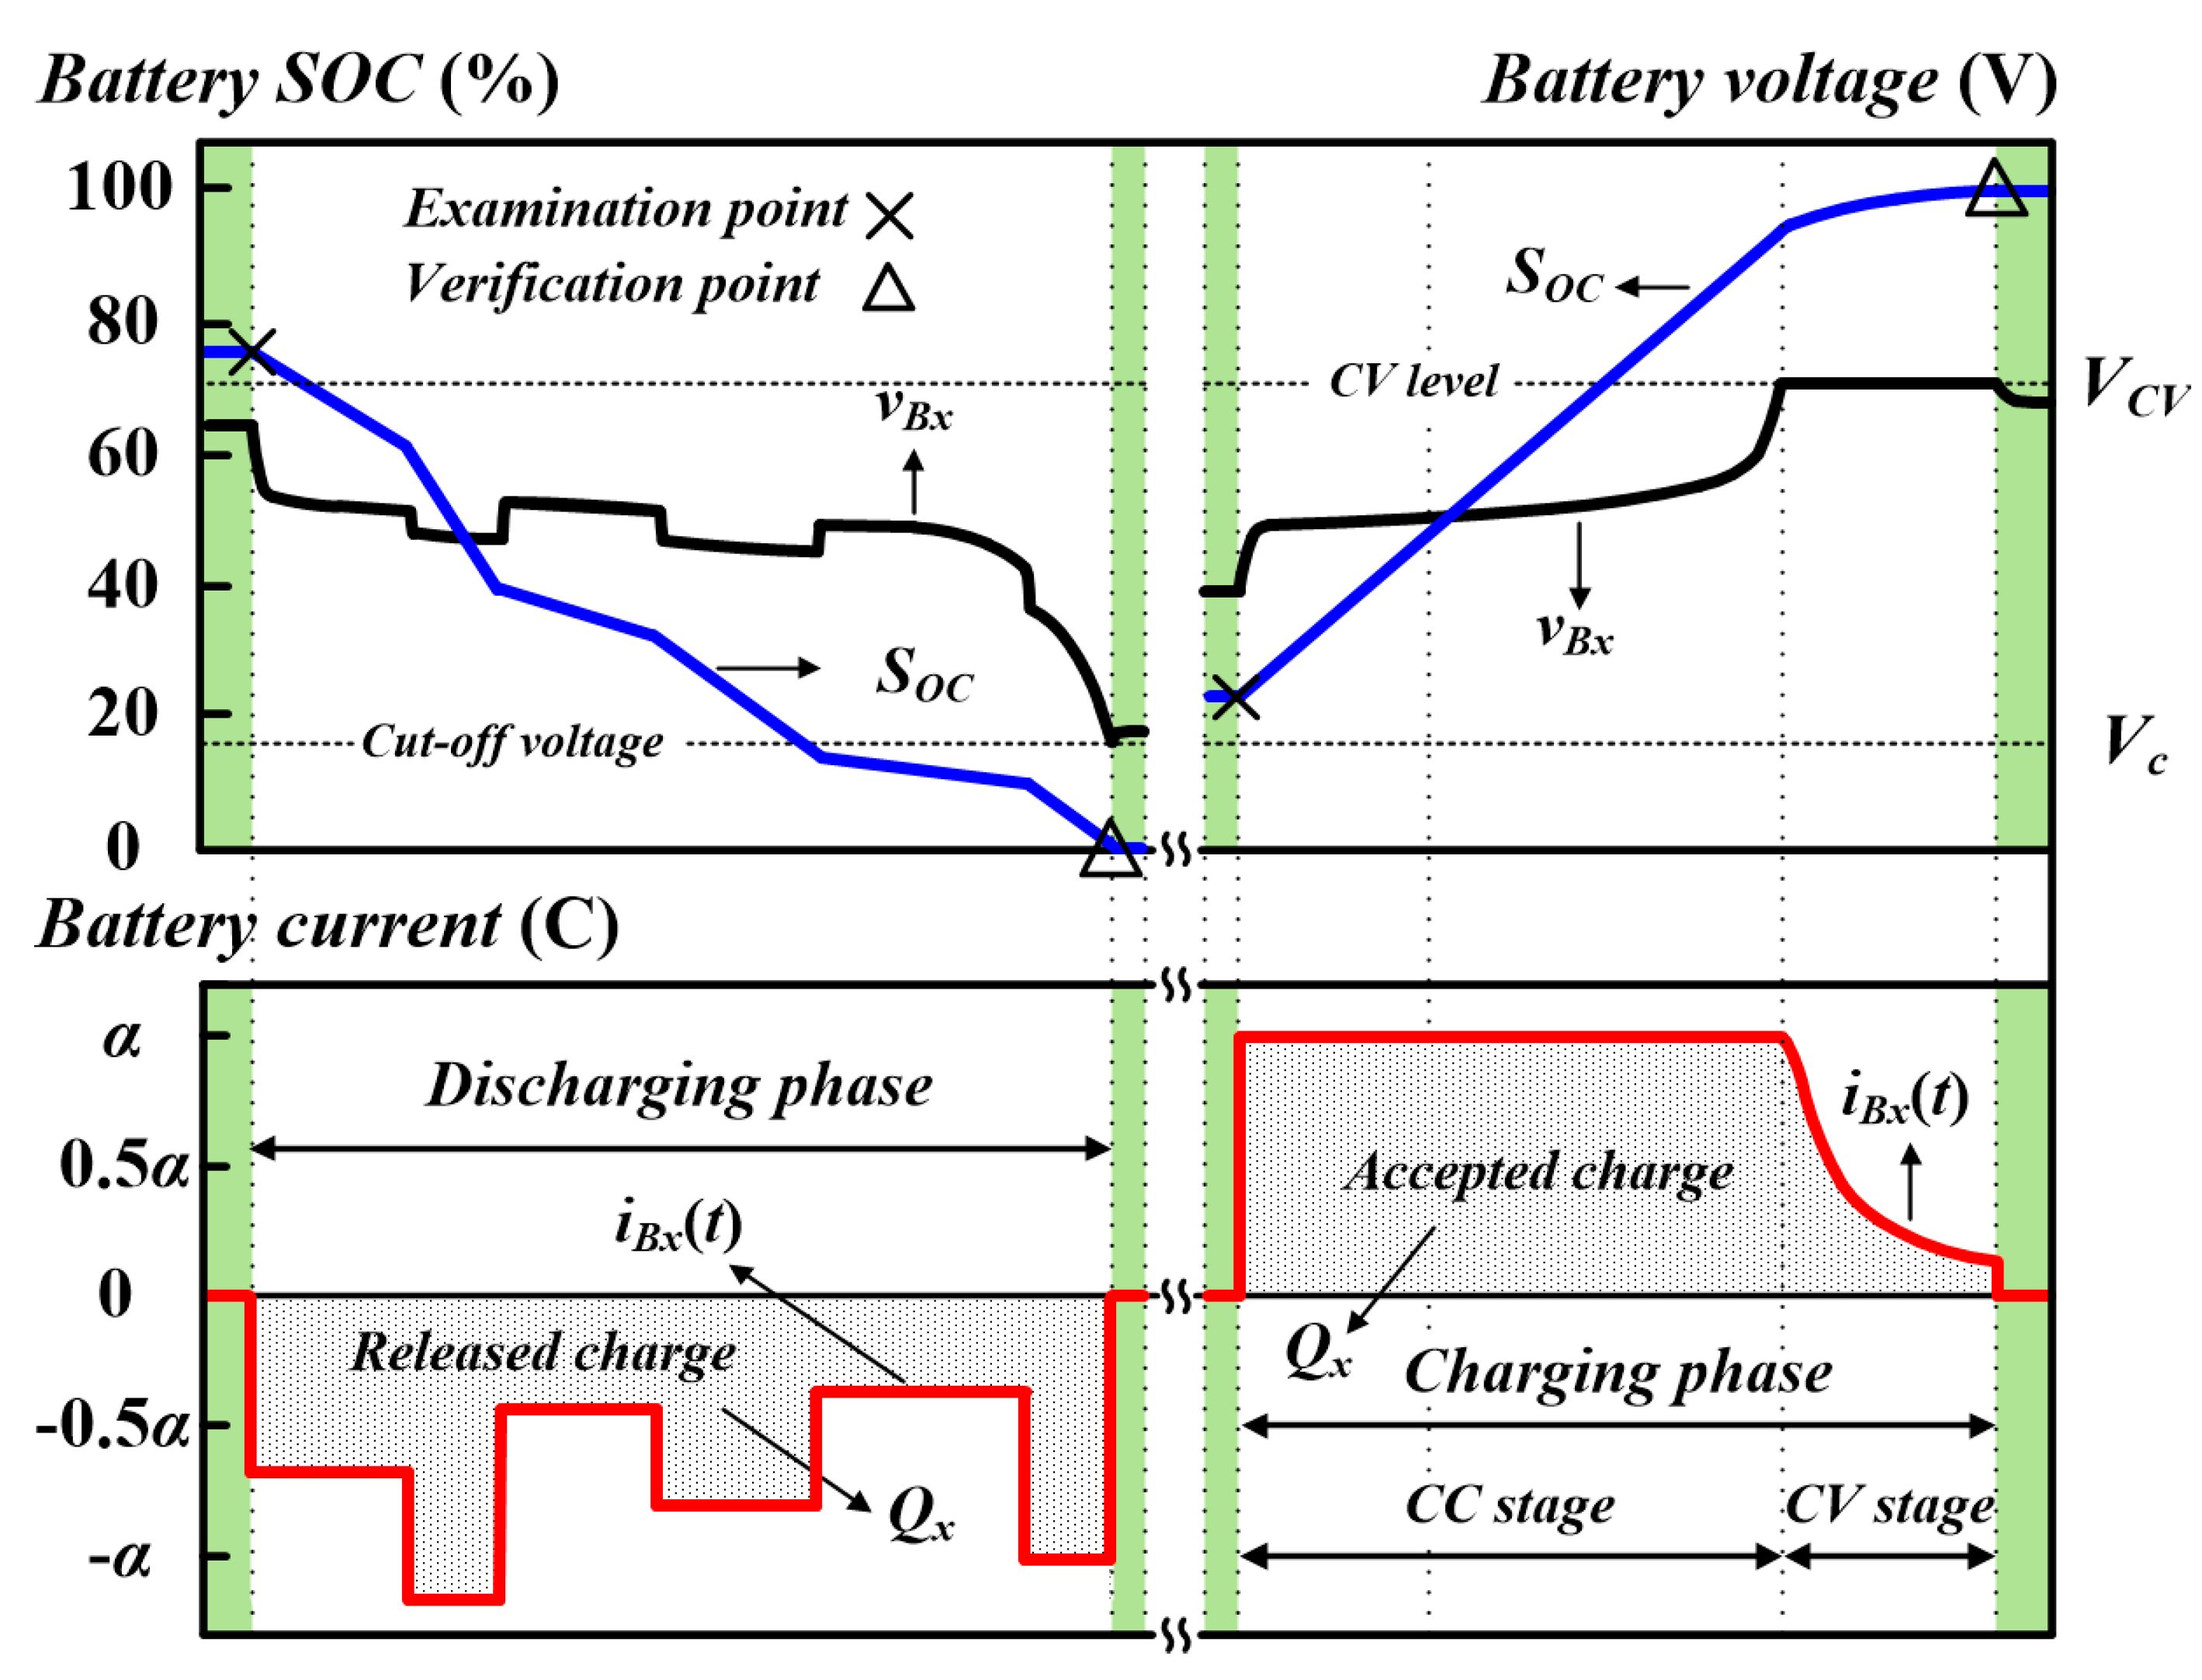
In practice, a battery can be randomly operated within a range between the fully charged and exhausted statuses. In other words, the up-to-date releasable/chargeable capacity may not be acquired in every operation cycle. In these cases, the battery’s capacity can be adapted by partially implementing the calibration procedure in a specified operating cycle. Figure 3 illustrates the arrangement of the partial calibration. The calibration procedure is executed on a battery which may be in either the discharging or charging cycle with an arbitrary SOC, in which, Qx represents the cumulative charge in a partial calibration. In the case of a calibrated battery being discharged, the examination point is designated at 90% of depth-of-discharge (DOD), which stands for the extent of discharging. The DOD is defined as the percentage of the released charge relative to QM.
Thereafter, the calibrated battery starts to be discharged by the specified rate of α C to exclude the effect of the voltage drops on the internal impedance by the drastically changed currents. As the battery voltage declines to the cut-off voltage, a cumulative amount of discharged Qx is obtained. At the same time, the SOC will be reset at 0% since the end-of-discharging condition has been reached. On the other hand, for the charging phase, the CC-CV scheme is applied to the battery from an arbitrarily set examination point, at which a scheduled charging is possible. With an initial value, the SOC will be continuously counted. Once the battery has been fully charged, an amount of charge, Qx, is accumulated from the examination point to the end-of-charging. Then, the SOC is reset to be 100%.
The partial calibration is accomplished as the battery has experienced a charging-discharging or a discharging-charging procedure. With the partial calibration by a charging-discharging cycle, the up-to-date full capacity is obtained by the discharging phase. The SOH is assessed as:
On the other hand, if the battery is calibrated by a discharging-charging cycle, the full capacity is renewed from the charging phase and the SOH is rationalized as:
With a calibrated SOH, the SOC can then be estimated in a more accurate way.
5. Estimation Error
For discharging, the error led by the capacity degradation can be obtained by comparing the estimated residual charge, Qe, at the checking point with the measured cumulative charge, Qx, at the point when the battery has reached the end-of-discharge.
In Equation (6), the full capacity QM has to be updated to take the effect of aging into account.
On the other hand, the estimated acceptable charge is the difference between the full capacity and the estimated charge at the examination point.
Then, the error for charging can be defined as:
In Equation (8), Qx is the actual accumulated charge from the examination point to the fully charged point.
6. Experimental Verifications
To verify the SOC estimation with SOH calibration, a test system is set up to be capable of individually controlling the currents either into or out from the batteries. In this test setup, battery voltages and battery currents are measured continuously, and cumulative charges are updated every 0.1 s. Table 1 lists the specifications of the tested battery cells. The nominal capacity given by the manufacturer is 2.3 Ah. However, the actual full capacity of new batteries may range from 1.95 Ah to 2.05 Ah, which are obtained by averaging the cumulative charges from five full charging-discharging cycles with the same charging-discharging C-rates for regular SOH calibration. During the testing processes, the battery terminal voltages are constrained by a CV level of 3.6 V for charging, and a cut-off voltage of 2.0 V for discharging, respectively. The tested battery in the exemplar case is initially calibrated at a full capacity of 1.997 Ah. Accordingly, the battery current rate of 1 C is firstly designated as 1.997 A. Before testing, the battery is fully charged by the standard CC-CV scheme. Subsequently, the battery is discharged and charged cyclically to randomly designated levels. A break of 600 s is interposed between charging and discharging phases to have a stable terminal voltage.
An experimental test is carried out to demonstrate the accuracy of the SOC estimation with SOH calibration by 25 charging/discharging cycles. Figure 4 depicts four SOC estimation curves, which are all obtained by the coulomb counting method. Table 2 lists the historic data of the SOC estimation curves before the experimental test. In the test, curve X represents the standard SOC estimation with precision current measurement. For the three other curves, an error of 0.3% in measuring current is deliberately implanted during charging and discharging. The SOC estimation on curves I and II are made without SOH calibration, and hence their full capacities Qf are identical to the original full capacity of 1.997 Ah. On the other hand, the SOCs on curve III and curve X are recalculated with updated SOHs after every calibration. In curve I, the SOC is reset to 0 when the battery is discharged to the cut-off point, and is retuned to 100% when the battery is fully charged.
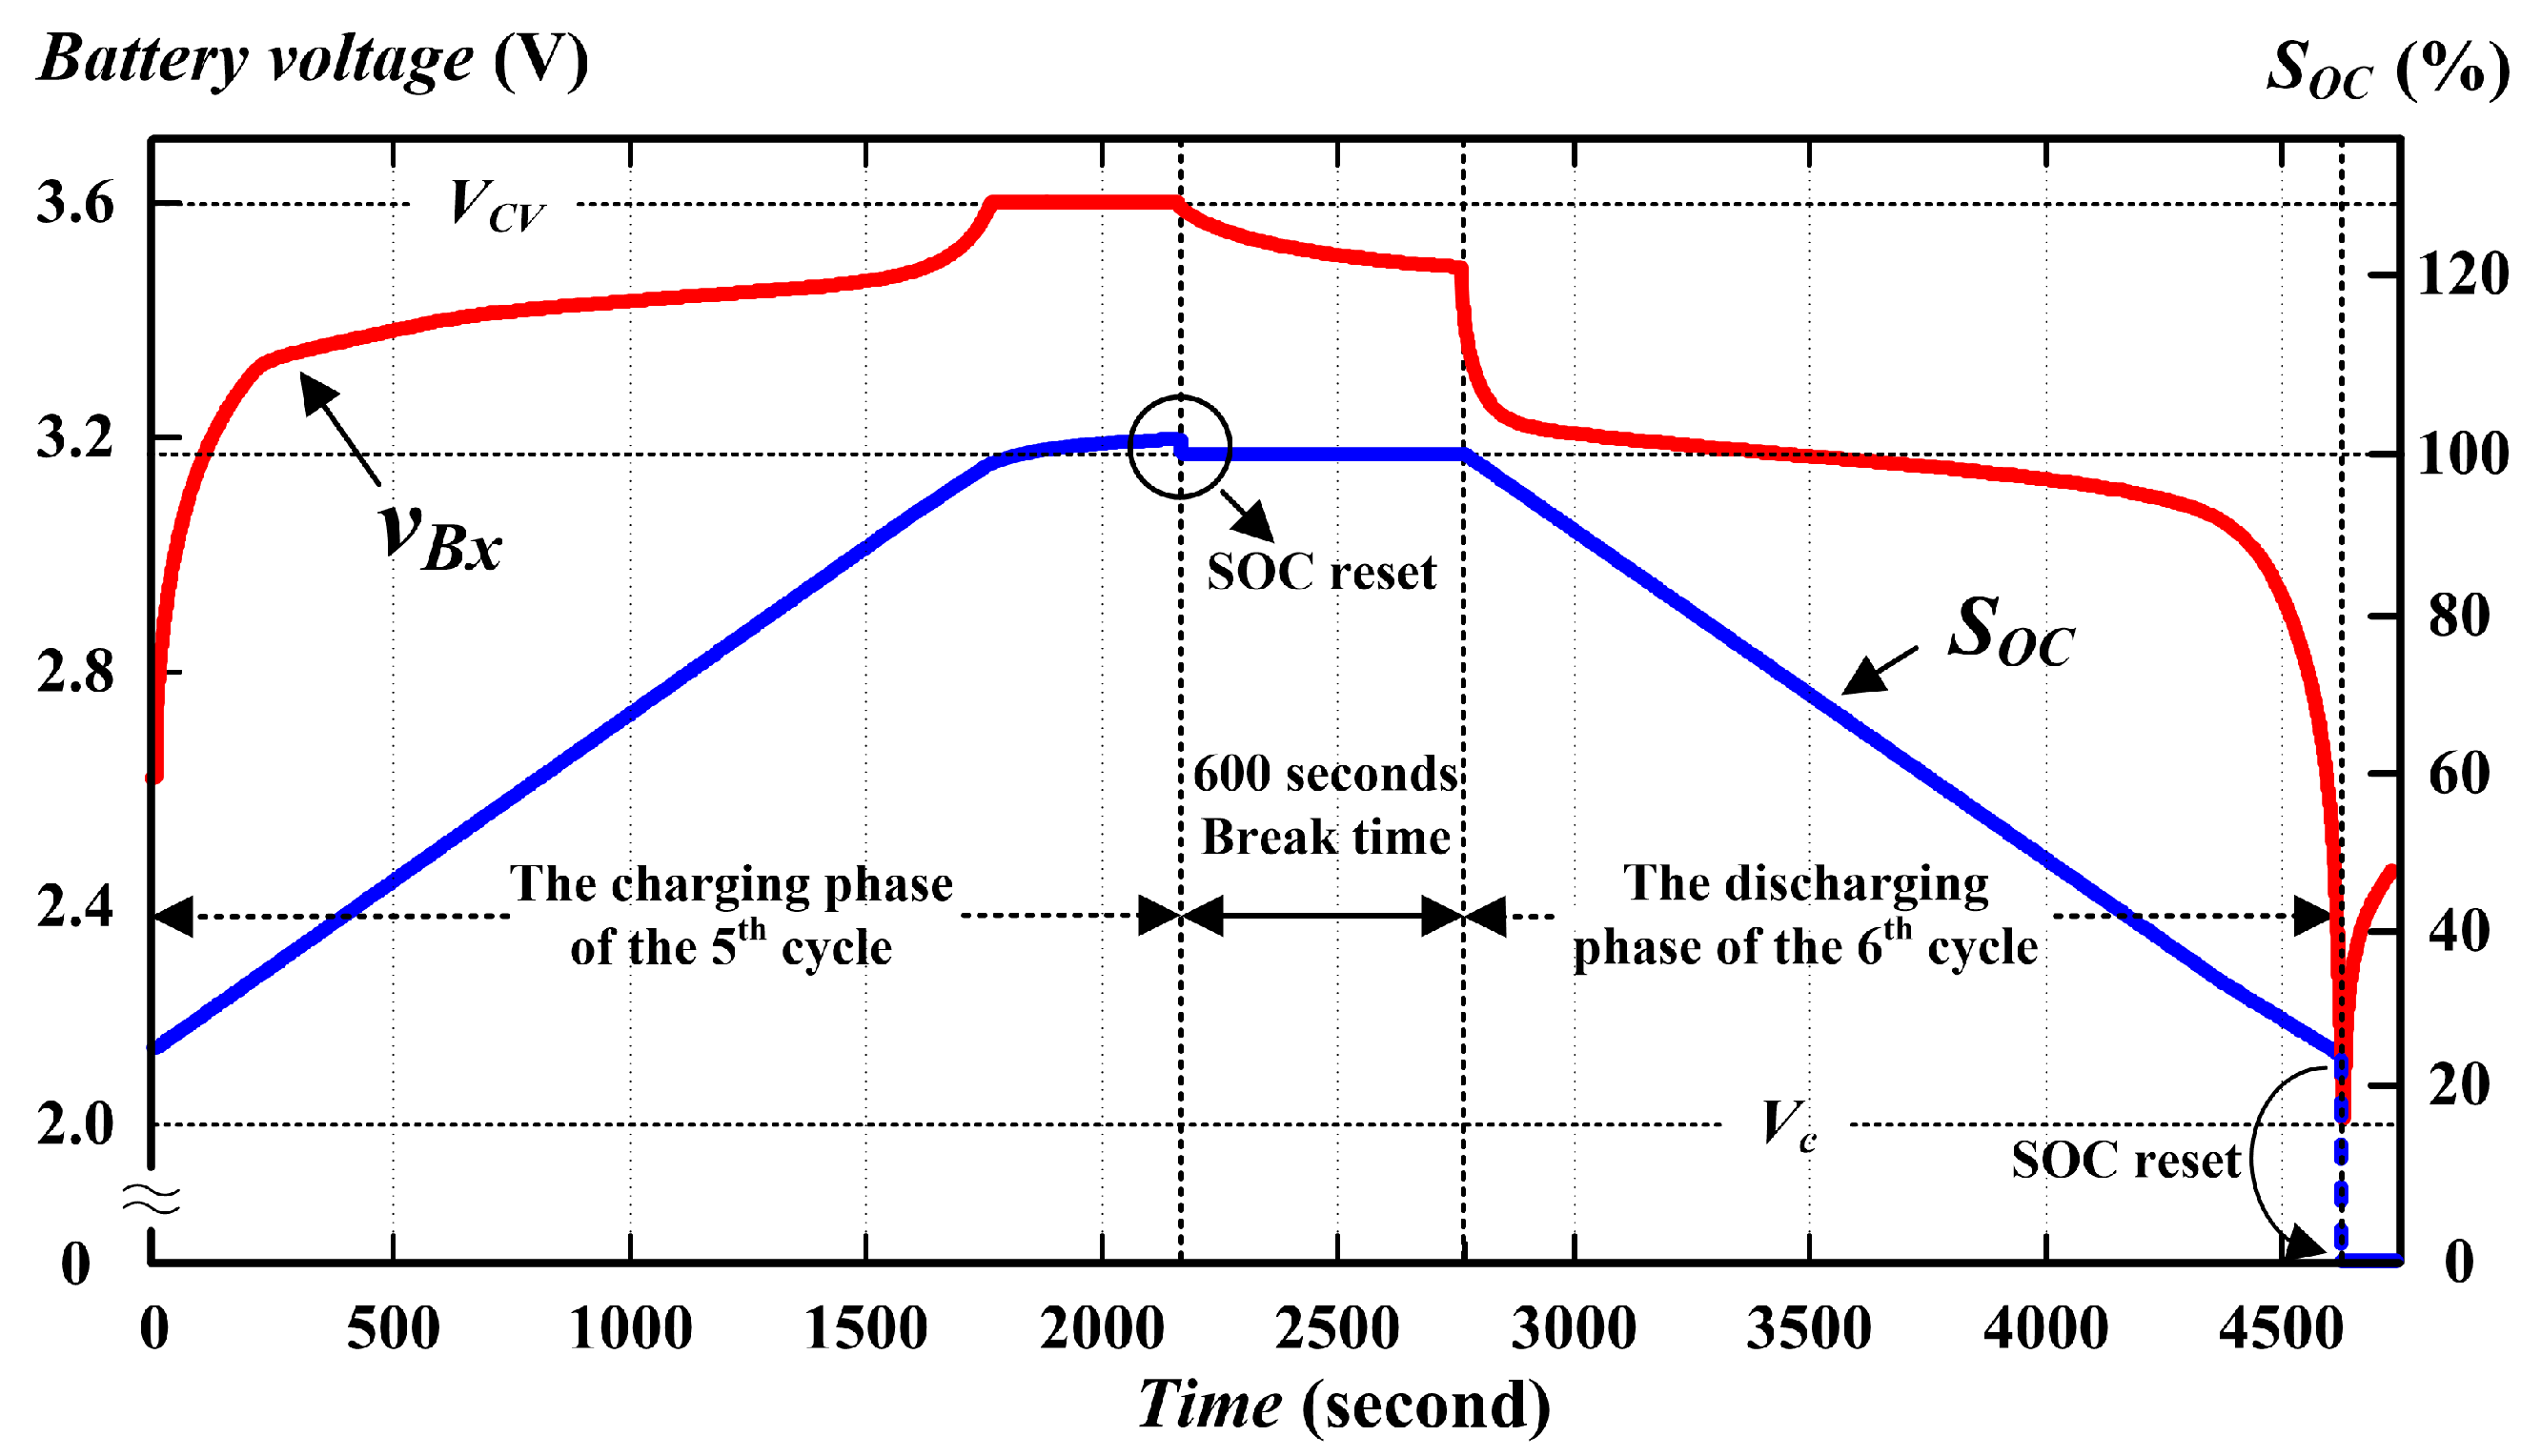
A partial calibration is carried out at the charging phase of the fifth cycle and the following discharging phase in the sixth cycle. Figure 5 shows the detailed variation of the battery voltage and the estimated SOC. At the end of the charging phase of the fifth cycle, the accumulated SOC is 101.58%, which should be 100% for a fully charged battery. The miscalculation may come from the measuring inaccuracy, the temperature effect, or the misestimated initial capacity. At the discharging phase of the sixth cycle, the battery is scheduled to be drained by a designated rate of 1.5 C, and then by 1.0 C as an SOC of 10% is reached. With a critically overestimated SOC, however, the battery voltage declines to the cut-off level when the SOC decreases to 15.21%. By this partial calibration, a full capacity is only 1.548 Ah and the SOH is therefore updated to 77.52%. After the first calibration, the SOCs on curves III and X are recalculated by the latest calibrated SOH and the C-rate is normalized with the latest full capacity. On the other hand, curves I and II without SOH calibration are the same shape, but have different offsets.
Figure 6 shows the battery voltage and the SOC curves during the regular calibrations at the discharging phase of the 19th cycle and the charging phase of the 25th cycle, respectively. Before regular calibration, the battery is either fully charged or exhausted, and the SOC is reset at 100% or 0% to exclude the misestimation caused by measuring error. With regular discharging and charging schemes, typical voltage and SOC curves are obtained.
In practice, the SOHs may vary within a small range due to the different numerical integrations of the cumulative capacity after each calibration. Table 3 lists the SOHs of four curves throughout the experimental test. With an uncalibrated SOH of 100%, the SOCs on curve I are overestimated all the time, while the SOCs on curve II can be either underestimated or overestimated depending on the amount of SOCs that have been reset at the fully charged and empty points. For curves III and X, the SOHs are calibrated to be the same after the first calibration at the sixth cycle. However, these two curves are not completely overlapped afterward due to the implanted current measuring error of 0.3% in curve III. In the experimental case, the battery’s SOH is calibrated to 77.33% after the charging phase of the 25th cycle. An experiment is carried out with the old battery under a higher C-rate of 3 C. A shorter discharging duration results in less cumulative full capacities of 75.45% in the event that the discharging process is terminated when the battery voltage reaches the cut-off point with a higher discharging current. However, the SOHs are calibrated at 77.34% and 77.23%, respectively, when it is discharged with 1 C for partial calibrations at the discharging phase. On the other hand, the reduced capacities can be compensated for at the CV stage during the calibrations at the charging phase. As a result, the two calibrated SOHs at the charging phase are 77.84% and 77.11%, respectively. These tested results are consistent with those obtained from the regular calibrations.
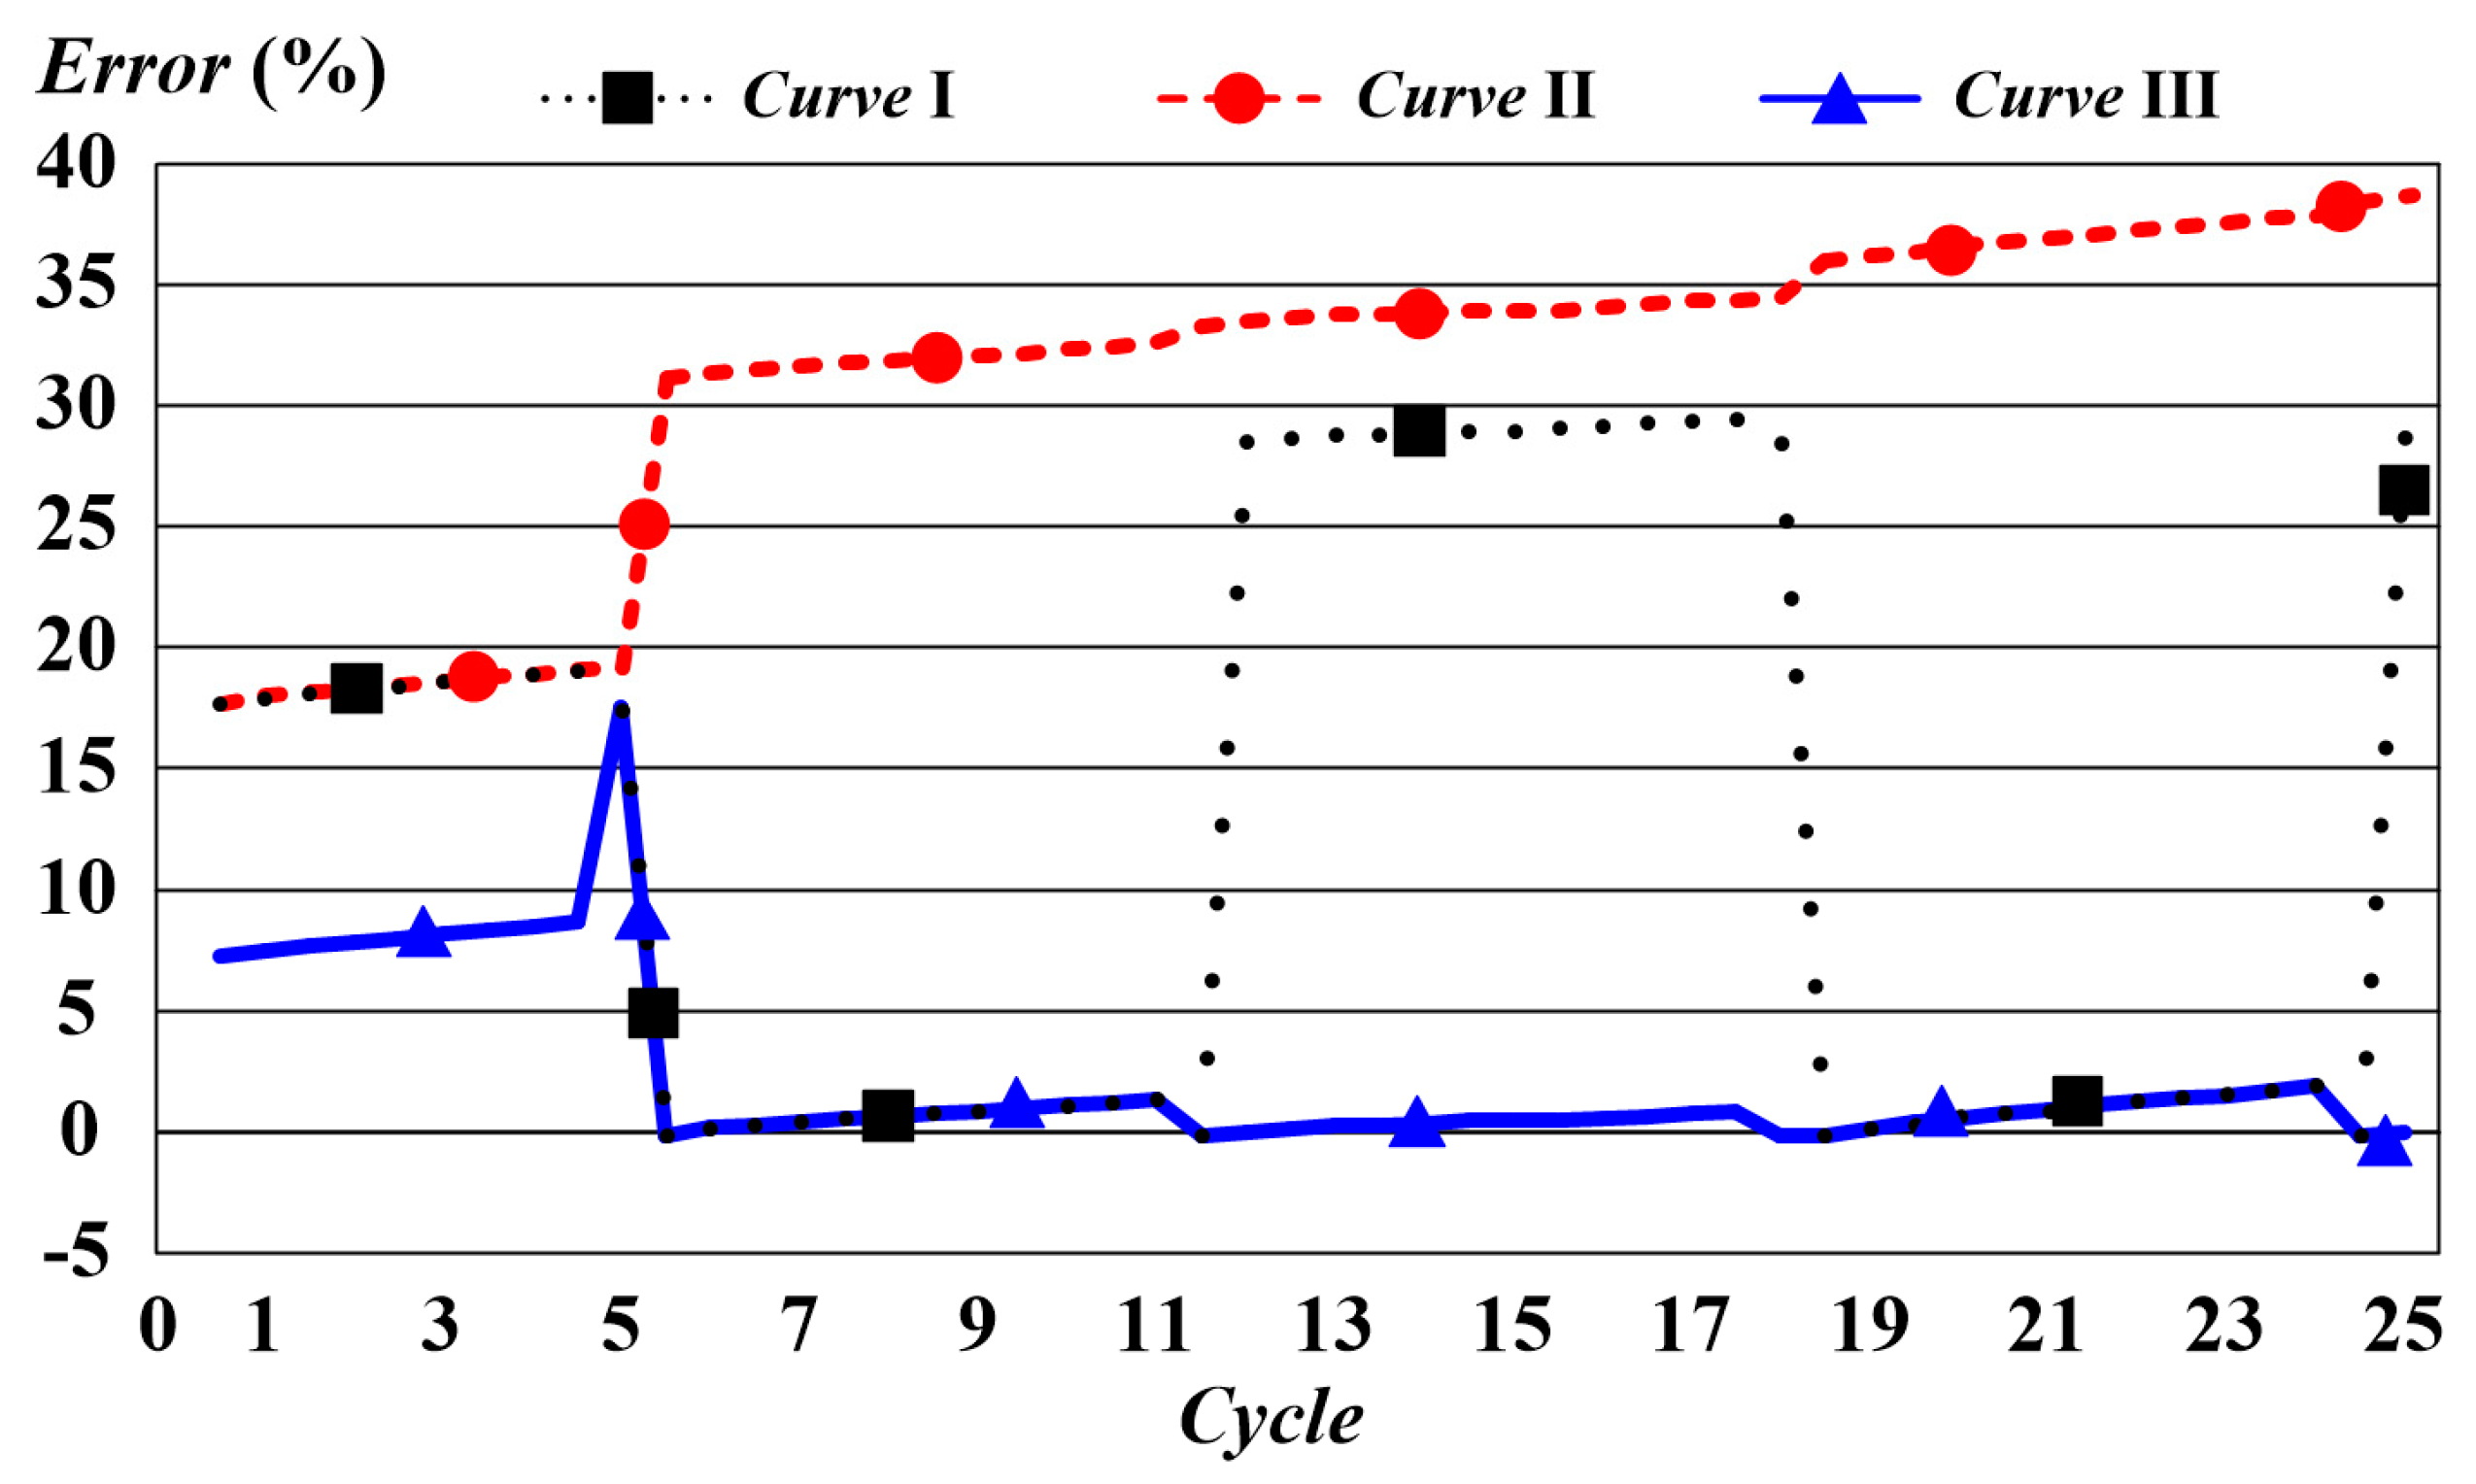
Figure 7 shows the estimation errors for curves I, II, and III as compared with the standard one. In the intervals between calibrations, the errors increase evidently due to the cumulative faults with inaccurate current measurement. On curve III with SOH calibration, a relatively larger error is found at the fifth cycle, with a previously misestimated capacity. Thereafter, the estimation errors are effectively reduced and kept to be less than 1.905%. Evidently, the actual battery capacity and the SOC estimation can be measured more accurately by regular and partial calibrations.
7. Conclusions and Discussions
An SOC estimation approach for lithium-ion batteries based on coulomb counting has been presented. The SOC estimation can be more accurate by taking account the capacity degradation and the current measuring error. To address the relative problems to the approach, however, the following discussions are made based on the research results.
- (1)
- The accepted/released charge of a battery depends on the charging/discharging current as well as the SOC. To identify the full capacity of a battery which has not been calibrated before, the C-rate has to be correctly normalized first. An accurate normalized C-rate can be simply obtained from several regular calibrations. For lithium-ion batteries, which are with relatively small internal impedances, only two subsequent calibrations are needed.
- (2)
- The error on SOC estimation is essentially caused by current integration as well as capacity degradation. The integrated error from an inaccurate current measurement of the charging/discharging cycles results in misjudgment of the full capacity. This error can be provisionally eliminated by resetting the SOC at 0% and 100% as the battery is fully exhausted and charged, respectively.
- (3)
- The coulombic efficiencies of lithium-ion batteries are high enough to neglect the trivial difference between the accepted charge and the released charge of two consecutive regular calibrations for charging and discharging phases. In other words, the full capacity can be updated by either the charging or discharging phase of a regular calibration. For other types of batteries that have lower coulombic efficiencies, calibrations in the charging and discharging phases may result in different cumulative full capacities. With different calculation bases, the SOC estimation for charging and discharging phases needs to be calculated separately. Nevertheless, the SOC estimation is still accurate when the batteries are operated at the same phase with the same calculation base.
- (4)
- For a battery’s SOH that has not been calibrated for a long time, the full capacity calculated from the first calibration may be incorrect. In this case, a further partial or regular calibration is needed to obtain a more accurate SOH.
- (5)
- The proposed approach can be used in battery testing systems for sorting new cells to acquire the nominal capacities more precisely. It can also be used for battery power systems that are capable of individually controlling the charging/discharging currents on batteries.
- (6)
- In this research, all experiments were carried out in room temperature, ranging from 26 °C to 30 °C. However, a different ambient temperature may lead to remarkably dissimilar accepted/released charges of a fully exhausted/charged battery, even under the same operating conditions. The effects of temperature must be considered for further improvement on the proposed approach.
Acknowledgments
This work was supported by the Ministry of Science and Technology of Taiwan under the grant number of 105-2218-E-006-009.
Author Contributions
Chin-Sien Moo contributed to the conception of the study and English editing of the paper. Tsung-Hsi Wu performed the analysis and the experiments of this work and wrote the paper.
Conflicts of Interest
The authors declare no conflict of interest.
References
- Scrosati, B.; Garche, J. Lithium batteries: Status, prospects and future. J. Power Sources 2010, 195, 2419–2430. [Google Scholar] [CrossRef]
- Stuart, L. A high capacity li-ion cathode: The Fe(III/VI) super-iron cathode. J. Energies 2010, 3, 960–972. [Google Scholar]
- Einhorn, M.; Conte, F.V.; Kral, C.; Fleig, J. Comparison, selection, and parameterization of electrical battery models for automotive applications. IEEE Trans. Power Electr. 2013, 28, 1429–1437. [Google Scholar] [CrossRef]
- Hong, J.; Park, S.; Chang, N. Accurate remaining range estimation for electric vehicles. In Proceedings of the IEEE Asia and South Pacific design automation conference, Macau, China, 25–28 January 2016. [Google Scholar]
- Pei, L.; Wang, T.; Lu, R.; Zhu, C. Development of a voltage relaxation model for rapid open-circuit voltage prediction in lithium-ion batteries. J. Power Sources 2014, 253, 412–418. [Google Scholar] [CrossRef]
- Li, X.; Wang, T.; Pei, L.; Zhu, C.; Xu, B. A comparative study of sorting methods for lithium-ion batteries. In Proceedings of the IEEE conference and expo transportation electrification Asia-Pacific, Bejing, China, 31 August–3 September 2014. [Google Scholar]
- Li, X.; Jiang, J.; Wang, L.Y.; Chen, D.; Zhang, Y.; Zhang, C. A capacity model based on charging process for state of health estimation of lithium ion batteries. J. Appl. Energy 2016, 177, 537–543. [Google Scholar] [CrossRef]
- Vetter, J.; Novák, P.; Wagner, M.R.; Veit, C.; Möller, K.C.; Besenhard, J.O.; Winter, M.; Wohlfahrt-Mehrens, M.; Vogler, C.; Hammouche, A. Ageing mechanisms in lithium-ion batteries. J. Power Sources 2005, 147, 269–281. [Google Scholar] [CrossRef]
- Xing, Y.; Ma, E.W.M.; Tsui, K.L.; Pecht, M. Battery management systems in electrical and hybrid vehicles. J. Energies 2011, 4, 1840–1857. [Google Scholar] [CrossRef]
- Lu, L.; Han, X.; Li, J.; Hua, J.; Ouyang, M. A review on the key issues for lithium-ion battery management in electric vehicles. J. Power Sources 2013, 226, 272–288. [Google Scholar] [CrossRef]
- Rahimi-Eichi, H.; Ojha, U.; Baronti, F.; Chow, M.Y. Battery management system-an overview of its application in the smart grid and electric vehicles. IEEE Ind. Electr. Mag. 2013, 7, 4–16. [Google Scholar] [CrossRef]
- Cuma, M.U.; Koroglu, T. A comprehensive review on estimation strategies used in hybrid and battery electric vehicles. J. Renew. Sustain. Energy Rev. 2015, 42, 517–531. [Google Scholar] [CrossRef]
- Huet, F. A review of impedance measurements for determination of the state-of-charge or state-of-health of secondary batteries. J. Power Sources 1998, 70, 59–69. [Google Scholar] [CrossRef]
- Xu, J.; Mi, C.C.; Cao, B.; Cao, J. A new method to estimate the state of charge of lithium-ion batteries based on the battery impedance model. J. Power Sources 2013, 233, 277–284. [Google Scholar] [CrossRef]
- Zou, Y.; Hu, X.; Ma, H.; Li, S.E. Combined state of charge and state of health estimation over lithium-ion battery cell cycle lifespan for electric vehicles. J. Power Sources 2015, 273, 793–803. [Google Scholar] [CrossRef]
- Hu, C.; Youn, B.D.; Chungc, J. A multiscale framework with extended Kalman filter for lithium-ion battery SOC and capacity estimation. J. Appl. Energy 2012, 92, 694–704. [Google Scholar] [CrossRef]
- Singh, P.; Vinjamuri, R.; Wang, X.; Reisner, D. Design and implementation of a fuzzy logic-based state-of-charge meter for li-ion batteries used in portable defibrillators. J. Power Sources 2006, 162, 829–836. [Google Scholar] [CrossRef]
- Landi, M.; Gross, G. Measurement techniques for online battery state of health estimation in vehicle-to-grid applications. IEEE Trans. Instrum. Meas. 2014, 63, 1224–1234. [Google Scholar] [CrossRef]
- Ng, K.S.; Moo, C.S.; Chen, Y.P.; Hsieh, Y.C. Enhanced coulomb counting method for estimating state-of-charge and state-of-health of lithium-ion batteries. J. Appl. Energy 2009, 86, 1506–1511. [Google Scholar] [CrossRef]
Figure 1.
The voltage and the discharging time under a rate of 1 C.

Figure 2.
Regular calibration procedure.

Figure 3.
Partial calibration procedure.

Figure 4.
The SOCs on the tested battery cell.

Figure 5.
Battery voltage and SOC curves during partial calibration.

Figure 6.
Battery voltage and SOC curves during regular calibrations.

Figure 7.
Estimation errors of different methods.


Table 1.
Battery specifications.
| Nominal Battery Capacity | 2.3 Ah | Calibrated Initial Full Capacity, Qf | 1.997 Ah |
|---|---|---|---|
| Nominal voltage | 3.3 V | Cut-off voltage, Vc | 2.0 V |
| CV level, VCV | 3.6 V | Cut-off current at CV stage | 0.1 C |
Table 2.
Historic data of SOC estimation curves before the experimental test.
| Parameters | Curve I | Curve II | Curve III | Curve X |
|---|---|---|---|---|
| Current measuring error | 0.3% | 0.3% | 0.3% | 0.0% |
| Full capacity, Qf | 1.997 Ah | 1.997 Ah | 1.820 Ah | 1.700 Ah |
| State-of-health, SOH | 100.00% | 100.00% | 91.14% | 85.13% |
Table 3.
The SOHs of four tested cases throughout the experiment.
| Cycles | Curve I | Curve II | Curve III | Curve X |
|---|---|---|---|---|
| 1–6 | 100.00% | 100.00% | 91.14% | 85.13% |
| 7–12 | 100.00% | 100.00% | 77.52% | 77.52% |
| 13–19 | 100.00% | 100.00% | 77.83% | 77.83% |
| 19–25 | 100.00% | 100.00% | 77.23% | 77.23% |
© 2017 by the authors. Licensee MDPI, Basel, Switzerland. This article is an open access article distributed under the terms and conditions of the Creative Commons Attribution (CC BY) license (http://creativecommons.org/licenses/by/4.0/).
Share and Cite
MDPI and ACS Style
Wu, T.-H.; Moo, C.-S. State-of-Charge Estimation with State-of-Health Calibration for Lithium-Ion Batteries. Energies 2017, 10, 987. https://doi.org/10.3390/en10070987
AMA Style
Wu T-H, Moo C-S. State-of-Charge Estimation with State-of-Health Calibration for Lithium-Ion Batteries. Energies. 2017; 10(7):987. https://doi.org/10.3390/en10070987
Chicago/Turabian StyleWu, Tsung-Hsi, and Chin-Sien Moo. 2017. "State-of-Charge Estimation with State-of-Health Calibration for Lithium-Ion Batteries" Energies 10, no. 7: 987. https://doi.org/10.3390/en10070987
Note that from the first issue of 2016, this journal uses article numbers instead of page numbers. See further details here.