
Numerical Investigations of the Combined Effects of Flow Rate and Methanol Concentration on DMFC Performance


1
State Key Laboratory of Advanced Design and Manufacturing for Vehicle Body, College of Mechanical and Vehicle Engineering, Hunan University, Changsha 410082, China
2
College of Science, Shanghai Institute of Technology, Shanghai 201418, China
*
Author to whom correspondence should be addressed.
Energies 2017, 10(8), 1094; https://doi.org/10.3390/en10081094
Submission received: 6 June 2017
/
Revised: 7 July 2017
/
Accepted: 13 July 2017
/
Published: 26 July 2017
(This article belongs to the Special Issue Direct Alcohol Fuel Cells 2018)
Abstract
:A modified 3D numerical model on the energy conversion process in the anode side of a Direct Methanol Fuel Cell (DMFC) system was constructed and validated to published experimental results. Systematic simulations were performed to investigate the underlying mechanisms of the energy conversion process, and the combined effects of inlet flow rate and input methanol concentration were summarized systematically. The increase of flow rate was found to be an effective strategy to accelerate the internal flow fields, while the diffusion layer was proposed to be a critical component in the design of high-performance DMFC. The frontier for optimal conditions of DMFC’s output was also determined, which can be helpful to improve the energy conversion performance of DMFC in practical applications.
1. Introduction
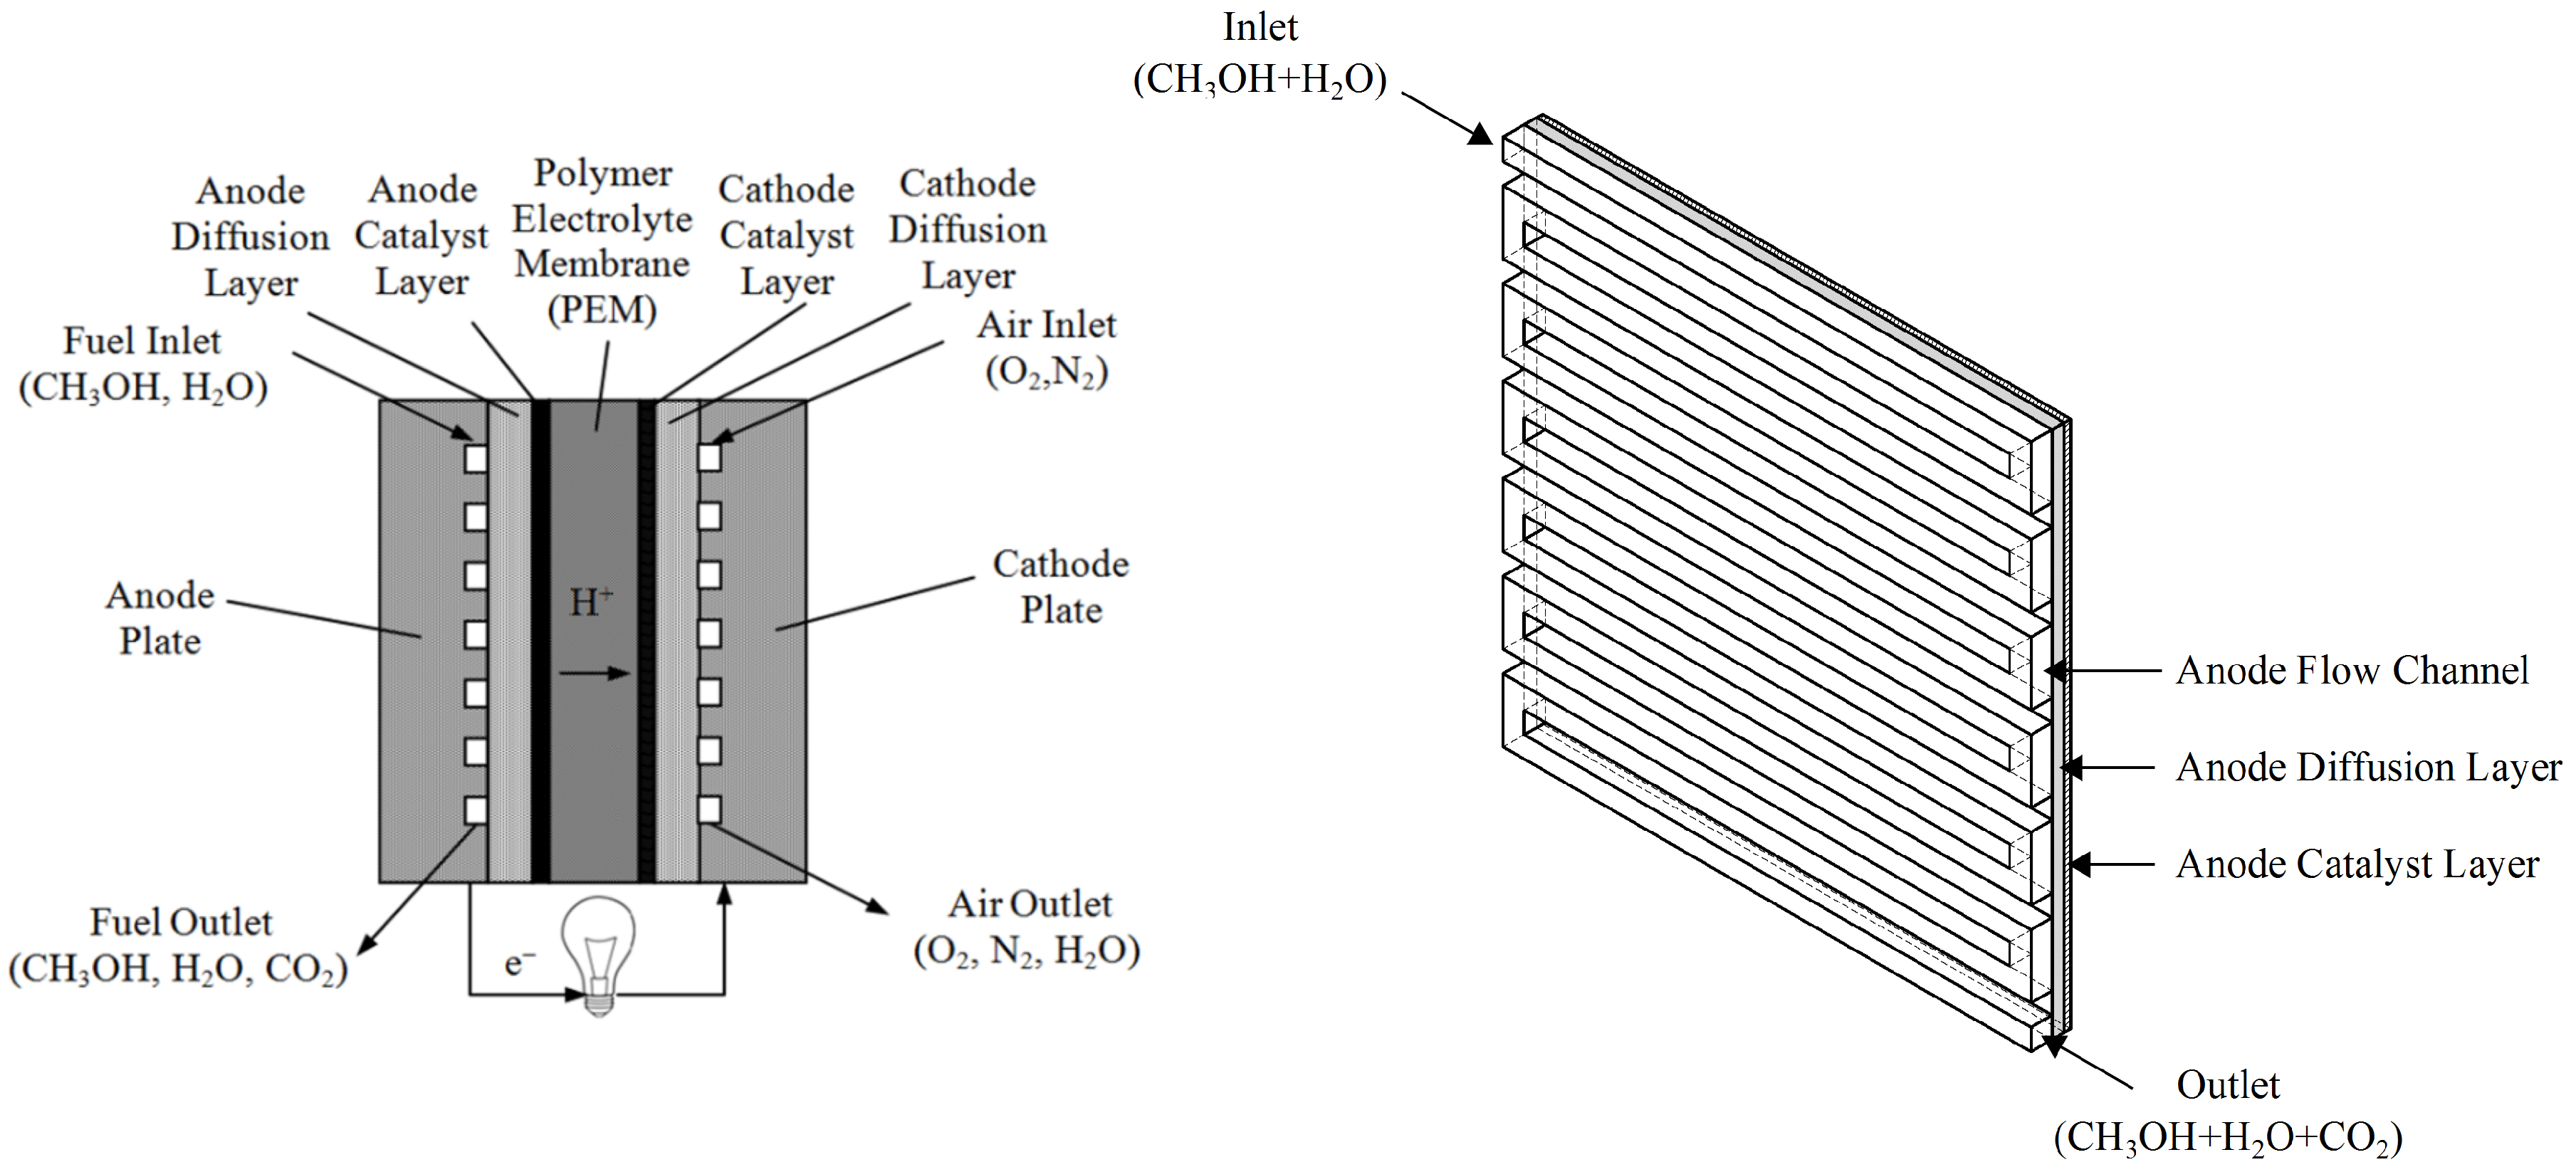
The Direct Methanol Fuel Cell (DMFC), which takes advantage of methanol oxidation reaction to convert chemical energy into electricity, has attracted considerable attention in recent years as a prosperous power source for mobile applications [1,2,3,4,5,6,7,8]. A typical DMFC is primarily composed of a Polymer Electrolyte Membrane (PEM), the catalyzed electrodes at anode/cathode sides and the end plates, as shown in Figure 1. The understanding of energy conversion process is necessary for optimal operation and design, but it is a task full of challenges as it normally involves lots of operating parameters, such as the feed solution properties [9] and the flow characteristics [10]. As the underlying mechanism of such a multi-parameter dependent system is usually hard to be experimentally determined, the comprehensive modelings of DMFC systems are essential in optimization design and operational management.
During the past decades, several mechanical models based on Computational Fluid Dynamics (CFD) techniques were proposed to study the energy conversion process of DMFC systems, from one-dimensional [11], two-dimensional [12,13] to three-dimensional (3D) [14,15,16,17,18,19] points of view. As the 3D models consider the physical and chemical behaviors in full dimensions, it is regarded to be able to simulate most of the DMFC’s underlying mechanisms. Ge and Liu have designed one of the earliest 3D multi-component models by coupling the continuity, momentum and species conservation equations for both the anode and cathode catalyst layers in DMFCs [14]. Danilov et al. have avoided to use empirical correlations of current distribution to a certain extent, and developed a 3D two-phase model to study the gas evolution in gas–liquid flows inside the anode channels [15]. Yang et al. have integrated five sub-models to construct a 3D two-phase model for predicting the DMFC’s performance at steady states [16]. Each of the sub-models can simulate a specific component of the DMFC systems, but the model constructing process is kind of complicated. Subsequently, in order to avoid much more complex modeling approach for two-phase flow and transport, Vera has presented an isothermal single-phase 3D model and proven that the carbon dioxide produced at the anode can be considered to be dilute enough to remain dissolved in the liquid phase, especially for the low current density regime [17]. Recently, we have focused on one-phase flow and developed a 3D model with electro-chemical relationships being described by the semi-empirical relationships [18]. Although it was then successfully applied to study the influence of geometric and operating parameters on DMFC performance in experiments [19,20], the assumption of satisfactorily high air flow rate leads to the incapability of this model to quantify the effects of air flow rate on the fuel cell performance.
By the aid of these developed models (including but not only limited to those mentioned above), great progress has also been done in the fields of numerical investigations of the operating parameters affecting DMFC performance [3,6]. For instance, the current density variations were investigated with the increase of anode methanol flow rate at a specific methanol concentration using a 3D single-phase multi-component mathematical model [14], and the polarization curves were calculated and compared for different methanol concentrations with an isothermal single-phase model [17]. However, to the best of our knowledge, a comprehensive research about the effects of main operating parameters on the DMFC performance is still not easily available. A systematic study, that is needed for further analysis on the physical mechanisms, is necessary for the determination of optimal operating parameters to improve the DMFC performance. It thus becomes the motivation of the present study.
Considering the effect of oxygen availability, a modified 3D numerical model about the energy conversion process of DMFC was developed by coupling the equations of species transport, mass and momentum conservations in the present study (Section 2). Comprehensive numerical simulations were performed to study the underlying mechanism of energy conversion process in a DMFC. The combined effects of inlet flow rate and methanol concentration on DMFC performance were systematically investigated, and an optimal operating condition was determined (Section 3). Results are discussed and summarized in Section 4.
2. Methods and Models
2.1. Problem Description
A DMFC can convert chemical energy of methanol to electrical energy by the oxidation-reduction reaction between methanol and oxygen [20]. As shown in Figure 1 (left), it mainly consists of anode, cathode and polymer electrolyte membrane (PEM), for which the anode and cathode are both composed by flow channel, diffusion layer and catalyst layer. On the anode side, the mixed solution of methanol () and water () is pumped into the flow channel when the operation is started. At the bottom of the flow channel, the diffusion layer that is made of porous media allows the methanol-water solution to penetrate and diffuse to the catalyst layer. As the catalyst layer is made of carbon paper or cloth with Pt-Ru and Pt catalysts deposited on it, it allows the diffusions of methanol and oxygen for oxidation reaction. The oxidation reaction can be described as
At the bottom of catalyst layer, the PEM only allows the ions () to pass through to the cathode side. The other production thus should be transported by the flow of mixed solution and exhausted from the channel outlet on the anode side. The current is generated when the electrons () moves via the external circuit to the cathode side. At the cathode side, the air flow brings oxygen into the system. A reduction reaction consuming , and to produce makes this whole clean energy generation process complete, which can be described as
As the air flow rate at the cathode side can be easily accelerated in experiments, many researchers assumed that the air amount is enough for the energy conversion process in the DMFCs and thus concentrated only on the oxidation reactions taking place at the anode side [3]. Following this assumption, many previous CFD studies were based on the anode side in order to simplify the modeling process and to increase the calculation efficiency [16,18,19,20]. The present CFD model is also based on the anode side of a DMFC system, which has been reported in our previous experimental work [20]. The physical domains in the following content include only three domains: the anode flow channel, the anode diffusion layer and the anode catalyst layer, as shown in Figure 1 (right), and the corresponding geometric dimensions are presented in Table 1.
2.2. Governing Equations and Models
The energy conservation process of DMFC is not only highly relevant to the chemical reactions of feed solutions, but also depends on the effect of convective diffusion in multiphase flow. Mechanical models include differential and algebraic equations based on the basis of physical and electrochemical governing phenomena, which are different in the different zones due to their different physical and chemical characteristics, such as material properties and chemical reactions. Owing to the existence of chemical reactions, the continuity equation ensuring the mass conservation should be expressed as
where denotes the mixture density, is the velocity of mixture, and denotes the mass source term. We use to represent the porosity of physical domain, while 1, 0.6 or 0.4 is for the channel layer, the diffusion layer and the catalyst layer, respectively [16,18,20]. As chemical reaction occurs only in the catalyst layer, the mass source term is 0 in the channel and diffusion layers. At the catalyst layer, it can be expressed as
where and are the species source terms caused by the chemical reaction and physical crossover through the membrane, respectively. As can not pass through the membrane due to its macromolecular structure, its physical crossover term should be 0. The crossover terms of methanol and water can be defined as [17,21]
where and are molecular weights of and , and are the electro-osmotic drag coefficients for and , F is the Faraday constant, is the diffusion coefficient of , denotes the local methanol concentration at the interface between the catalyst layer and membrane surface, and and are the thicknesses of the membrane and catalyst layer, respectively. The local volumetric current density of the cell is defined by [15,18]
where is the open circuit voltage, is the cell potential, and represents the area specific resistance of membrane. Special attention can be paid to the parameter . Although many CFD studies concentrated only on the anode side based on the assumption that the air amount is enough at the cathode side [16,18,19,20], the ’sufficiently high‘ flow rate is still an inaccurate criterion for the air availability, especially when the model is needed to be applied in analyzing the performances of different types of DMFCs. Therefore, the parameter is introduced to account for the effect of air availability in the present study, to improve the generalization capability of our CFD model without increasing the computation cost, which can be determined by the comparison of experimental and numerical results. However, not all of these parameters can be determined from experiments due to technical limitations. For example, the over-potential values at the anode and cathode sides, and , respectively, have been derived from semi-empirical equations in our former study [20]. The semi-empirical expressions of , and proposed in our previous studies [18] have been adopted in present study, and Equation (7) becomes
where the coefficients of our semi-empirical model – have been determined from experimental data, , , , , , , and . As the methanol oxidation reaction consumes and to produce at the catalyst layer (Equation (1)), the source terms by reaction are given by
where is the molecular weight of species k. The parameter is used to distinguish the production or consumption of species, while it takes 1 for and for and .
The momentum conservation equation at the anode side of DMFC can be derived from Navier–Stokes equations, which can be written as
where takes 1, 0.6 or 0.4 for channel layer, diffusion layer and catalyst layer, respectively, P denotes the pressure, and is mixture viscosity. The momentum source term caused by the resistance of porous media can be defined as [22,23]
where K denotes the permeability of porous media. The transport equations of species in porous media are defined as [20,24]
where denotes the mass fraction of specie k. and are the source term caused by reaction and crossover, respectively. The source terms for different flow domains are given by Equations (4)–(9), e.g., it takes 0 for the channel and the diffusion layer. denotes the effective diffusion coefficient of specie k, which is defined as [14]
where is the diffusion coefficient in the channel.
2.3. Numerical Implementations
The energy conversion process of DMFC can be modeled by a coupling of the governing equations of continuity, momentum and species transportation, as mentioned in Equations (3), (10) and (12). The source term and in Section 2.2. The flow fields can be determined by solving Equations (3) and (10). The obtained flow rate is then applied in Equation (12) to determine the convection and diffusion of species. Because of the technical limitations, not all the the parameters involved in governing equations can take a definitive value from experimental measurements. A mass literature review on relevant numerical and experimental studies was therefore carried out to identify the values of undetermined coefficients. Related parameters of DMFC applied in CFD simulations are summarized in Appendix A, Table A1.
Numerical simulations were implemented using the CFD codes, Fluent 15.0, which is based on the finite volume method. The source terms ( and ), current density and the other manually defined parameters/conditions are all coded by User Defined Functions (UDFs), and integrated into the CFD model. Flow domain is discretized into structured grids consisting of 166,235 cells and 201,600 nodes. The boundary conditions of velocity inlet and pressure outlet are applied at the channel inlet and outlet, respectively, while no-slip conditions are employed for all walls. Other operating parameters, including methanol concentration, inlet velocity and temperature, are also defined at corresponding boundaries. The implicit and pressure-based solver is used to solve the governing equations of this incompressible flows, while the pressure-velocity coupling process is achieved by the SIMPLE algorithm. A numerical simulation is considered to be steady, if a stable value of is achieved through sufficient iterations.
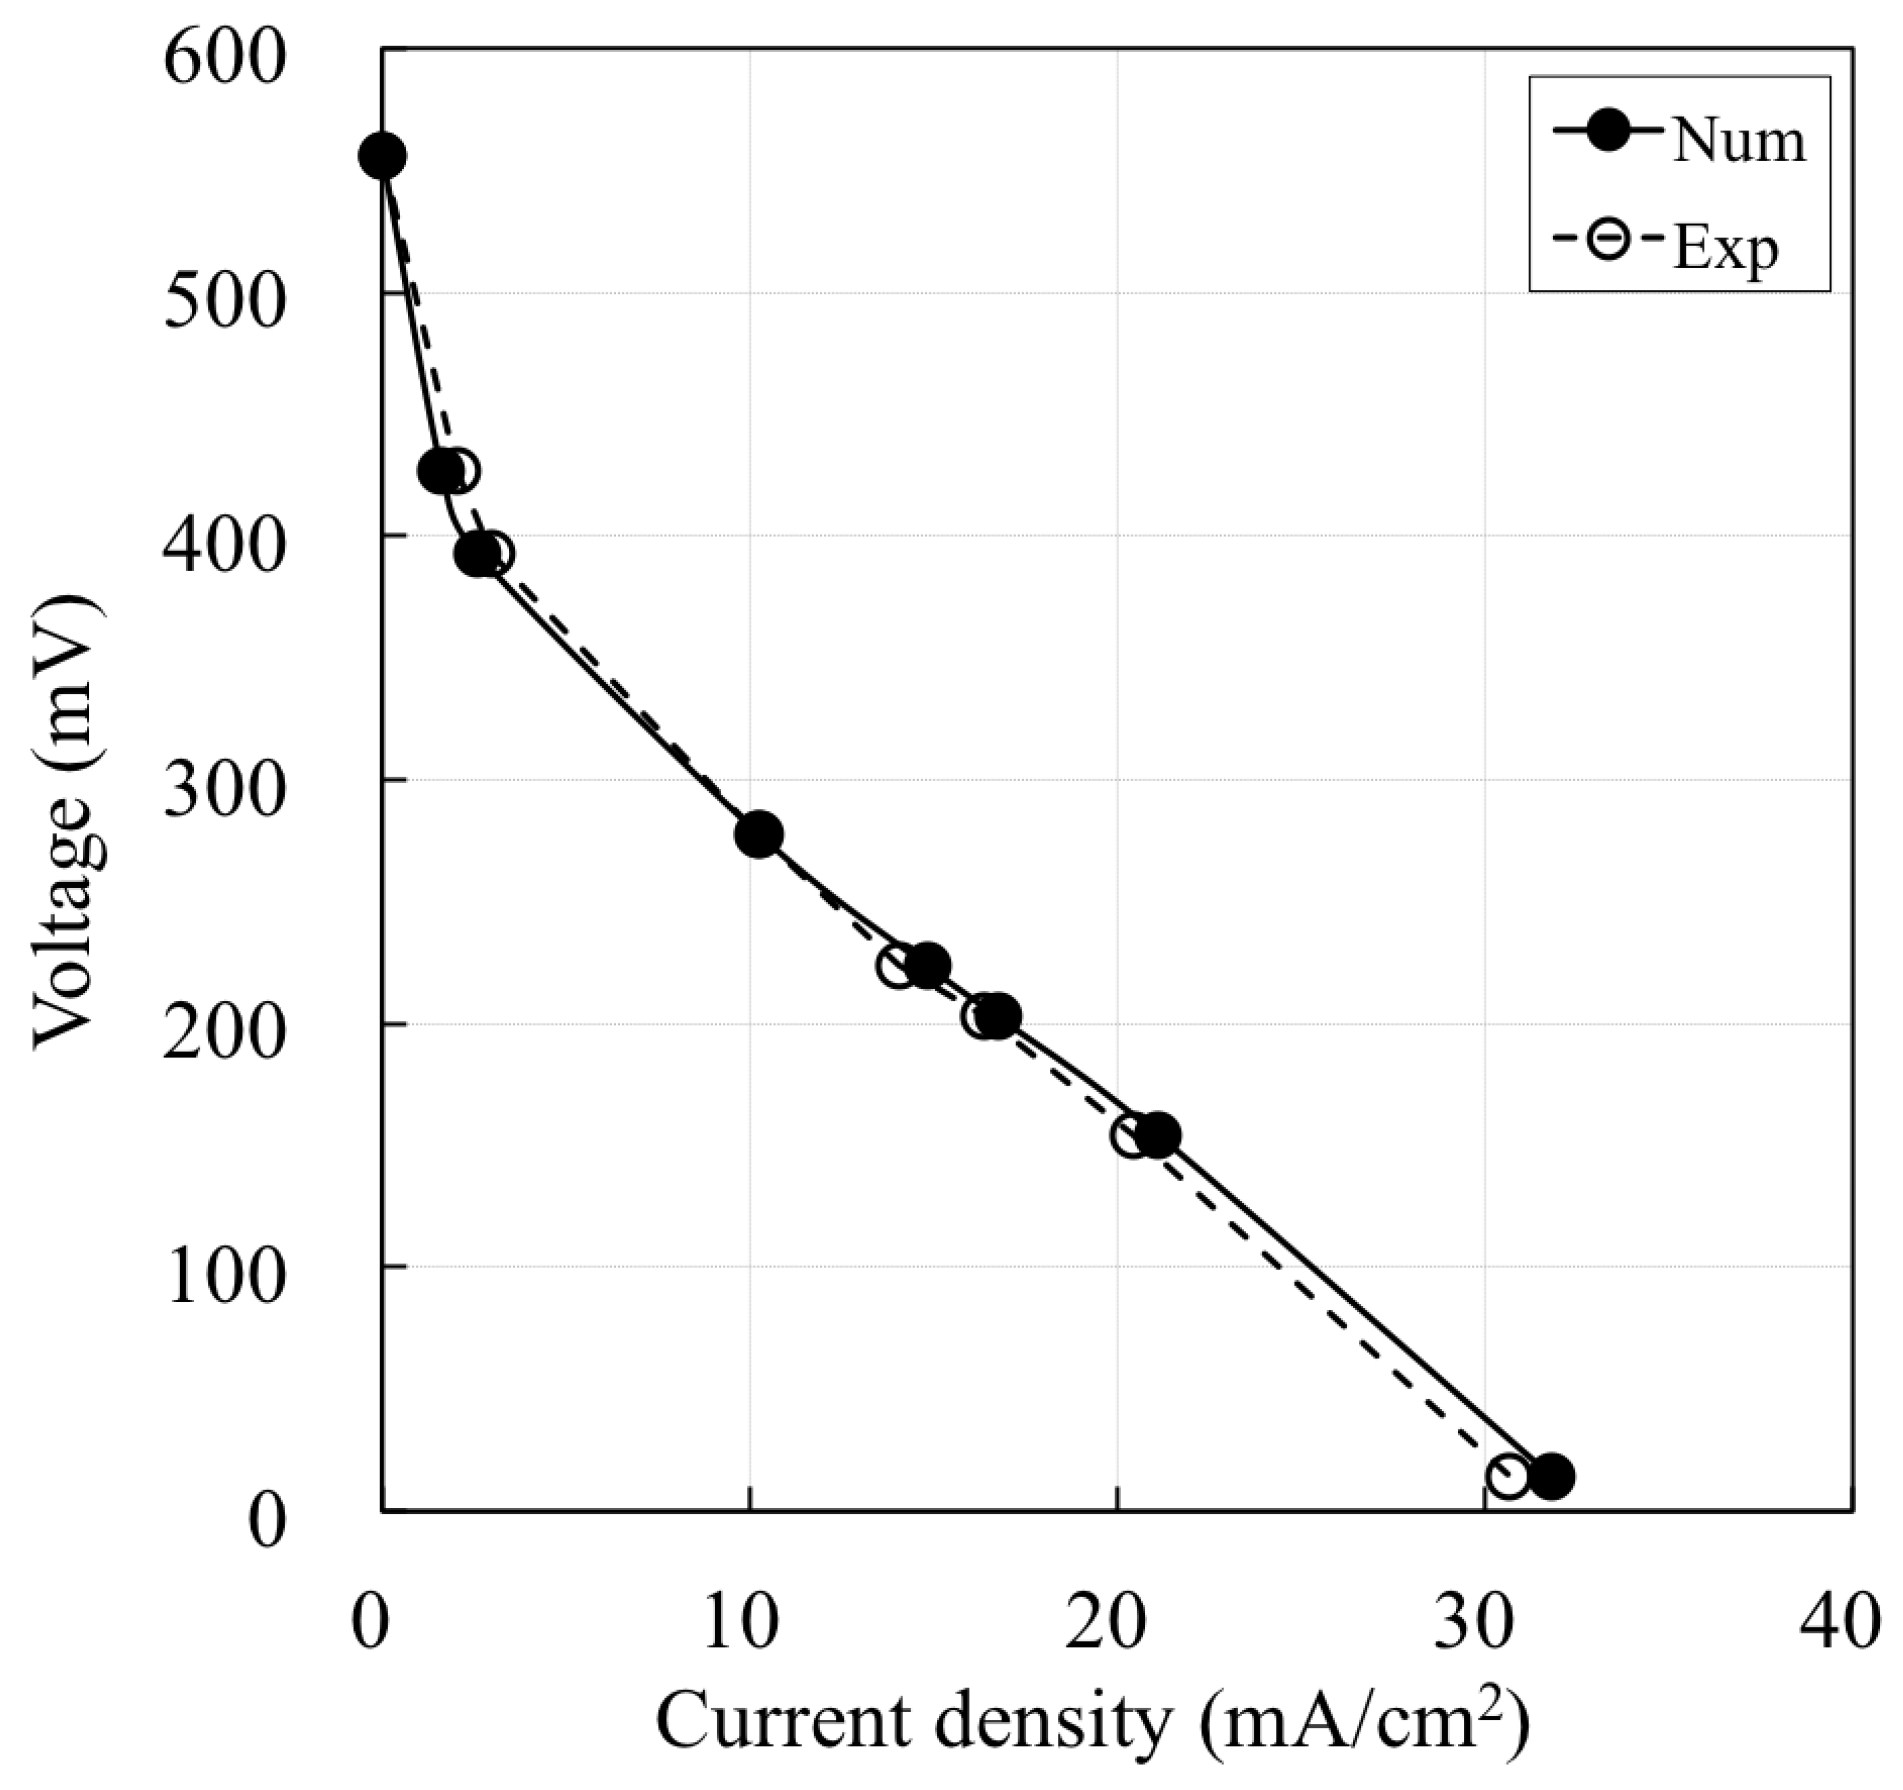
The energy conversion process of DMFC were experimentally investigated in [20]. For a given voltage (V), the currents (I) generated by a DMFC systems were measured and recorded. The relationship between the generated current and the applied voltage (I–V curve) obtained in experiments can be applied as reference data for numerical modeling. Figure 2 shows the comparison of I–V curves extracted from experimental and numerical results, respectively. It can be noted that the numerical predication coincides very well with experimental results, which validates the reliability and feasibility of the proposed numerical models of DMFC.
3. Results and Discussion
We focus on the combined effects of inlet flow rate and input methanol concentration on the energy conversion performance of a certain DMFC system in the present study. The geometric parameters of the DMFC system were chosen to be constant, which is based on a previous experimental work [20]. The cell is under closed circuit operations at a constant temperature of 343 K. The cell potential is chosen to be constant at V in the following results, unless otherwise stated. A unit conversion table for input flow rate is prepared for the convenience of the readers, as shown in Table A2.
Figure 3 shows the distributions of flow velocities on two typical planes, the interface plane between Channel and Diffusion layers (CD plane) and that between Diffusion and Catalyst layers (DC plane). Since the penetrating speed of membrane crossover is relatively low and the leak current density has not been discussed in this research, the fluid velocity on the interface plane between the Catalyst and PEM layers (CP plane) has not been presented here. In Figure 3, the methanol-water solution is pumped into the channel from the inlet at the top left corner. The flow velocity at the central area of the channel is found to be much larger than that near the boundary, which is mainly caused by the physical fact that the viscous drag (or called friction drag) is prominent near the boundary. Ribbed plates are located between these paralleled flow channels, on which there is no solution flow and the color for flow velocity is thus white. While the inlet velocity increases from 0.01 to 0.05 and to 0.107 m/s, the overall color of fluid velocities becomes brighter and lighter. It indicates that the increase of the inlet velocity is an effective strategy to accelerate the internal flow fields inside the DMFC. Since a sudden reverse of flow direction can usually result in an adverse pressure gradient, the flow fields usually become non-uniform at the U-turns under the effects of secondary flow and flow separation. This is why the highest flow velocities on CD plane are normally observed in vicinity of U-turns, as shown in Figure 3a (right). It can be observed in Figure 3b that the magnitude of flow velocities on the DC plane are much lower than that on the CD plane, while the flow field distributes more uniformly on the CD plane. The reason lies in the physical properties of diffusion layer, more specifically, the resistance of diffusion layer only allows a small amount of solution to permeate through to the catalyst layer, while its porosity makes the diffusion more uniform. More uniform flow distributions contribute to higher performances of DMFC [18]. It implies that the diffusion layer is a critical component, which deserves special attention in the design of high-performance DMFC.
The distributions of methanol concentrations on the CD, DC and CP planes were presented in Figure 4, respectively. It is well known that the distributions of methanol concentrations are highly relevant with the chemical reaction speed, which is thus critical for the energy conversion performance of DMFCs. As results of the serpentine arrangement of flow channels, the methanol solution was only allowed to be pumped into the system from the sole inlet at the top left corner. This is the reason why the highest methanol concentration occurs in the upstream channel, as shown in Figure 4a (left). It is also of interest to notice that the methanol concentration is higher near the channel boundary than at the channel center. Although it is different from the distribution of flow velocities, in which the highest velocity normally occurs at the central area of channel (see Figure 3), this result also makes sense according to the physical fact that the concentration of chemical reactant could accumulate at the region of low flow velocities. With a low inlet velocity of 0.01 m/s, the distribution of methanol concentration decreases gradually while the locating position changes from CD to DC, and to CP plane. It is mainly caused by the characteristics of flow fields, as the low-velocity penetrating flow can only transport a small amount of methanol from CD to CP plane. On the CP plane, the distribution of methanol concentration is more uniform than on the other planes. Since a more uniform methanol distribution implies a more stable energy conversion process, the feasibility and necessity of applying diffusion layer in a DMFC system are therefore confirmed by present results. From left to right, the methanol concentrations on all of the three typical planes are found to increase with the inlet velocity. Its reason lies in the “excessive” feed of solution by high flow rate, which gives rise to an accumulation of unreacted methanol inside the system. It reminds us of the idea to optimize the inlet flow velocity and input methanol concentration, for the sake of optimal energy conversion performances of DMFC.
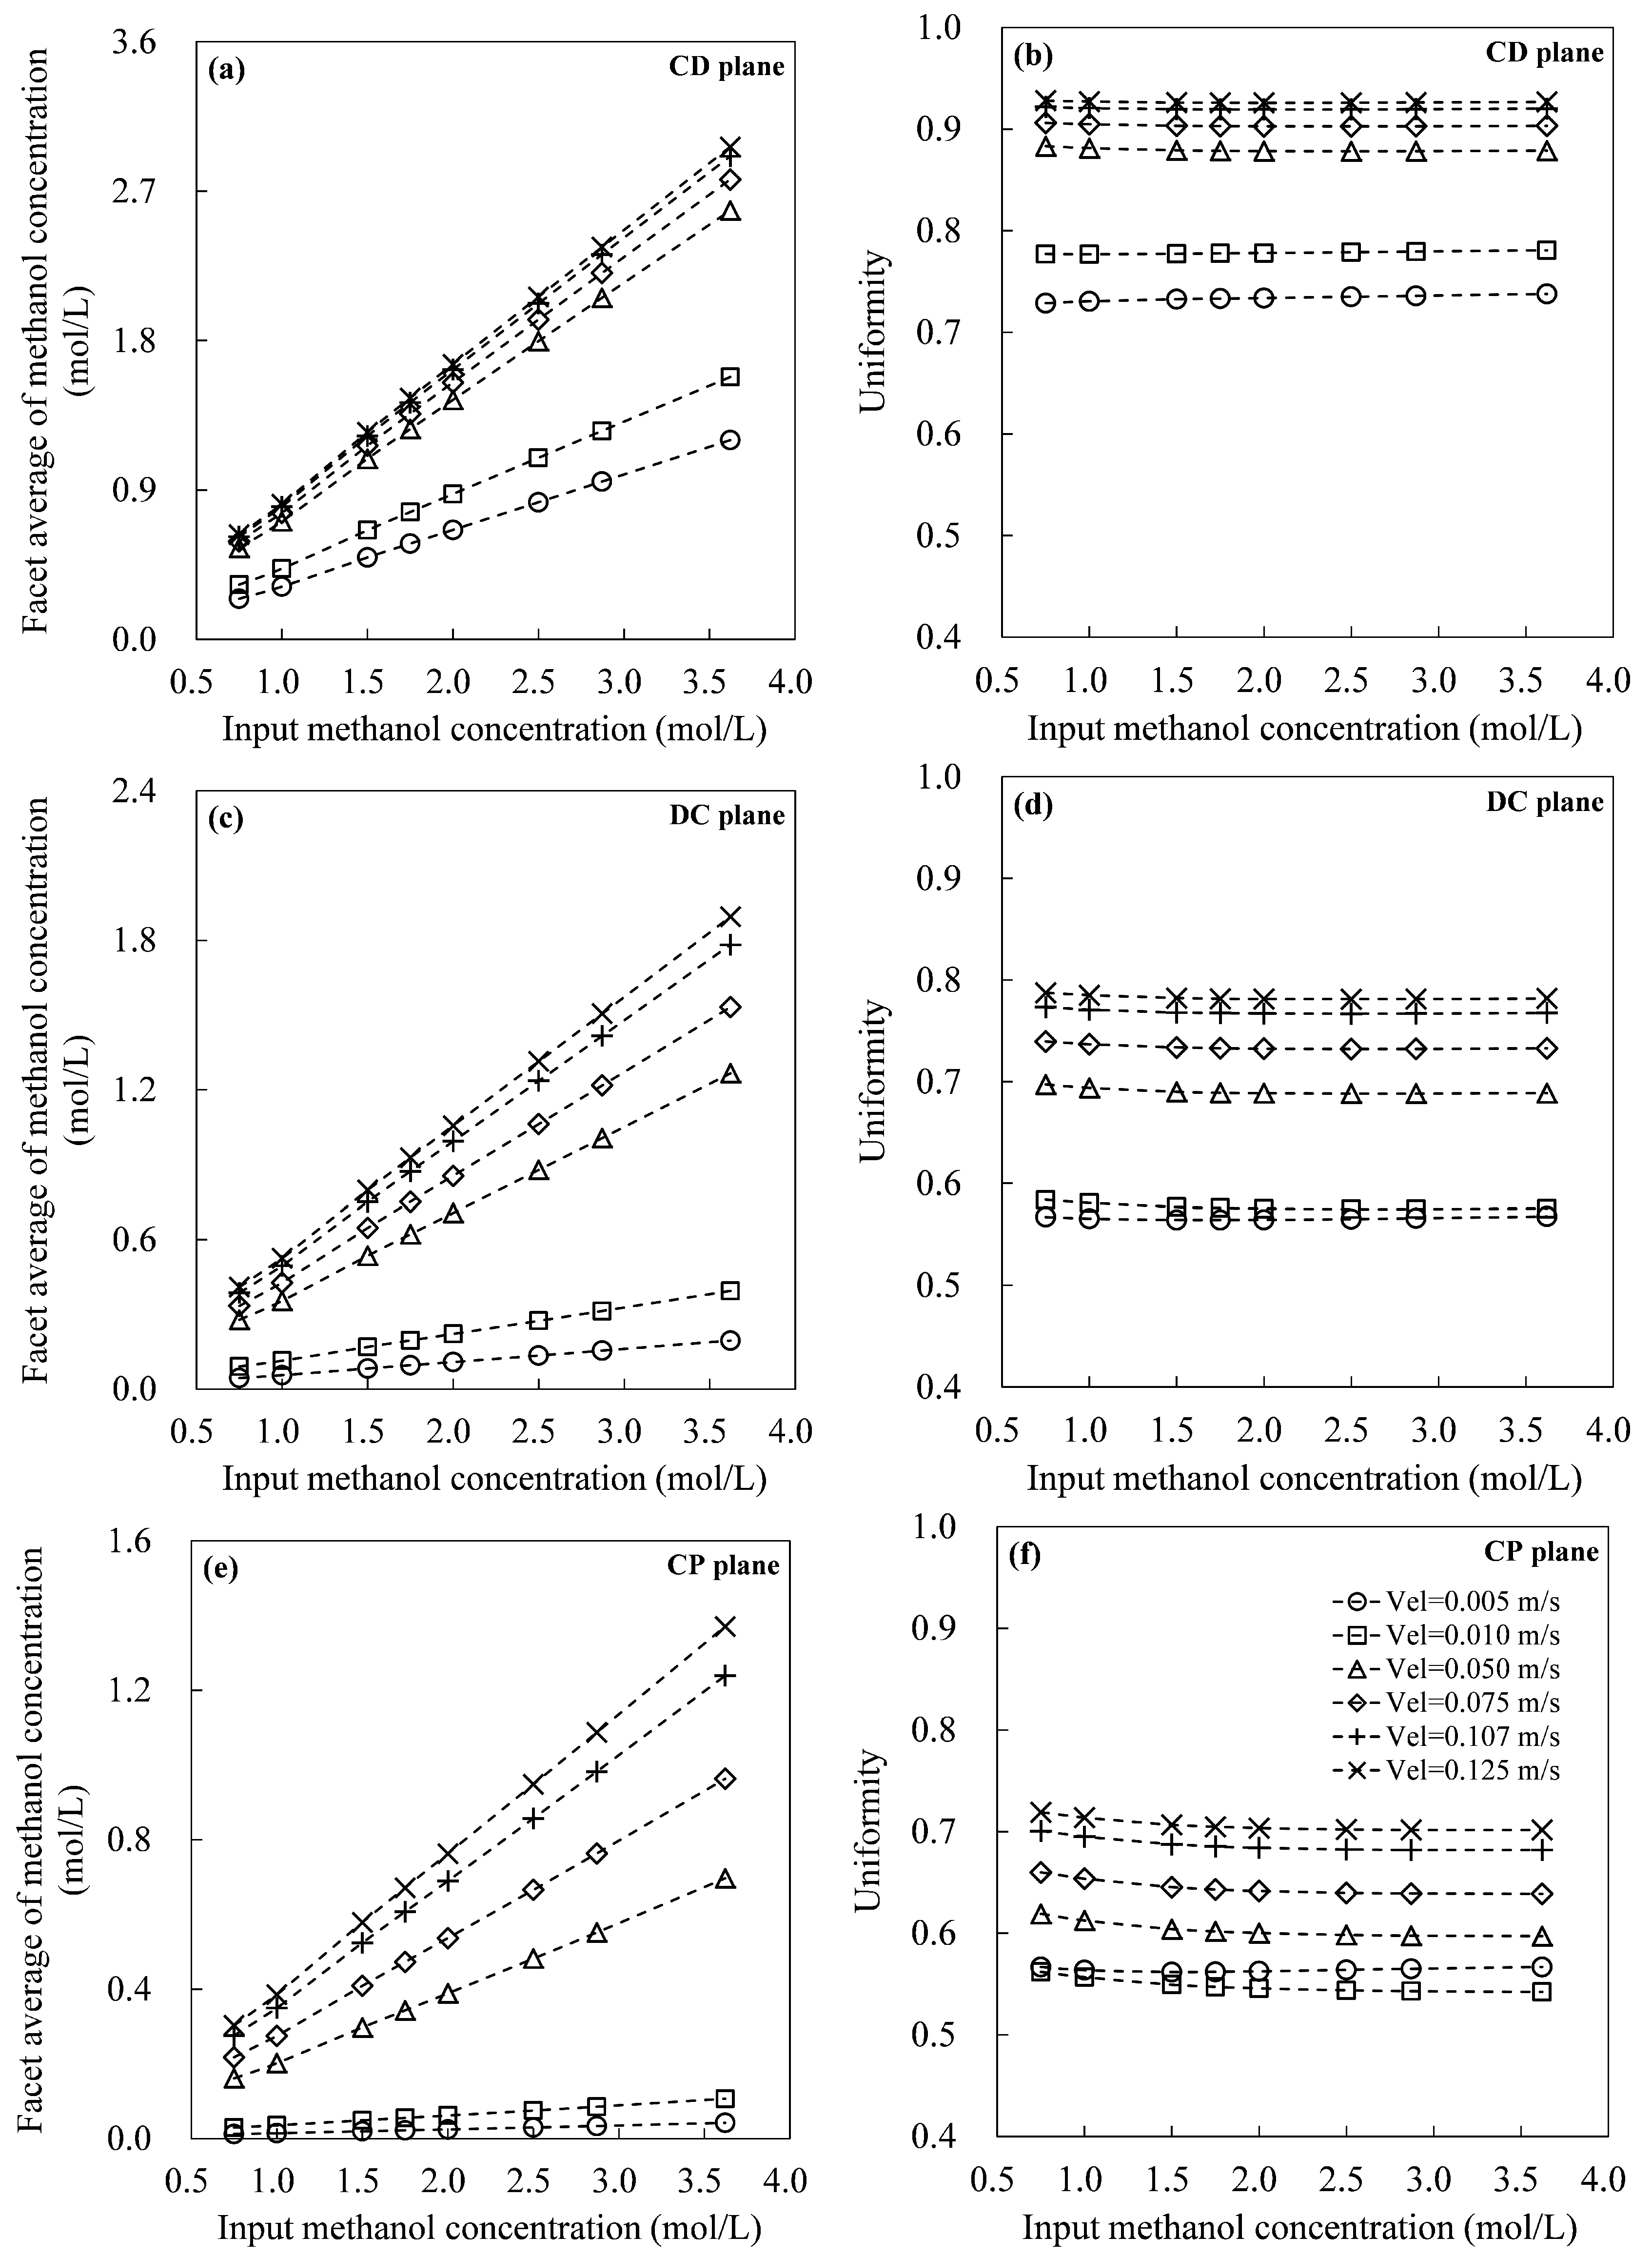
In considerations of the combined effects of input methanol concentrations and flow rates, systematic diagrams about the facet average and facet uniformity of methanol concentration distributing on the CD, DC and CP planes are also presented in Figure 5. The facet average and facet uniformity of methanol concentration was considered as two quantitative criteria for evaluating the methanol distribution on these typical planes, while the criterion of Weltens’ Uniformity Index (WUI) that was initially proposed to evaluate the uniformity of flow fields [25] is applied in present study to evaluate the uniformity of methanol distributions. It is defined as
where is the local methanol concentration, denotes the average methanol concentration and n is the number of sampling points. The (between 0 and 1) denotes the uniformity of distribution, and the larger the is, the more uniform the distribution is. The facet average of methanol concentration increases almost linearly with the input methanol concentration for all the three planes. For the same inlet velocity and input concentration, the facet average of methanol concentration is observed to decrease gradually from CD, DC to CP plane. It validates the former findings derived from Figure 4 in a quantitative way. On a specific plane, the slopes of fit lines can be observed being relatively small for the input flow rate of 0.005 m/s, but being much higher for a flow rate of 0.125 m/s. This phenomenon also exists for the other flow rates. More precisely, the slopes of fit lines increase gradually as the inlet flow velocity arises. A higher slope indicates that the same change in input methanol concentration can lead to a larger increase in the facet average of methanol concentration. It indicates that the facet average of methanol concentration can increase more rapidly with the input methanol concentration, if a larger flow rate is applied at the inlet. It also reminds us that a quick increase in facet average of methanol concentration required in practice need to be achieved by increasing both the inlet velocity and input concentration. These quantitative results can be treated as numerical database, which would be highly beneficial for experimental analysis and also for predicting the optimal operating conditions of DMFC systems.
From Figure 5b,d,f, the uniformity of methanol concentration distribution can be found to decrease gradually from the CD, DC to CP plane for almost all the input flow rates, excluding the conditions of 0.005 and 0.01 m/s on the CP plane. Furthermore, the uniformity generally increases with input flow rate for all the three planes, excluding the conditions of input flow rate 0.005 and 0.01 m/s on the CD plane. From Figure 5b, it can be found that the input methanol concentration has little effect on the uniformity of methanol concentration distributing on CD plane. However, it is different on DC and CP planes (Figure 5d,f), in which the uniformity changes obviously with input methanol concentration, especially when it is lower than 2.0 mol/L. On the DC and CP planes, it can be found that the uniformity decreases first with the increase of input methanol concentration until the methanol concentration reaches 1.5 mol/L, and then stays at a constant value, especially for the cases of input flow velocities 0.005 and 0.01 m/s. It reminds us that special attention should be paid when a low input concentration is applied, as a performance change of DMFC might be caused by the variation of distribution uniformity.
The distributions of current density on the CP plane were also presented in Figure 6, for the purpose of a preliminary analysis on the combined effects of input flow rate and methanol concentration on the electrochemical characteristics of this DMFC system. As is known to all that the speed of energy conversion process depends largely on the local methanol concentration, the local current density presented in Figure 6 was found to be large at those high methanol concentration area (see Figure 4), and, therefore, ribbed distributions of current density were found for all those operating conditions. With a constant input methanol concentration, e.g., 1.0 mol/L as shown in Figure 6a, the overall color of current density distribution becomes lighter and brighter with the increase of input flow rate. It is in good agreement with the experimental evidence that the more the methanol (fuel) is pumped into a certain energy conversion system, the more the energy can be generated [9,10,18]. With a constant input flow rate, the low current density region (in dark blue) decreases gradually with the increase of input methanol concentrations, which is apparent for a low input flow rate of 1.0 mol/L (see the left column of Figure 6). It implies that a low input of methanol would not be beneficial to the energy conversion efficiency of a DMFC system. However, the optimal operating conditions can not be simply deduced from those diagrams, a systematic analysis on the current density variations under the combined effects of inlet flow rate and input methanol concentration is still necessary.
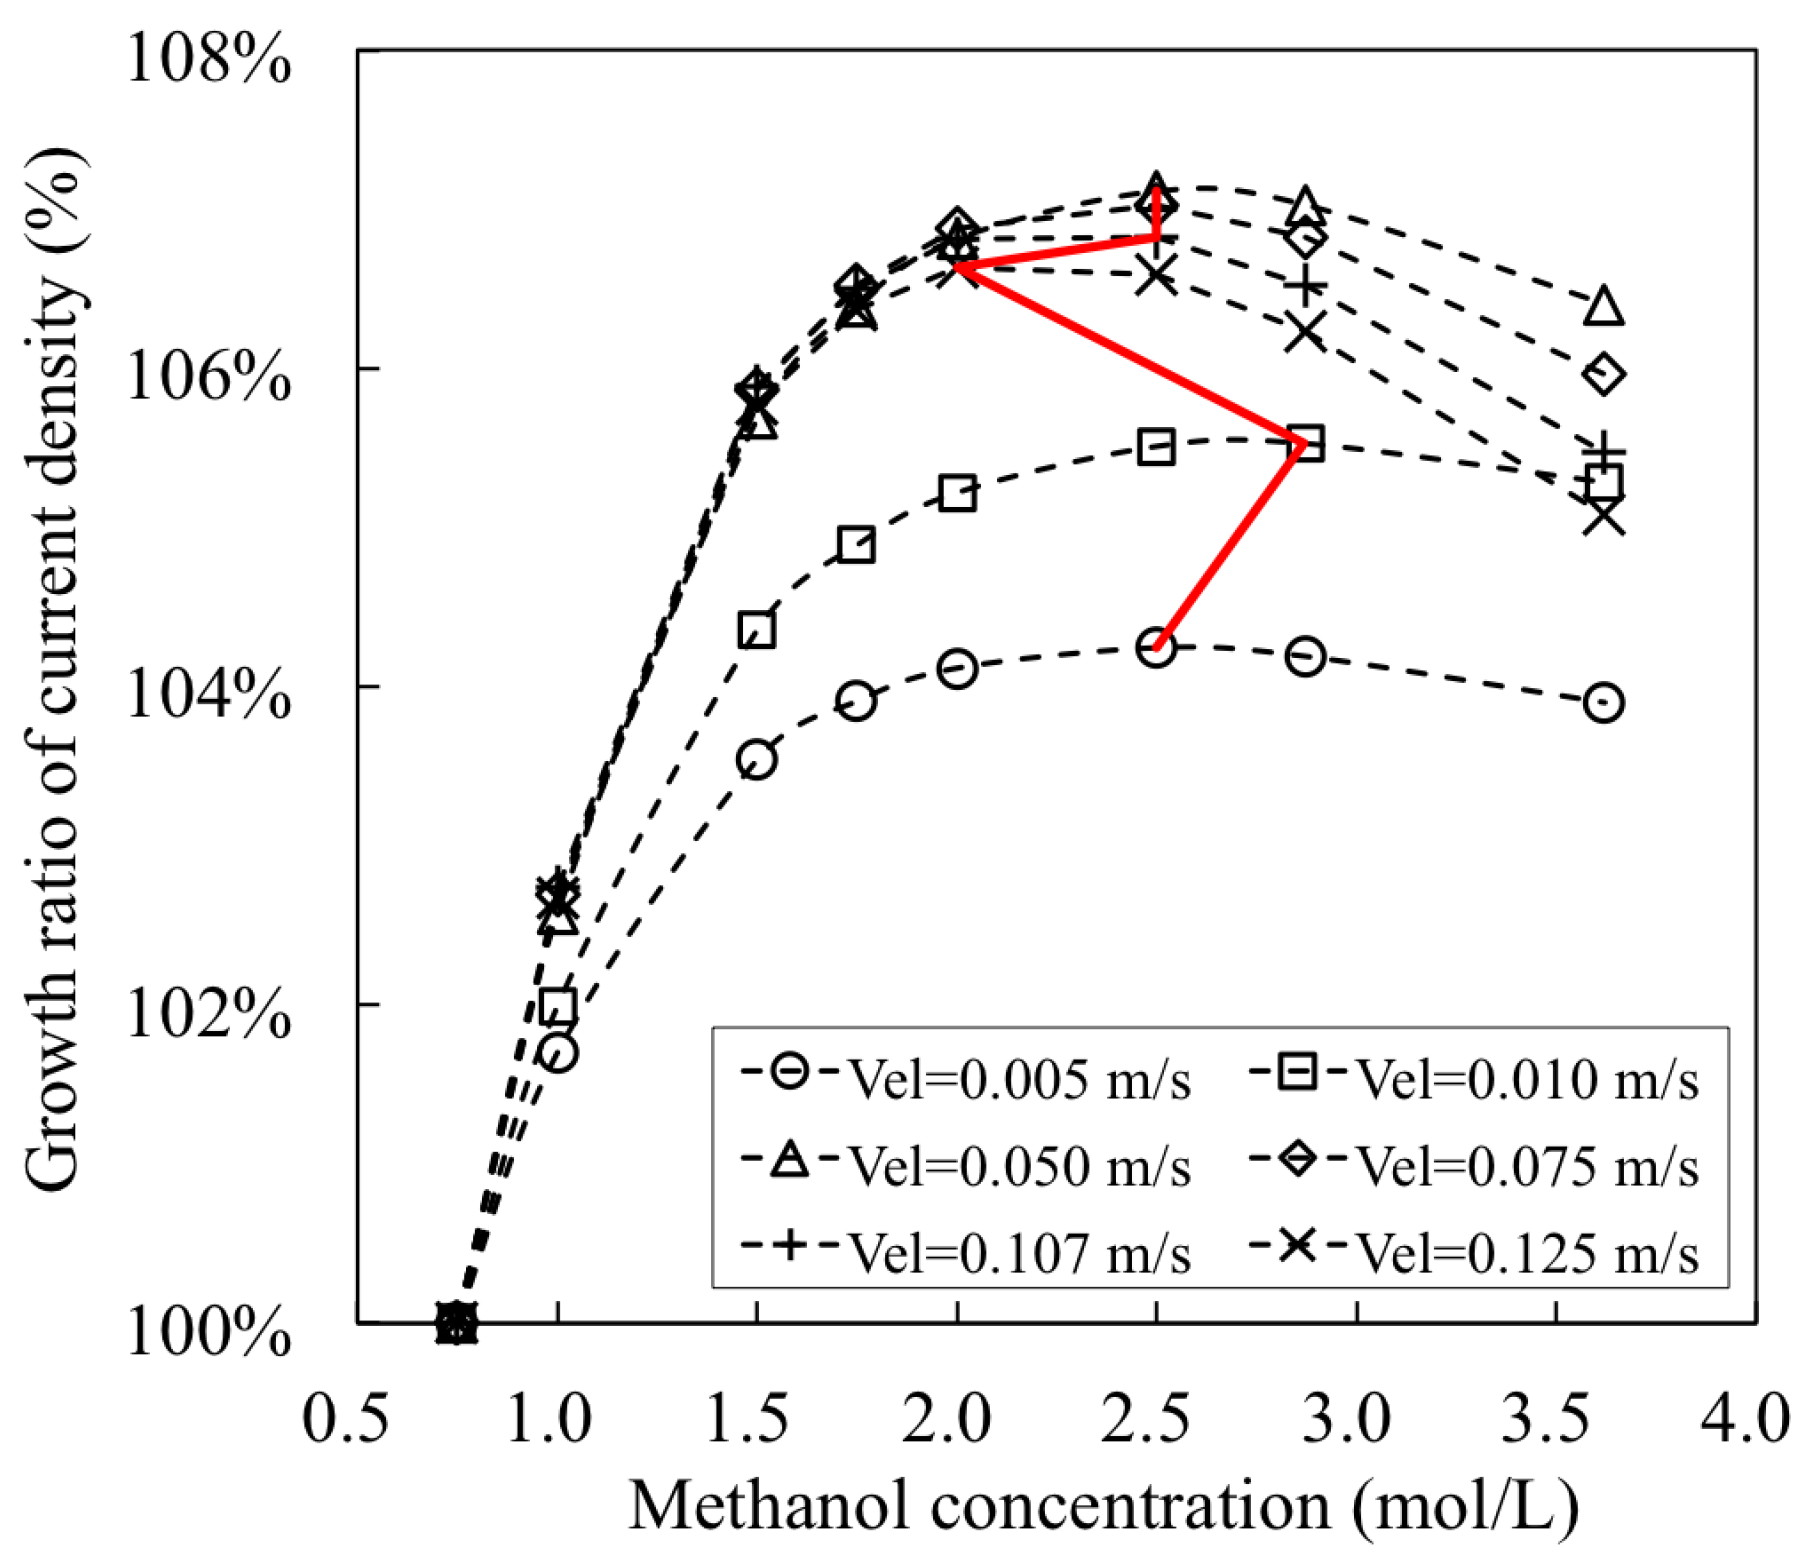
Considering the inlet methanol concentration of 0.75 mol/L as a reference state, the current density at the reference state is recognized as . The criterion called growth ratio is proposed to evaluate the increase of power output of DMFC at a constant voltage, which is defined as
where i denotes the generated current density at a given condition of inlet flow velocity and input methanol concentration. The coupling effects of input methanol concentration and inlet flow velocity on the growth ratio were analyzed and summarized, which is shown in Figure 7. Taking the case of inlet velocity m/s, for example, the relationship between the growth ratio and the input methanol concentration is nonlinear; more specifically, an increase of input methanol concentration will not always bring out an increase of power output. It can be noted that the growth ratio increases with input methanol concentration until its maximum value is achieved (signed by red dot); thereafter, it decreases as input methanol concentration continues rising. More curves of the growth ratio to input methanol concentration can be obtained as inlet flow velocity varies from 0.005 to 0.125 m/s. A red line can be noticed in Figure 7, which is plotted by connecting all the maximum value. With the help of this red line, one can easily determine the frontier for optimal operations with the largest increase of power output, as well as the optimal operating conditions of input methanol concentration and inlet flow velocity. The proposed frontier for optimal operations can be highly beneficial in practical applications to improve the energy conversion performance of DMFC.
4. Conclusions
Considering the effect of oxygen availability, a modified 3D numerical model about the energy conversion process of DMFC was constructed by coupling the equations of species transport, mass and momentum conservations. Its reliability and feasibility were validated by the comparisons of numerical and experimental results. Systematic numerical simulations were performed to investigate the underlying mechanism of energy conversion process, as well as the effects of operating parameters on DMFC performance. Main findings can be summarized as follows:
- (1)
- A parameter was introduced to quantify the effect of oxygen availability in model construction. It can be one of the earliest studies, to the best of our knowledge, for considering the experimental facts that DMFC’s performance depends largely on the air flow rate.
- (2)
- Flow characteristics inside the DMFC system were systematically examined by numerical simulations. The increasing of inlet velocity was observed to be an effective strategy to accelerate the internal flow fields in DMFC. Careful analysis was also carried out on the the distributions of methanol concentration on three typical planes. From a hydrodynamic point of view, the diffusion layer is a critical component in the design of high-performance DMFC, as it was observed to be highly associated with the distribution uniformities of both flow velocity and methanol concentration.
- (3)
- The combined effects of inlet flow rate and input methanol concentration on the facet average (also the facet uniformity) of methanol concentration were summarized. The simultaneous increases in both flow velocity and methanol concentration were proposed to be applied, if a quick increase in facet average of methanol concentration is required in practice. The proposed quantitative results can be used as a numerical database to analyze experimental results in future. The frontier for optimal conditions of DMFC’s output were determined, which is helpful to improve the energy conversion performance of DMFC in practical applications.
Acknowledgments
This project was supported by the National Natural Science Foundation of China (No. 11402084, 51505136 and 11572203), the Natural Science Foundation of Hunan Province (No. 2015JJ3051 and 2017JJ3018), the self-determined project of State Key Laboratory of Advanced Design and Manufacturing for Vehicle Body (No. 51475002) and the Fundamental Research Funds for the Central Universities (Hunan University).
Author Contributions
X.Q. Hu and Q.W. Yang conceived and designed the research work, analyzed the data and wrote the paper together; X.Y. Wang and J.Z. Chen performed the numerical simulations; D.P. Jin performed the experiments; Q. Xin contributed analysis tools and valuable ideas in data analysis.
Conflicts of Interest
We declare that we have no financial and personal relationships with other people or organizations that can inappropriately influence our work, there is no professional or other personal interest of any nature or kind in any product, service and/or company that could be construed as influencing the position presented in, or the review of, this manuscript.
Abbreviations
The following abbreviations are used in this manuscript:
| DMFC | Direct Methanol Fuel Cell |
| CFD | Computational Fluid Dynamics |
| PEM | Polymer Electrolyte Membrane |
| WUI | Weltens’ Uniformity Index |
| CD plane | Interface plane between Channel and Diffusion layers |
| DC plane | Interface plane between Diffusion and Catalyst layers |
| CP plane | Interface plane between Catalyst and PEM layers |
Appendix A

Table A1.
Parameters of the Direct Methanol Fuel Cell (DMFC system for numerical simulations.
| Definition | Notation | Value | Unit | Ref. |
|---|---|---|---|---|
| Water density | 1000 | kg· m | [20] | |
| Water viscosity | kg· ms | [26] | ||
| Air density | 1.29 | kg· m | [20] | |
| Air viscosity | kg· ms | [26] | ||
| Diffusion coefficient | ms | [26] | ||
| of in water | ||||
| Diffusion coefficient | ms | [26] | ||
| of in water | ||||
| Permeability of | m | [20] | ||
| diffusion layer | ||||
| Permeability of | m | [20] | ||
| catalyst layer | ||||
| Porosity of | 0.6 | − | [20] | |
| diffusion layer | ||||
| Porosity of | 0.4 | − | [20] | |
| catalyst layer | ||||
| Faraday constant | F | C· k mol | [17] | |
| Gas constant | R | J molK | [17] | |
| Molecular weight | 0.032 | kg· mol | [17] | |
| of | ||||
| Molecular weight | 0.018 | kg· mol | [17] | |
| of | ||||
| Molecular weight | 0.044 | kg· mol | [27] | |
| of | ||||
| Molecular weight | 0.032 | kg· mol | [27] | |
| of | ||||
| Electro-osmotic drag | − | [28] | ||
| coefficient of | ||||
| Electro-osmotic drag | − | [14] | ||
| coefficient of | ||||
| Oxygen availability | 1.75 | − | Determined from Exp. |
Table A2.
Unit conversion table for input flow rate.
| Unit | Value | |||||
|---|---|---|---|---|---|---|
| m/s | 0.005 | 0.010 | 0.050 | 0.075 | 0.107 | 0.125 |
| ccm | 0.2055 | 0.4110 | 2.0550 | 3.0825 | 4.4000 | 5.1375 |
References
- Dillon, R.; Srinivasan, S.; Aricò, A.S.; Antonucci, V. International activities in DMFC R&D: Status of technologies and potential applications. J. Power Sources 2004, 127, 112–126. [Google Scholar]
- Guo, Z.; Faghri, A. Development of planar air breathing direct methanol fuel cell stacks. J. Power Sources 2006, 160, 1183–1194. [Google Scholar] [CrossRef]
- Liu, H.; Song, C.; Zhang, L.; Zhang, J.; Wang, H.; Wilkinson, D.P. A review of anode catalysis in the direct methanol fuel cell. J. Power Sources 2006, 155, 95–110. [Google Scholar] [CrossRef]
- Liu, X.; Zhang, B.; Zhang, Y.; He, H.; Li, J.; Wang, S.; Yuan, Z.; Deng, H. Development and characterization of a novel air-breathing micro direct methanol fuel cell stack for portable applications. J. Micromech. Microeng. 2010, 20, 104008. [Google Scholar] [CrossRef]
- Feng, L.; Cai, W.; Li, C.; Zhang, J.; Liu, C.; Xing, W. Fabrication and performance evaluation for a novel small planar passive direct methanol fuel cell stack. Fuel 2012, 94, 401–408. [Google Scholar] [CrossRef]
- San Martín, I.; Ursúa, A.; Sanchis, P. Modelling of PEM fuel cell performance: Steady-state and dynamic experimental validation. Energies 2014, 7, 670–700. [Google Scholar] [CrossRef]
- Wang, L.; He, M.; Hu, Y.; Zhang, Y.; Liu, X.; Wang, G. A “4-cell” modular passive DMFC (direct methanol fuel cell) stack for portable applications. Energy 2015, 82, 229–235. [Google Scholar] [CrossRef]
- Barbera, O.; Stassi, A.; Sebastian, D.; Bonde, J.L.; Giacoppo, G.; D’Urso, C.; Baglio, V.; Aricò, A.S. Simple and functional direct methanol fuel cell stack designs for application in portable and auxiliary power units. Int. J. Hydrogen Energy 2016, 41, 12320–12329. [Google Scholar] [CrossRef]
- Na, Y.; Zenith, F.; Krewer, U. Increasing fuel efficiency of direct methanol fuel cell systems with feedforward control of the operating concentration. Energies 2015, 8, 10409–10429. [Google Scholar] [CrossRef]
- Vinh, N.D.; Kim, H.M. Comparison of numerical and experimental studies for flow-field optimization based on under-rib convection in polymer electrolyte membrane fuel cells. Energies 2016, 9, 844. [Google Scholar] [CrossRef]
- Ko, J.; Chippar, P.; Ju, H. A one-dimensional, two-phase model for direct methanol fuel cells-Part I: Model development and parametric study. Energy 2010, 35, 2149–2159. [Google Scholar] [CrossRef]
- Birgersson, E.; Nordlund, J.; Ekström, H.; Vynnycky, M.; Lindbergh, G. Reduced two-dimensional one-phase model for analysis of the anode of a DMFC. J. Electrochem. Soc. 2003, 150, A1368–A1376. [Google Scholar] [CrossRef]
- Yan, T.Z.; Jen, T.C. Two-phase flow modeling of liquid-feed direct methanol fuel cell. Int. J. Heat Mass Transf. 2008, 51, 1192–1204. [Google Scholar] [CrossRef]
- Ge, J.; Liu, H. A three-dimensional mathematical model for liquid-fed direct methanol fuel cells. J. Power Sources 2006, 160, 413–421. [Google Scholar] [CrossRef]
- Danilov, V.A.; Lim, J.; Moon, I.; Changb, H. Three-dimensional, two-phase, CFD model for the design of a direct methanol fuel cell. J. Power Sources 2006, 162, 992–1002. [Google Scholar] [CrossRef]
- Yang, W.W.; Zhao, T.S.; Xu, C. Three-dimensional two-phase mass transport model for direct methanol fuel cells. Electrochim. Acta 2007, 53, 853–862. [Google Scholar] [CrossRef]
- Vera, M. A single-phase model for liquid-feed DMFCs with non-Tafel kinetics. J. Power Sources 2007, 171, 763–777. [Google Scholar] [CrossRef]
- Yang, Q.; Kianimanesh, A.; Freiheit, T.; Park, S.S.; Xue, D. A semi-empirical model considering the influence of operating parameters on performance for a direct methanol fuel cell. J. Power Sources 2011, 196, 10640–10651. [Google Scholar] [CrossRef]
- Kianimanesh, A.; Yu, B.; Yang, Q.; Freiheit, T.; Xue, D.; Park, S.S. Investigation of bipolar plate geometry on direct methanol fuel cell performance. Int. J. Hydrogen Energy 2012, 37, 18403–18411. [Google Scholar] [CrossRef]
- Yu, B.; Yang, Q.; Kianimanesh, A.; Freiheit, T.; Park, S.S.; Zhao, H.; Xue, D. A CFD model with semi-empirical electrochemical relationships to study the influence of geometric and operating parameters on DMFC performance. Int. J. Hydrogen Energy 2013, 38, 9873–9885. [Google Scholar] [CrossRef]
- Jeng, K.T.; Chen, C.W. Modeling and simulation of a direct methanol fuel cell anode. J. Power Sources 2002, 112, 367–375. [Google Scholar] [CrossRef]
- He, Y.L.; Li, X.L.; Miao, Z.; Liu, Y.W. Two-phase modeling of mass transfer characteristics of a direct methanol fuel cell. Appl. Therm. Eng. 2009, 29, 1998–2008. [Google Scholar] [CrossRef]
- Le, A.D.; Zhou, B. A general model of proton exchange membrane fuel cell. J. Power Sources 2008, 182, 197–222. [Google Scholar] [CrossRef]
- Sivertsen, B.R.; Djilali, N. CFD-based modelling of proton exchange membrane fuel cells. J. Power Sources 2005, 141, 65–78. [Google Scholar] [CrossRef]
- Weltens, H.; Bressler, H.; Terres, F.; Neumaier, H.; Rammoser, D. Optimisation of Catalytic Converter Gas Flow Distribution by CFD Prediction. SAE Pap. 1993, 930780. [Google Scholar]
- Wang, Z.H.; Wang, C.Y. Mathematical modeling of liquid-feed direct methanol fuel cells. J. Electrochem. Soc. 2003, 150, A508–A519. [Google Scholar] [CrossRef]
- Divisek, J.; Fuhrmann, J.; Gärtner, K.; Jung, R. Performance modeling of a direct methanol fuel cell. J. Electrochem. Soc. 2003, 150, A811–A825. [Google Scholar] [CrossRef]
- Guo, H.; Ma, C.F. 2D analytical model of a direct methanol fuel cell. Electrochem. Commun. 2004, 6, 306–312. [Google Scholar] [CrossRef]
Figure 1.
Schematic of a direct methanol fuel cell (DMFC) with serpentine flow channel.

Figure 2.
Comparison of numerical and experimental I–V curves. The methanol concentration and flow rate at the inlet are 1.5 mol/L and 1.107 m/s, respectively.
Figure 2.
Comparison of numerical and experimental I–V curves. The methanol concentration and flow rate at the inlet are 1.5 mol/L and 1.107 m/s, respectively.

Figure 3.
Velocity distribution of methanol-water solution on two typical planes. (a) is on the interface plane between the channel and diffusion layers (CD plane); while (b) is between the diffusion and catalyst layers (DC plane). From left to right, the mean velocity at inlet varies from 0.01, 0.05 to 0.107 m/s.
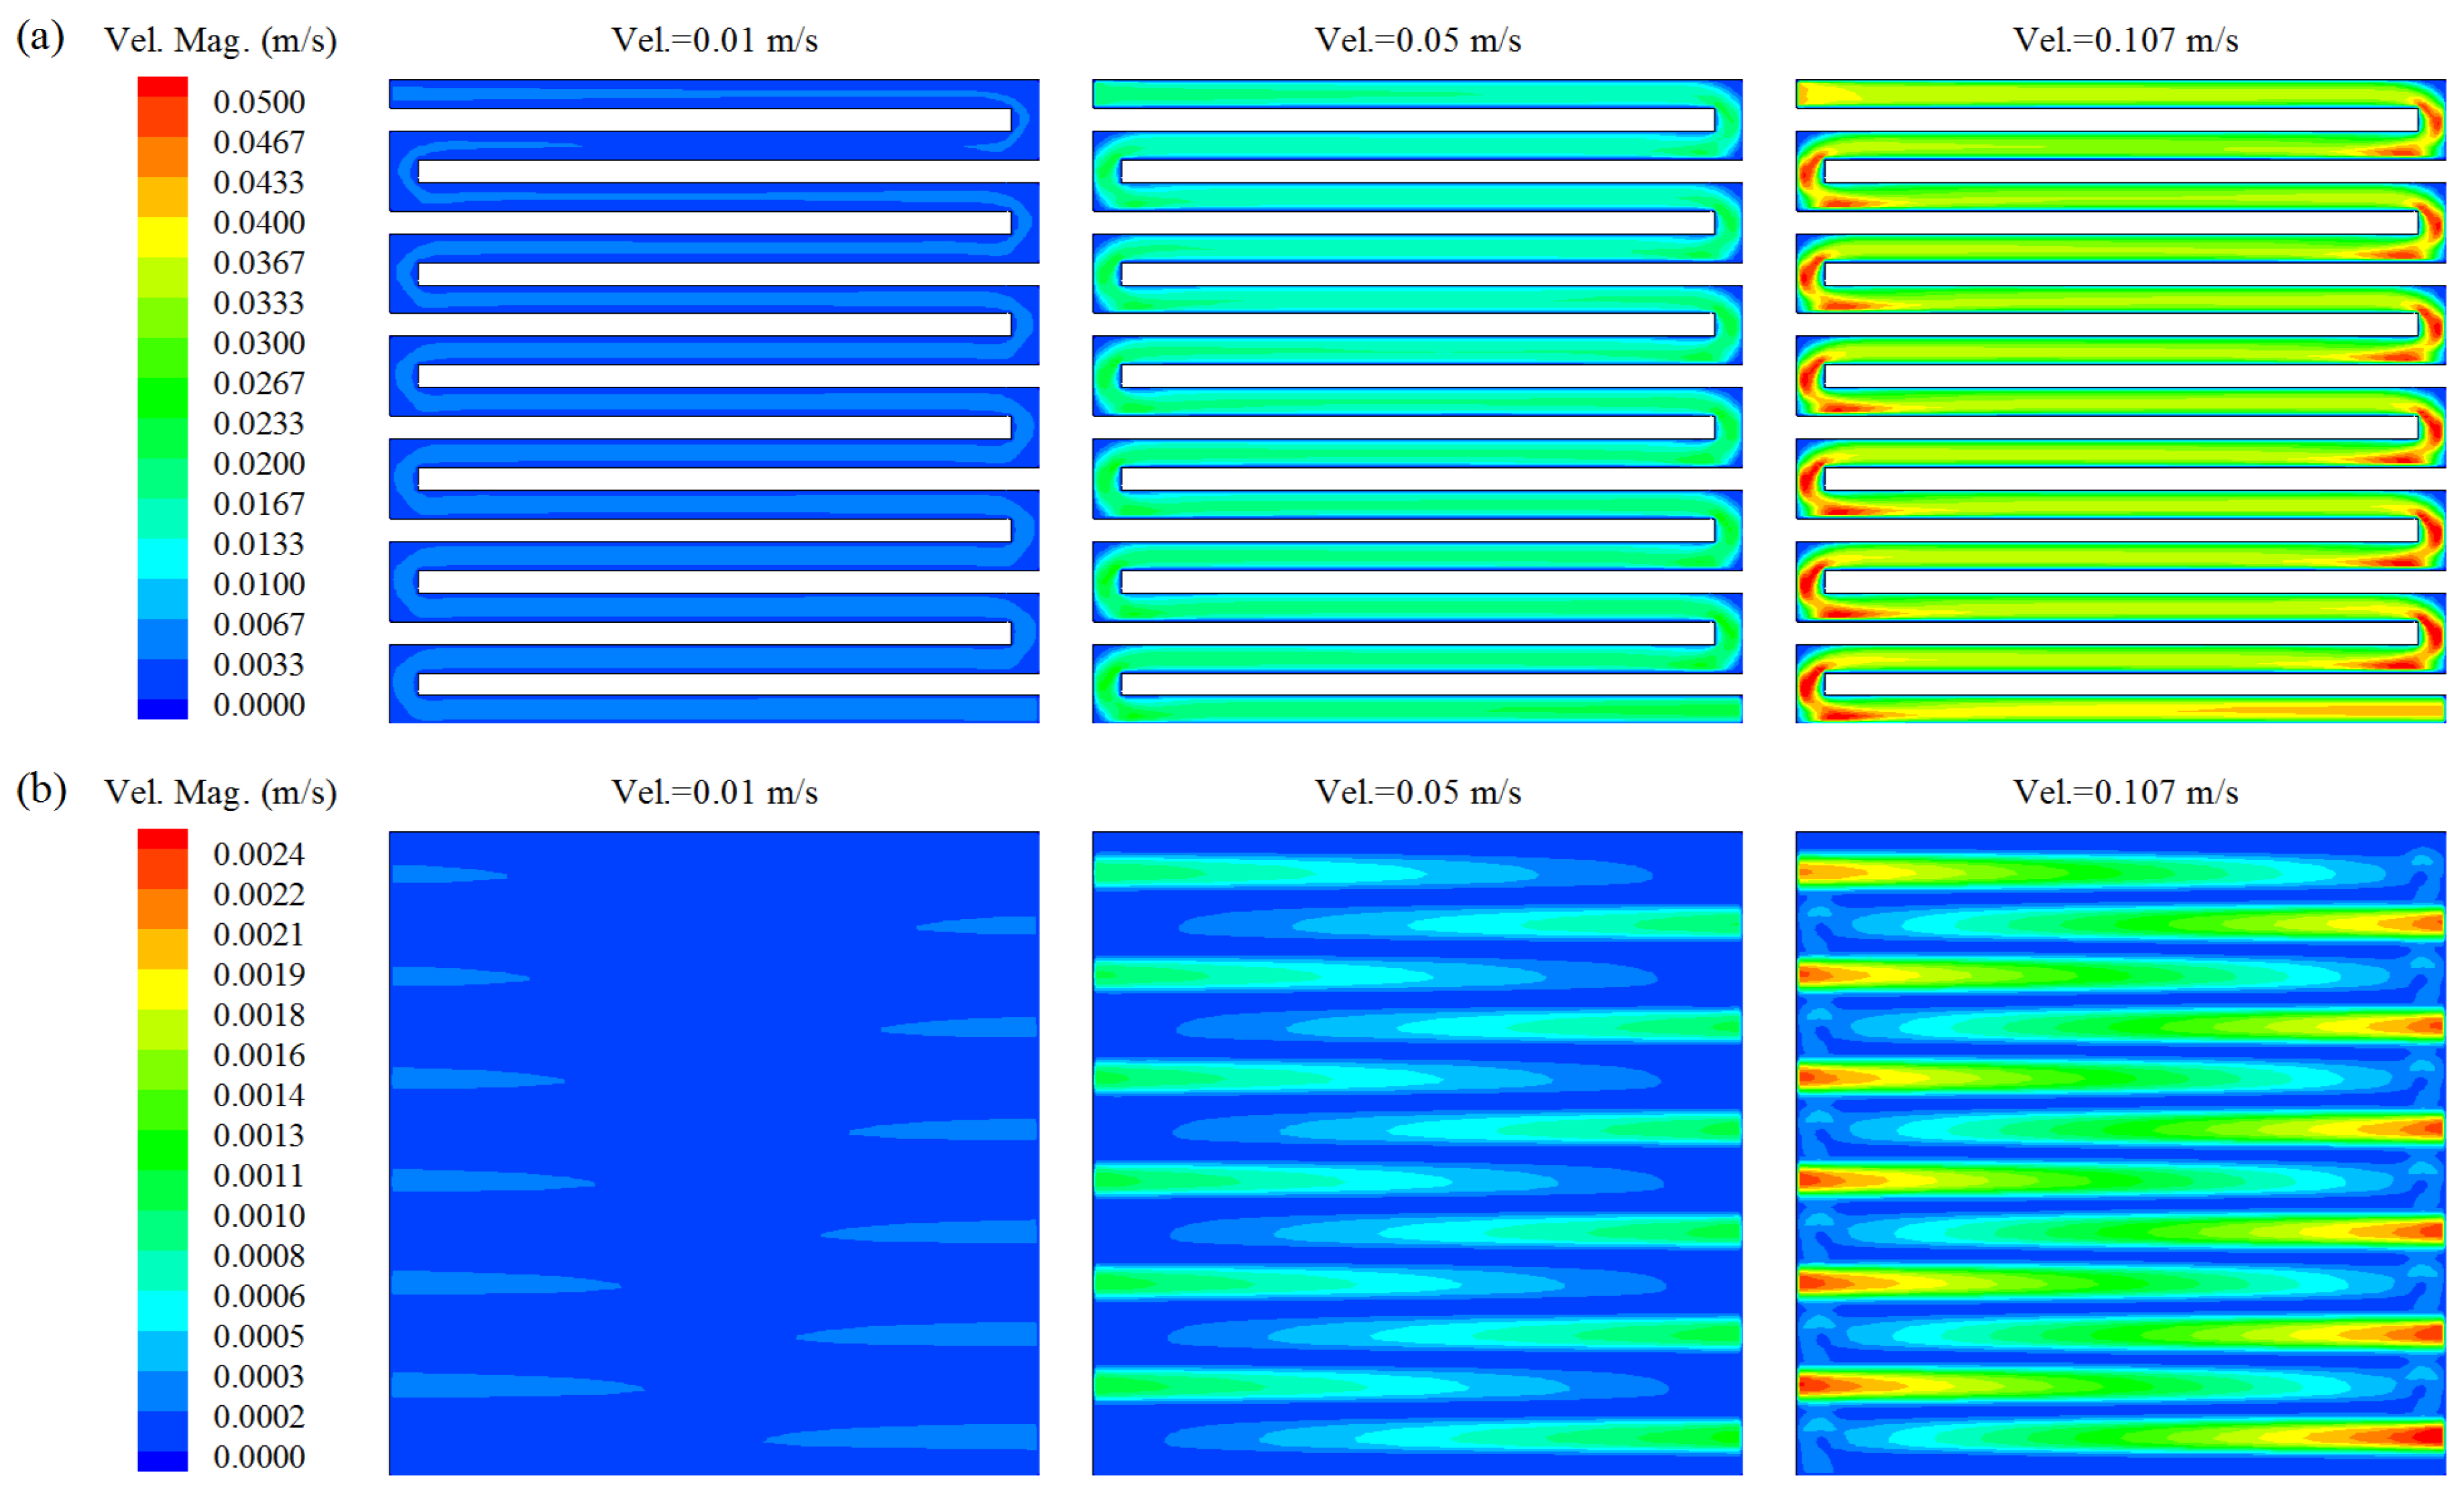
Figure 4.
Distribution of methanol concentration on three typical planes. (a) is on the interface plane between the channel and diffusion layers (CD plane); (b) is between the diffusion and catalyst layers (DC plane); and (c) is between the catalyst and PEM layers (CP plane). The methanol concentration at the inlet is constant at 1.5 mol/L, while the velocity at inlet varies from 0.01, 0.05 to 0.107 m/s from left to right.
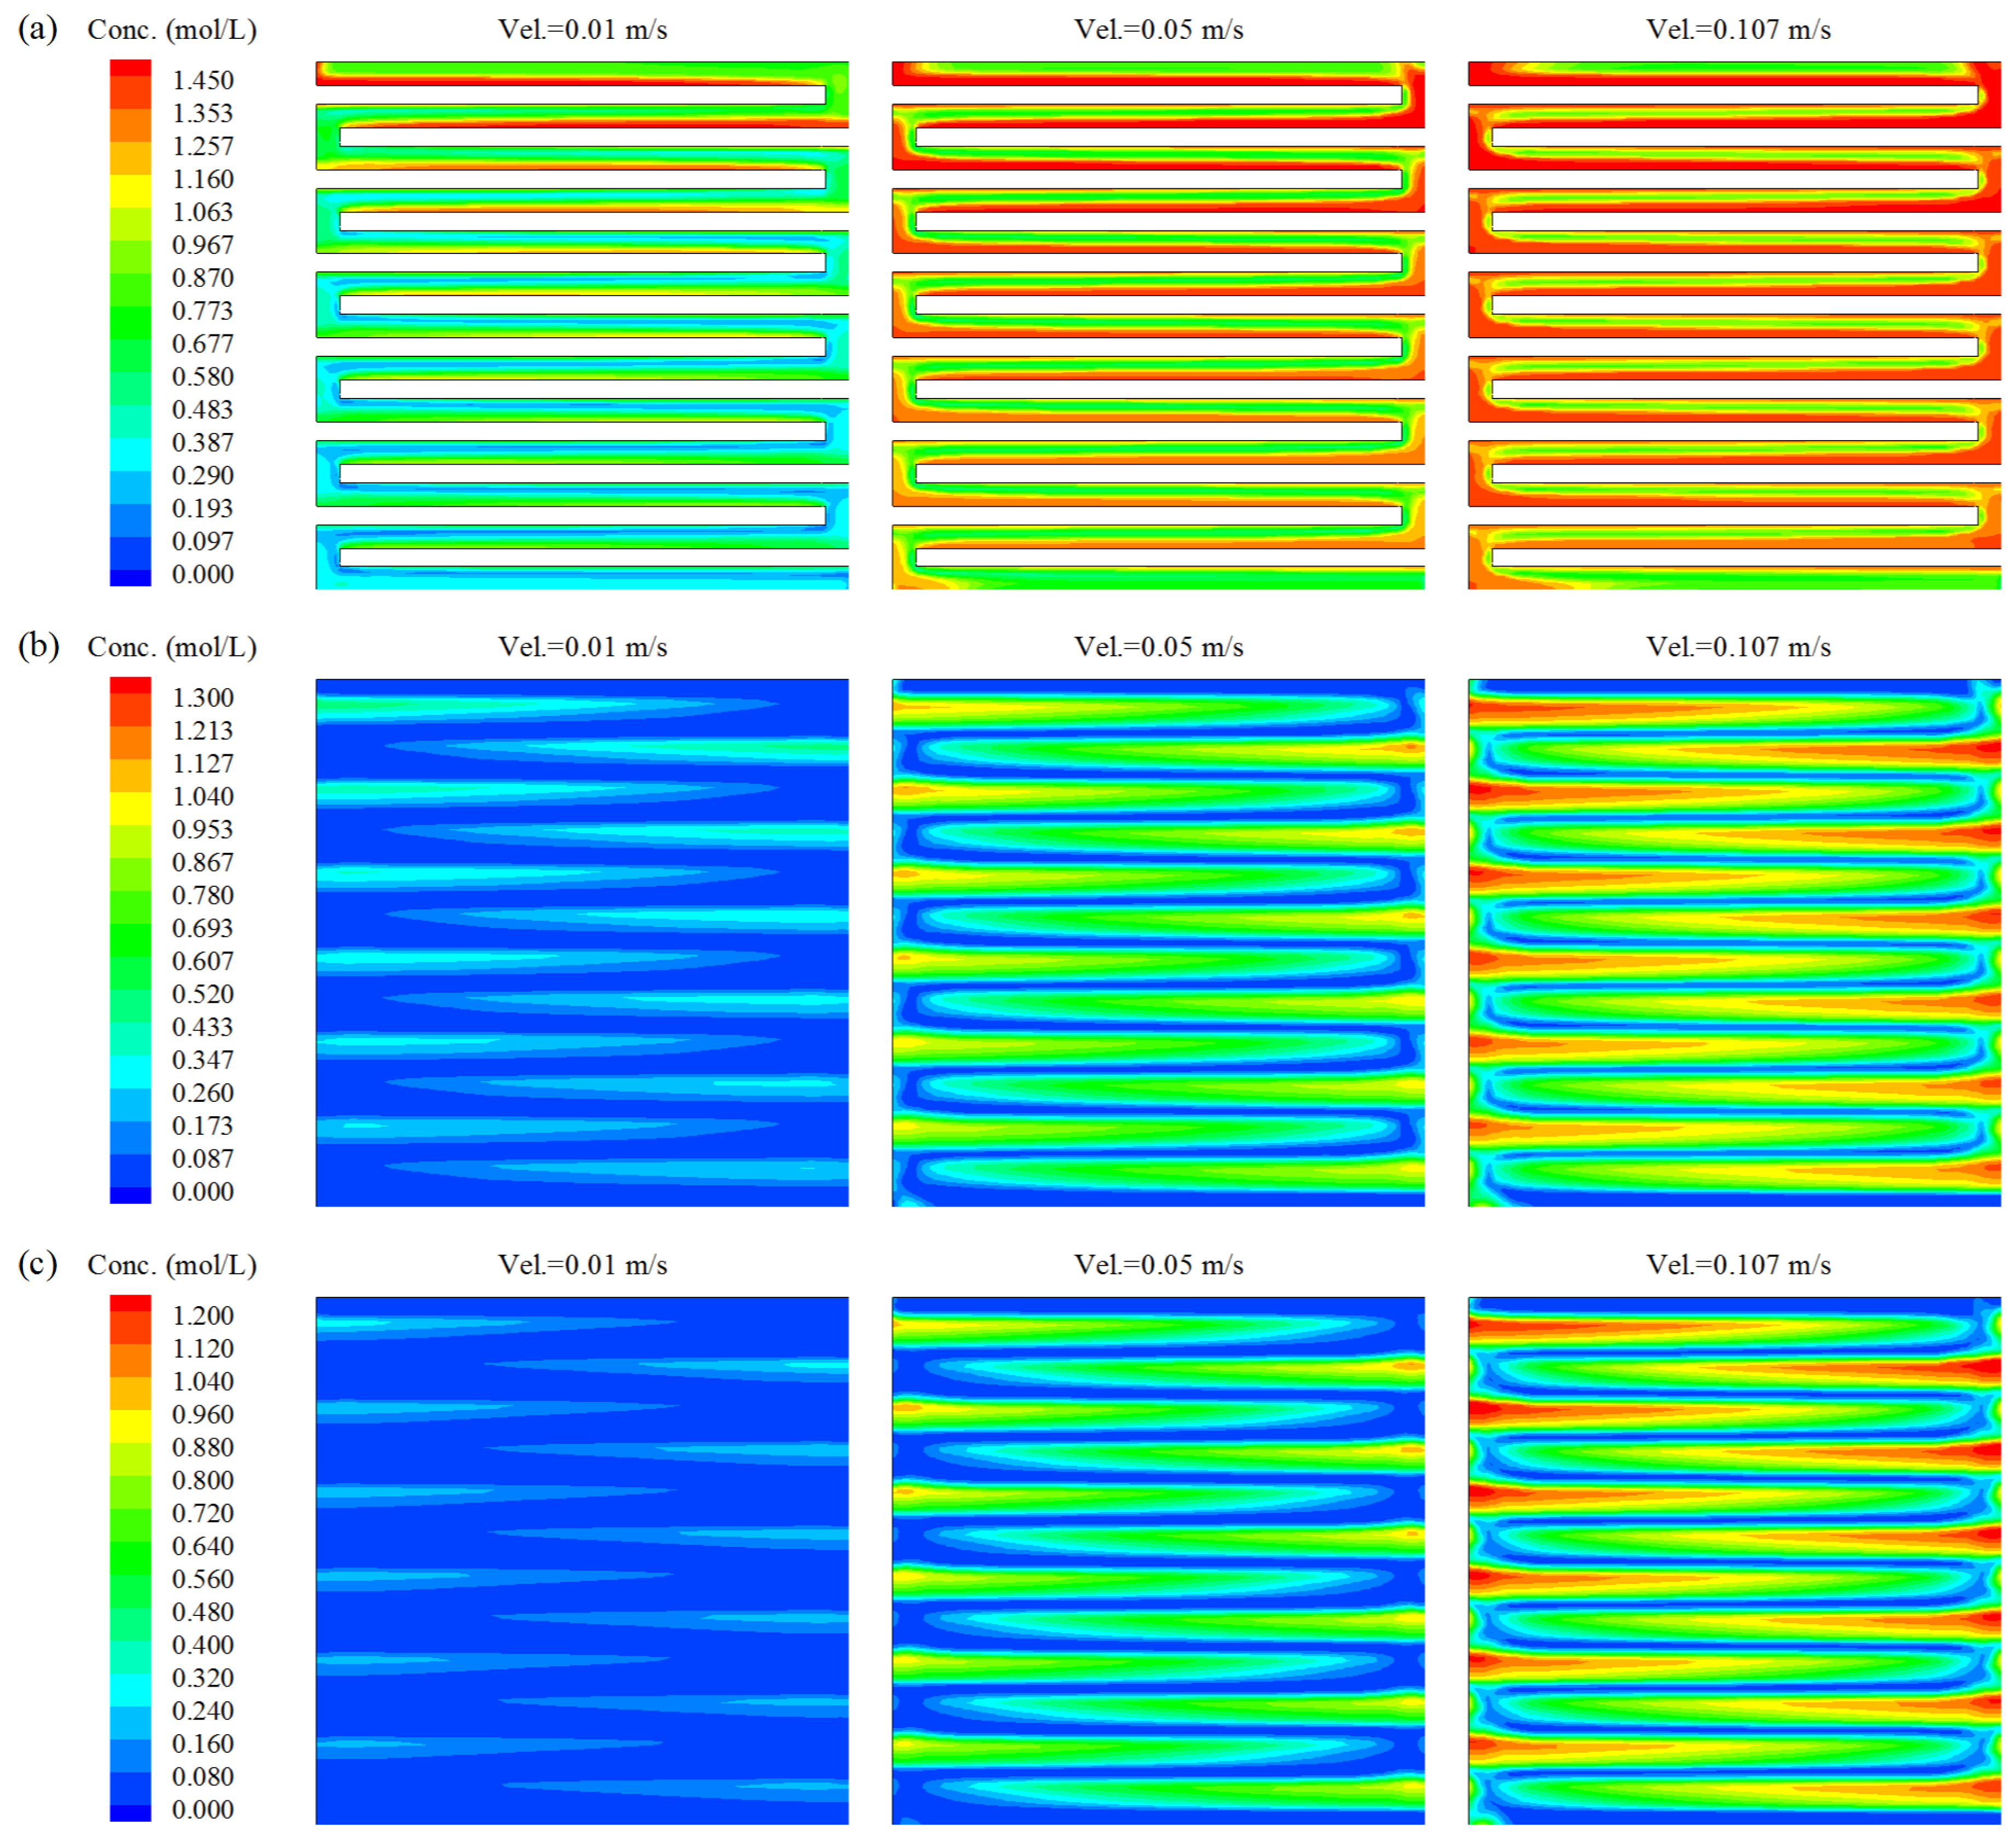
Figure 5.
Facet average and uniformity of methanol concentration on the CD (a,b); DC (c,d) and CP (e,f) planes.
Figure 5.
Facet average and uniformity of methanol concentration on the CD (a,b); DC (c,d) and CP (e,f) planes.

Figure 6.
Distributions of current density on the CP plane with an input methanol concentration of 1.0 (a); 1.5 (b) and 2.0 (c) mol/L.
Figure 6.
Distributions of current density on the CP plane with an input methanol concentration of 1.0 (a); 1.5 (b) and 2.0 (c) mol/L.
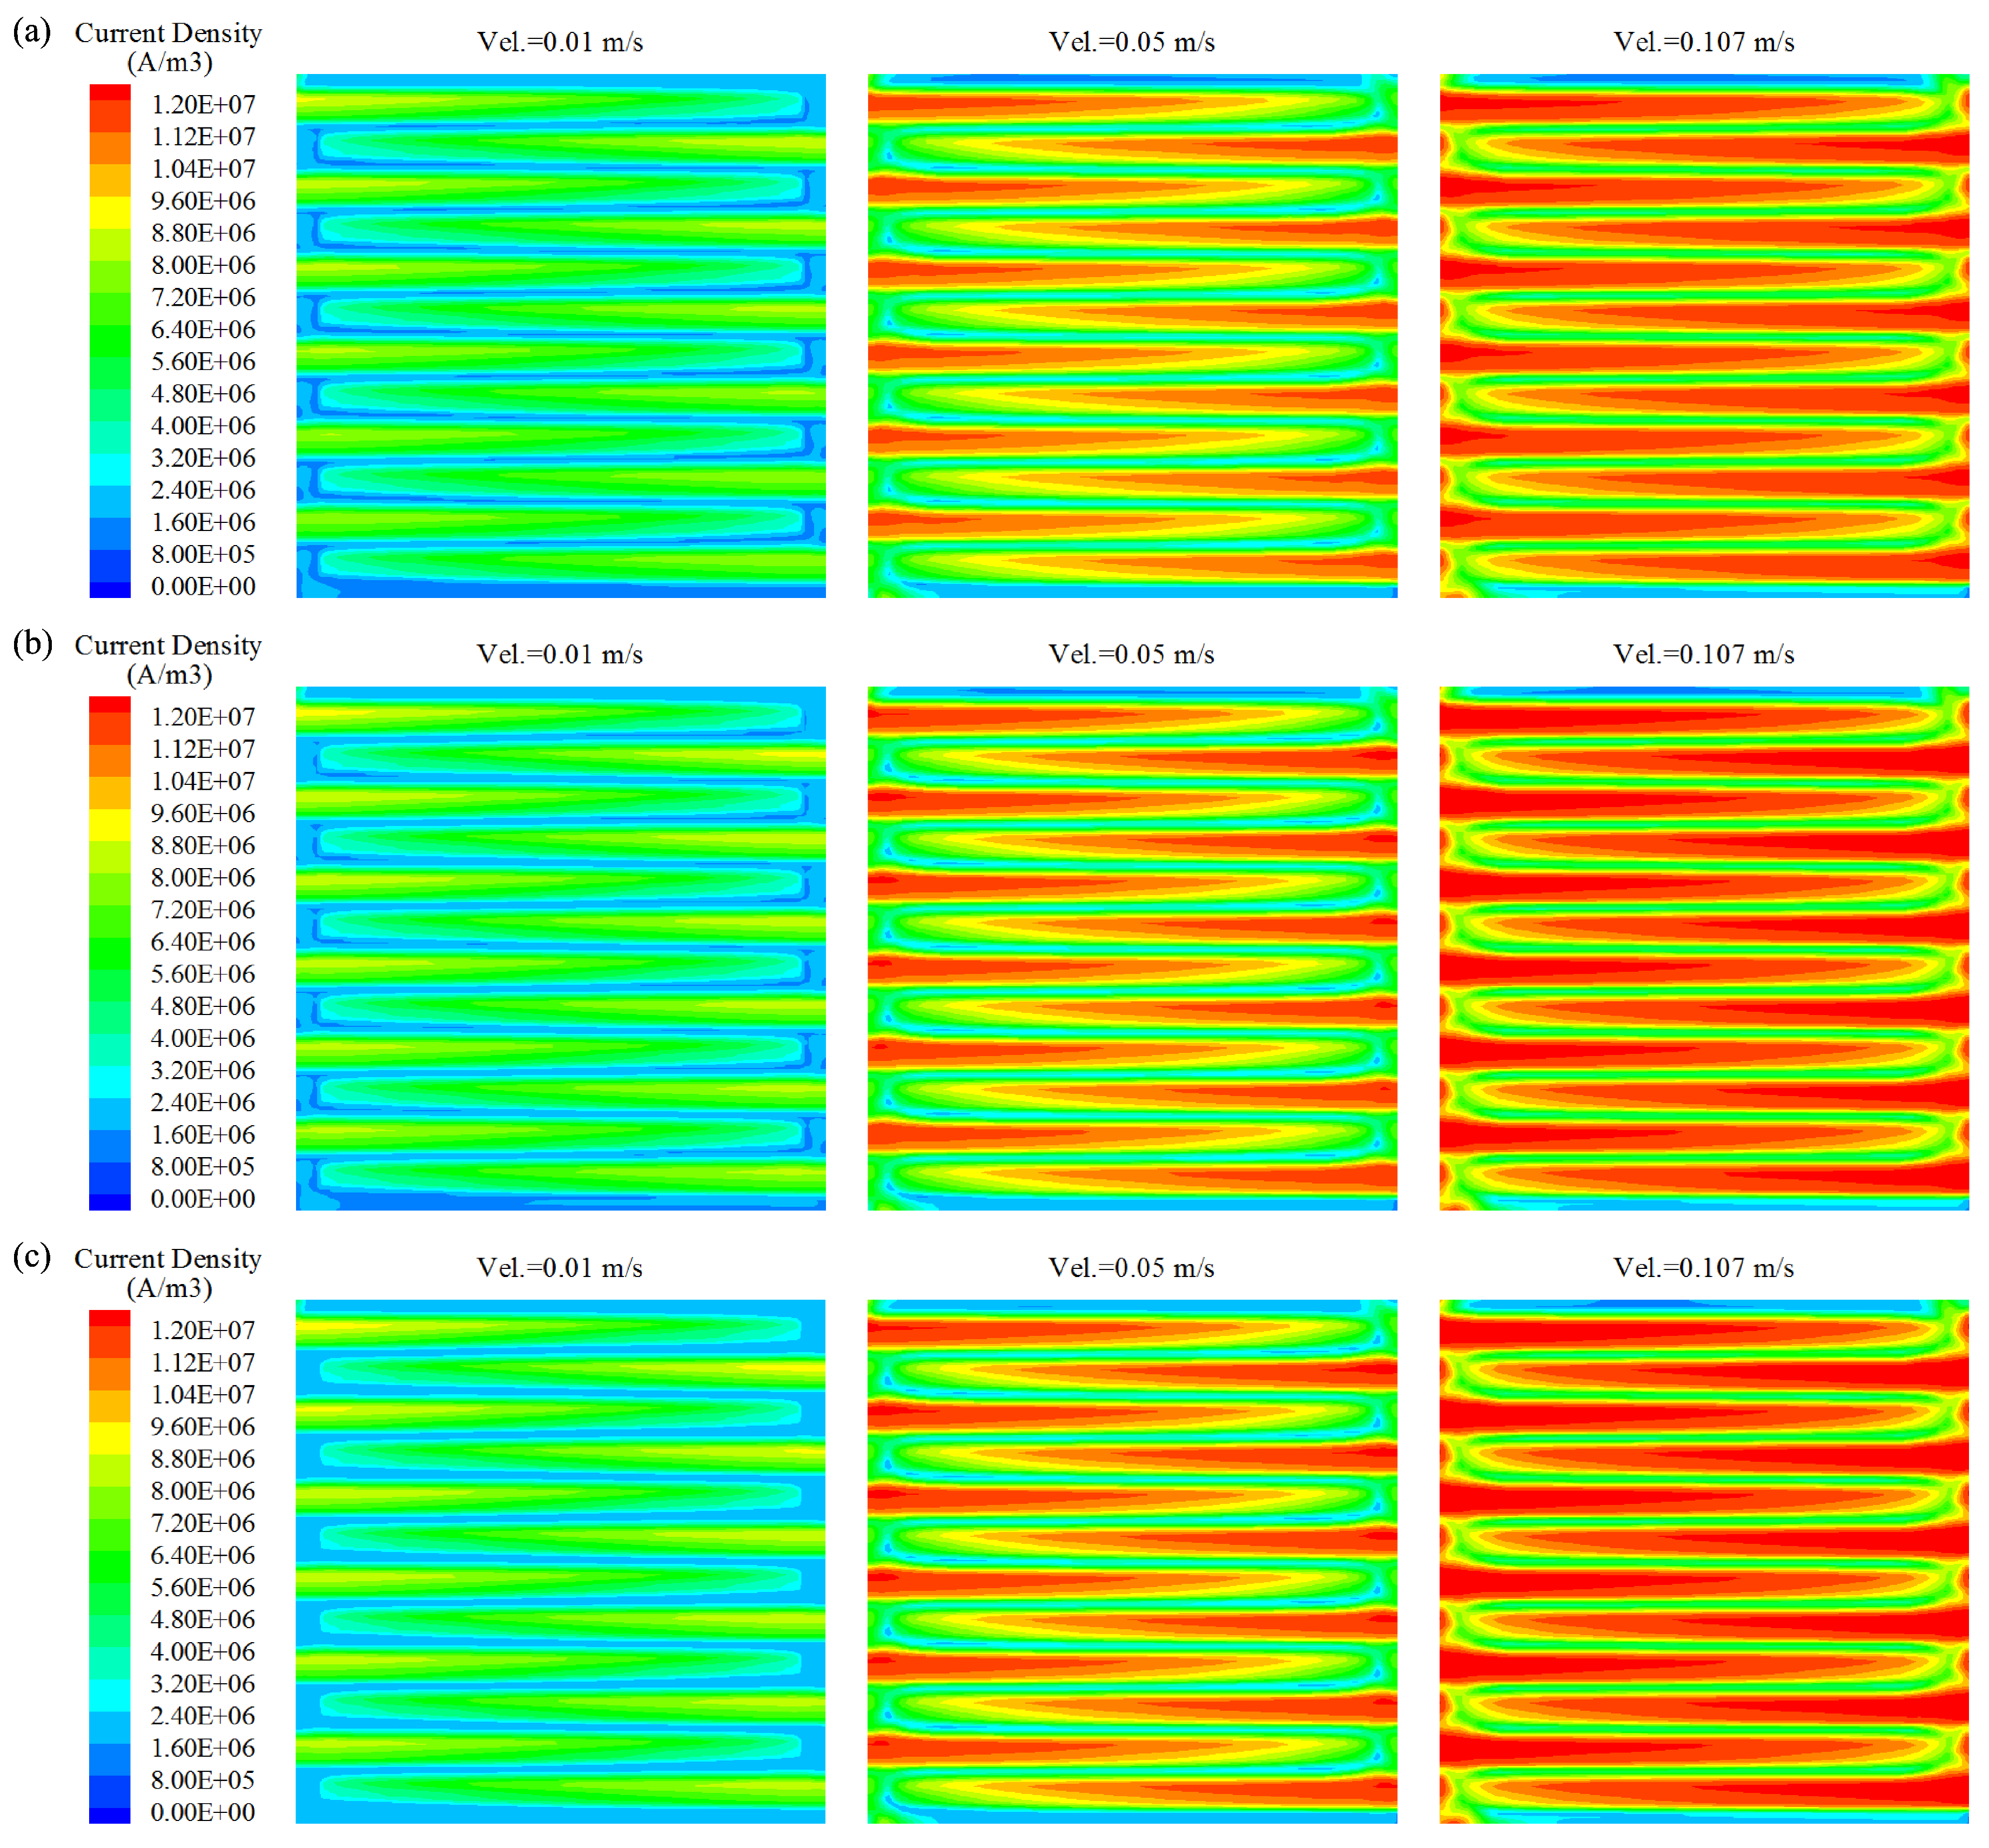
Figure 7.
Growth ratio of current density with the increase of input methanol concentration at different flow velocities. Red line denotes the maximum values at corresponding operating conditions.
Figure 7.
Growth ratio of current density with the increase of input methanol concentration at different flow velocities. Red line denotes the maximum values at corresponding operating conditions.

Table 1.
Geometric dimensions of the anode side.
| Location | Length | Width | Height | Info |
|---|---|---|---|---|
| Anode plate | 30.95 | 30.65 | − | − |
| Channel layer | 30.95 | 30.65 | 0.50 | Serpentine channel with 12 U-turns |
| Channel cross-section | − | 1.37 | 0.50 | Square shape |
| Diffusion layer | 30.95 | 30.65 | 0.20 | − |
| Catalyst layer | 30.95 | 30.65 | 0.02 | − |
unit: mm.
© 2017 by the authors. Licensee MDPI, Basel, Switzerland. This article is an open access article distributed under the terms and conditions of the Creative Commons Attribution (CC BY) license (http://creativecommons.org/licenses/by/4.0/).
Share and Cite
MDPI and ACS Style
Hu, X.; Wang, X.; Chen, J.; Yang, Q.; Jin, D.; Qiu, X. Numerical Investigations of the Combined Effects of Flow Rate and Methanol Concentration on DMFC Performance. Energies 2017, 10, 1094. https://doi.org/10.3390/en10081094
AMA Style
Hu X, Wang X, Chen J, Yang Q, Jin D, Qiu X. Numerical Investigations of the Combined Effects of Flow Rate and Methanol Concentration on DMFC Performance. Energies. 2017; 10(8):1094. https://doi.org/10.3390/en10081094
Chicago/Turabian StyleHu, Xuqu, Xingyi Wang, Juanzhong Chen, Qinwen Yang, Dapeng Jin, and Xiang Qiu. 2017. "Numerical Investigations of the Combined Effects of Flow Rate and Methanol Concentration on DMFC Performance" Energies 10, no. 8: 1094. https://doi.org/10.3390/en10081094
Note that from the first issue of 2016, this journal uses article numbers instead of page numbers. See further details here.