1. Introduction
Voltage control is expected to become increasingly difficult in future distribution networks due to the proliferation of renewable generation and other unplanned low carbon technologies (LCT) [
1]. Various architectures and algorithms have been proposed for voltage control. These architectures can be broadly categorized as either centralized or distributed control architectures, both of which could provide solutions for future voltage control problems [
2]. The development of a Smart Grid facilitates the application of advanced centralized voltage control schemes and optimization algorithms. This research focuses on the optimization-based centralized voltage control approach, which could potentially achieve full network transparency and optimal solutions with respect to various optimization objectives.
Various optimization algorithms have been proposed in previous research to solve voltage control problems, which can be classified as deterministic or metaheuristic algorithms [
3]. In [
4], the primal-dual interior-point (PDIP) algorithm was applied to solve the reactive power and voltage control problems. The voltage control problem was formulated as a mixed integer nonlinear optimization problem (MINLP), and network loss minimization was defined as the optimization objective. In [
5], the oriented coordinate descent method (ODCDM) was applied to solve the distribution network voltage control problem. The voltage control problem was formulated as a combinatorial optimization problem, and network loss was also minimized. The deterministic algorithms can provide deterministic answers and they are computationally efficient. Some of them have been successfully implemented within real distribution networks, such ODCDM [
6]. However, they can only guarantee local optimal solutions for non-convex optimization problems [
3]. In addition, they are not designed for mixed-integer problems, although some methods have been previously proposed to facilitate the application of deterministic algorithms to solve mixed-integer problems. For example, the PDIP algorithm was applied to solve the mixed-integer problems in [
4], by modelling the discrete control variables as continuous variables, and introducing a penalty function to force the discrete control variables to converge to their feasible values. However, the introduced penalty function increases the risk of converging to a local optimal solution or even an infeasible solution.
Meta-heuristic algorithms have been applied for voltage control in the last two decades [
7]. In [
8], the genetic algorithm (GA) was applied to control the tap position of on-load tap changer (OLTC) transformers and static var compensator to minimize the network losses and voltage deviation. In [
9], an evolutionary particle swarm optimization-based algorithm is used to manage reactive power from distributed generations (DGs), active power and reactive power from micro-grids, and the OLTC tap positions to minimize network losses and microgeneration shedding. Meta-heuristic algorithms are able to solve MINLP problems and are theoretically able to find global optimal solutions. However, metaheuristic algorithms are computationally intensive and they may not be able to provide deterministic solutions due to their stochastic nature. In addition, there are normally several parameters in the meta-heuristic algorithms, which need to be tuned for specific problems. Meta-heuristic algorithms have not been applied in practice due to these concerns. However, it is an active research area, and advanced meta-heuristic algorithms are being developed. Cuckoo Search via Lévy Flights, also known as Cuckoo Search (CS), is one of the most recently developed meta-heuristic algorithms, which is less sensitive to parameter tuning and could provide more predictable results [
10].
Previous research normally focused on the development of one specific type of voltage optimization algorithm. However, it is highly possible that one specific type of voltage optimization algorithm is not sufficient to solve the complex voltage control problems in future distribution networks. It is important to compare deterministic and meta-heuristic algorithms. In this work, advanced voltage control approaches have been investigated using two sophisticated representative optimization algorithms: ODCDM and CS, representing deterministic and meta-heuristic algorithms respectively. Different network conditions and different objectives have been evaluated, and the results are discussed in detail in the paper. This work has been carried out with the following steps:
- (1)
The optimization problem formulated for voltage control has been analyzed regarding the potential development of distribution networks (
Section 2);
- (2)
Two algorithms have been selected and implemented for evaluation (
Section 3);
- (3)
An algorithm test methodology was proposed (
Section 4);
- (4)
The performances of the selected algorithms were then evaluated and compared (
Section 5).
2. Problem Description and Mathematical Formulation
For distribution networks, voltage control is used to utilize the available voltage control devices and to ensure the network operation is within the statutory voltage limits and thermal limits. Additional objectives, such as reducing network losses, can also be achieved by setting the control devices properly. One approach is to formulate and solve the voltage control problem as an optimal power flow (OPF) problem; the formulation of which is well known and can be found in previous studies, such as [
4,
9]. The details of the problem formulation could vary with different networks and control preferences. In the following, the impacts of the development of distribution networks on the problem formulation are discussed.
2.1. Control Variables and State Variables
Conventionally, the control variables for distribution network voltage control are discrete control variables, such as the OLTC tap position [
5]. Recently, with the advent of DG [
11], and technologies such as energy storage systems (ESS) [
1] and D-STATCOMs [
12], continuous control variables also need to be considered as voltage control variables. These continuous control variables convert the voltage control problem from a combinatorial problem to a mixed integer optimization problem. State variables represent the variables that cannot be changed directly but will be changed with the variations of control variables, such as the busbar voltage magnitudes and the power flowing through different branches.
2.2. Equality and Inequality Constraints
The equality constraints mainly include the load flow equations for distribution networks. The inequality constraints represent the limits of control and state variables, such as the range of on-load tap changer positions and the network voltage statutory limits.
2.3. Optimization Objectives
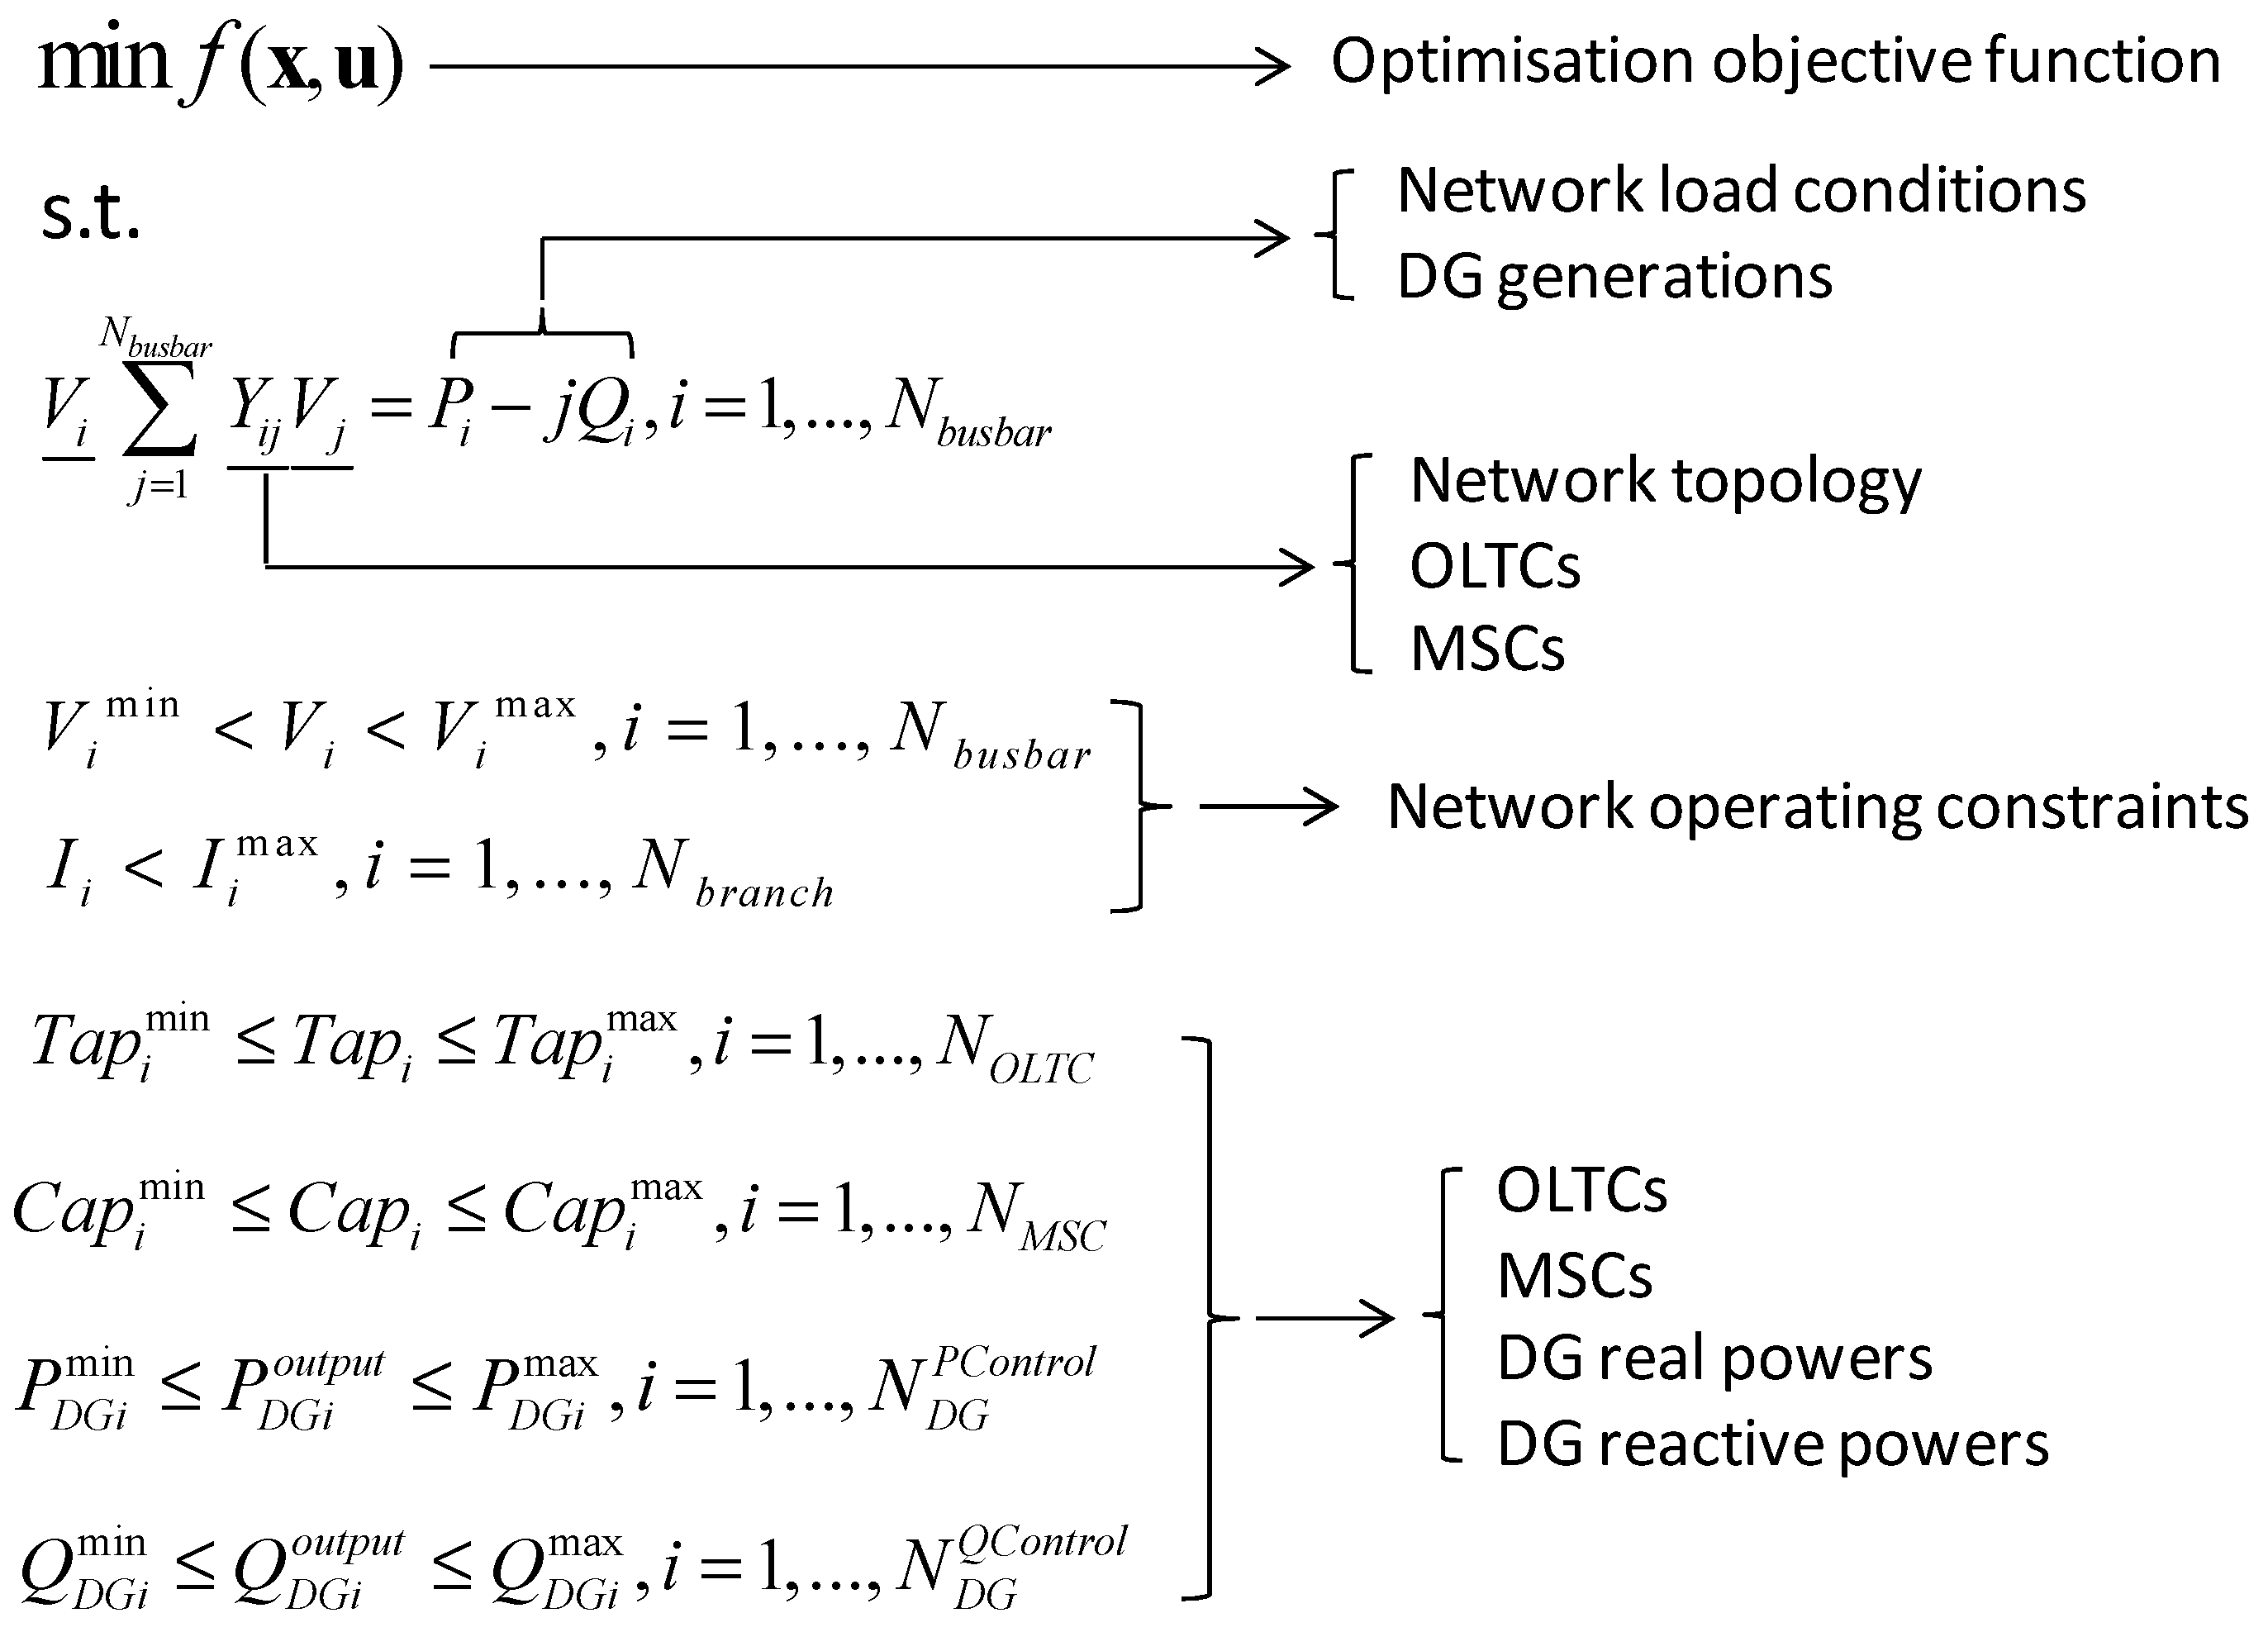
Different optimization objectives have been defined to reflect the network operators’ control preferences. Real power loss minimizing, as represented by (1), is normally adopted as the optimization objective for conventional distribution networks.
New optimization objectives are being introduced for distribution network voltage control, with the integration of LCTs. For instance, DG curtailment minimization, as represented by (2), is widely adopted as the optimization objective, when large penetrations of controllable renewable energy generation are connected to distribution networks.
3. Algorithm Selection and Implementation
In this study, the oriented discrete coordinate descent method and Cuckoo Search were selected and implemented to represent deterministic and meta-heuristic optimization algorithms. As a robust and computationally efficient algorithm, ODCDM has been adopted by state-of-the-art industrial products and has been applied in real distribution networks [
6,
13,
14]. Cuckoo Search is one of the most advanced meta-heuristic algorithms, and it has been successfully applied in almost every area and domain of optimization problems [
15]. Previous research demonstrated that CS outperforms some popular meta-heuristic algorithms, such as GA and Particle Swarm Optimization (PSO) in different areas [
16]. The mechanisms of these two algorithms are introduced in the following.
3.1. Oriented Discrete Coordinate Decent Method
As one type of the reduced gradient method, ODCDM iteratively improves the objective function by following the largest partial derivative of the objective function with respect to the control variables [
5]. In each iteration, all partial derivatives of the objective function
F with respect to the discrete control variable
Xi are calculated. As shown by (3), the partial derivatives are achieved by moving the control variable by one step size and calculating the difference between the objective functions.
It should be noted here that the objective function F is the combination of the optimization objective function and the penalty functions, as shown by (4).
The penalty function is applied to represent the penalty of inequality constraints violation. For example, it could represent the penalty related to voltage constraint violation. The penalty for all busbars at which the voltages are out of limits can be calculated by (5).
A large value is normally adopted for the penalty factor wk to avoid voltage violations.
In the Customer-Led Network Revolution (CLNR) project, ODCDM has been implemented in an advanced distribution network control system, named the Grand Unified Scheme (GUS) [
6,
17]. This GUS system has been deployed and trailed in a number of distribution networks areas in Northeast England. These field trials have been used to practically validate the ODCDM-based algorithm described in the paper. The validation is carried out by implementing the ODCDM algorithm in the same way as the GUS algorithm was implemented in the CLNR field trials, and then comparing the simulation results with the measured field trial results. Validation results demonstrated that the implemented ODCDM algorithm can represent the algorithm in the GUS system. A detailed description of the validation progress and results can be found in [
6].
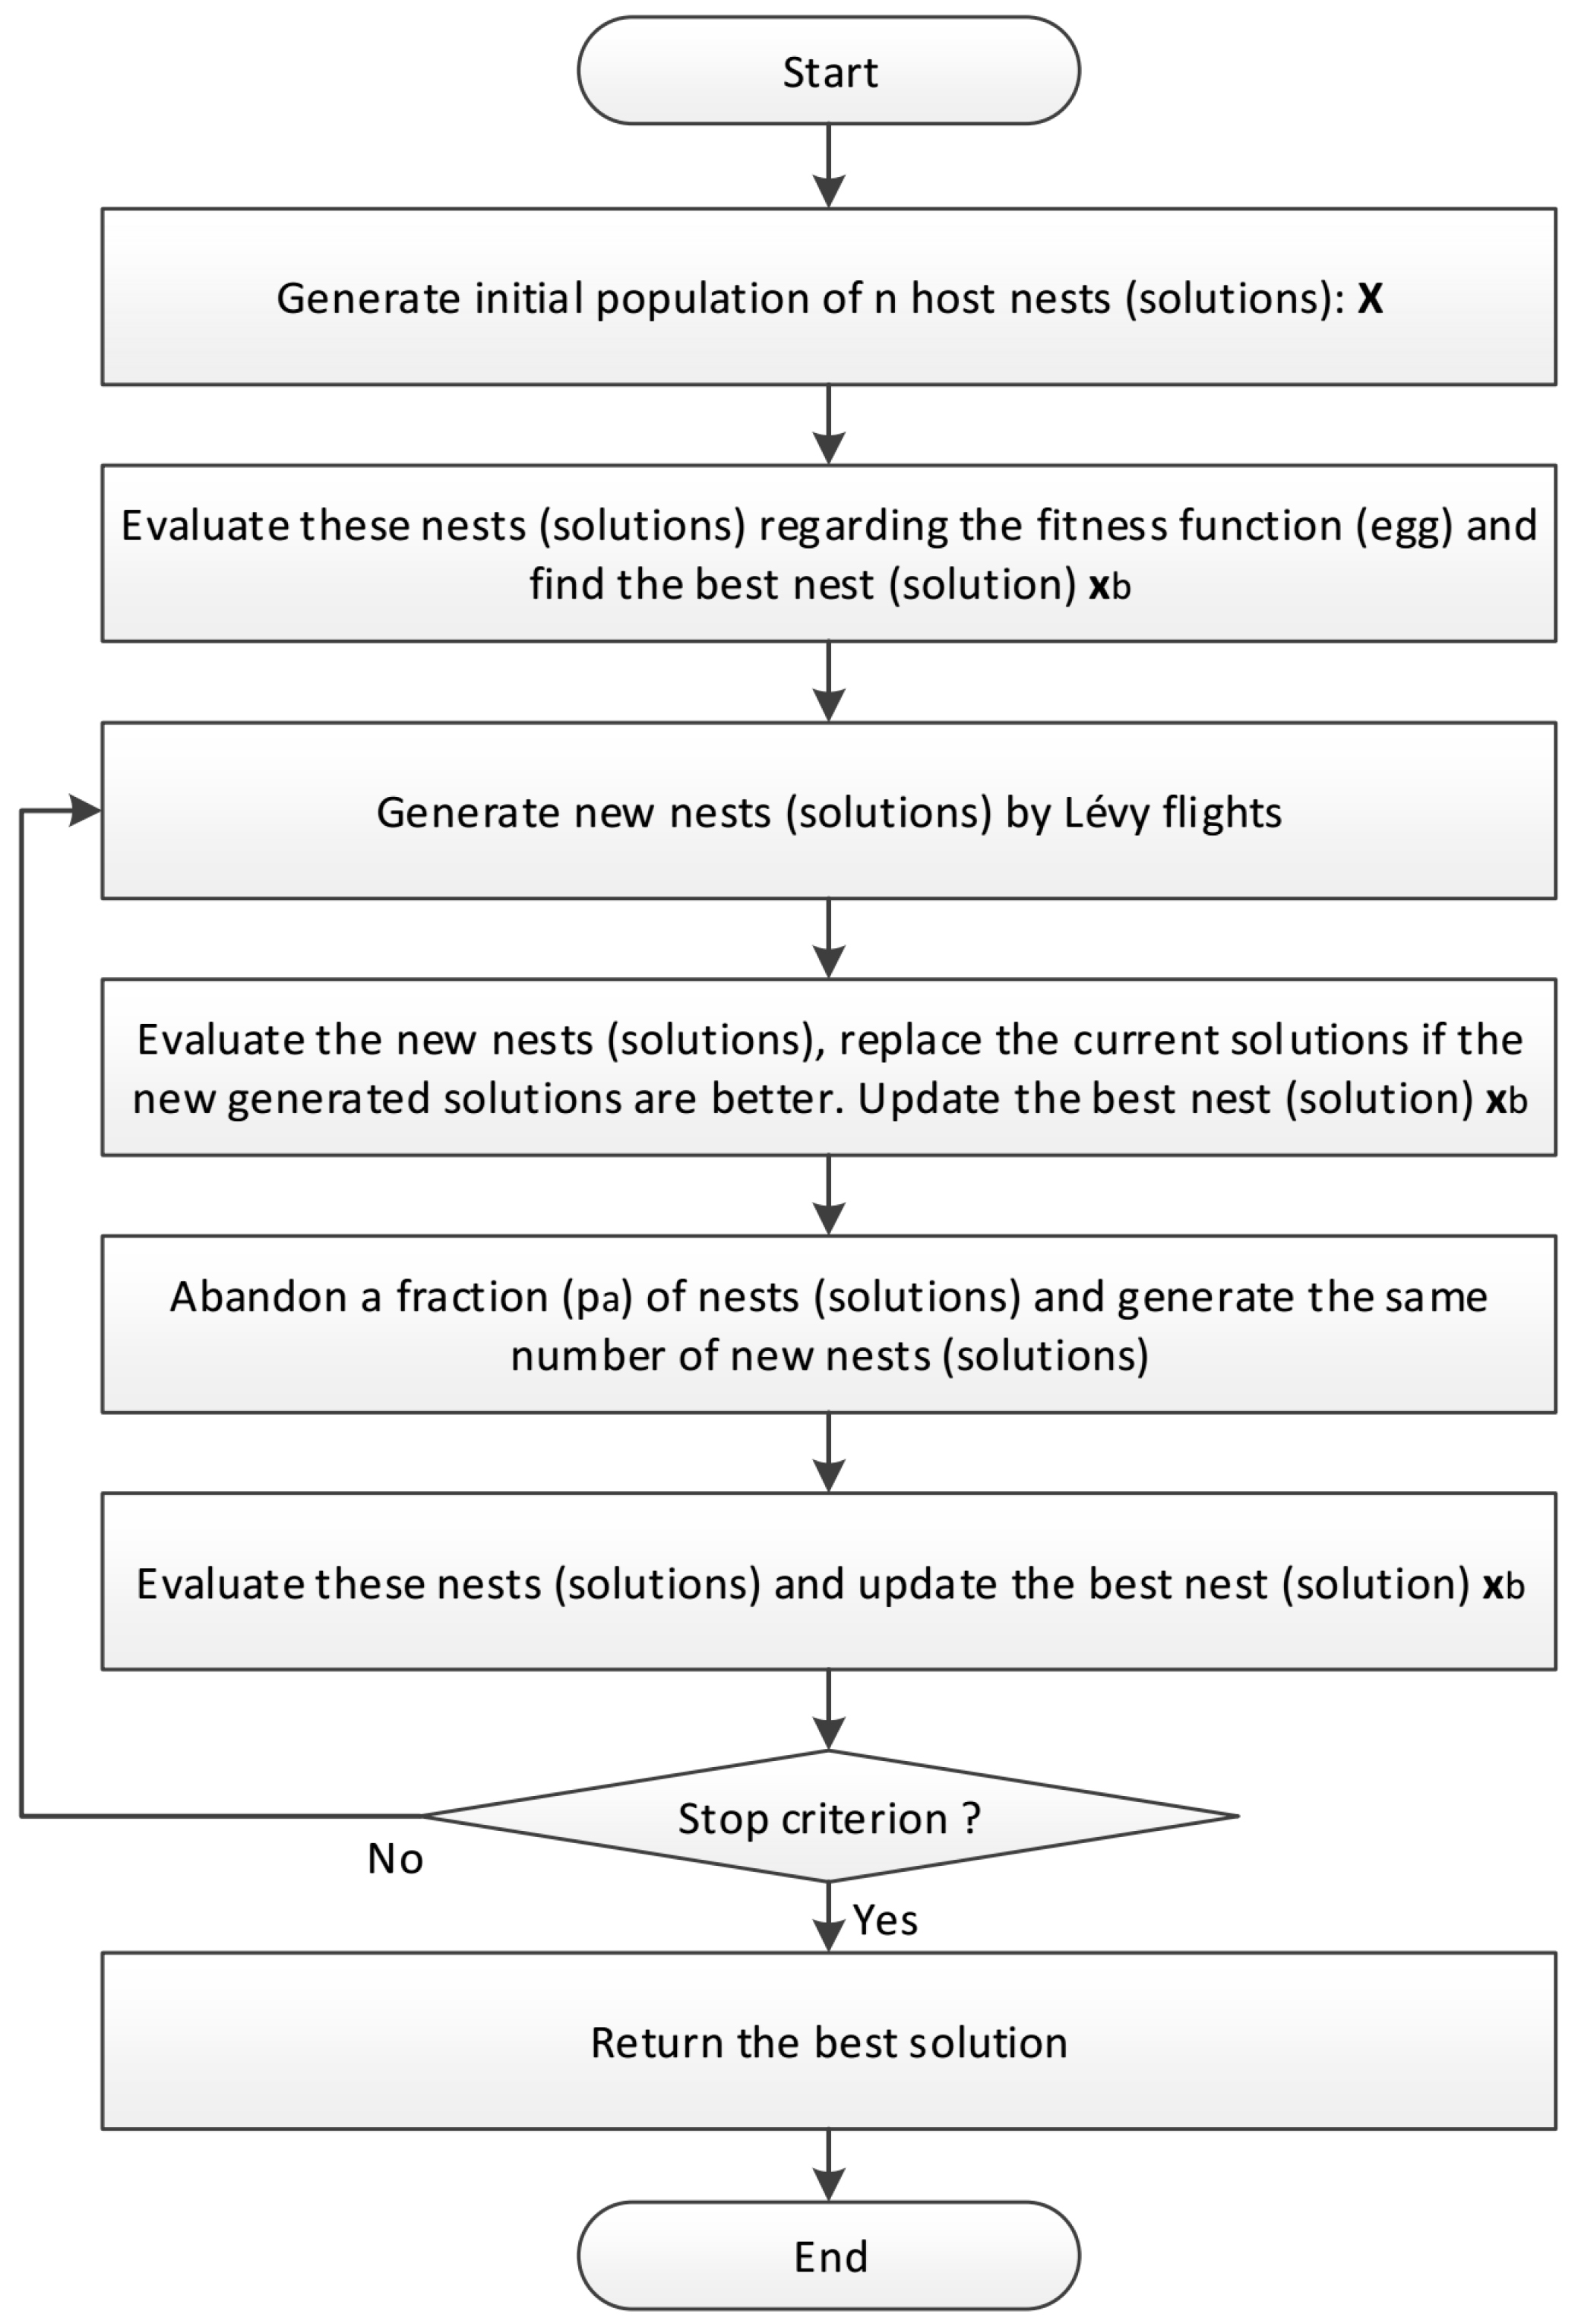
3.2. Cuckoo Search via Lévy Flights
Cuckoo Search was first proposed in 2009, inspired by the breading behavior such as brood parasitism of certain species of cuckoos [
10]. CS attracted considerable attention and has been successfully applied to solve different optimization problems in different areas. The flow chart of CS is shown in
Figure 1. The principles of the cuckoo search algorithm can be described as follows:
- (1)
A initial group of solutions (named as nests) are generated randomly, and their fitness functions are evaluated;
- (2)
A new group of nests are generated using Lévy Flights, and their fitness functions are evaluated;
- (3)
The previous nests are replaced with the new generated nests in step 2, if the fitness function is improved, and the best nest is saved;
- (4)
A portion of the current nests are abandoned, and new nests are generated based on the best nest;
- (5)
The new set of nests is evaluated;
- (6)
Step 2 is followed if the stop criteria are not met.
The use of Lévy Flights is one of the main reasons for the excellent performance of CS. Lévy Flights can generate a very large step size, which results in a larger search space, compared to normal distribution optimization. Lévy Flights is used in CS to generate new group of nests, as shown by (6)
where
α > 0 is the step size which should be related to the scales of the problem of interest, and
α = 1 can be used for most cases, as suggested by [
10]. Lévy Flights essentially provides the step size, the length of which is drawn from a Lévy Flights distribution, shown by (7).
This distribution has an infinite variance with an infinite mean. The step size, which is generated with this distribution, is used to generate new solutions. Some of the new solutions are generated by Lévy flights around the best solution obtained so far, which is able to speed up the local search. There is a chance that some generated solutions are far enough from the current best solution, which can make sure the system will not be trapped in a local optimum.
The original CS algorithm was developed to solve the optimization problems with continuous variables only, and it can be revised to solve combinatorial problems and mixed integer optimization problems [
15]. Basically, the progress for continuous variables is kept the same, and for discrete variables, the step size is rounded off before being used to generate the new values for the discrete variables. This procedure is applied in both the
get cuckoo function and
empty nest function. It can be represented by (8).
The Cuckoo Search algorithm has been compared with two popular metaheuristic algorithms, GA and PSO, with regard to solving voltage optimization problems.
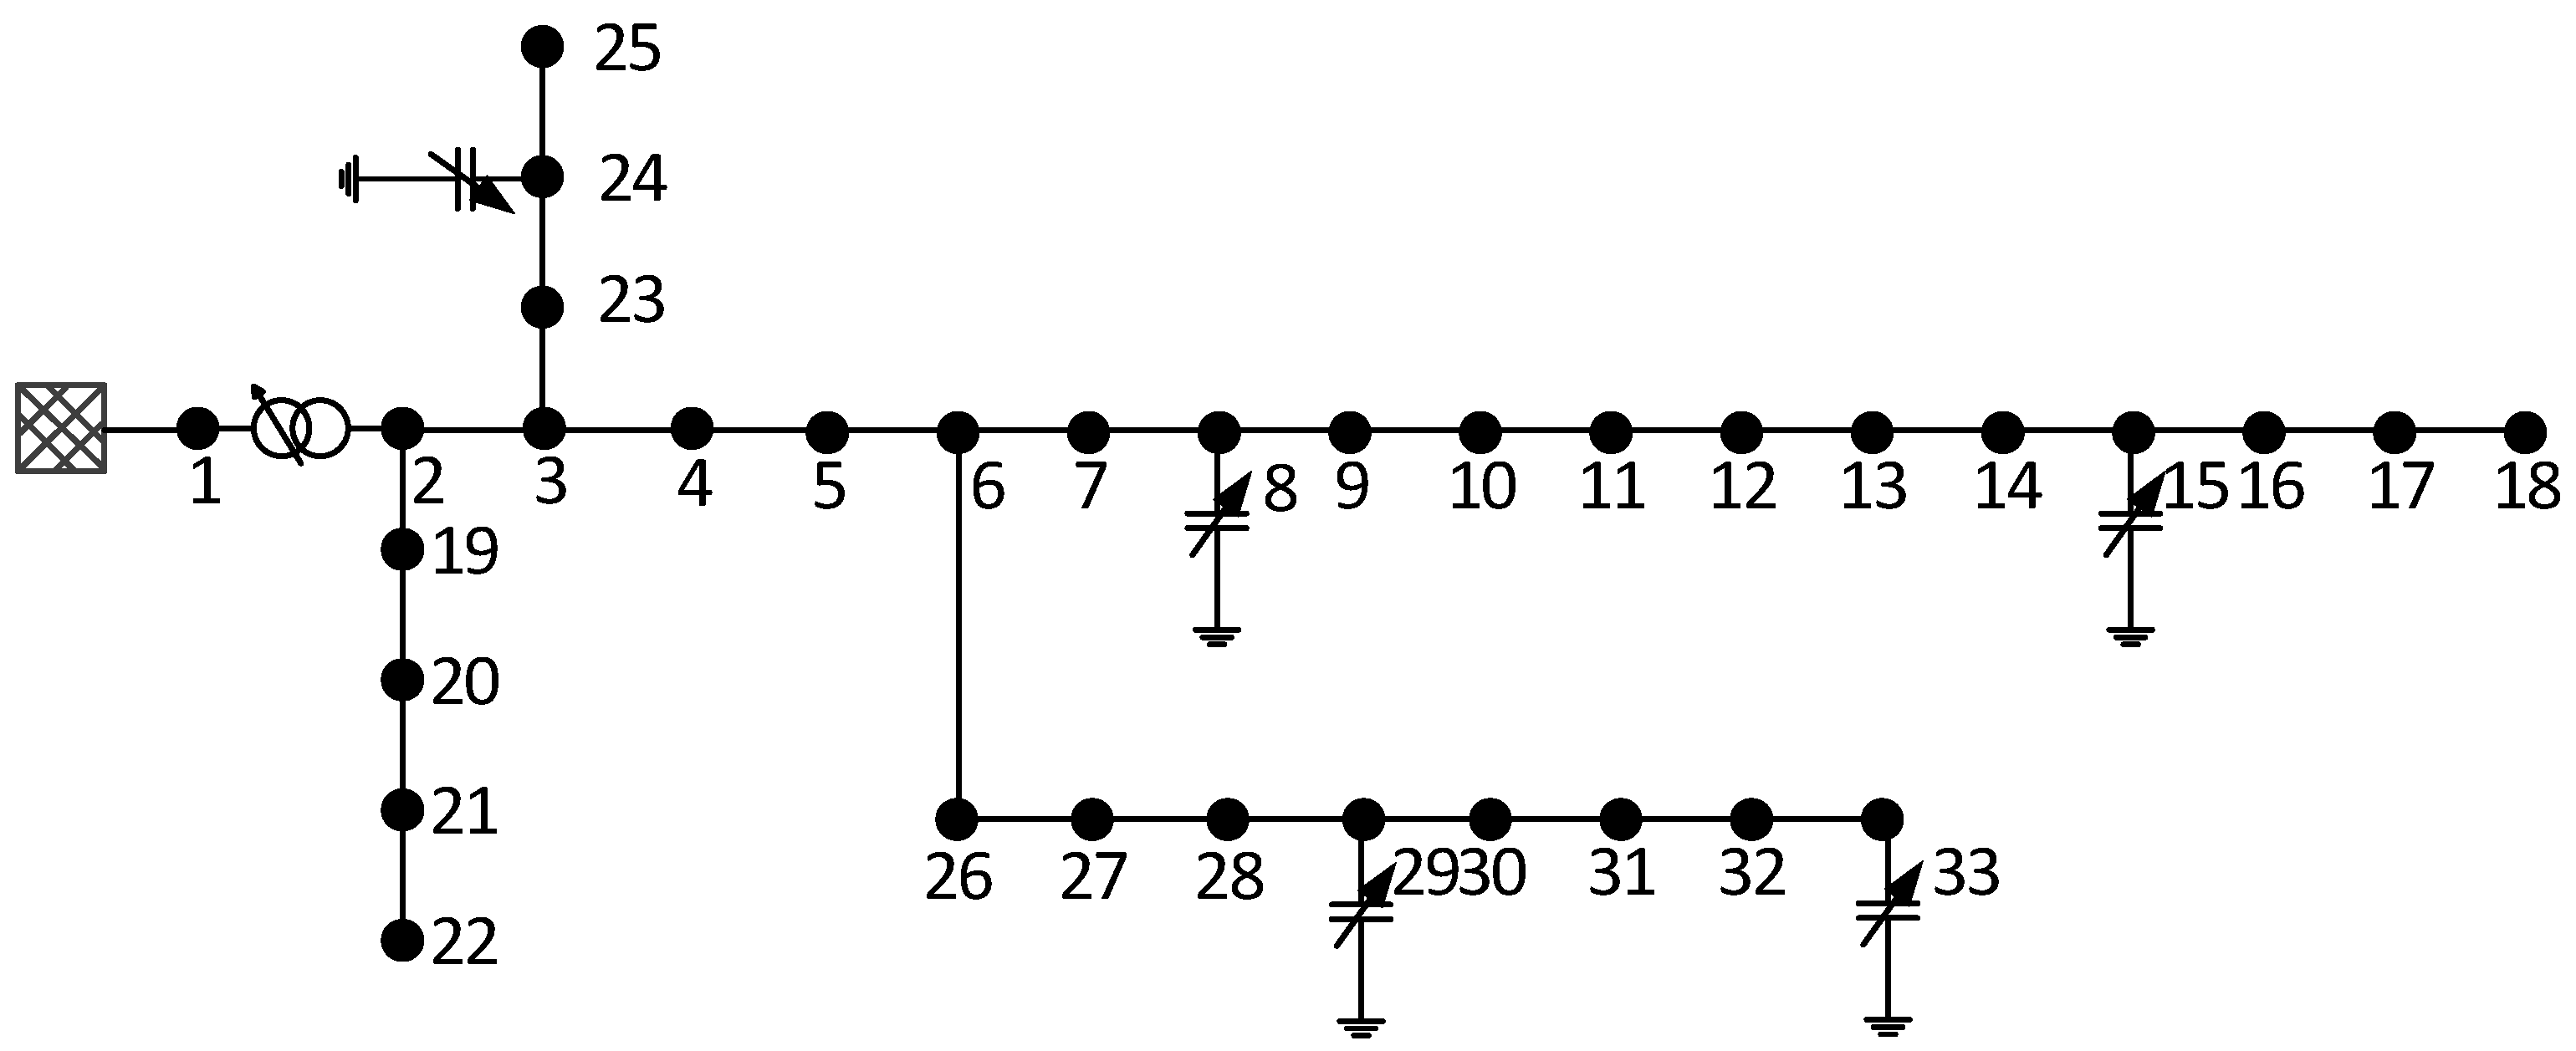
Table 1 shows the test results obtained with these three metaheuristic algorithms for one sampled test case. For this test case, the algorithms were applied to minimize the real power losses for the test network shown in
Figure 2. The impedance and load data of this network can be found in [
18]. One on-load tap changer and five mechanically switched capacitor banks were controlled. The tap position of the tap changer could be controlled between −5% and 5%, with the step size of 1.25%. All the capacitor banks have 8 steps, with the step size of 0.1MVAr. Due to their stochastic nature, metaheuristic algorithms may achieve different results each time they are run. To achieve a valid comparison, all three algorithms were run 100 times, and their performances were compared based on the results from the 100 runs, as shown in
Table 1. It can be seen from the test results that CS has a more stable performance, in comparison with GA and PSO.
4. Algorithm Test Methodology
A methodology has been proposed to evaluate voltage optimization algorithms. A number of test cases were generated based on the potential variation of the voltage optimization problem. As shown in
Figure 3, the voltage optimization problem is determined by the following variants: The optimization objective function;
- -
The network topology;
- -
The voltage control variables;
- -
The network load and generation conditions;
- -
The network operating constraints including voltage limits and the thermal limits of the branches.
The creation of voltage control test cases for conventional and future distribution networks is discussed in the following.
4.1. Conventional Network Scenario
In the conventional scenario, voltage control is achieved with discrete voltage control variables, including the OLTC tap position and the mechanically switched capacitor (MSC) stage position. Once the network topology and the details of the voltage control devices are defined, the optimization problem will primarily seek to satisfy optimization objectives and network load conditions. For a conventional distribution network scenario, network loss minimization is adopted as the optimization objective.
For a give test network, the test cases can then be determined when the load condition is decided. The optimization objectives are tested under the following loading conditions.
- -
Network load conditions that are generated by scaling all the loads in the network with a load scale index, which is varied from 25% to 100% with a step size of 5%.
- -
Network load conditions that are also generated by scaling all the loads in the network with the load scale index based on the 24-hour load profile from the CLNR project [
1].
4.2. Future Network Scenario
The projected proliferation of different clusters of low carbon technologies in distribution networks is expected in future distribution network operators. In particular, renewable energy resources are already being installed in distribution networks, in the form of DGs. Furthermore, load LCTs, such as air source heat pumps and electrical vehicles, are also expected in future distribution networks, due to the electrification of heat and transportation [
19]. Here, it is assumed that the maximum network load is increased from the original value by a factor of 1.1, to represent the effect of the connection of load LCTs. This factor is a conservative antifiction of load growth due to the adoption of electric vehicle and heat pumps. This paper focused on the performance of the voltage control algorithms; therefore a simple assumption was adopted. Detailed load modelling is beyond the scope of this paper. The snapshot approach in the future network scenario consists of a set of loads, and generation conditions are also produced to evaluate the algorithms. Load is varied from 25% to 110% with a step size of 5% (18 load conditions). In addition, the generation is varied to the maximum generation with the fixed step size.
Partial DG power output curtailment and DG power factor control are expected to be introduced for voltage control in future distribution networks. The control method and capability of DGs depend on the DG technology and distribution network operator’s preference [
20,
21,
22]. Here, the DG reactive power capability curves are modelled by real/reactive power constraints for simplicity and generality, represented by (9) and (10).
Normally, the lower limit of the DG real power export is zero, while the upper limit of the DG real power is the available DG real power output. The limits of the DG reactive power are defined by (11).
This power factor limit of DG output limit
φ is assumed to be 0.95 in the test cases based on previous studies in literature and UK grid code requirements [
23].
Novel optimization objectives are also considered for future network scenarios, including the DG curtailment minimization, represented by (2), and the DG reactive power usage minimization, represented by (12).
Although in practice the objective function could be a combination of different optimization objectives, in this study, only one optimization objective was considered, to investigate the impacts of different optimization objectives on the algorithm performance.
The location and rating of DGs also affect the problem. Here, DGs are located randomly across the case study networks to generate the test conditions; however, it is assumed that for a fixed set of DG locations and ratings, the problem is fixed. The busbars to which the DGs are connected were determined randomly, since in practice, the DGs may be connected to any part of the distribution networks. The ratings of the DGs were decided by considering the maximum capacity of a single DG and the total connected capacity of all DGs.
4.3. Starting Point Selection for ODCDM
The performance of ODCDM may be affected by the starting point adopted by the algorithm, which is normally the setting position of the voltage control devices before the optimization is executed. Here a fixed ‘flat start’ starting point and randomly generated starting points were used, following the approaches proposed in previous research [
24]. In [
24], ten starting points are generated for an algorithm test: one is a ‘flat start’, and the remaining nine are randomly generated starting points. In ‘flat start’, the OLTC tap position is at the position that gives the rated transformer ratio. For capacitor banks, the stage is 0, which means no reactive power is injected into the network.
4.4. Maximum Iteration Selection for CS
Parameter tuning approach may enhance the performance of CS. However, to demonstrate the robustness of the CS algorithm, the parameters suggested by previous research were applied. The maximum iteration number is usually decided for a fixed control variable number before the test. For a given voltage control problem (fixed control variables), the required maximum iteration number is determined when the standard deviation over N runs is smaller than 0.001. It has been found by test cases that
N = 100 is sufficient in this study. The worst case scenarios found in previous research were used to determine the required maximum iteration number [
23]:
- -
Maximum load and no generation;
- -
Maximum load and maximum generation;
- -
Minimum load and maximum generation.
The largest value for the maximum iteration number determined is selected as a reference for all test conditions in each case study network. CS will stop once the maximum iteration number is reached or the expected value of the optimization objective function is found.
4.5. Performance Criteria
The voltage optimization algorithms should be able to provide a feasible solution and optimize the defined optimization objective within a reasonable time. The following metrics are defined to evaluate the algorithms’ performances:
- -
The ability to find a feasible solution;
- -
The optimal value achieved for the optimization objective function;
- -
The computation time.
Here, the UK statutory voltage limits are applied, which are 0.94 pu and 1.06 pu [
25].
5. Case Study and Test Results
In this study, PYPOWER, which is the Python version of MATPOWER [
26], is used as the platform for load flow analysis. Both algorithms, CS and ODCDM, are implemented in Python and can be used with different PYPOWER network models. The tests were run on an Intel i5, 3.20 GHz computer (8 GB) in the SPYDER integrated development environment [
27].
The test results of two case study networks based on original 33-bus [
18] and 69-bus [
28] are adopted here to demonstrate the principle of the two algorithms. There are no voltage control devices in the original networks. The case study networks were modified to reflect voltage control devices and capacitor bank replacements. A constant power load model is used to model the loads in the case study networks. The original load from the standard model is used as the maximum load condition, while the minimum load condition is defined to be 25% of the original load condition.
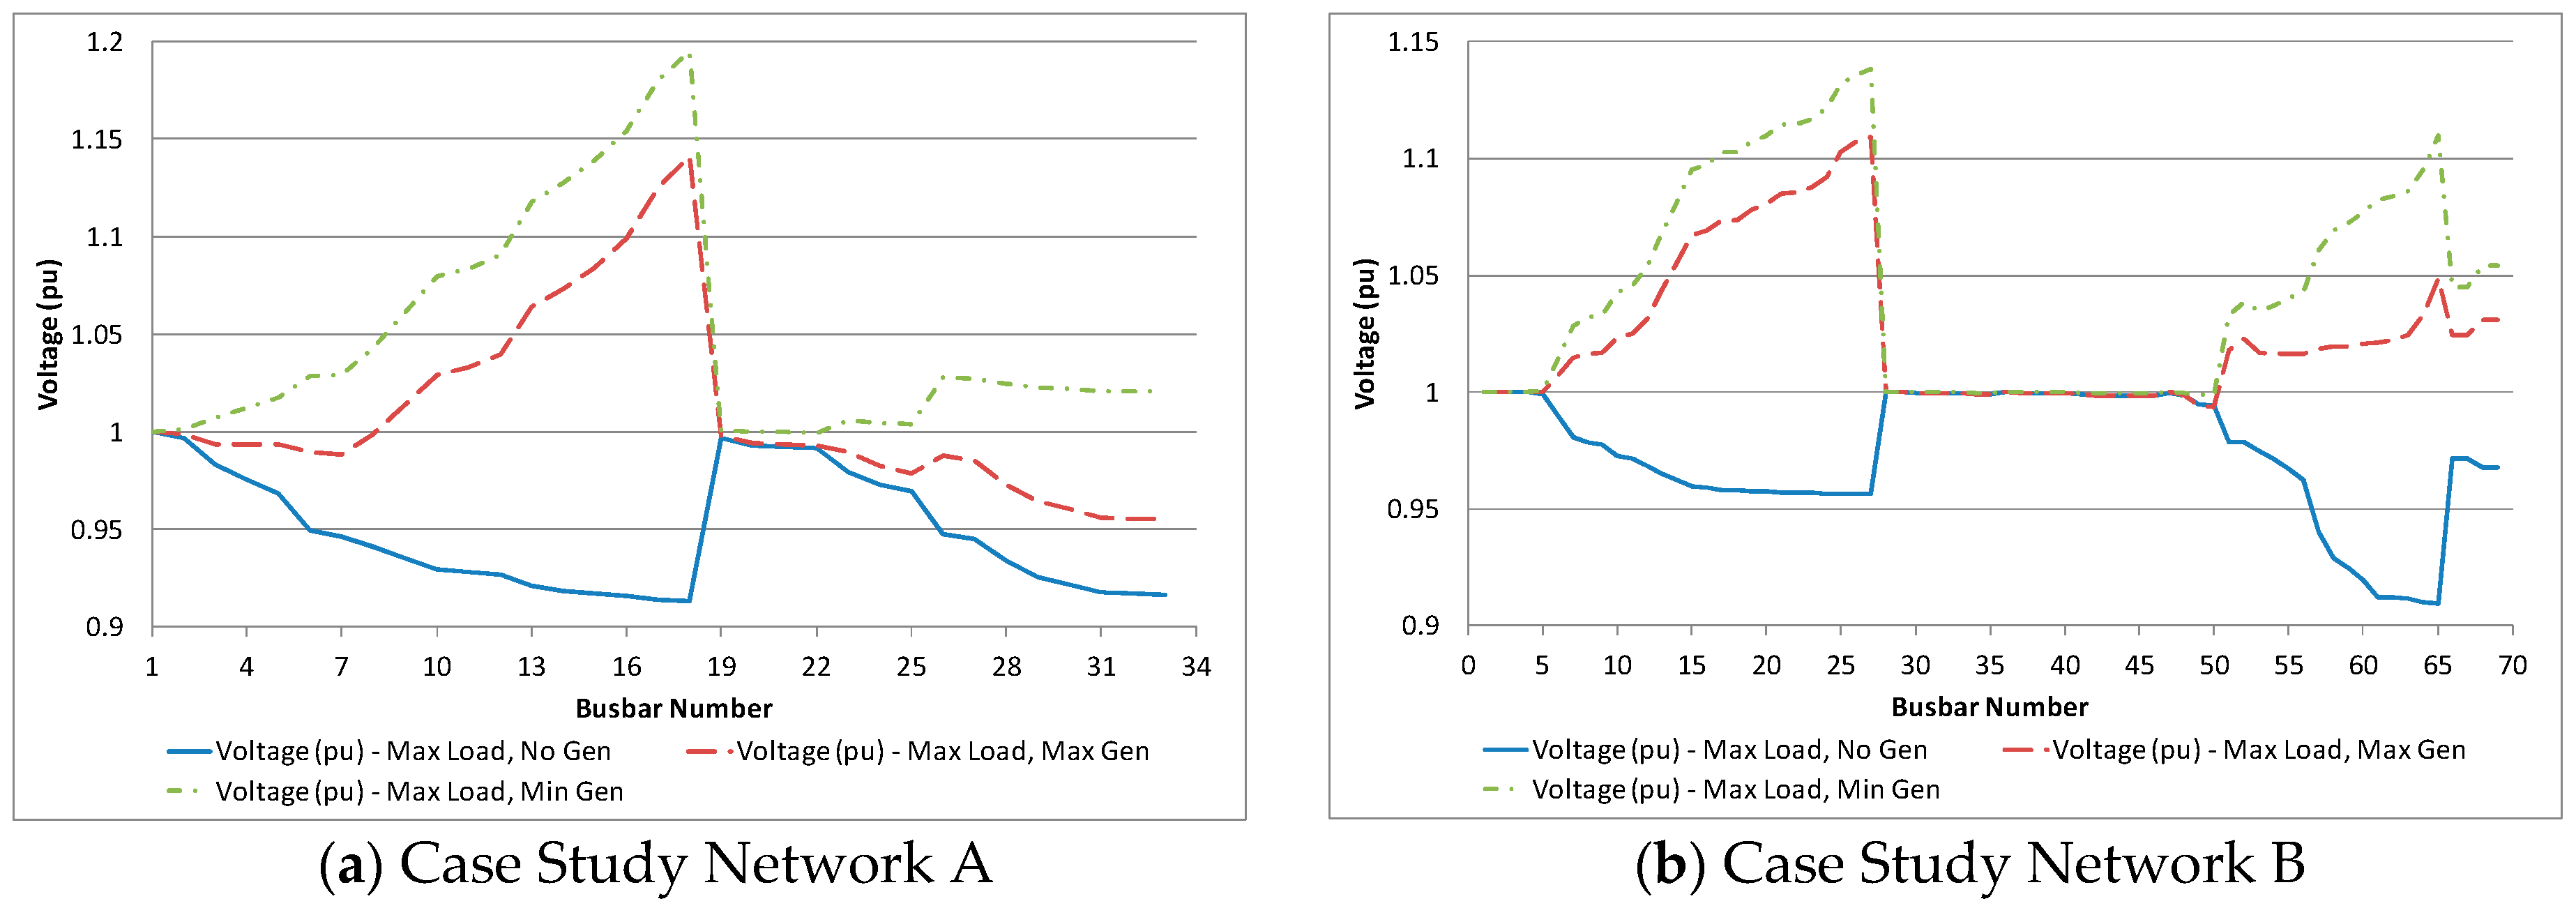
The 33-bus case study network, referred to as Network A, has an OLTC transformer and five MSCs integrated into the original network as shown in
Figure 4. The OLTC is placed between busbars 1 and 2, with eight tap positions from 0.95 to 1.05 in per unit, with a step size of 0.0125. Four MSCs are connected to busbars 8, 12, 15 and 29. Each MSC consists of six modules with 50 KVAr per module. A single DG is connected to bus 18 in the future scenario. The installed capacity of this DG is assumed to be 4 MW.
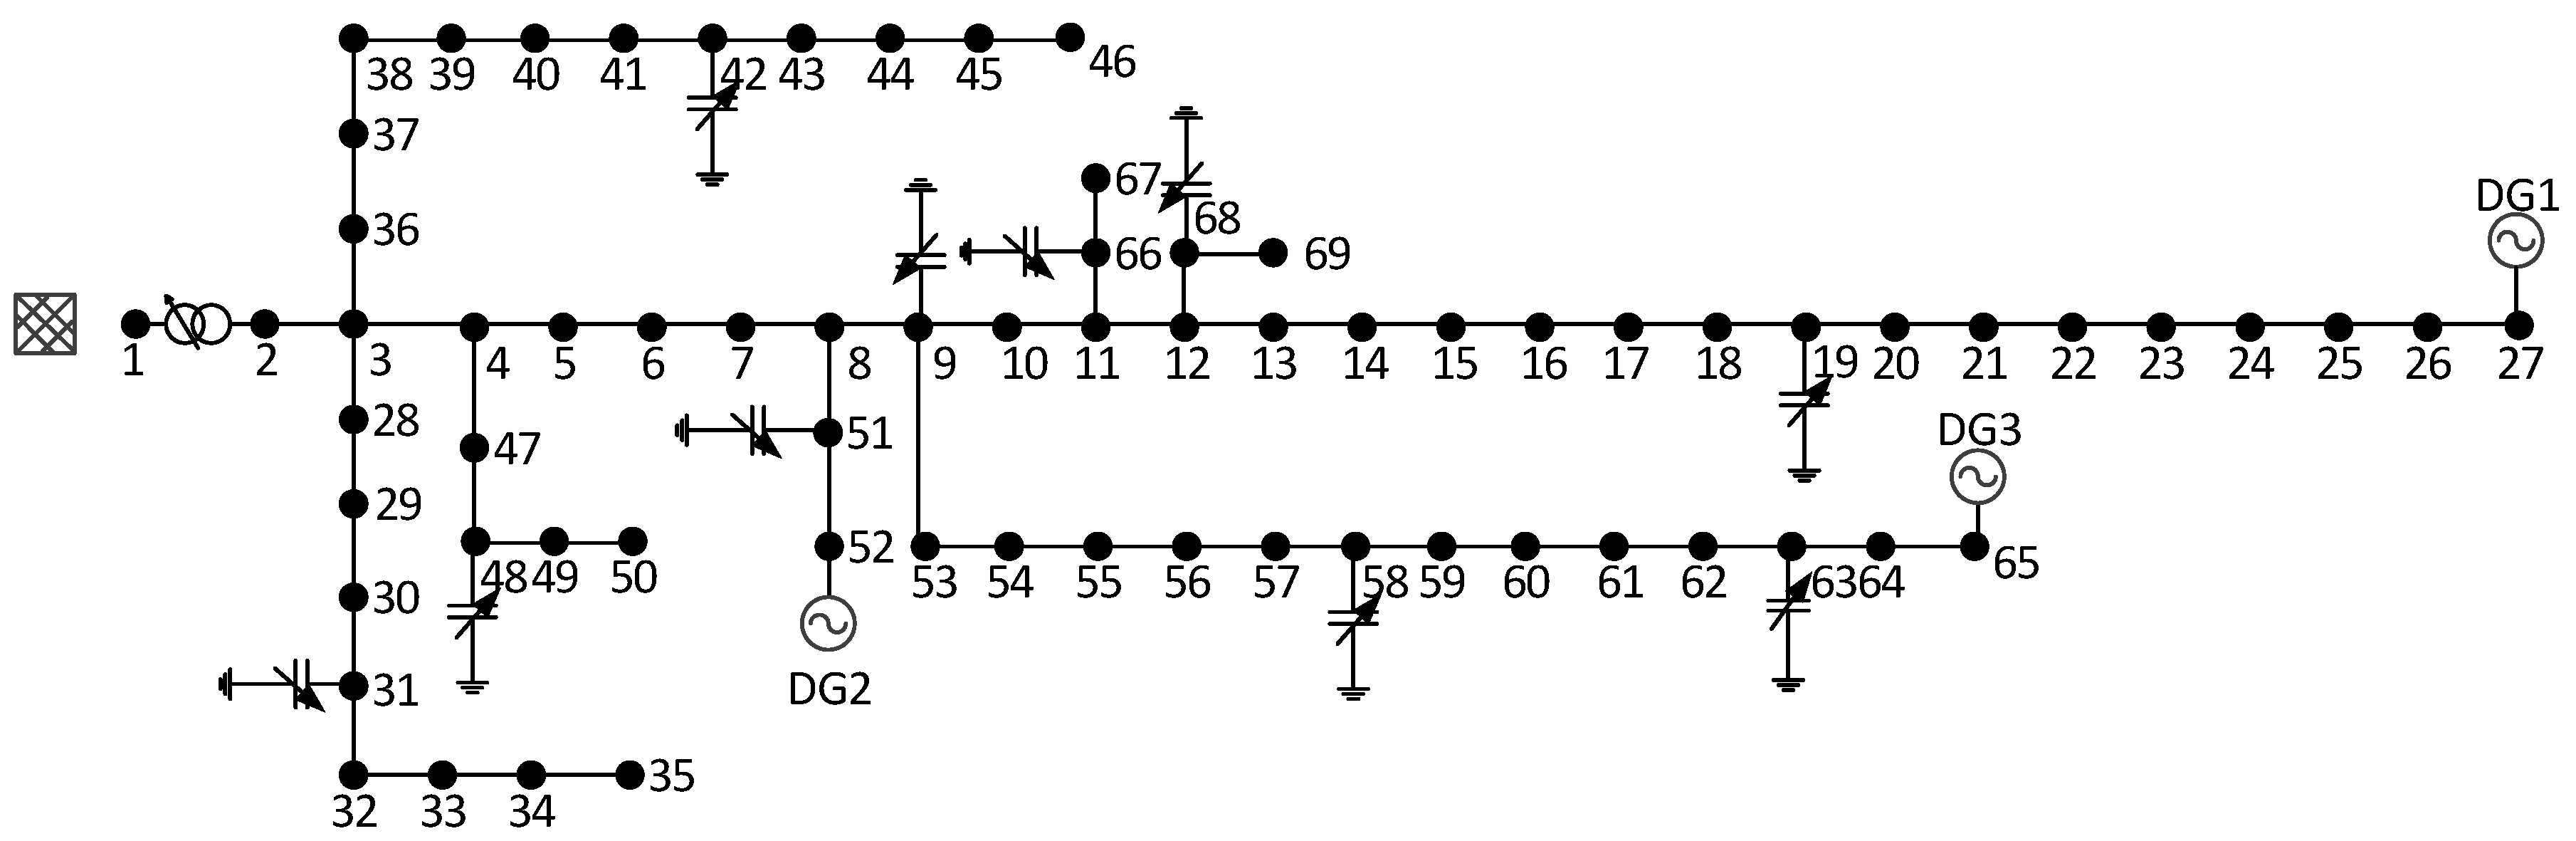
In the 69-bus case study network, referred to as network B, ten MSCs are connected to the network as shown in
Figure 5. The step size of MSCs is 0.3 MVAr. The MSCs at busbar 48 have 4 steps, and the MSC at busbar 63 has 5 steps. The remaining MSCs have 3 steps. In addition, an OLTC is connected to create a more realistic case study network. In the future scenario, three DGs are connected to buses 27, 65 and 52. The installed capacities of these three DGs are assumed to be 2.5 MW.
The case study network busbar voltages before the voltage problem algorithms have been applied are shown in
Figure 6.
5.1. Test Results—Conventional Scenarios
In these scenarios, there is no DG connected to the case study networks. In total, 160 test cases have been generated, using 2 case study networks and 40 loads conditions. For all the test conditions under the conventional scenario, both ODCDM and CS always found a feasible solution, which means there was no voltage violation observed during these tests.
It was found that there were no significant differences between the results achieved by both algorithms, in terms of network loss minimization. The computation time required for ODCDM is much shorter than that required for CS. The test results for an illustrative sample set of test conditions for Network A and Network B are shown in
Table 2.
5.2. Future Scenario
The objectives are evaluated individually under different test conditions. For each optimization objective, different load and generation conditions are used to generate the set of test conditions for the future distribution networks. For both case study networks, DG real and reactive powers are also controlled along with the existing OLTC and the MSCs in the networks.
In total, 3 objective functions and 204 load conditions were considered, resulting in the generation of a set of 612 test conditions for each case study network. The DG real power is set to the available DG real power output, and the DG reactive power is set to zero in the starting points. Step sizes of 0.01 MW/MVAr are used to discretize DG real and reactive powers for ODCDM.
5.2.1. Test Results for Network A
The results for the test condition with the minimum load and maximum generation are summarized in
Table 3.
It was found that for the majority of the test conditions, CS achieved reduced network losses, real power curtailment and reactive power export in comparison with ODCDM. The computation time required by ODCDM is still shorter than that required by CS for the majority of the test conditions. However, there are a few test conditions, such as the network loss minimization test condition as shown
Table 2, where the computation time of ODCDM is longer than that of CS. This is because DG real and reactive powers, with a step size of 0.01 MW/MVAr, introduce control variables with a large number of step sizes to the problem. ODCDM may need a large number of iterations to achieve the final result, depending on the starting point. The computation time of ODCDM could be reduced if large step sizes are used to discretize the continuous DG real and reactive powers. However, the results achieved with large step sizes may not be as good as those achieved with small step sizes.
The results for the test condition with the maximum load and maximum generation are summarized in
Table 4. It should be noted for the test cases shown in
Table 4, ODCDM failed to find a feasible solution in some of the test cases, but CS could always find a feasible solution i.e., a solution that ensured that all variables remained within constraints. In addition, when DG curtailment minimization was used as the optimization objective, CS found a feasible solution for all the 288 test cases, but ODCDM failed to find a feasible solution for 56 out of 288 test cases.
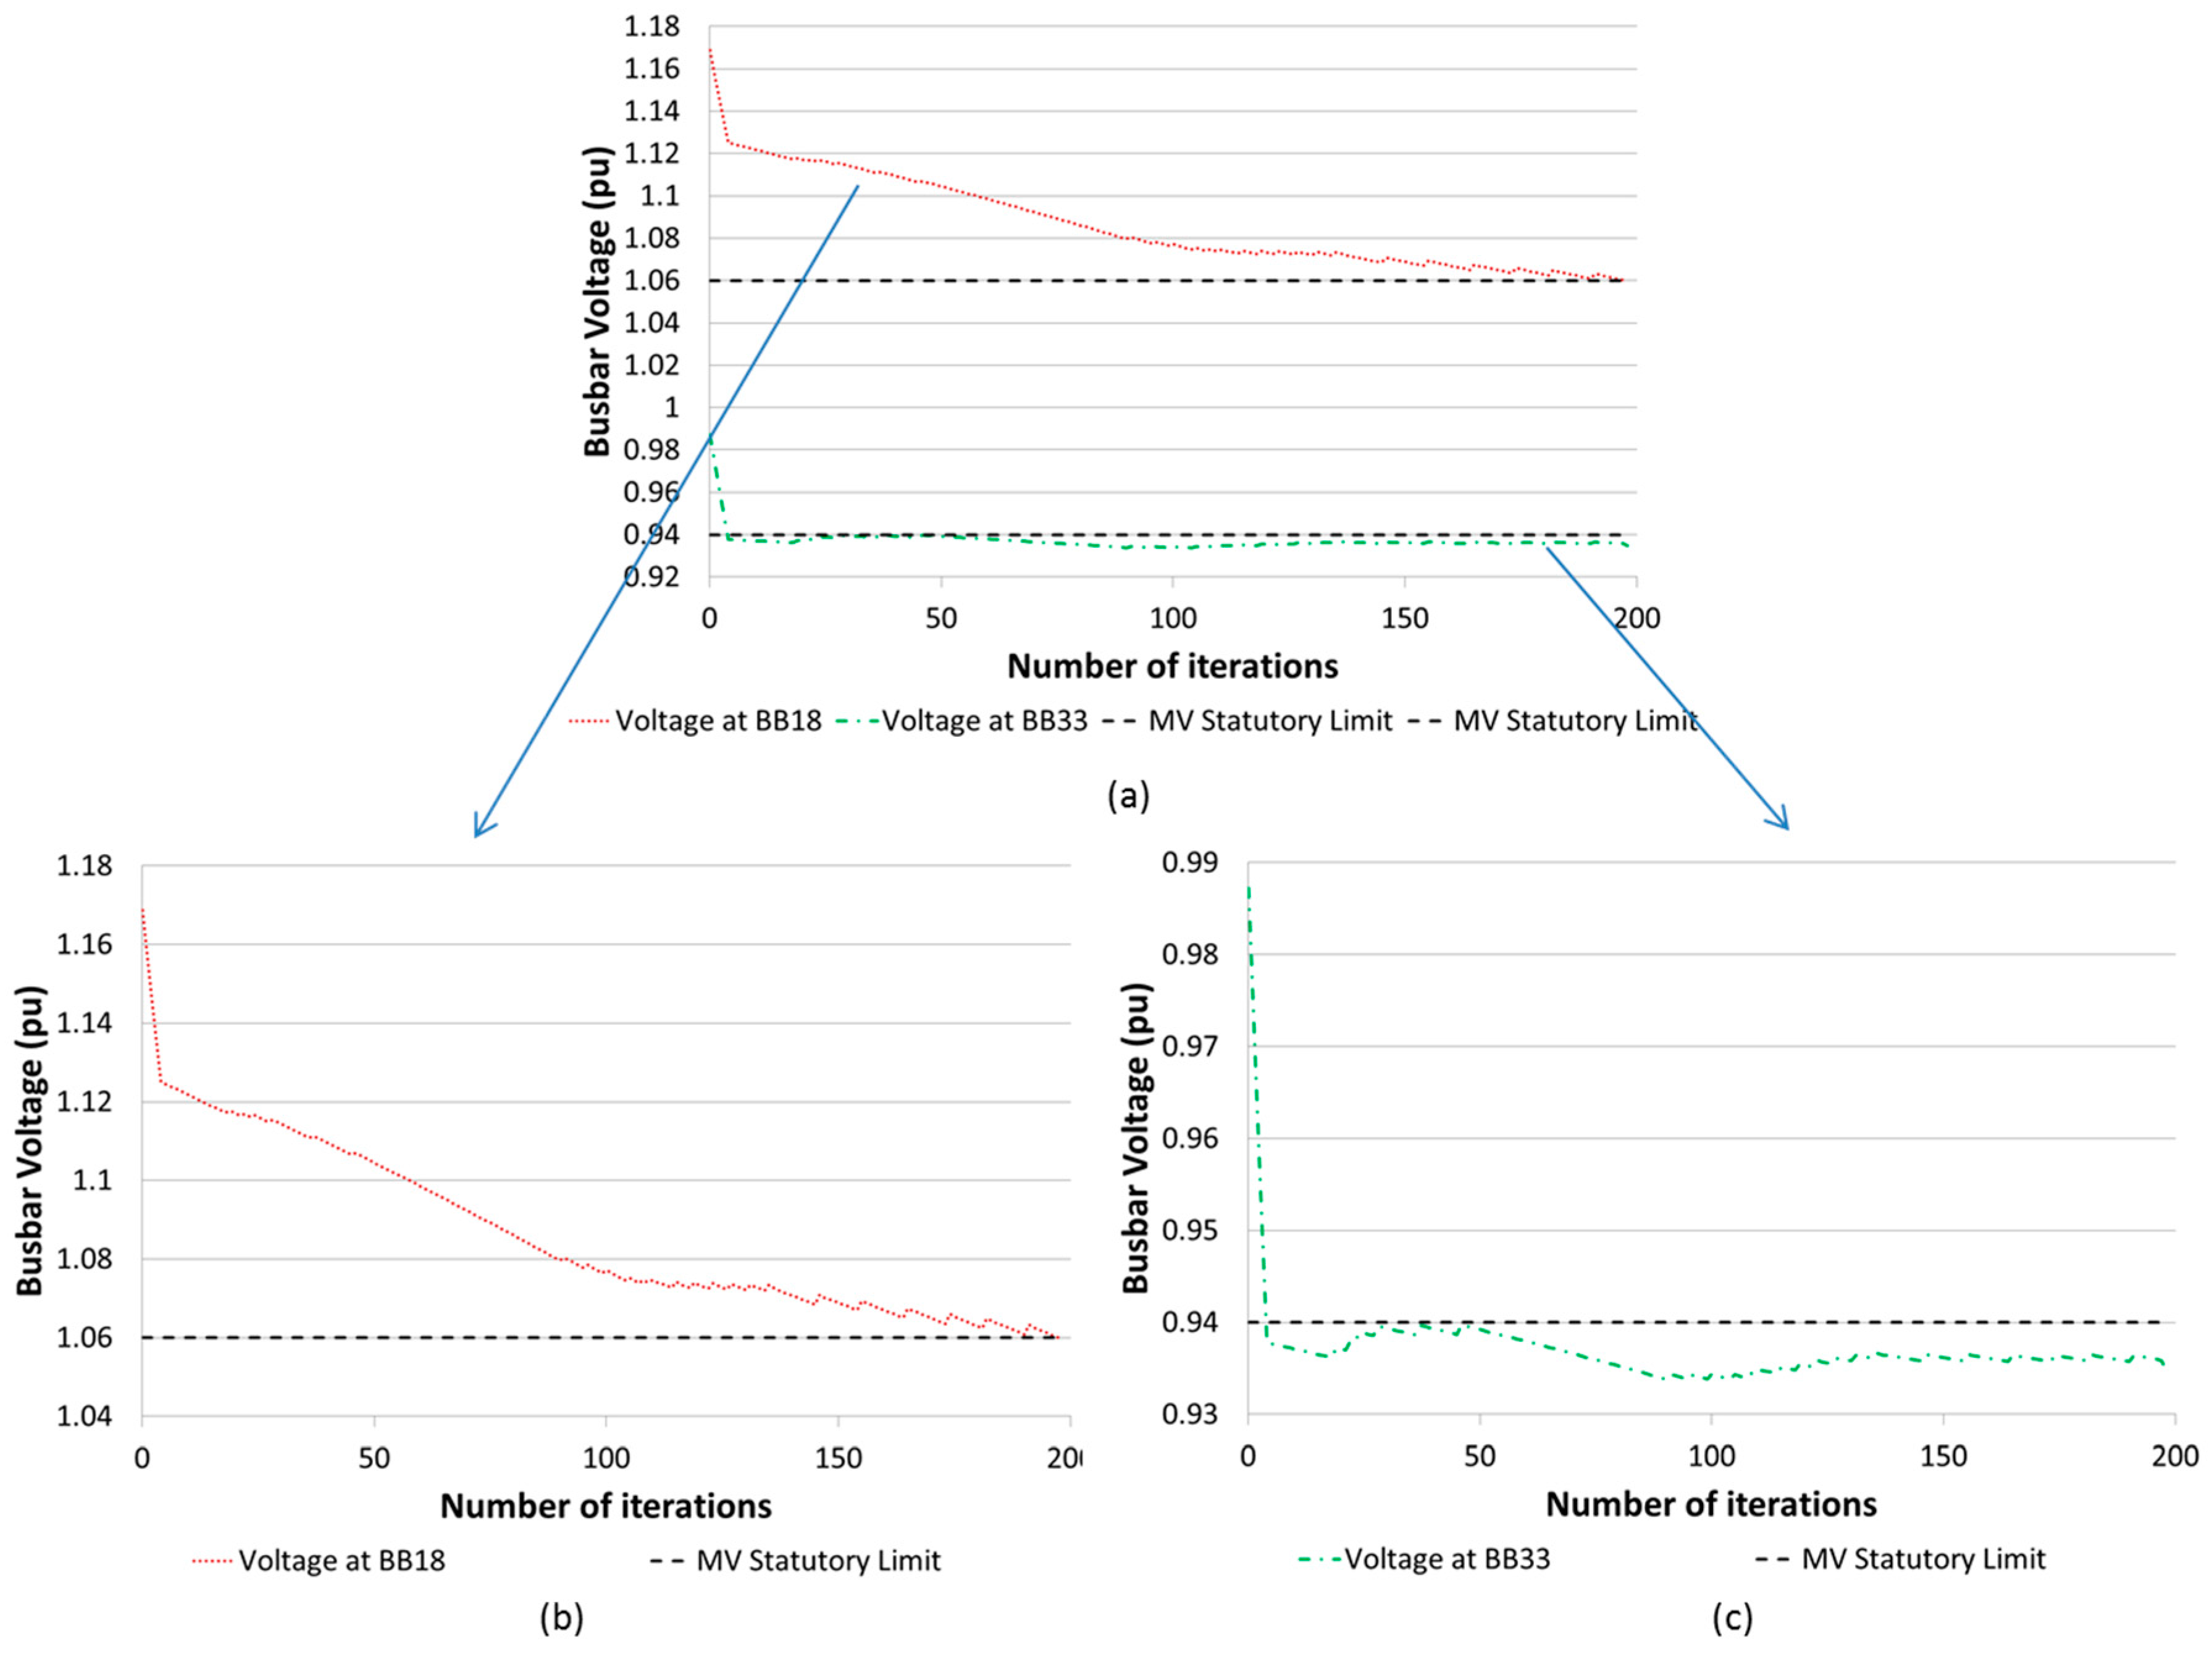
One of the 56 test conditions is used here to demonstrate the failure of ODCDM. In this test condition, the load scaling factor is set as 0.7 and DG real power output is set as 4MW. In
Figure 7, the highest and lowest voltages observed by the algorithm during each iteration of the algorithm are presented.
As shown in
Figure 7, the highest voltage was found at busbar 18, where DG is connected, and the lowest voltage was found at busbar 33, which is another feeder end. It can be seen that the total voltage violation was decreased gradually by ODCDM. However, ODCDM was “trapped” at a point and was unable to reduce the violation any further to that the voltages remained within limits. This solution could be avoided by choosing a different starting point.
For example, if the DG real power could be set as zero in the starting point (SP), then ODCDM was able to find a feasible solution with this SP. However, the result achieved regarding the DG curtailment minimization objective was 2.24 MW, while the result achieved by CS was 0 MW. The results are summarized in
Table 5.
5.2.2. Test Results for Network B
The results for the test condition with the minimum load and maximum generation are summarized in
Table 6. The results for the test condition with the maximum load and maximum generation are summarized in
Table 7. Similar observations can be found in the test results for Network B. It should be noted that for all the test cases of Network B, both ODCDM and CS could always find feasible solutions. This is because DGs are located in a more balanced way in Network B, which is less likely to create the network conditions demonstrated by
Figure 7.
The improvement in performance achieved by CS is due to the following:
- (1)
The connection of DG could create a network condition, in which there are both over voltage and under voltage problems in the network. The ODCDM solution may be “trapped” at a point because of the existence of both over and under voltages. For instance, as shown in
Table 7, the ODCDM approach required a curtailment of the DG real power, while no DG curtailment was required for the CS approach. This is because when DG curtailment was selected as the optimization objective, it was possible for CS to find a solution, which prioritized the reactive regulation. However, the ODCDM approach was trapped at a local optimal, which means the ODCDM approach failed to find this solution.
- (2)
The solution values are restricted by the step size used to discretize continuous control variables.
6. Discussion
This work demonstrates the capability and flexibility of deterministic and metaheuristic approaches to achieve solutions for voltage control problems in current and future distribution networks. As shown by the test results in this paper, the differences between the results achieved by ODCDM and CS varied from case to case. The voltage optimization problem is nonlinear and nonconvex, which theoretically has many local optimal solutions. ODCDM may only be able to find a local optimal solution, depending on the starting point; however, CS could achieve the global optimal solution when the allowed number of iterations is large enough.
For the conventional test conditions generated in this study, the differences between the results achieved by ODCDM and CS, regarding network loss minimization, are not significant. ODCDM could provide an adequate solution for these test conditions. For future distribution networks, more significant improvements can be achieved by CS, in terms of the optimization objective. CS could easily escape from infeasible local optimal solutions, while ODCDM may be trapped at an infeasible local optimal solution, when the network busbar voltages are close to both the upper and lower voltage limits. The values achieved by CS regarding the optimization objective functions could be significantly lower than those achieved by ODCDM. It should be noted that the actual differences between the results achieved by the algorithms for specific test conditions also depend on the results achieved by ODCDM, which are affected by some issues, such as the SP of ODCDM.
Regarding the computation time, it generally includes two parts: time used for fitness function evaluation and time used for algorithm itself. The time used for fitness function evaluation depends mainly on the network size and the objective function. The time used for algorithm itself depends on the number of control variables. As expected, ODCDM has a shorter computation time under all test conditions; however, it is possible, with detailed information, to speed up the metaheuristic algorithms.
When the DGs are integrated into the system and particularly when the number of DGs is increased, it is observed that the number of local optimal solutions is increased and the results obtained by ODCDM may be substantially inferior to the global optimal solution or even infeasible. This is not only because of the introduction of continuous variables but also the increase in the non-convexity of the problem.
In future distribution networks, with integration of large quantities of unplanned, clustered LCT, more sophisticated voltage control will be required. It should also be noted that, potentially, more control objectives, which may not be compatible to each other, need to be considered within any voltage control scheme. These developments will make use of metaheuristic algorithms within these voltage schemes more attractive.
In this paper, only three-phase balanced networks are considered. Different types of load connection, especially in low voltage networks, will affect the level of unbalance. However, the majority of current voltage control devices are three-phase balanced and cannot solve voltage unbalance issues. Therefore, in this paper, only three-phase balanced load connection was assumed, which is also consistent with the current industrial practice and previous publications. In future work, voltage control algorithms with voltage unbalance correction will be considered.
This paper focuses on the comparison of steady state voltage control algorithm-based OPF techniques in distribution networks. Wider issues, however, such as hybrid renewable energy sources (HRES) in smart grid, should also be considered [
29,
30,
31,
32,
33,
34,
35]. Dynamic operation and fault analysis becomes more important and challenging in distribution networks and microgrids with high penetrations of HRES. In [
31], a modified bird-mating optimization with hill-climb was proposed to solve transformer placement problem considering voltage imbalance. Stability and fault analysis for HRES systems have been explored in [
32,
33,
34]. In [
35], a novel intelligent damping controller was developed for STATCOM for improving power quality and damping considering wind farm, battery energy storage and micro-turbine generation. Algorithms for high penetrations of HRES should be considered in future work.
7. Conclusions
Advanced voltage control architectures and algorithms will be required to solve the future voltage control problems, for which existing voltage control architectures and algorithms struggle to provide adequate solutions. Two centralized optimization algorithms ODCDM and CS have been comparatively evaluated using a set of scenarios for conventional and future distribution networks. The control of DG real and reactive power is used here to represent the novel voltage control techniques in future distribution networks.
ODCDM and CS have been comparatively evaluated regarding their abilities to find feasible solutions, values achieved for objective functions and computation times. From the results, it was found that both ODCDM and CS are able to find optimal solutions when different optimization objectives are used. ODCDM could determine adequate solutions for conventional distribution networks with shorter computation time. In future distribution networks, particularly in networks with large non-uniform distributions of DG or ESS, CS could provide improved performance and reduced generation curtailment in comparison with ODCDM. Furthermore, CS does not become trapped at infeasible local optimal solutions in contrast to ODCDM.


