How Can China Achieve Its Nationally Determined Contribution Targets Combining Emissions Trading Scheme and Renewable Energy Policies?


1
School of Statistics and Management, Shanghai University of Finance and Economics, Shanghai 200433, China
2
School of Economics and Management, Beihang University, Beijing 100191, China
3
Institutes of Science and Development, Chinese Academy of Sciences, Beijing 100190, China
4
School of Public Policy and Management, University of Chinese Academy of Sciences, Beijing 100049, China
*
Author to whom correspondence should be addressed.
Energies 2017, 10(8), 1166; https://doi.org/10.3390/en10081166
Submission received: 31 March 2017
/
Revised: 6 July 2017
/
Accepted: 7 July 2017
/
Published: 8 August 2017
(This article belongs to the Special Issue Lessons from the Evaluation of Existing Emission Trading Schemes)
Abstract
:The adoption of emissions trading scheme (ETS) and renewable energy sources (RES) policies have been essential to achieving China’s national targets for reducing CO2 emissions and developing non-fossil energy sources. The combination of ETS and RES policies raises an important issue: What is the effect of combining ETS and RES policies on the existing carbon market and economy? Focusing on the design of the nationwide carbon market, this paper uses a multi-regional computable general equilibrium (CGE) model to analyze the economic impacts of ETS policy when combined with RES policies in China. The results show that China’s annual ETS emissions cap should decrease by 0.3% to maintain stable CO2 prices and achieve the targets in China’s intended nationally determined contribution (INDC). It is estimated that the CO2 price on the nationwide carbon market would decrease by 11–64% when the renewable energy subsidy rate increases from 20 to 100%, and the total trading volume would decrease by 3–25%. The results also show that the combination of an ETS and a feed-in tariff (FIT) results in greater GDP cost and welfare loss in all Chinese regions, increasing the total social cost by 0.01–0.06%.
1. Introduction
Addressing climate change and promoting low-carbon development are the two key goals of energy policy in China. In an effort to join international action to address climate change at a national level, the Chinese government has set the ambitious target of cutting CO2 emissions per unit of GDP by 60–65% of the 2005 level by the year 2030. This target has been submitted to the United Nations Framework Convention on Climate Change (UNFCCC) via the Intended Nationally Determined Contribution (INDC). China has also announced its intention for 20% of total energy consumption to be derived from non-fossil sources by 2030, in order to promote renewable energy development. As of now, the primary tools to meet these two targets are emissions trading schemes (ETS) and renewable energy source (RES) policies [1,2]. Being the most important instrument for emissions reduction, the ETS was first implemented in seven pilots at provincial and city levels in China, and a nationwide carbon market is to be launched in late 2017. Besides its main intention of emissions reduction, the nationwide carbon market is also intended to transfer wealth across regions, thereby promoting economic development in central and western China. The market-based mechanism of the ETS provides an opportunity for the central and western regions to benefit from quota sales. These regions are less developed but they are rich in natural resources, and thereby these regions have lower marginal abatement costs than eastern regions. By reducing emissions in low abatement costs and selling the excessive quotas in a higher carbon price to eastern regions in the ETS, the central and western regions would obtain trading revenues from eastern regions, causing wealth transfer across regions. Thus, the design of nationwide carbon market to include quota allocation and cap setting is essential to policy makers in China. Prior to the ETS, the RES policy was adopted in 2006 in the form of feed-in tariffs (FITs) for renewable energy power generation, with the goal of developing renewable energy in China.
The European Union’s emissions trading scheme (EU ETS) demonstrated that its impacts on renewables and demand-side energy savings are limited, and it may not provide sufficient incentives for technology innovation. The EU experience teaches that it is necessary to have a specific renewable target in addition to an ETS system [3,4,5]. This is of great significance to the climate change strategy in China.
The design efforts for the nationwide carbon market are currently underway. However, the multiple INDC targets and policy instruments create uncertainty regarding the impacts of the ETS. This uncertainty creates a challenge for the design process. Due to the overlapping sectoral coverage of these policies, the policy objectives are interrelated and there is interaction between policy instruments [6]. The coexisting multiple policy instruments may have a synergistic effect; for example, the RES policy promotes the substitution of fossil fuels by renewable energy and reduces CO2 emissions while increasing the supply of renewable energy [7,8,9,10]. However, the mixed policies may also have conflicts and even lead to the failure of some policy instruments and, in turn, increase the social costs of policy implementation. Experience from the EU ETS demonstrated that the implementation of a RES policy adjusting resulted in additional CO2 emissions reduction and decreased the demand for CO2 permits. These effects were not considered in the EU ETS design and, thus, led to an unexpectedly low carbon price [11,12,13,14].
The EU ETS experience has sparked intense debates about the overlap between ETS and RES policies. Fischer and Preonas [15] suggested that the effects of RES policy on the ETS should be acknowledged; the RES policy makes it easier to meet the emissions cap and drive down carbon prices to the benefit of the relatively dirty sources. Koch et al. [16] conducted an empirical analysis of Phase II and the first year of Phase III of the EU ETS. They found that the coexistence of EU ETS and RES deployment targets work at cross-purposes in deed. But it could, together with the economic recession and the use of international credits, only explain 10% of the variations of the EU Allowances (EUAs) price changes. Using Spain as a case study, Del Rio [17] found that the combination of the ETS and FITs generally leads to higher consumer costs. He also suggested that renewable energy targets should be considered when deciding on the quantities of EUAs to be allocated.
Some scholars explore the possibility of achieving the multiple climate goals by a single ETS or RES policy, as opposed to a combination of the two, through a long-term simulation. Anandarajah and Strachan [18] analyzed the effects of renewable policy on the UK’s 2020 and 2050 emissions reduction targets. They found that, although renewable policies can reduce emissions, such policies alone cannot meet the long-term 2050 CO2 mitigation target. Likewise, the long-term emissions reduction policy cannot meet the UK’s renewable targets without concurrent renewable policies. Linares et al.’s [19] analysis of the EU example also supported the notation that both ETS and RES policies are required to meet the emissions reduction and renewable energy targets.
Other analyses focus on the policy design and consider the interaction of mixed policies. Fais et al. [20] asserted that the German FITs will cause a reduction in EU ETS certificate prices by 1.9 E/tCO2 to 6.1 E/tCO2 between 2015 and 2030. They further suggested that the impact of RES policy on emission mitigation should be considered when defining the long-term ETS targets, to avoid weakening the CO2 price signal. Some studies applied the partial or computable general equilibrium model to evaluate the socio-economic impacts of the ETS or the combination of ETS and RES policies, as seen in Fujimori et al. [21,22], Zhang et al. [23], Hübler et al. [24], Morris [25], Böhringer and Behrens [26], and Del Rio [27]. Cheng et al. [28], Wang et al. [29], and Wu et al. [30] each assessed the ETS in Guangdong and Shanghai from a regional perspective, using a two-region CGE model. Brink et al. [31] evaluated various options to support CO2 prices in the EU ETS using a CGE model. They suggested that, while a tighter cap increases the EUA price under various economic growth assumptions, a fixed or variable CO2 tax and an auction reserve price are better in guaranteeing a floor in the effective CO2 price.
The ETS pilots in China showed that the over-allocation risk of emissions permits is one of the challenges for a carbon market, which will lead to low carbon price and reduce the efficiency of market [32]. Therefore, it is extremely important to design a nationwide carbon market under the full consideration of the possible interaction between the ETS and RES policies. Lin et al. [33] discussed how ETS and FIT policies harmonize in China. However, their discussion lacks a quantitative analysis on ETS and RES policy interaction. Mittal et al. [34] quantified the impacts of renewable energy on emissions reduction targets and mitigation costs in China using the Asian-Pacific Integrated Model/Computable General Equilibrium (AIM/CGE) model, but their study did not address the ETS policy.
In the present paper, we analyze the interactions between ETS and RES policies in China using a multi-regional CGE model, which is able to capture the economy-wide impacts. Focusing on the design of the nationwide carbon market, we analyze a FIT in combination with an ETS to determine the national- and regional-level impacts on the carbon market, the social costs, and the electricity industry.
The paper is organized as follows: Section 2 describes the CGE model used and how ETS and RES policies are implemented in this model. Section 3 presents the data and policy scenarios. Section 4 explores the effects of an ETS alone and an ETS in combination with an RES, and Section 5 further discusses the two sensitivity analyses. Section 6 presents the conclusions.
2. Methodology
The quantitative analysis is based on the CEEP Multi-Regional Energy-Environment-Economy Modelling System (CE3MS) that was mainly used in climate mitigation and impact analysis [35,36,37]. The CE3MS classifies 30 regions in mainland China (excluding Tibet due to a lack of data) and 17 industrial classifications in each region, including one agricultural, five energy, seven non-energy, and four service sectors (shown in Table 1).
2.1. Basic Structure of CE3MS
Two kinds of regions constitute the CE3MS: 30 Chinese economic regions and one representing the rest of the world (ROW). The model accounts for economic activities including production, consumption, investment, export and import, inter-regional commodity trading, and factor mobility. Wu et al. [36] provide the mathematical formulas for these economic activities. There are six modules in CE3MS: production, emissions trading, commodity trading, institution, labor and capital mobility, and macro closure.
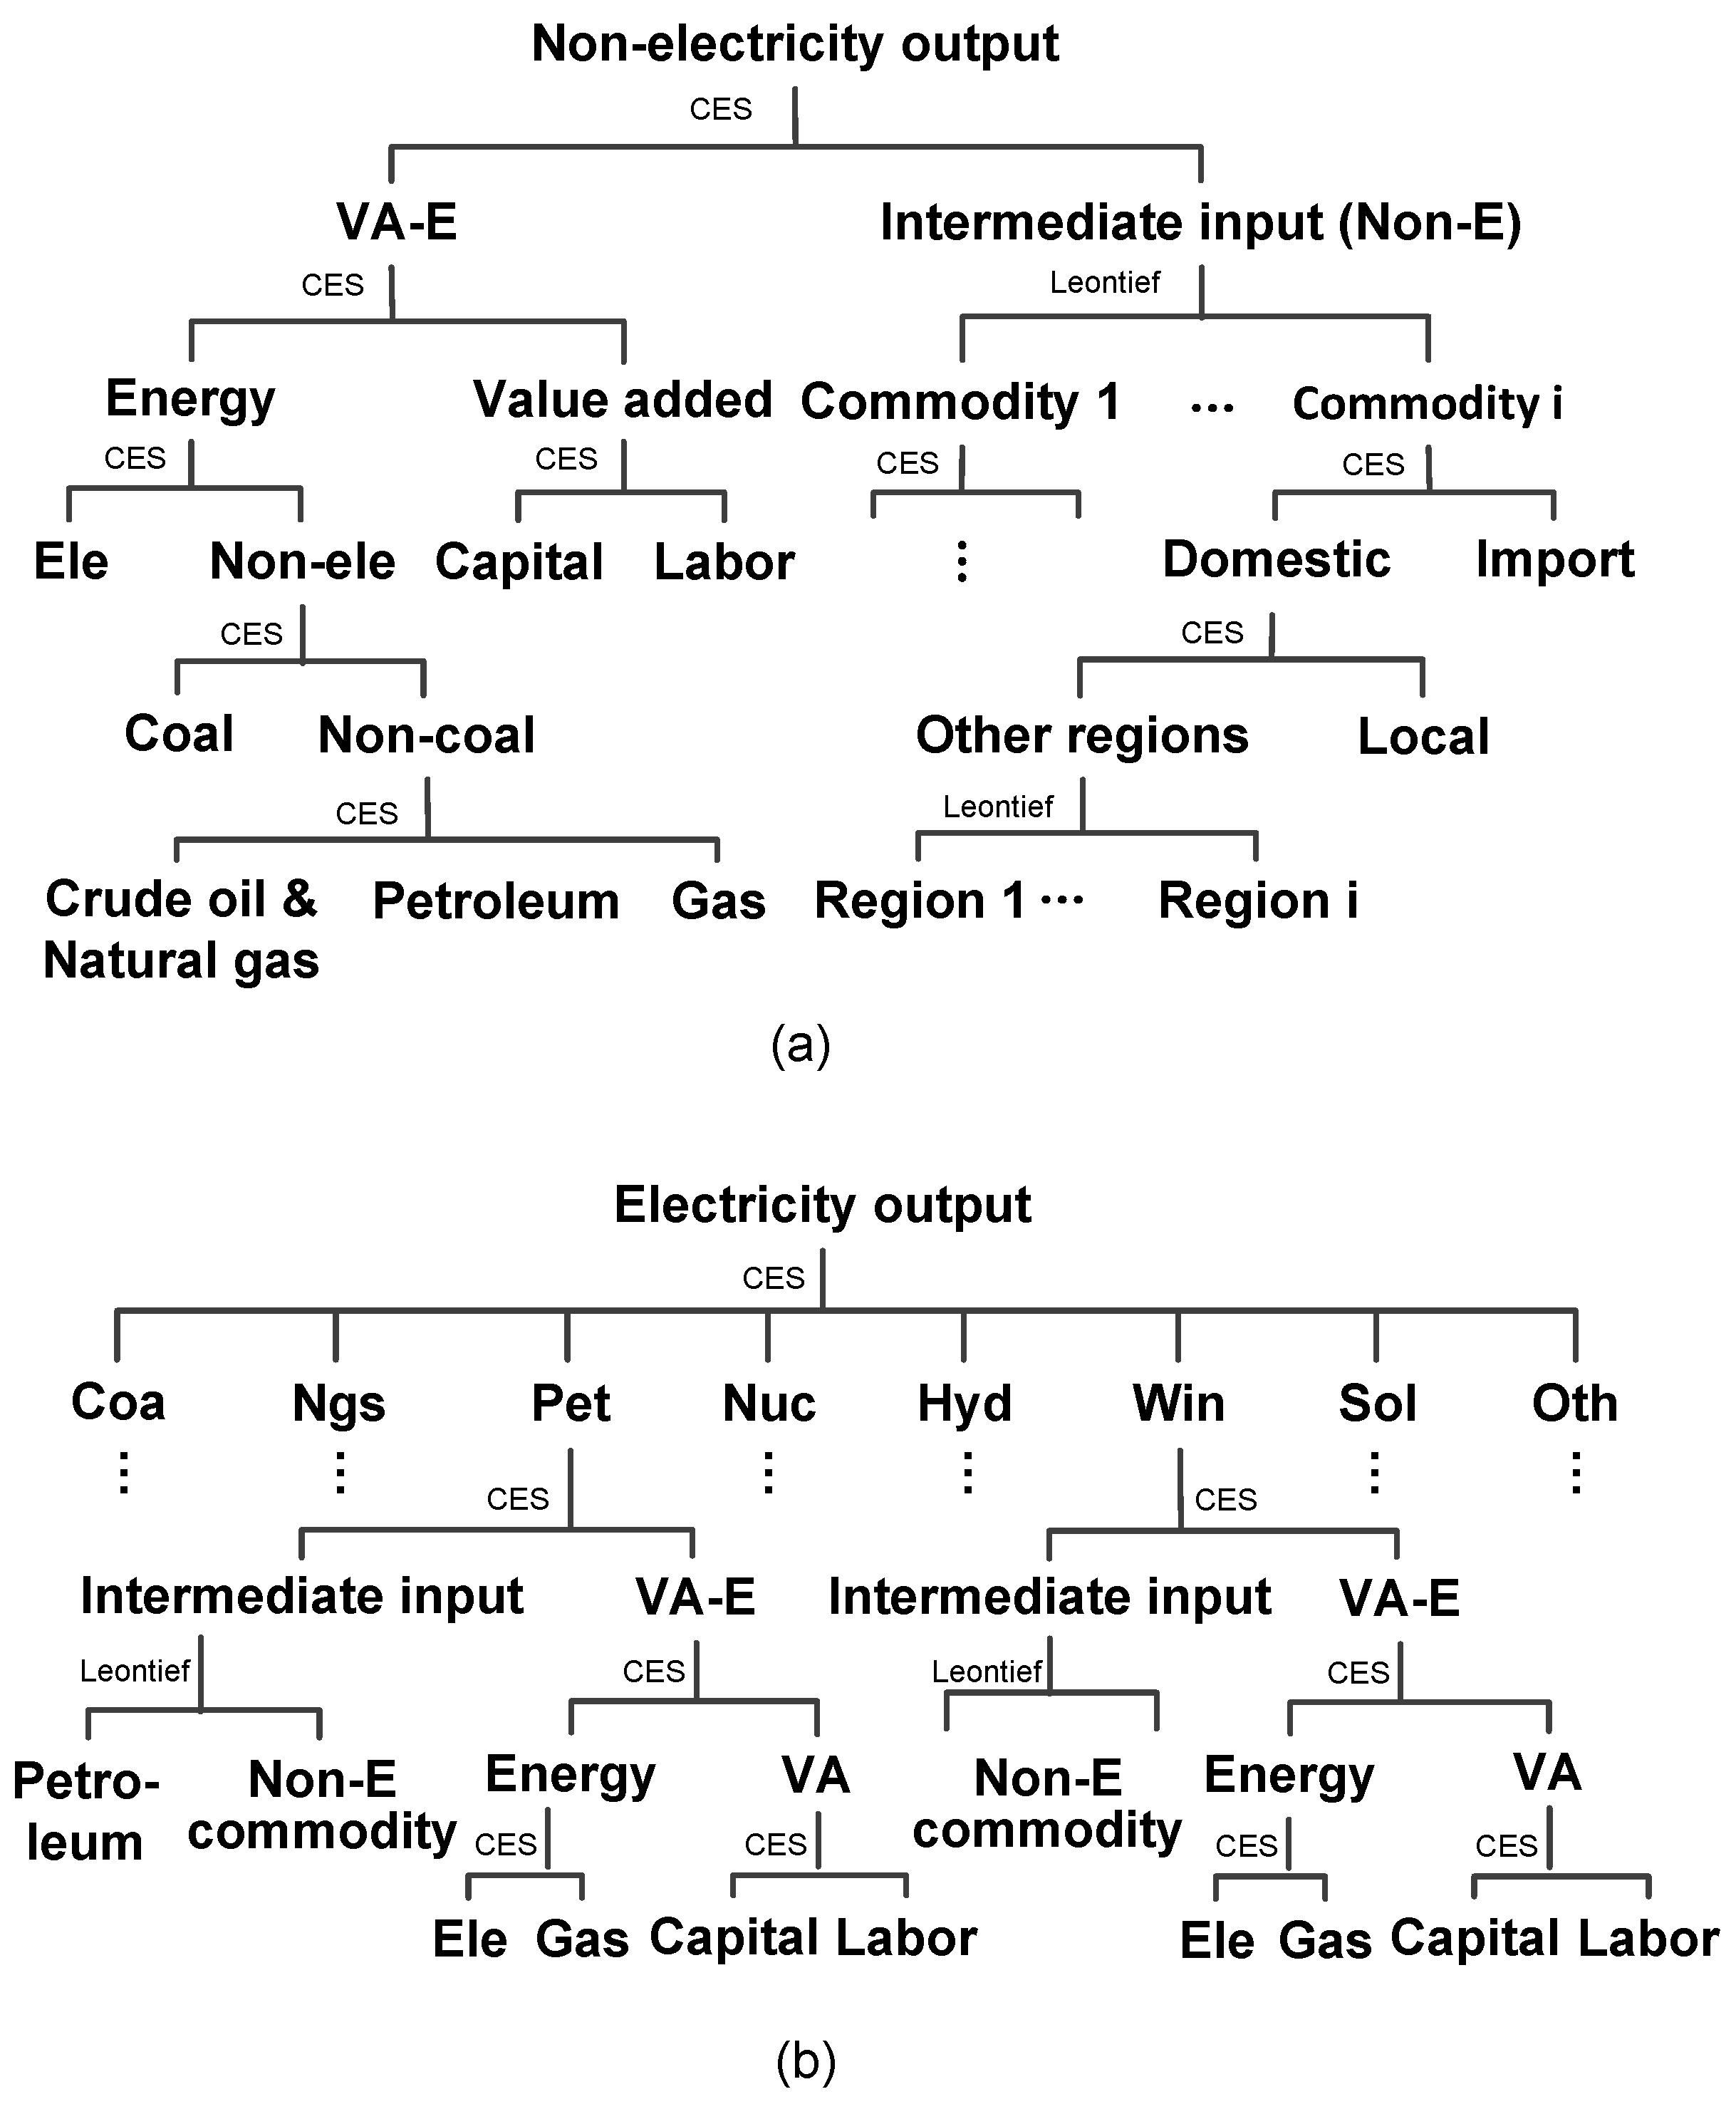
The production module describes the production activities of different sectors under the assumption of cost minimization. A nested structure of the constant elasticity substitution (CES) function is adopted to formulate the production structure. For non-electricity sectors, the output is composed of non-energy intermediate inputs and the capital-labor-energy inputs (Figure 1a).
It is important that the industrial classification of the power generation sector is disaggregated in detail, as technological description is crucial for the RES policy implementation in this study. For that reason, the electric power generation is represented by eight technologies in CE3MS: coal power (Coa), natural gas power (Ngs), petroleum power (Pet), nuclear power (Nuc), hydropower (Hyd), wind power (Win), solar power (Sol), and other renewable technologies (Oth), as well as their technological and cost parameters in the CES functions. Figure 1b represents the nested CES structure of electricity production. Particularly, the input of coal, crude oil, and natural gas are considered as intermediate inputs which could not be substituted by other energy as raw materials in the coal-powered (Coa), natural gas-powered (Ngs), and petroleum-powered (Pet) generation.
In the commodity trading module, consisting of domestic trade and international trade, the Armington assumption is adopted to describe the imperfect substitutions between domestic commodities (including local commodities and commodities from other regions in China) and import from the ROW. The distribution of domestically produced commodities between exports and domestic sales is expressed by the constant elasticity transformation (CET) function. The “small country” assumption is adopted in international trade, where we assume that the export and import prices of commodities will not be affected by their supply and demand in China.
The institution module describes the economic activities of institutions—income, expenditure, and savings—including rural and urban households, the representative enterprise, regional governments, and the central government. Both households and regional governments have commodity consumption and the utility functions of households and local governments are assumed as Cobb-Douglas functions in this model.
In the labor and capital mobility module, labor and capital are assumed to transfer across sectors and regions based on the changes in relative wage and returns on capital. In the macroeconomic balance, the “neoclassical closure” is introduced that investment is determined by the sum of households, government, and foreign savings in CE3MS.
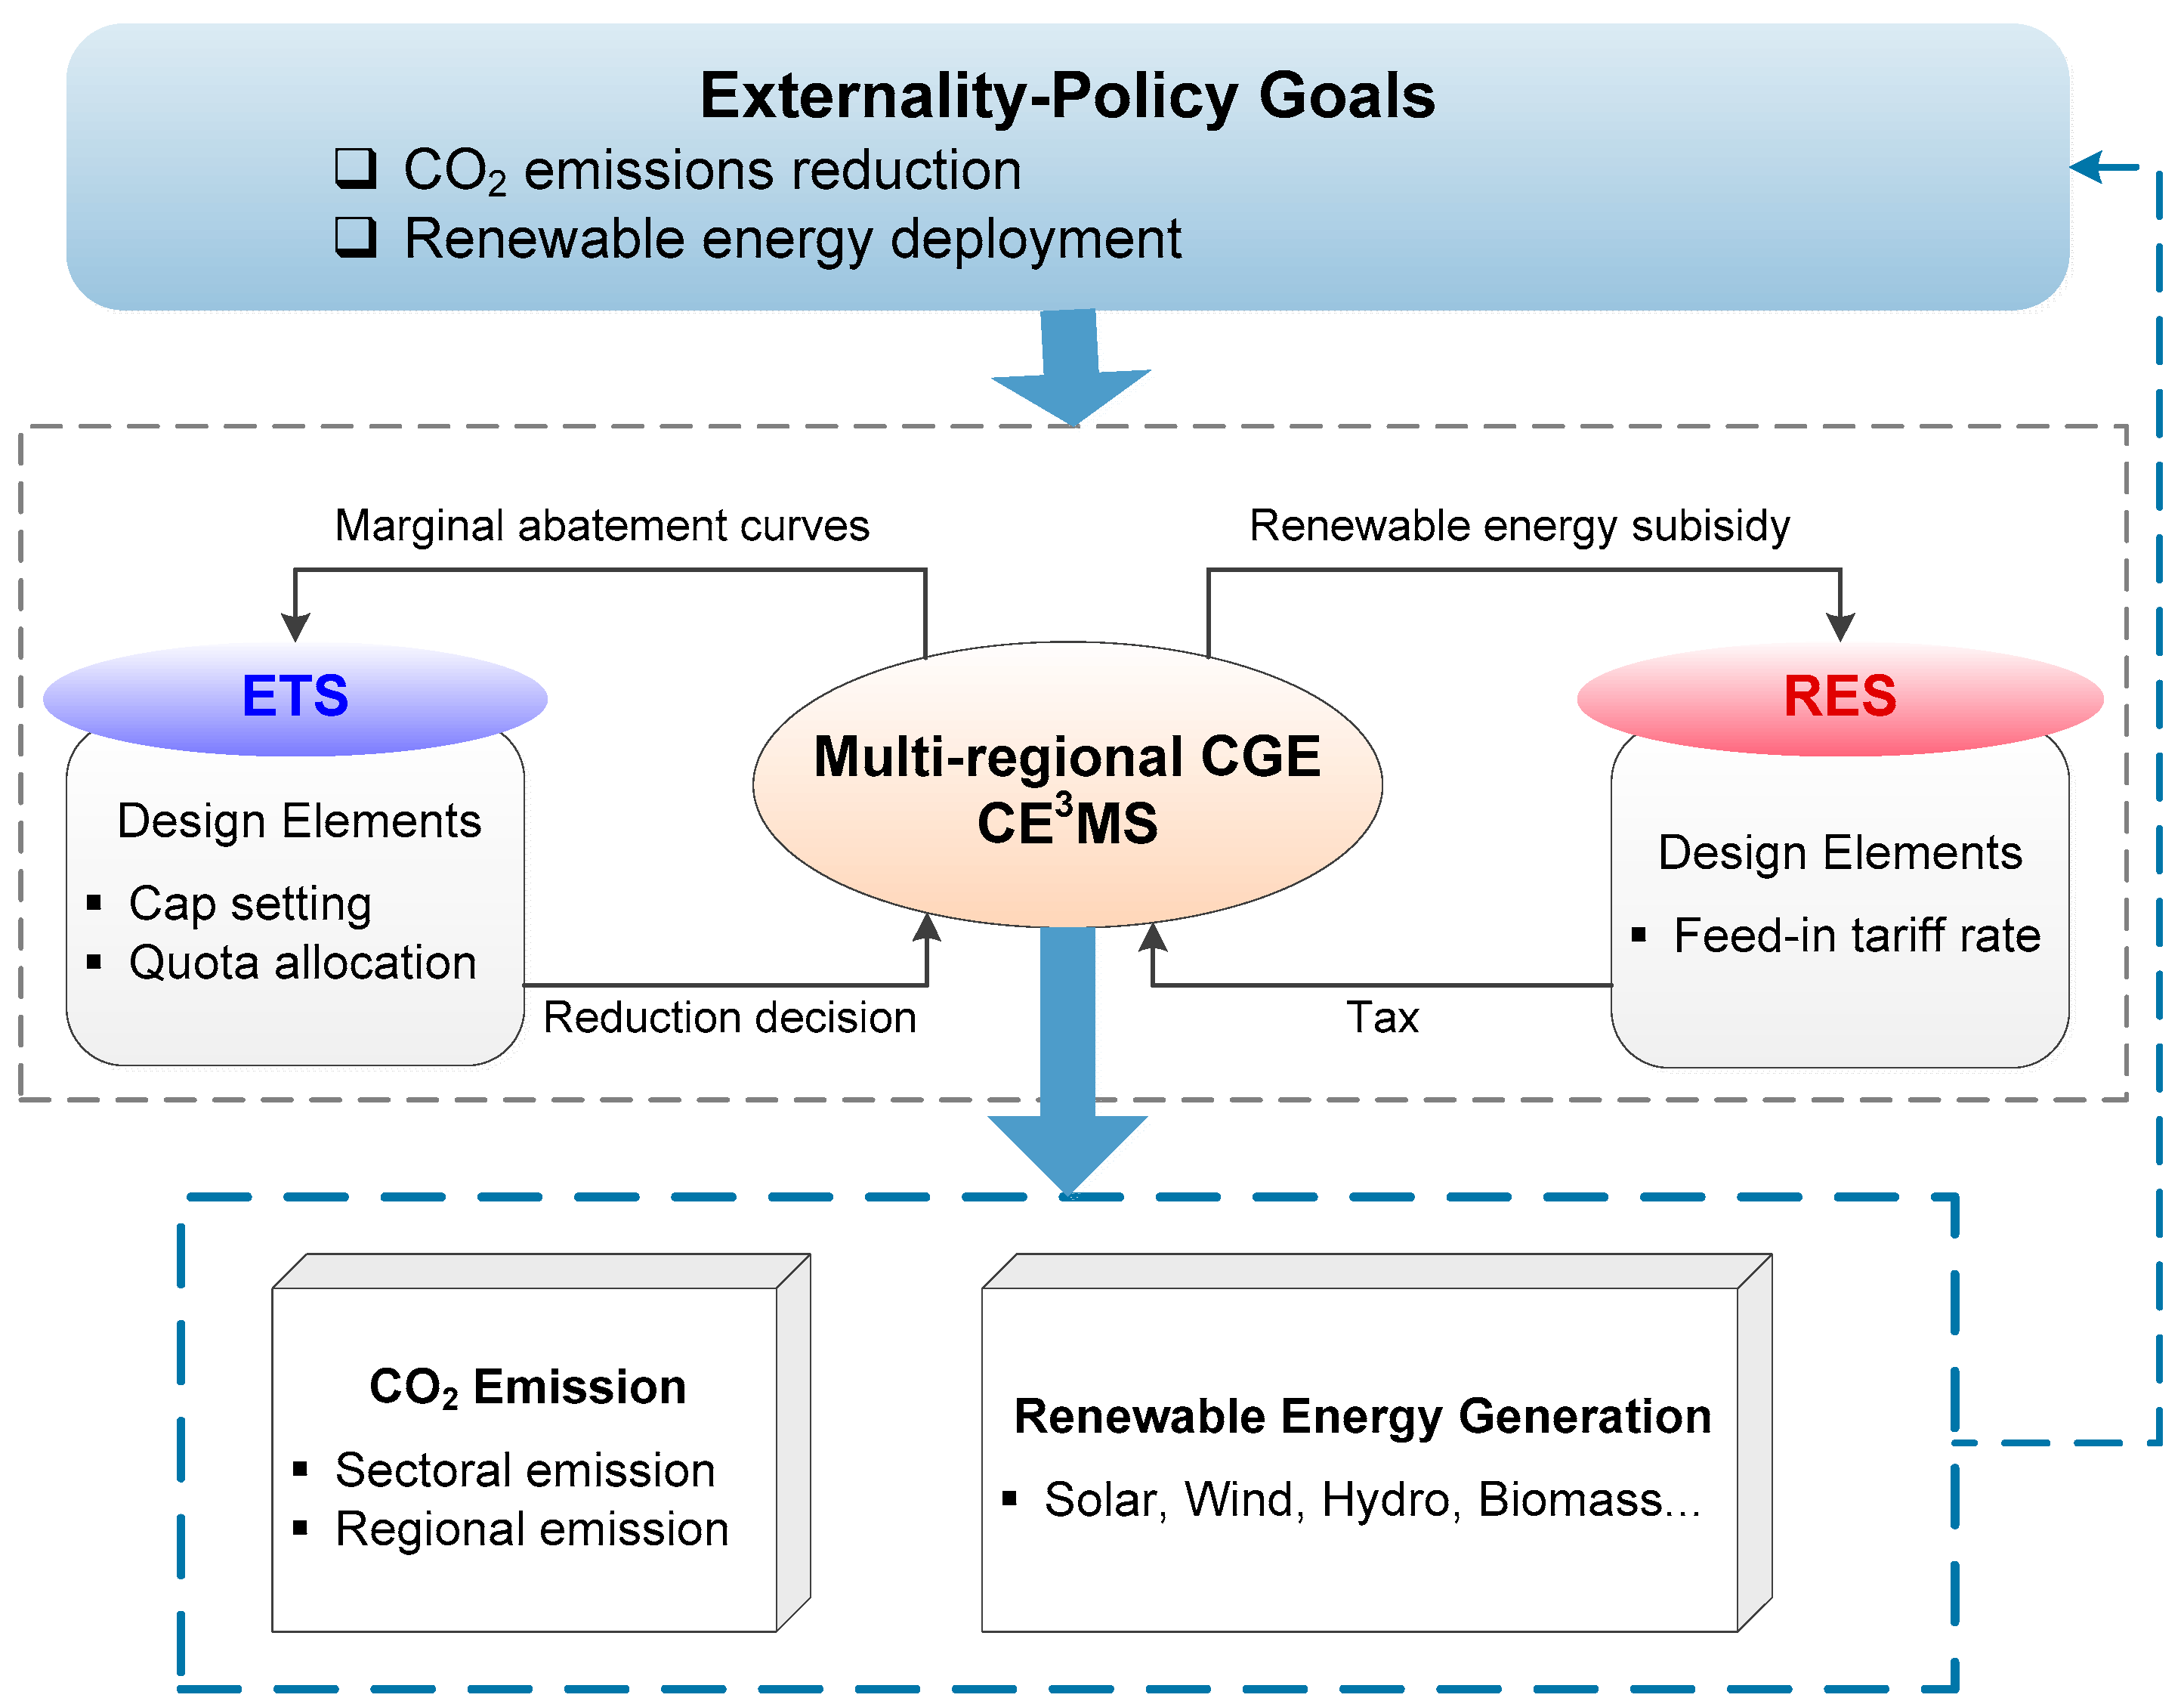
As the ETS and RES policies are focused in this study, we summarize the key aspects in ETS and RES policy modelling in the Section 2.2, Section 2.3 and Section 2.4. Figure 2 presents the framework for combining ETS and RES policies in CE3MS.
2.2. Description of the INDC Targets in CE3MS
As CE3MS is a static model, one of the problems we encounter in this analysis is how to deal with the long-term mitigation targets in a static model. Rather than making the model dynamic in a recursive dynamic manner as many literatures [21,22,28,29,30], we choose a simple way to decompose the long-term target into a single-year target which could be modeled in a static model. The main reason is that it is difficult to decide the growth of related parameters across different regions making a multi-regional model dynamic, including capital stock, labor force, energy efficiency improvement, and the total factor productivity in different regions. Based on the projection of CO2 intensity reduction and renewable energy generation from International Energy Agency (IEA) and other literatures [38,39,40], we convert the INDC targets into single-year targets.
The emissions reduction target of 65% in the INDC is adopted in this analysis, and we simply assume that CO2 intensity is anticipated to decrease at an annual rate in China for the 2007–2030 period. According to the historic CO2 intensity data during 2005–2010 from International Energy Agency and an assumed CO2 intensity reduction induced by autonomous energy efficiency improvement (AEEI) without any mitigation policies during 2010–2030 from Zhang et al. [38], it is calculated that an additional 20.52% decrease in CO2 intensity between 2007 and 2030 is needed to achieve the INDC target (Table 2). Therefore, we adopt an annual rate of 0.99% under the assumption of a linear decrease in CO2 intensity. In the base case, the total CO2 emissions are 6381.30 Mt in year 2007. For simplicity, we count the 0.99% of 6381.30 Mt, 63.17 Mt, as the quantity target for emissions reduction in this study.
To achieve the RES target of 20% in INDC, the share of renewable energy generation including wind power (Win), solar power (Sol), and other renewable technologies (Oth) in the total power generation should be 15.5% by 2030 according to China Energy Research Society [40]. The initial renewable energy ratio in total electricity generation in the base case is about 14.95%. Therefore, the need to install additional renewable capacity to meet a renewable generation target is 15.17% in total. We assume the same growth of renewable energy generation proportion for the 2007–2030 period, and thereby derive the single-year growth of 0.66%.
2.3. Modelling Approach for ETS
The ETS modelling in the CGE model is usually handled by implementing an endogenous carbon tax or treating allowance as a special input factor [21,22,23,24,28,29,30,42,43,44,45,46]. Although the impacts of implementing an ETS or an endogenous carbon tax on economies are the same theoretically, emissions trading is a decision optimization process for each trader under the principle of cost minimization. The scholarly discourse on ETS is lacking in this kind of description in ETS. To improve the characterization of ETS policy, an optimization modelling approach has been developed in CE3MS so as to reflect the decision-making process of emissions traders and the formation of equilibrium carbon price (Equations (1) and (2)):
denotes the total costs related to emissions reduction of the trading sector tj in region r. is the abatement cost function which is derived from the marginal abatement cost curves. and are the emissions in the base case and real emissions under the ETS policy, respectively. is the equilibrium CO2 price, and is the initial emission quota.
In this optimization model, each trading sector decides on emission reductions by comparing its marginal abatement costs with the CO2 price to minimize total abatement costs. Comprehensive data on sectoral marginal abatement costs in each region are required to implement this optimization approach. The marginal abatement cost curves used in this analysis are estimated by applying a unified carbon tax in CE3MS. The detailed results are provided by Fan et al. [37]. Eight sectors—five energy (Coal, Coil, Petro, Ele, Gas) and three energy-intensive (Chem, Nmm, Metal)—are considered as emissions traders.
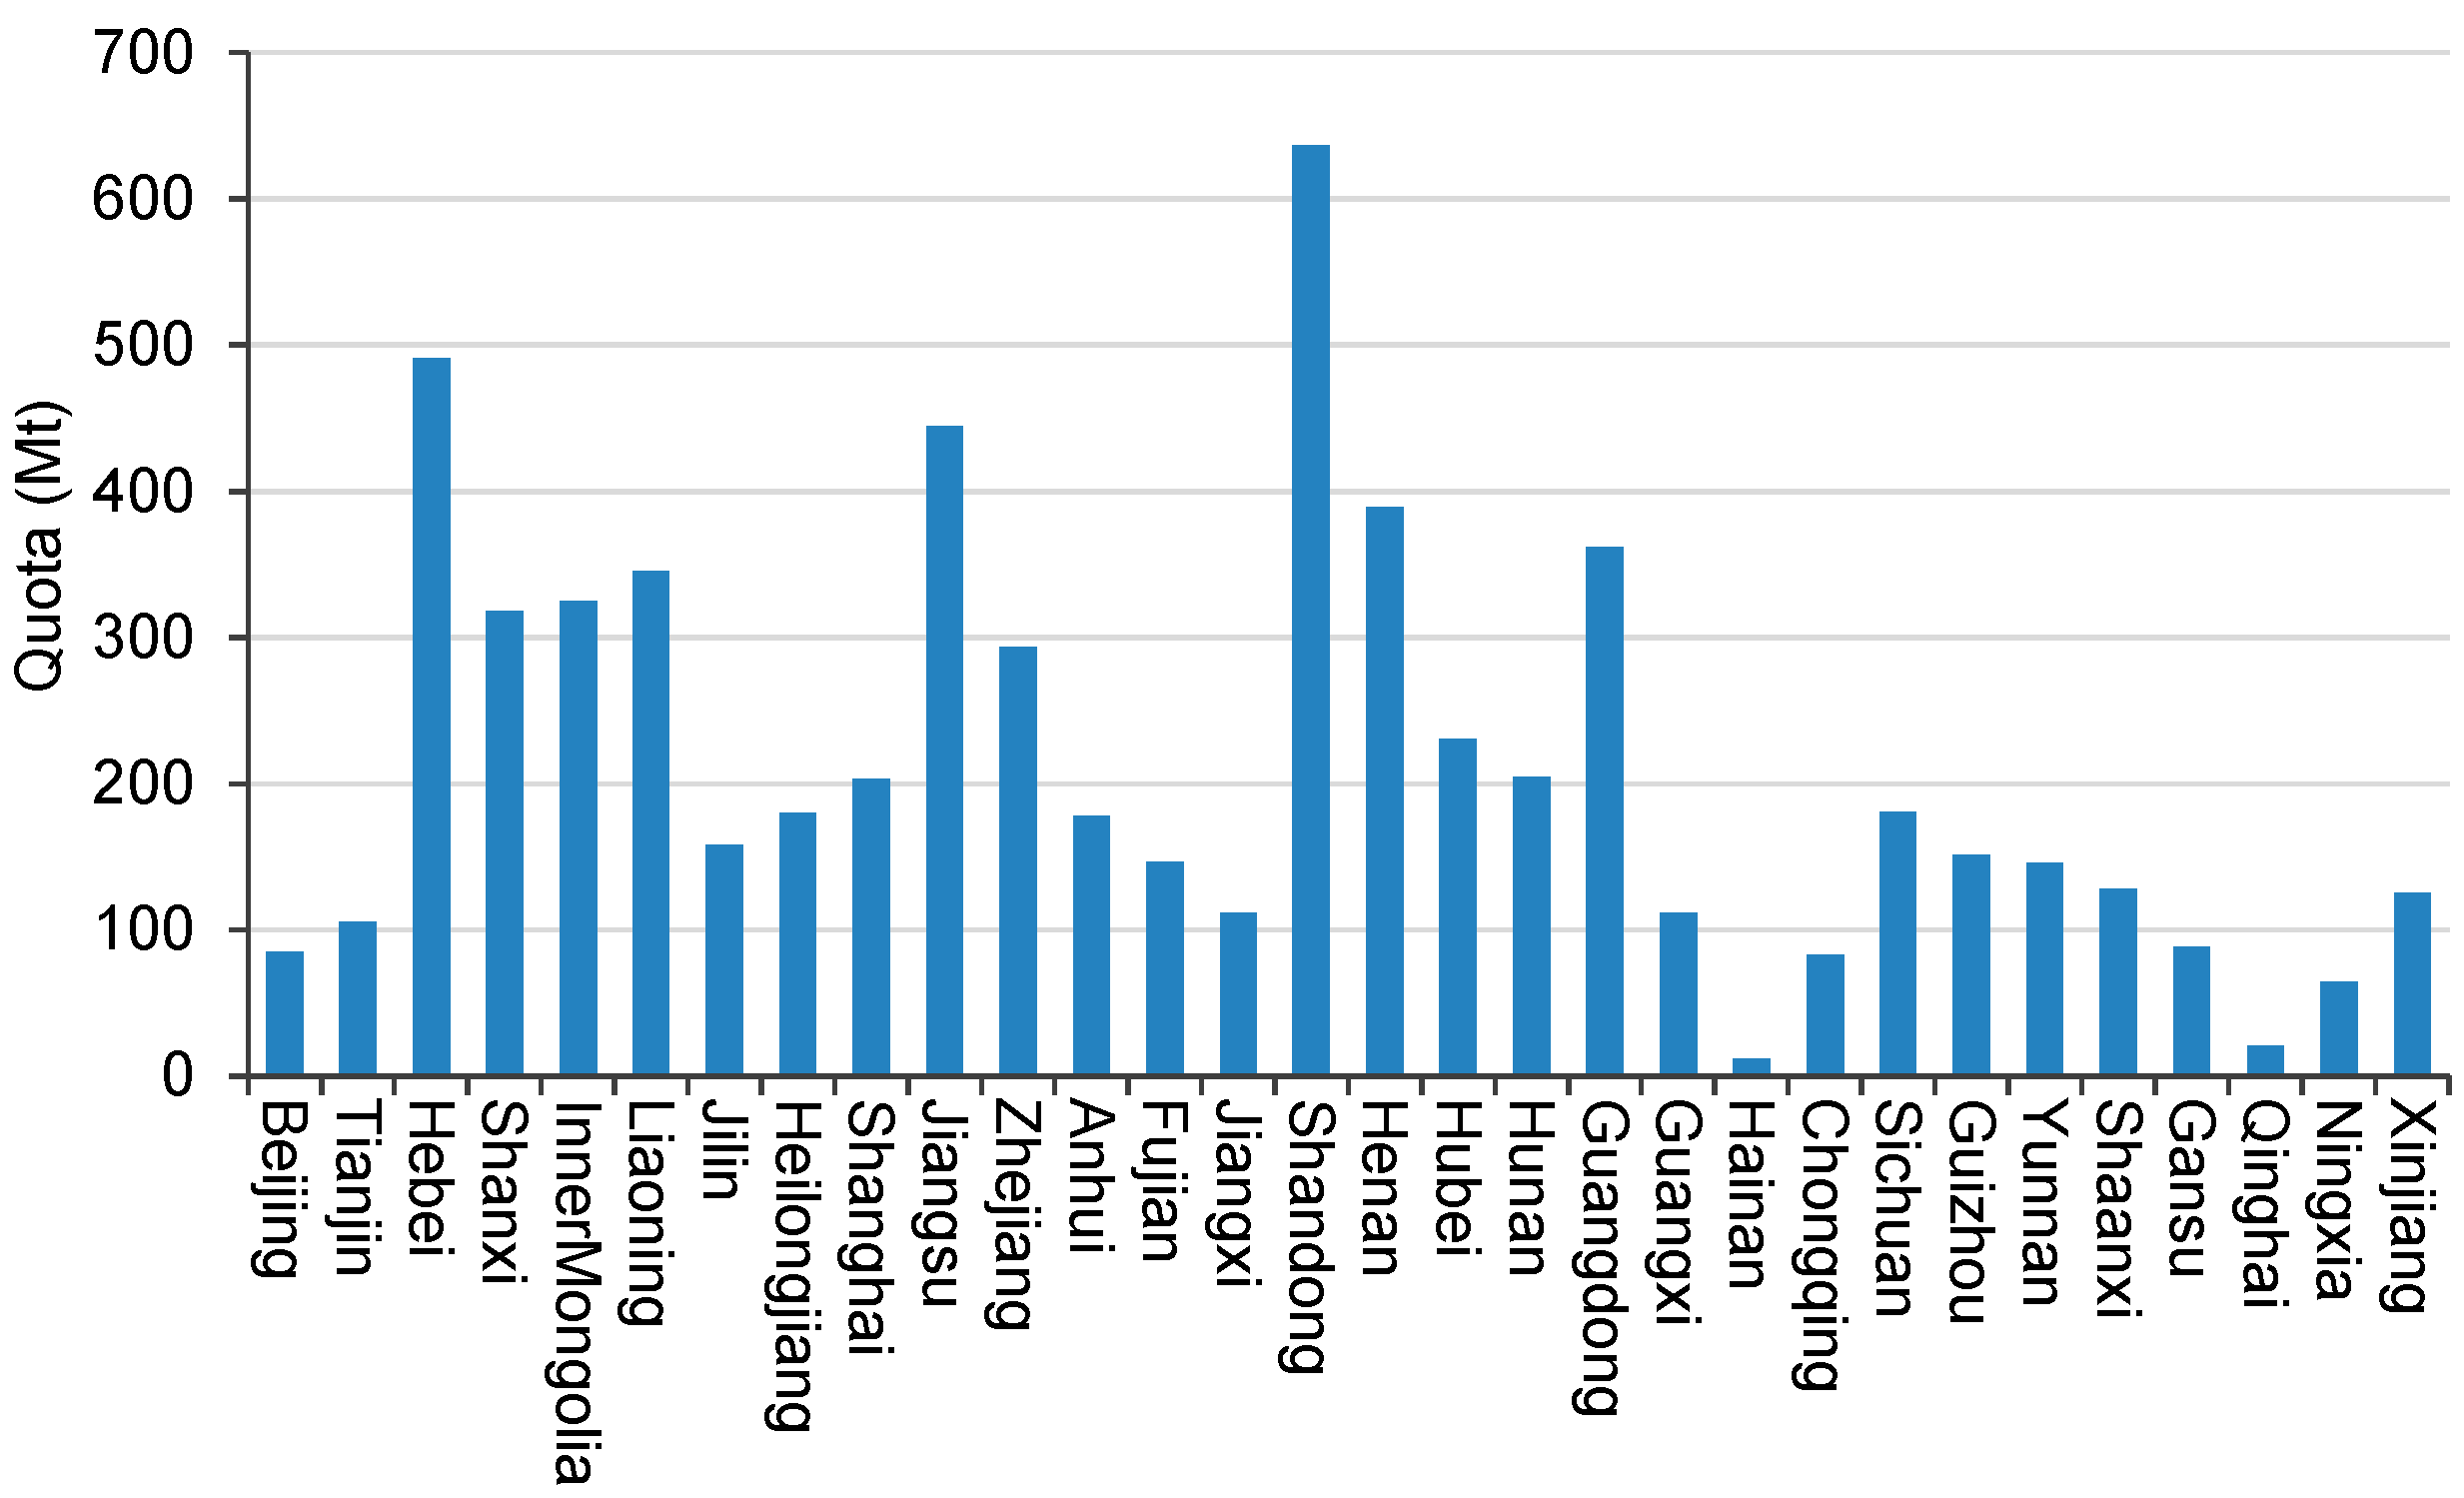
With regard to the quota allocation in the ETS design, all quotas are allocated by Grandfathering, which means that the quotas are allocated to sectors in regions according to the sectoral historic emissions (emissions in the base case year 2007 in this study). Figure 3 shows the regional CO2 emissions in the base case, and Figure 4 shows the allocation of quotas across regions. A hybrid allocation method is adopted: free allocation for energy sectors and full auction for energy-intensive sectors. A perfect auction, where the quota’s auction price is equal to the CO2 price in carbon market, is assumed for energy-intensive sectors. A fixed proportion of auction revenues are returned to households while the rest are used for local government savings.
2.4. Modelling Approach for RES
As the total electricity output is composed of eight power generation technologies by a CES function in CE3MS, the changes in relative generation costs will cause substitutions of different technologies. Regarding the generation side, a fixed tariff in the form of subsidy is introduced into the renewable power generation process for each unit of electricity generated. The subsidies lower the cost of renewable generation and, thus, cause the substitution of renewable energy for fossil energy. With reference to Paltsev et al. [47] and Sue Wing [48], the substitution elasticity of different generation technologies in the CES function of total electricity output is set to 2 in this analysis. Regarding the electricity demand side, the renewable generation subsidy costs are eventually passed to consumers (including households, regional government, and production sectors which use electricity as intermediate input) via a tax on electricity consumption. The tax rate of electricity consumption is endogenously adjusted in order to meet the required total renewable energy subsidies. In this way, the burden of renewable subsidies is shifted from electricity producers to electricity consumers.
3. Data and Scenarios
The CE3MS database derives from the China 2007 regional social accounting matrices (SAMs). The following scenarios are adopted to assess the impact of RES policy on ETS policy (Table 3). Due to the limitation of a static model, we simply use the quantity target calculated in Section 2.2 (63.17 Mt) as the emissions reduction target in this study. For the benchmark scenario, there is no ETS policy or RES policy. A nationwide carbon market is assumed to be in place under scenarios Sa0 to Sa5, and the CO2 price is adjusted endogenously until the emissions reduction target is achieved. The RES policy is adopted under scenarios Sa1 to Sa5, with a RES production subsidy rate ranging from 20 to 100%, which means that 20 to 100% of the renewable power generation costs (i.e., production costs of renewable technologies) would be subsidized. Considering that hydropower has the lowest generation cost and high competitiveness compared with other renewable energy technologies in China, it is not included in the RES policy in this study. Due to the interaction of RES policy and ETS policy on CO2 emissions, the CO2 price on the carbon market will be adjusted to a new level to meet the emissions reduction target when a RES policy is in place.
For simplicity of presenting the results, the 30 regions are classified into three areas—eastern, central, and western regions—based on the regional divisions used by the National Bureau of Statistics of China. In addition, six regions (Shanxi, Inner Mongolia, Heilongjiang, Sichuan, Shaanxi, and Xinjiang) are further regarded as resource regions, given that they are rich in coal, crude oil, and natural gas. Table 4 shows the classification of regions.
4. Results
4.1. Carbon Market
The RES policy can effectively increase the share of renewable energy generation and accelerate the substitution of renewable energy for fossil energy. However, this may reduce the electricity industries’ demands for emission permits if the emission allowances remain the same as when there is no RES policy, thus causing a decrease in CO2 price. As the CO2 price is a signal to mitigation technologies and low-carbon investment, the Chinese government considers the forthcoming nationwide carbon market the most important instrument for emissions reduction. When paired with RES policy, the ETS will play a less important role in emissions reduction than expected. The impact of RES policy on the carbon market is analyzed here in terms of CO2 price, emissions cap, renewable energy promotion targets, and inter-regional flow of carbon trading funds and allowances.
4.1.1. CO2 Price
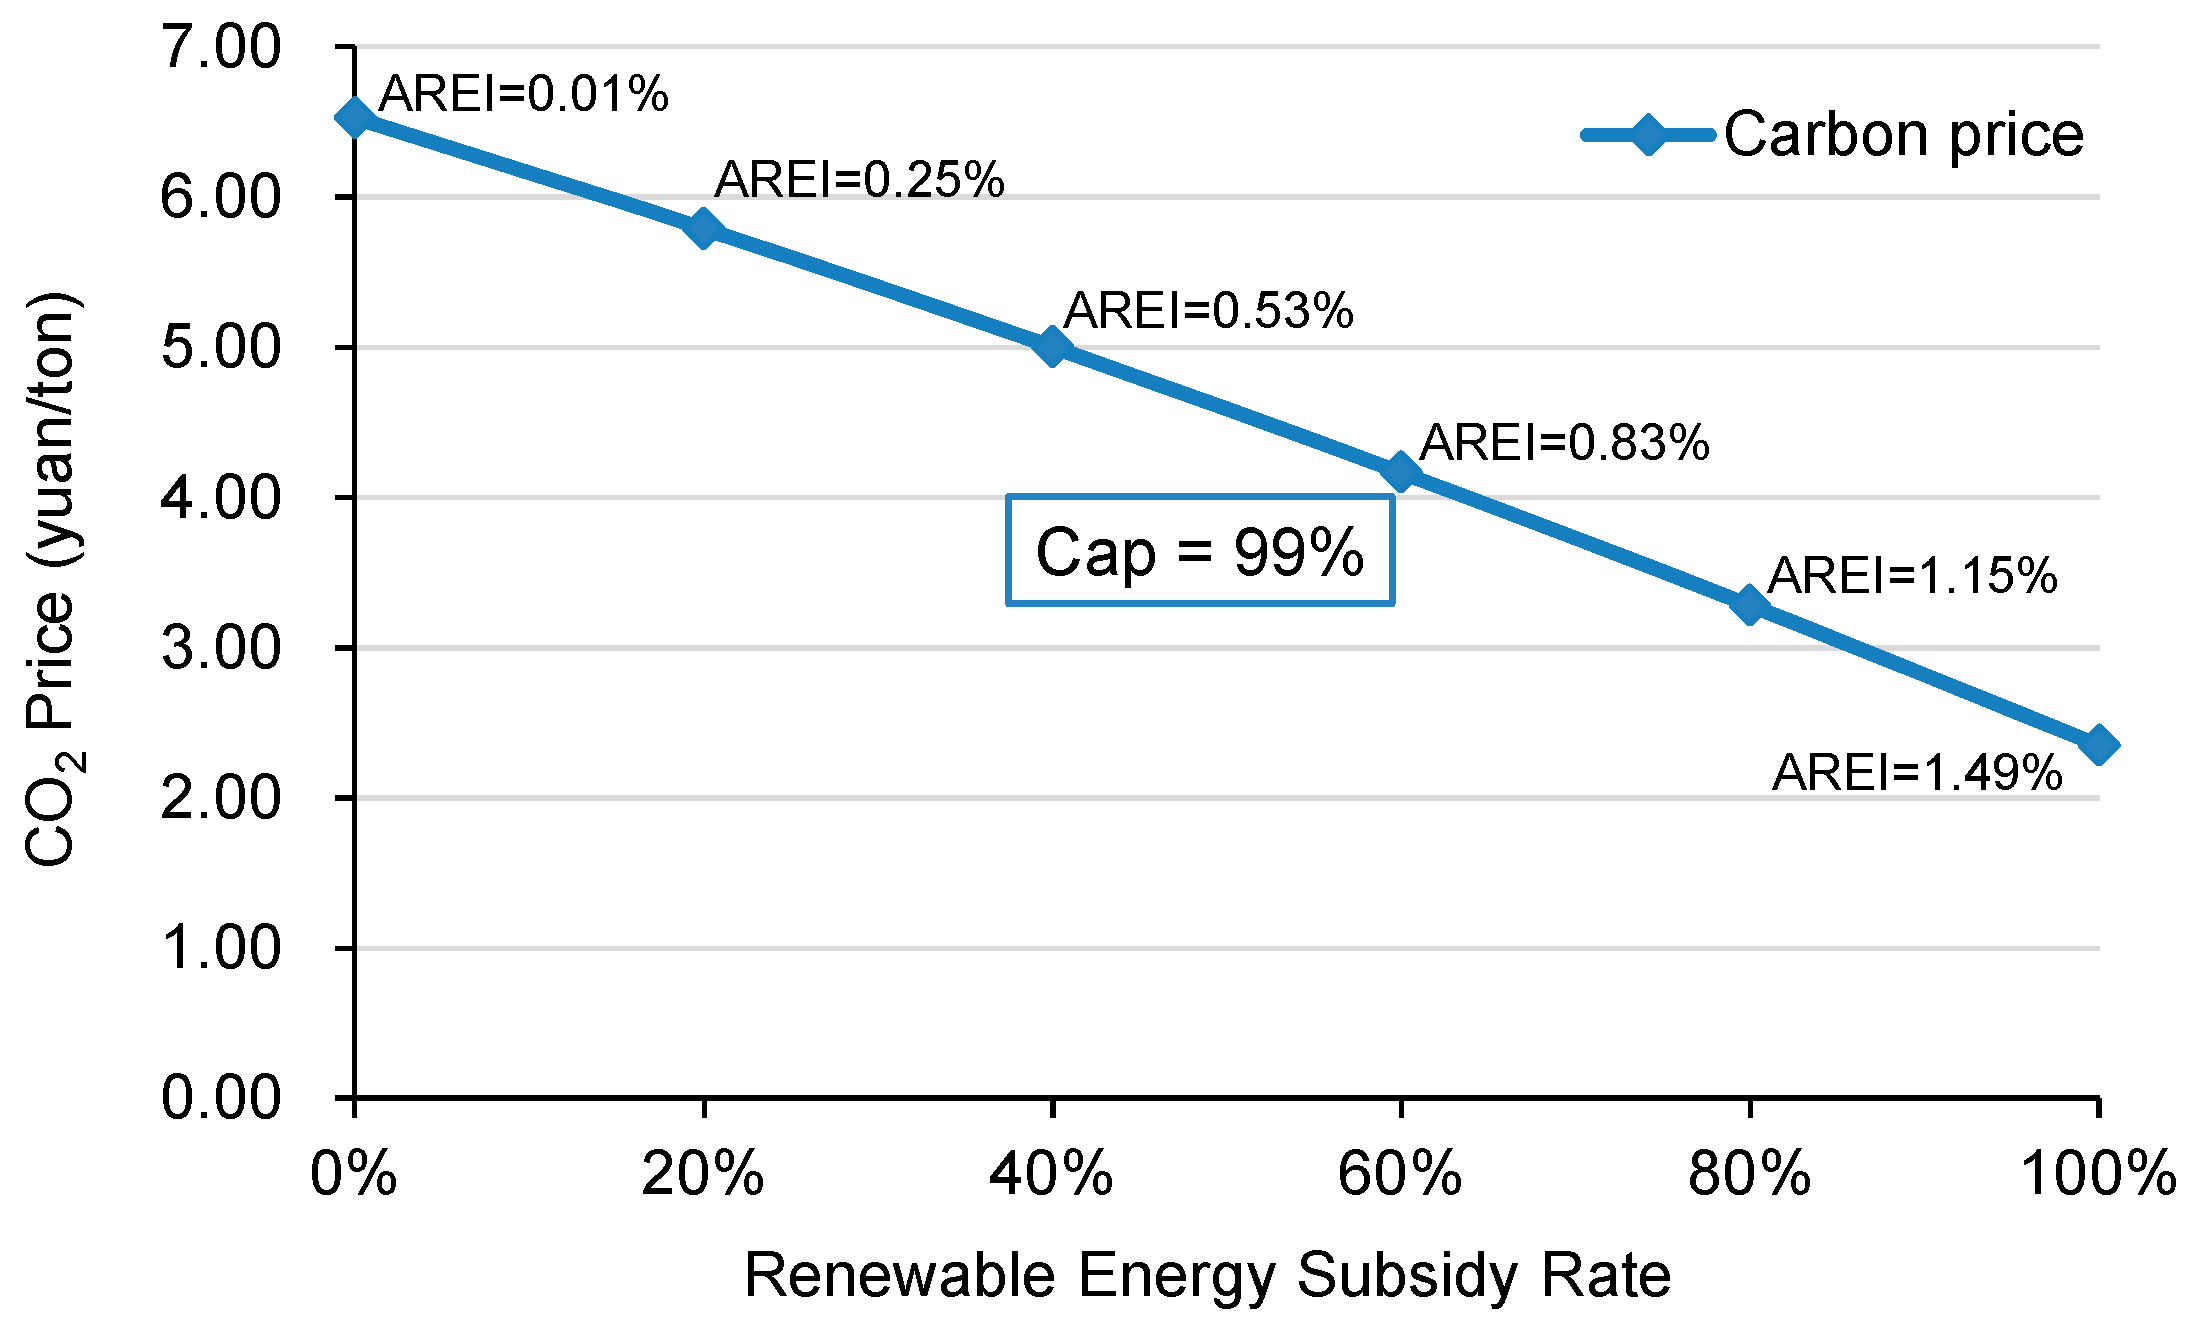
Figure 5 shows the CO2 price on the carbon market as influenced by RES policy under scenarios Sa0 to Sa5. With a higher renewable energy subsidy, the CO2 price decreases between 11% and 64%. When there is only an ETS policy, the CO2 price is 6.53 yuan/ton to achieve the reduction target. However, with an additional RES policy, it decreases to 5.79 yuan/ton, 5.00 yuan/ton, 4.17 yuan/ton, 3.28 yuan/ton, and 2.35 yuan/ton under scenarios Sa1 to Sa5 respectively. The results show that the higher the RES subsidy rate, the greater the CO2 price decreases. The lower CO2 price level indicates that if the emission allowances remain the same, the nationwide carbon market will provide fewer incentives for low-carbon investment under the additional RES policy. The RES subsidy in China is presently around 100%; at this level, our estimation shows that the CO2 price will decrease by 64%. Therefore, unless the RES subsidy is gradually phased-out between 2017 and 2030, the CO2 price on the nationwide carbon market will be affected significantly and, thus, the incentive of the nationwide carbon market to reduce emissions will be weakened. Alternatively, a tighter emission cap is needed during the 2017–2030 period to maintain a steady CO2 price.
4.1.2. Inter-Regional Carbon Trading
A lower CO2 price will affect inter-regional carbon trading, particularly trading volume and value. Figure 6 shows the total trading volume and value of the nationwide carbon market under scenarios Sa0 to Sa5. While the RES policy promotes the development of renewable energy, the demand for emission allowances weakens within the electricity sectors, thus reducing the trading volume of the existing nationwide carbon market. According to our estimation, the total trading volume decreases between 3% and 25% at RES subsidies ranging from 20 to 100%. The total trading value experiences larger decrease with the decreasing CO2 price. The results show that the annual trading value of the nationwide carbon market is about 119 million yuan with an ETS policy alone. However, it decreases by 73% under scenario Sa5 (additional RES policy with 100% subsidy).
Table 5 presents the inter-regional flow of trading funds associated with the nationwide carbon market. One of the important characteristics of this market is that it will transfer trading funds from eastern regions to resource-rich central and western regions. Our estimation shows that, when there is only an ETS policy, total annual trading funds of 34.25 million yuan are transferred from eastern to central and western regions. Of this figure, 79% (27.01 million yuan) goes to six resource regions. Nevertheless, when an additional RES subsidy is adopted at a 40% subsidy rate, central regions will no longer receive trading revenues, and even face a funding outflow of approximately 0.25 million yuan. With higher RES subsidies, the inter-regional wealth redistribution effect of the nationwide carbon market will be reduced. According to our estimation, the total scale of trading funds transferring from eastern to central and western regions reduces by 90% when the RES subsidy rate increases from 0 to 100%. This increase counteracts the goal of narrowing economic disparities among regions. The promotion of renewable energy reduces CO2 emissions and, therefore, the demand for emissions trading decreases, leading to a lower inter-regional flow of trading funds across regions. The transfer of wealth is not only directly caused by the ETS, but it also relevant to the distributional effects of subsidies. As different regional distributions of RES subsidies lead to different CO2 emission reductions, the emissions trading volumes and inter-regional flow of trading funds will be different. However, the distributional effects of subsidies on inter-regional transfer are not further discussed in this analysis because the distribution of RES subsidies is not the main focus in this study.
4.1.3. Emissions Cap and Renewable Energy Target
As the RES policy, when paired with the existing ETS, will lead to lower CO2 prices, there is a risk that the CO2 price will be too low to ensure the effective operation of the carbon market. From the perspective of market mechanism design, a stable CO2 price is the basis for an effective carbon market. In order to maintain the stability of the CO2 price and keep the ETS policy incentives, a tighter emissions cap is preferable for policy makers in China. Figure 7 shows the reduction of CO2 emissions and increased share of renewable energy under the same CO2 price level. The results show that, with only an ETS policy, the CO2 reduction is 1.17%. However, for a 1% increase in the renewable energy share, CO2 emissions would need to decline by 1.66% to maintain the same CO2 price. According to our estimation, the optimal annual CO2 emissions reduction should increase from 1.20 to 1.50% to maintain the CO2 price at the level of 6.53 yuan/ton, while achieving both the emissions intensity reduction target of 65% and non-fossil energy target of 20% in the INDC. In other words, China’s ETS emissions cap should be 0.30% tighter when operating both ETS and RES policies. If the emissions cap is not adjusted while there is a RES policy to achieve the 20% renewable energy target, the CO2 price of the nationwide carbon market will drop from 6.53 yuan/ton to 5.00 yuan/ton.
4.2. Social Cost
In China, combining RES with ETS policies results in higher social costs than the ETS policy alone. Table 6 presents the loss of GDP and welfare cost under different scenarios. The results show that the total GDP decreases more when a FIT is adopted on top of an ETS. According to our estimation, 50% of the GDP costs are caused by the implementation of RES policy when the subsidy rate of RES is 20%. In addition, 94% of the GDP costs will be caused by the increased RES subsidy rate under scenario Sa5. The main reason is that the RES subsidy costs are transferred to consumers through a tax on electricity consumption; this tax increases the electricity prices in all regions. Therefore, the increased electricity prices and decreased household consumption lead to the GDP loss. Additionally, the results show that regional disparities increase with the increasing RES subsidy.
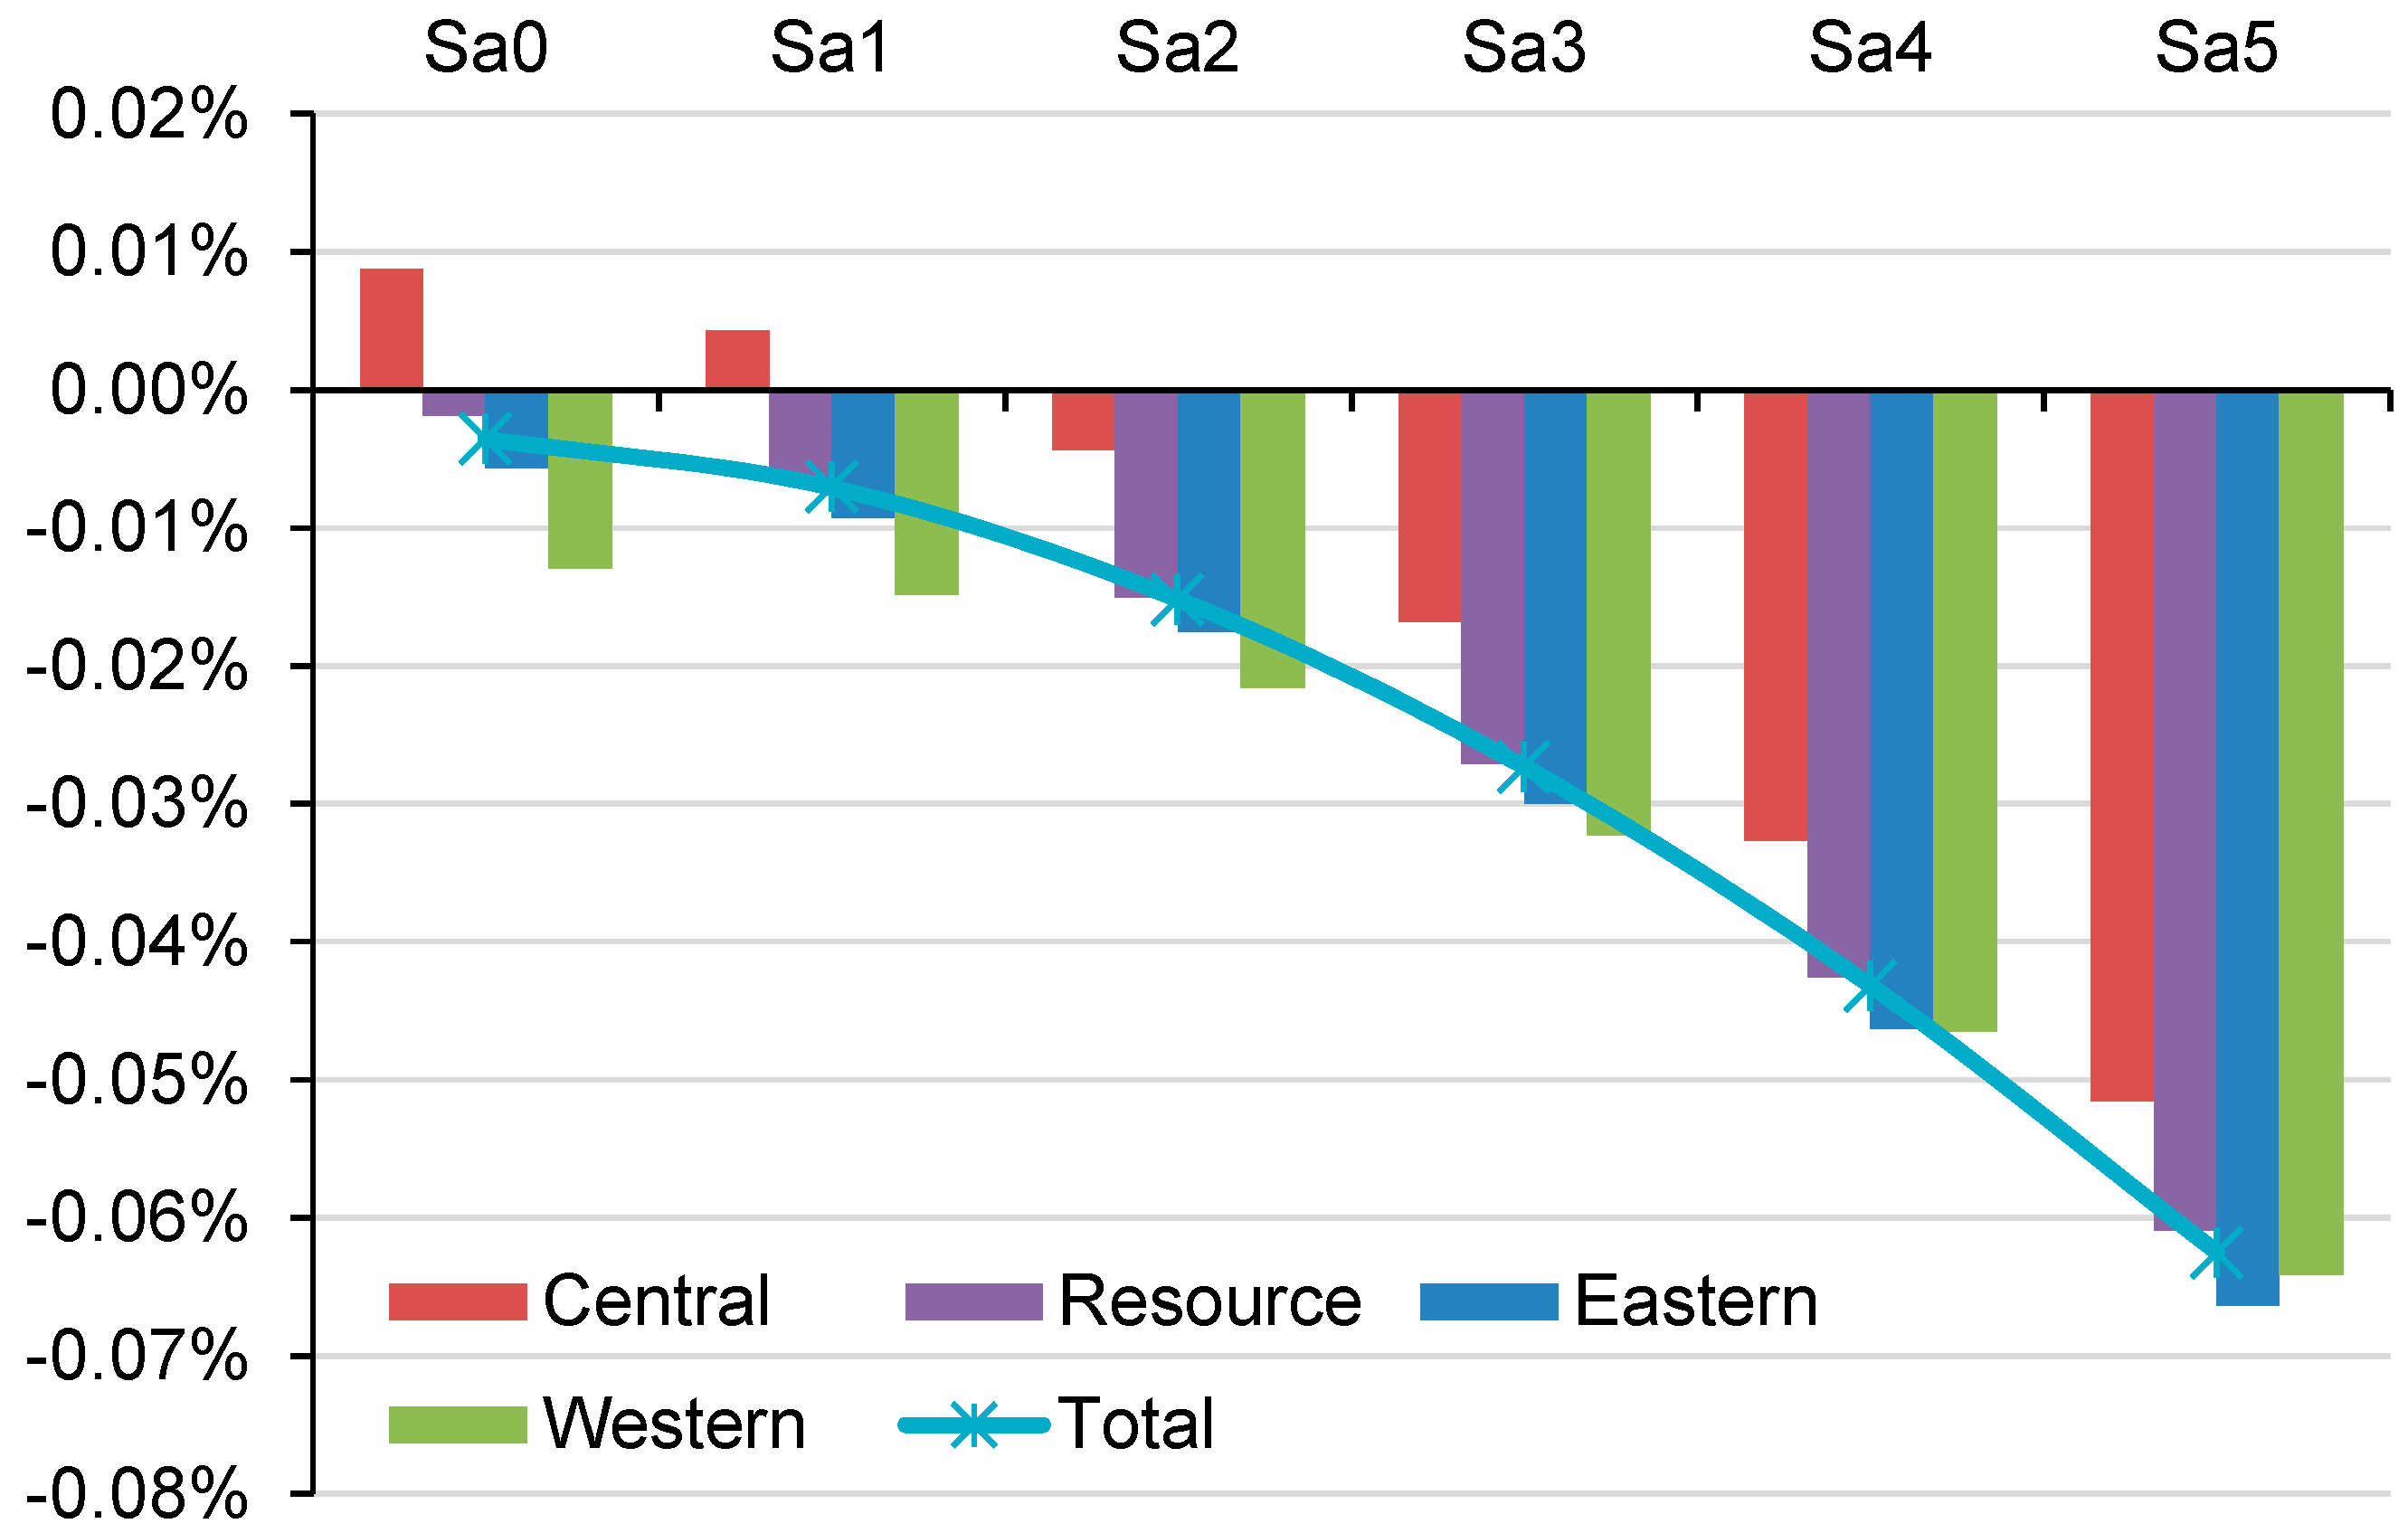
Figure 8 shows the regional GDP change in different scenarios. The adoption of an additional RES policy causes an increase in GDP costs in all regions, especially in central regions such as Shanxi, Heilongjiang, and Anhui. When there is only an ETS policy, GDP in central regions experience an increase of 0.01%. Most of the central regions are quota sale regions in the nationwide carbon market and can benefit from trading revenues. Our estimation shows that, although the resource regions and western regions are the main quota sale regions, their trading revenues cannot cover the GDP costs associated with excessive emissions reduction. Figure 8 shows that with the increase of the RES subsidy rate, the GDP change in central regions experiences a significant loss of 0.05% under Sa5, from an increase of 0.01% under scenario Sa0. For example, the GDP in Shanxi, a central region rich in coal with high potential for wind power [49,50], increases 0.078%, 0.058%, and 0.029% under scenarios Sa0, Sa1, and Sa2 respectively. GDP in Shanxi decreases by 0.006 to 0.094% under scenarios Sa3 to Sa5. The GDP in the eastern, western, and resource regions also present larger decreases under scenarios Sa1 to Sa5, as compared to Sa0. The GDP in eastern regions decreases the fastest with increasing RES subsidy.
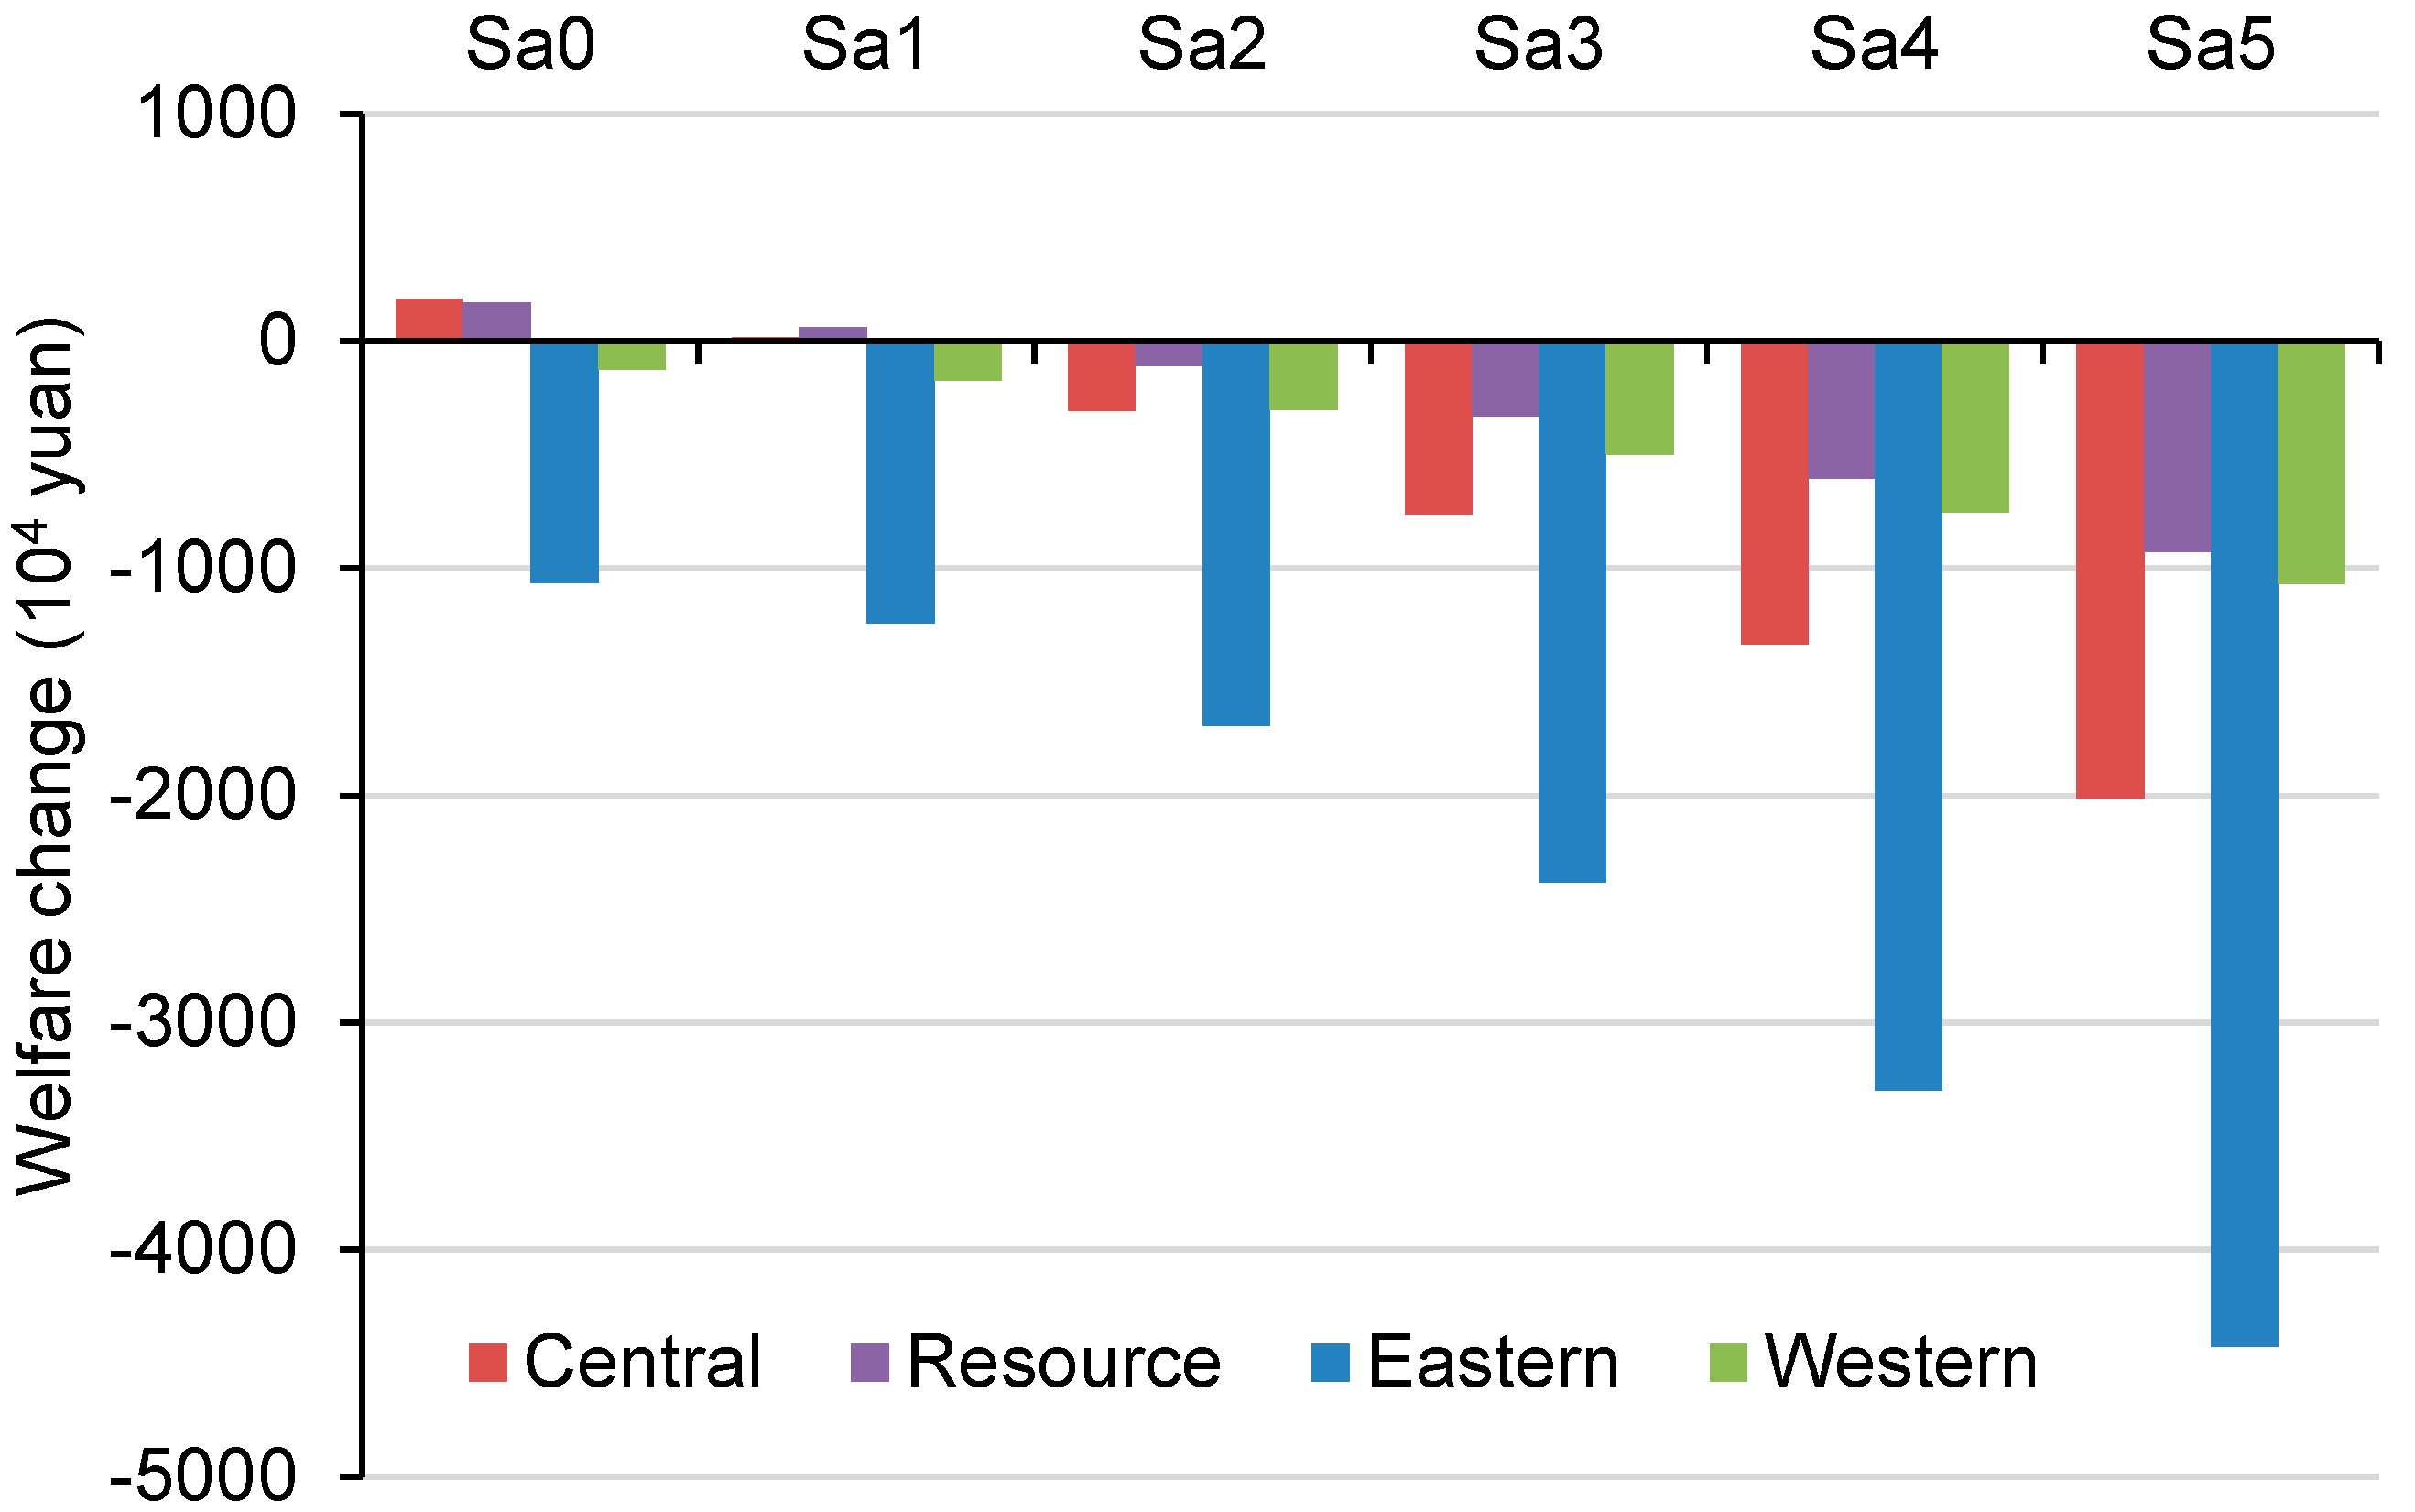
Figure 9 shows the regional welfare changes under different scenarios, indicating that the additional RES policy imposes greater welfare costs. There are significant differences between regions. The central and resource regions experience welfare increases under scenarios Sa0 and Sa1, while facing increasing welfare losses at higher RES subsidy rates. In the eastern regions, the welfare loss is 10.64 million yuan under scenario Sa0 when there is only an ETS policy. However, these regions experience significant welfare loss, ranging from 12.41 million yuan to 44.27 million yuan, under scenarios Sa1 to Sa5. The most important cause of this trend is that eastern regions have lower potential for renewable power generation compared to central and western regions, while the electricity consumption is higher in these economically developed regions. Thus, the costs of electricity consumption will increase in the eastern regions as the burden of RES subsidies is shifted to consumers through a tax. Therefore, though the eastern regions may take advantage of lower CO2 prices as net buyers of quotas in the ETS, the households face significant welfare losses when an additional RES policy is adopted without any adjustment to ETS policy.
4.3. Electricity Industry
As the electricity industry is the main source of CO2 emissions, it is the most important trading sector in the nationwide carbon market. It is also the target industry of renewable energy development and will no doubt be affected by the implementation of RES policy.
4.3.1. Electricity Generation
Table 7 presents the changes in fossil-derived power generation. The additional RES policy leads to a significant decrease in fossil-derived power, including coal-, natural gas-, and petroleum-powered generation. Coal-powered generation is affected the most under all scenarios, which means that both ETS and RES policies are effective in reducing coal use. The ETS policy alone has a slight impact on natural gas- and petroleum-powered generation. However, the combination of ETS and RES policies greatly reduces natural gas- and petroleum-powered generation. Electricity generation from natural gas and petroleum decreases 0.04% and 0.07% respectively under scenario Sa0, and by 1.55% and 1.30% respectively under Sa5 (Table 7).
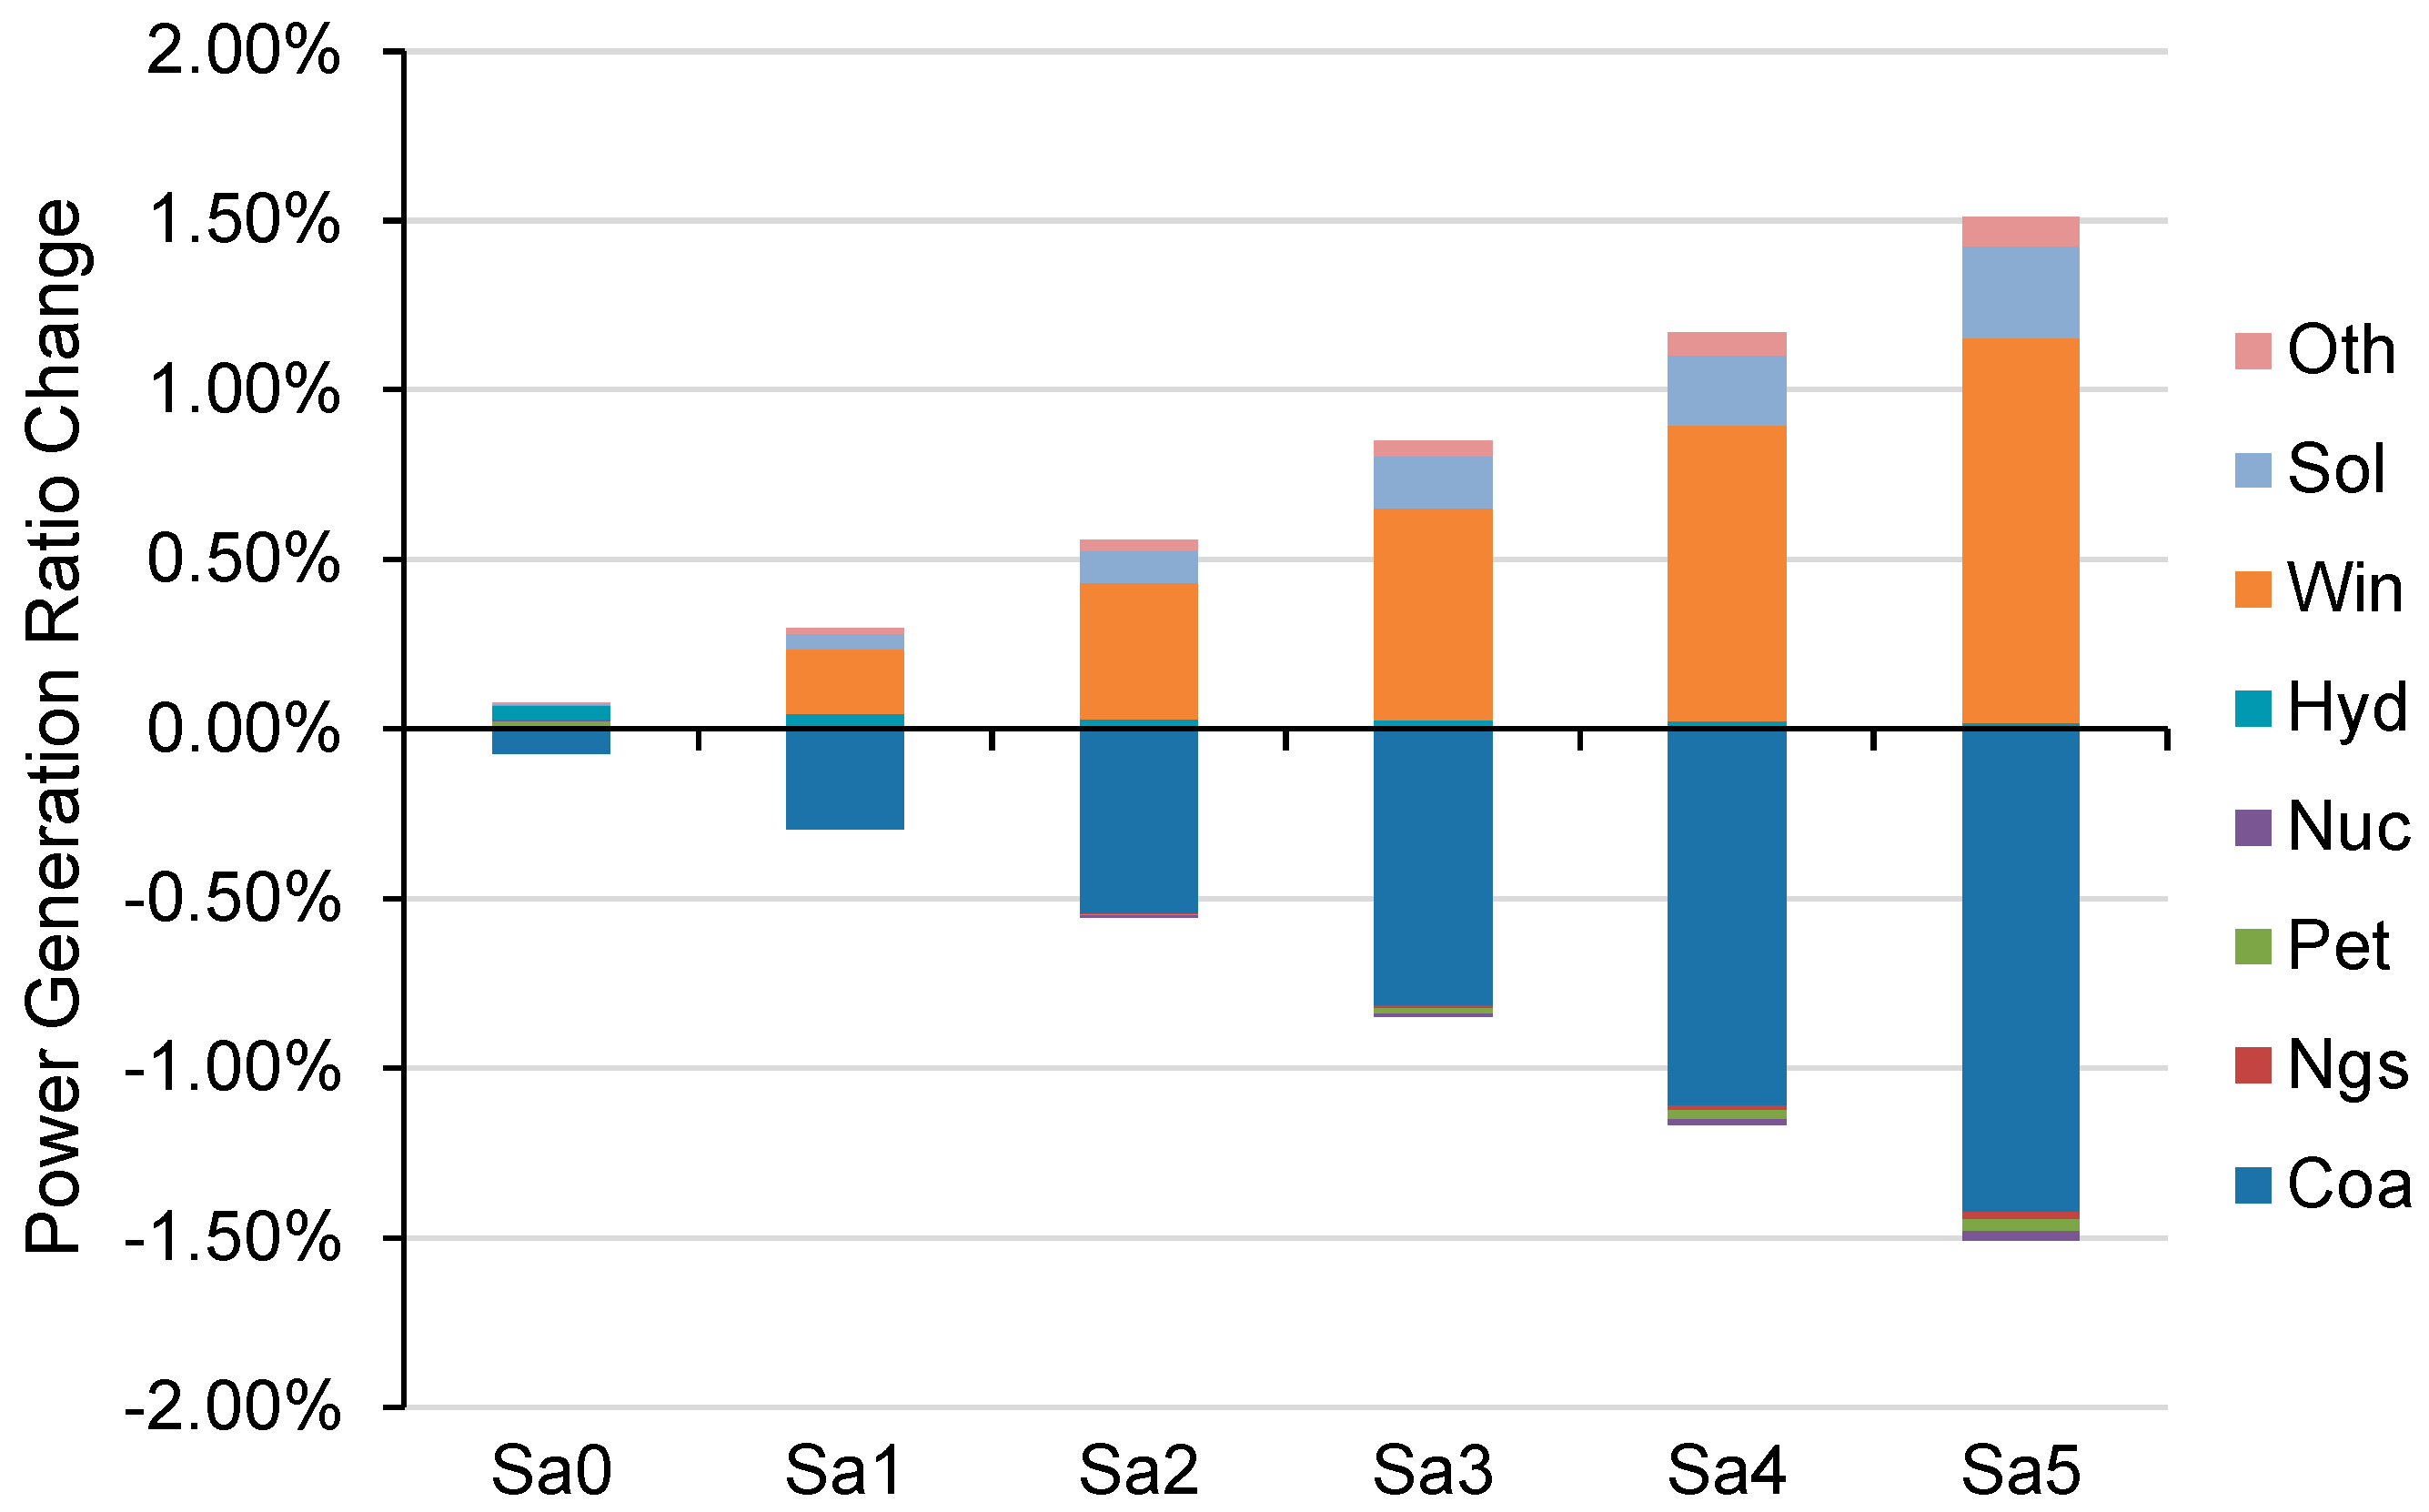
The RES policy also significantly affects the power generation structure in China. Figure 10 shows the changes for share of each power generation technology under different scenarios. With an ETS policy alone, coal- (Coa) and hydropower-powered (Hyd) generation are most affected, showing 0.07% decrease and 0.04% increase respectively. However, an additional RES policy leads to significant structural adjustment in power generation. The results show that, under the same CO2 emissions reduction target, the combination of ETS and RES policies is more effective in reducing traditional power generation and promoting renewable energy generation than ETS policy alone. Particularly, the shares of wind and solar energy in total power generation increase by 0.24–1.40% under Sa1 to Sa5.
4.3.2. Changes in Output and CO2 Emissions
The total output of the electricity industry faces declines under all scenarios, especially with increasing RES subsidy. Figure 11 shows that with an ETS policy alone, the total output of the electricity industry decreases by 0.55%. It further reduces by 0.89% when an RES policy is adopted at a subsidy rate of 100%. With an additional RES policy, as the subsidy cost is assumed to be passed to final consumers via a tax on electricity consumption. The final demand for electricity decreases, thereby leading to further declines in electricity output. Table 8 presents the changes in electricity prices and household electricity consumption in all regions. As expected, the electricity prices increase in most regions and the total household electricity consumption significantly declines as the subsidy rate of renewable energy increases.
Conversely, the electricity industry experiences less reduction of CO2 emissions under the various combined ETS and RES policy scenarios than with an ETS policy alone (Figure 11). The changes in CO2 emissions of the electricity industry are the results of a double impact of ETS and RES policies in this analysis. One possible reason for the lower emission reductions is that the electricity industry is less active in the carbon market when there is an RES policy, due to a lower CO2 price. As the emission reductions in the electricity industry are induced by both ETS and RES policies, the impact of an ETS is lower when combined with an RES policy, thus leading to lower total emission reductions in the electricity industry. The implementation of an RES policy reduces the CO2 price. Therefore, the electricity industry, which is the main quota seller, has less incentive to reduce excessive CO2 emissions for quota sales. The results in Figure 11 show lower CO2 emission reductions in the electricity industry when there is an RES policy. The electricity sector in many regions, which were previously quota sale sectors with lower marginal abatement costs, can no longer benefit from the quota sale on the carbon market due to a lower CO2 price. These sectors will no longer choose to further reduce CO2 emissions as a means of obtaining additional trading revenues from the carbon market, thus leading to less reduction of CO2 emissions within the electricity industry in China. As shown in Table 9, increasing RES subsidies lead to significantly reduced emissions trading volumes in the electricity sector within the western, and other resource-rich, regions such as Inner Mongolia, Jilin, and Guizhou.
5. Sensitivity Analysis
5.1. CO2 Intensity Decline
Given that CE3MS is a static model, in the above analysis we assumed that the 2010–2030 CO2 intensity decline induced by AEEI is 31.21%. This section performs further analysis with a more conservative CO2 intensity decline of 20% lower than the previous assumption. Therefore, a scenario b with 24.97% (20% lower of 31.21%) CO2 intensity decline induced by AEEI during 2010–2030 is adopted.
Table 10 presents the key results, which show that the assumption of CO2 intensity decline induced by AEEI has a direct impact on the cap. Lower CO2 intensity decline leads to a higher CO2 price and a more significant adjustment in power generation structure. However, the comparison of ETS alone and in combination with RES gives the same conclusions as our previous analysis in terms of the resulting changes in CO2 price, social costs, and electricity industry performance.
5.2. Quota Allocation Method
The initial quota allocation is an important issue in the ETS design. Different quota allocations may influence wealth transfer between regions, resulting in different social costs. Therefore, we also perform a sensitivity analysis on the quota allocation method. According to the findings of the current ETS pilots, a scenario c, with free allocation for all trading sectors, is adopted. The results (see Table 11) show less pronounced effects on social costs, including both GDP and welfare losses, under scenarios Sc0 to Sc5 as compared to scenarios Sa0 to Sa5. As free allocation could be considered as hidden compensation to trading sectors, the welfare loss caused by the labor price decrease is lower under free allocation than under auction. As compared with free allocation, auction will directly cause higher production costs of trading sectors, and the costs will eventually transfer to households via lower wages and higher commodity prices. For that reason, the welfare loss of households will be greater when there is an auction. However, the results show that the adoption of an RES policy and an increasing subsidy rate rapidly lead to large costs similar to that under a hybrid allocation method.
6. Conclusions and Discussion
An emissions trading scheme and renewable energy policies have been considered as two important market-based instruments for CO2 abatement in China. Since it is expected that a nationwide carbon market will be implemented in late 2017, the interaction between RES and ETS policies is a central issue for the design of China’s nationwide carbon market. Therefore, this paper explored the interaction between the two policies via a multi-regional CGE framework and captured the full economy-wide impacts of such policy interaction.
We simulated six policy scenarios for the implementation of ETS and RES policies: a nationwide carbon market alone, to reduce carbon intensity by 65% below the 2005 level by 2030; and five scenarios for the cap, combined with a FIT subsidy ranging from 20 to 100%, to achieve both the 65% reduction in carbon intensity and a 20% share of non-fossil sources in total energy consumption by 2030. Several conclusions emerged.
Firstly, the annual ETS emissions cap in China should decrease by 0.3% to maintain a stable CO2 price and achieve the INDC targets. The results show that CO2 price on the nationwide carbon market would decrease between 11% and 64% with increasing a renewable energy subsidy, thereby disincentivizing the carbon market for low-carbon investment. The total trading volume is predicted to decrease between 3% and 25%.
Secondly, adding a FIT to an ETS imposes additional GDP costs and welfare losses in all regions, thereby increasing the cost of the policy by 0.01 to 0.06%. Eastern regions, which have higher abatement costs and lower potential for developing renewable energy, face more significant social costs under the combined ETS and RES policies than with ETS alone.
Lastly, the electricity industry faces a decline in total output. However it experiences lower reduction of CO2 emissions under the combination of ETS and RES policies than with ETS alone. This highlights another issue; the renewable subsidy reduces the shadow cost of CO2 emissions and may stimulate emissions by the most energy-intensive technologies.
The interpretation of the findings in this analysis is limited due to the use of a static model, which thereby could not provide numerical results in each year for the 2007–2030 period. For example, the relation between CO2 price and the renewable energy subsidy rate in Figure 5 are approximately linear as it only presents the result for one year. In addition, as the changes in CO2 intensity and renewable energy generation are assumed to be linear, our numerical results are not sufficient to show the accurate annual changes in economic variables such as CO2 price, GDP growth and capital stock. However, this will not change our qualitative conclusions for the interactions between ETS and RES policies.
As the implementation of the nationwide carbon market is imminent, policymakers should not ignore the economic impacts of the overlap between ETS and RES policies in China. A tighter emissions cap could be considered to achieve the targets both for emissions reduction and renewable energy development in the INDC, while guaranteeing an effective CO2 price to maintain the advantages of the ETS in investment incentives for low-carbon technologies. The adjustment of cap depends on various assumptions and, thus, it will be difficult to determine the appropriate adjustment rate. A carbon price floor to the ETS, instead, may play a better role in guaranteeing a minimum CO2 price level, irrespective of the economic circumstances or impact of overlapping policies [31,51]. The option of carbon price floor is not discussed in this study and therefore remains to be investigated in further studies.
Acknowledgments
We acknowledge the financial support from the National Natural Science Foundation of China under grant Nos. 71210005, 71690245, 71573248 and the National Key Research and Development Plan under grant No. 2016YFA0602804. Jie Wu also would like to acknowledge the support of Program for Innovative Research Team of Shanghai University of Finance and Economics (IRTSHUFE). We appreciate the editor and three anonymous reviewers for their constructive comments and suggestions.
Author Contributions
Jie Wu conducted modelling and the simulations. Yan Xia contributed to the establishment of the database. Ying Fan supervised the work and contributed to the discussions of the results. Jie Wu wrote the manuscript, and Ying Fan and Yan Xia contributed to revising the paper.
Conflicts of Interest
The authors declare no conflict of interest.
References
- Kim, Y.S.; Hwang, C.S.; Kim, E.S.; Cho, C. State of Charge-Based Active Power Sharing Method in a Standalone Microgrid with High Penetration Level of Renewable Energy Sources. Energies 2016, 9, 480. [Google Scholar] [CrossRef]
- Kies, A.; Schyska, B.U.; von Bremen, L. The Demand Side Management Potential to Balance a Highly Renewable European Power System. Energies 2016, 9, 955. [Google Scholar] [CrossRef]
- Rogge, K.S.; Schneider, M.; Hoffmann, V.H. The innovation impact of the EU emission trading system—findings of company case studies in the German power sector. Ecol. Econ. 2011, 70, 513–523. [Google Scholar] [CrossRef]
- Schmidt, T.S.; Schneider, M.; Rogge, K.S.; Schuetz, M.J.A.; Hoffmann, V.H. The effects of climate policy on the rate and direction of innovation: A survey of the EU ETS and the electricity sector. Environ. Innov. Soc. Transit. 2012, 2, 23–48. [Google Scholar] [CrossRef]
- Calel, R.; Dechezleprêtre, A. Environmental policy and directed technological change: Evidence from the European carbon market. Rev. Econ. Stat. 2012, 42, 551–574. [Google Scholar] [CrossRef]
- Delarue, E.; Van den Bergh, K. Carbon mitigation in the electric power sector under cap-and-trade and renewables policies. Energy Policy 2016, 92, 34–44. [Google Scholar] [CrossRef]
- Böhringer, C.; Löschel, A.; Moslener, U.; Rutherford, T.F. EU climate policy up to 2020: An economic impact assessment. Energy Econ. 2009, 31, S295–S305. [Google Scholar] [CrossRef]
- Tsao, C.-C.; Campbell, J.E.; Chen, Y. When renewable portfolio standards meet cap-and-trade regulations in the electricity sector: Market interactions, profits implications, and policy redundancy. Energy Policy 2011, 39, 3966–3974. [Google Scholar] [CrossRef]
- Uribe-Pérez, N.; Angulo, I.; Hernández-Callejo, L.; Arzuaga, T.; de la Vega, D.; Arrinda, A. Study of Unwanted Emissions in the CENELEC-A Band Generated by Distributed Energy Resources and Their Influence over Narrow Band Power Line Communications. Energies 2016, 9, 1007. [Google Scholar]
- Franzitta, V.; Curto, D.; Milone, D.; Rao, D. Assessment of Renewable Sources for the Energy Consumption in Malta in the Mediterranean Sea. Energies 2016, 9, 1034. [Google Scholar] [CrossRef]
- Fankhauser, S.; Hepburn, C.; Park, J. Combining multiple climate policy instruments: How not to do it. Clim. Chang. Econ. 2010, 1, 209–225. [Google Scholar] [CrossRef]
- Nordhaus, W. Designing a friendly space for technological change to slow global warming. Energy Econ. 2011, 33, 665–673. [Google Scholar] [CrossRef]
- Van den Bergh, K.; Delarue, E.; D’haeseleer, W. Impact of renewables deployment on the CO2 price and the CO2 emissions in the European electricity sector. Energy Policy 2013, 63, 1021–1031. [Google Scholar] [CrossRef]
- Weigt, H.; Ellerman, A.D.; Delarue, E. CO2 abatement from renewables in the German electricity sector: Does a CO2 price help? Energy Econ. 2013, 40, 149–158. [Google Scholar] [CrossRef]
- Fischer, C.; Preonas, L. Combining Policies for Renewable Energy: Is the Whole Less than the Sum of its Parts? Int. Rev. Environ. Resour. Econ. 2010, 4, 51–92. [Google Scholar] [CrossRef]
- Koch, N.; Fuss, S.; Grosjean, G.; Edenhofer, O. Causes of the EU ETS price drop: Recession, CDM, renewable policies or a bit of everything?—New evidence. Energy Policy 2014, 73, 676–685. [Google Scholar] [CrossRef]
- Del Río, P. Interactions between climate and energy policies: The case of Spain. Clim. Policy 2009, 9, 119–138. [Google Scholar]
- Anandarajah, G.; Strachan, N. Interactions and implications of renewable and climate change policy on UK energy scenarios. Energy Policy 2010, 38, 6724–6735. [Google Scholar] [CrossRef]
- Linares, P.; Santos, F.J.; Ventosa, M. Coordination of carbon reduction and renewable energy support policies. Clim. Policy 2008, 8, 377–394. [Google Scholar] [CrossRef]
- Fais, B.; Blesl, M.; Fahl, U.; Voß, A. Analysing the interaction between emission trading and renewable electricity support in TIMES. Clim. Policy 2015, 15, 355–373. [Google Scholar] [CrossRef]
- Fujimori, S.; Masui, T.; Matsuoka, Y. Gains from emission trading under multiple stabilization targets and technological constraints. Energy Econ. 2015, 48, 306–315. [Google Scholar] [CrossRef]
- Fujimori, S.; Kubota, I.; Dai, H.C.; Takahashi, K.; Hasegawa, T.; Liu, J.Y.; Hijioka, Y.; Masui, T.; Takimi, M. Will international emissions trading help achieve the objectives of the Paris Agreement? Environ. Res. Lett. 2016, 11, 104001. [Google Scholar] [CrossRef]
- Zhang, X.; Qi, T.Y.; Ou, X.M.; Zhang, X.L. The role of multi-region integrated emissions trading scheme: A computable general equilibrium analysis. Appl. Energy 2017, 185, 1860–1868. [Google Scholar] [CrossRef]
- Hübler, M.; Voigt, S.; Löschel, A. Designing an emissions trading scheme for China—An up-to-date climate policy assessment. Energy Policy 2014, 75, 57–72. [Google Scholar] [CrossRef]
- Morris, J.F. Combining a Renewable Portfolio Standards with a Cap-and-Trade Policy: A General Equilibrium Analysis; Massachusetts Institute of Technology: Cambridge, MA, USA, 2009. [Google Scholar]
- Böhringer, C.; Behrens, M. Interactions of emission caps and renewable electricity support schemes. J. Regul. Econ. 2015, 48, 74–96. [Google Scholar] [CrossRef]
- Del Río, P. Analysing the interactions between renewable energy promotion and energy efficiency support schemes: The impact of different instruments and design elements. Energy Policy 2010, 38, 4978–4989. [Google Scholar] [CrossRef]
- Cheng, B.B.; Dai, H.C.; Wang, P.; Zhao, D.Q.; Masui, T. Impacts of carbon trading scheme on air pollutant emissions in Guangdong Province of China. Energy Sustain. Dev. 2015, 27, 174–185. [Google Scholar] [CrossRef]
- Wang, P.; Dai, H.C.; Ren, S.Y.; Zhao, D.Q.; Masui, T. Achieving Copenhagen target through carbon emission trading: Economic impacts assessment in Guangdong Province of China. Energy 2015, 79, 212–227. [Google Scholar] [CrossRef]
- Wu, R.; Dai, H.C.; Geng, Y.; Xie, Y.; Masui, T.; Tian, X. Achieving China’s INDC through carbon cap-and-trade: Insights from Shanghai. Appl. Energy 2016, 184, 1114–1122. [Google Scholar] [CrossRef]
- Brink, C.; Vollebergh, H.R.J.; Van der Werf, E. Carbon pricing in the EU: Evaluation of different EU ETS reform options. Energy Policy 2016, 97, 603–617. [Google Scholar] [CrossRef]
- Jotzo, F.; Löschel, A. Emissions trading in China: Emerging experiences and international lessons. Energy Policy 2014, 75, 3–8. [Google Scholar] [CrossRef]
- Lin, W.B.; Gu, A.; Wang, X.; Liu, B. Aligning emissions trading and feed-in tariffs in China. Clim. Policy 2016, 16, 434–455. [Google Scholar] [CrossRef]
- Mittal, S.; Dai, H.C.; Fujimori, S.; Masui, T. Bridging greenhouse gas emissions and renewable energy deployment target: Comparative assessment of China and India. Appl. Energy 2016, 165, 301–313. [Google Scholar] [CrossRef]
- Wu, J.; Albrecht, J.; Fan, Y.; Xia, Y. The design of renewable support schemes and CO2 emissions in China. Energy Policy 2016, 99, 4–11. [Google Scholar] [CrossRef]
- Wu, J.; Fan, Y.; Xia, Y. The economic effects of initial quota allocations on carbon emissions trading in China. Energy J. 2016, 37, 129–151. [Google Scholar] [CrossRef]
- Fan, Y.; Wu, J.; Xia, Y.; Liu, J.Y. How will a nationwide carbon market affect regional economies and efficiency of CO2 emission reduction in China? China Econ. Rev. 2016, 38, 151–166. [Google Scholar] [CrossRef]
- International Energy Agency. Indicators for People’s Republic of China. Available online: http://www.iea.org/statistics/statisticssearch/report/?product=Indicators&country=CHINA (accessed on 10 July 2017).
- Zhang, X.L.; Karplus, V.J.; Qi, T.Y.; Zhang, D.; He, J.K. Carbon emissions in China: How far can new efforts bend the curve? Energy Econ. 2016, 54, 388–395. [Google Scholar] [CrossRef]
- China Energy Research Society (CERS). China Energy Outlook 2030; Economy & Management Publishing House: Beijing, China, 2016. [Google Scholar]
- National Development and Reform Commission (NDRC). China’s Intended Nationally Determined Contribution: Enhanced Actions on Climate Change. Available online: http://www.sdpc.gov.cn/xwzx/xwfb/201506/t20150630_710204.html (accessed on 30 June 2015).
- Edwards, T.H.; Hutton, J.P. Allocation of carbon permits within a country: A general equilibrium analysis of the United Kingdom. Energy Econ. 2001, 23, 371–386. [Google Scholar] [CrossRef]
- Massetti, E.; Tavoni, M. A developing Asia emission trading scheme (Asia ETS). Energy Econ. 2012, 34, S436–S443. [Google Scholar] [CrossRef] [Green Version]
- Yuan, Y.N.; Shi, M.J.; Li, N. Analysis of regional assignment of carbon emission permits and its impacts on regional development in China—Based on a multi-regional computable equilibrium model. Manag. Rev. 2013, 25, 43–50. [Google Scholar]
- Chen, A.P.; Groenewold, N. The regional economic effects of a reduction in carbon emissions and an evaluation of offsetting policies in China. Pap. Reg. Sci. 2014, 93, 429–453. [Google Scholar] [CrossRef]
- Li, W.; Li, H.; Sun, S. China’s Low-Carbon Scenario Analysis of CO2 Mitigation Measures towards 2050 Using a Hybrid AIM/CGE Model. Energies 2015, 8, 3529–3555. [Google Scholar] [CrossRef]
- Paltsev, S.; Reilly, J.M.; Jacoby, H.D.; Eckaus, R.S.; McFarland, J.; Sarofim, M.; Asadoorian, M.; Babiker, M. The MIT Emission Prediction and Policy Analysis (EPPA) Model: Version 4; MIT Joint Program on the Science and Policy of Global Change: Cambridge, MA, USA, 2005. [Google Scholar]
- Sue Wing, I. The synthesis of bottom-up and top-down approaches to climate policy modeling: Electric power technologies and the cost of limiting US CO2 emissions. Energy Policy 2006, 34, 3847–3869. [Google Scholar] [CrossRef]
- Yi, B.W.; Xu, J.H.; Fan, Y. Inter-regional power grid planning up to 2030 in China considering renewable energy development and regional pollutant control: A multi-region bottom-up optimization model. Appl. Energy 2016, 184, 641–658. [Google Scholar] [CrossRef]
- Li, H.; Li, G.; Wu, Y.; Wang, Z.; Wang, J. Operation Modeling of Power Systems Integrated with Large-Scale New Energy Power Sources. Energies 2016, 9, 810. [Google Scholar] [CrossRef]
- Roberts, M.J.; Spence, M. Effluent charges and licenses under uncertainty. J. Public Econ. 1976, 5, 193–208. [Google Scholar] [CrossRef]
Figure 1.
Structure of production for non-electricity and electricity sectors: (a) non-electricity sectors; (b) electricity sector.
Figure 1.
Structure of production for non-electricity and electricity sectors: (a) non-electricity sectors; (b) electricity sector.

Figure 2.
Framework for combining ETS and RES policies in CE3MS.

Figure 3.
Regional CO2 emissions in China (Mt).

Figure 4.
Quota allocation across regions.

Figure 5.
CO2 price changes under different RES subsidy rate. (AREI denotes annual renewable energy ratio increase).
Figure 5.
CO2 price changes under different RES subsidy rate. (AREI denotes annual renewable energy ratio increase).

Figure 6.
Total carbon trading volume and value under different scenarios.

Figure 7.
CO2 reduction and AREI under the same CO2 price level.

Figure 8.
Regional GDP changes under different scenarios.

Figure 9.
Regional welfare changes under different scenarios.

Figure 10.
Power generation structural changes under different scenarios.

Figure 11.
Changes in output and CO2 emissions of electricity industry.


Table 1.
Sector declarations and descriptions.
| Sector Codes | Description |
|---|---|
| Agri | Agriculture, forestry, animal husbandry and fishery |
| Coal | Coal |
| Coil | Crude oil and natural gas |
| Mine | Mining |
| Fpap | Manufacture of foods, beverage, tobacco, textile, wearing, apparel, leather, wood, paper and publishing |
| Petro | Coking, gas and processing of petroleum |
| Chem | Chemical industry |
| Nmm | Manufacture of nonmetallic mineral products |
| Metal | Manufacture and processing of metals and metal products |
| Omf | Other manufacture |
| Ele | Production and supply of electric, heat power |
| Gas | Production and supply of gas, water |
| Cons | Construction |
| Trans | Transport, storage, post, information transmission, computer services and software |
| Wsale | Wholesale and retail trades, hotels and catering services |
| Esta | Real estate, leasing, business services and financial intermediation |
| Ots | Other services |
Table 2.
Data of CO2 intensity in China.
| CO2 Intensity Decrease | Value | Source |
|---|---|---|
| 2005–2010 CO2 intensity decrease | 21.94% | IEA [38] |
| 2010–2030 CO2 intensity decrease induced by AEEI | 31.21% | Zhang et al. [39] |
| 2005–2030 CO2 intensity decrease target | 65% | NDRC [41] |
Table 3.
Policy scenarios under INDC emissions reduction target of 65%.
| Scenario | RES Subsidy Rate (%) | CO2 Emission Reduction (Mt) |
|---|---|---|
| S0: Benchmark scenario without any policies | 0 | 0 |
| Sa0: ETS policy only | 0 | 63.17 |
| Sa1: ETS policy and RES policy | 20 | 63.17 |
| Sa2: ETS policy and RES policy | 40 | 63.17 |
| Sa3: ETS policy and RES policy | 60 | 63.17 |
| Sa4: ETS policy and RES policy | 80 | 63.17 |
| Sa5: ETS policy and RES policy | 100 | 63.17 |
Table 4.
Classification of regions.
| Category | Regions |
|---|---|
| Eastern regions | Beijing, Tianjin, Hebei, Liaoning, Shanghai, Jiangsu, Zhejiang, Fujian, Shandong, Guangdong, Hainan |
| Central regions | Shanxi, Jilin, Heilongjiang, Anhui, Jiangxi, Henan, Hubei, Hunan |
| Western regions | Inner Mongolia, Guangxi, Chongqing, Sichuan, Guizhou, Yunnan, Shaanxi, Gansu, Qinghai, Ningxia, Xinjiang |
| Resource regions | Shanxi, Inner Mongolia, Heilongjiang, Sichuan, Shaanxi, Xinjiang |
Table 5.
Inter-regional flow of carbon trading funds under different scenarios.
| Region | Sa0 | Sa1 | Sa2 | Sa3 | Sa4 | Sa5 |
|---|---|---|---|---|---|---|
| Eastern Regions (Million Yuan) | −34.25 | −26.14 | −18.46 | −11.59 | −5.88 | −1.70 |
| Central Regions (Million Yuan) | 2.22 | 0.91 | −0.25 | −1.05 | −1.45 | −1.46 |
| Western Regions (Million Yuan) | 32.02 | 25.23 | 18.72 | 12.63 | 7.33 | 3.16 |
| Resource Regions (Million Yuan) | 27.01 | 21.72 | 16.46 | 11.50 | 7.10 | 3.53 |
Table 6.
Social cost changes under different scenarios.
| Indicators | Sa0 | Sa1 | Sa2 | Sa3 | Sa4 | Sa5 |
|---|---|---|---|---|---|---|
| National GDP Change (%) | −0.004 | −0.007 | −0.015 | −0.027 | −0.043 | −0.063 |
| Regional Disparity (%) 1 | 12.949 | 12.949 | 12.950 | 12.951 | 12.952 | 12.954 |
| Welfare Change (Million yuan) 2 | −1000 | −1397 | −2300 | −3643 | −5389 | −7506 |
1 The regional disparity is calculated as the variation coefficient of per capita GDP of all regions. The numerical result of regional disparity seems quite small, as the emissions reduction target—0.99%—is not very large in this study. The results are more significant in another study of us that the regional disparity will decrease with a larger emissions reduction target (2–10%) under the ETS policy [37]. Although the numerical result is small in this study, it does show the change in regional disparity that it increases when an RES policy is adopted. It is significant that the changes of regional disparity are in opposite direction under ETS and RES policies. 2 The welfare change is measured by the Hicksian Equivalent Variation (HEV) compared to the base case in this study, which represents the change in total households’ income.
Table 7.
Fossil fuel power generation output changes.
| Region | Sa0 | Sa1 | Sa2 | Sa3 | Sa4 | Sa5 |
|---|---|---|---|---|---|---|
| Coal-powered | −0.60% | −0.79% | −1.02% | −1.29% | −1.59% | −1.92% |
| Natural gas-powered | −0.04% | −0.26% | −0.52% | −0.82% | −1.16% | −1.55% |
| Petroleum-powered | −0.07% | −0.26% | −0.47% | −0.72% | −0.99% | −1.30% |
Table 8.
Changes in electricity prices and household consumption on electricity in all regions (%).
| Region | Price | Household Consumption | ||||||||||
|---|---|---|---|---|---|---|---|---|---|---|---|---|
| Sa0 | Sa1 | Sa2 | Sa3 | Sa4 | Sa5 | Sa0 | Sa1 | Sa2 | Sa3 | Sa4 | Sa5 | |
| Total | 0.24 | 0.28 | 0.38 | 0.53 | 0.74 | 0.99 | −0.28 | −0.32 | −0.43 | −0.59 | −0.81 | −1.08 |
| Beijing | 0.25 | 0.30 | 0.47 | 0.75 | 1.12 | 1.60 | −0.27 | −0.32 | −0.49 | −0.77 | −1.15 | −1.62 |
| Tianjin | 0.18 | 0.20 | 0.30 | 0.45 | 0.65 | 0.90 | −0.07 | −0.10 | −0.23 | −0.43 | −0.69 | −1.02 |
| Hebei | 0.31 | 0.36 | 0.46 | 0.60 | 0.79 | 1.01 | −0.39 | −0.44 | −0.54 | −0.70 | −0.89 | −1.13 |
| Shanxi | 0.68 | 0.66 | 0.68 | 0.75 | 0.86 | 1.00 | −0.45 | −0.47 | −0.54 | −0.67 | −0.84 | −1.05 |
| InnerMongolia | 0.48 | 0.49 | 0.56 | 0.69 | 0.86 | 1.08 | −0.51 | −0.52 | −0.59 | −0.72 | −0.90 | −1.12 |
| Liaoning | 0.34 | 0.37 | 0.48 | 0.65 | 0.88 | 1.17 | −0.41 | −0.43 | −0.54 | −0.71 | −0.94 | −1.22 |
| Jilin | 0.33 | 0.36 | 0.45 | 0.59 | 0.79 | 1.05 | −0.39 | −0.41 | −0.51 | −0.67 | −0.90 | −1.17 |
| Heilongjiang | 0.13 | 0.18 | 0.29 | 0.46 | 0.67 | 0.93 | −0.21 | −0.26 | −0.37 | −0.54 | −0.76 | −1.03 |
| Shanghai | 0.15 | 0.20 | 0.31 | 0.47 | 0.67 | 0.92 | −0.19 | −0.24 | −0.36 | −0.52 | −0.74 | −0.99 |
| Jiangsu | 0.14 | 0.18 | 0.29 | 0.47 | 0.70 | 0.98 | −0.20 | −0.24 | −0.34 | −0.50 | −0.71 | −0.97 |
| Zhejiang | 0.40 | 0.43 | 0.54 | 0.70 | 0.92 | 1.20 | −0.43 | −0.47 | −0.58 | −0.76 | −0.99 | −1.28 |
| Anhui | 0.25 | 0.30 | 0.38 | 0.51 | 0.67 | 0.86 | −0.25 | −0.29 | −0.38 | −0.51 | −0.67 | −0.87 |
| Fujian | 0.05 | 0.11 | 0.26 | 0.47 | 0.74 | 1.08 | −0.09 | −0.15 | −0.29 | −0.50 | −0.78 | −1.12 |
| Jiangxi | 0.31 | 0.33 | 0.41 | 0.53 | 0.71 | 0.93 | −0.34 | −0.36 | −0.44 | −0.57 | −0.75 | −0.98 |
| Shandong | 0.34 | 0.36 | 0.43 | 0.55 | 0.72 | 0.92 | −0.37 | −0.38 | −0.46 | −0.58 | −0.76 | −0.97 |
| Henan | 0.24 | 0.29 | 0.40 | 0.56 | 0.78 | 1.04 | −0.13 | −0.20 | −0.34 | −0.54 | −0.81 | −1.12 |
| Hubei | 0.29 | 0.31 | 0.39 | 0.51 | 0.69 | 0.90 | −0.41 | −0.41 | −0.47 | −0.57 | −0.71 | −0.90 |
| Hunan | 0.16 | 0.20 | 0.29 | 0.43 | 0.61 | 0.83 | −0.18 | −0.22 | −0.31 | −0.46 | −0.64 | −0.87 |
| Guangdong | 0.23 | 0.28 | 0.41 | 0.60 | 0.85 | 1.16 | −0.23 | −0.29 | −0.43 | −0.64 | −0.91 | −1.24 |
| Guangxi | 0.21 | 0.27 | 0.41 | 0.61 | 0.88 | 1.21 | −0.24 | −0.29 | −0.43 | −0.63 | −0.89 | −1.21 |
| Hainan | −0.01 | 0.00 | 0.02 | 0.06 | 0.11 | 0.17 | −0.05 | −0.05 | −0.08 | −0.12 | −0.18 | −0.26 |
| Chongqing | 0.21 | 0.24 | 0.34 | 0.49 | 0.69 | 0.93 | −0.25 | −0.28 | −0.38 | −0.54 | −0.74 | −0.99 |
| Sichuan | 0.13 | 0.19 | 0.29 | 0.45 | 0.64 | 0.88 | −0.18 | −0.23 | −0.33 | −0.48 | −0.68 | −0.91 |
| Guizhou | 0.34 | 0.38 | 0.49 | 0.66 | 0.90 | 1.19 | −0.39 | −0.43 | −0.54 | −0.73 | −0.98 | −1.29 |
| Yunnan | −0.22 | −0.17 | −0.01 | 0.23 | 0.52 | 0.88 | 0.24 | 0.19 | 0.03 | −0.19 | −0.48 | −0.82 |
| Shaanxi | 0.23 | 0.28 | 0.37 | 0.52 | 0.71 | 0.94 | −0.26 | −0.31 | −0.41 | −0.56 | −0.77 | −1.01 |
| Gansu | 0.31 | 0.35 | 0.45 | 0.60 | 0.79 | 1.03 | −0.28 | −0.33 | −0.44 | −0.60 | −0.81 | −1.06 |
| Qinghai | −0.04 | 0.02 | 0.16 | 0.38 | 0.67 | 1.03 | −0.01 | −0.06 | −0.20 | −0.41 | −0.69 | −1.03 |
| Ningxia | 0.27 | 0.31 | 0.42 | 0.59 | 0.83 | 1.11 | −0.29 | −0.33 | −0.45 | −0.64 | −0.90 | −1.21 |
| Xinjiang | 0.51 | 0.49 | 0.53 | 0.60 | 0.72 | 0.88 | −0.53 | −0.51 | −0.54 | −0.62 | −0.74 | −0.90 |
Table 9.
Emissions trading volumes of electricity sector in all regions 3 (104 ton).
| Region | Sa0 | Sa1 | Sa2 | Sa3 | Sa4 | Sa5 |
|---|---|---|---|---|---|---|
| Total | −1495.68 | −1512.37 | −1476.60 | −1394.75 | −1271.62 | −1109.92 |
| Beijing | 26.89 | 24.02 | 22.11 | 20.89 | 20.23 | 20.01 |
| Tianjin | 21.47 | 18.18 | 11.35 | 3.13 | −5.97 | −16.15 |
| Hebei | −73.31 | −80.08 | −82.72 | −82.10 | −78.54 | −72.14 |
| Shanxi | −94.40 | −100.76 | −105.15 | −107.77 | −108.79 | −108.27 |
| InnerMongolia | −502.55 | −460.57 | −410.61 | −353.10 | −288.44 | −216.75 |
| Liaoning | −73.42 | −69.09 | −59.03 | −43.78 | −23.79 | 0.66 |
| Jilin | −307.45 | −279.14 | −256.24 | −238.94 | −227.60 | −223.09 |
| Heilongjiang | 1.99 | −2.16 | −6.09 | −10.01 | −13.98 | −18.01 |
| Shanghai | 70.60 | 62.20 | 53.47 | 45.14 | 37.14 | 29.43 |
| Jiangsu | −56.34 | −69.58 | −77.03 | −79.78 | −78.35 | −73.05 |
| Zhejiang | −0.38 | −16.63 | −33.32 | −51.21 | −70.38 | −90.71 |
| Anhui | −15.14 | −20.04 | −24.43 | −28.40 | −31.99 | −35.16 |
| Fujian | 5.90 | 1.75 | −1.04 | −2.61 | −3.11 | −2.60 |
| Jiangxi | −1.13 | −5.85 | −10.19 | −14.48 | −18.75 | −23.01 |
| Shandong | −198.03 | −203.11 | −200.67 | −192.61 | −179.61 | −161.93 |
| Henan | −79.24 | −78.92 | −75.23 | −68.39 | −58.55 | −45.60 |
| Hubei | −1.58 | 9.60 | 35.01 | 71.47 | 118.30 | 175.31 |
| Hunan | 6.30 | 0.05 | −5.11 | −9.43 | −12.97 | −15.76 |
| Guangdong | 124.52 | 96.37 | 66.79 | 35.47 | 2.39 | −32.37 |
| Guangxi | 15.80 | 12.67 | 10.20 | 8.28 | 6.85 | 5.87 |
| Hainan | 0.32 | 0.23 | 0.06 | −0.18 | −0.48 | −0.83 |
| Chongqing | 19.42 | 16.28 | 10.97 | 5.93 | 1.08 | −3.60 |
| Sichuan | 22.71 | 17.09 | 12.47 | 8.71 | 5.73 | 3.47 |
| Guizhou | −119.17 | −109.80 | −98.78 | −86.20 | −72.19 | −56.82 |
| Yunnan | −53.40 | −49.54 | −43.18 | −34.23 | −22.89 | −9.28 |
| Shaanxi | −33.06 | −33.00 | −31.13 | −27.72 | −22.90 | −16.74 |
| Gansu | −17.99 | −19.17 | −19.87 | −20.22 | −20.26 | −20.03 |
| Qinghai | −1.32 | −2.09 | −2.49 | −2.56 | −2.34 | −1.86 |
| Ningxia | −93.71 | −86.00 | −77.77 | −69.00 | −59.74 | −49.98 |
| Xinjiang | −89.99 | −85.27 | −78.93 | −71.05 | −61.70 | −50.91 |
Positive values denote quota purchases and negative values denote quota sales.
Table 10.
Key results of sensitivity analysis (2007–2030 CO2 intensity decline).
| Indicators | Sb0 | Sb1 | Sb2 | Sb3 | Sb4 | Sb5 |
|---|---|---|---|---|---|---|
| CO2 price (Yuan/ton) | 9.69 | 8.95 | 8.15 | 7.31 | 6.41 | 5.48 |
| GDP change (%) | −0.007 | −0.010 | −0.018 | −0.030 | −0.045 | −0.064 |
| Welfare change (Million Yuan) | −1618 | −1983 | −2857 | −4176 | −5895 | −7985 |
| Electricity output change (%) | −0.830 | −0.797 | −0.818 | −0.885 | −0.995 | −1.144 |
| Coal-powered (%) | −0.882 | −1.074 | −1.304 | −1.569 | −1.865 | −2.192 |
| Natural gas-powered (%) | −0.232 | −0.427 | −0.661 | −0.933 | −1.241 | −1.586 |
| Petroleum-powered (%) | −0.321 | −0.482 | −0.667 | −0.876 | −1.110 | −1.371 |
Table 11.
Key results of sensitivity analysis (free quota allocation).
| Indicators | Sc0 | Sc1 | Sc2 | Sc3 | Sc4 | Sc5 |
|---|---|---|---|---|---|---|
| CO2 price (Yuan/ton) | 6.91 | 6.13 | 5.29 | 4.41 | 3.47 | 2.49 |
| GDP change (%) | −0.002 | −0.005 | −0.014 | −0.026 | −0.042 | −0.062 |
| Welfare change (Million Yuan) | 689 | 97 | −1013 | −2578 | −4555 | −6913 |
| Electricity output change (%) | −0.569 | −0.538 | −0.560 | −0.629 | −0.740 | −0.892 |
| Coal-powered (%) | −0.616 | −0.807 | −1.037 | −1.302 | −1.598 | −1.925 |
| Natural gas-powered (%) | −0.047 | −0.264 | −0.522 | −0.822 | −1.162 | −1.542 |
| Petroleum-powered (%) | −0.091 | −0.273 | −0.484 | −0.723 | −0.993 | −1.296 |
© 2017 by the authors. Licensee MDPI, Basel, Switzerland. This article is an open access article distributed under the terms and conditions of the Creative Commons Attribution (CC BY) license (http://creativecommons.org/licenses/by/4.0/).
Share and Cite
MDPI and ACS Style
Wu, J.; Fan, Y.; Xia, Y. How Can China Achieve Its Nationally Determined Contribution Targets Combining Emissions Trading Scheme and Renewable Energy Policies? Energies 2017, 10, 1166. https://doi.org/10.3390/en10081166
AMA Style
Wu J, Fan Y, Xia Y. How Can China Achieve Its Nationally Determined Contribution Targets Combining Emissions Trading Scheme and Renewable Energy Policies? Energies. 2017; 10(8):1166. https://doi.org/10.3390/en10081166
Chicago/Turabian StyleWu, Jie, Ying Fan, and Yan Xia. 2017. "How Can China Achieve Its Nationally Determined Contribution Targets Combining Emissions Trading Scheme and Renewable Energy Policies?" Energies 10, no. 8: 1166. https://doi.org/10.3390/en10081166
Note that from the first issue of 2016, this journal uses article numbers instead of page numbers. See further details here.