1. Introduction
Power transformer is one of the most expensive and important pieces of equipment in power grid [
1,
2]. The safety and stability of such transformers are both important and necessary in operating power systems [
3]. Oil-paper insulation is an important form of power transformer insulation system; the remaining life of the transformer largely depends on the insulation status of oil-paper which is affected by thermal, mechanical, partial discharge and other aging factors in the long-running process [
4,
5,
6]. Therefore, using an accurate assessment tool to evaluate the condition of oil-paper insulation has become a popular research topic.
Aging degree and moisture content (MC) are two important aspects of oil-paper insulation state assessment. The increase of moisture content will raise dielectric loss and reduce breakdown voltage of oil-paper insulation which will damage the insulation structure and affect normal operation of equipment [
7,
8]. The aging degree of oil-paper insulation will directly determine the service life of the transformer. When the aging degree reaches a certain extent, with the degradation of insulating paper, the breakdown voltage and mechanical properties of the insulation system will significantly reduce, thus the transformer main insulation will be unable to meet the requirements, and the insulation system will be completely ineffective. Various methods have been developed to help to evaluate the condition of the insulating paper, including the breakdown voltage, the tensile strength, the degree of polymerization and Karl Fischer coulometric titration [
9,
10]. More recently, Frequency Domain Spectroscopy (FDS) [
11,
12,
13], Polarization and Depolarization Current (PDC) [
14,
15,
16] and Recovery Voltage Measurement (RVM) [
17], which are based on dielectric response, have become a hotspot for scholars to study because of easy operation and no need for sampling. Compared with PDC and RVM, FDS has the advantages of rich insulation information and strong anti-interference ability, so it has great potential in oil-paper insulation condition evaluation [
18].
A lot of valuable research about oil-paper insulation condition assessment and the influence of moisture and aging on FDS measurement have been done. Blennow [
19] studied measurement of moisture content in field transformer based on field experience, and presented that precautions should be taken with the results to minimize effects caused by equipment remaining connected to the transformer as well as by external conditions, while the internal relationship between aging and moisture had not be explored. Belén García and Juan Carlos Burgos’ studies [
20,
21,
22] focused on moisture diffusion in oil-paper insulation, and explored the influence of temperature, thickness of cardboard, aging and other factors on moisture diffusion coefficient between oil and paper. The mechanism of factors affecting water diffusion was elaborately demonstrated, which revealed an internal relation between moisture and aging degree of paper. Studies of Jadav et al. [
23] and Liao et al. [
23,
24] explored the influence of aging degree and moisture content of oil-paper insulation on FDS. The results showed that aging mainly affects the low-frequency range of tanδ curves, while moisture has an effect in the whole measurement frequency domain, and the effect of moisture on tanδ curves is more prominent than that of cardboard aging. As above, although a lot research has been done related to condition assessment, FDS or internal relationship between moisture and aging, there still remains challenging problems that the assessment results of aging condition and moisture content are mostly combined rather than separated, which causes the inaccuracy of condition assessment results. Therefore, exploring effective ways to evaluate the condition of oil-paper insulation and separating the influences of aging degree and moisture content on dielectric response measurements are still challenging problems. In this study, different with the previous studies, aging degree and moisture content compensation factors are introduced to eliminate the influences on different frequency bands between aging and moisture. Therefore, problems in previous literature can be solved by compensating one factor when measuring another, and compensation factor algorithm is proposed to achieve accurate assessment on the field test based on compensation factors and characteristic parameters.
In this paper, an accelerated thermal aging experiment was carried out under laboratory condition and five sets of oil-paper insulation samples were prepared with different aging degree and moisture content. Firstly, the effect of moisture content and aging degree of insulation paper on FDS curves were studied, and characteristic parameters were put forward to represent aging degree and moisture content. Then, by analyzing the combined effects of moisture and aging on FDS, this paper introduced the moisture compensation factor (MCF) and aging compensation factor (ACF), and proposed a new method that could eliminate the mutual influences between moisture content and aging degree to evaluate the condition of oil-paper insulation.
4. A New Approach to Assessing Aging Degree of Oil-Paper Insulation
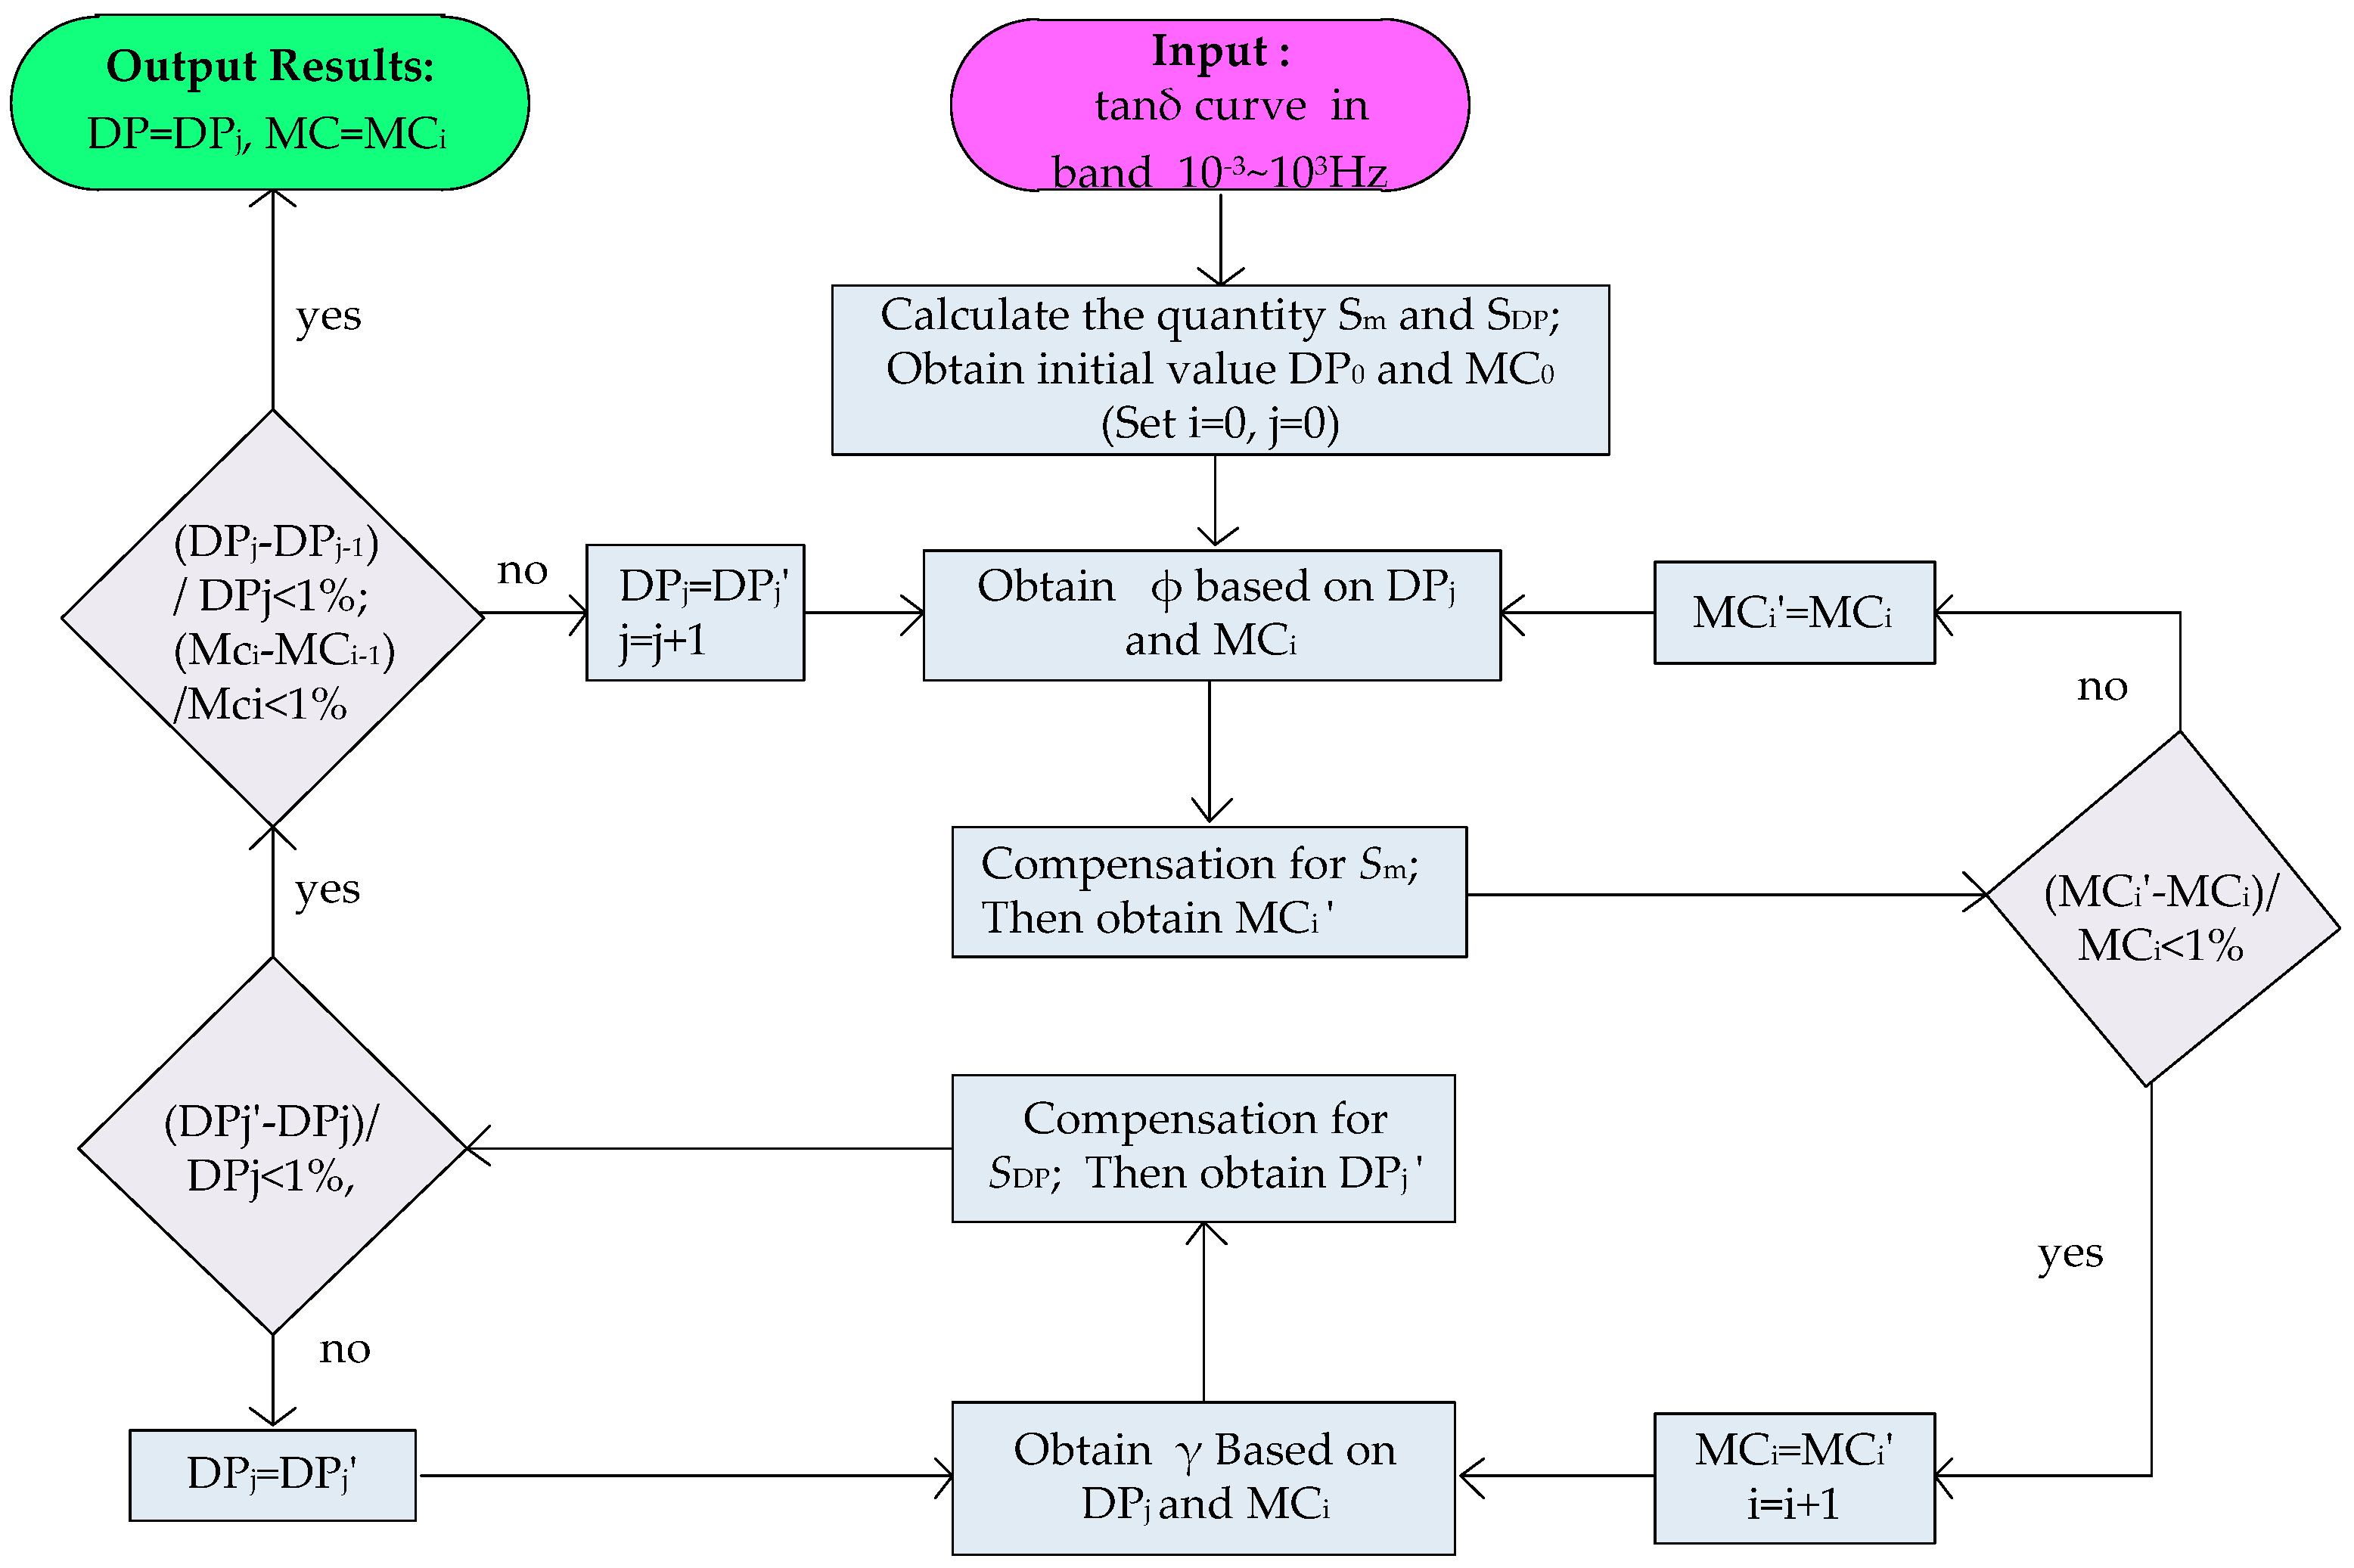
The above compensation factors can eliminate one element of aging and moisture when evaluating the other, but the disadvantage is that the specific values of factors need to be obtained (MC value or DP value). However, it is often difficult to get any precise value of the two. Therefore, an algorithm is proposed to solve this problem, specific steps are as follows:
- (1)
Firstly, the tan
δ curve of oil-paper insulation sample is measured, and S
DP, S
m are calculated by tan
δ curve. According to fitting Equation in
Table 3, moisture content can be obtained, and the results are recorded as MC
0. As the impact of moisture on aging measurement is noteworthy, according to DL/T984-2005 <oil-immersed transformer insulation aging guidelines> [
28], the range of DP can be obtained through the transformer operating years, and recorded as DP
0. MC
0, and DP
0 are taken as initial value, but both have errors.
- (2)
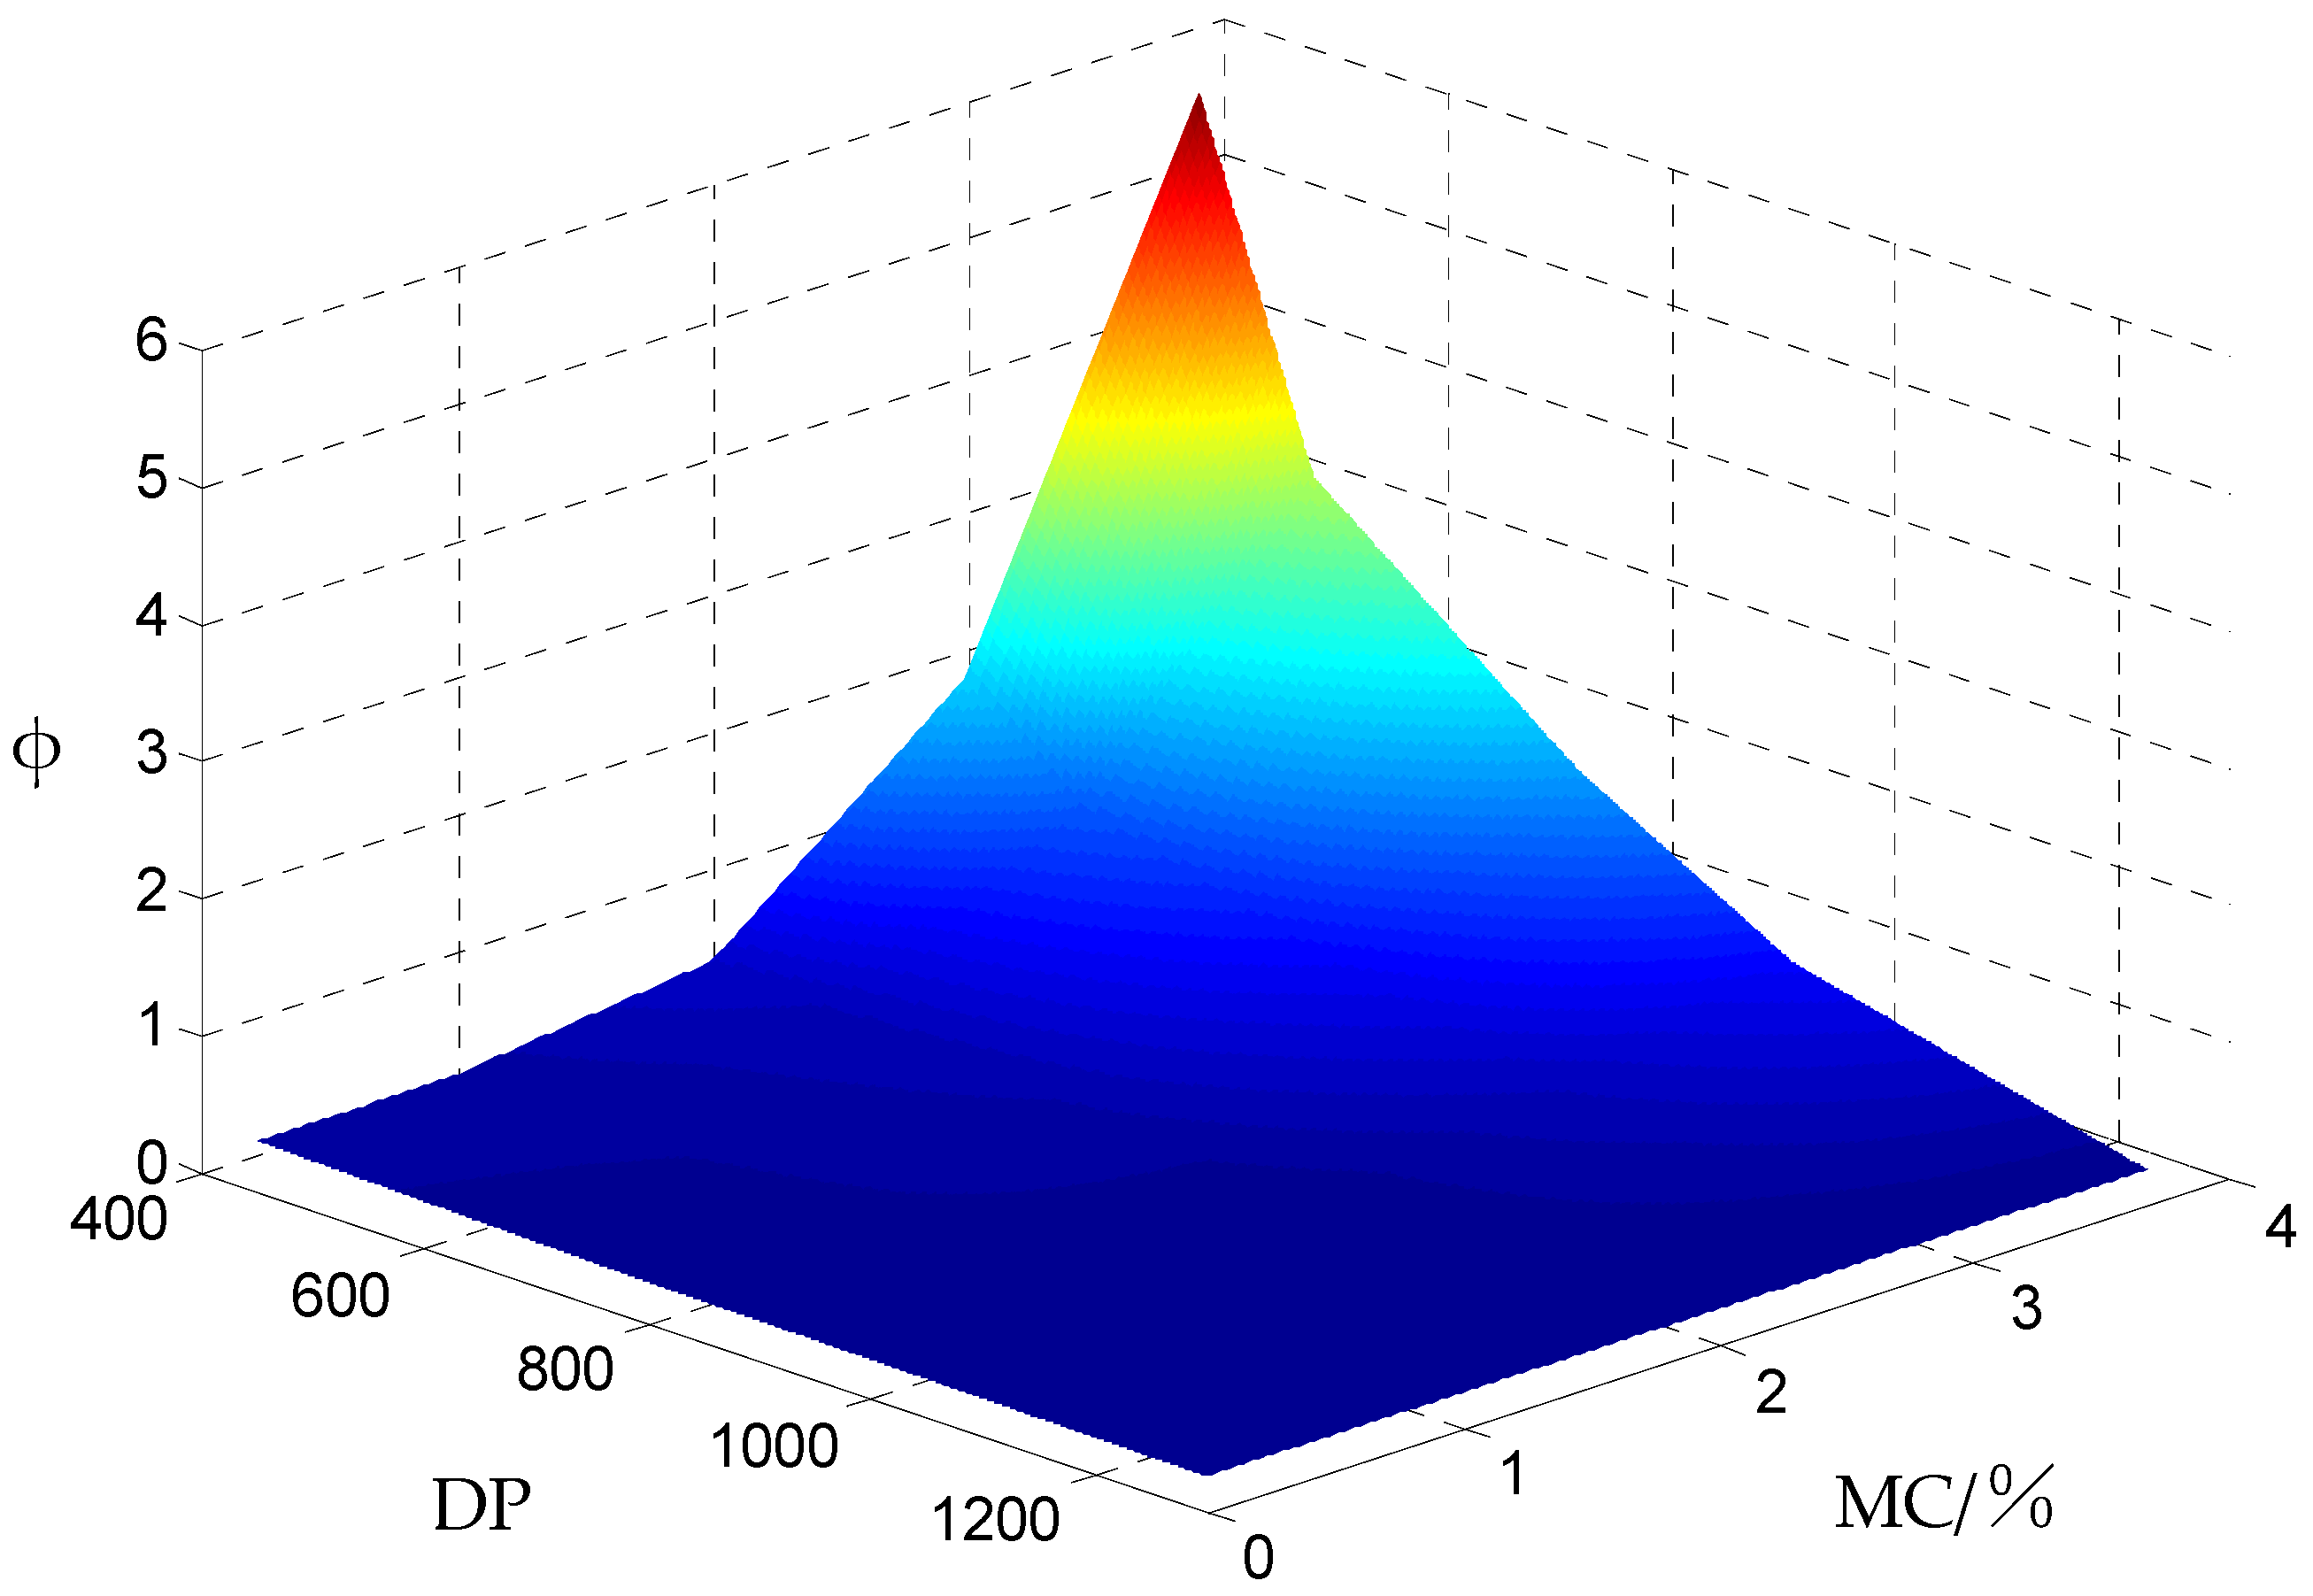
The DP value and MC value of steps 1 are brought into the ACF surface to calculate ACF φ. Then, Sm is modified by φ, and the modified Sm is brought into the table 3 to obtain the new MC’. Finally, the Sm compensating operation is repeated until the difference of the two adjacent moisture calculation results less than 1%.
- (3)
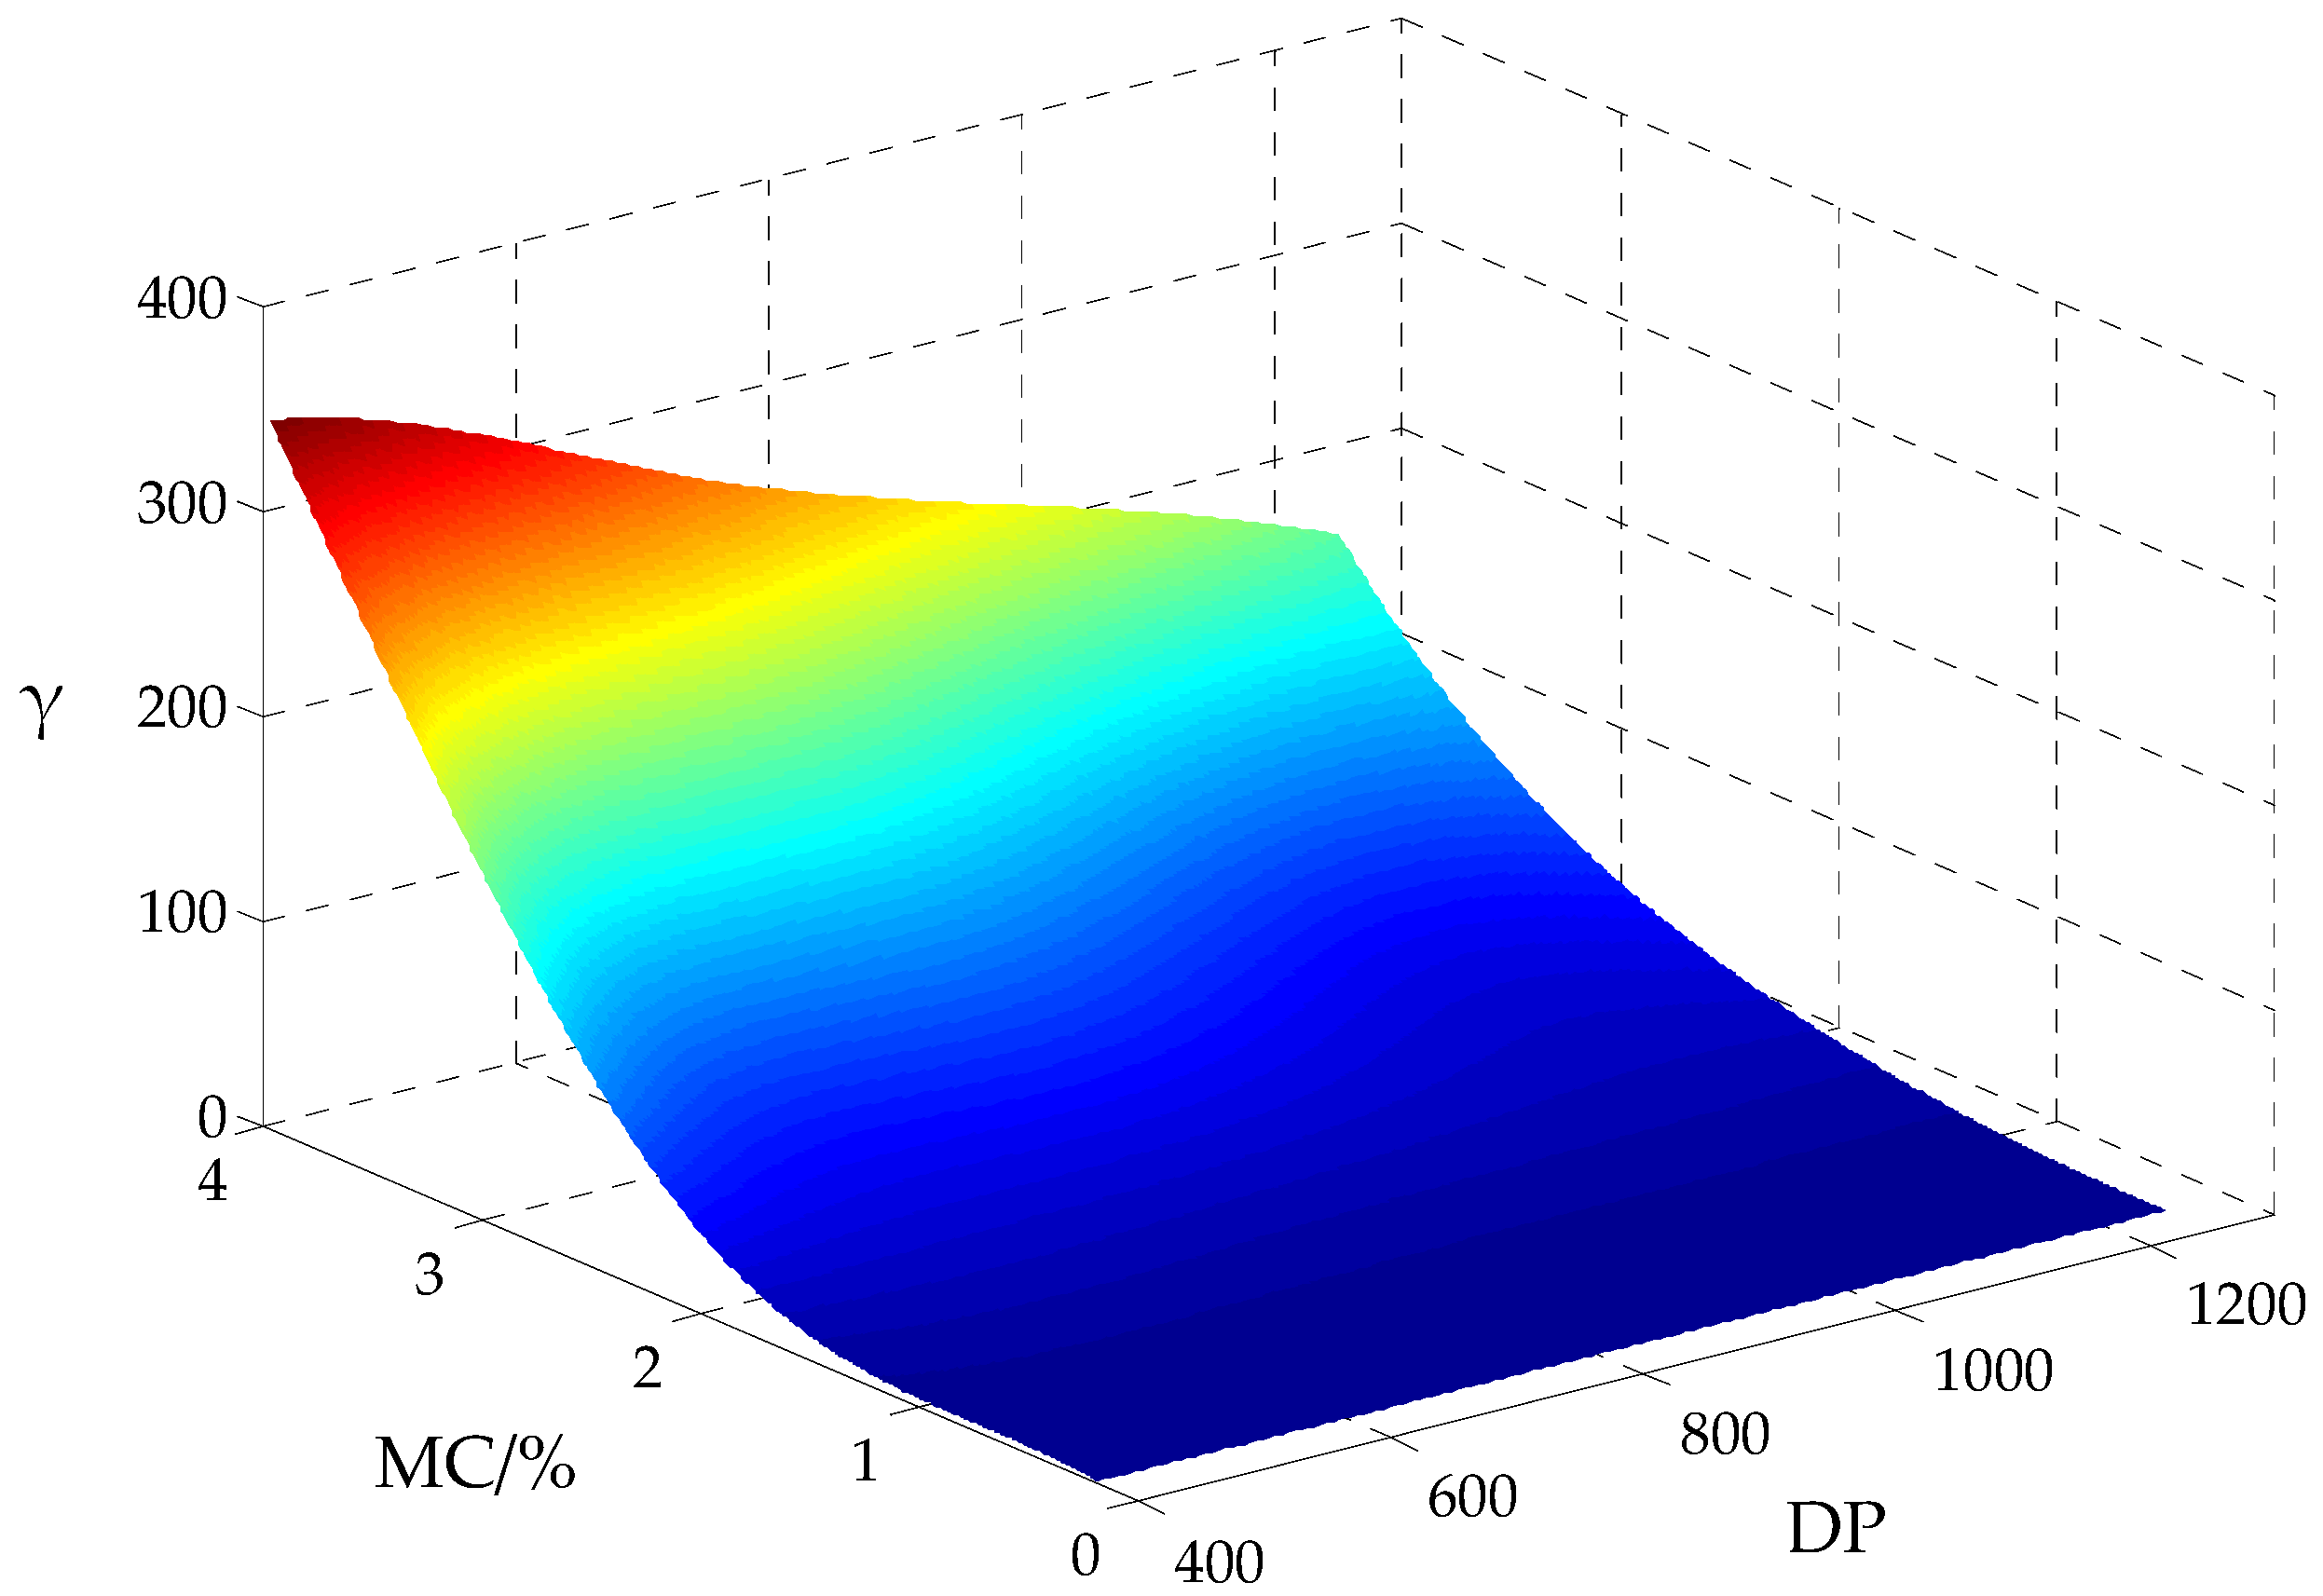
The DP value and MC value of steps 2 are brought into the MCF surface to calculate MCF γ. Then, S
DP is modified by
γ, and the modified S
DP is brought into the
Table 3 to obtain the new DP’. Finally, the S
DP compensating operation is repeated until the difference of the two adjacent DP calculation results less than 1%.
- (4)
If DP and MC meet the condition of (DPj − DPj−1)/DPj−1 < 1% and (MCi − MCi−1)/MCi−1< 1%, the DP and MC can be used as evaluation results. Otherwise, repeat steps 2, 3.
This method uses the compensation factor surface to approximate the true compensation factor step by step. Finally, the effect of moisture or aging on the measurement in S
DP and S
m is eliminated, and the accurate evaluation results are obtained according to
Section 3.2. The flow chart of compensation factor method is shown in
Figure 9.
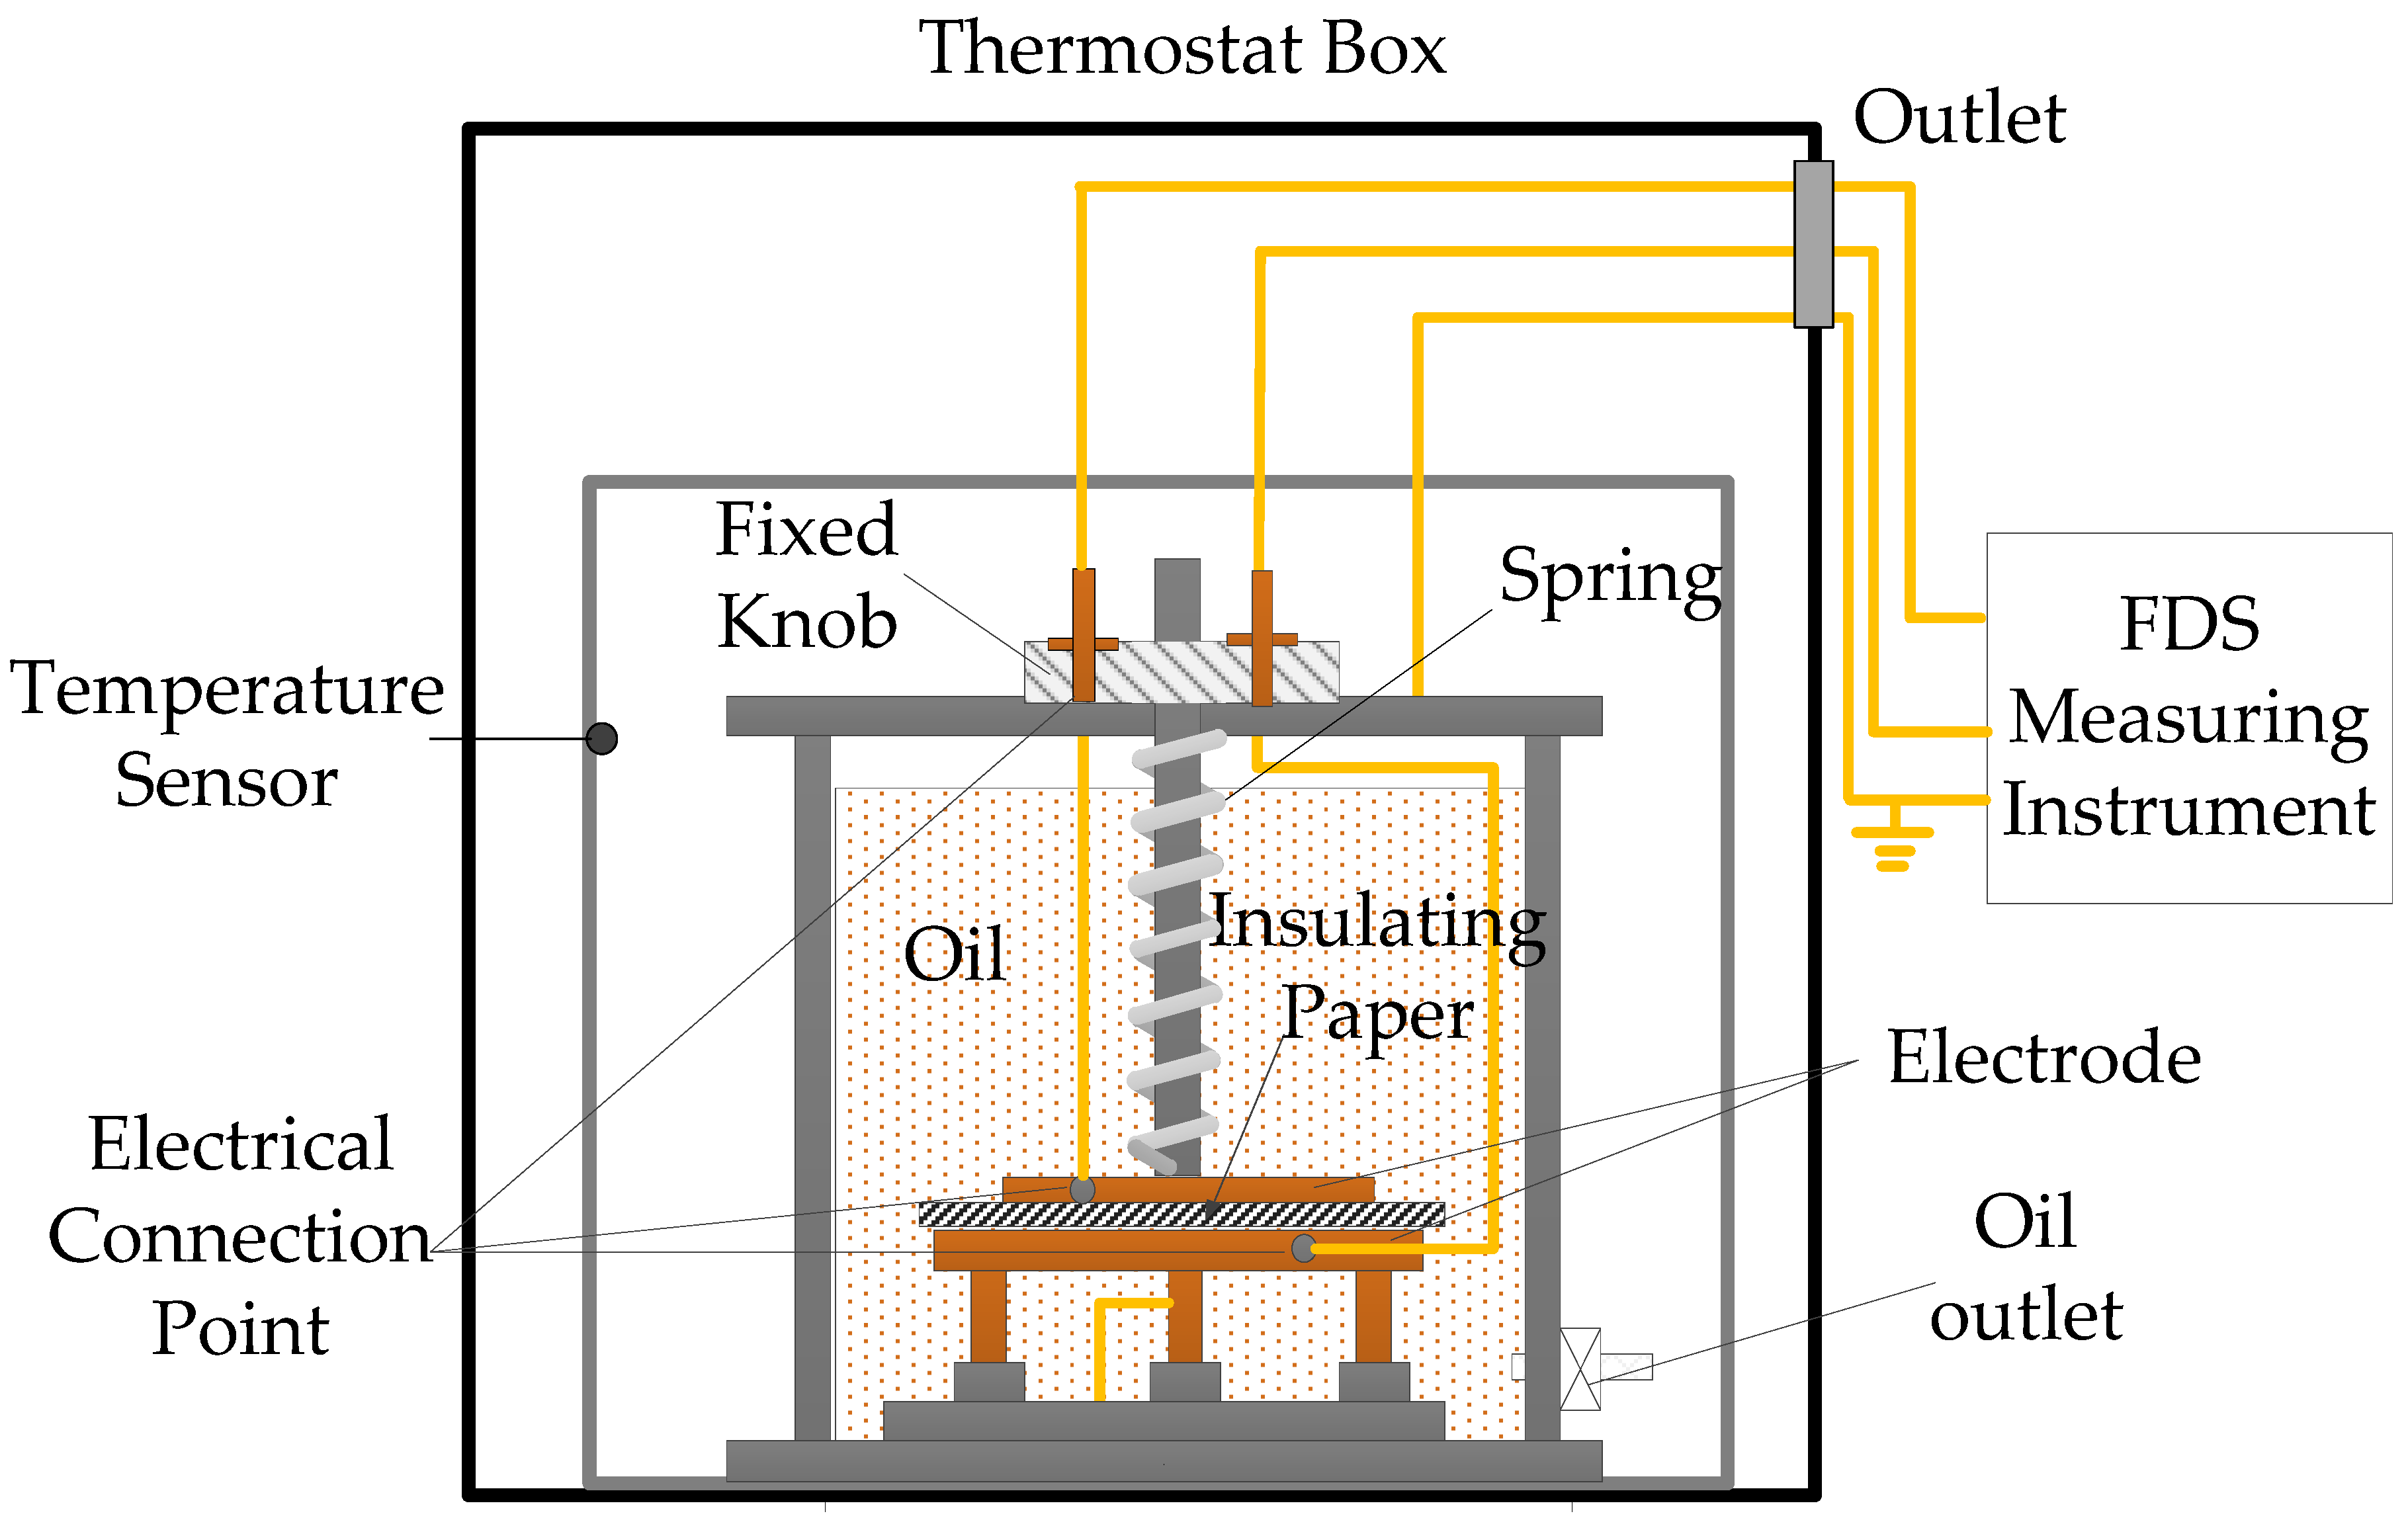
5. Field Test
In order to verify the feasibility of the compensation factor method to evaluate aging degree and moisture content in the main insulation of field transformers, in this section, two 110 kV double-winding transformers with different operating times in different regions (Sichuan, China) Power Grid Company were used as examples to evaluate the main insulation status. The specific information of transformers for field test is shown in
Table 6.
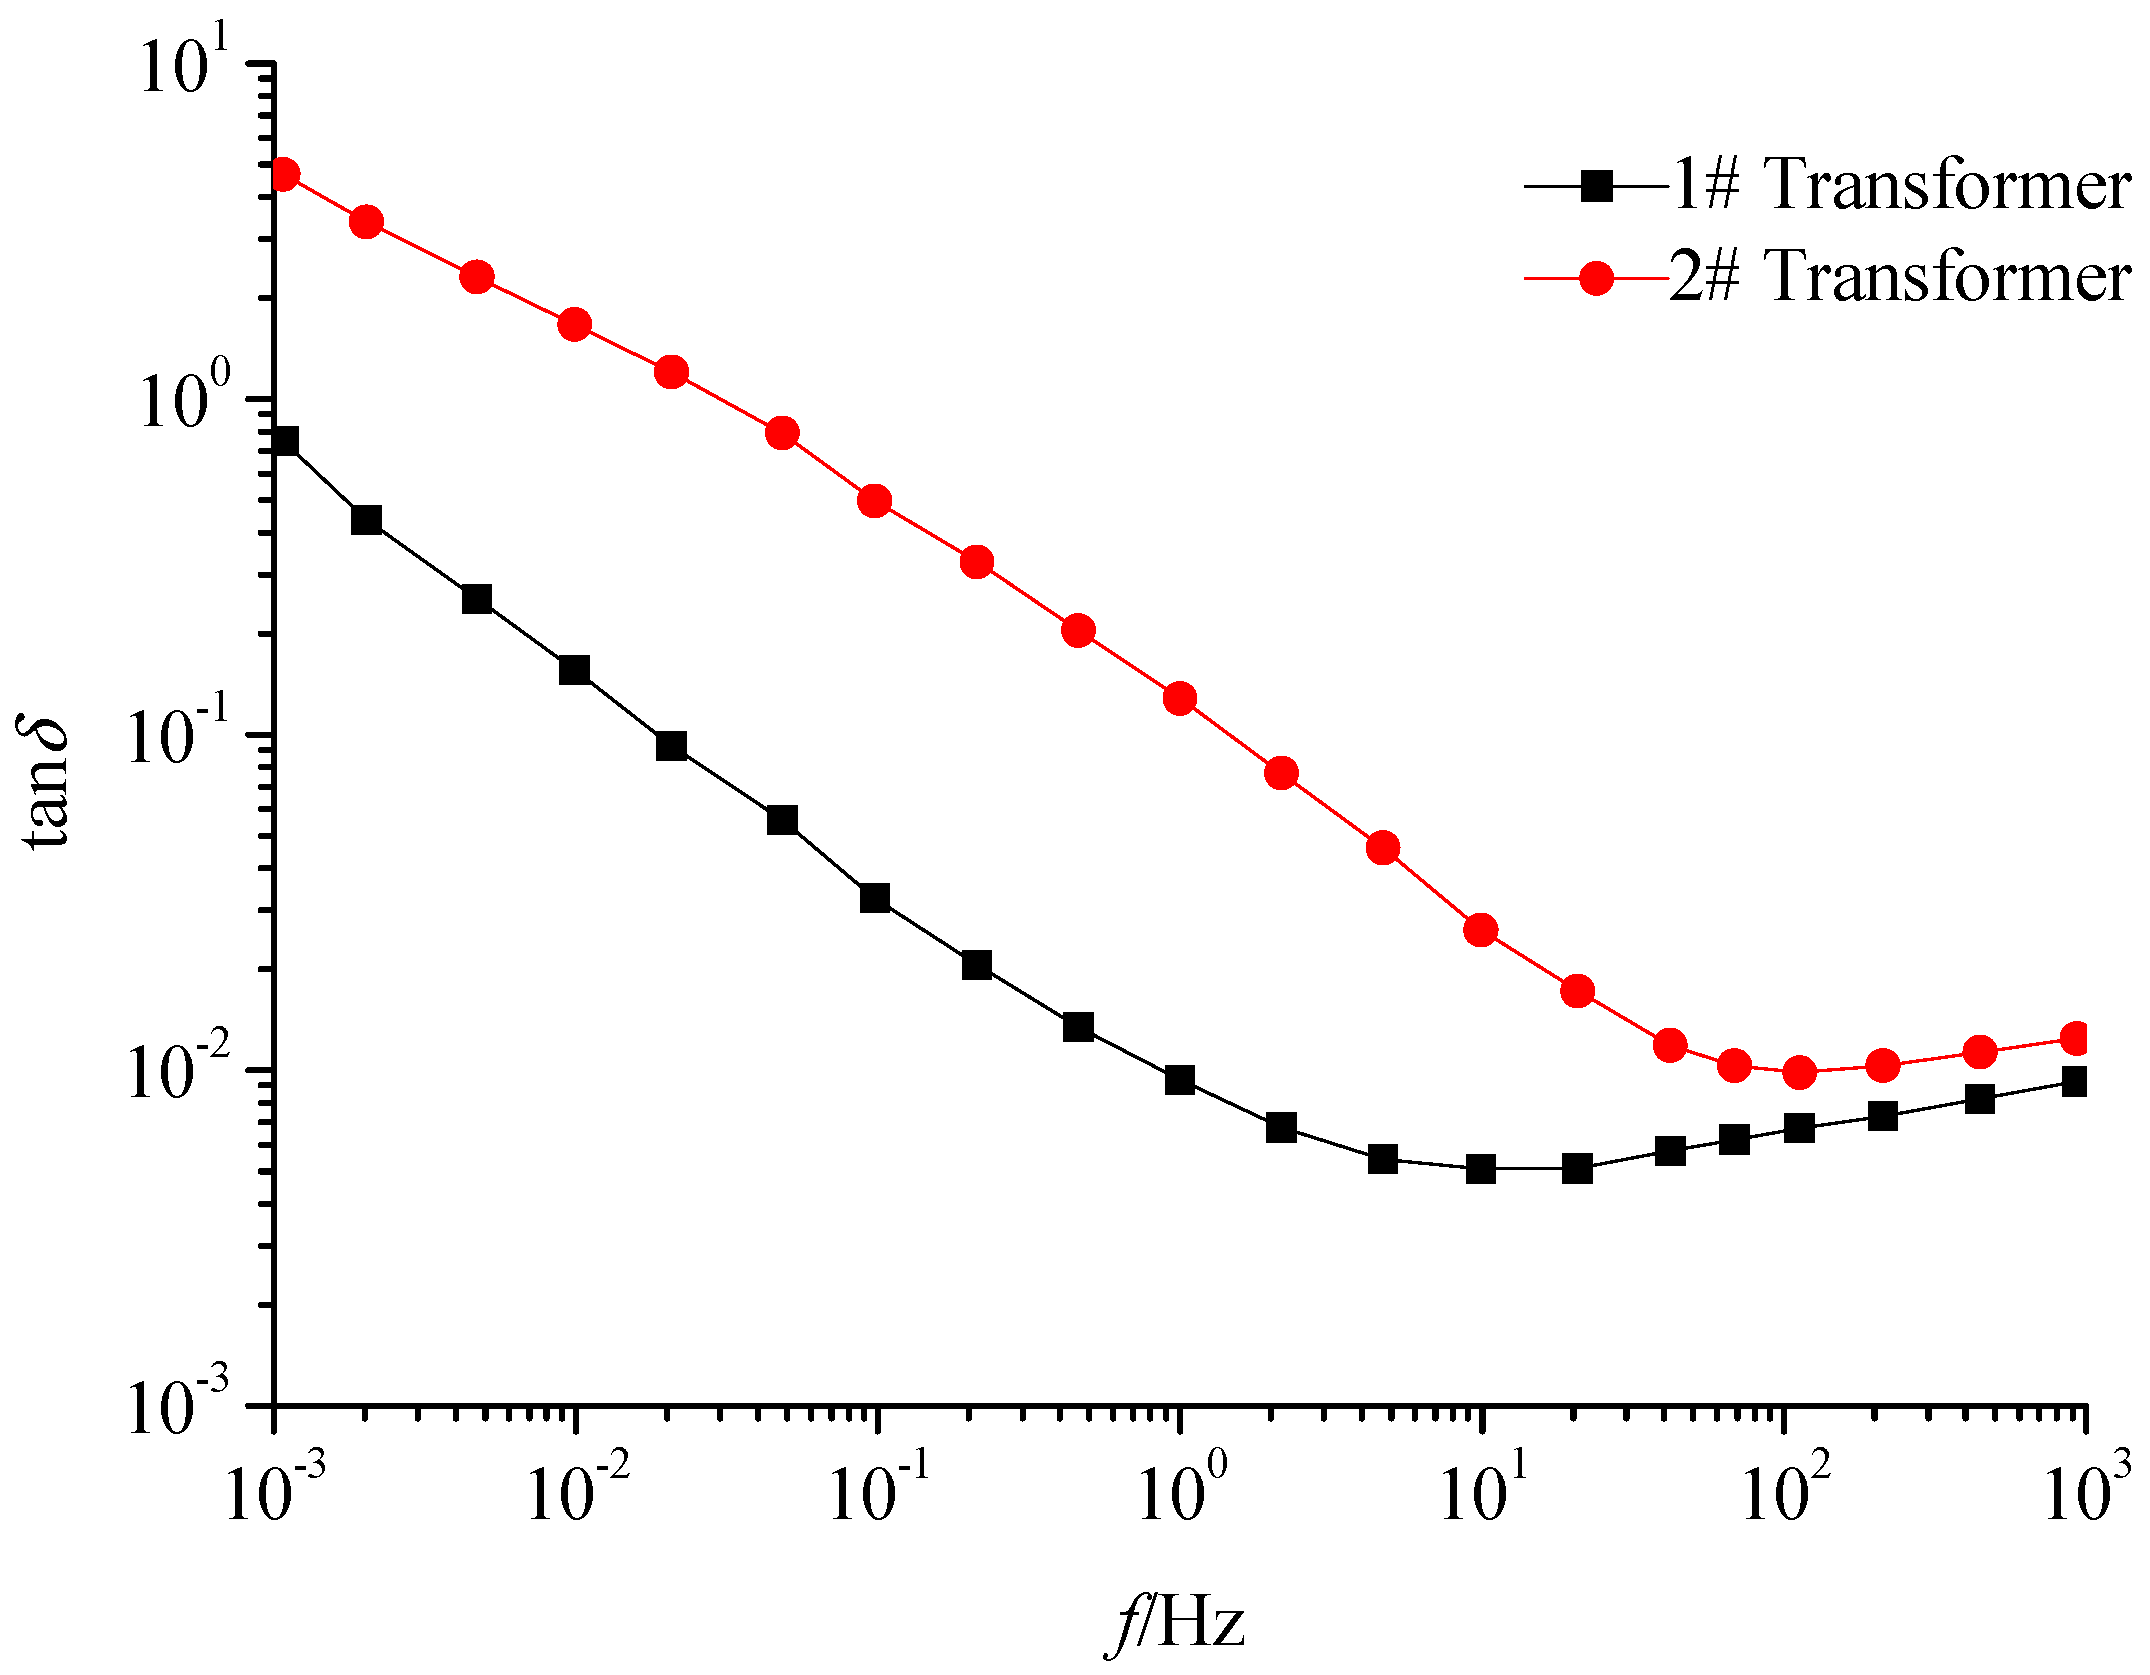
IDAX300 dielectric response analyzer was selected as field test instrument, the test frequency was set in the range of 10
−3 to 10
3 Hz and the test voltage peak was set to 200V. At the beginning of test, top oil temperature of 1# transformer was 26 °C, top oil temperature of 2# transformer was 28 °C. The fluctuation of the oil temperature of the two transformers was less than 2 °C during the whole test. According to temperature shift method and XY model of oil-paper insulation in the references [
24,
29], the FDS curve of field transformers had been adjusted by temperature shift, so as to obtain tanδ curves at reference temperature 30 °C, as shown in
Figure 10.
Referring to DL/T984-2005<oil-immersed transformer insulation aging guidelines>, 1# transformer has served for 10 years, which is in the middle of aging; 2# transformer has served for 18 years, the main insulation DP less than 500 which is in the late aging stage. So, the initial value of the 1# transformer was chosen as DP
0 = 700, and the initial value of the 2# transformer was chosen as DP
0 = 500.
Table 7 shows the evaluation results of the compensation factor method for the insulation state of field transformers. 1# transformer status evaluation results are DP = 771.9, MC = 1.015%; 2# transformer evaluation results are DP = 446.7, MC = 1.644%. The MC results are similar to IDAX300’s results, and shown in
Table 7. Since it is not possible to sample the field transformer, so the exact value of DP is unknown, but the DP results of compensation factor method are in a reasonable range.
6. Conclusions
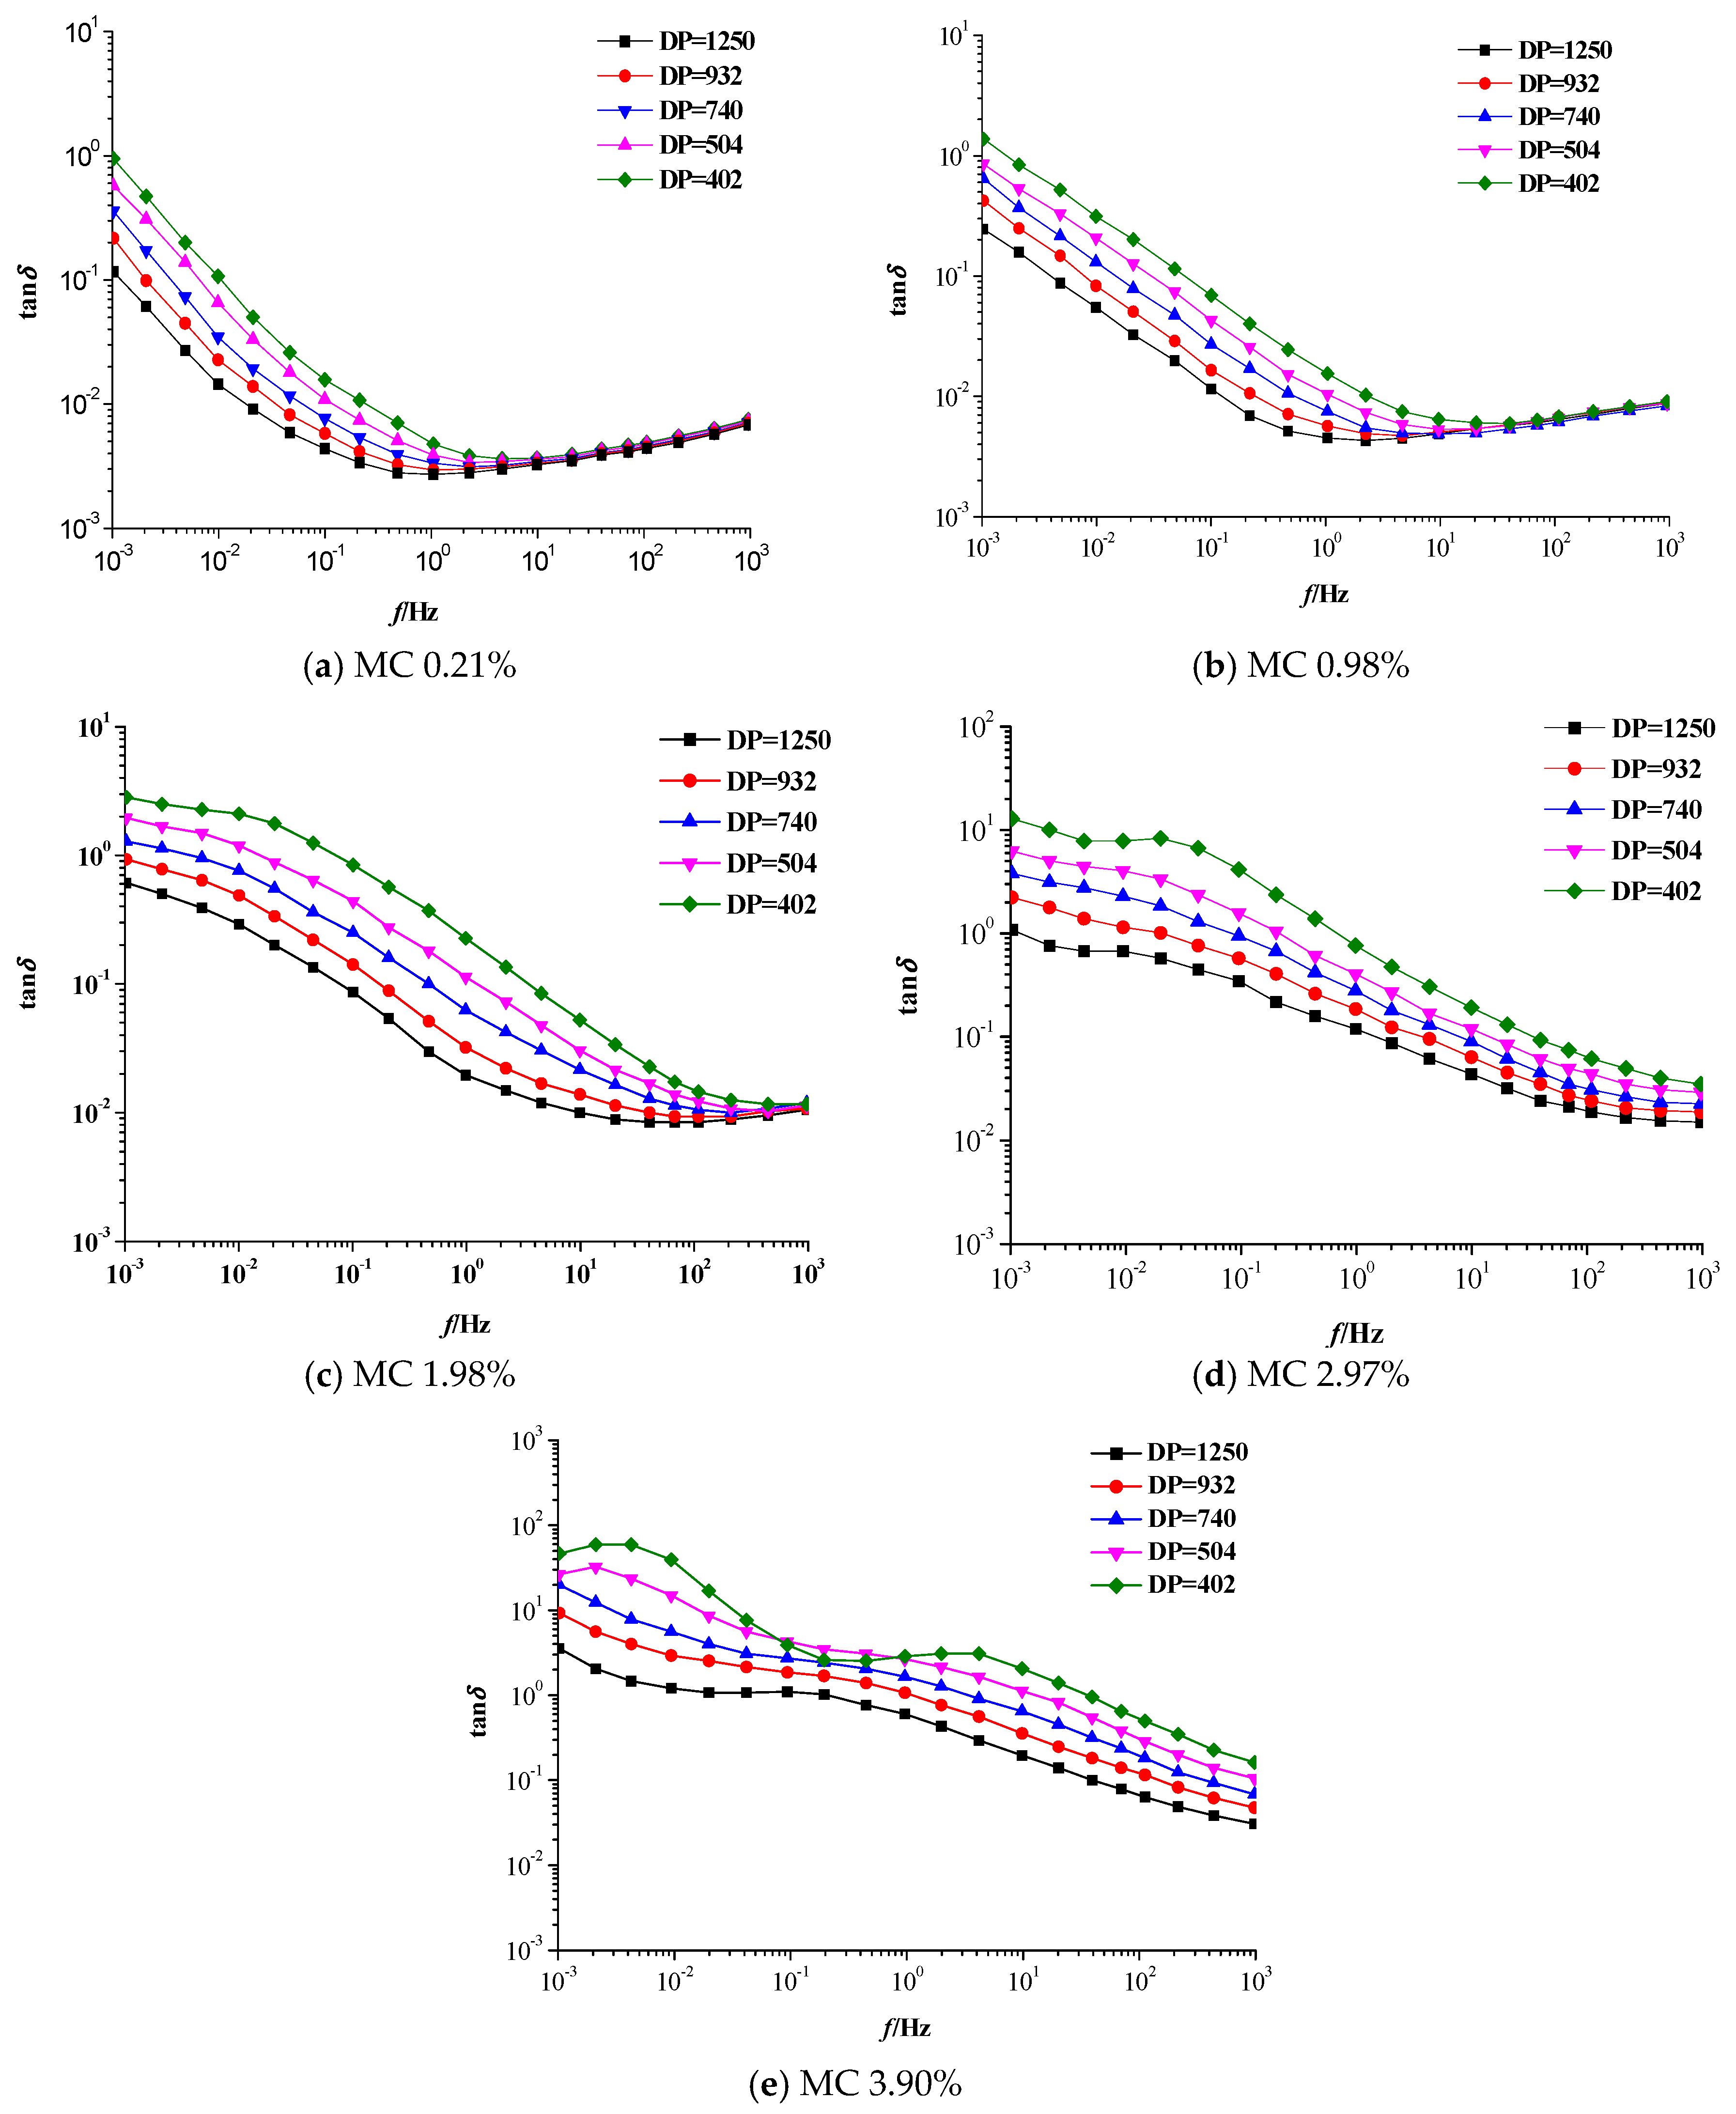
In this study, Oil-paper insulation samples were prepared through an accelerated thermal aging test. After aging, samples were dried and the DP of them were measured. Then, different moisture content samples (0%~4%) were obtained under each aging degree with natural moisture absorption. The dielectric loss (tanδ) curves of oil-paper insulation under different conditions were measured based on the FDS measurement. By analysis of curves, the characteristic parameters of aging and moisture were proposed, and the compensation factor and compensation factor evaluation algorithm were put forward for compensating the influence on characteristic parameters and accuracy of evaluating the condition of oil-paper insulation.
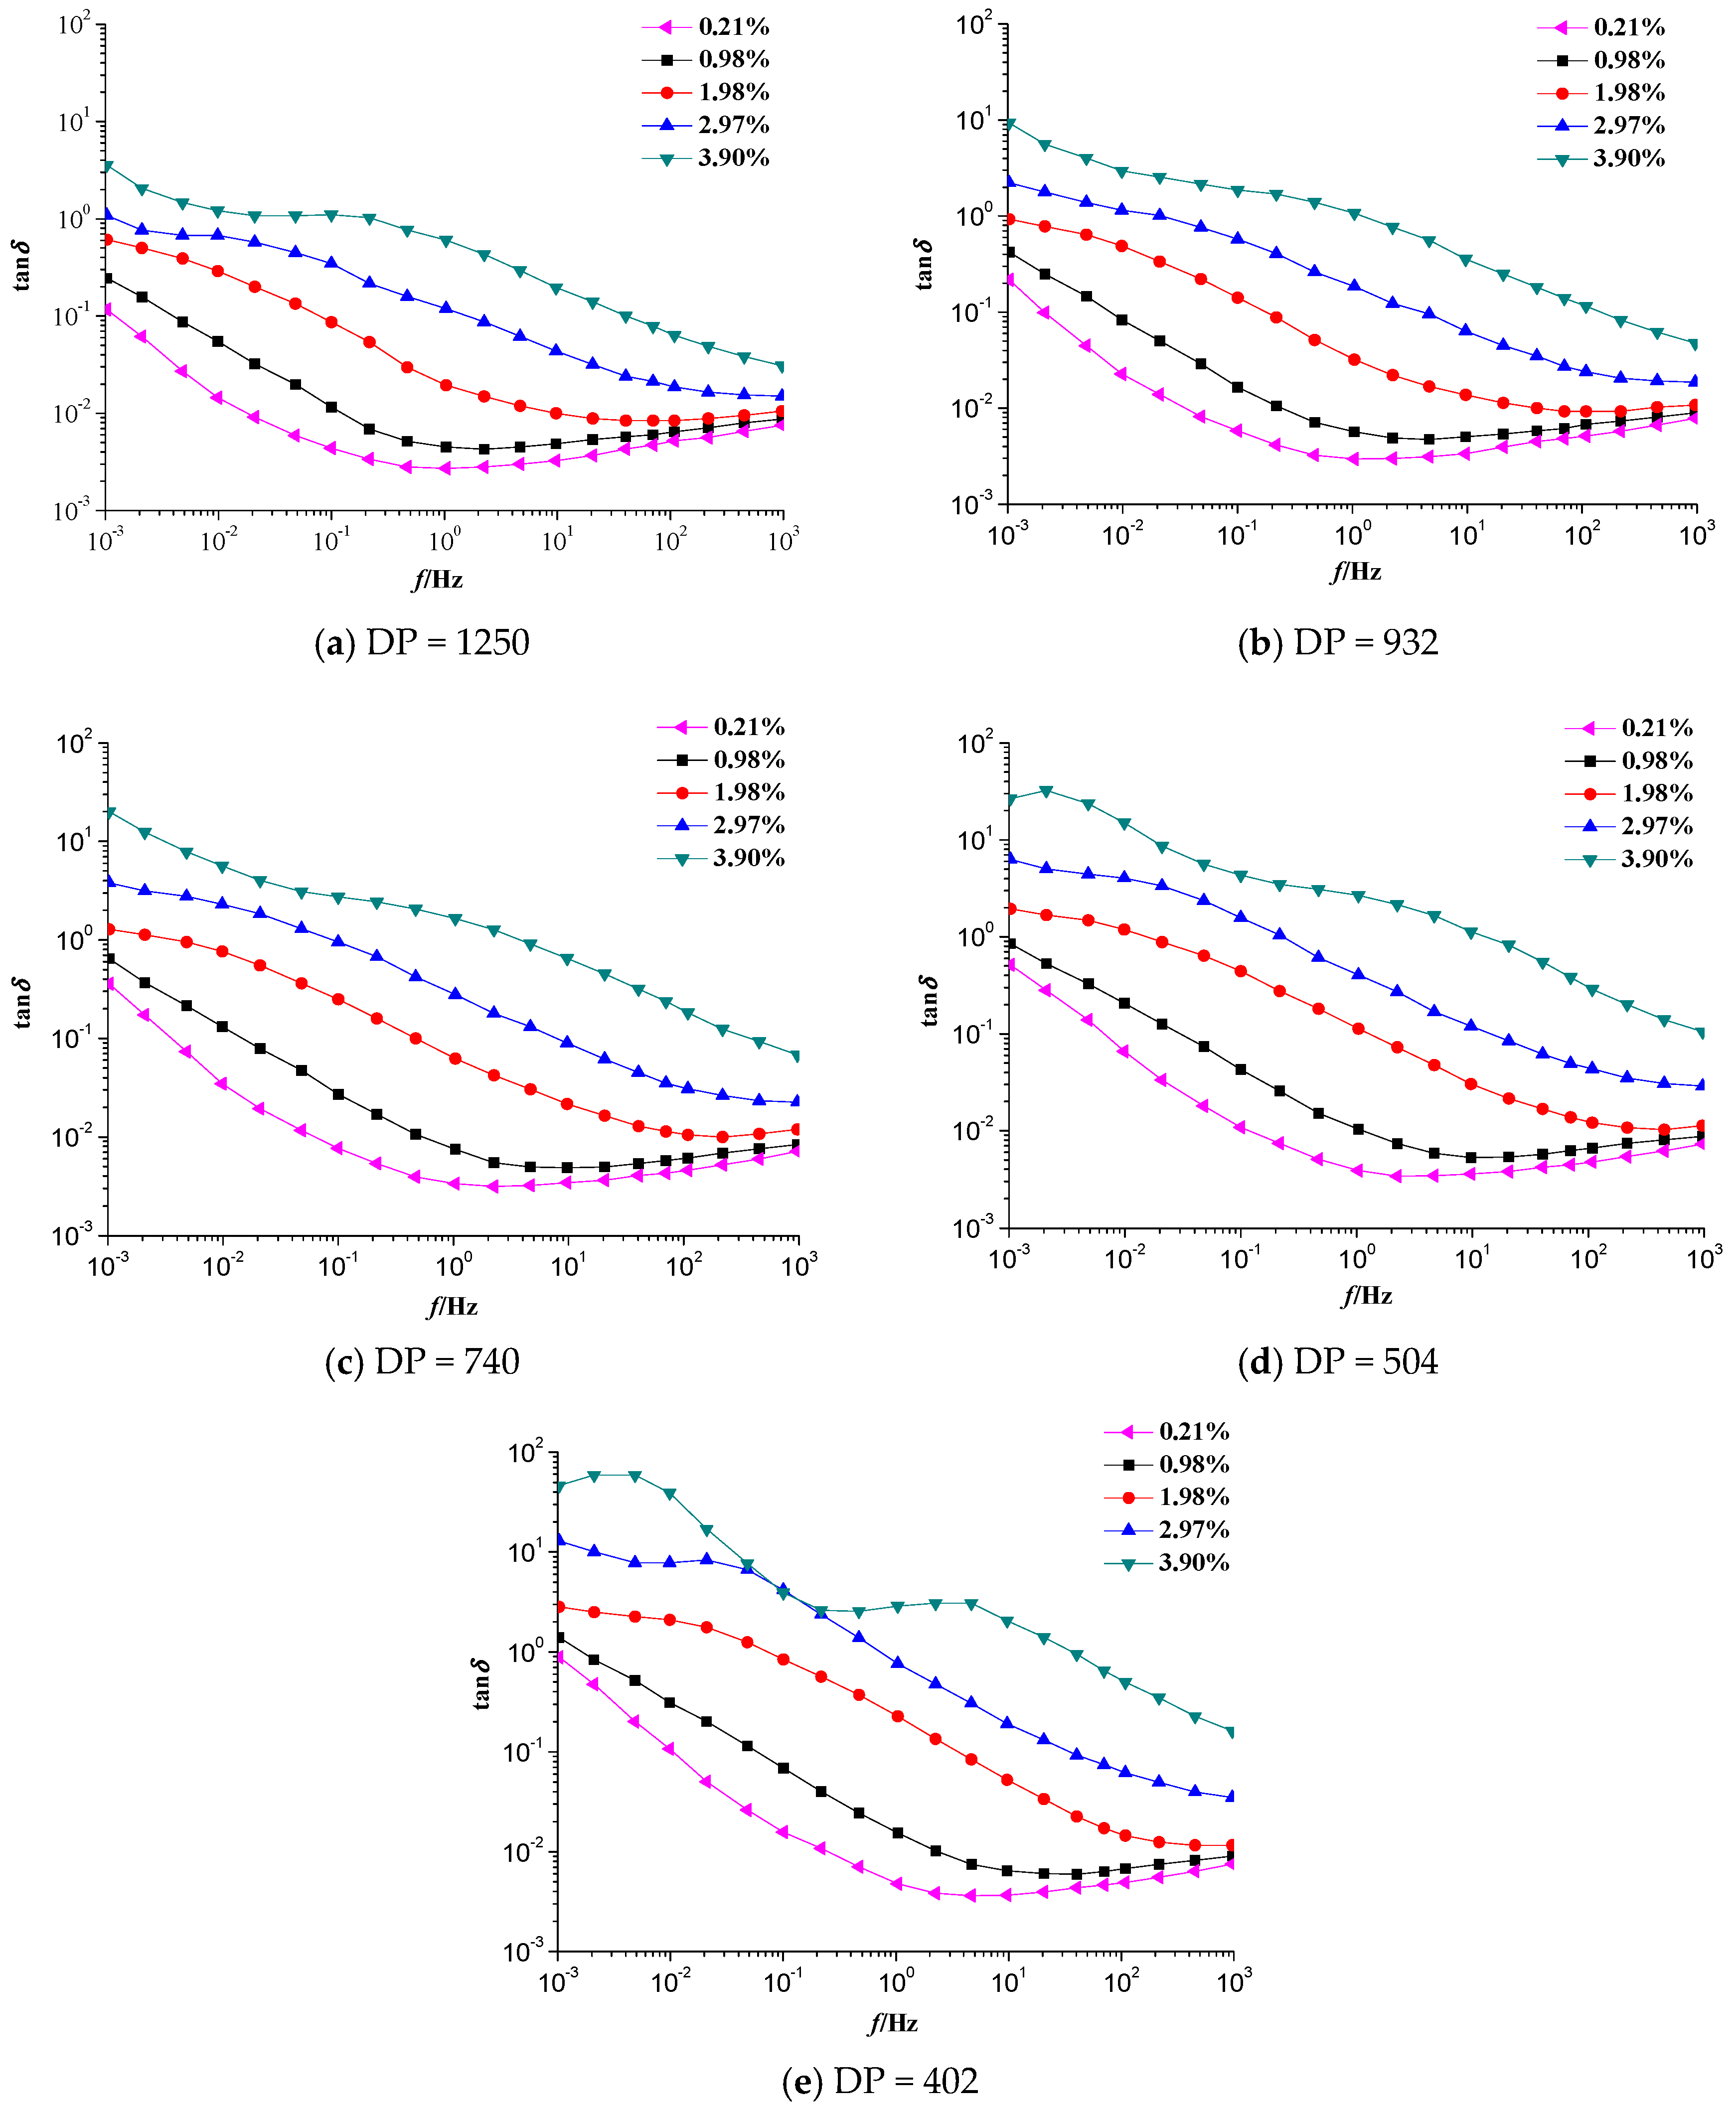
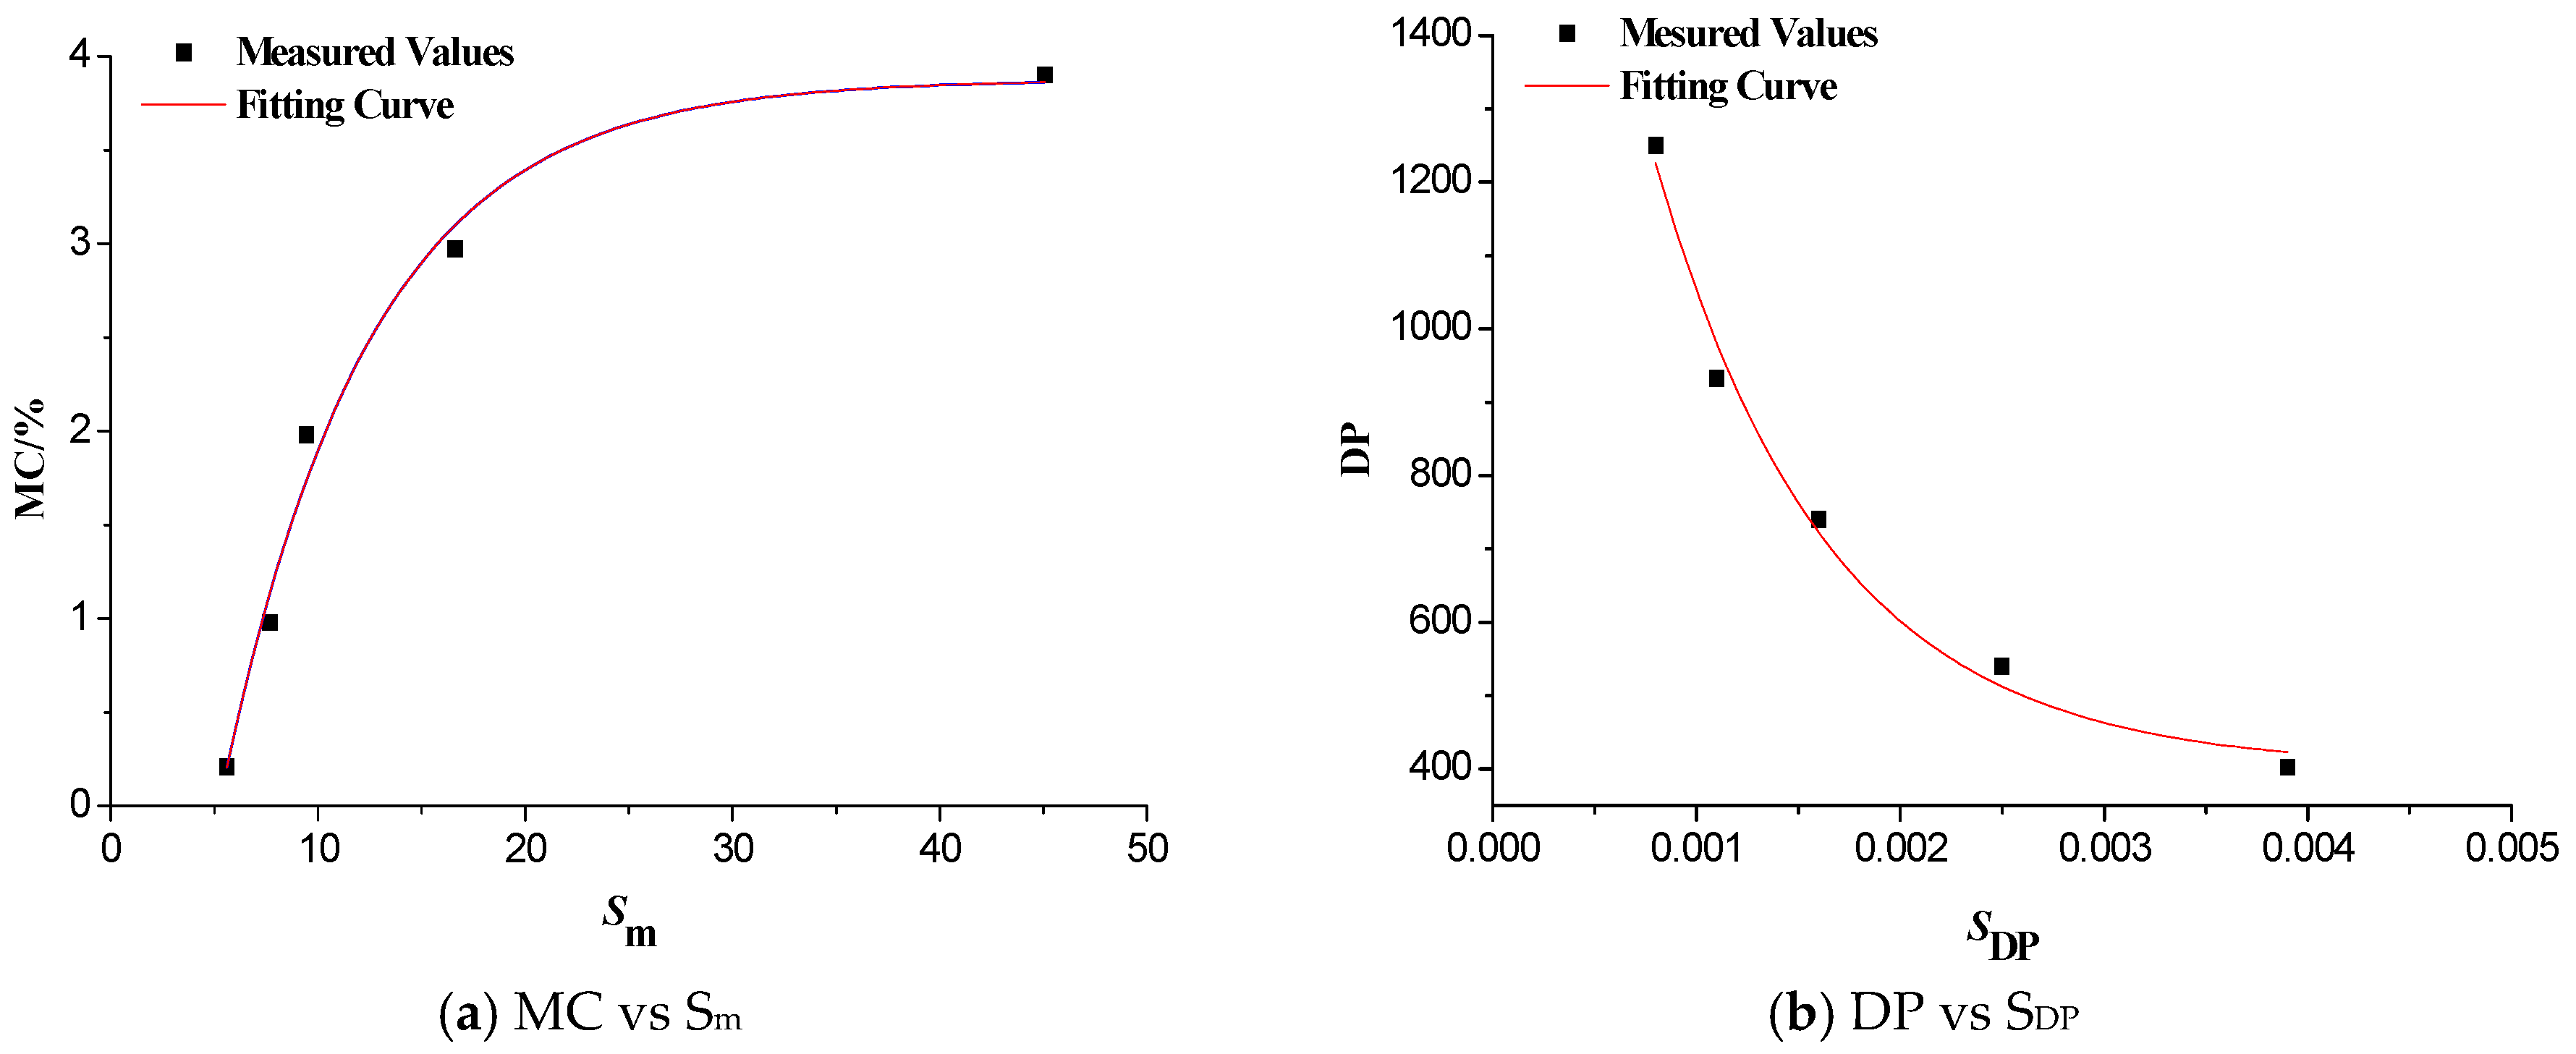
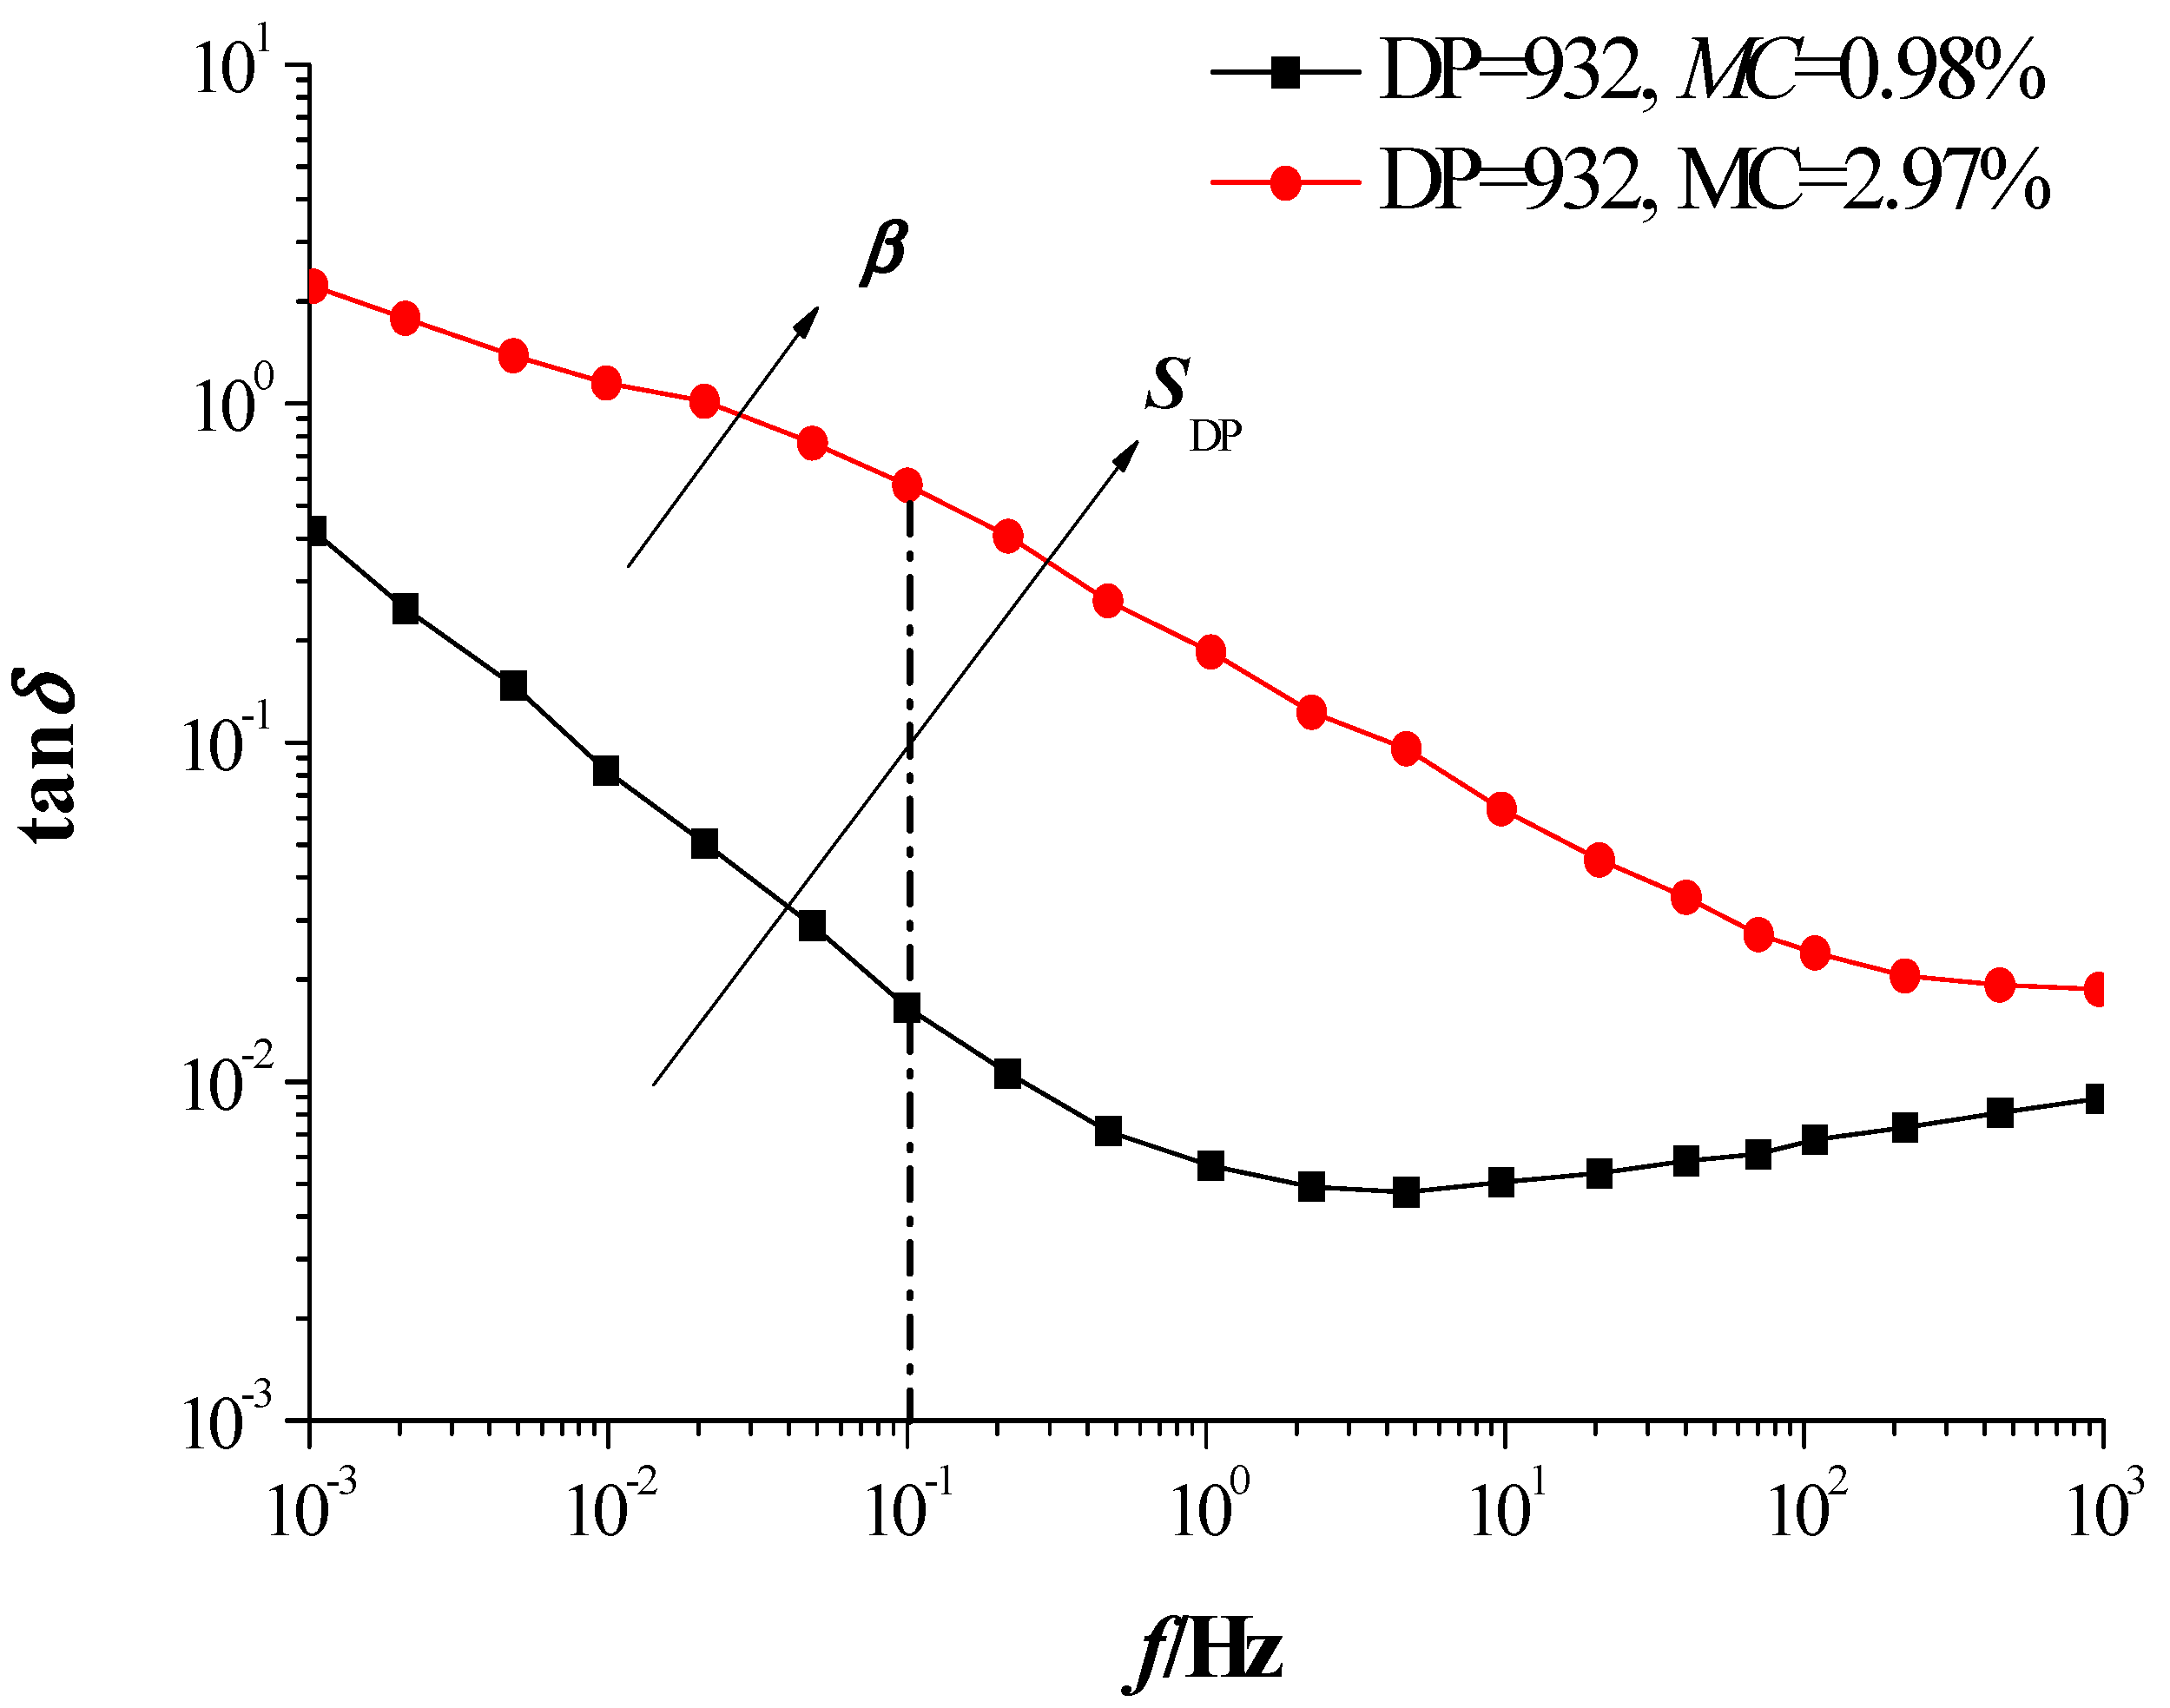
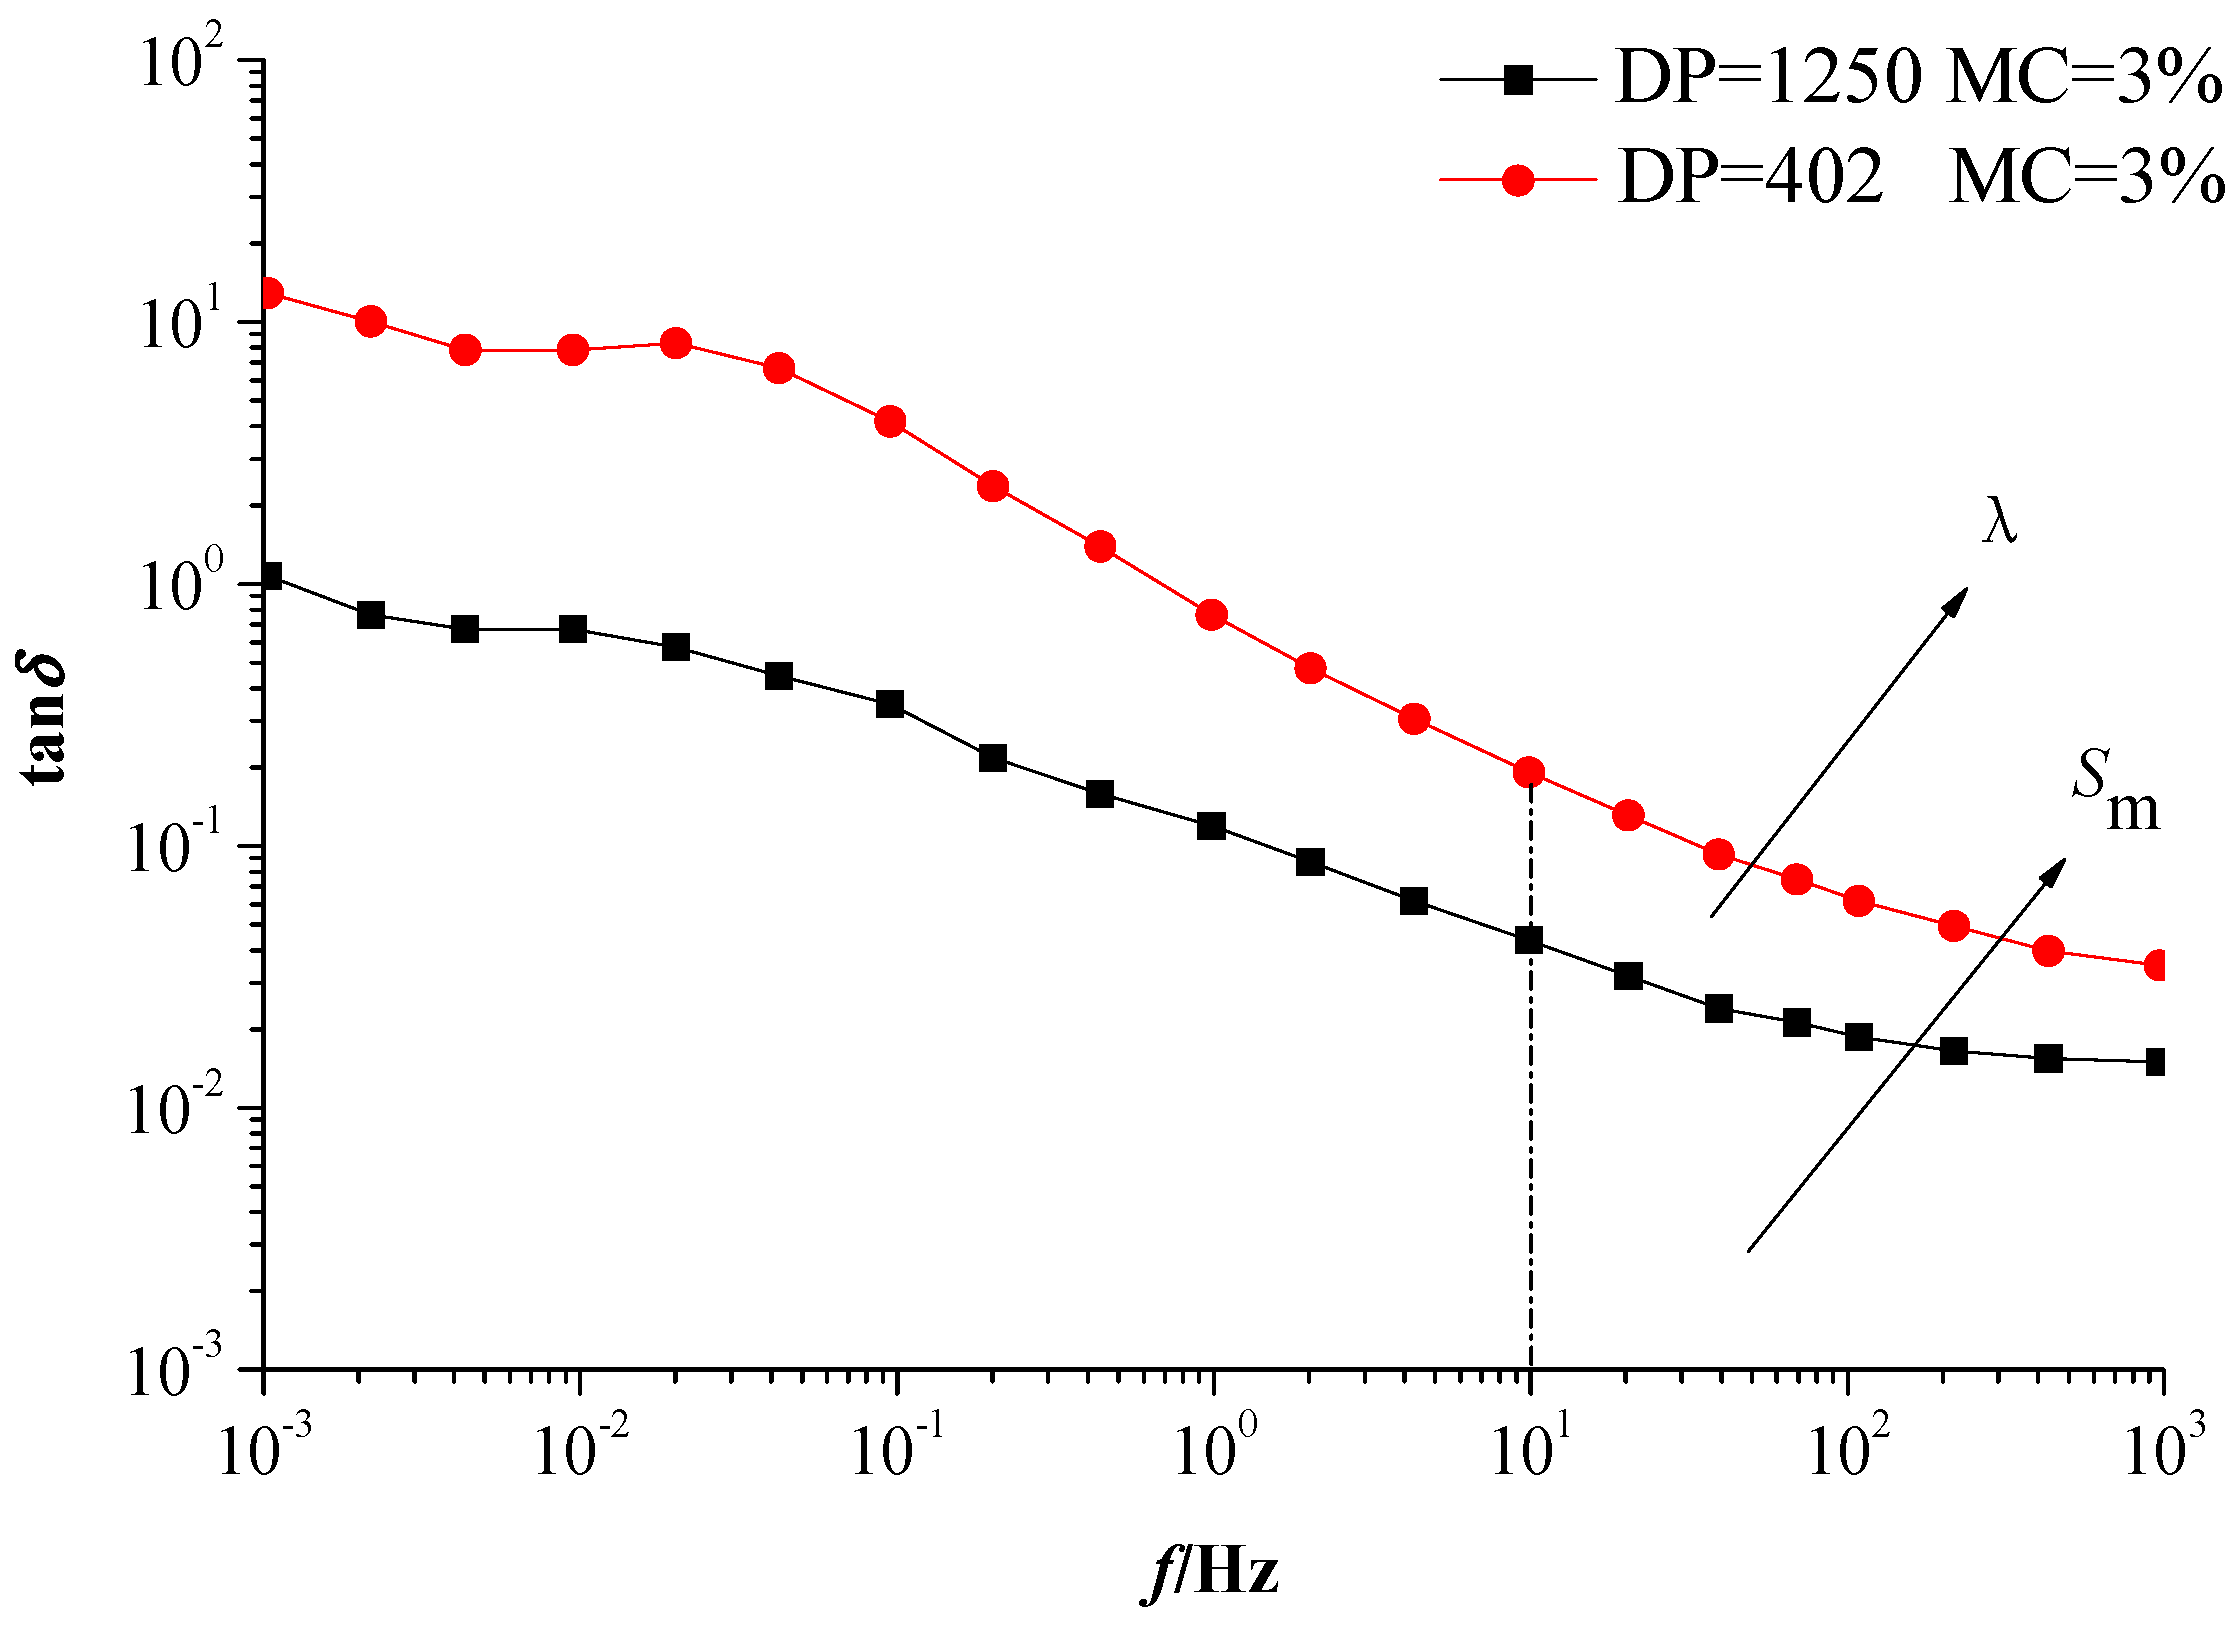
From the tests, when the moisture content is less than 2%, the range of 101~103 Hz is mainly affected by moisture content and aging degree has little effect. While when moisture content exceeds 2%, the effect of aging degree on this band became increasingly prominent. In conclusion, consistent with previously published literatures, aging degree mainly affects low-frequency range (10−1~10−3 Hz) of tanδ curve and moisture mainly affects high-frequency range (101~103 Hz) of the tanδ curve, and meanwhile the effects of aging and moisture on high-frequency or low-frequency bands cannot be ignored. The effects of aging and moisture on the FDS curve interact with each other. When moisture content is higher or aging is more serious, the degree of mutual interference is even greater. Moreover, the integral values Sm (101~103 Hz) and SDP (10−3~10−1 Hz) were proposed as characteristic parameters of moisture content and aging degree respectively, which have excellent fitting relationship with moisture and aging degree of oil-paper insulation. The compensation factor φ was proposed for compensating the effect of aging on Sm and the compensation factor γ was proposed for compensating the effect of moisture on SDP. The compensation factors can eliminate one element of aging and moisture when evaluating the other. Finally, a new method was proposed to evaluate the oil-paper insulation condition based on the aging and moisture content compensation factors, which can eliminate the influence between aging and moisture, and its validity were preliminarily verified by field transformers.


