Energy Performance Assessment of a 2nd-Generation Vacuum Double Glazing Depending on Vacuum Layer Position and Building Type in South Korea


Department of Architectural Engineering, Hanbat National University, Daejeon Metropolitan City 34158, Korea
*
Author to whom correspondence should be addressed.
Energies 2017, 10(8), 1240; https://doi.org/10.3390/en10081240
Submission received: 26 June 2017
/
Revised: 31 July 2017
/
Accepted: 18 August 2017
/
Published: 21 August 2017
(This article belongs to the Special Issue Zero-Carbon Buildings)
Abstract
:(1) Background: The application of high insulation to a building envelope helps reduce the heating load, but increases the cooling load. Evaluating the installation of high insulation glazing to buildings in climate zones with four distinct seasons, as in the case of South Korea, is very important; (2) Methods: This study compared the heating energy performance of four types of glazing, inside vacuum double glazing, outside vacuum double glazing, single vacuum glazing, and low-e double glazing, with fixed low-e coating positions on the inside of the room in a mock-up chamber under the same conditions. The annual energy consumption according to the building type was analyzed using a simulation; (3) Results: As the insulation performance of building envelopes has increased, the energy saving rate of inside vacuum double glazing has been increased further in office buildings. In residential buildings, the energy saving rate of inside vacuum double glazing with a low SHGC (solar heat gain coefficient) has become higher than that of outside vacuum double glazing; (4) Conclusions: Since the effects of SHGC on the energy saving rates are greater in high insulation buildings, SHGC should be considered carefully when selecting glazing in climate zones with distinct winter and summer seasons.
1. Introduction
According to a recent comprehensive study [1] on window systems, 60% of the total energy consumption in a building can be attributed to windows with low thermal performance. The windows currently installed in buildings are low-e windows filled with air or argon that have excellent insulation performance compared to single pane windows. However, the window’s U-value of 1.80 W/m2·K [2], whose performance was obtained by the filling with argon gas, is still not sufficient to meet the requirements for a zero-energy building [3]. Therefore, it is essential to install high-insulating glazing to meet the thermal insulation standards that are being strengthened continuously. High-insulating vacuum glazing was first developed in 1913 [4,5], and second-generation vacuum glass, which enables a similar thermal insulation performance to a wall with a U-value of 0.3–0.4 W/m2·K, has recently been developed using a second-generation manufacturing process in a vacuum chamber [6]. Vacuum glazing is divided into first generation and second-generation vacuum glazing according to its manufacturing method. While the first-generation vacuum glazing is made by a method of vacuuming the inside of the glazing through a seal cap, the second-generation vacuum glazing is manufactured in a vacuum chamber. Hence, there is no seal cap, and a vacuum of up to 10−6 torr can be achieved. Therefore, the second-generation vacuum glazing shows high insulation performance [7] in this study, three 2nd-generation vacuum double glazing units with different compositions and the commonly used low-e double glazing were fabricated and compared.
Existing research on vacuum glazing has focused mainly on the position of the vacuum layer [8], radius and thermal conductivity of the filler [9], type of low-e coating and emissivity in the vacuum layer [10], and the development of sealing materials made of composite materials [11]. As described above, research on vacuum glass has been carried out continuously with a focus on improving the U-value since 2000 [3].
Recently, research on the building energy performance has been carried out with the increasing demand for vacuum glass in the market. Jang et al. [12] reported that the application of vacuum glass resulted in an energy saving rate of 8.82% compared to the quadruple-paned glazing used in the expanded zone of a balcony. Song et al. [13] reported that vacuum glass showed energy saving effects by reducing the cooling and heating energy consumption by 40% compared to ordinary double glazing, and by 22% compared to low-e double glazing.
Most studies, however, were performed using first generation vacuum glazing, and the location of the low-e layer applied to vacuum glazing was not specified clearly. According to Fang et al. [14], the U-value of vacuum glazing ranged from 8.2% to 17% depending on the position of the low-e layer. In particular, the differences in the U-value were greater when the emissivity was low. Since the high insulation performance of a building envelope generally causes an increase in cooling load, the annual energy performance changes caused by a higher cooling load should be considered when applying vacuum glass to climatic regions with distinct summer and winter seasons.
Therefore, in this study, when the position of the low-e layer was fixed, the energy performance of the building was verified depending on the position of the vacuum layer. In addition, the influence of the cooling load increase to the total energy consumption was analyzed depending on the type of building. Furthermore, this study investigated the position of vacuum glazing layer suitable for the strengthening of the insulation standard.
For this purpose, a second-generation vacuum glazing to direct the position of the low-e layer to the inside was fabricated and installed in a mock-up chamber designed to have the same thermal conditions. A comparison experiment was then performed on the heating energy consumption. Based on the experimental results, the thermal performance in a building application was analyzed through a simulation. The characteristics of the cooling and heating and the optimal position of the vacuum layer were finally derived for each type of building.
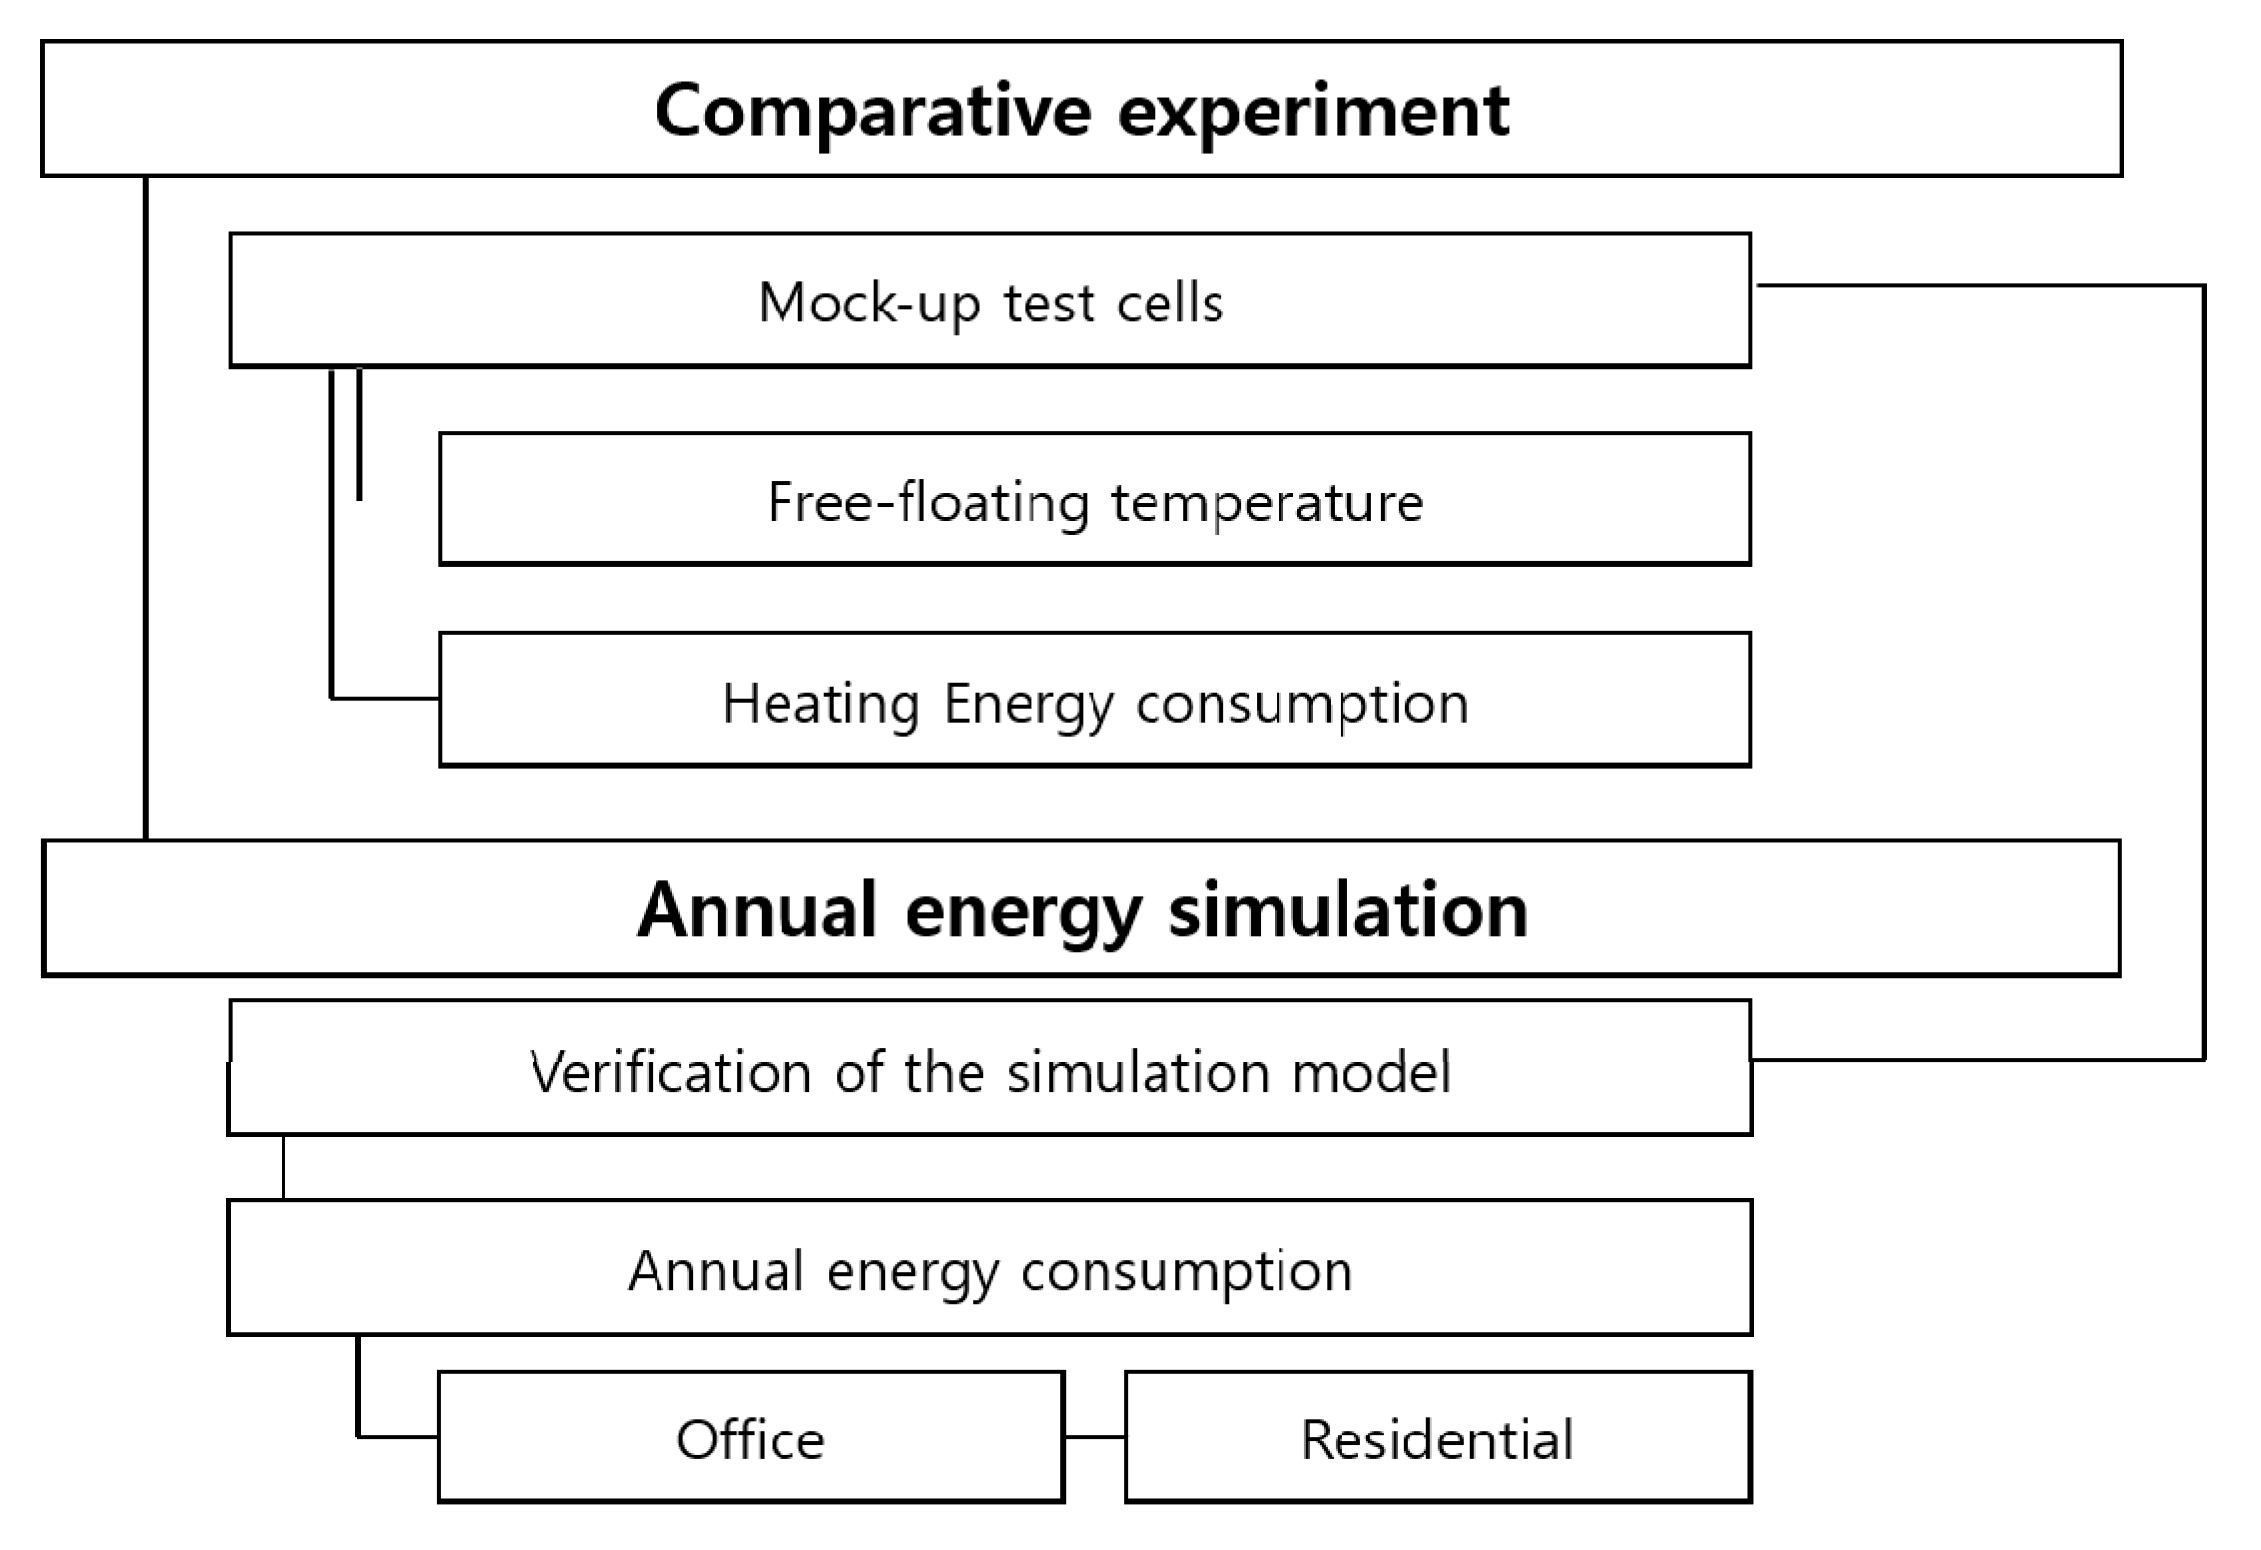
Figure 1 is a simplified representation of the technical framework of this study.
2. Comparative Experiment in the Mock-Up Chamber
2.1. Experimental Overview
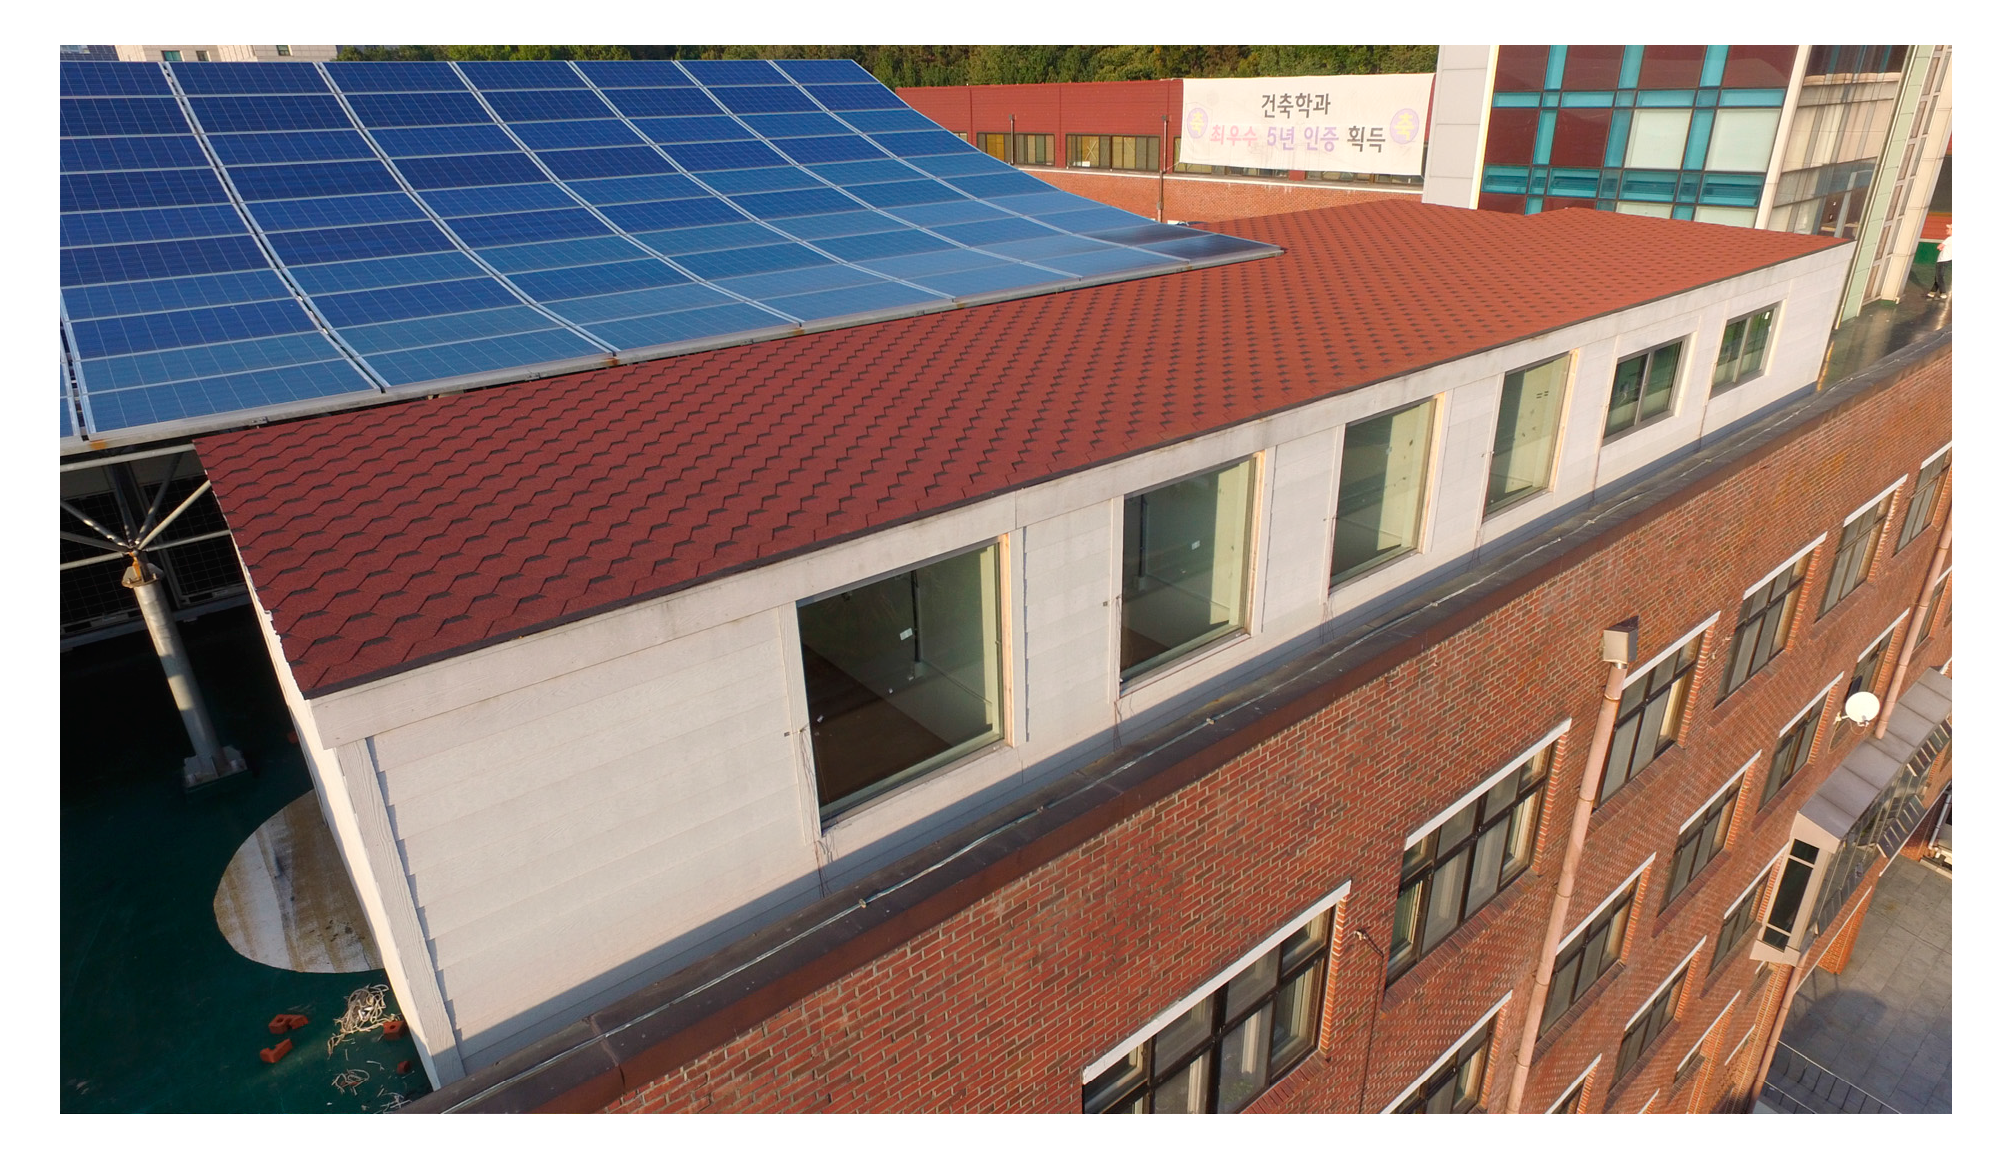
Figure 2 and Figure 3 present the front view and floorplan of the mock-up chamber, respectively. The chambers used were rm_A and rm_C, and the size of each chamber was 2.4 m (W) × 3.6 m (D) × 2.6 m (H). The structure was made of 220 mm SIP (structural insulation panel) with 200 mm EPS (Expanded Poly Styrene) and the thickness of the wall between the chambers was 440 mm, minimizing thermal transfer between the chambers.
A previous study [15] reported that each chamber of the mock-up in the free-floating air condition was under the same conditions, showing that the mean temperature difference was 0.3 °C during the day and 0.2 °C during the night. Table 1 lists the thermal properties of the mock-up obtained by the experiment. Each room is equipped with an FCU (Fan Coil Unit) connected to a constant temperature water bath. In addition, a radiator and a power analyzer were installed to calculate the heating energy input more precisely, and a controller capable of controlling the radiator to ±0.3 °C was manufactured. To measure the state of the mock-up chamber, the temperature of the central surface of the glazing, indoor temperature, and outdoor temperature were measured using a thermocouple, and the solar radiation was measured using a pyranometer. Table 2 lists the specifications of the measuring device.
Table 3 lists the thermal and optical performance of each glazing derived using LBNL (Lawrence Berkeley National Laboratory)’s Window 7.4 software (Regents of the University of California, Berkeley, CA, USA).
2.2. Comparative Experiment Results
In the experiment, the SVG (single vacuum glazing) and LEG (low-e double glazing) were compared simultaneously to evaluate the insulation performance of vacuum glazing. Figure 4 shows the indoor temperatures and indoor surface temperatures of SVG and LEG in the free-floating state. The room temperature difference between the two rooms was a maximum of 2.8 °C at 6 a.m. The temperature difference during night without the impact of solar irradiance was due to the difference in U-value between the two types of glazing compared, and the insulation performance of SVG was found to be better than that of LEG, even when comparing the U-values calculated using Window 7.4 software.
At this time, the maximum difference in the indoor surface temperature was 6.4 °C. The indoor surface temperature is closely related to the MRT (mean radiant temperature) and condensation, and the MRT is one of four indicators for evaluating the indoor comfort. Therefore, the analysis results suggest that the SVG, which maintains a relatively high surface temperature, shows better indoor comfort performance and dew condensation prevention performance than LEG.
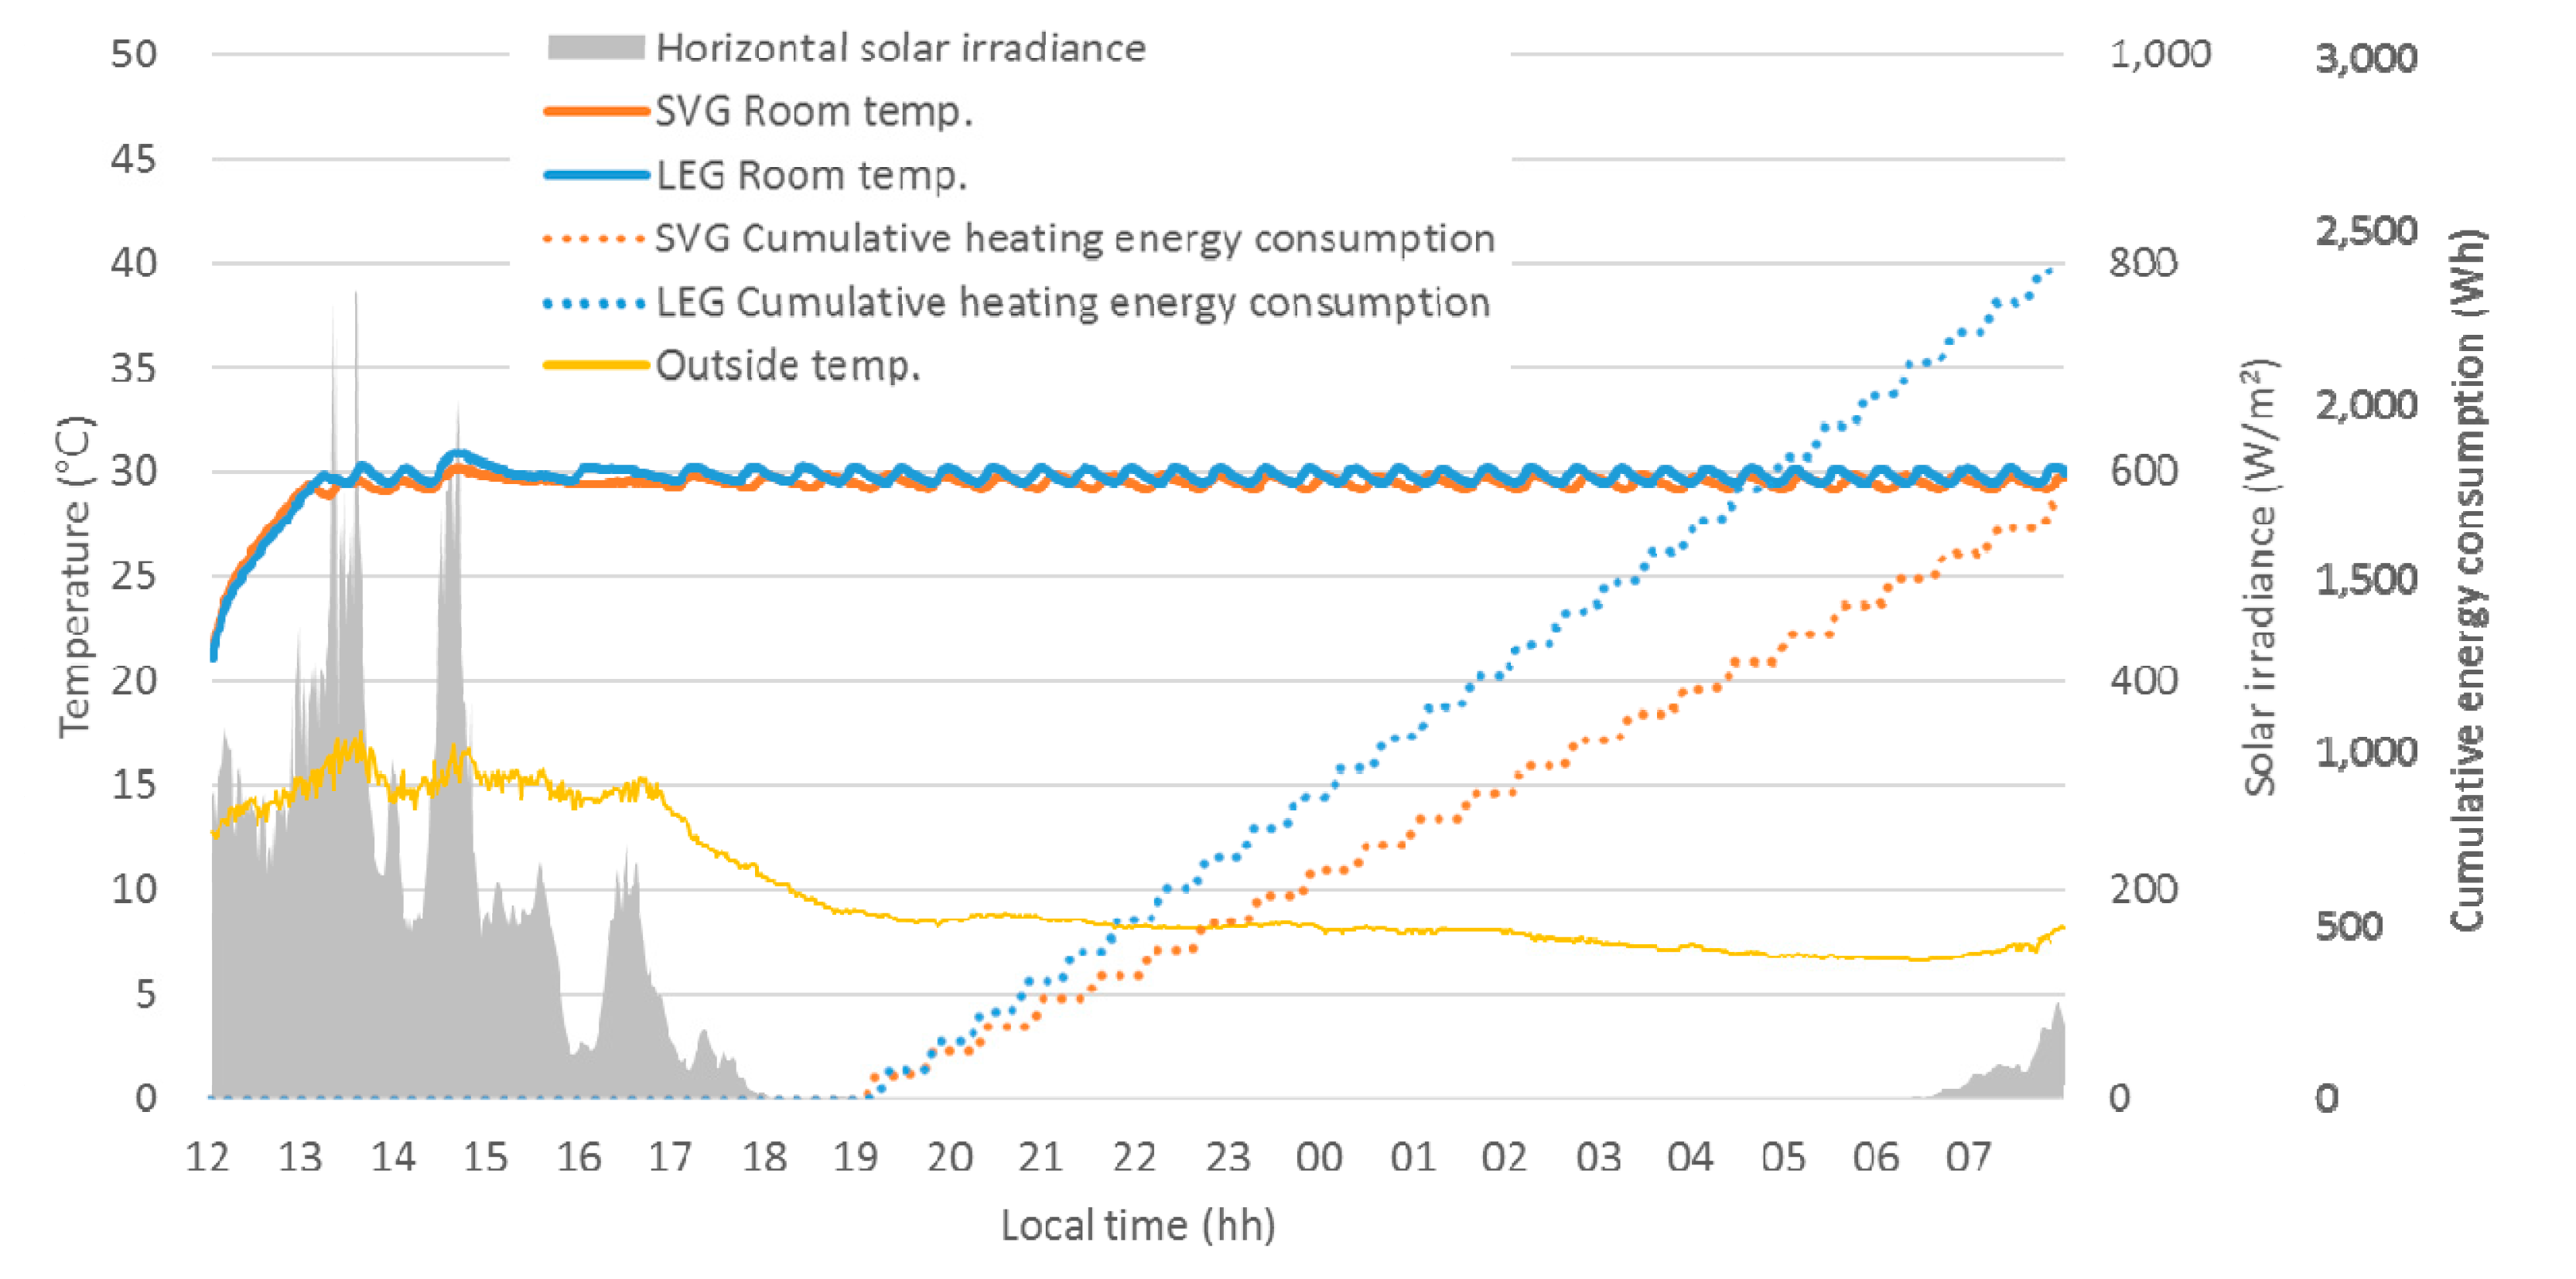
Figure 5 shows the room temperature and cumulative heating energy consumption at 30 °C under air-conditioned conditions. During the experiment, the accumulated energy consumption of SVG and LEG was 1712 and 2386 Wh, respectively. This is due to the low U-value of the vacuum glazing, and the heat loss of SVG was approximately 28% lower than that of LEG during nighttime in winter.
A free-floating experiment of IVG (inside vacuum double glazing) and OVG (outside vacuum double glazing) was performed before comparing the heating energy performance according to the position of the vacuum glazing. At this time, the position of the low-e coating layer was designed to always be located on the inside of the room.
Figure 6 presents the room temperature and indoor surface temperature under free floating conditions. The room temperatures of the two chambers were similar during the night but the temperature of the OVG chamber was approximately 1.1 °C higher during the day.
This was attributed to the optical properties of IVG and OVG. The U-values of IVG and OVG were 0.506 and 0.508 W/m2·K, respectively. Therefore, the difference in the U-value is not significant. On the other hand, the SHGC (solar heat gain coefficient) values of IVG and OVG are 0.516 and 0.557, respectively, which the OVG showed approximately 8% higher SHGC than the IVG. The indoor temperature and surface temperature of OVG are believed to be relatively higher due to solar irradiance during the day, while the temperatures are similar during the night.
The heating energy consumption of IVG and OVG was compared continuously during the day and night to take into account both the U-value and the influence of SHGC. Figure 7 shows the room temperature and accumulated heating energy consumption under air-conditioned conditions.
While the room temperature was maintained at 30 °C, the accumulated energy consumption of IVG and OVG was 1476 and 1367 Wh, respectively. The IVG and OVG have the same structure except for the position of the vacuum layer. According to analysis results, however, OVG was found to reduce the cumulative heating energy consumption by 7.4% compared to IVG. This result can be explained as follows: since OVG has a somewhat higher SHGC than IVG, it is advantageous for the storage and acquisition of solar energy.
3. Annual Energy Simulation Analysis
3.1. Simulation Overview
The results in Section 3 show only the results for mock-up chambers for simultaneous comparisons, and the experimental period was rather short. This makes it difficult to characterize the entire winter season. Therefore, a simulation was conducted to evaluate the annual cooling and heating energy and determine the characteristics of each building type.
To do this, the mock-up chamber was first simulated and the experimental results were verified. An office building, which is used mainly during the day, and a residential building, which is used mainly during the night, were then simulated.
The simulation model for the experimental verification was based on the EnergyPlus model of a previous study [15], which precisely simulated the field mock-up. The compared glazing types were analyzed by inputting the spectral data calculated using Window 7.4 software. Figure 8 shows the mock-up chamber implemented in the simulation program.
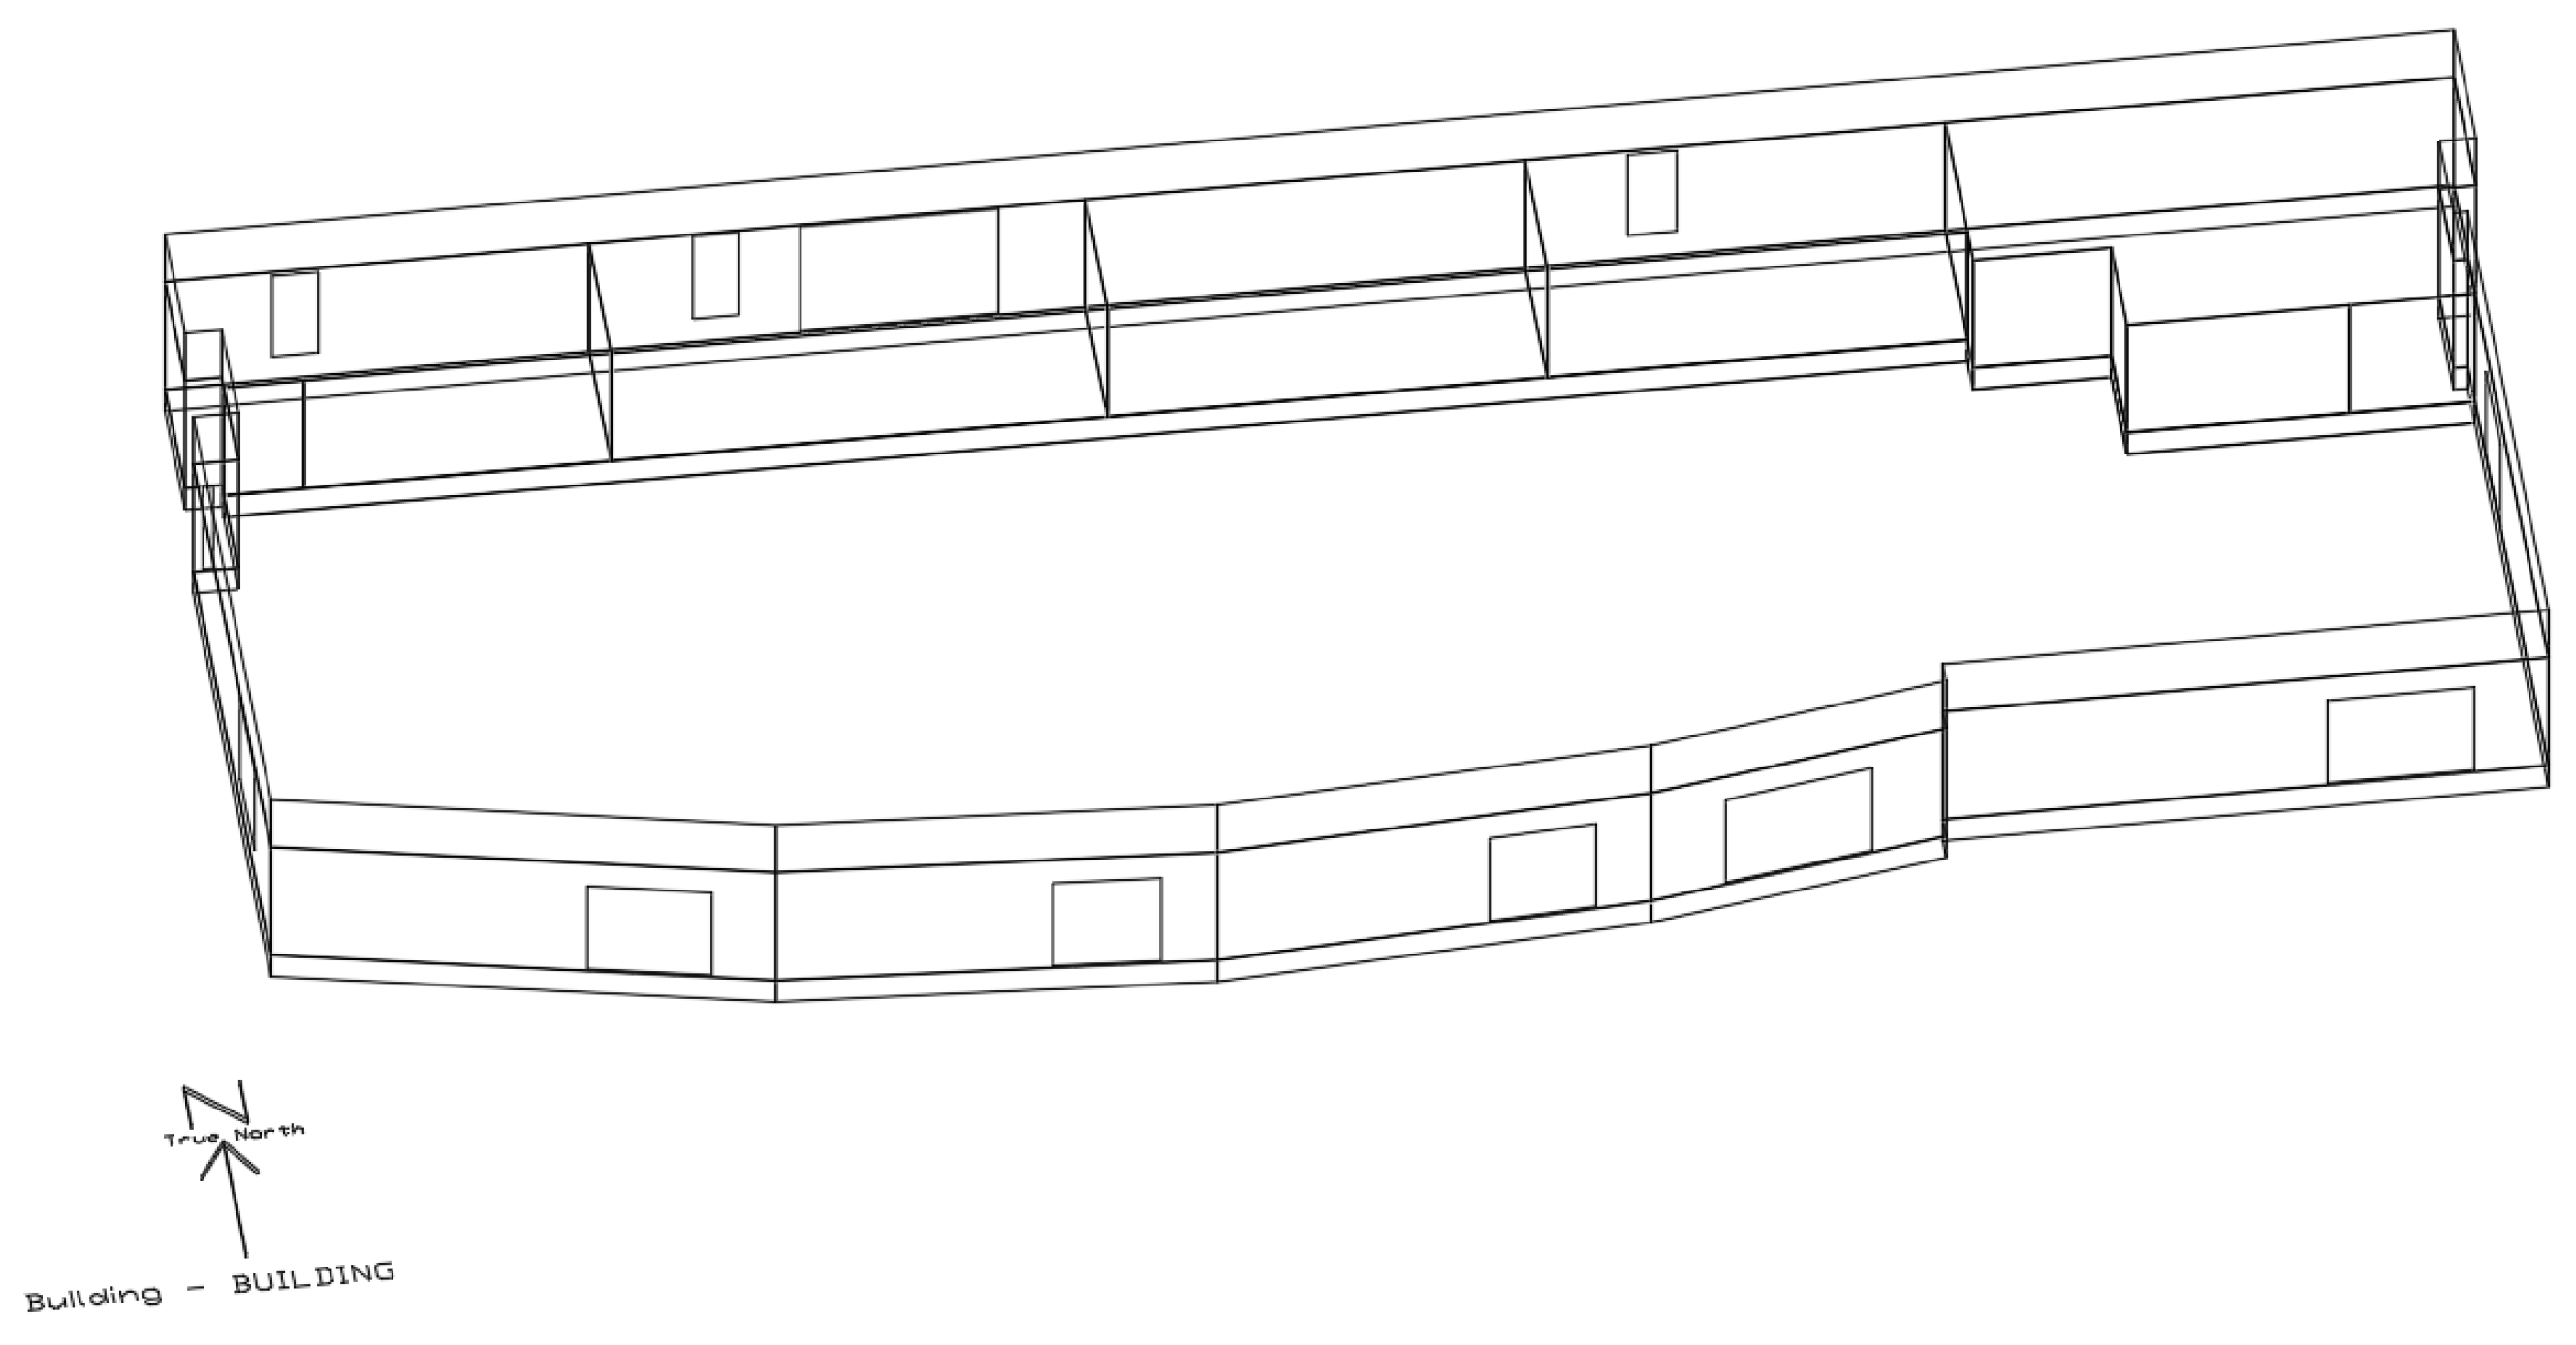
Figure 9 and Figure 10 show the office and residential building models. The total energy consumption of the office buildings from September 2011 to August 2012 was 5566 MWh and, thus, 261.8 kWh/m2·year. This is 1.3% lower than 265.1 kWh/m2·year, which is the basic unit of office buildings in the Energy Consumption Survey [16] issued by the Korea Energy Economics Institute during the year.
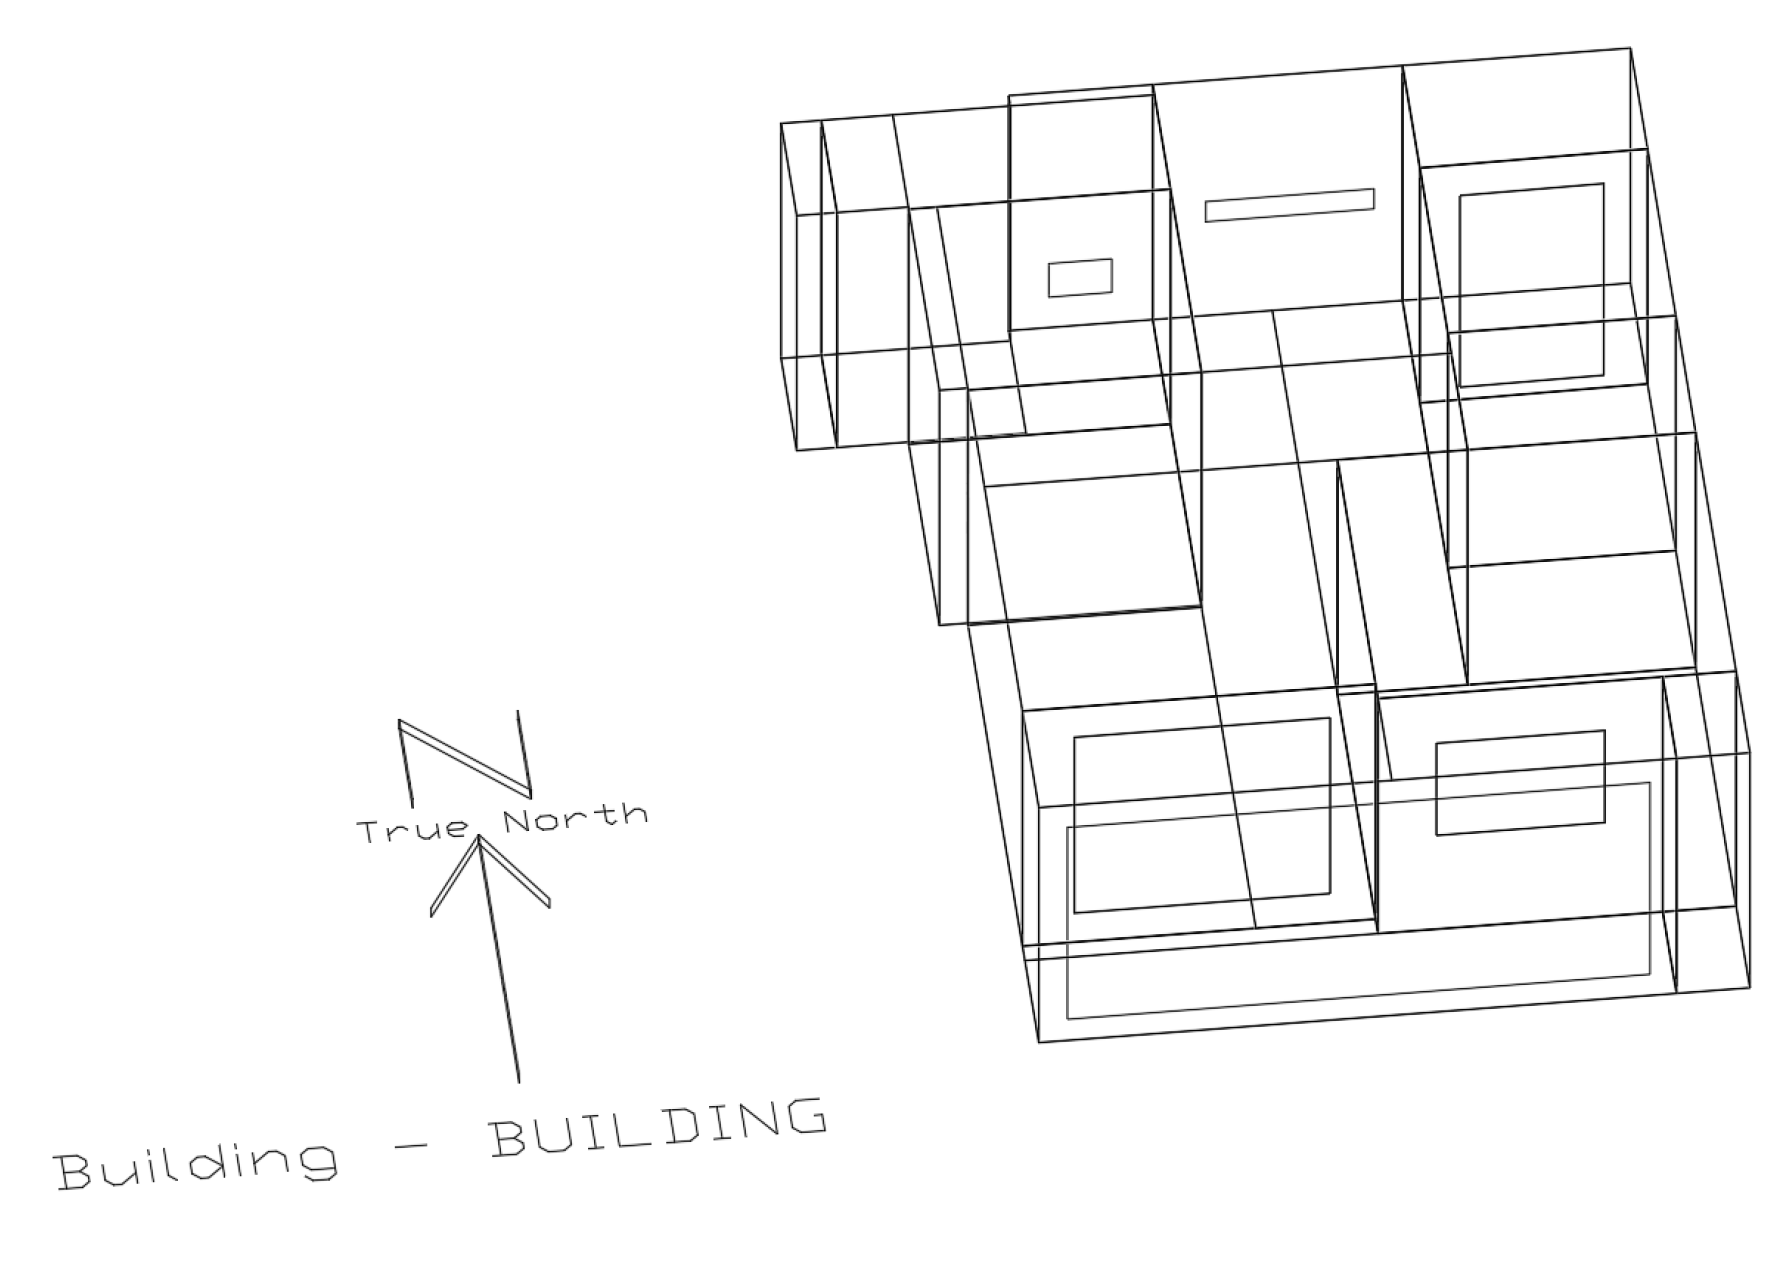
When it comes to residential buildings for a performance assessment, this study selected the apartment house which showed the highest proportion (approximately 48.1%) of the housing type according to a survey conducted by the National Statistical Office from 2006 to 2016 [17].
The heating energy consumptions of the selected apartment for simulation and the Energy consumption survey [16] were 199.3 kWh/m2·year measured in 2008–2009 and 193.1 kWh/m2∙year, respectively, which show a 3% difference between them. Therefore, the simulation model is considered representative of residential apartment buildings in Korea.
This study analyzed only the reference floor of the simulation model. The boundary conditions of the ceiling and floor were set as adiabatic, assuming that the upper and lower floors were operated at the same temperature and according to the same schedule.
Table 4 lists the input variables for office and residential buildings. Each input variable was entered based on the drawing.
The standard weather data used in the simulation is an IWEC (International Weather for Energy Calculations) in Inchon, South Korea. Korea is located at latitude between 33 and 43 °N, with a mild climate and monthly characteristics of the weather are shown in Table 5.
3.2. Simulation Result
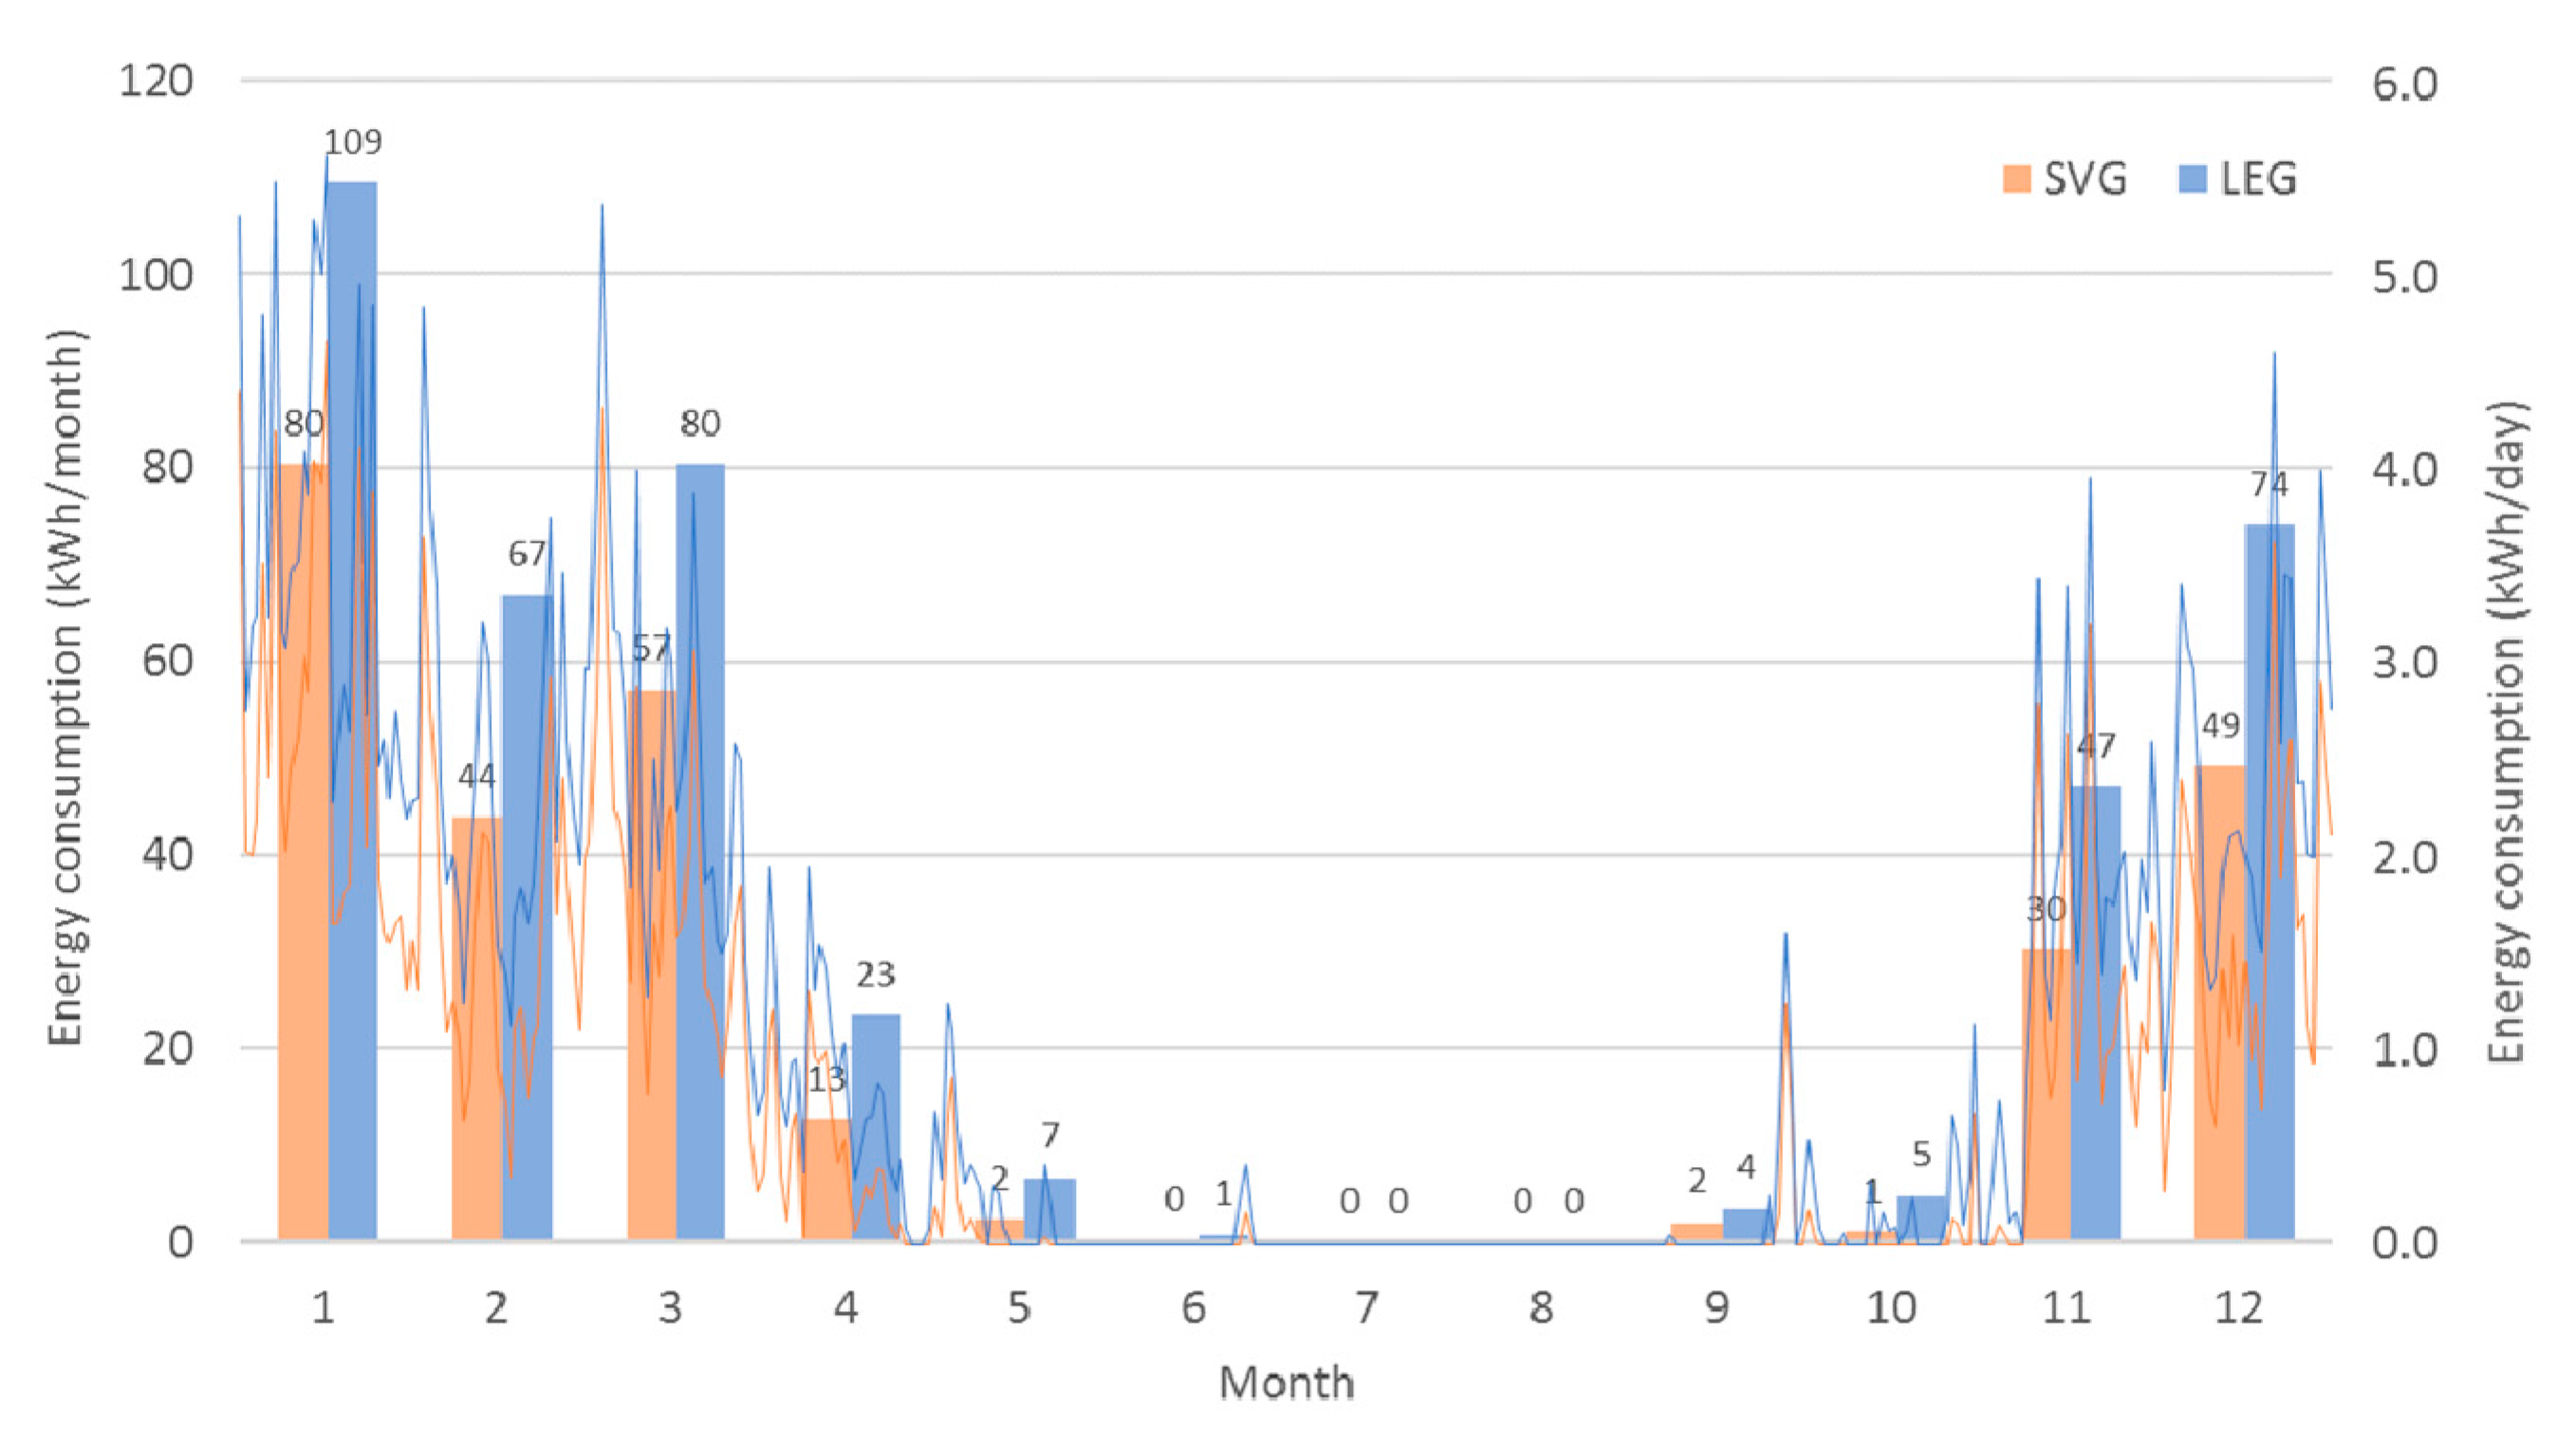
Figure 11 presents the monthly heating energy consumption of mock-up chambers, where SVG and LEG were applied. In winter, the energy saving rates of SVG compared to LEG were 27%, 34%, and 34% in January, February, and December, respectively. The annual heating energy demands were 279 and 417 kWh for SVG and LEG, respectively; SVG had an annual energy saving rate of 33.1% compared to LEG.
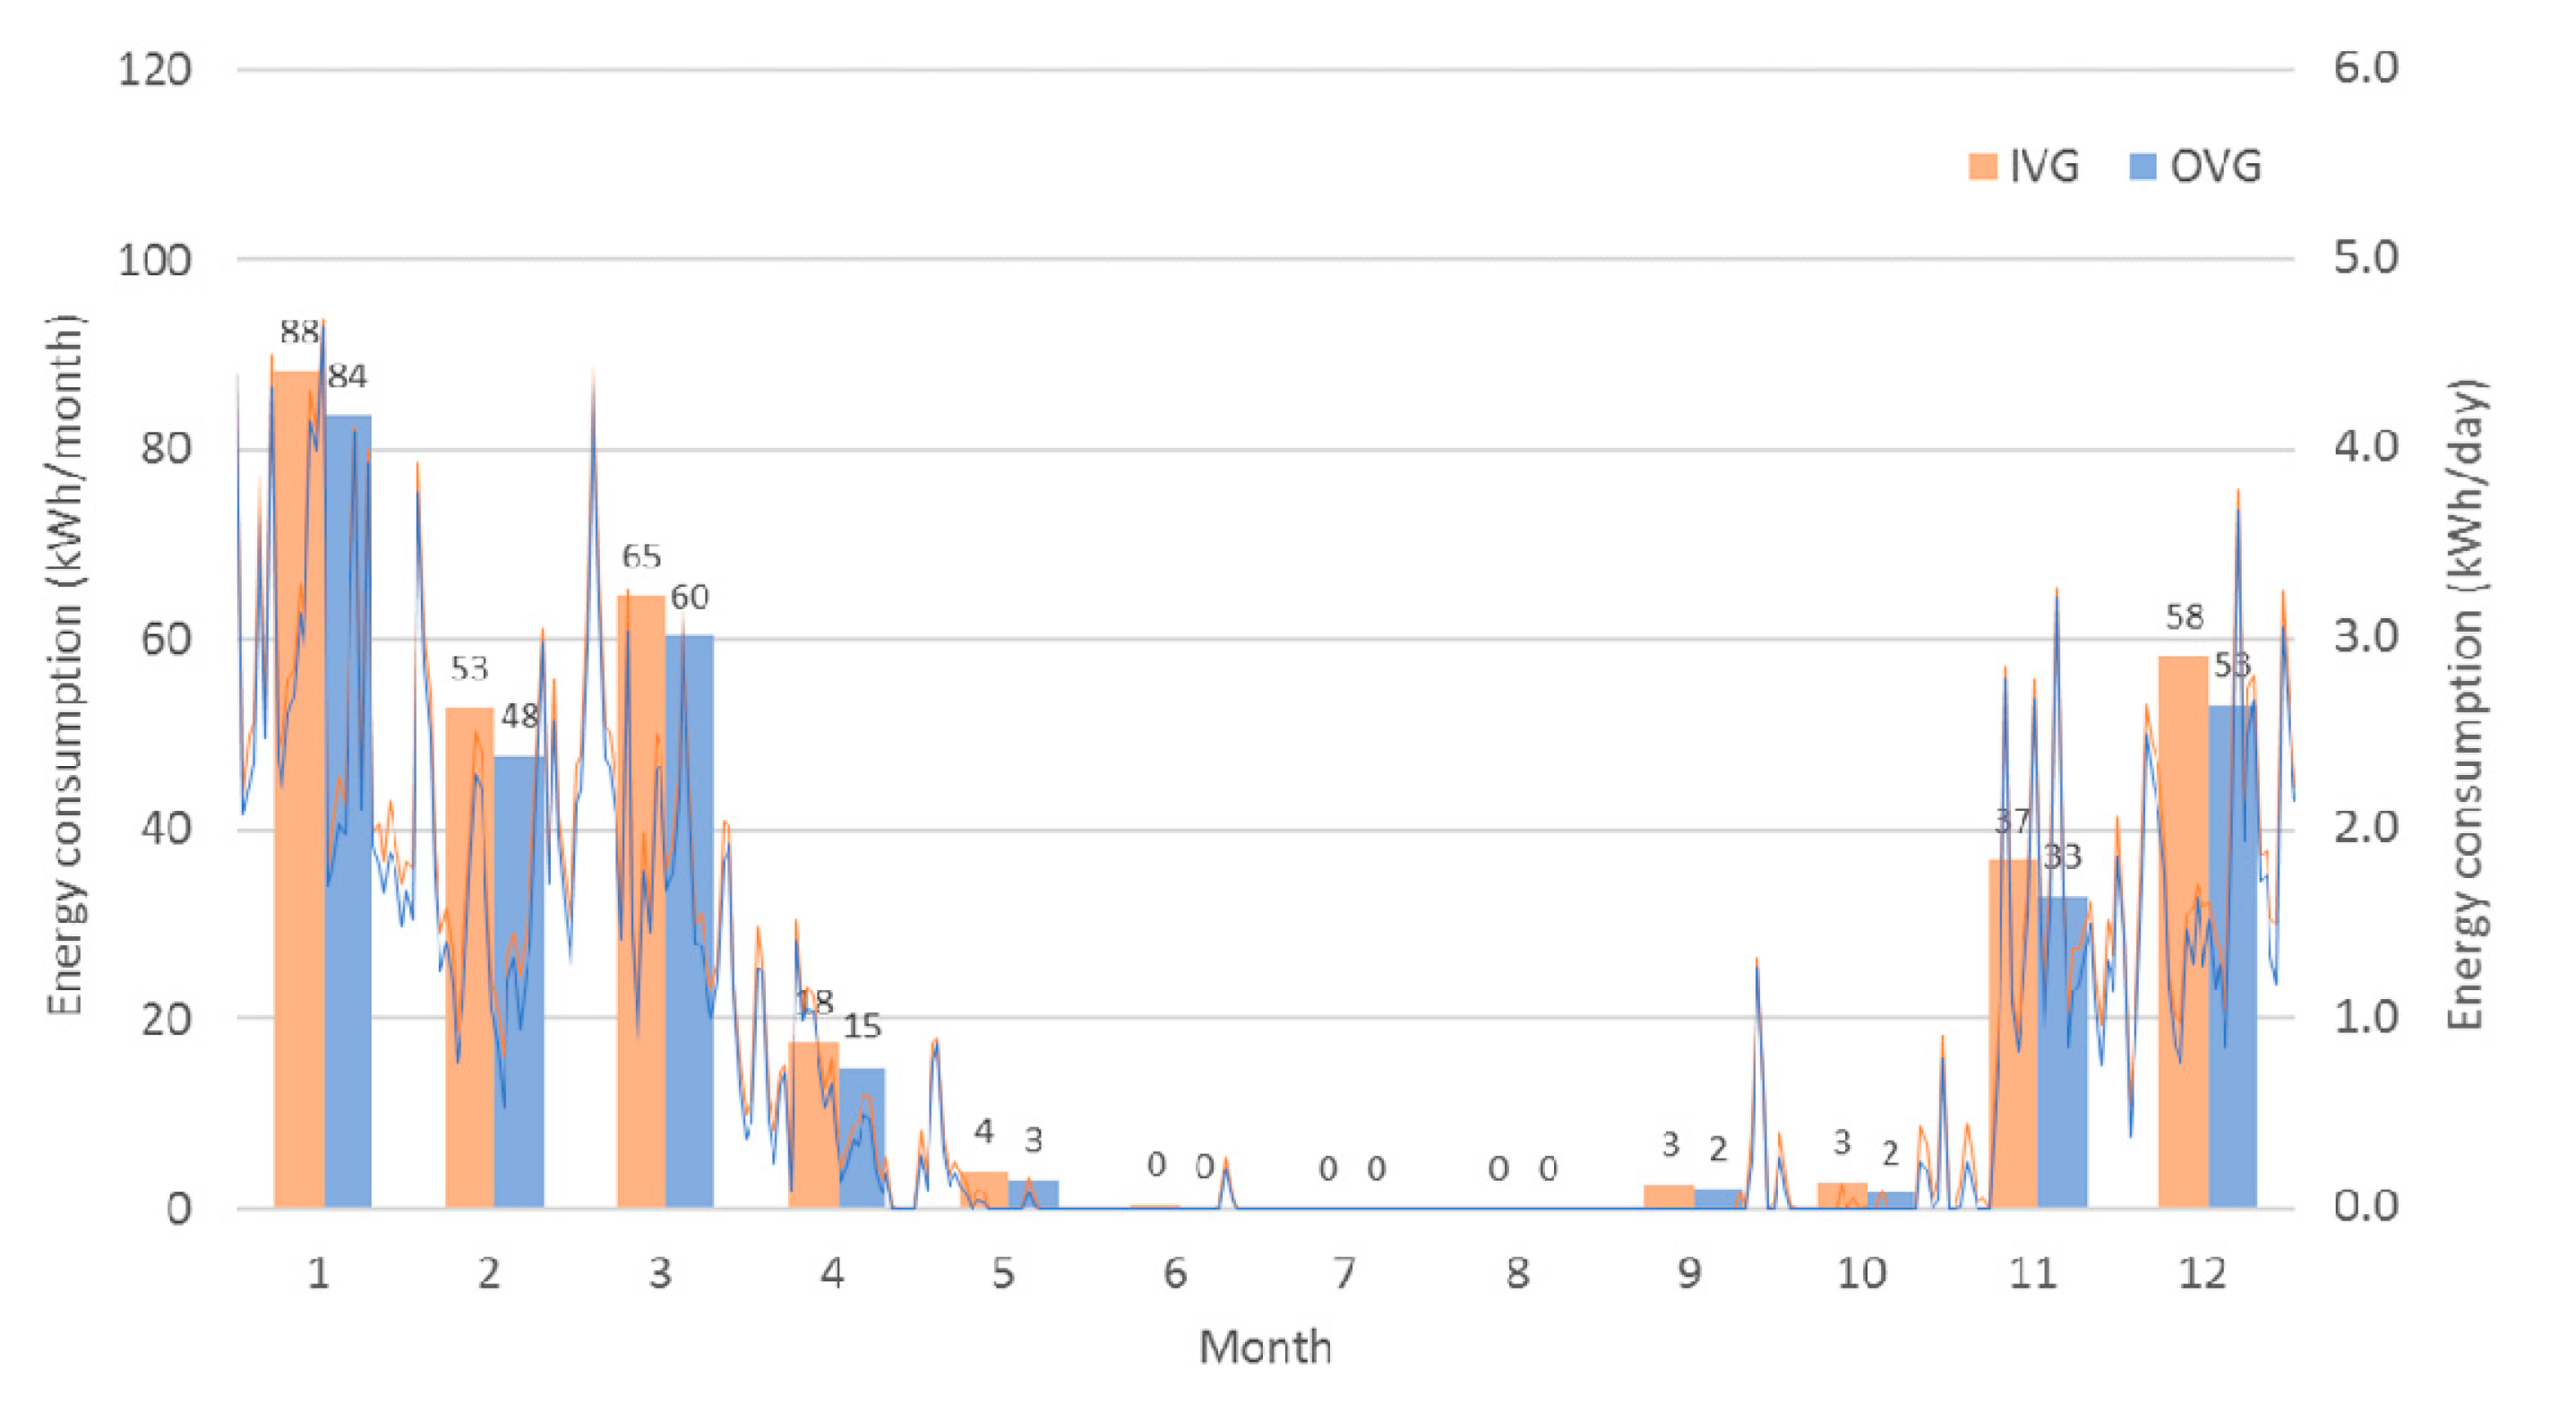
Figure 12 presents the monthly heating energy requirements of the mock-up chamber with OVG and IVG. In January, February, and December corresponding to the winter season, the application of OVG resulted in energy savings of 5%, 10%, and 9%, respectively, compared to IVG. The annual heating energy consumption was 299 and 327 kWh for OVG and LEG, respectively; OVG showed an annual energy saving rate of 8.5% compared to IVG.
Figure 13 compares the heating energy saving rates in January, November, and December with the heating energy savings obtained from the experimental results. The experimental results were all within the standard deviation of the simulation. Therefore, the spectral data of the glazing types entered in the simulation were considered to simulate the actual product and applied to office and residential buildings for comparative analysis.
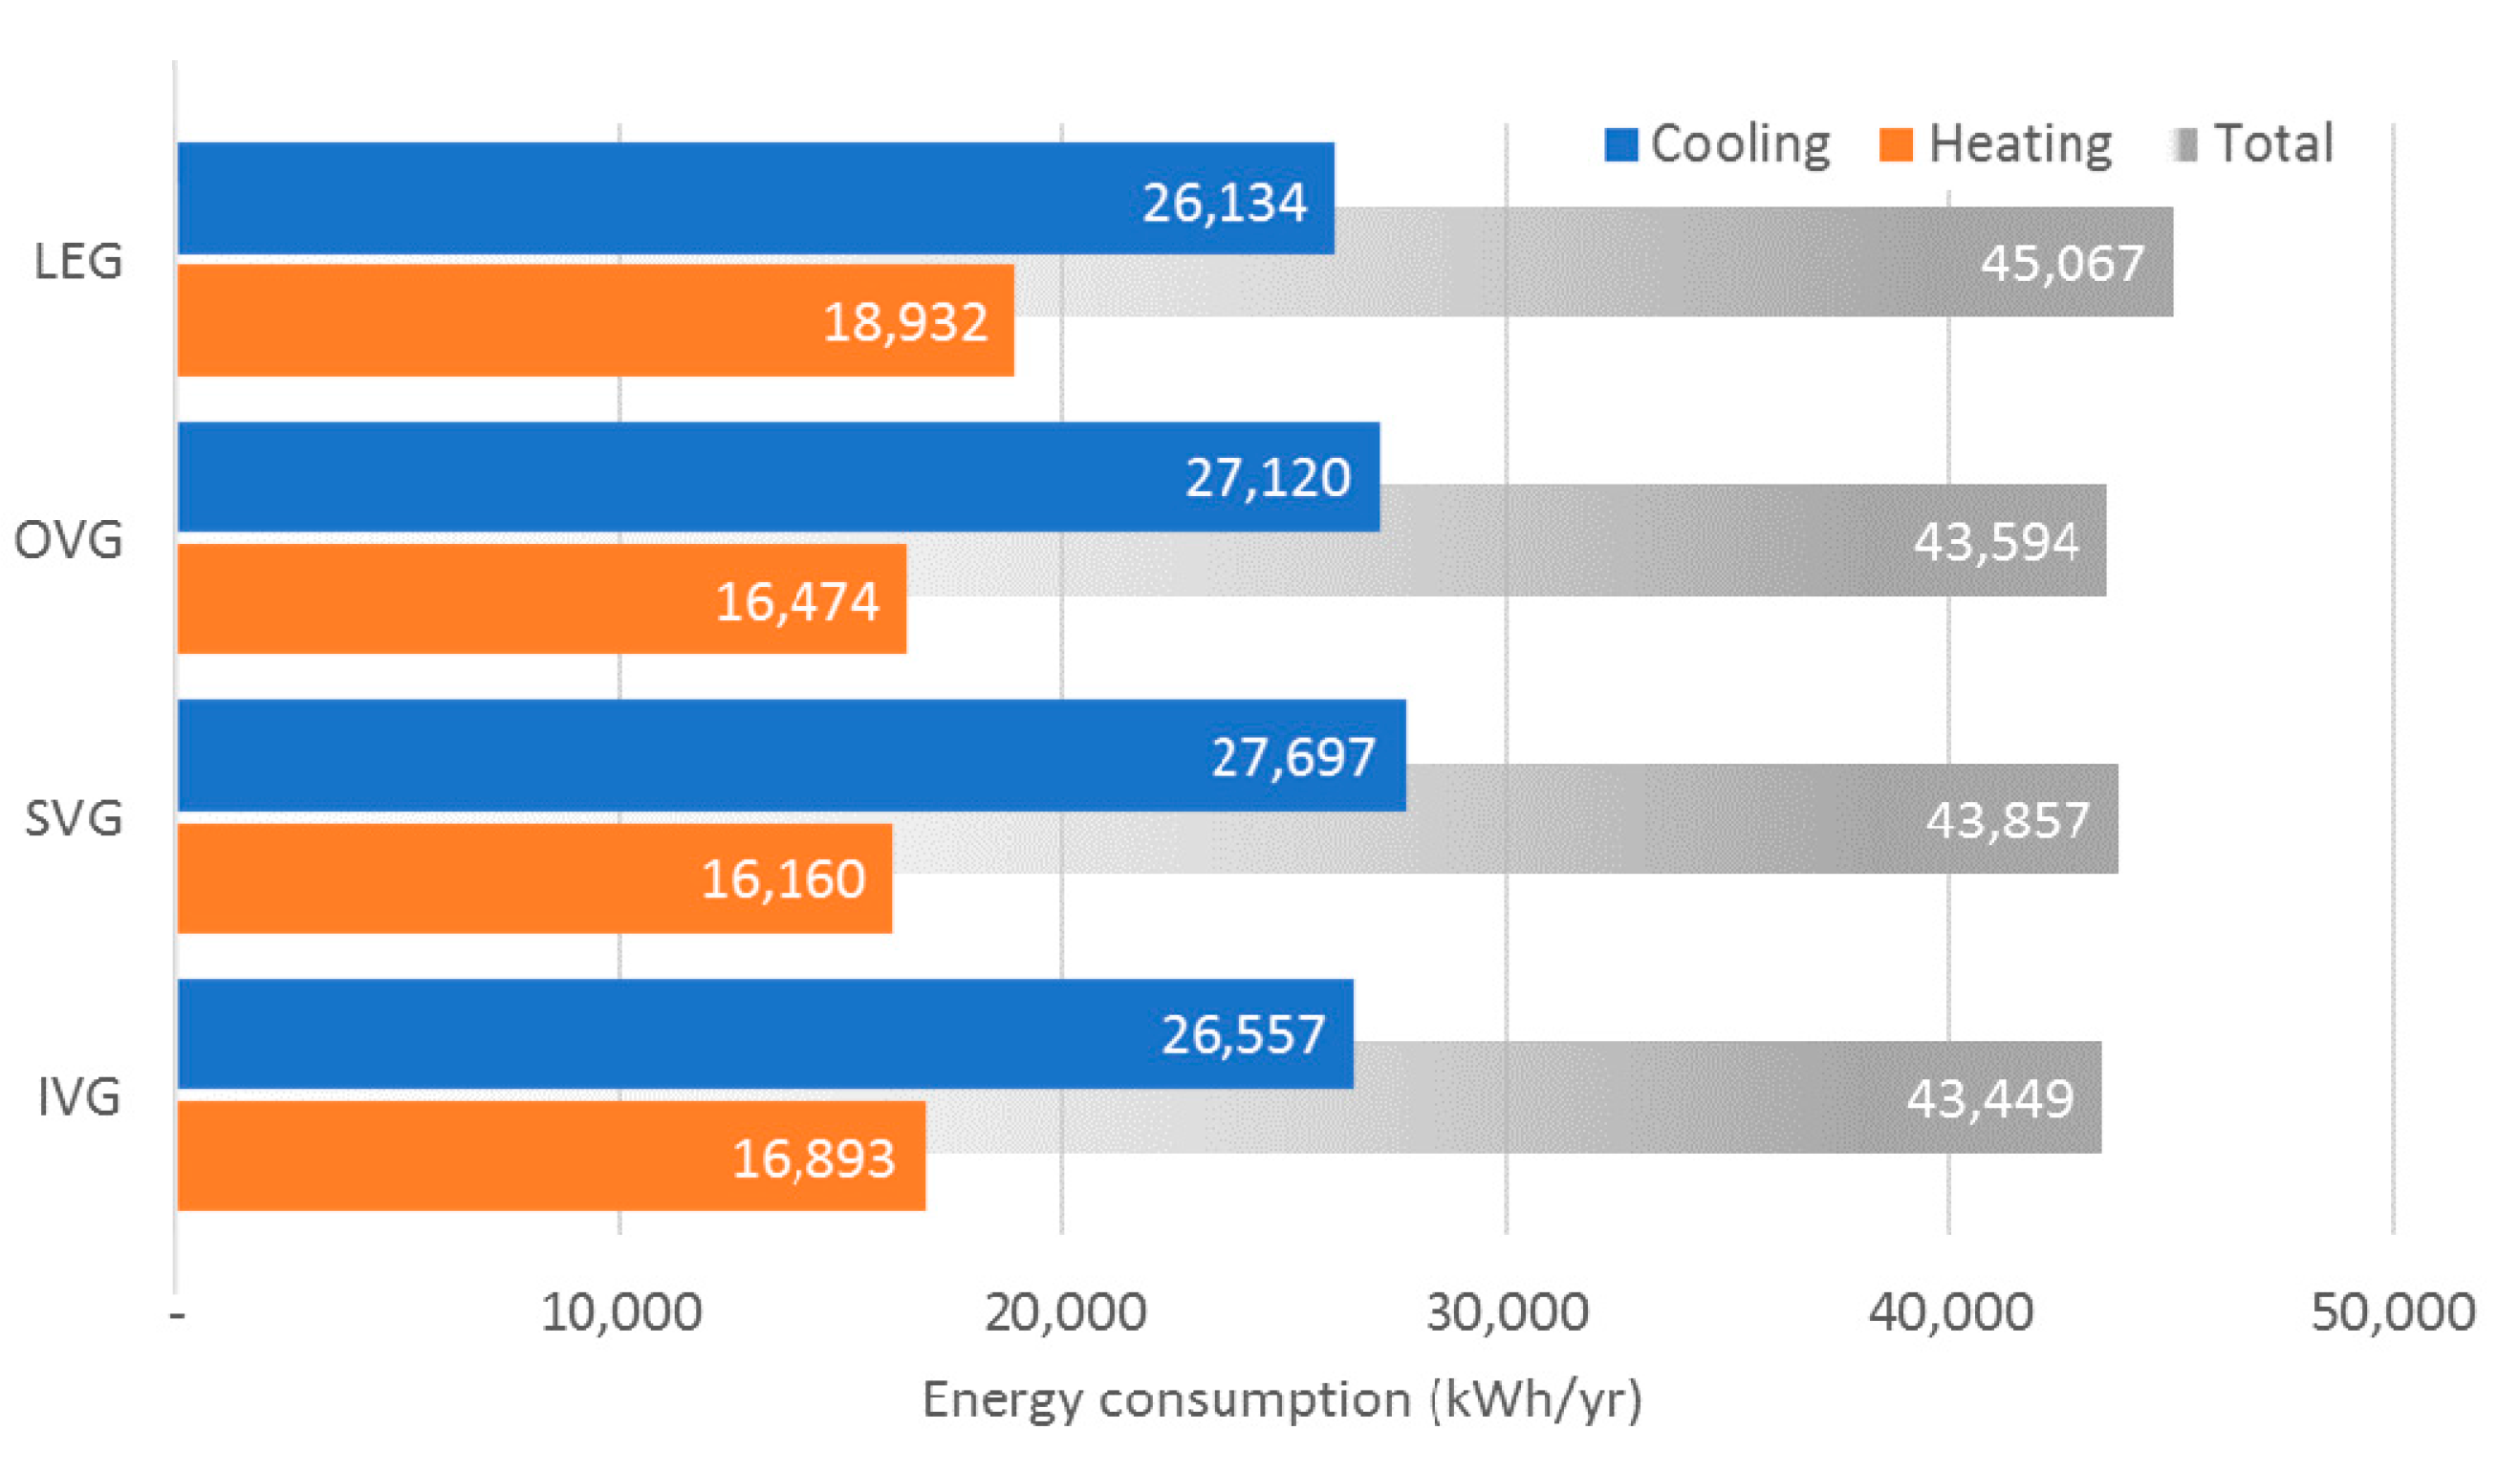
Figure 14 shows the annual cooling and heating energy consumption of the office buildings according to the simulation. Generally, as the insulation performance of glazing increases, the cooling energy consumption also increases.
On the other hand, in the case of IVG and OVG, which is composed of a multi-layer structure with three sheets of glazing, the cooling energy consumption did not increase significantly because the SHGC was reduced by the multi-layer structure.
Compared to the cooling energy consumption in the case of LEG, the cooling energy consumption was increased by 2%, 6%, and 4% for IVG, SVG, and OVG, respectively. On the other hand, heating energy consumption was reduced by 11%, 15%, and 13% for IVG, SVG, and OVG, respectively, compared to the value for LEG. In the total energy consumption for cooling and heating, IVG showed the highest saving rate of 3.6% compared to LEG, followed by OVG with 3.3% and SVG with 2.7%.
An analysis of the position of the vacuum layer showed that it is advantageous for saving energy to place the vacuum layer on the indoor side in an office building. This is because IVG has a similar U-value to OVG, but a relatively lower SHGC.
As a result, in office buildings, where the proportion of cooling and heating requirements are similar, the high thermal insulation function of vacuum glazing does not show a significant energy saving effect because it has different effects on the energy consumption in summer and winter.
Figure 15 shows the annual cooling and heating energy consumption of residential buildings analyzed by simulations. IVG, SVG, and OVG showed 10%, 30%, and 20% higher cooling energy consumption, respectively, than LEG. On the other hand, the heating energy consumption of IVG, SVG, and OVG was reduced by 17%, 24%, and 21%, respectively, compared to LEG.
Although the increase rate of cooling energy consumption is similar to the reduction rate of heating energy consumption, heating energy consumption accounts for approximately 72% of the total energy consumption in residential buildings. Therefore, OVG, SVG, and IVG showed a 12.2%, 12.2%, and 11.4% lower total energy consumption, respectively, than LEG because of the total energy consumption of residential buildings with a high proportion of heating energy.
A comparison of the energy saving performance according to the position of the vacuum layer in the residential building showed that it is advantageous to place the vacuum layer on the outdoor side. This is because in residential buildings with a high heating energy consumption, it is advantageous to install glazing with a high SHGC to collect solar radiation in winter.
In particular, when SVG is applied, the annual cooling/heating energy consumption was calculated to be 3796 kWh, which was the same as in the case of applying OVG. SVG has a higher U-value than IVG or OVG, but a high SHGC, which is advantageous during winter.
As a result, it is important to maintain a high SHGC and a low U-value in residential buildings with a large heating demand ratio.
The commercial and residential buildings used in the simulations maintain a U-value at the time of construction, so they do not clearly indicate the thermal properties of vacuum glazing according to the continuously strengthened insulation standards. Therefore, the energy consumption was estimated according to the change in the U-value of the building envelope.
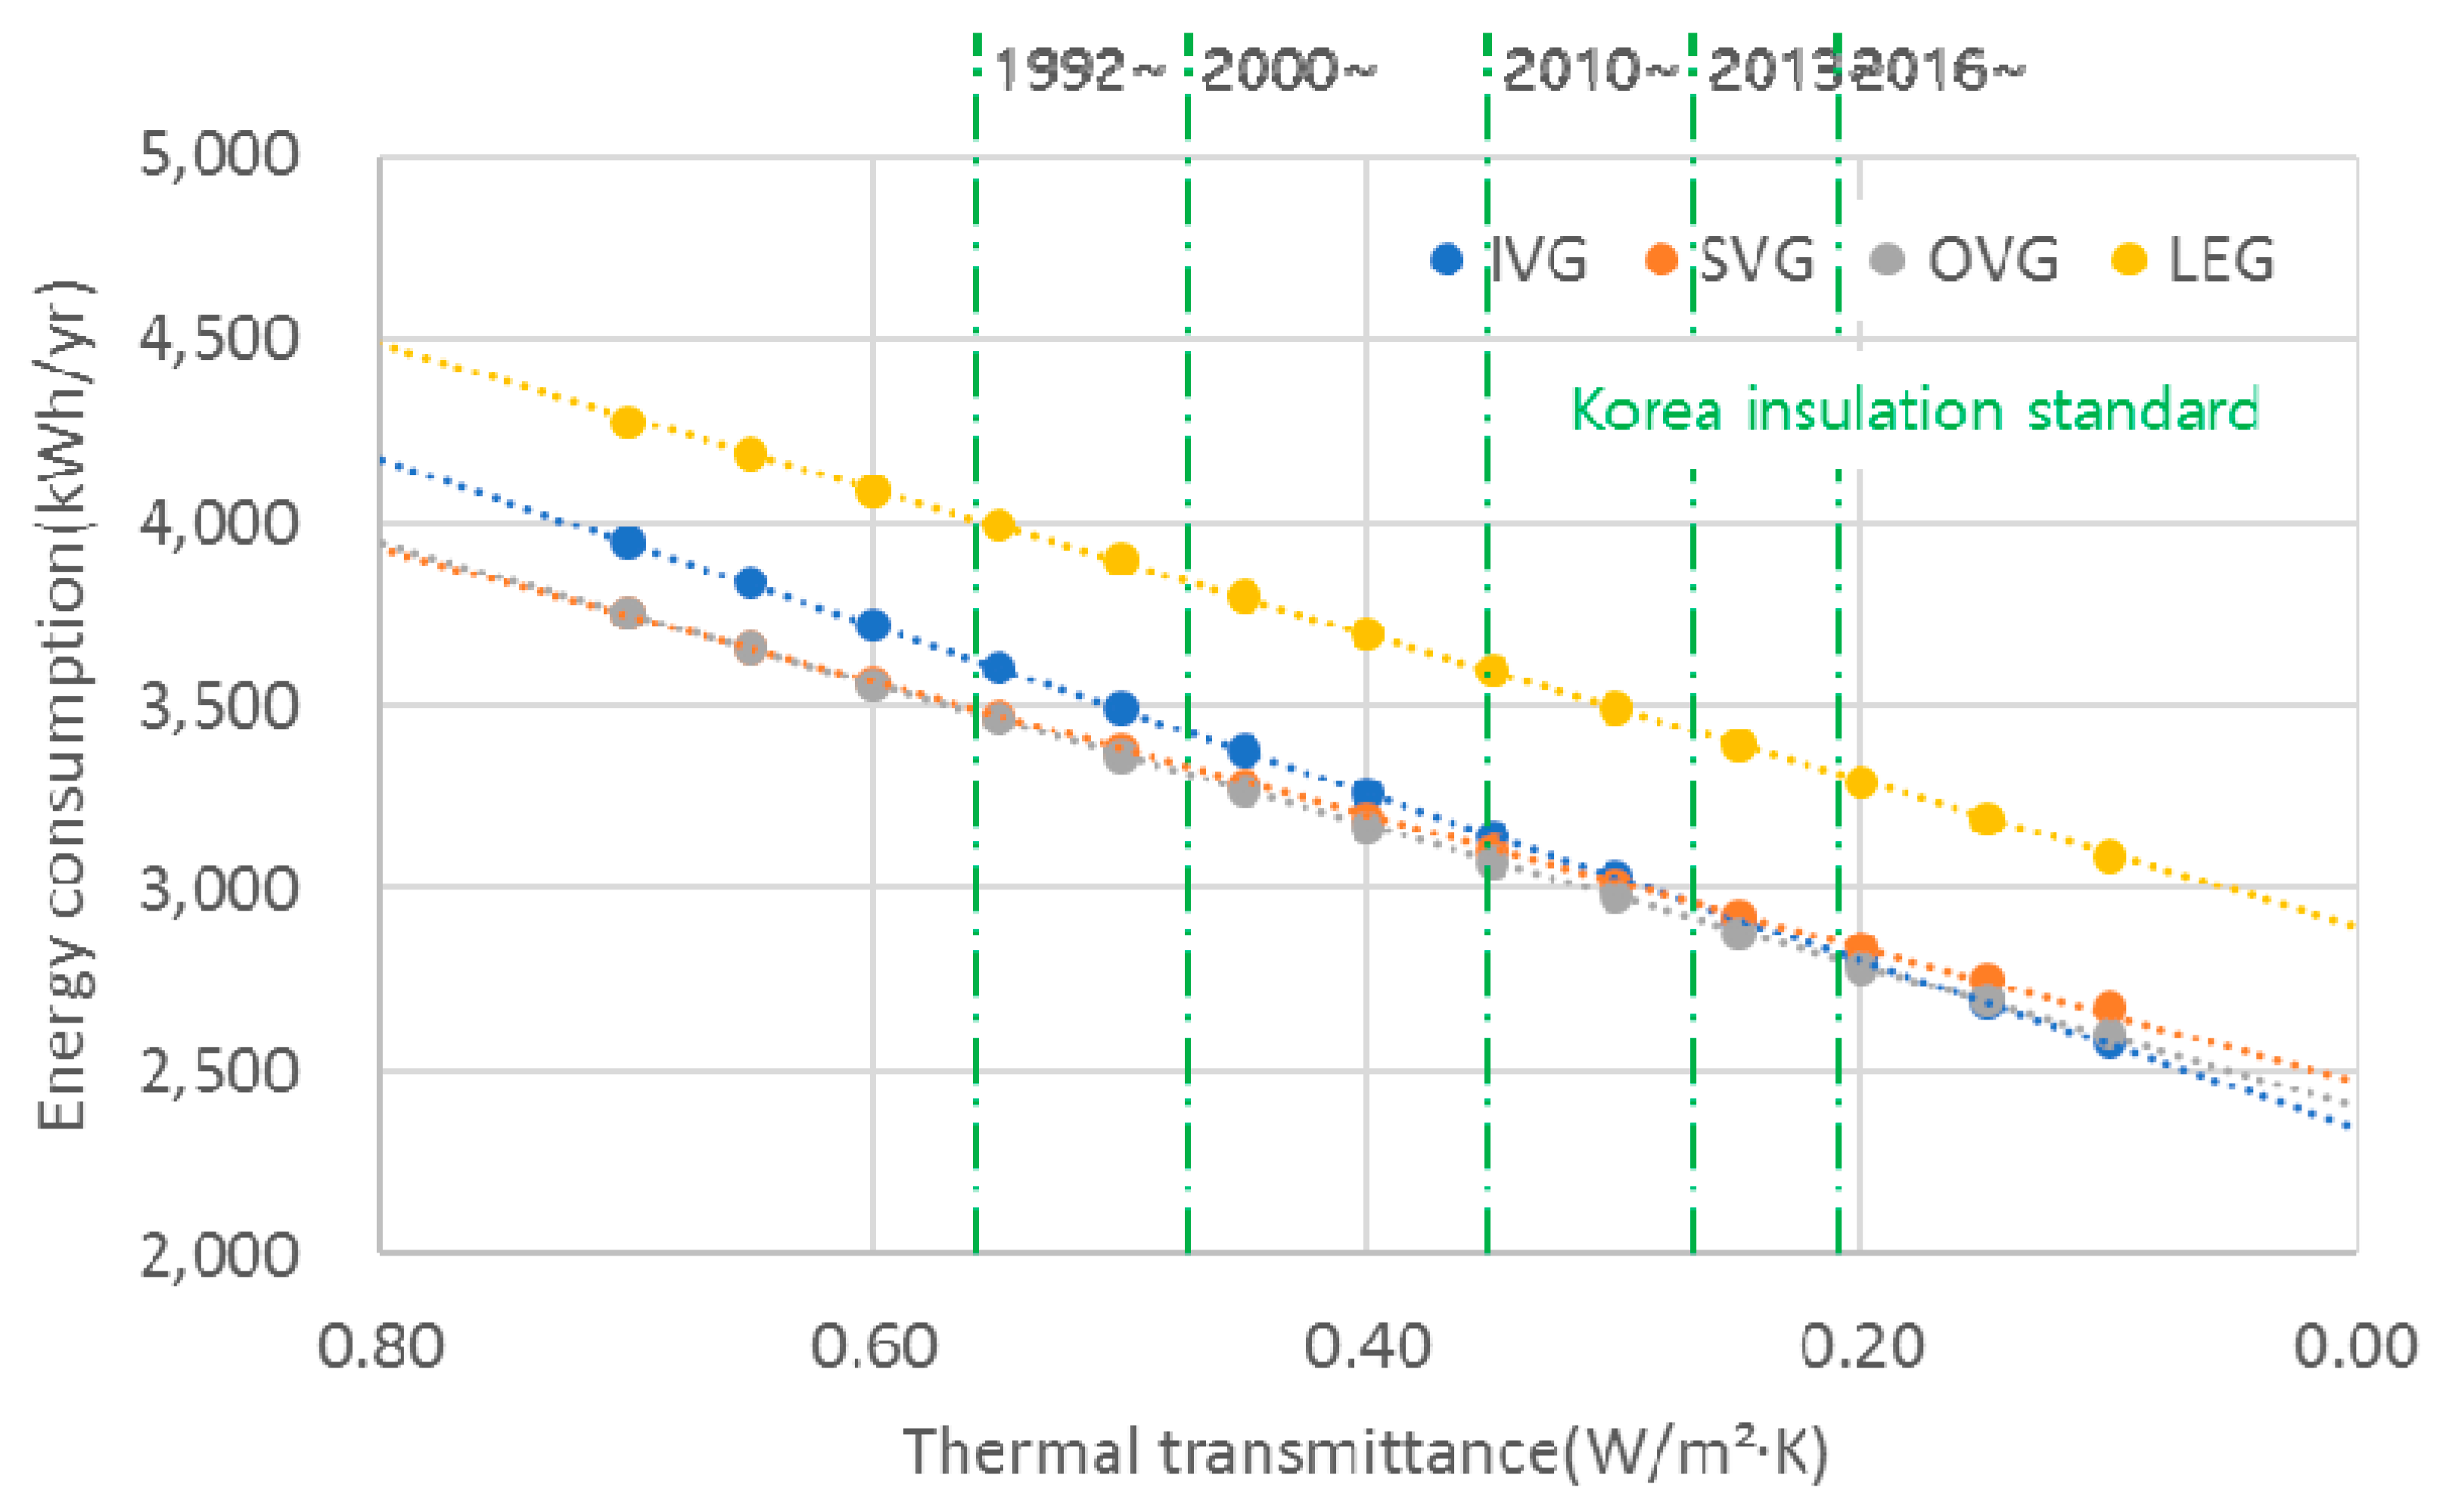
Figure 16 and Table 6 present an estimation of the energy consumption of an office building according to the change in U-value. In office buildings, which are used mainly during the daytime and have high cooling energy consumption, installing the IVG with a low SHGC results in the highest energy saving rate when the U-value of the building envelope is low. In particular, as the U-value of building envelope is lowered, the energy savings rate due to IVG application is also higher.
Figure 17 and Table 7 show the results of an analysis of residential buildings. Since residential buildings are used mostly at night and have a high heating requirement, a high SHGC is required along with a low U-value under the insulation conditions of building envelopes, such as the insulation level of existing residential buildings. On the other hand, according to the analysis results, if the U-value of building envelopes is lower than a certain level, as in newly-built residential buildings, the application of IVG with a low SHGC will produce the largest reduction in energy requirement, as in office buildings.
Currently, there are no clear legal standards for SHGC in South Korea. The window certification system for energy efficiency gives a higher rating to windows with a lower U-value. On the other hand, as shown in the results of this study, because windows have both thermal and optical properties, both SHGC and the U-value of windows should be considered to achieve better energy savings in climate zones with distinct winter and summer seasons. In addition, the effect is greater as the insulation of the building is strengthened.
4. Discussion and Conclusions
In this study, the energy performance of second-generation vacuum glazing in the climate zone of Korea with distinct summer and winter seasons was analyzed. Experiments and simulations were carried out on the energy performance of a building according to the change in the vacuum layer position of the double-layer vacuum glazing, with the position of the low-e coating being fixed on the inside.
Short-term experiment in the mock-up chamber showed that single vacuum glazing decreased in heating energy consumption by 28% and showed 6.4 °C lower indoor surface temperature as compared to low-e double glazing. Therefore, it was proved that the application of vacuum glass in winter is more advantageous than the conventional glass in terms of building energy and thermal comfort.
Regarding to the performance in summer, while single vacuum glazing in the residential building showed a cooling energy increase of 279 kWh (30%) compared to low-e double glazing, the heating energy was reduced by 809 kWh (24%). Thus, total cooling and heating energy was finally reduced by about 12%. However, the heating and cooling energy consumption was decreased by 2.7% for the office building.
In other words, the vacuum glazing has a great effect on the heating energy saving in a mild climate, which has summer and winter seasons, and this indicates the need to consider an increase in cooling energy consumption. Therefore, it is necessary to examine the use of the building and the proportion of heating and cooling energy consumption.
According to the simulation results, when considering the application of vacuum glazing, inside vacuum glazing, which decreases the cooling load in summer, is advantageous for cooling-dominated buildings, such as commercial buildings. On the other hand, outside vacuum glazing was found to be favorable for residential buildings. Henceforward, if the thermal performance of the envelope in residential buildings continuously increases, outside vacuum glazing will be advantageous. These results are associated with the SHGC, which should be taken into consideration in window selection in climate zones with distinct winter and summer seasons. In addition, the impact of SHGC on the building energy consumption becomes greater as the building becomes more insulated.
It is clear that vacuum glass whose insulation performance is similar to that of a wall is one of the necessary elements for achieving a zero energy building. However, high insulation is a direct cause of the cooling energy increase in summer, so the unconditional strengthening of insulation standards is not the answer to energy saving. As shown in the results of this paper, careful examination is needed to achieve the optimal energy saving according to the type of building and the thermal performance of the envelope. In particular, the criteria for SHGC should be made urgently and this should also be a flexible standard for building types, not simply high or low.
The results of this study, conducted in Korea, which has four distinct seasons, were limited to short-term experiments in winter. This means the conclusion on cooling energy consumption from the simulation were not verified by experiments. Therefore, subsequent studies should be conducted to verify the energy effect of vacuum glazing in buildings in summer. Furthermore, the possibility of building applications in various climate conditions should be investigated.
Acknowledgments
This work was supported by the R and D program of MSIP/COMPA, (2016-K000249, Ultra energy-saving vacuum insulating glass technology).
Author Contributions
Seung-Chul Kim and Jong-Ho Yoon conceived and designed the experiments; Seung-Chul Kim and Ru-Da Lee performed the experiments; Seung-Chul Kim and Jong-Ho Yoon wrote the paper.
Conflicts of Interest
The authors declare no conflict of interest.
References
- Jelle, B.P.; Hynd, A.; Gustavsen, A.; Arasteh, D.; Goudey, H.; Hart, R. Fenestration of today and tomorrow: A state-of-the-art review and future research opportunities. Sol. Energy Mater. Sol. Cells 2012, 96, 1–28. [Google Scholar] [CrossRef]
- Understanding the Government’s Data on U-Values. Available online: http://www.pilkington.com (accessed on 23 May 2017).
- Cuce, E.; Cuce, P.M. Vacuum glazing for highly insulating windows: Recent developments and future prospects. Renew. Sustain. Energy Rev. 2016, 54, 1345–1347. [Google Scholar] [CrossRef]
- Zoller, F. Hollow Pane of Glass. German Patent No. 387655, 1924. [Google Scholar]
- Simko, T.M.; Collins, R.E.; Beck, F.A.; Arasteh, D. Edge conduction in vacuum glazing. Proceedings of Thermal Performance of the Exterior Envelopes of Buildings VI, Clearwater Beach, FL, USA, 4–8 December 1995. [Google Scholar]
- Cho, S. Window technologies for realization of passive & zero energy house. J. JAIK 2014, 58, 21–25. [Google Scholar]
- Kim, S.-C.; Yoon, J.-H.; Shin, U.-C.; Ahn, J.-H. A Comparative experiment on thermal stress failure of vacuum glazing applied in curtain wall at spandrel area. KIEAE J. 2016, 16, 121–128. [Google Scholar] [CrossRef]
- Fang, Y.; Hyde, T.J.; Arya, F.; Hewit, N. A novel building component hybrid vacuum glazing: A modelling and experimental validation. ASHRAE Trans. 2013, 119, 430–441. [Google Scholar]
- Manz, H.; Brunner, S.; Wullschleger, L. Triple vacuum glazing: Heat transfer and basic mechanical design constraints. Sol. Energy 2006, 80, 1632–1642. [Google Scholar] [CrossRef]
- Eames, P.C. Vacuum glazing: Current performance and future prospects. Vacuum 2008, 82, 717–722. [Google Scholar] [CrossRef]
- Fang, Y.; Hyde, T.J.; Arya, F.; Hewitt, N.; Eames, P.C.; Norton, B.; Miller, S. Indium alloy-sealed vacuum glazing development and context. Renew. Sustain. Energy Rev. 2014, 37, 480–501. [Google Scholar] [CrossRef]
- Jang, C.-Y.; Kim, C.-H.; Lee, N.-E. A study on the vacuum glazing applied to the building energy efficiency rating of apartment. J. KSES 2010, 11, 96–101. [Google Scholar]
- Song, S.-B.; Son, B.-G.; Jung, S.-M. Insulation performance and building energy saving effect of vacuum insulation glass. J. KSES 2012, 11, 139–144. [Google Scholar]
- Fang, Y.; Hyde, T.J.; Arya, F.; Hewitt, N.; Wang, R.; Dai, Y. Enhancing the thermal performance of triple vacuum glazing with low-emittance coatings. Energy Build. 2015, 97, 186–195. [Google Scholar] [CrossRef]
- Kim, S.-C.; Yoon, J.-H.; Lee, H.-M. Comparative experimental study on heating and cooling energy performance of spectrally selective glazing. Sol. Energy 2016, 145, 78–89. [Google Scholar] [CrossRef]
- Energy Consumption Survey; Korea Energy Economics Institute: Uiwang, Korea, 2011; pp. 616–619.
- National Statistical Office (2006–2016). Available online: http://kosis.kr/statHtml/statHtml.do?orgId=116&tblId=DT_MLTM_5403&conn_path=I2 (accessed on 6 June 2017).
Figure 1.
Technical framework of this study.

Figure 2.
Front view of mock-up test cells.

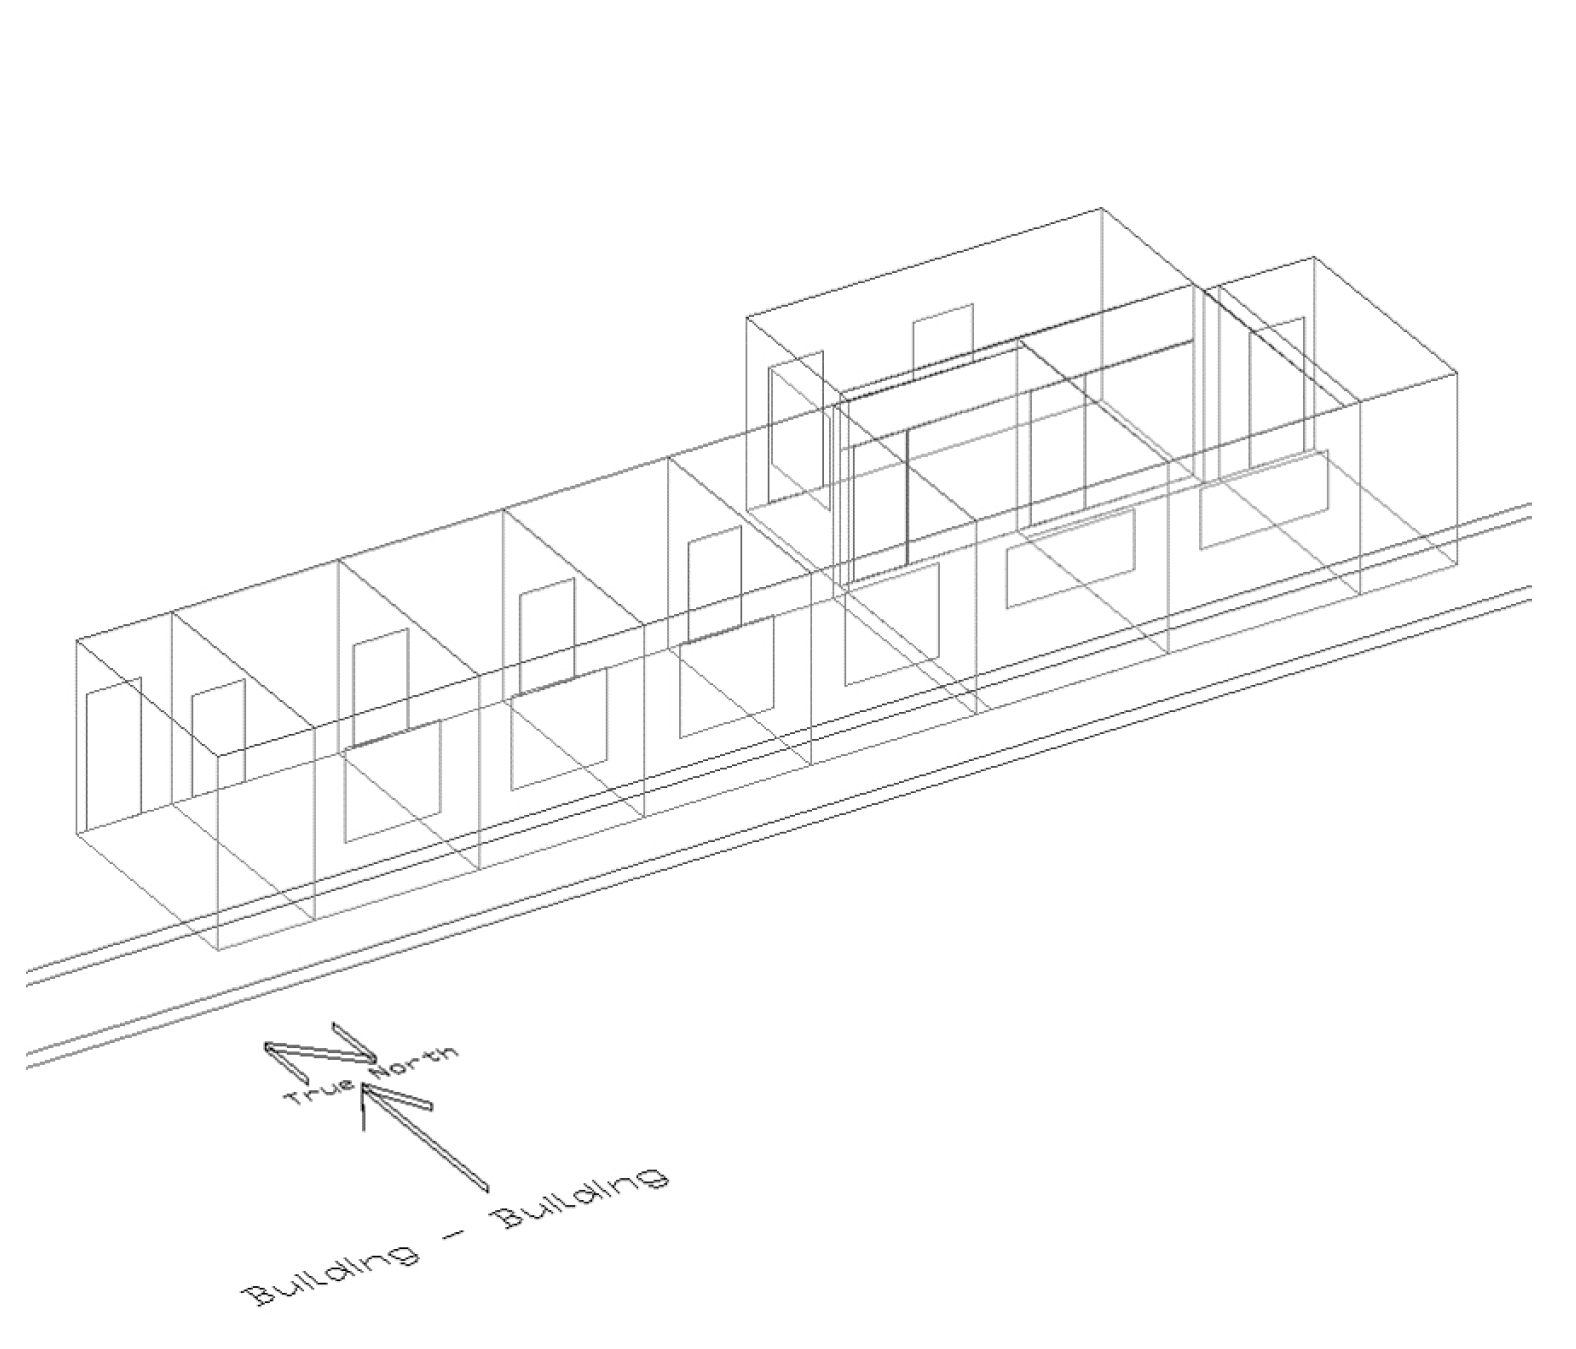
Figure 3.
Floor plan of full scale mock-up test facility.

Figure 4.
Measured temperature profiles with the SVG and LEG (8–9 April 2017).

Figure 5.
Temperature distribution and energy consumption of the SVG and LEG (1–2 April 2017).

Figure 6.
Measured temperature profiles with the IVG and OVG (6–7 April 2017).

Figure 7.
Temperature distribution and energy consumption of the IVG and OVG (4–5 April 2017).

Figure 8.
Simulation model of mock-up with the building performance simulation tool, EnergyPlus.

Figure 9.
Simulation model of office building.

Figure 10.
Simulation model of residential building.

Figure 11.
Calculated heating energy consumption of the SVG and LEG.

Figure 12.
Calculated heating energy consumption of the IVG and OVG.

Figure 13.
Comparison of standard deviation of heating energy saving rate and experiment results.

Figure 14.
Calculated cooling and heating energy consumption of office buildings.

Figure 15.
Calculated cooling and heating energy consumption of residential building.

Figure 16.
Changes in energy consumption due to insulation enhancement in office buildings.

Figure 17.
Changes in energy consumption due to insulation enhancement in residential buildings.


Table 1.
Thermal properties of the mock-up test cells [15].
Table 1.
Thermal properties of the mock-up test cells [15].
| Thermal Properties of Construction | Value | |
|---|---|---|
| EPS insulation | Thermal conductivity | 0.0376 W/m·K |
| Specific heat | 55 kJ/m3·K | |
| Oriented strand board | Thermal conductivity | 0.1060 W/m·K |
| Specific heat | 270 kJ/m3·K | |
| Thermal conductance of external wall | 0.173 W/m2·K | |
| Thermal conductance of floor | 0.173 W/m2·K | |
| Thermal conductance of internal wall | 0.090 W/m2·K | |
| Thermal conductance of roof | 0.173 W/m2·K | |
Table 2.
Specification of sensors and equipment for the experiment.
| Sensors and Equipment | Measurement Range | Error Range |
|---|---|---|
| T type T/C sensor | −250 °C to 400 °C | ±1.0 °C |
| Outside thermometer | −40 °C to 60 °C | ±0.5 °C |
| Pyranometer | 0 to 4000 W/m2 | ±0.5% |
| Digital power analyzer | 0.5 to 100 kHz; 15 to 600 V; 5 mA to 20 A | 0.1% of reading 0.2% of range |
Table 3.
Calculated thermal and optical properties of tested glazing systems.
| Properties | Inside Vacuum Double Glazing (IVG) | Single Vacuum Glazing (SVG) | Outside Vacuum Double Glazing (OVG) | Low-E Double Glazing (LEG) |
|---|---|---|---|---|
 |  |  |  |  |
| U-value (W/m2·K) | 0.506 | 0.557 | 0.508 | 1.679 |
| SHGC | 0.516 | 0.597 | 0.557 | 0.597 |
| Tvis | 0.713 | 0.792 | 0.713 | 0.792 |
Table 4.
Inputs for simulation model.
| Parameter | Office | Residential |
|---|---|---|
| Heating setpoint temp. | 20 °C | 22 °C |
| Cooling setpoint temp. | 26 °C | 26 °C |
| Occupancy density | 0.1110 people/m2 | 0.0169 people/m2 |
| Equipment power density | 11.77 W/m2 | 3.06 W/m2 |
| Lighting power density | 13.60 W/m2 | 7.50 W/m2 |
| External walls U-value | 0.435 W/m2·K | 0.650 W/m2·K |
| Infiltration rate | 0.5 ACH | 0.7 ACH |
| Minimum fresh air | 10 ℓ/s·person | - |
Table 5.
Monthly weather data in Inchon, Korea.
| Month | Average Outdoor Air Temperature (°C) | Average Outdoor Relative Humidity (%) | Wind Speed (m/s) | Diffuse Solar Radiation (W/m2) | Direct Solar Radiation (W/m2) |
|---|---|---|---|---|---|
| Jan | −2.2 | 46.5 | 3.3 | 44.3 | 89.8 |
| Feb | −0.3 | 61.7 | 4.6 | 57.8 | 111.4 |
| Mar | 4.8 | 65.8 | 3.3 | 80.3 | 104.0 |
| Apr | 10.8 | 69.6 | 3.8 | 98.5 | 125.1 |
| May | 15.8 | 72.8 | 3.0 | 104.5 | 120.4 |
| Jun | 20.5 | 73.8 | 3.0 | 118.2 | 101.3 |
| Jul | 23.6 | 86.3 | 2.5 | 111.4 | 45.7 |
| Aug | 25.0 | 83.0 | 3.7 | 108.8 | 48.8 |
| Sep | 20.8 | 73.0 | 2.2 | 89.4 | 72.4 |
| Oct | 14.5 | 66.2 | 2.1 | 66.7 | 87.7 |
| Nov | 7.6 | 67.0 | 3.5 | 49.0 | 76.8 |
| Dec | 1.2 | 59.4 | 2.7 | 42.6 | 60.4 |
Table 6.
Cooling and heating energy due to insulation enhancement in office buildings [kWh].
| U-Value (W/m2·K) | IVG | SVG | OVG | LEG | ||||
|---|---|---|---|---|---|---|---|---|
| Cooling | Heating | Cooling | Heating | Cooling | Heating | Cooling | Heating | |
| 0.50 | 26,168 | 17,742 | 27,291 | 16,979 | 26,721 | 17,297 | 25,788 | 19,738 |
| 0.45 | 26,469 | 17,082 | 27,604 | 16,345 | 27,029 | 16,656 | 26,052 | 19,112 |
| 0.40 | 26,773 | 16,448 | 27,928 | 15,718 | 27,344 | 16,027 | 26,333 | 18,497 |
| 0.35 | 27,093 | 15,804 | 28,270 | 15,080 | 27,675 | 15,388 | 26,621 | 17,868 |
| 0.30 | 27,430 | 15,151 | 28,634 | 14,433 | 28,028 | 14,732 | 26,923 | 17,214 |
| 0.25 | 27,789 | 14,485 | 29,016 | 13,780 | 28,400 | 14,071 | 27,240 | 16,565 |
| 0.20 | 28,167 | 13,812 | 29,423 | 13,115 | 28,789 | 13,403 | 27,575 | 15,904 |
| 0.15 | 28,566 | 13,141 | 29,856 | 12,460 | 29,207 | 12,741 | 27,926 | 15,226 |
| 0.10 | 28,996 | 12,454 | 30,319 | 11,767 | 29,655 | 12,044 | 28,310 | 14,540 |
Table 7.
Cooling and heating energy due to insulation enhancement in residential buildings [kWh].
| U-Value (W/m2·K) | IVG | SVG | OVG | LEG | ||||
|---|---|---|---|---|---|---|---|---|
| Cooling | Heating | Cooling | Heating | Cooling | Heating | Cooling | Heating | |
| 0.70 | 1014 | 2932 | 1213 | 2540 | 1120 | 2634 | 937 | 3341 |
| 0.65 | 1029 | 2805 | 1234 | 2427 | 1137 | 2519 | 948 | 3237 |
| 0.60 | 1047 | 2673 | 1257 | 2309 | 1157 | 2401 | 959 | 3130 |
| 0.55 | 1064 | 2542 | 1280 | 2193 | 1177 | 2284 | 971 | 3023 |
| 0.50 | 1084 | 2408 | 1306 | 2073 | 1200 | 2163 | 984 | 2913 |
| 0.45 | 1105 | 2271 | 1334 | 1952 | 1225 | 2040 | 997 | 2801 |
| 0.40 | 1129 | 2133 | 1364 | 1829 | 1252 | 1916 | 1011 | 2688 |
| 0.35 | 1154 | 1992 | 1398 | 1705 | 1281 | 1790 | 1026 | 2573 |
| 0.30 | 1182 | 1849 | 1434 | 1578 | 1313 | 1662 | 1042 | 2455 |
| 0.25 | 1214 | 1703 | 1474 | 1448 | 1348 | 1531 | 1060 | 2336 |
| 0.20 | 1248 | 1555 | 1519 | 1316 | 1387 | 1398 | 1078 | 2214 |
| 0.15 | 1287 | 1404 | 1569 | 1182 | 1431 | 1263 | 1099 | 2091 |
| 0.10 | 1331 | 1249 | 1623 | 1048 | 1479 | 1125 | 1121 | 1966 |
© 2017 by the authors. Licensee MDPI, Basel, Switzerland. This article is an open access article distributed under the terms and conditions of the Creative Commons Attribution (CC BY) license (http://creativecommons.org/licenses/by/4.0/).
Share and Cite
MDPI and ACS Style
Kim, S.-C.; Yoon, J.-H.; Lee, R.-D. Energy Performance Assessment of a 2nd-Generation Vacuum Double Glazing Depending on Vacuum Layer Position and Building Type in South Korea. Energies 2017, 10, 1240. https://doi.org/10.3390/en10081240
AMA Style
Kim S-C, Yoon J-H, Lee R-D. Energy Performance Assessment of a 2nd-Generation Vacuum Double Glazing Depending on Vacuum Layer Position and Building Type in South Korea. Energies. 2017; 10(8):1240. https://doi.org/10.3390/en10081240
Chicago/Turabian StyleKim, Seung-Chul, Jong-Ho Yoon, and Ru-Da Lee. 2017. "Energy Performance Assessment of a 2nd-Generation Vacuum Double Glazing Depending on Vacuum Layer Position and Building Type in South Korea" Energies 10, no. 8: 1240. https://doi.org/10.3390/en10081240
Note that from the first issue of 2016, this journal uses article numbers instead of page numbers. See further details here.