Financial assessment of plant project can pre-judge the direct and indirect economic benefits to some extent providing investors bases for decision making.
In this section, the financial models are first introduced from electricity prices and two perspectives (cost and income); then some static and dynamic indicators are explained with or without consideration of the time value of money.
2.2.2. Cost and Income
(1) Capital Cost
The capital cost of STCG includes direct capital cost and indirect capital cost.
where,
,
, and
are referring to the capital cost, direct capital cost, and indirect capital cost of STCG respectively.
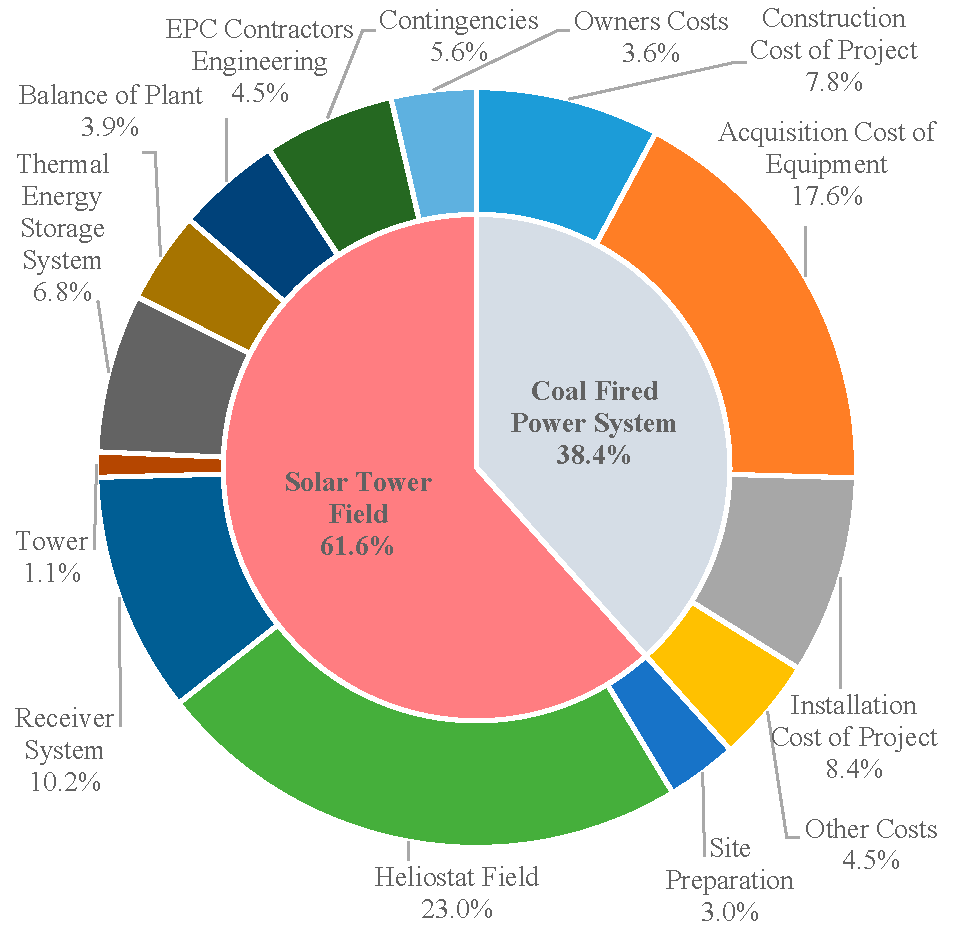
For STCG, the direct capital cost includes investment cost of coal-fired power generation system (such as boiler, turbines, generator, etc.), solar tower field (such as heliostats, receiver, tower, thermal energy storage tanks, etc.), and the contingency of the plant project. While the indirect capital cost includes land cost, owner cost, sales tax, etc.
Due to lack of real solar tower aided coal-fired power plants, the capital cost of STCG comes from two parts: solar tower power plant and coal-fired power plant. What should be noted is that the cost of a power cycle in a solar tower power plant does not need to be accounted for when calculating the total capital cost of STCG, because the solar tower field shares its power cycle with the coal-fired power generation system.
Capital cost of both the solar tower power plant and coal-fired power plant have been taken from literature [
34,
35].
(2) Operation and Maintenance Cost
The operation and maintenance (O&M) cost consists of fixed cost and variable cost.
where
is the total O&M cost of STCG project,
and
are fixed and variable O&M cost, respectively.
The variable O&M cost in the
nth year depends on the generating capacity and annual power output as indicated below,
where,
is the O&M cost per kW electricity in each year;
is the nameplate generating capacity;
is the O&M cost per unit power generation,;
is the annual power output;
is the inflation rate, which can be found from reference [
36]; and
represents the
nth year.
The O&M cost can also be calculated by a simplified method [
37]. The O&M cost in the
nth year is
where
is the proportion of O&M cost to the capital cost of STCG project.
In order to guarantee the secure and stable high efficiency operation of the plant, annual overhaul and technological transformation are needed, whose costs are also included in the O&M cost.
(3) Insurance Cost
The method for calculating insurance cost in the
nth year is similar to that of O&M cost [
38],
where
is the insurance rate.
(4) Fuel Cost
Coal is the only fuel used by a STCG plant, and the annual coal consumption depends on grid demand and annual DNI. The fuel cost in the
nth year is
where
is the total coal consumption in the
nth year;
is the average coal price in the
nth year.
(5) Interest of Debt
The interest of debt accounts for a large proportion of the debt repayment. The repayment is a dynamic process, so the interest paid to the bank in each year is different. The interest in the
nth year is
where
is the interest of debt in the
nth year;
is the remaining debt by the end of the (
n − 1)th year; and
is the interest rate of debt.
can be calculated by the remaining debt by the end of the (
n − 2)th year and the repayment in the (
n − 1)th year,
where
is the repayment to the bank on the principal cash in the (
n − 1)th year and it can be calculated as:
where,
is the sum of principal cash and interest that needs to be paid to the bank in the (
n − 1)th year.
The available money used to pay the bank depends on the annual income. The proportion of the available money to the annual income is called debt service coverage ratio (DSCR) [
39]. DSCR should be no smaller than 1, and the larger the DSCR is, the stronger the repayment capacity is.
where
is the available money used to pay the bank in the
nth year,
is the annual income in the
nth year.
Taking the discount rate into consideration, the income equivalence of the 0th year in the
nth year is
where
is the discount rate.
If the available money in each year is converted to the 0th year by discount rate and then accumulated, the debt repayment capacity of the project can be obtained. The debt repayment capacity equals to the maximum debt the project owner(s) can borrow from the bank. If the debt is beyond the debt repayment capacity, that means the total income of the project cannot cover the debt from the bank.
In the repayment process, the available money each year is first used to pay for the interest, and then for the principal cash.
(6) Revenue of Electricity
Electricity revenue is the main income for a plant project, and it is related to the electricity market and government policies. Electricity price of different electricity sources (fossil fuels or renewable energy) differs along with different pricing mechanisms (see
Section 2.2.1).
The electricity revenue of a STCG plant comes from the electricity generated by solar thermal energy and coal.
where
is the total electricity revenue of a STCG plant for the whole life cycle;
is the lifespan of a STCG plant;
is the power output of solar thermal energy in the
nth year;
is the price of electricity generated by solar thermal energy in the
nth year;
is the power output of coal in the
nth year;
is the price of electricity generated by coal in the
nth year. If electricity price changes monthly, the total revenue should also be calculated every month.
(7) Taxes
The main taxes imposed on a plant project include the value-added tax (VAT), the income tax, and the additional tax.
The VAT is a turnover tax based on the added value of goods during circulation. The taxable amount of a general taxpayer equals the difference between the current output tax and the current input tax
where
is the value-added tax,
and
are the current output tax and the current input tax respectively.
The income tax is a tax imposed on taxpayers with their taxable income. The income tax rate for enterprises in China is 25%.
The additional tax is a tax levied in accordance with a certain proportion of the regular tax, including urban maintenance and construction tax, educational surtax, etc. Based on current laws and regulations, the rates of urban maintenance and construction tax and educational surtax are 7% and 3% of the regular tax respectively.
2.2.3. Assessment Indicators
• Static Indicators
Static indicators refer to the indexes calculated directly with cash flows without considering the time value of money. They include static pay-back period, return on investment, etc.
(1) Static Pay-Back Period (SPP)
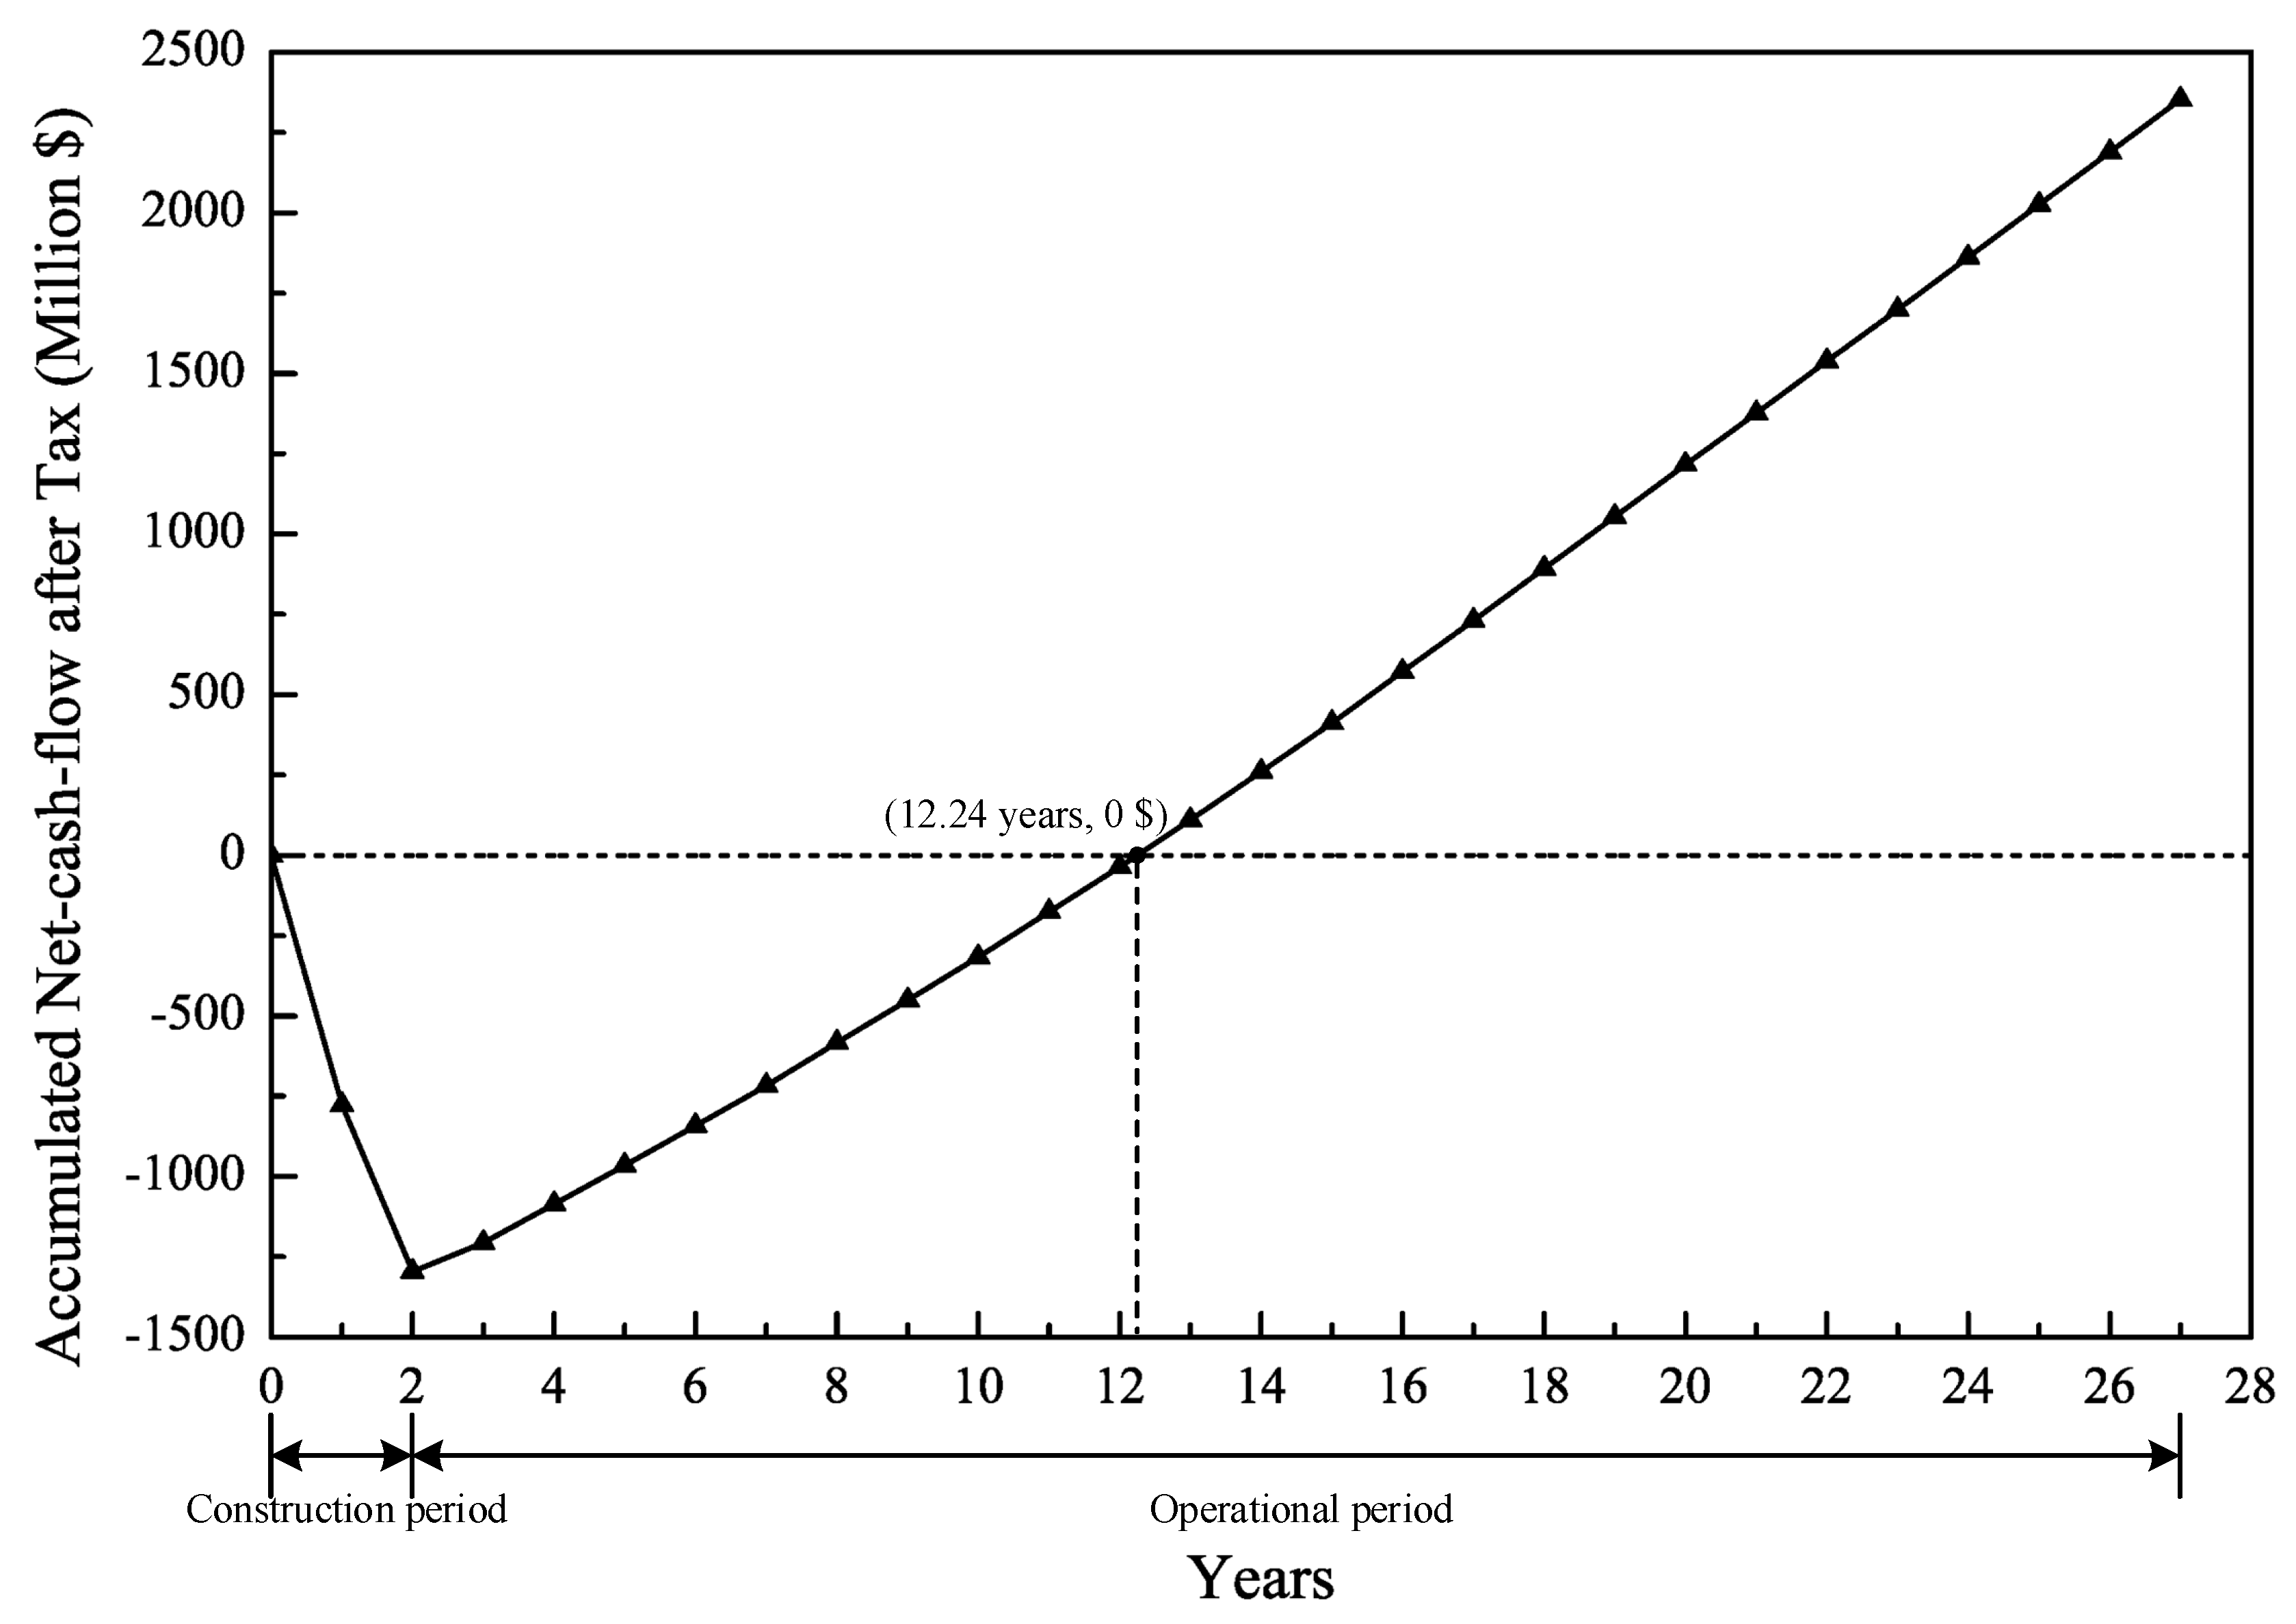
The static pay-back period is the time needed to recover the total investment without considering the time value of money, namely the time needed for accumulative net cash flows to just cover the total investment during project’s life cycle. Generally, there are two forms of the static pay-back period: the operation period including or not the construction period. In this paper, the construction period is included into the static pay-back period (SPP), whose calculation method also fits the dynamic pay-back period. The static pay-back period and the dynamic pay-back period are generally calculated with the unit of year.
where
is the static pay-back period, and
and
are cash inflow and cash outflow respectively.
The static pay-back period (SPP) can reflect the investment pay-back time with a simple calculation method. However, the time value and the cash flows after the static pay-back period are not considered, so it cannot accurately reflect the effect of different investment methods on the project.
(2) Return on Investment (ROI)
The ROI refers to the ratio between the annual profit and the total investment of the project in normal productive years. If the annual profit changes drastically during the project’s life cycle, the average annual pre-tax profit can be used instead of the annual profit in a particular year.
where
is the annual profit of the project and
is the total investment of the project.
A project is worth investing when the ROI is no less than the benchmark yield of the project.
(3) Rate of Return on Common Stock Holders’ Equity (ROE)
The ROE refers to the ratio between the annual after-tax net profit and the total capital of the project in normal productive years. If the annual after-tax net profit changes significantly during the project’s life cycle, the average annual after-tax net profit can be used instead of the annual after-tax net profit.
where
is the annual after-tax net profit of the project and
is the total capital of the project.
• Dynamic Indicators
Dynamic indicators refer to the indexes calculated with cash flows considering the time value of money. They include dynamic pay-back period, net present value, internal rate of return, LCOE, etc.
(1) Dynamic Pay-Back Period (DPP)
Compared with the static pay-back period presented above (SPP), the dynamic pay-back period (DPP) is the time needed to recover the total investment considering the time value of money, namely the time needed for accumulative net cash flows discounted by the benchmark yield to just cover the total investment during the project’s life cycle. Units of the dynamic pay-back period (DPP) are the same ones as the static pay-back period (SPP).
where
and
are cash inflow and cash outflow respectively,
is the dynamic pay-back period of the project, and
is the benchmark yield.
The time value of money is considered in the analysis of the dynamic pay-back period, overcoming the disadvantages of the static pay-back period. Therefore, the dynamic pay-back period is longer than the static pay-back period. However, the calculation considering the time value of money is more complex, and the cash flows after dynamic pay-back period are ignored. Dynamic pay-back period will be meaningless if the net cash flows are negative after the dynamic pay-back period, and some other indicators are needed for financial evaluation of the project.
(2) Net Present Value
The NPV is the accumulation of annual net cash flows discounted by the benchmark yield to the beginning of the project. The time value of money and the temporal distribution of cash flows in the project life cycle are considered in calculating NPV, which can reflect the profits and losses of the project by money. The NPV can be calculated as [
40]
where
is the annual net cash flows in the
nth year.
Annual net cash flows are the difference between the annual cash inflows and annual cash outflows
The NPV is a dynamic indicator that can reflect the profitability of the technical solution in the project life cycle. If the NPV is higher than 0, extra revenue can be obtained besides the profits that can meet the profitability requirement of the benchmark yield; if the NPV is equal to 0, the project can meet the profitability requirement of the benchmark yield and is financially feasible; if the NPV is lower than 0, the profit cannot meet the profitability requirement of the benchmark yield, and the project is not financially feasible.
(3) Internal Rate of Return (IRR)
The IRR is the discount rate when the total cash inflows and outflows at present are equal to each other (i.e., NPV = 0), which is the rate of return desired by investors. The IRR is also known as investors’ tolerance of inflation.
The IRR can be calculated as
When the IRR is equal to the average inflation rate during the project’s life cycle, the project will not generate profits but is still feasible; if the IRR is lower than the average inflation rate, the project may probably suffer losses; if the IRR is higher than the average inflation rate, the project may probably earn profits. This is the most practical and important significance of the IRR for a project, especially for projects with a long pay-back period.
(4) Levelized Cost of Electricity
The LCOE is an assessment criterion used to evaluate the cost of power generation technologies. It is related to capital cost, O&M cost, insurance cost, power output, and debt, etc. The LCOE is defined as the ratio between the overall cost and the total power output of project in its life cycle [
41,
42,
43,
44], namely
where
is the annual cost in the
nth year, and
is the annual power output in the
nth year.
In the numerator of the equation above, the annual cost in each year is discounted. For the 0th year, the annual cost means the capital cost, which does not need to be discounted. Therefore, the equation above can be expressed as
where
is the annual cost in the
nth year (from the first year), including the O&M cost, the fuel cost, the insurance cost, etc.
Considering the investment, the power output and the time value of money, the LCOE can reflect the generating cost of the project. Therefore, the LCOE is an important criterion to assess the generating cost of a plant project.


