1. Introduction
New high performing materials for glazing systems have recently received great attention as a means to improve energy efficiency in buildings. This trend is confirmed by the publication of extensive reviews on the latest developments on glazing technologies in 2015, 2016 and more recently in 2017 [
1,
2,
3,
4,
5,
6]. Among the emerging systems, photovoltaic semi-transparent materials, (STPV) integrated into windows as active elements, show high potential and are starting to be studied more extensively. Characterization of such devices on the point of view of their electrical, optical and thermal behavior in real operating conditions is of fundamental importance to provide reliable data to input into simulation models for the evaluation of their energy saving potential.
The thermal transmittance coefficient (U-value) and solar heat gain coefficient (SHGC) are the two parameters typically used for the thermal characterization, the comparison between glazing systems and as input for building energy performance simulations. The U-value defines the heat transmission through a given thickness of a building wall or window and it is related to the thermophysical properties of the materials. Low numbers indicate high insulation. The SHGC, also named as g-value, quantifies the total heat transmitted into a room due to solar radiation. It is given by two contributors, one is the short wave solar radiation directly entering through the glass while the other comes from the solar radiation absorbed by the glass pane which increases its temperature inducing a heat flow towards the room. SHGC then depends principally on the transmission and absorption coefficients of the transparent material. A standardized definition of this magnitude in the case of transparent glazing systems is given by EN 410 [
7]. Regarding the normative for building integrated photovoltaics (BIPV), EN 50583 [
8] standard, parts 1 and 2, for BIPV modules and systems states the need to determine U-value and SHGC for BIPV systems, but it does not prescribe any specific calculation [
9]. It has to be noted that for STPV, the SHGC usually changes if it is evaluated with the PV module in open circuit mode or in real operating conditions, i.e., when the module is operating at maximum power point (MPP) [
10,
11,
12]. In particular, SHGC decreases in real operating conditions since a large amount of the incoming solar radiation is converted into electrical power decreasing the residual fraction converted into heat. This is one of the main reasons for the importance of testing under real operating conditions despite the complexity of outdoor experiments.
Chae et al. [
13] evaluated the performance of three different amorphous silicon cells when integrated into windows. They built their own cells in the lab and they were able to fully characterize the devices from the optical, thermal and electrical point of view. These data were used as input of an energy plus model of a typical office building located in six different climatic zones in the US. They concluded that at low and mid latitudes, STPV can produce a 30% annual energy saving while for cities like Chicago and Duluth these systems did not provide a real gain. Looking at the Mediterranean area, Olivieri et al. performed two studies to characterize energy performance of glazing elements with amorphous silicon for the city of Madrid. They built an experimental set-up to thermally, optically and electrically characterize different kinds of amorphous silicon semi-transparent glasses [
14]. They used the experimental data obtained as input of a dynamic building simulation model to evaluate the energy saving potential of STPV elements with different gradation of transparency in Madrid, comparing the results with the energy performance of a standard glazing system [
15]. Liao et al. [
16] evaluated the energy performance of STPV using amorphous silicon with different characteristics. They demonstrated that a-Si PV glazing holds great potential in terms of energy performance under the climate conditions of Central China.
More recently, Wang et al. [
17] studied the performance of a PV double skin façade (PV-DSF) and a PV insulating glass (PV-IGU) in a comparative experiment carried on in Hong Kong. The results indicate that the PV-DSF has better performance than PV-IGU in reducing solar heat gains, while it has worse performance regarding thermal insulation. They used the experimental data to validate simulation models to investigate the overall performance of PV-DSF and PV-IGU in five different climates of China. The results show that the average energy saving potential of the PV-DSF and the PV-IGU are 28.4% and 30%, respectively, compared to the commonly used insulating glass window.
Organic photovoltaic has a great potential of integration into windows, in particular, dye-sensitized solar modules (DSM) are the most promising devices for this purpose since they are built on glass substrates [
18,
19]. Recently, some studies appeared in the literature [
20,
21,
22,
23,
24] regarding the evaluation of thermal, optical and electrical characteristics of dye-sensitized solar technology; however, most of them are focused on small dimensions solar cells that usually have better performance than modules. Moreover, in laboratory tests, the device provides better performance. These data have been used as input for models to provide energy assessment and the potential of this technology for energy saving in buildings with different configurations and in different climates. For example, Yoon et al. [
25] built and characterized their own dye solar cells (DSC) varying the thickness of the active material and used their results as input to a model of an office buildings in Korea provided with DSC windows. They found that lowering transparency of the active material produced low energy consumption in winter, mainly due to the PV energy production. This improvement depends on the cell efficiency; at low efficiency levels the energy consumption is almost constant with transparency while if efficiency could double with respect to the actual values, a certain dependence of consumption on transparency appeared. Lee et al. [
26] evaluated the potential of energy saving of DSC integrated in a reference building in six different climatic zones in the world. They tested six different DSC taking their characteristics from a national database. However the efficiency considered does not seem very representative of the realistic efficiencies of large area devices (DSM) that can be effectively integrated in a glazing system. They evaluated the four DSC performances with respect to four window-to-wall ratios, four orientations and seven cities. They concluded that while in Berlin and Moscow the advantage is low, a percentage variable between 12% and 22% of energy saving due to PV production is reached for the other cities tested.
Recently, Cornaro et al. [
27] studied the potential of energy saving of DSM and amorphous silicon modules integrated into a reference building located in different zones in Italy. They evidenced how DSM performs better than thin film even if its use does not provide the necessary saving improvement to reach NZEB conditions for the climate considered. Reale et al. [
28] developed a model of DSM using data coming from outdoor conditions to estimate producible energy of DSM with respect to the well-established technologies for a generic STPV installation. They concluded that DSM should have an equivalent efficiency in real outdoor conditions that is 16% higher than the one at standard test conditions in the laboratory (3.36%).
Despite the recent attempts, few studies in the literature regard the evaluation of thermal and electrical properties of DSM for STPV [
29], especially in real operating conditions [
28,
30]. This lack of data does not allow reliable evaluation of DSM potential of energy saving in buildings.
The study presented here aims to contribute to fill this lack, providing a thermal and electrical characterization of a DSM in real operating conditions using a method developed in house. In
Section 2, the method to measure thermal and electrical characteristics of DSM, developed by the authors, is described.
Section 3 presents the results obtained for the thermal characterization, while
Section 4 shows the results regarding the electrical characteristics of the device.
2. Materials and Methods
Two Solar Test Boxes (STBs) were built with the objective of making comparative analysis of thermal and lighting performance of transparent materials with respect to a double glass reference pane and to evaluate solar heat gain (SHGC) and U-value of innovative semi-transparent materials. Here, the method is briefly described. The methodology of STB is more deeply described in previously published works [
31].
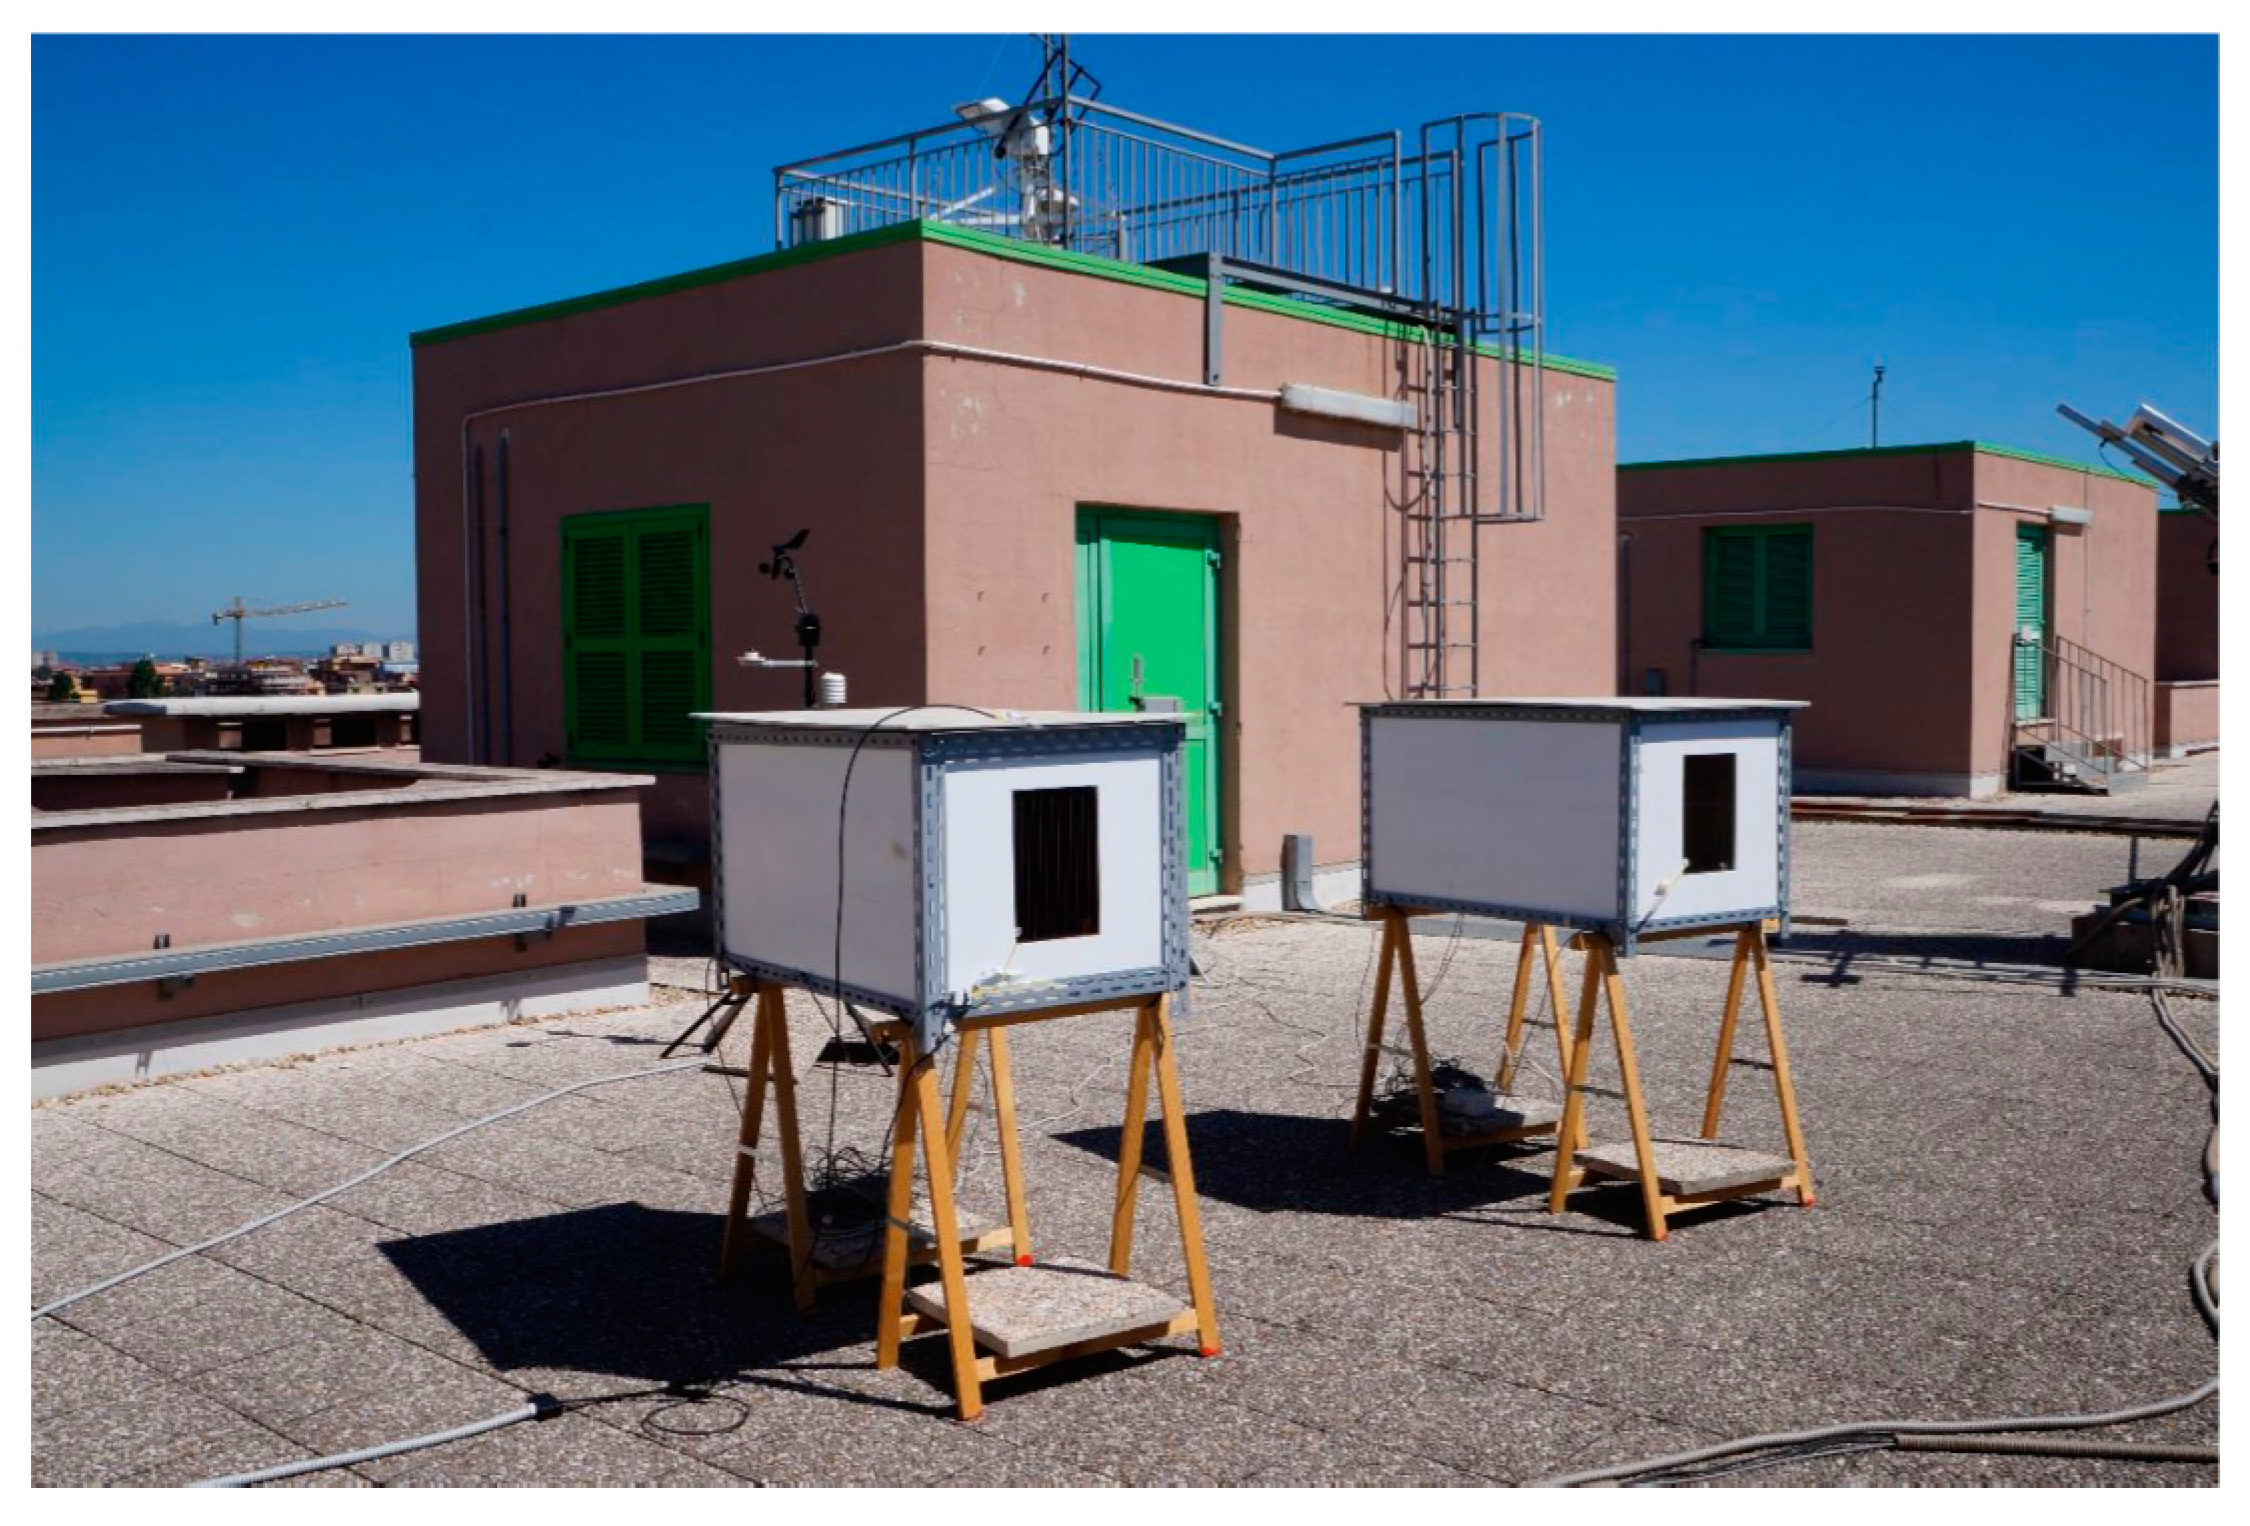
The boxes, shown in
Figure 1, were designed with a linear scale factor of 1:5 and a surface scale factor of 1:25 with respect to a real room. They have the dimensions of 1.00 m × 0.60 m × 0.55 m and consist of five opaque walls and one glazed wall. The exterior was manufactured with plywood panels of 8 mm thickness painted entirely white, to make them highly reflective. The entire non-glazed inner surface of the boxes, also comprising the portion of the area behind the frame of the window, was heavily insulated with a lightweight rigid insulating material of 80 mm thickness, Stiferite GT, specific for thermal insulation in buildings. On the south facing wall, a glazed area of 42 cm × 37 cm can be allocated, the remaining of this surface being occupied by a wood frame 90 mm thick, to shield the thickness of the inside insulating panes.
Each box is instrumented to measure inside air temperature, illuminance and surface temperature of the inner and outer side of the glazed pane.
Temperature sensors are TT500 thermistors by Tecno.el s.r.l. (Formello (RM), Italy) with a wide temperature range (−30 to 120 °C), a resolution of 0.1 °C and an accuracy of ±0.2 °C. Illuminance is measured using a luxmeter by Delta Ohm s.r.l. with a measurement range of 200,000 lx, a sensitivity of 1.5 mV/k·lx and calibration accuracy less than 4%. Also, outside temperature and relative humidity, solar irradiance on the vertical plane and wind speed and direction can be measured using a portable weather station. Temperature and relative humidity are measured by a Rotronic Hygroclip2 sensor with accuracy of ±0.1 °C for temperature and of ±0.8% for relative humidity. Solar irradiance sensor is a silicon cell radiometer provided by Apogee Instruments with an accuracy of ±5% while wind speed and direction are measured using a model 7911 anemometer provided by Davis Instruments with an accuracy of ±1 m/s for speed and of ±7° for direction. Data are collected at a minute time rate.
The weather and solar station of ESTER lab (Lat. 41.9, Long. 12.6) [
32] also provides direct and diffuse solar irradiance measurements.
Table 1 lists the material properties used in STBs.
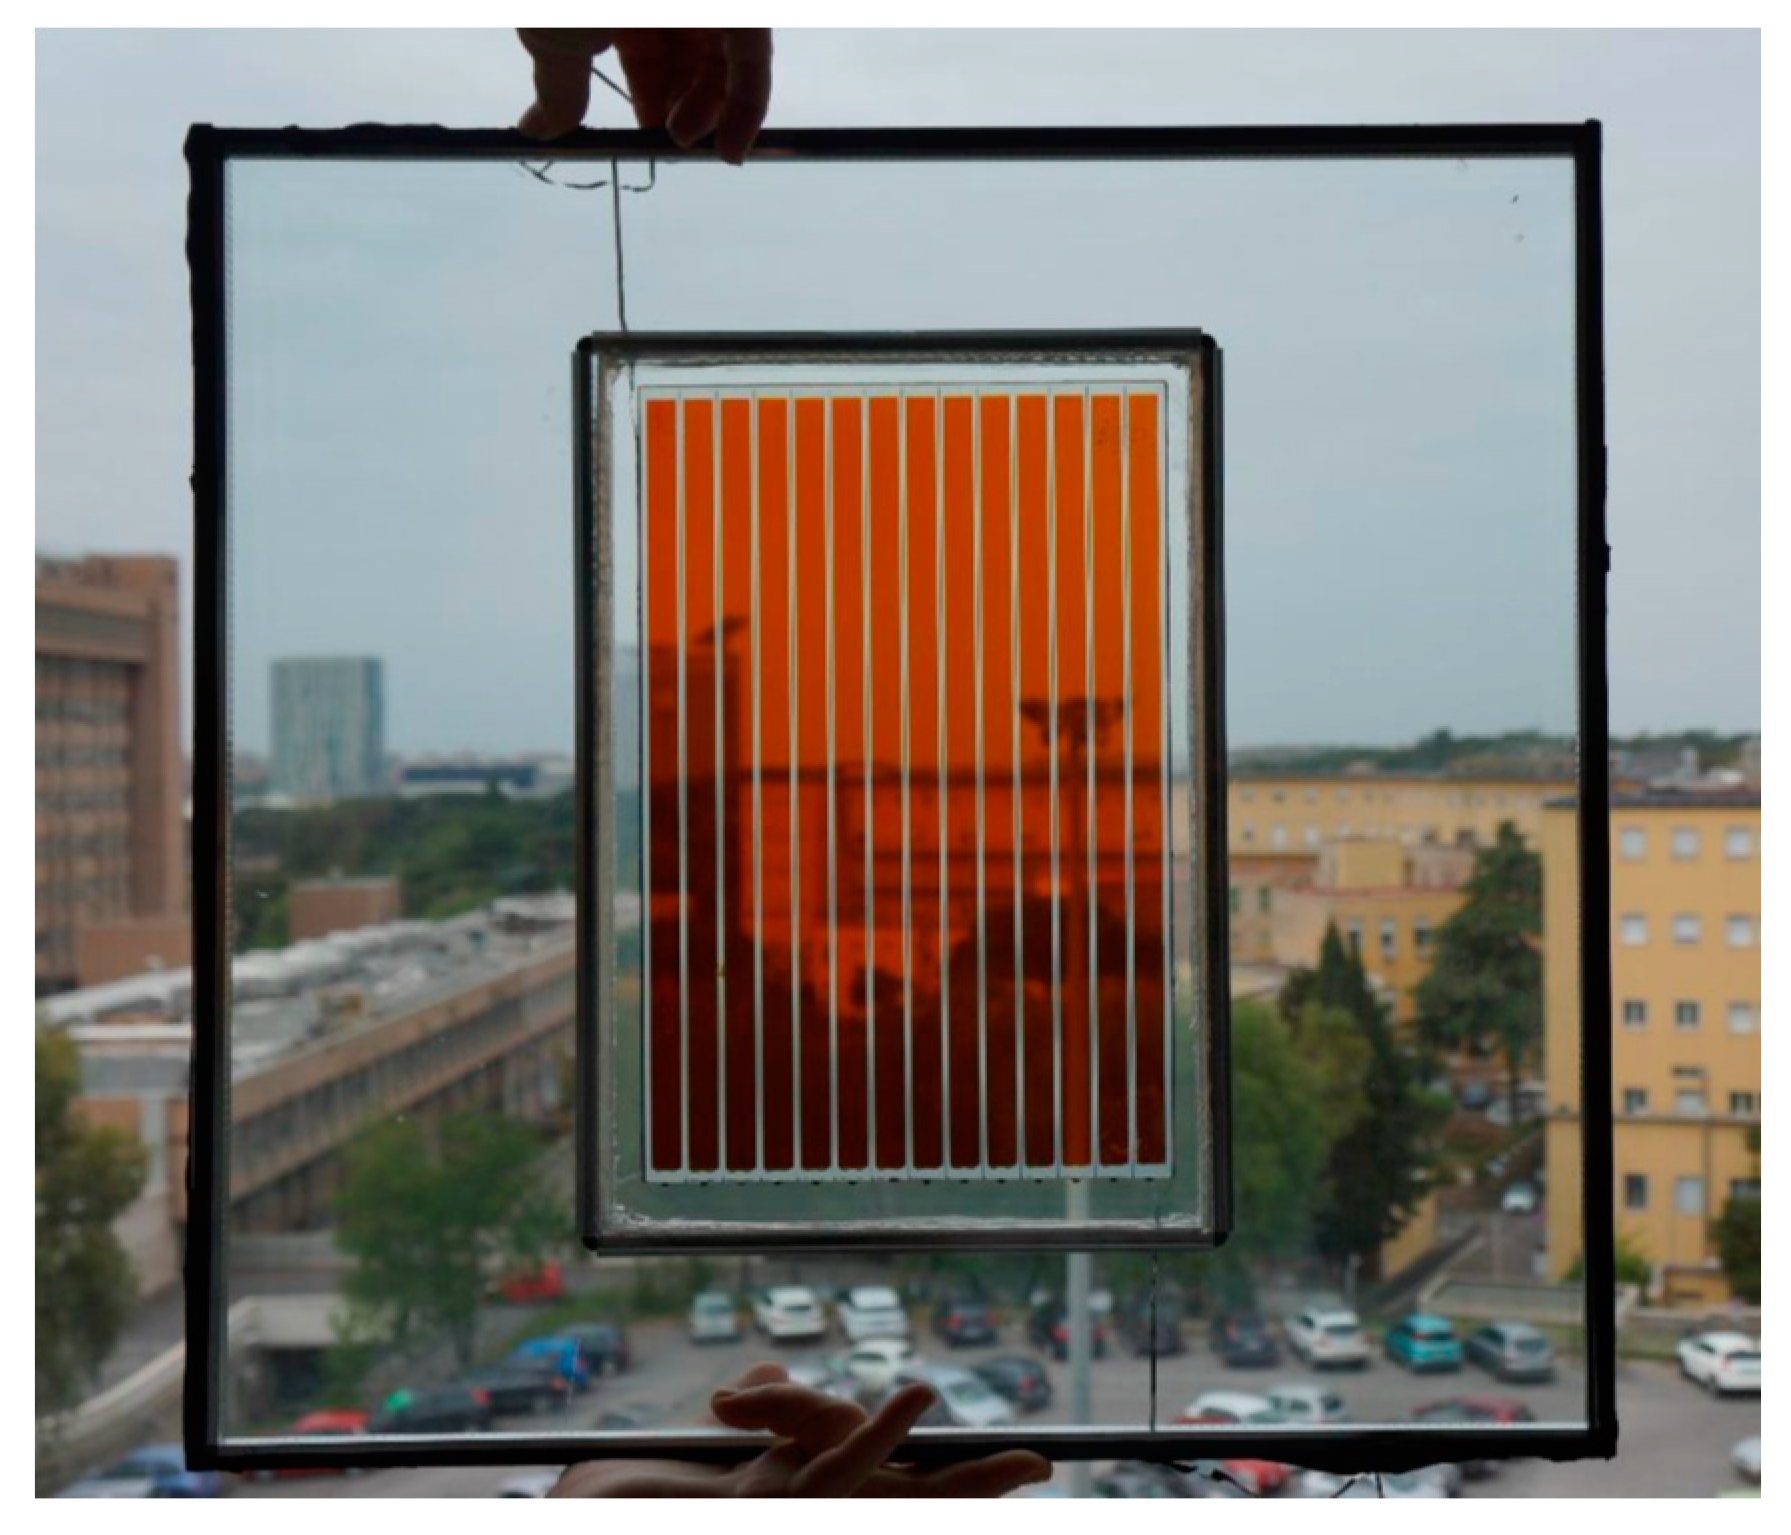
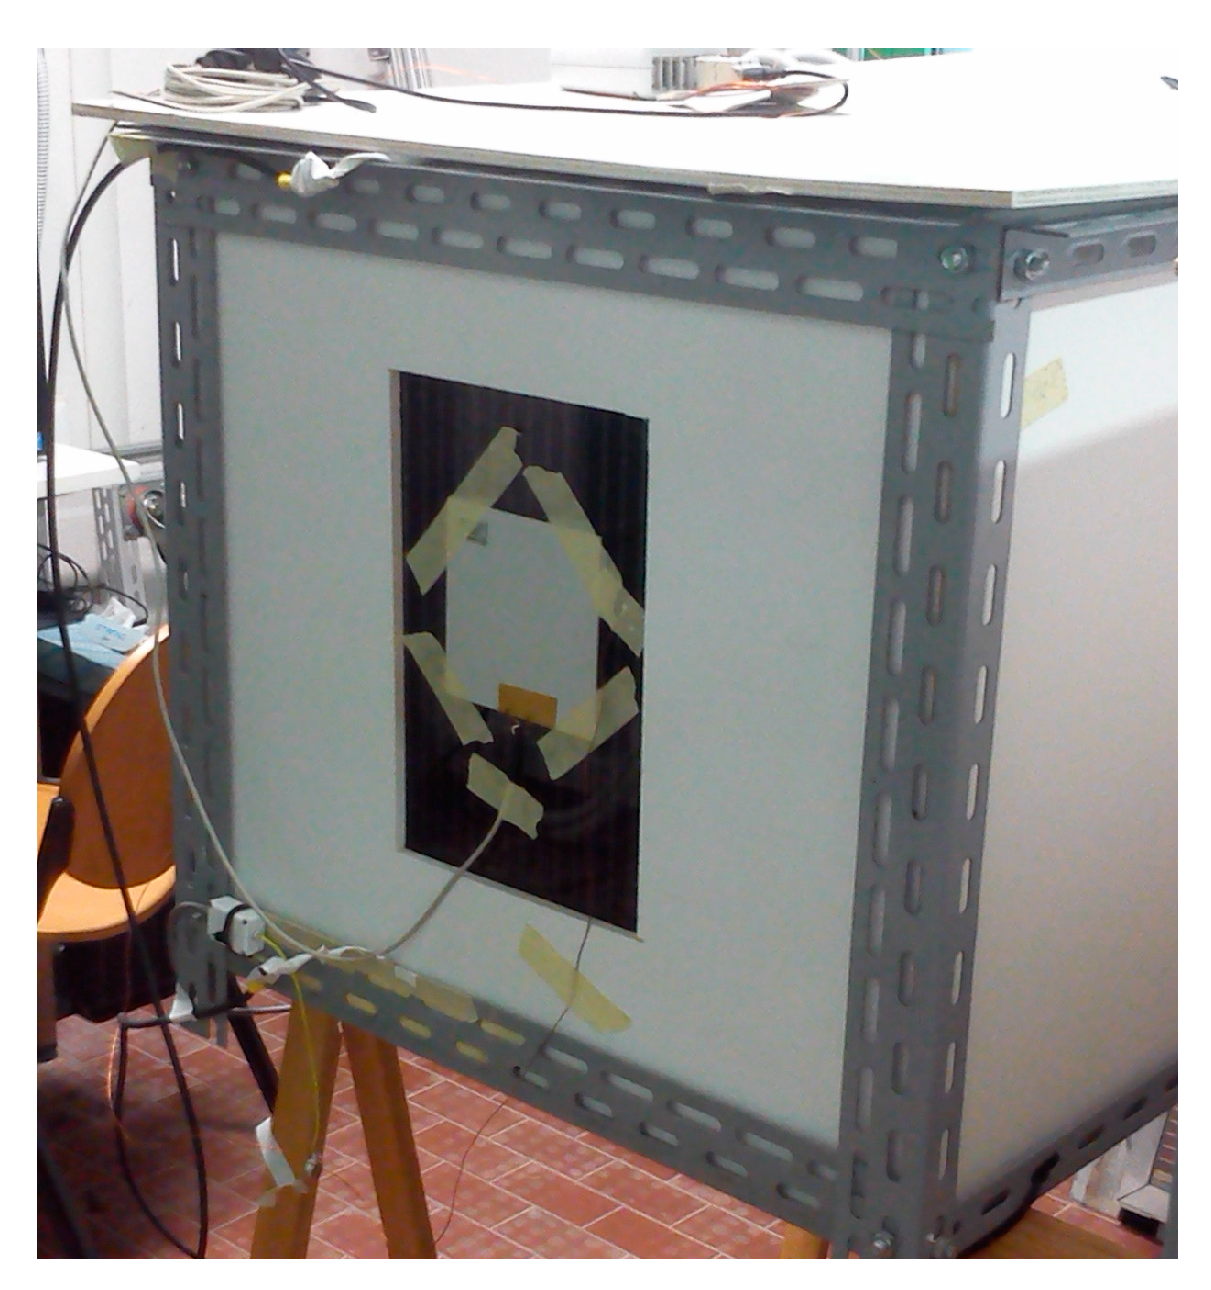
The experimental activity aimed to evaluate the electrical and thermal performance in real operating conditions of the DSC module (DSM) shown in
Figure 2. The active area of the module is 20 cm × 30 cm. In order to fit it into the glass pane of the STB, the DSM was inserted into a double glass pane as shown in the figure.
The electrical characteristics of DSM are listed in
Table 2. Current and voltage are evaluated at nominal conditions, i.e., at Standard Test Conditions (STC). STC are defined as irradiance of 1000 W/m
2, module temperature of 25 °C and irradiance spectrum correspondent to an air mass (AM) equal to 1.5.
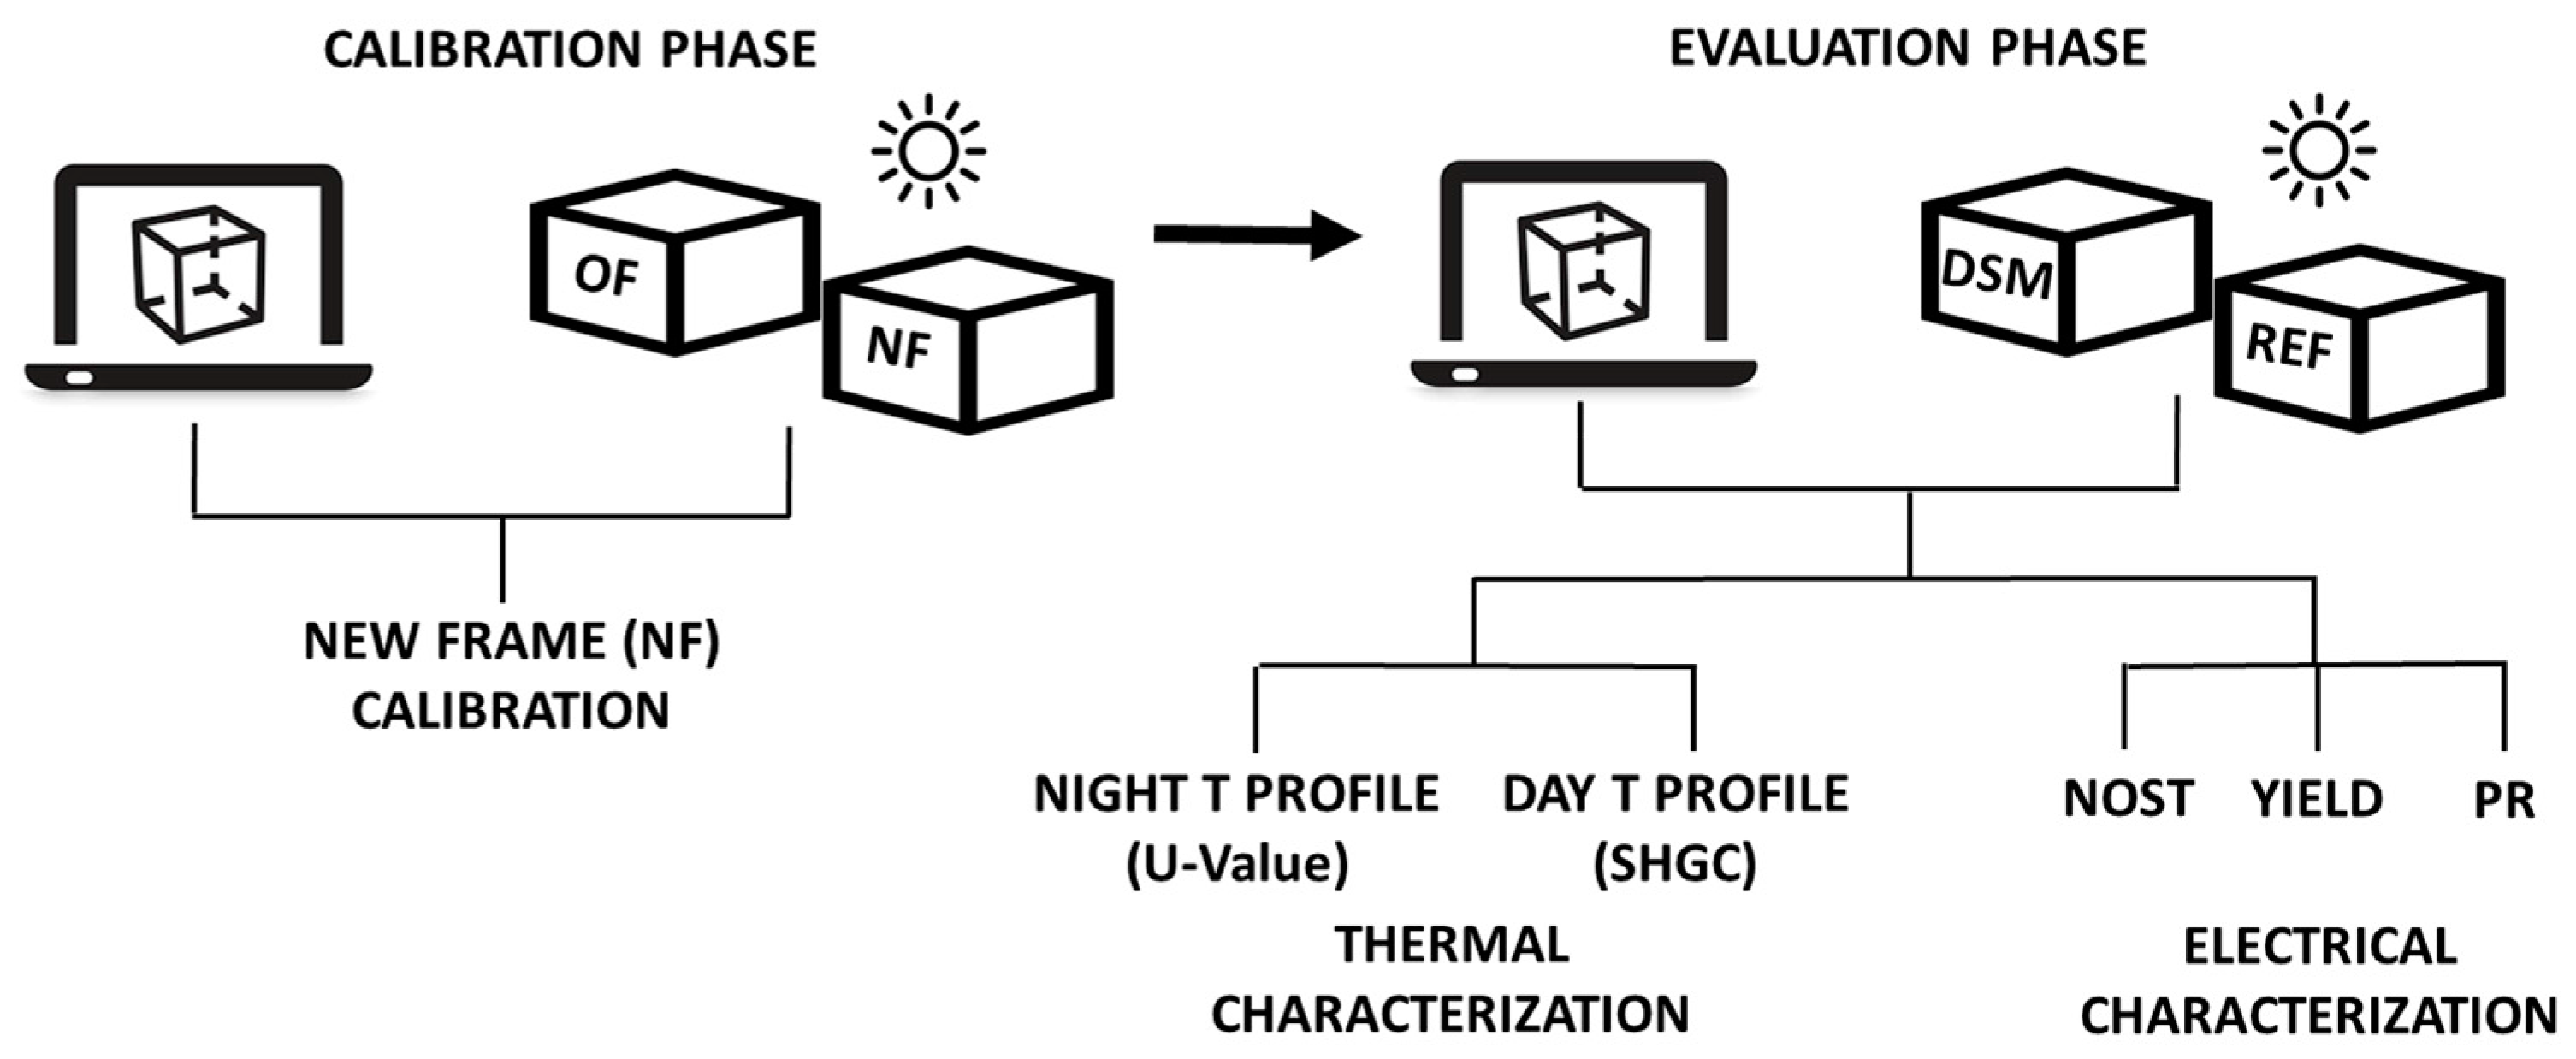
The methodology adopted for this study, schematically shown in the
Figure 3 workflow, consists of the combination of experimental data collection from STB and modeling with a dynamic simulation software. The process can be divided in two phases, calibration phase and evaluation phase. The calibration phase is preliminary to the evaluation one. Temperature data collected in one of the boxes, named “Reference” are used to calibrate the dynamic simulation model of STB. In the evaluation phase, the calibrated model allows to evaluate the U-value and SHGC of the material of unknown characteristics located in the second box, named “Test”. In particular, the night temperature profile is used to estimate U, since no contribution of the solar irradiance to the boxes’ thermal loads is present; the daytime temperature profile is used to evaluate SHGC.
In particular, since the DSM has to be the only glazed element hit by solar radiation, it was fundamentally providing the two boxes with a suitable wood frame to shield the glazed pane that hold the DSM. The new frame was bigger than the other used in previous tests of other materials [
31]. Owing to the flexibility of the method, it was possible to test a sample with different geometry simply calibrating the STB for the new configuration. Therefore, the calibration phase consisted of the calibration of the new frame (NF) with respect to the old one (OF) (
Figure 3). Air temperature data inside STB were collected and used for the calibration of the dynamic simulation model provided with NF.
Each phase is based on the fine-tuning of the air inner temperature profile measured inside the boxes with the one simulated by the model. The error is evaluated as the difference between these two trends: aim of this process is to minimize the error between the two data sets. The index used to compare experimental and simulated data is the root mean square error (RMSE), defined as:
where
n is the number of data,
is the
i-th measured value,
is the
i-th simulated value.
The Normalized Root Mean Square Error is defined as:
where
and
are respectively the maximum and the minimum data measured during the day where
RMSE index finds the lowest value.
To validate the results obtained for the U-value, an indoor test was also performed and the results are presented in the next section.
During the evaluation phase, the electrical characteristics of the PV glazed pane were also monitored, as shown in
Figure 1. DSM was connected to a MPPT3000 provided by ISAAC SUPSI, Lugano, CH. The device allows to keep the module to its maximum power point and to collect IV curves every 10 min during the outdoor campaign. IV curves were used to evaluate the nominal operative system temperature (NOST), the yield (
Y), the efficiency (
η) and the performance ratio (
PR) that are defined in
Section 4.
3. Thermal Characterization
3.1. Calibratin Phase
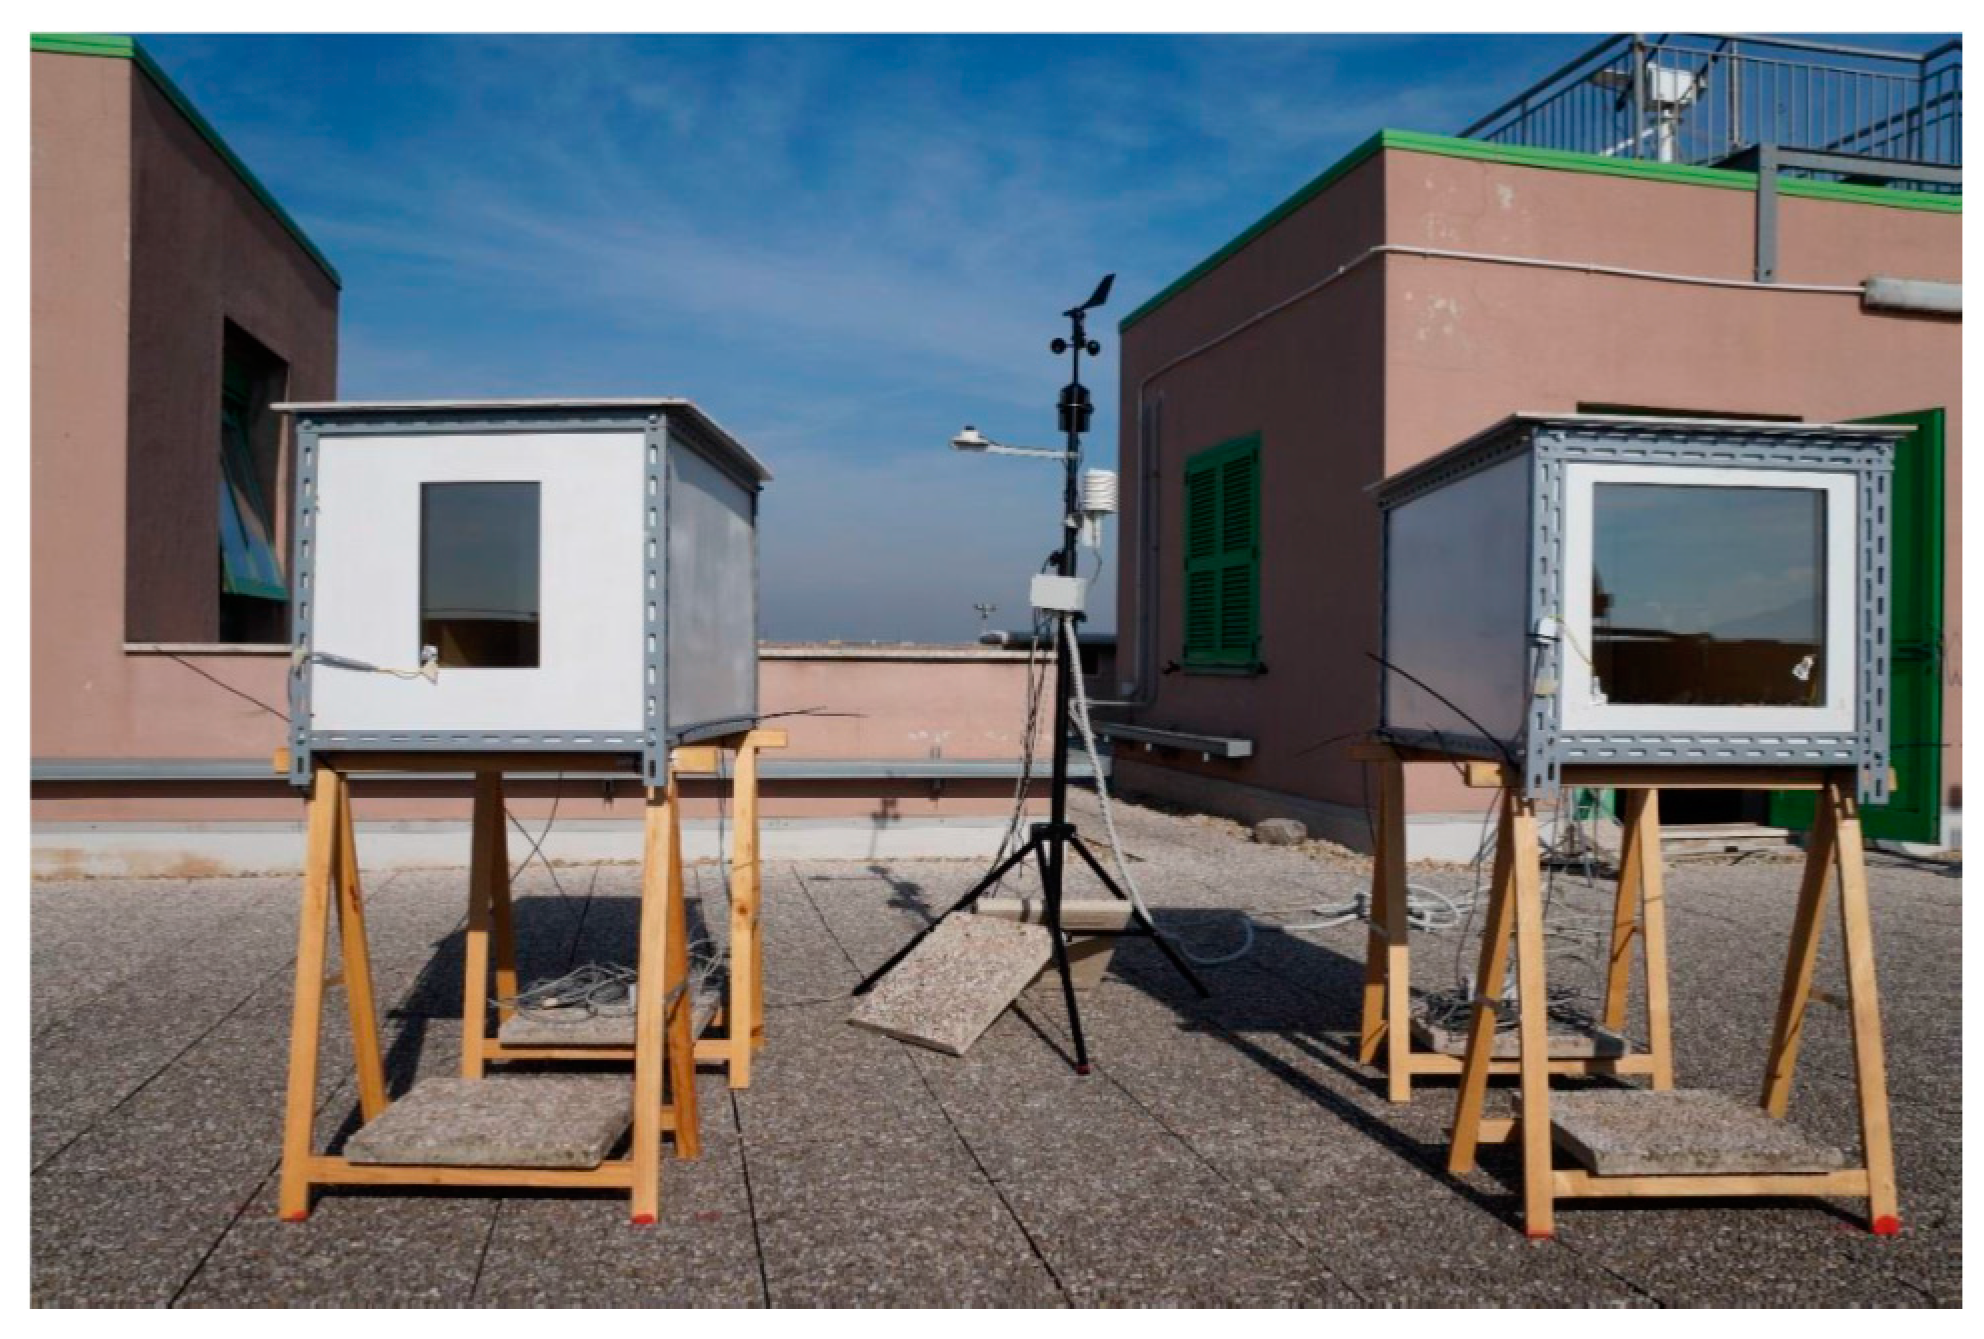
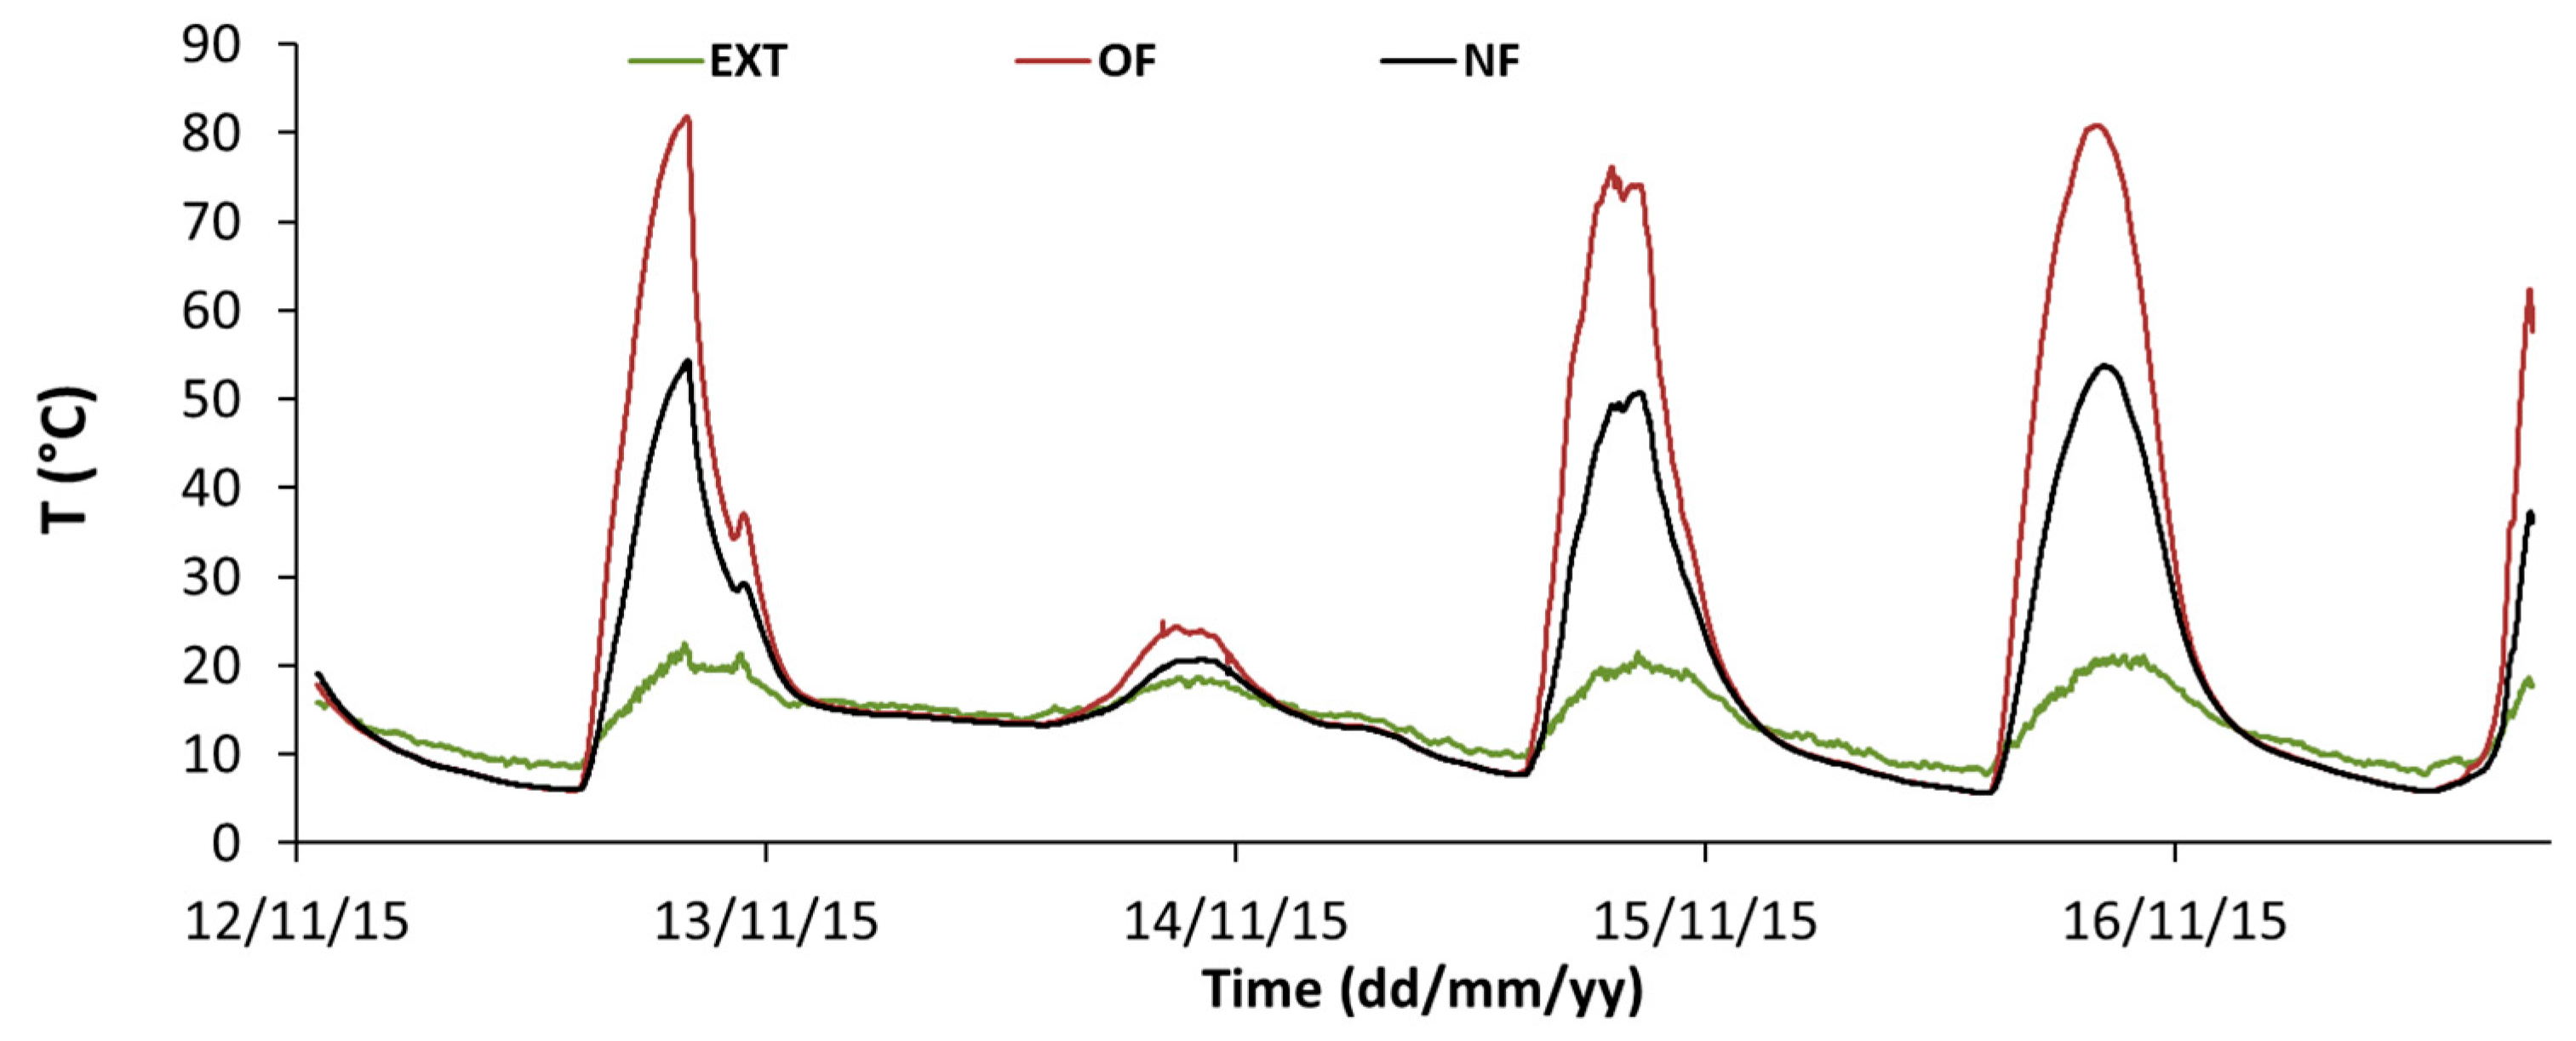
For the calibration phase a short-term monitoring campaign was carried out from 12 to 17 November 2015. The two boxes, one with the old framed (OF) and the other with the new frame (NF) were exposed outdoor as shown in
Figure 4. The weather was mostly sunny, with an exception for 14 November, that was mostly cloudy.
The boxes were positioned at ESTER lab, with two identical glazed elements (reference double pane) facing south. Meteorological measurements of outside air temperature and relative humidity together with wind speed and direction were also collected using the local station positioned beside the boxes. During the campaign, direct and diffuse solar irradiance, useful to run the dynamic simulation, were acquired by a Kypp and Zonen first class CH1 pyrheliometer and a secondary standard CM21 pyranometer, respectively, mounted on a 2AP suntracker available at ESTER lab. Air temperature data inside STB were collected and used for the calibration of the dynamic simulation model provided with NF.
Figure 5 shows the trends of outside and inside air temperatures monitored in the two STBs equipped with the reference glazed pane and the two different frames. The inside temperature of both boxes raised up to 50° and more, due to the high insulation properties of the materials and the solar heat gain of the glazing. In particular, the inside temperature of the old framed STB (OF) reached almost 80 °C, or more, while the new framed STB (NF) did not exceed 50 °C. This difference is explained by the reduction of the glazed surface due to the new frame.
As a first validation check, the air temperature trend inside the old framed box (OF) was compared with the simulation data provided by the STB original model to verify the old calibration accuracy. A RMSE of 2.72 °C was obtained over the whole period of test with a NRMSE of 4% indicating a good agreement with the original calibration [
31].
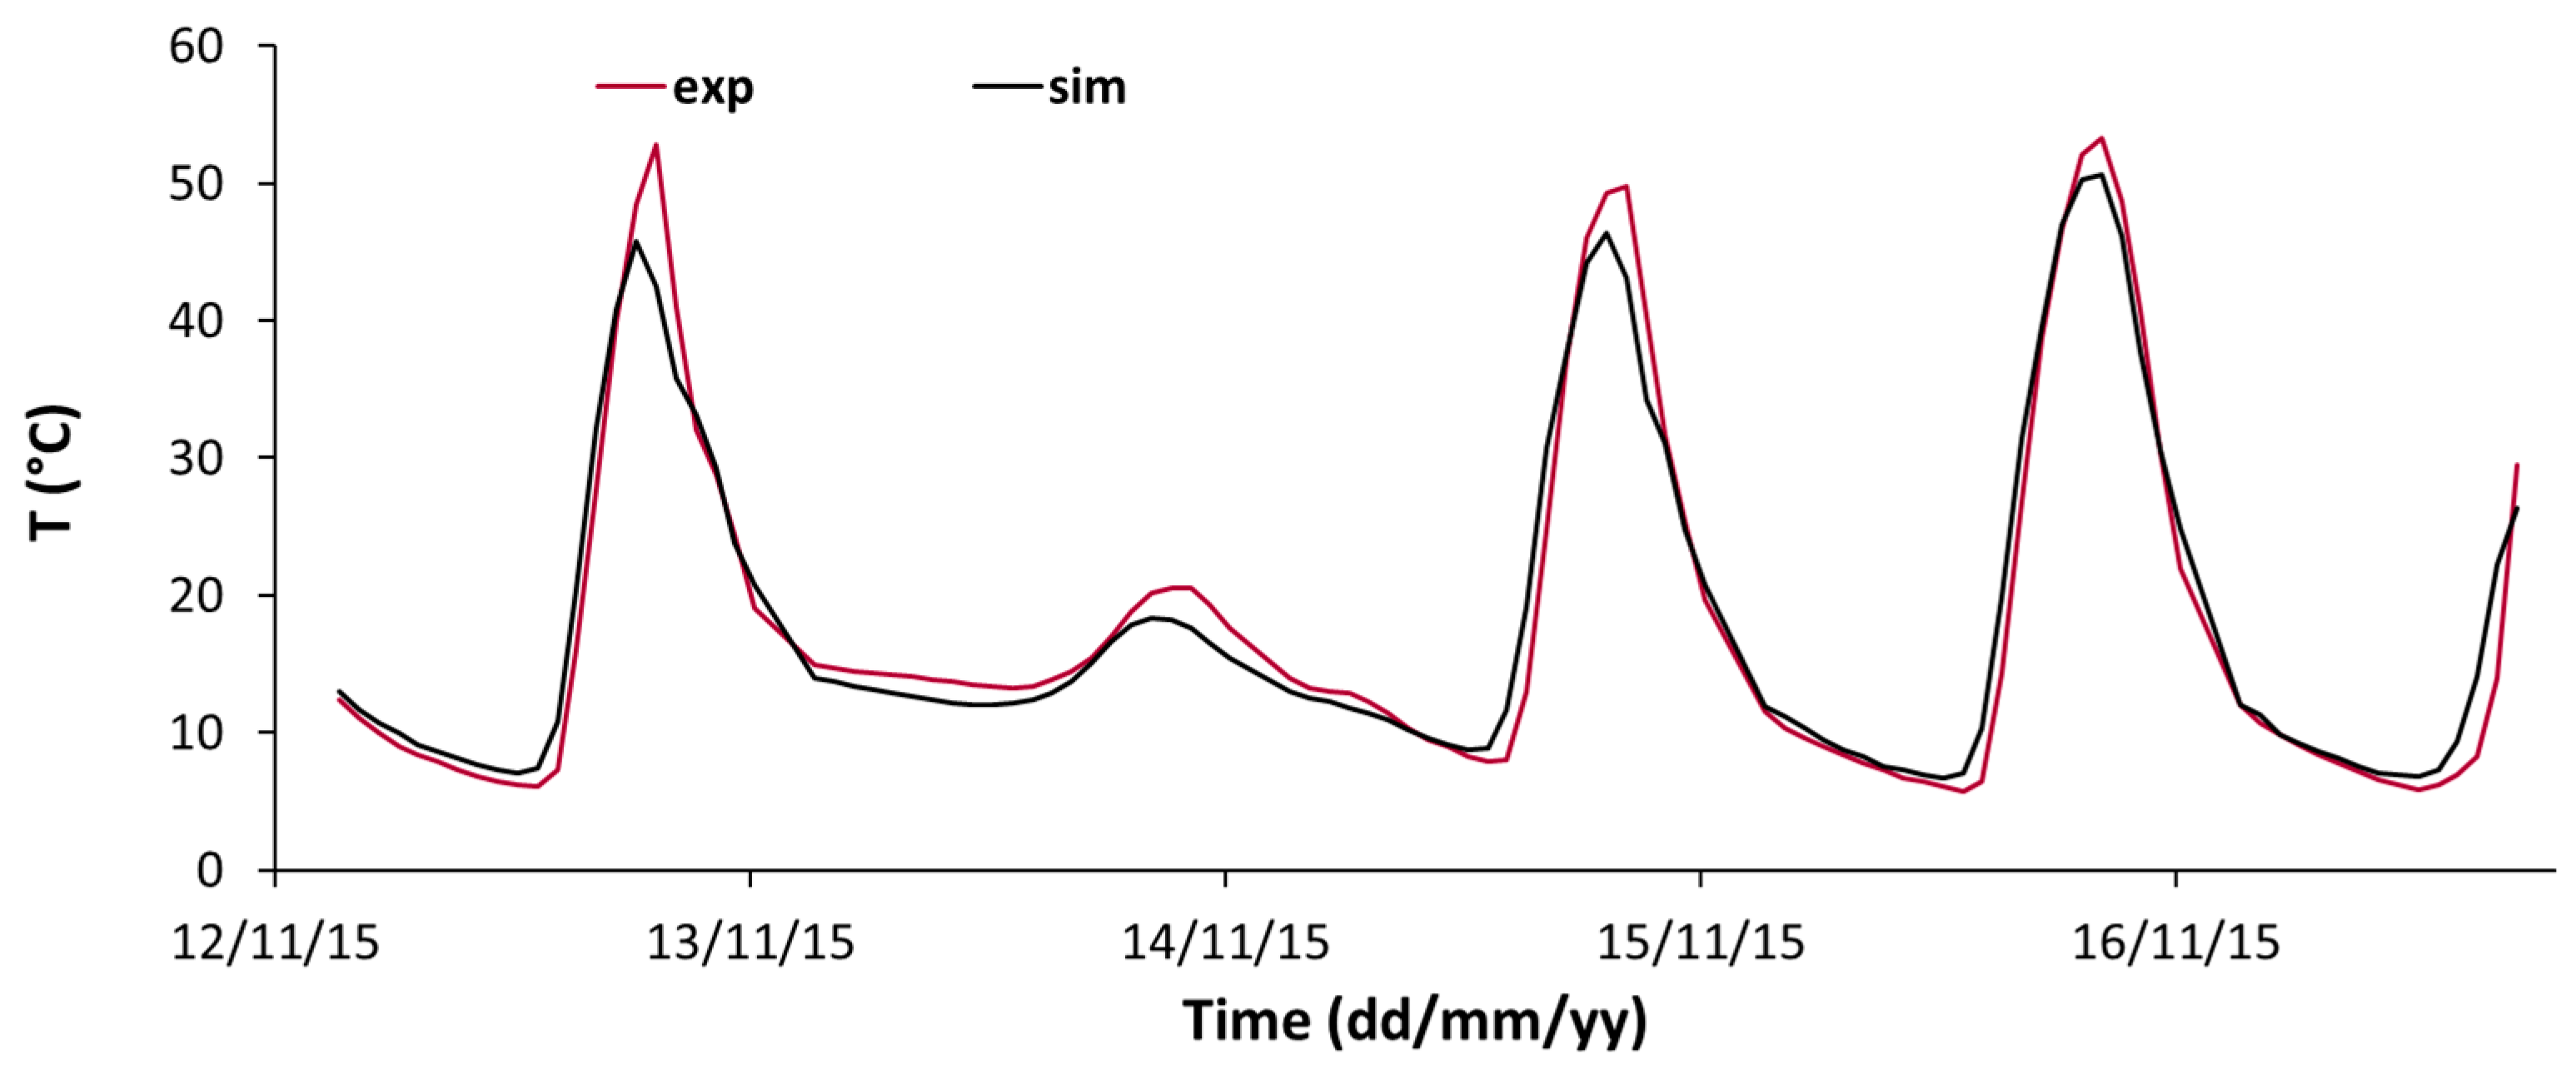
To calibrate the new framed (NF) box, the inside air temperature obtained by the STB simulation model was compared with the experimental data; the U-value of the frame and the ratio of opaque over glazed area (frame fraction) were changed in the model till the RMSE reached a minimum. The nighttime period model was used to evaluate the thermal transmittance considering a fixed value of frame fraction. The minimum rate of night RMSE calculated, defined the U value which minimized the error, U = 2 W/m²·K. The U value was then input into the daytime model so that the air temperature trends simulated varied accordingly to the frame fraction value. The minimum daily RMSE value calculated, defined the frame fraction searched to: F = 0.55.
Figure 6 shows the inside air temperature trends of the new framed STB after calibration. A RMSE of 2.56 °C was obtained with a NRMSE of 5.4% over the all period of test.
Although the real frame fraction value calculated by the actual geometry of the frame was F = 0.62, the best-rated value was 0.55. This difference is probably due to the thermal behavior of the frame-glass sandwich that was taken into account in some way by the model.
3.2. Evaluation Phase
The evaluation phase was carried out from 11 to 21 April, 2016. The boxes were equipped with the new larger frame, one with the reference double glazed pane (REF) and one with the DSM (DSM), as shown in
Figure 1.
The evaluation phase allowed determining U and SHGC of the DSM sample using data collected during the corresponding monitoring campaign. The U-value was evaluated using the nighttime temperature trend inside the DSM STB while the SHGC was determined using the daytime inside air temperature trend. Weather conditions were mostly variable; 15 April was a clear day while the 18th was mostly cloudy. Maximum outside air temperature experienced during the period was 26 °C while the minimum, during the night, was 10 °C, over the whole period. The temperature range varied between 5 °C and 13 °C.
The weather data collected during the monitoring campaign were used to produce the climatic file needed to run the simulation model.
Data collected in the REF box where used to validate the calibration carried out in November. The RMSE and NRMSE evaluating the whole period of test were equal to 2.79 °C and 6.7% respectively, confirming the repeatability of the calibration procedure.
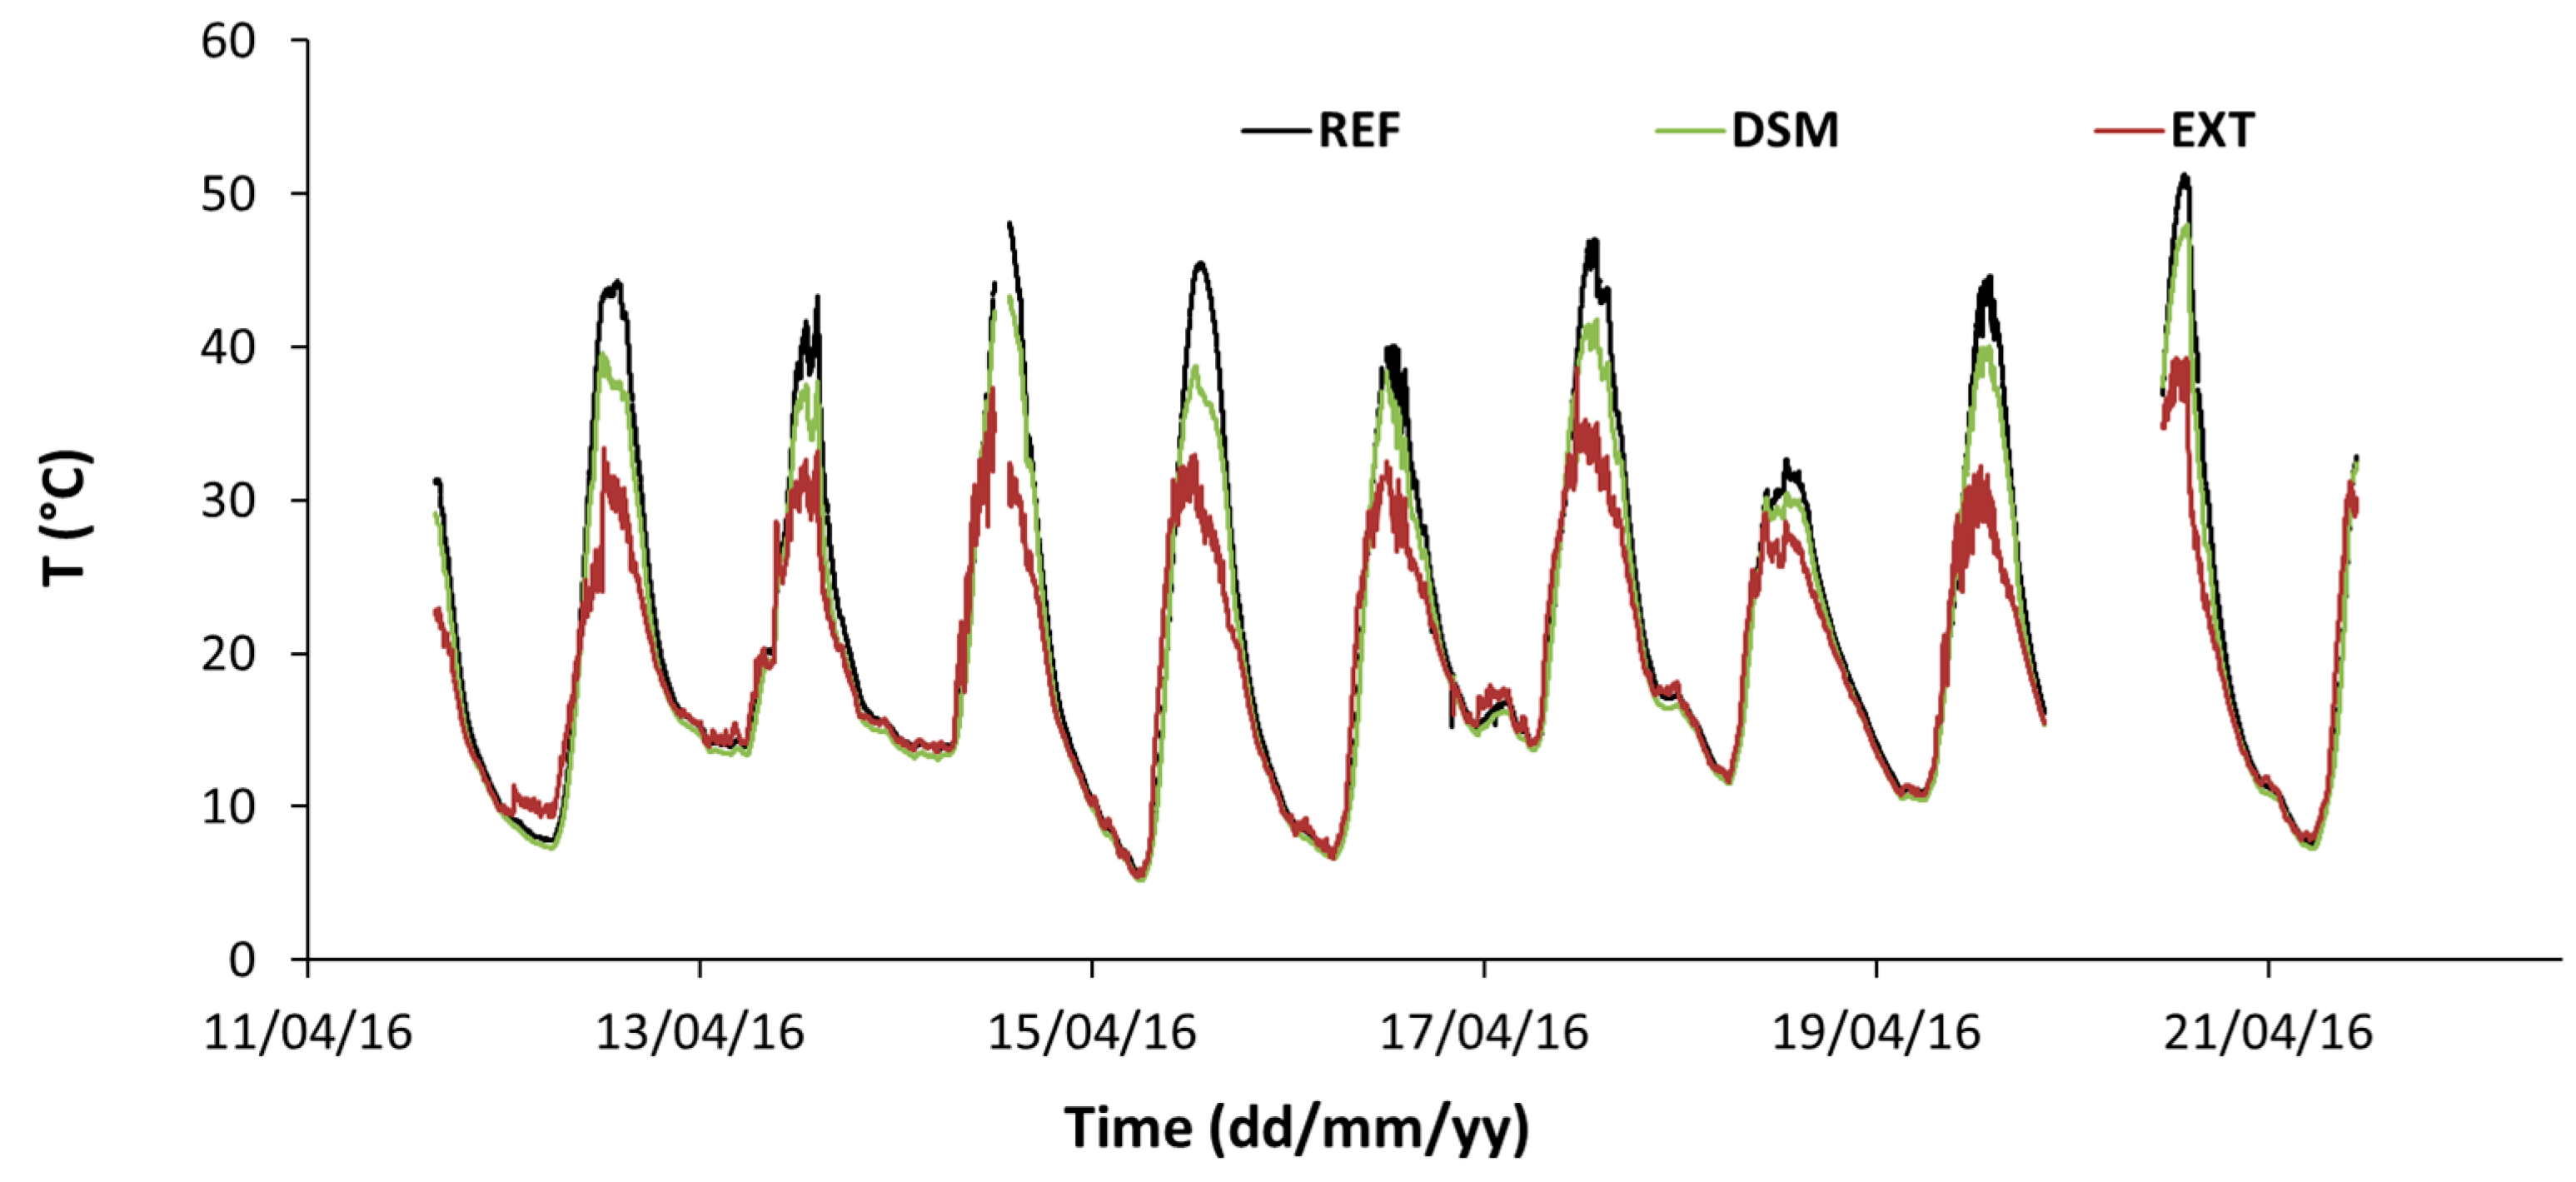
Figure 7 shows the inner temperature trends of the REF and DSM boxes, together with the outside air temperature (EXT). During the monitoring campaign, some data collected got lost, as can be seen in the shown trends, due to sensors malfunctioning. The outside air temperature reached almost 26 °C, as already evidenced. As it was expected, the inside temperature of reference glazed pane rose up to 45 °C while the test box equipped with DSM kept the inside temperature lower.
It is interesting to note that during the night, inside air temperature of both boxes was lower than outside air temperature. This is due to radiative heat transfer of the glass pane with respect to the sky dome.
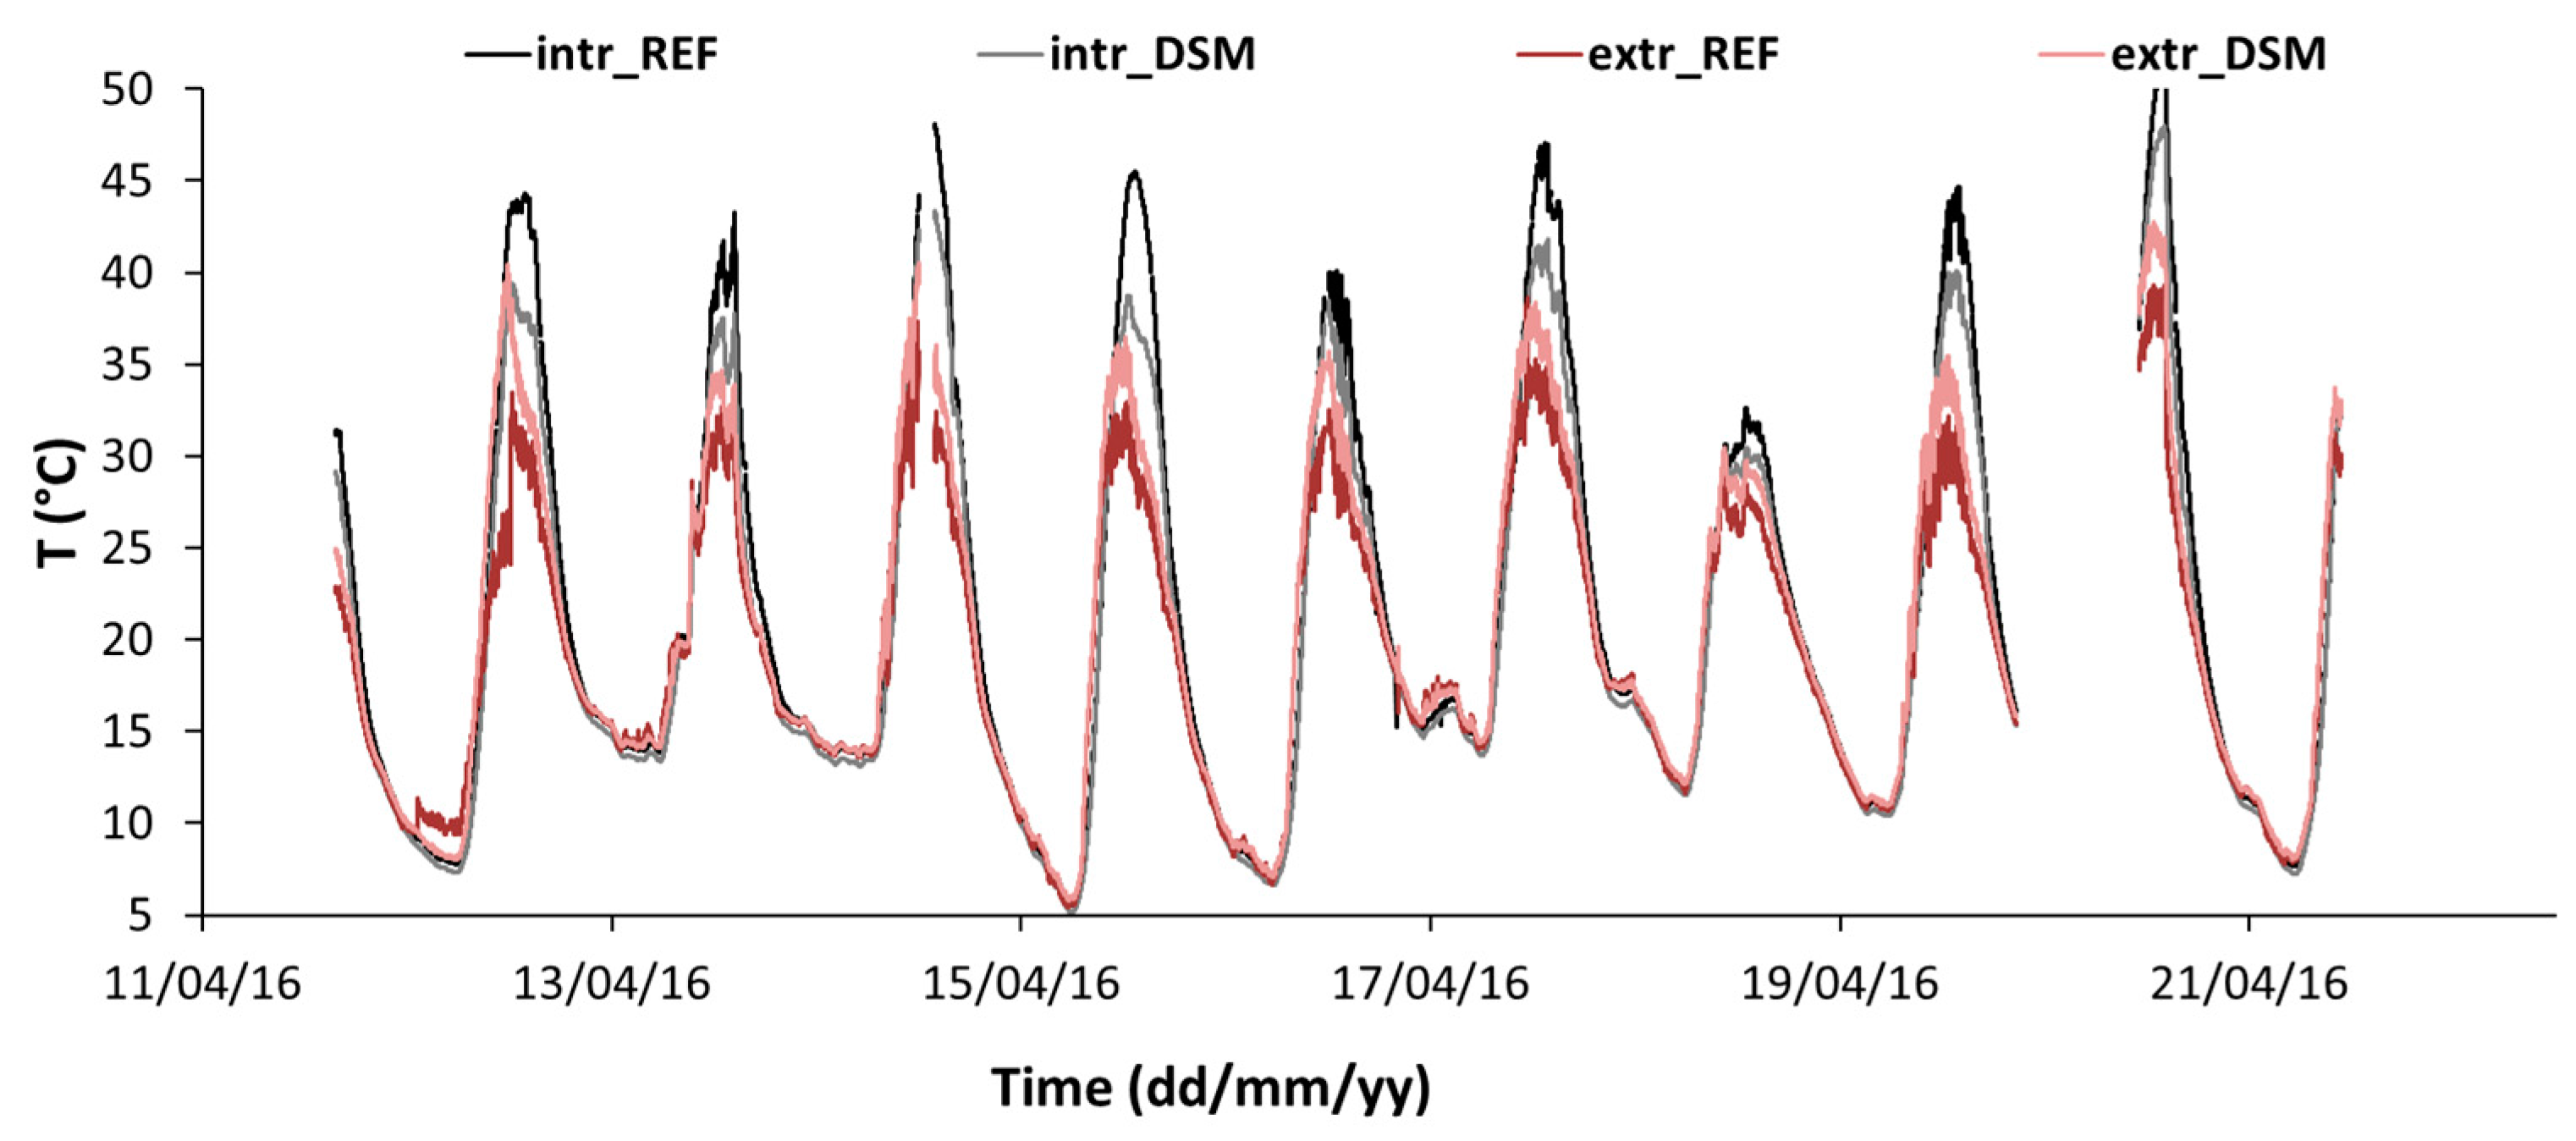
Figure 8 shows the intrados and extrados surface temperature, for REF and DSM. Both STBs show intrados temperature higher than extrados; this behavior depends on the heat dynamics between outdoor and indoor as well as on the thermal properties of the glass [
33]. Moreover, extrados temperature of DSM is higher than REF and this is probably due to different absorption and transmission coefficients to solar radiation of the two glazed system in the different parts of the solar spectrum [
22].
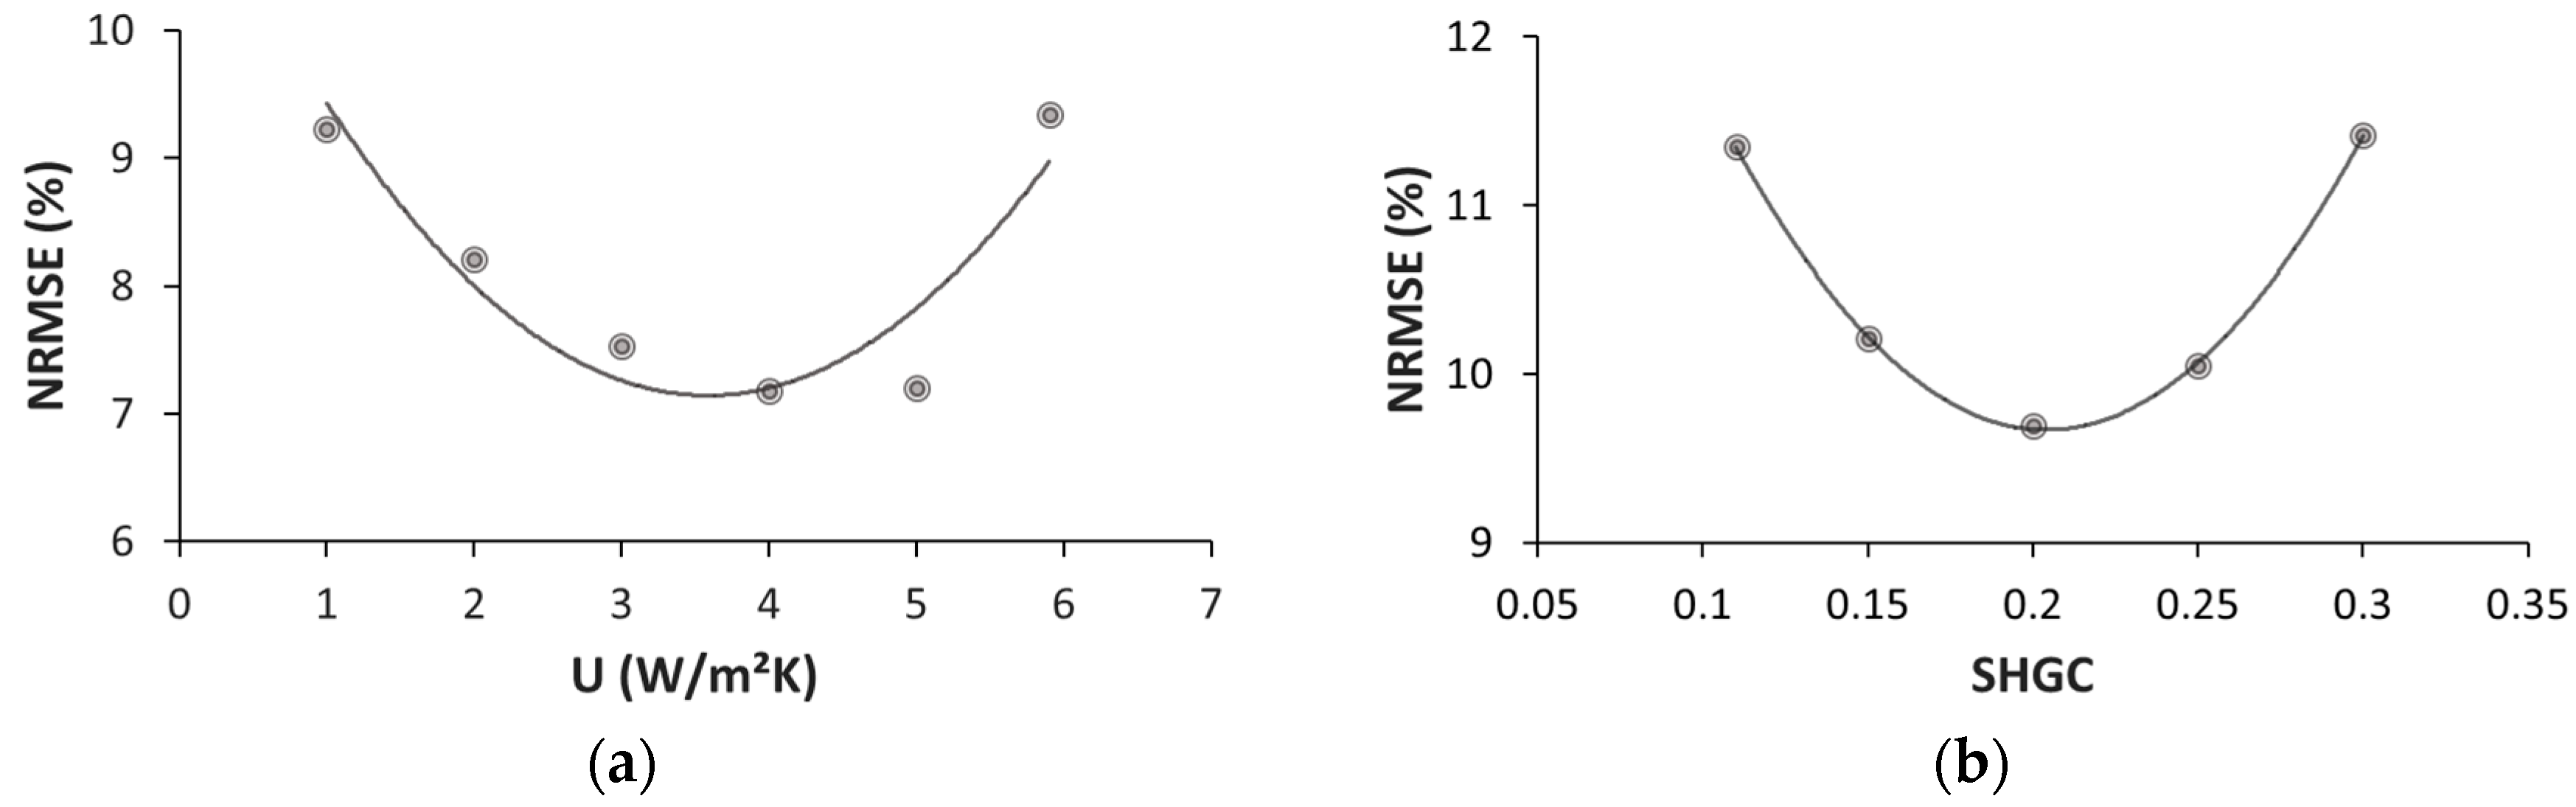
The U-value was calculated through a minimization process of the NRMSE between simulated and calculated night temperature profiles. The calculation of the simulated night temperature profile used different guessed test sample U-values used as model input. A wide range of possible U-values was considered, spanning from 1 to 6 W/m²·K. A simulation was run for each guess and each simulated temperature profile obtained was compared to the measured one calculating the NRMSE.
Figure 9a shows the NRMSE values obtained for the various runs versus U values. As expected, the trend can be approximated by a parabolic trend. Although the fit is not as good as expected due to the presence of some outliers, the minimum can be found representing the sought value, U
DSM = 3.6 W/m²·K.
The U-value obtained is used as input of the daytime model and the SHGC was calculated with the same minimization process used for the U-value.
Figure 9b shows the values obtained for the various runs versus SHGC values. The parabolic trend allows evaluating SHGC = 0.2.
It can be observed that for a NRMSE variation of 1% around the minimum, a great indetermination of the U and of the SHGC parameters is obtained. The firstly U-value indetermination directly affects the SHGC evaluation. This is mainly due to the low sensitivity of the method to the U-value calculation owing to the small heat flux put into play during the process [
31]. For this reason, and also considering the poor fit obtained in
Figure 9a, an additional measurement of the U-value was carried out with the same box in indoor conditions to validate the result.
Moreover, it has to be pointed out that the prototype tested is a combination of simple glass pane and DSM so that the results could be influenced by the particular configuration considered. However, this is one of the few characterizations of a DSM in real operating conditions and, even if with its limitations, it can give an indication of the thermal behavior of the system. However, the SHGC value found is in line with what is found in the literature for similar devices [
29]. Future improvement of the test will consist in the evaluation of various prototypes with different configurations to investigate the assembly influence.
3.3. Indoor Measurements of U-Value
Validation of the U-value outdoor evaluation was carried out using another method in an indoor environment. The measurement was performed on both boxes, REF and TEST in order to check the validity of the method and the U-value of the DSM. A heat flux sensor (Albhorn, mod. MA259035) was applied to REF box which glazed system had known thermal properties (U-value of the glass, Ug = 2.8 W/m
2·K) to verify the capability of the method. Two temperature sensors provided by the heat flux measurement kit where attached to the inside and outside surface of the glass. A laboratory hotplate with controlled temperature was inserted into the box. In this way, a temperature difference was created between the inside of the box and the outside laboratory. Temperature and heat flux data were acquired for three hours at a time rate of 30 s, till the steady state was reached. U-value of the glass was calculated averaging the data referred to the steady state. According to EN673 [
34], the Ug was calculated considering the standard global heat transfer coefficients for the inside and outside. Using this method, Ug = 2.77 ± 0.03 W/m
2·K which perfectly fits the results obtained with the outdoor method. The same procedure was then repeated using the DSM box (
Figure 10). The U-value obtained for DSM is U
DSM = 3.68 ± 0.02 W/m
2·K confirming what obtained with the outdoor method.
4. Electrical Characterization
According to the electrical specifications provided by the manufacturers, the DSC module exhibits the nominal characteristics listed in
Table 2 with a nominal power declared by the manufacturer, P = 1.47 W. The electrical characterization consisted of the evaluation of the nominal operative system temperature (NOST), the calculation of the temperature coefficients and the evaluation of the energy performance during the period of the test. The I–V characteristic curve visualizes the operating voltage and electricity values of the module.
Figure 11 shows the I–V curves, one per day, from 12 April till 20 April, collected in the central part of the day, when the module experienced its maximum production. As expected, the maximum current is increasing with global irradiance while the voltage, which mainly depends on temperature and poorly on irradiance, remains almost constant.
4.1. Performance Indices
To evaluate the performance of PV modules, a set of indices can be considered. The main index used in the absence of direct measurements on the module is the efficiency at standard test conditions (STC). These conditions are values of irradiance (1000 W/m2), module temperature (25 °C) and air mass (AM 1.5) considered as reference for module property evaluation.
The efficiency at STC is defined as:
where
Pnom is the nominal power (or peak power) at STC,
A is the surface area of the module and
GSTC is the irradiance of 1000 W/m
2. This efficiency can be derived from the specification given by the manufacturer or can be evaluated through indoor measurements using a sun simulator [
35].
When the PV module is working in the real environment at its maximum power point its real efficiency can be defined as follow:
where
Pmax is the PV module electrical power produced at the maximum power point of operation and
Gpoa is the corresponding value of plane of array irradiance. The abovementioned indices evaluate the module performance instantaneously but they can also give information about the performance in a defined period of time. In this case, instead of electrical power and irradiance, the correspondent energy values in the defined period of time (day, month, year) have to be evaluated. The efficiency indicates the performance of a device but it does not give indications about its energy production. To evaluate and to compare the energy production of different modules of different power sizes, the energy yield is commonly used. The energy yield (
Y) is written as:
where
E is the electrical energy produced by the module in a defined time interval and
Pnom is the nominal power. This index can also be interpreted as the number of hours in which the PV modules work at their peak power value. Since the energy production is normalized to the module size, this index allows comparing PV devices of different peak powers.
The energy production of a PV module does not depend only on radiation intensity but also, to some extent, on the temperature of the module, on the variation of solar spectrum and also on other factors that do not strictly depend on the module itself. To take into account all these influences, another index called performance ratio (
PR) is defined, [
36]:
Yr is called the reference yield and is the ratio between the solar irradiation,
I, evaluated in the considered time interval and the solar irradiance at STC; it also represents the sun peak hours defined as the hours in which the in plane irradiance has reached 1000 W/m
2. The
PR index can also be seen as the ratio of the real efficiency over the efficiency at STC, and for this reason, it measures how far the behavior of the module is with respect to its performance at STC. As already mentioned, this index is not sensitive to irradiance variation but to secondary effects on the module performance.
4.2. NOST
Rating the NOST of the module is helpful to help expect future decay of the photovoltaic conversion. NOST can be seen as the optimal operation temperature of the module. It is defined according to the nominal operating cell temperature (NOCT) [
37]: NOCT is defined for an open-rack mounted module in the following standard reference environment: –tilt angle: 45° from the horizontal; –total irradiance: 800 W/m
2; –ambient temperature: 20 °C; –wind speed: 1 m/s; –no electrical load: open circuit. NOST differs from NOCT only because it is evaluated when the module circuit is closed on an electrical load [
38]. NOCT and NOST can be used by the system designer as a guide to the temperature at which a module will operate in the field, and it is therefore, a useful parameter when comparing the performance of different module designs. However, these indexes are directly dependent on the mounting structure, irradiance, wind speed, ambient temperature, reflections and emissions from the ground and nearby objects, etc. In the present case, the same procedure indicated in [
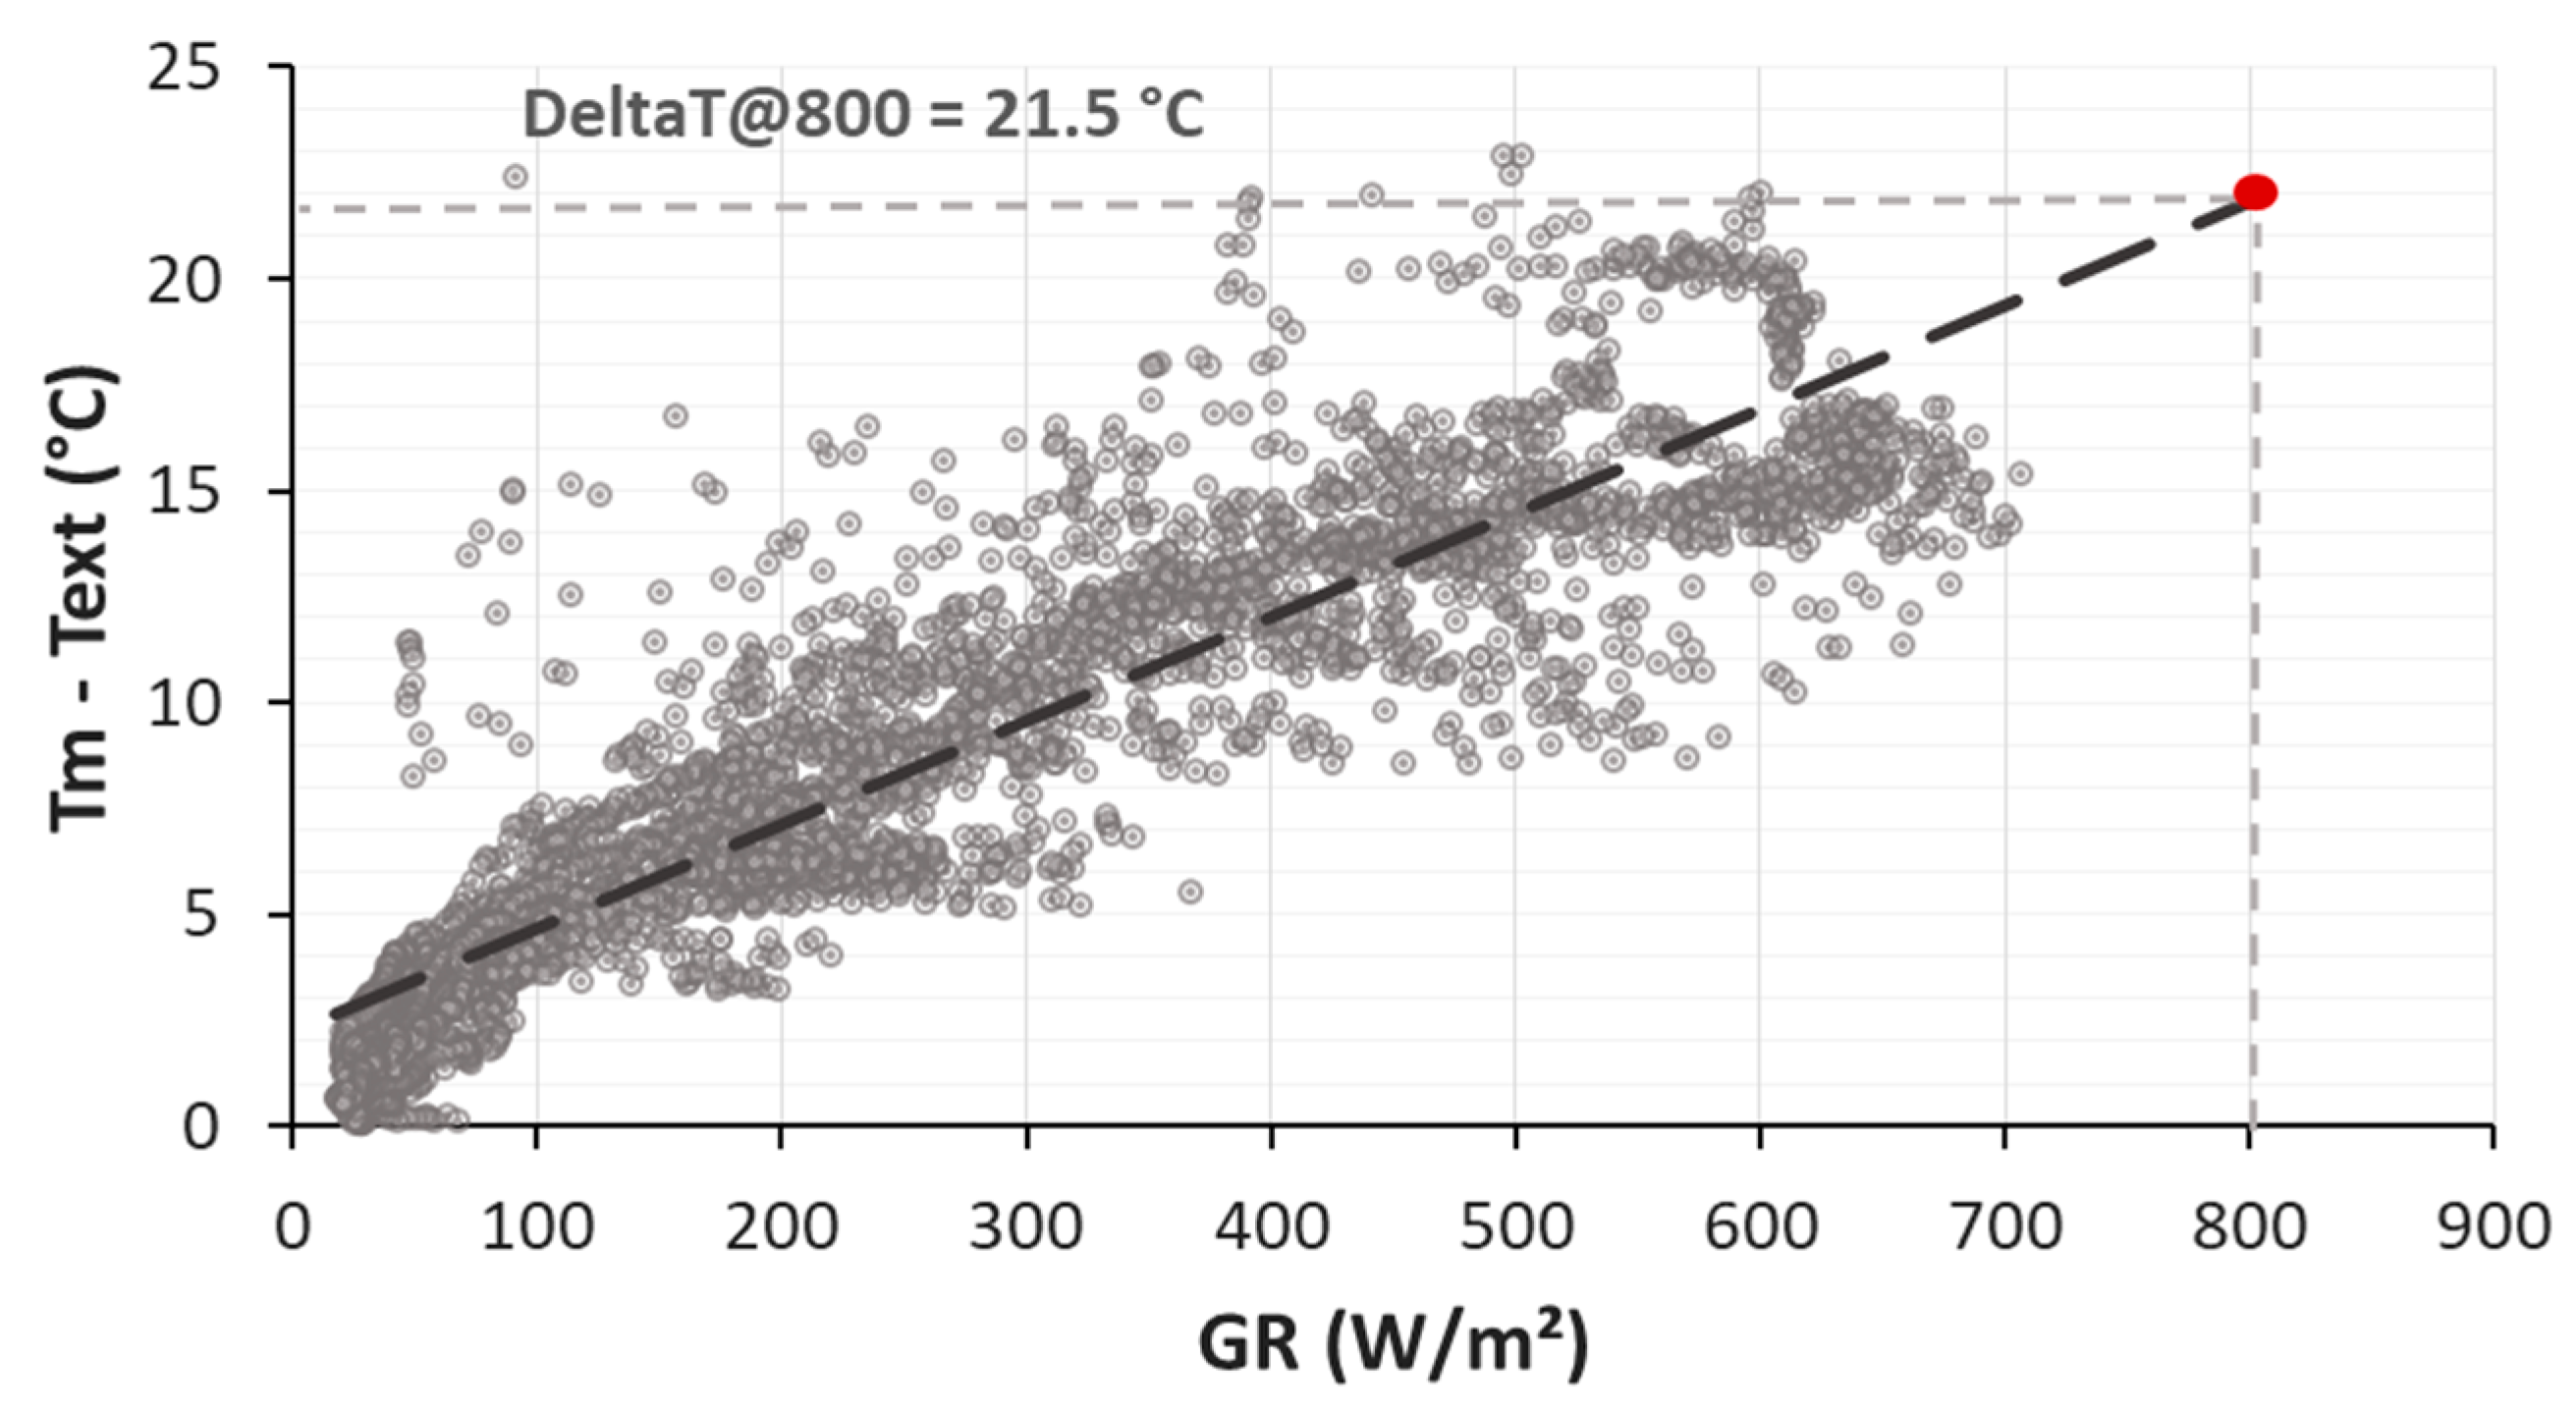
37] was used, however, the mounting configuration substantially differs from the one prescribed in the norm. For this reason, the value obtained is not compliant with the norm but can give a good indication of the operation temperature of the module. The method consists of the measurement of the temperature difference between the DSM inner surface (Tm) and the outside air temperature. This value is graphed versus the plane of the module irradiance, as shown in
Figure 12. A linear interpolation of the data allows evaluating the temperature difference at the irradiance value of 800 W/m
2. The NOST value is calculated from this temperature difference considering an outside air temperature of 20 °C. The value obtained is T(NOST) = 41.5 °C. For standard crystalline PV modules NOCT usually ranges between 40 °C and 50 °C (typically 45 °C). NOST values can be lower than NOCT [
38].
4.3. Temperature Coefficients
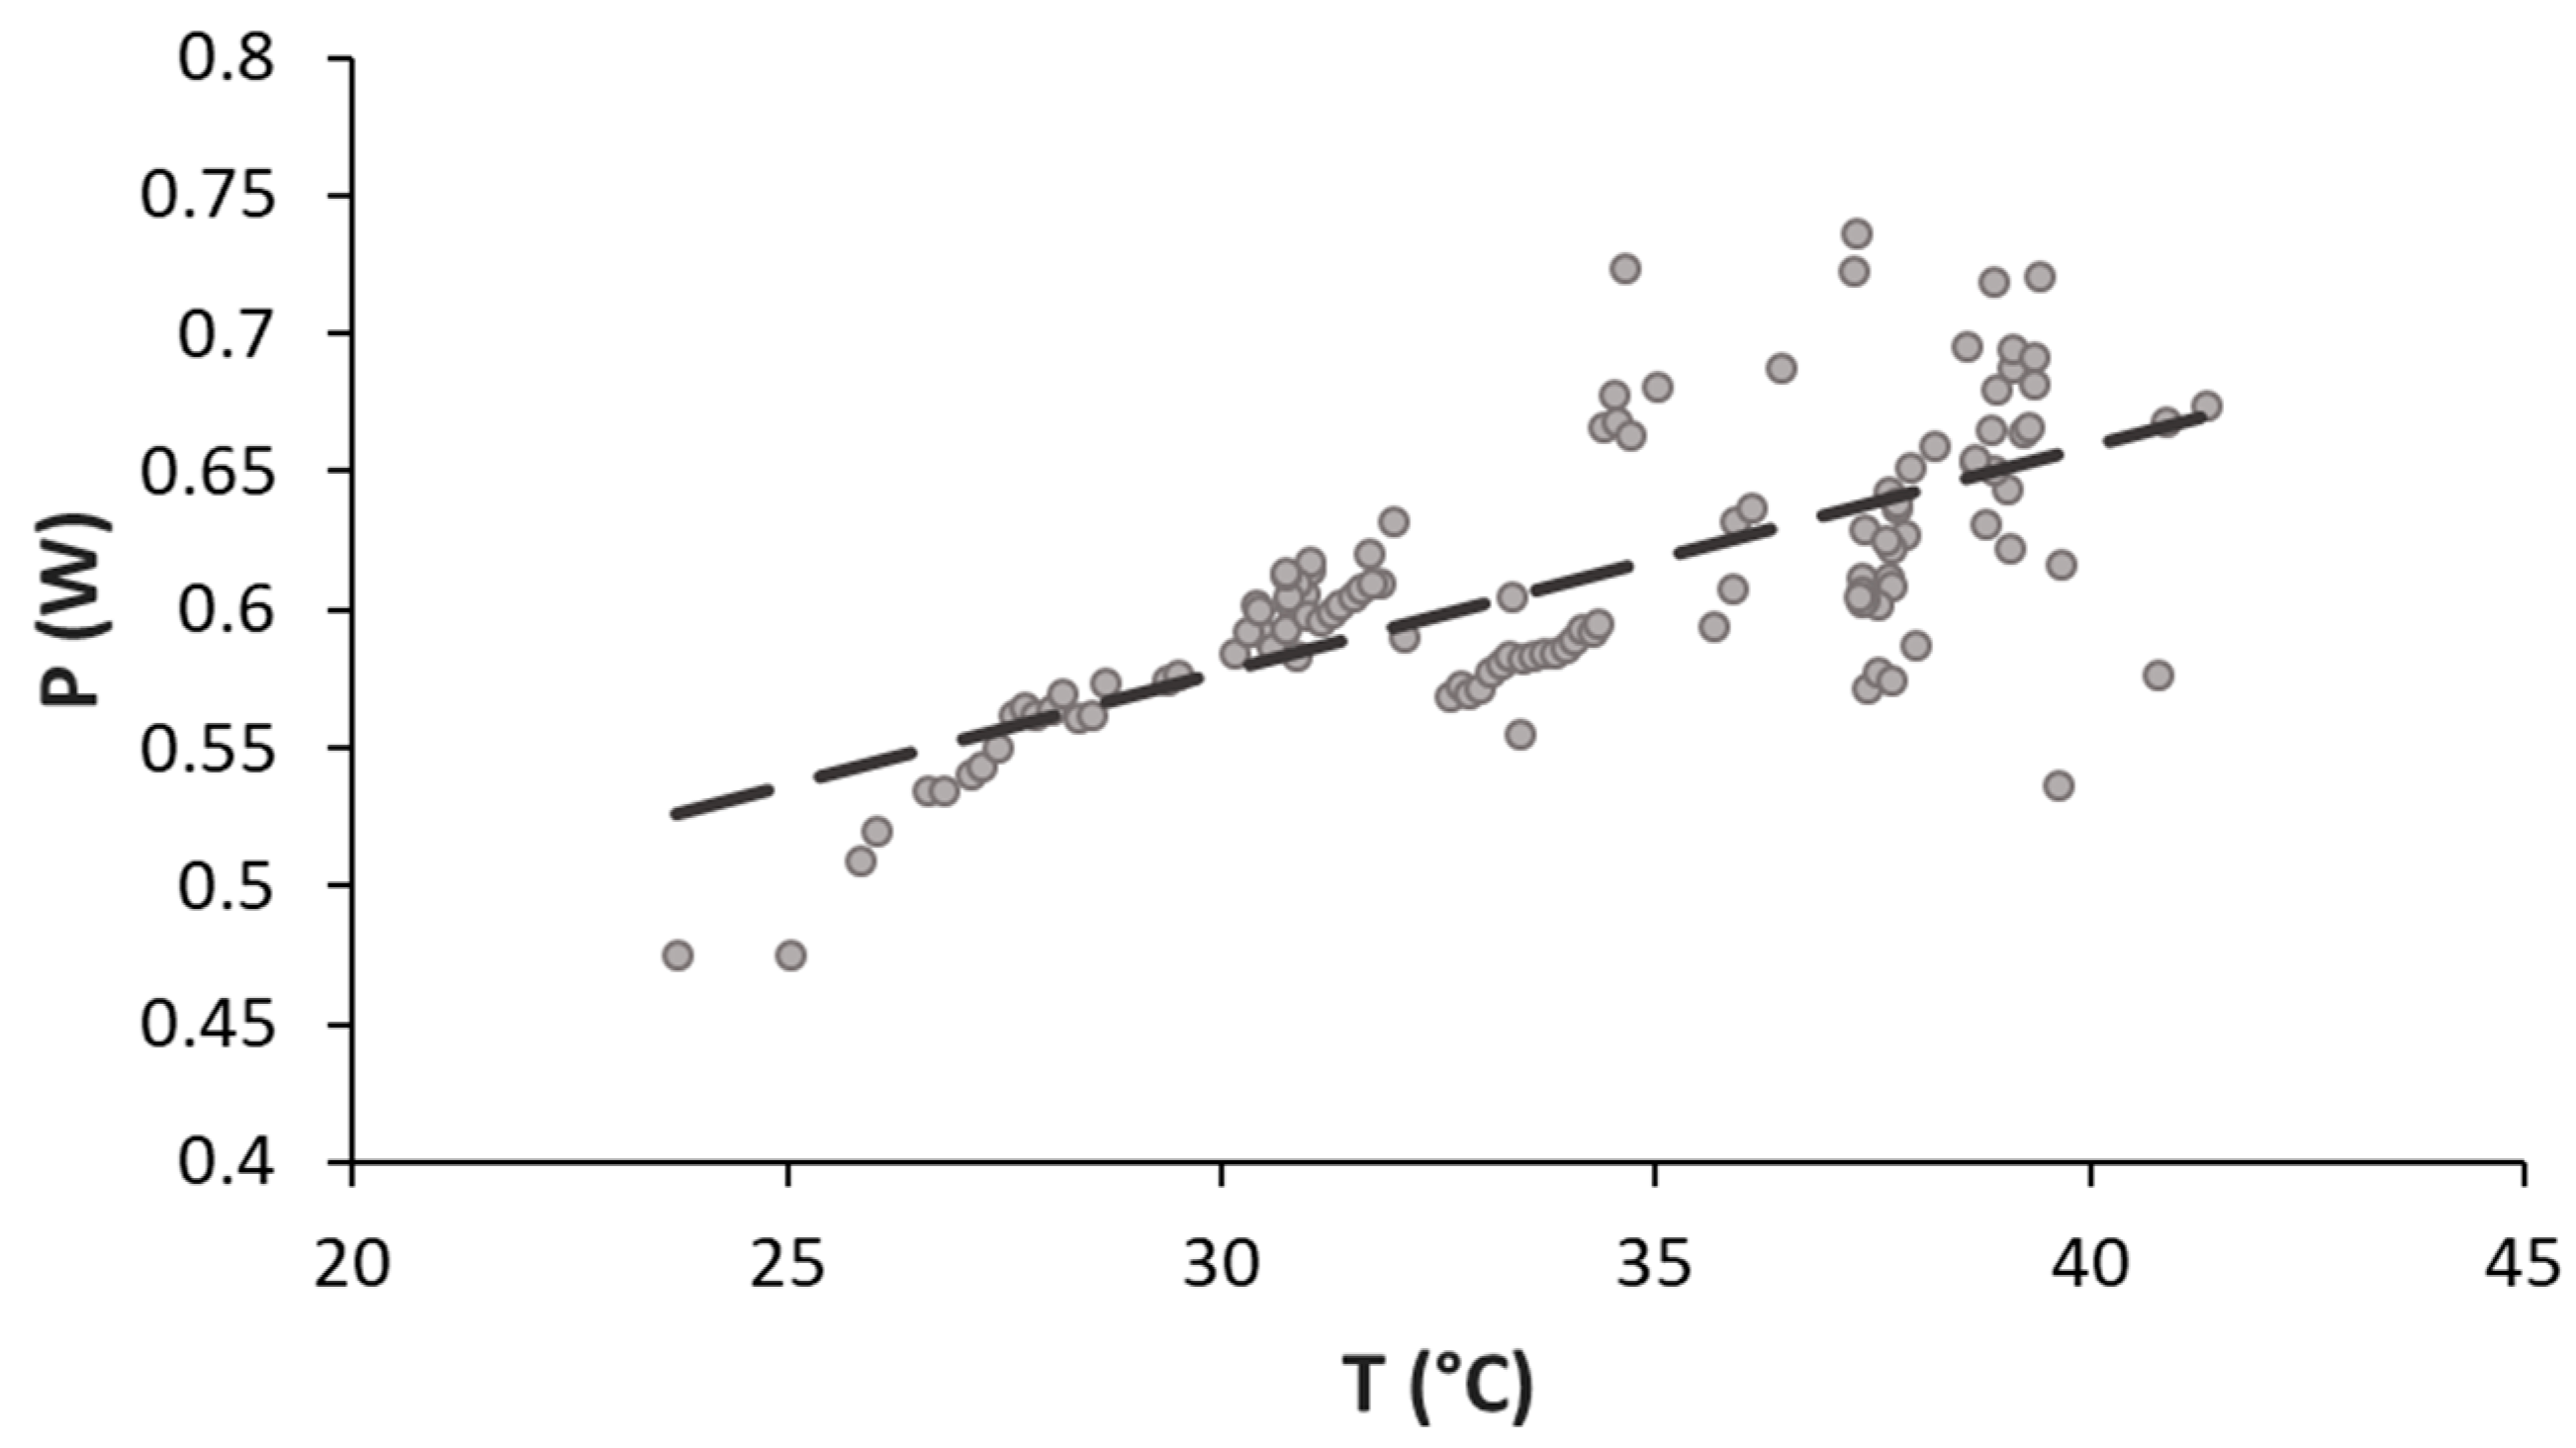
In a photovoltaic system, peak power is affected by variation of the cell’s temperature and of the global radiation facing the photovoltaic surface. In general, for the most consolidated technologies when module temperature increases, the maximum power decreases. Since temperature has direct influence on the module performance, it is important to know the temperature coefficients of the considered technology. To evidence the temperature dependence on the DSM performance, power, P, has been considered at an almost fixed value of vertical global irradiance (GRv), i.e., 490 W/m² ≤ GRv ≤ 510 W/m².
Figure 13 reports the trend of P, with varying module temperature. The figure shows a positive trend of power with increasing temperature showing a positive temperature coefficient of 0.0082 W/°C (the angular coefficient of the interpolant). This means that PV production increases as temperature increases making DSM suitable for integration in buildings where the modules usually suffer from high temperatures and cannot be efficiently cooled.
This behavior can be explained considering the total resistance of the cells that is given by the series of conducting glass resistance, RFTO, platinum electrode resistance, RPt and the resistance due to the electron holes carriage in the electrolite, Rd. It can be observed that as the temperature increases, RFTO remains constant while RPt and Rd increase. In particular, it has been observed that for temperature values higher than 40 °C till approximately 50 °C, this resistance decrease produces an improvement in the cell efficiency [
39].
It has to be noted that the temperature coefficient evaluation was performed with DSM in the vertical position while usually temperature coefficients are measured at normal incidence. In this case, the intent was to measure this parameter in more realistic operating conditions. Nevertheless, it is possible to compare the result with what is obtained for a standard crystalline PV module that is approximately −0.4%/°C. DSM exhibits a power temperature coefficient of 0.6%/°C demonstrating high potentiality for building integration where high temperatures experienced by the PV modules usually penalize standard technologies.
4.4. Energy Performance
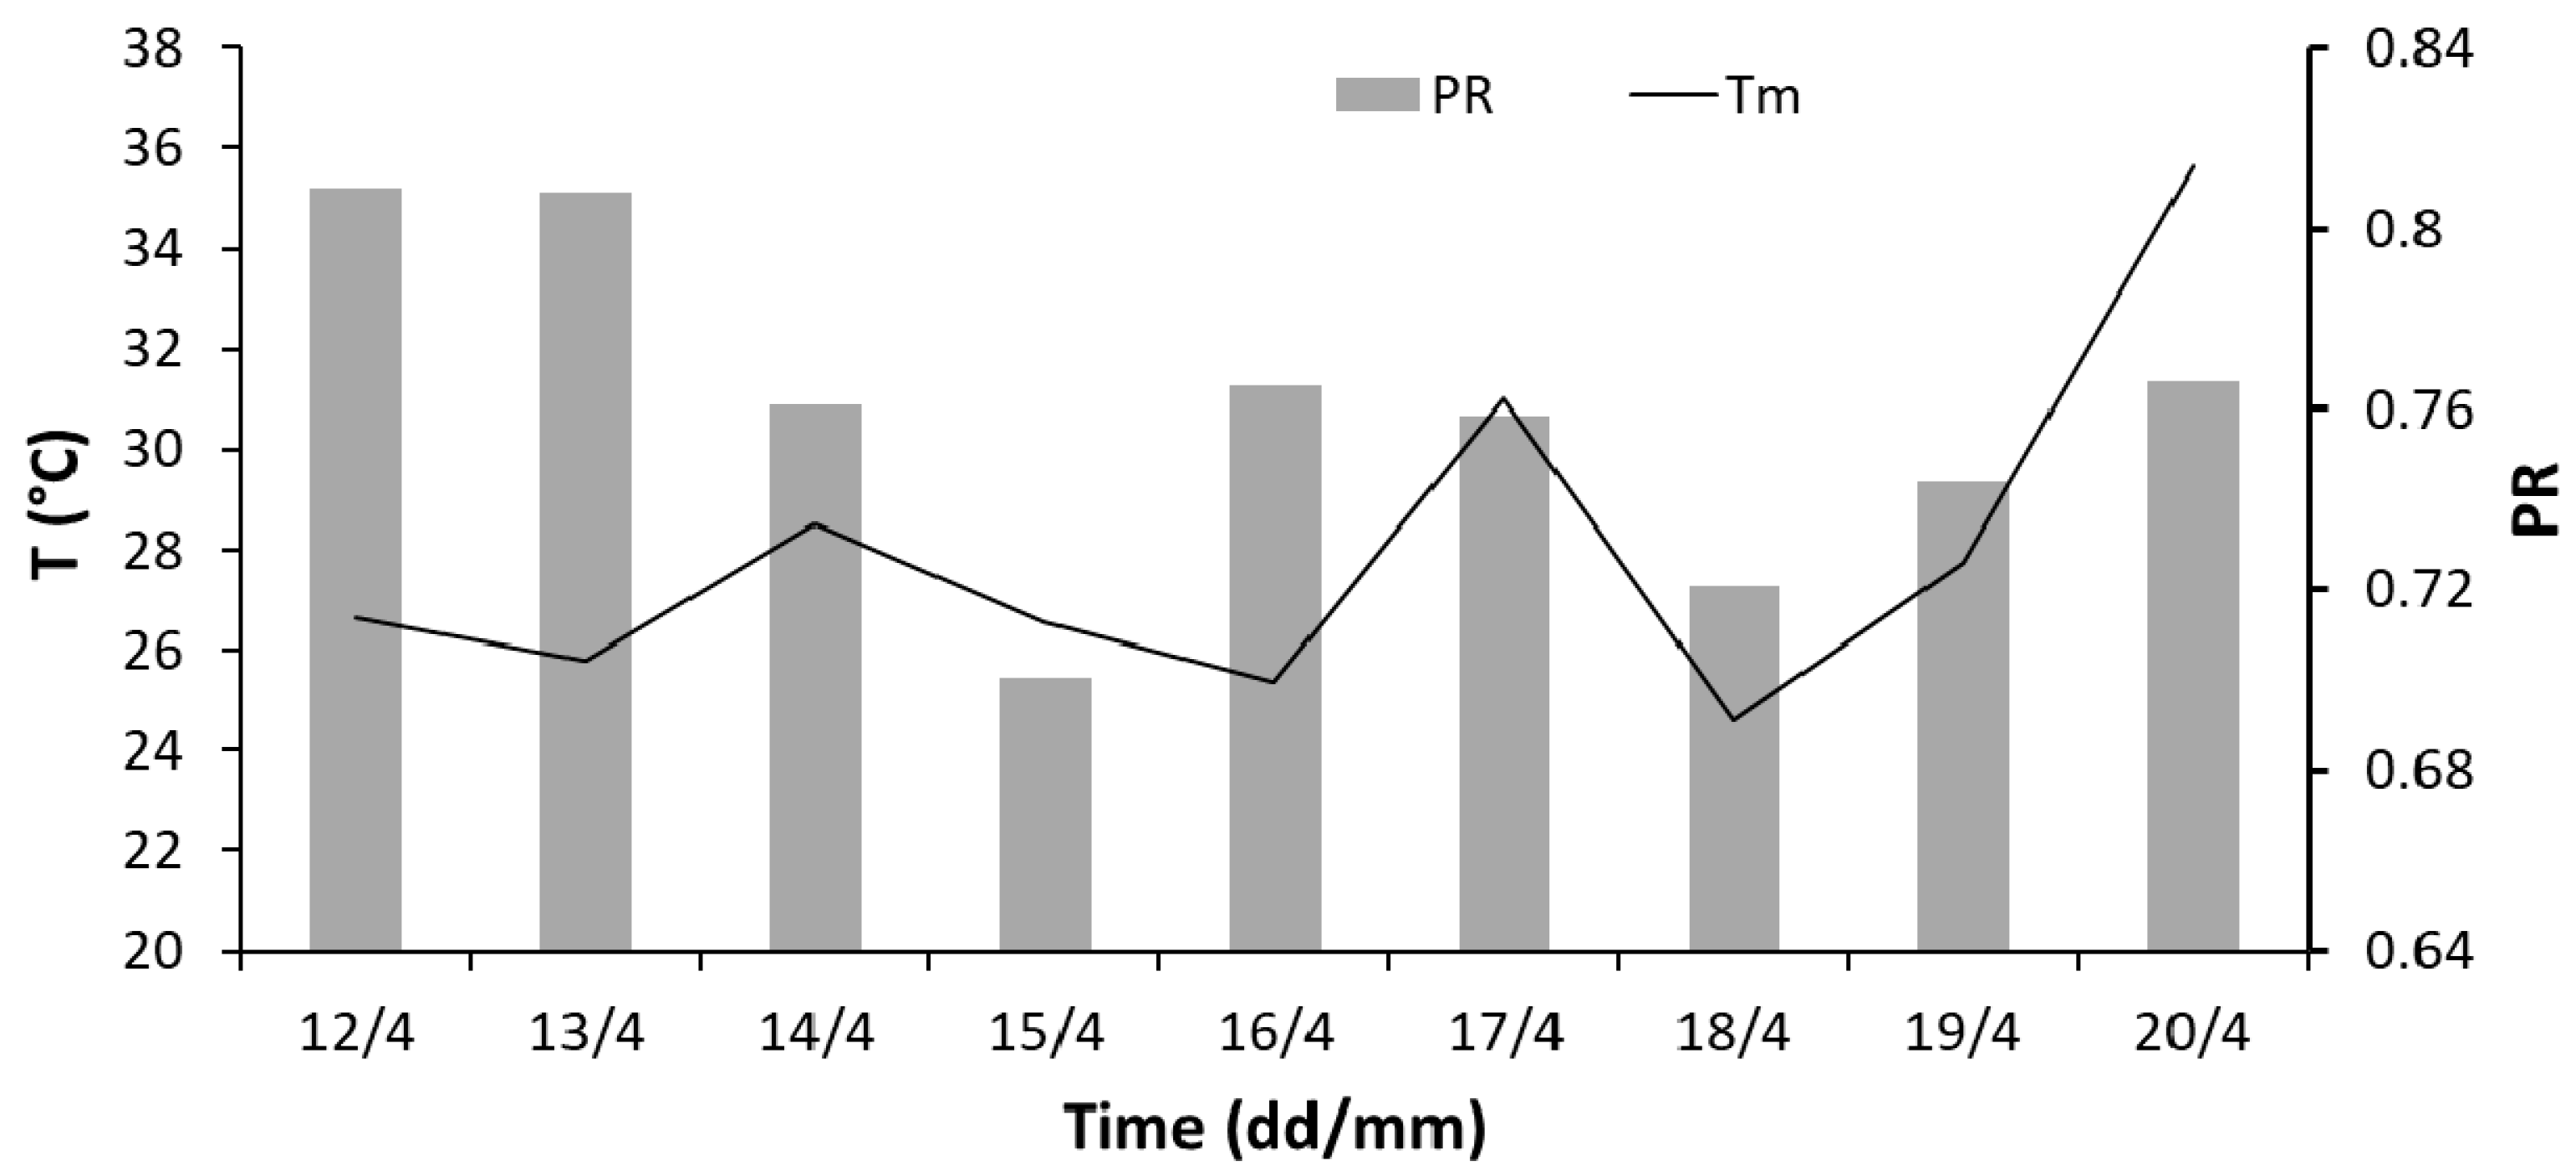
Figure 14 reports the average daily values of PR has defined in
Section 4.1.
Table 3 summarizes the daily reference and DSM yield together with the DSM daily efficiency.
The overall energy produced by the module operating during the monitoring campaign is 32.05 Wh. The average PR for the total time period considered is 0.76. Average efficiency over the period of test is 2.49%, to be compared with
ηSTC = 3.28%. The average efficiency during the central part of the day reached 3%.
Figure 14 reports the daily PR together with the average diurnal temperature of the back of the module. The daily PR is fluctuating day by day and this behavior does not seem to be related to temperature variations (see
Figure 14) but rather to instabilities of the module or to the method used for the measurements. For example, on 15 April, although the day presented the highest solar irradiance, DSM gave the lowest performance and efficiency (see also
Table 3). Further investigations are necessary to deepen this aspect.
5. Conclusions
In the work presented here, a complete characterization of a dye-sensitized PV module, suitable for building integration, was carried out in real operating conditions. A methodology developed by the authors, using solar test boxes, allowed evaluating the U-value and the SHGC of a DSM prototype in outdoor conditions. During the same test, the electrical characteristics of the module were also measured and the energy production, efficiency and performance ratio were determined. The thermal characterization provided a U-value = 3.6 W/m2·K and SHGC = 0.2. U-value was validated through a steady state indoor test, while SHGC results compliant with data were found in the literature. Electrical characterization evidenced a favorable performance of the module with respect to increasing temperatures. This behavior proves that DSM could be integrated into building facades with success. The daily energy production trend of DSM and its daily energy performance present some unclear features. Future investigations are needed to deepen this aspect. Despite this last consideration, the findings of this work prove that it is possible to evaluate STPV performance under real operating conditions and a simple set up, providing results that can be helpful for a more realistic evaluation of energy saving potential of dye-sensitized solar cell technology integrated into buildings. Indeed, these data can be used as realistic input for building dynamic simulation models.

 ,
, 


