Pathways to Decarbonise the European Car Fleet: A Scenario Analysis Using the Backcasting Approach

Abstract
:1. Introduction
2. Emission Target
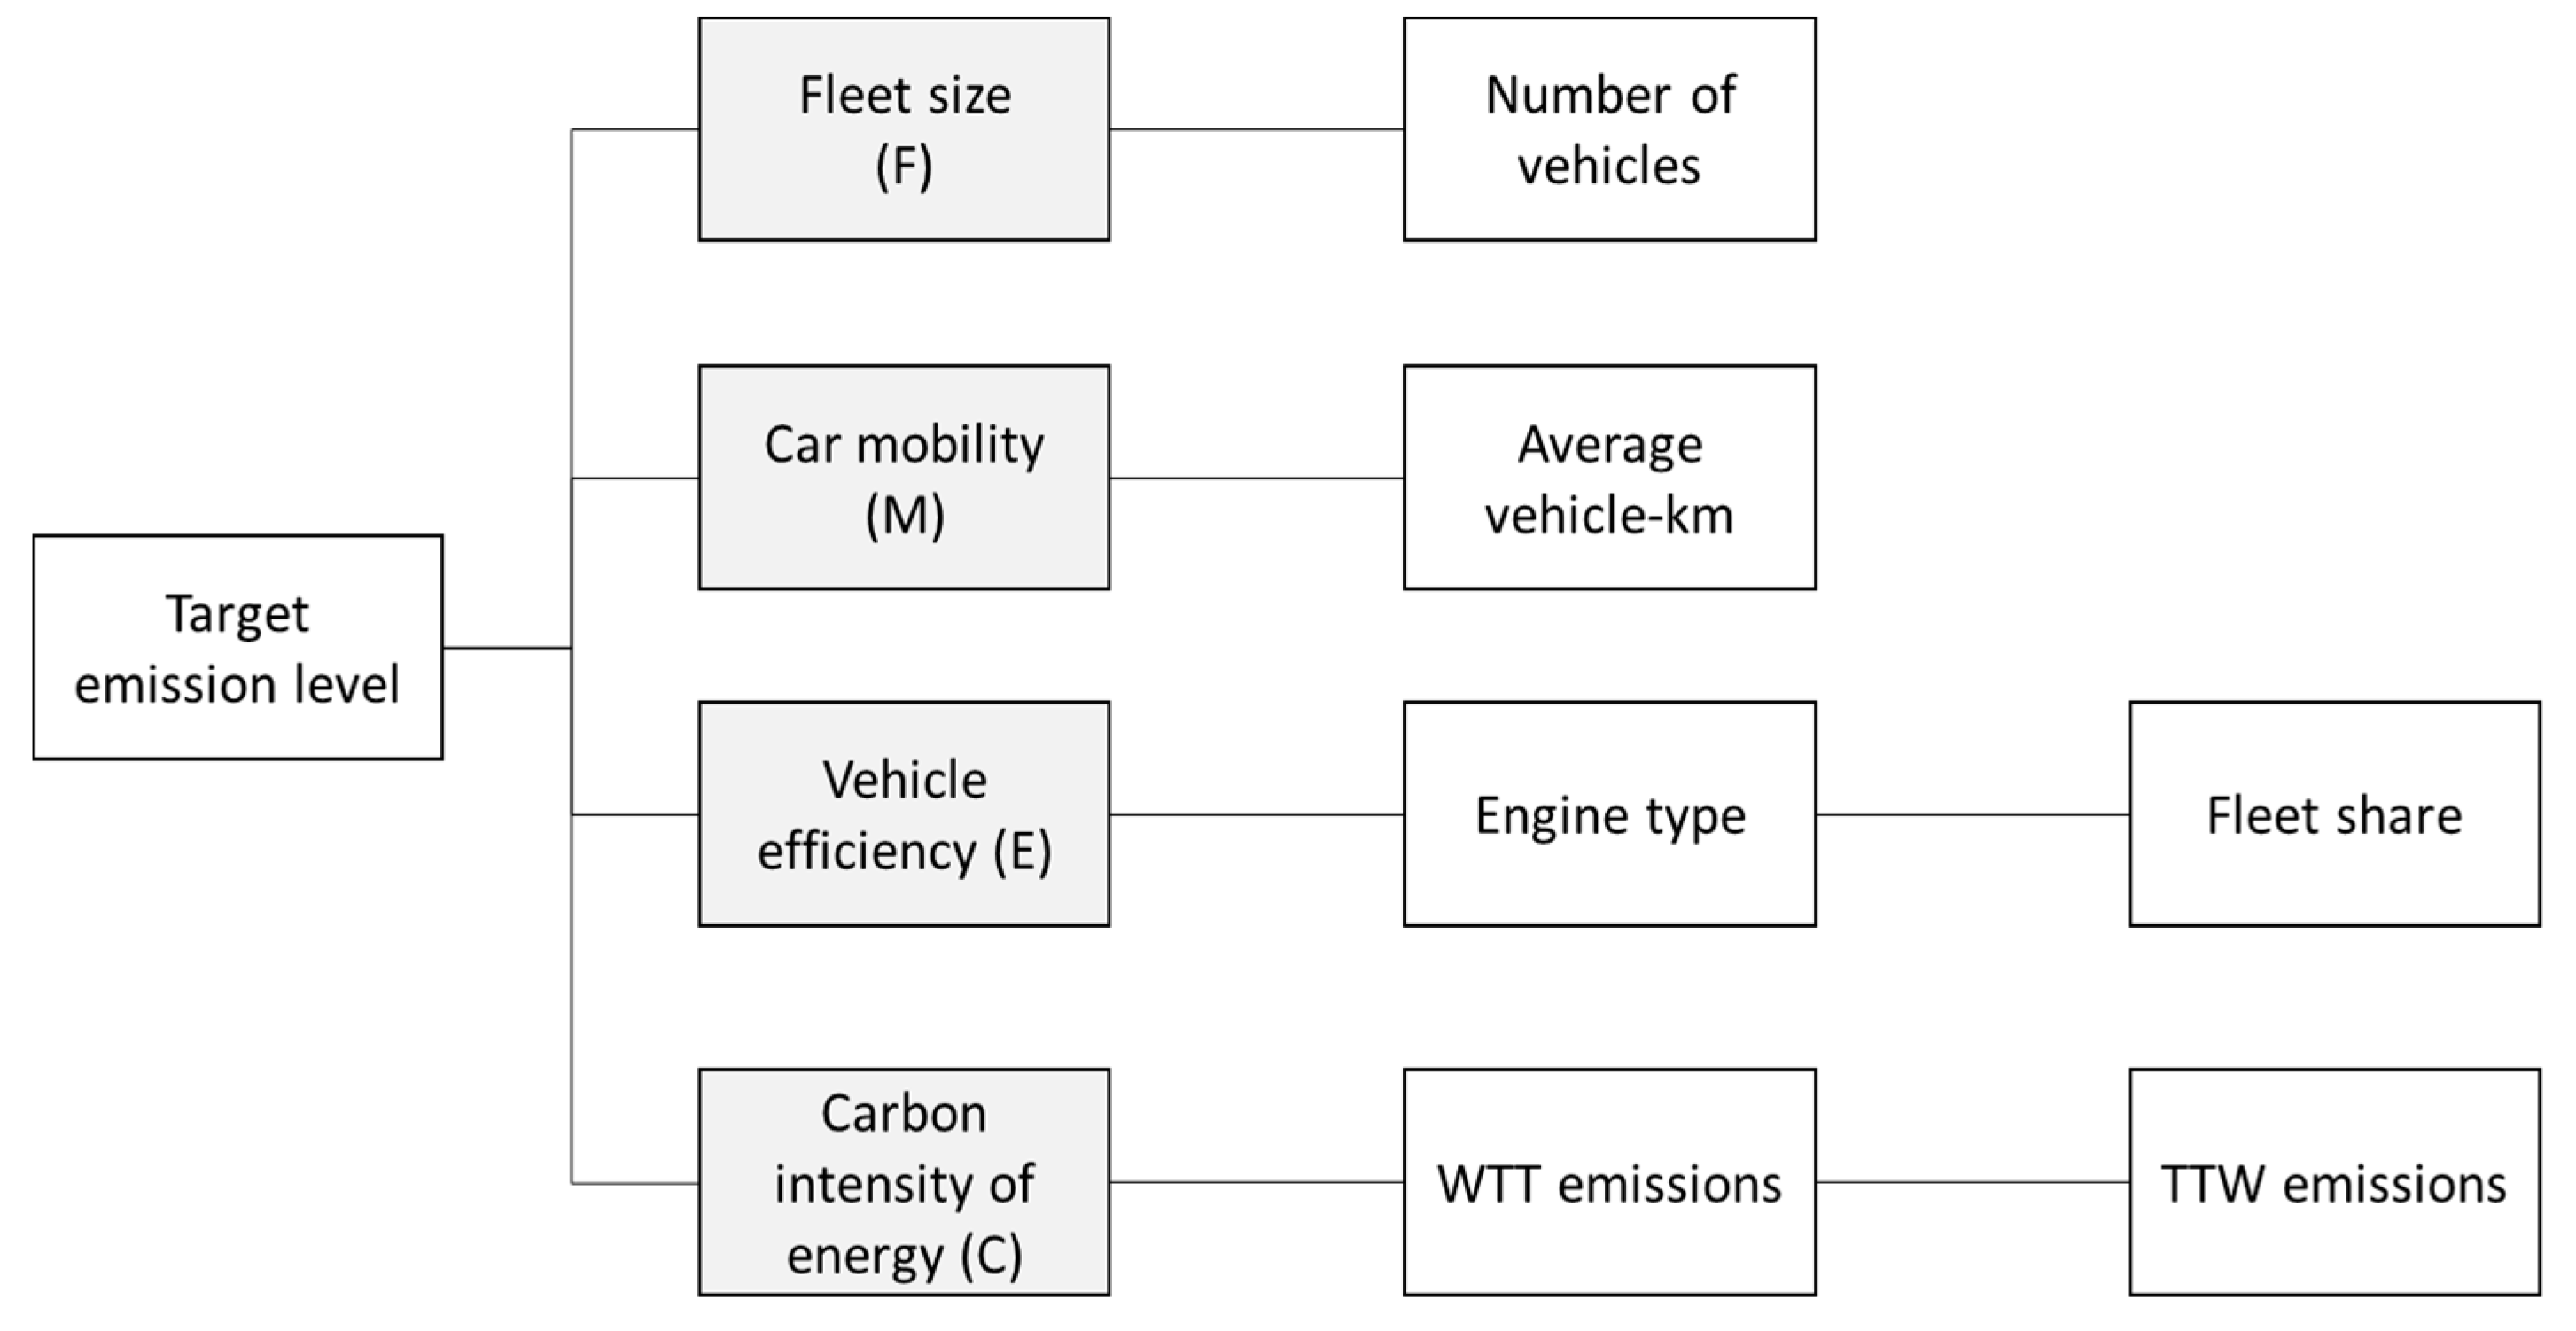
3. Decomposition Approach
4. Baseline
4.1. The Baseline Year 2010
4.2. The Reference Year 2050
5. Decarbonisation Scenarios
5.1. Actions to Reduce Car Emissions
5.2. Transitions in Car Use
5.3. Scenario Description
5.3.1. Reference Case
- Car ownership prevails
- Slow technology transition
- Low priority for green energy
5.3.2. Scenario 1: Electrification
- Car ownership prevails
- Fast technology transition
- Moderate priority for green energy
5.3.3. Scenario 2: Shared Mobility
- Shift to multi-modality
- Slow technology transition
- Moderate priority for green energy
5.3.4. Scenario 3: Green Energy
- Shift to multi-modality
- Fast technology transition
- High priority for green energy
6. Discussion
6.1. Findings Related to Current Trends
6.1.1. Electrification of the Car Fleet
6.1.2. Patterns of Car Use and Ownership
6.2. Scenario Analysis and Backcasting
6.2.1. Analysis of Decarbonisation Scenarios
6.2.2. Limitations of the Approach and Potential Developments
7. Conclusions
Author Contributions
Conflicts of Interest
Appendix A

| Emission Factors | 2010 | 2050 | Data Source |
|---|---|---|---|
| Average annual mileage (km/car) | 13,325 | 13,054 | Average value for 2010: [19,29,30,31,32] Increase for 2050: [19] |
| Vehicle fleet (number of cars) | 235,947,849 | 307,145,288 | Average value for 2010: [8,14,20,23,33] Increase for 2050: [19] |
| Vehicle efficiencies (kWh/km) of | Values for 2010 and 2050: [19] | ||
| Gasoline | 0.830 | 0.422 | |
| Diesel | 0.744 | 0.402 | |
| HEV gasoline | 0.623 | 0.334 | |
| HEV diesel | 0.558 | 0.318 | |
| PHEV gasoline | 0.410 | 0.233 | |
| PHEV diesel | 0.374 | 0.231 | |
| EV | 0.225 | 0.147 | |
| LPG | 0.769 | 0.429 | |
| CNG | 0.704 | 0.414 | |
| Electric proportion in PHEV (%) | 30% | 70% | |
| Fuel proportion in PHEV (%) | 70% | 30% | |
| Fleet share (%) per engine type | Values for 2010 and 2050: [19] | ||
| Gasoline | 60.20 | 46.71 | |
| Diesel | 35.73 | 31.17 | |
| HEV gasoline | 0.07 | 10.86 | |
| HEV diesel | 0.06 | 7.28 | |
| PHEV gasoline | 0.00 | 0.01 | |
| PHEV diesel | 0.00 | 0.01 | |
| EV | 0.00 | 0.00 | |
| LPG | 3.48 | 3.46 | |
| CNG | 0.46 | 0.50 | |
| Indirect emissions (kgCO2/kWh) | Values for 2010: [36] Interpolated increase for 2050: [40] | ||
| Gasoline | 0.0497 | 0.0527 | |
| Diesel | 0.0554 | 0.0551 | |
| Electricity | 0.5440 | 0.5000 | |
| Hydrogen | 0.4271 | 0.4271 | |
| LPG | 0.0288 | 0.0345 | |
| CNG | 0.0468 | 0.0414 | |
| Direct emissions (kgCO2/kWh) | Values for 2010: [36] Interpolated increase for 2050: [40] | ||
| Gasoline | 0.2639 | 0.2797 | |
| Diesel | 0.2542 | 0.2526 | |
| Electricity | 0.0000 | 0.0000 | |
| Hydrogen | 0.0000 | 0.0000 | |
| LPG | 0.2365 | 0.2836 | |
| CNG | 0.2027 | 0.1793 | |
References
- Banister, D.; Dreborg, K.-H.; Hedberg, L.; Hunhammar, S.; Steen, P.; Akerman, J. Transport policy scenarios for the EU: 2020 images of the future. Innovation 2000, 13, 27–45. [Google Scholar] [CrossRef]
- Sinn, H.W. Das grüne Paradoxon: Warum man das Angebot bei der Klimapolitik nicht vergessen darf. Perspektiven der Wirtschaftspolitik 2008, 9, 109–142. [Google Scholar] [CrossRef]
- European Commission Climate Action—Paris Agreement. Available online: http://ec.europa.eu/clima/policies/international/negotiations/paris/index_en.htm (accessed on 27 October 2016).
- European Commission. Roadmap to a Single European Transport Area–Towards a Competitive and Resource Efficient Transport System; Publications Office of the European Union: Luxembourg, 2011; ISBN 9789279182709. [Google Scholar]
- European Commission Climate Action: 2050 Energy Strategy. Available online: http://ec.europa.eu/energy/en/topics/energy-strategy/2050-energy-strategy (accessed on 15 November 2017).
- European Parliament. Council of the European Union Regulation (EC) No. 443/2009. Available online: http://eur-lex.europa.eu/LexUriServ/LexUriServ.do?uri=OJ:L:2009:140:0001:0015:EN:PDF (accessed on 20 November 2017).
- European Parliament and Council of the European Union. Directive 2009/28/EC of the European Parliament and of the Council of 23 April 2009. Off. J. Eur. Union 2009, 140, 16–62. [Google Scholar] [CrossRef]
- Fiorello, D.; De Stasio, C.; Kohler, J.; Kraft, M.; Newton, S.; Purwanto, J.; Schade, B.; Schade, W.; Szimba, E.; Deliverable, D. The iTREN-2030 Reference Scenario Until 2030. Available online: www.tmleuven.be/project/itren2030/D4_Reference_Scenario.pdf (accessed on 10 November 2017).
- De Vita, A.; Tasios, N.; Papadopoulos, D.; Siskos, P.; Apostolaki, E.; Zampara, M.; Paroussos, L.; Fragiadakis, K.; Kouvaritakis, N.; Capros, P. Trends to 2050—Reference Scenario 2013. Available online: Ec.europa.eu/transport/media/publications/doc/trends-to-2050-update-2013.pdf (accessed on 10 November 2017).
- Höltl, A. Successful Pathways to Decarbonise the European Car Fleet: Future Perspectives; University Press: Brussels, Belgium, 2017; ISBN 9789057186769. [Google Scholar]
- Hickman, R.; Banister, D. Looking over the horizon: Transport and reduced CO2 emissions in the UK by 2030. Transp. Policy 2007, 14, 377–387. [Google Scholar] [CrossRef]
- Åkerman, J. Sustainable air transport—On track in 2050. Transp. Res. Part D Transp. Environ. 2005, 10, 111–126. [Google Scholar] [CrossRef]
- Ashina, S.; Fujino, J.; Masui, T.; Ehara, T.; Hibino, G. A roadmap towards a low-carbon society in Japan using backcasting methodology: Feasible pathways for achieving an 80% reduction in CO2 emissions by 2050. Energy Policy 2012, 41, 584–598. [Google Scholar] [CrossRef]
- Mock, P. European Vehicle Market Statistics—Pocketbook 2014. Available online: http://eupocketbook.theicct.org (accessed on 11 February 2015).
- European Commission. Communication from the Commission to the European Parliament, the Council, the European Economic and Social Committee and the Committee of the Regions—Clean Power for Transport: A European Alternative Fuels Strategy. Available online: http://eur-lex.europa.eu/legal-content/EN/TXT/PDF/?uri=CELEX:52013PC0017&from=EN (accessed on 10 November 2017).
- European Commission. Working Paper—The Implementation of the 2011 White Paper on Transport “Roadmap to a Single European Transport Area—Towards a Competitive and Resource-Efficient Transportsystem” Five Years After Its Publication: Achievements and Challenges. Available online: https://ec.europa.eu/transport/sites/transport/files/themes/strategies/doc/2011_white_paper/swd%282016%29226.pdf (accessed on 10 November 2017).
- U.S. Environmental Protection Agency—Office of Transportation and Air Quality. Greenhouse Gas Emissions from a Typical Passenger Vehicle. Available online: https://www.epa.gov/greenvehicles/greenhouse-gas-emissions-typical-passenger-vehicle-0 (accessed on 10 November 2017).
- European Commission. EU Transport in Figures—Statistical Pocketbook 2016; Publications Office of the European Union: Luxembourg, 2016; ISBN 9789279515286. [Google Scholar]
- EU Transport GHG: Routes to 2050 SULTAN—Illustrative Scenario Tool. Available online: http://www.eutransportghg2050.eu (accessed on 1 October 2016).
- European Commission. EU Transport in Figures—Statistical Pocketbook 2013; Publications Office of the European Union: Luxembourg, 2013; ISBN 9789279288609. [Google Scholar]
- Tietge, U.; Mock, P.; Zacharof, N.; Franco, V. Real-World Fuel Consumption of Popular European Passenger Car Models; International Council on Clean Transportation Working Paper; ICCT: Berlin, Germany, 2015. [Google Scholar]
- Millard-Ball, A.; Schipper, L. Are We Reaching Peak Travel? Trends in Passenger Transport in Eight Industrialized Countries. Transp. Rev. 2011, 31, 357–378. [Google Scholar] [CrossRef]
- TM Leuven. TREMOVE—Economic Transport and Emissions Model. Available online: http://www.tmleuven.be/methode/tremove/home.htm (accessed on 6 March 2017).
- Kwon, T.-H. Decomposition of factors determining the trend of CO2 emissions from car travel in Great Britain (1970–2000). Ecol. Econ. 2005, 53, 261–275. [Google Scholar] [CrossRef]
- McCollum, D.; Yang, C. Achieving deep reductions in US transport greenhouse gas emissions: Scenario analysis and policy implications. Energy Policy 2009, 37, 5580–5596. [Google Scholar] [CrossRef]
- Papagiannaki, K.; Diakoulaki, D. Decomposition analysis of CO2 emissions from passenger cars: The cases of Greece and Denmark. Energy Policy 2009, 37, 3259–3267. [Google Scholar] [CrossRef]
- Kaya, Y. Impact of Carbon Dioxide Emission Control on GNP Growth: Interpretation of Proposed Scenarios. In Proceedings of the IPCC Energy and Industry Subgroup, Response Strategies Working Group, Paris, France; 1990. [Google Scholar]
- Kwon, T.-H. A scenario analysis of CO2 emission trends from car travel: Great Britain 2000–2030. Transp. Policy 2005, 12, 175–184. [Google Scholar] [CrossRef]
- Tranter, M.; Robineau, D.; Goodman, G. National Travel Survey: England 2014. Available online: https://www.gov.uk/ (accessed on 20 February 2017).
- Lenz, B.; Follmer, R.; Nobis, C.; Köhler, K.; Mehlin, M.; Gruschwitz, D.; Jesske, B.; Quandt, S. Mobilität in Deutschland 2008—Ergebnisbericht. Available online: http://www.mobilitaet-in-deutschland.de/pdf/MiD2008_Abschlussbericht_I.pdf (accessed on 8 May 2014).
- Bovag-RAI Mobiliteit in Cijfers—Autos 2015/2016. Available online: http://www.bovagrai.info/auto/2010/images/micauto2010.pdf (accessed on 6 March 2017).
- Kraftfahrt-Bundesamt Pressemitteilung Nr. 15/2015: Die Jährliche Fahrleistung Deutscher Pkw. Available online: http://www.kba.de/ (accessed on 20 February 2017).
- Huynh, Q.-N. The Automobile Industry Pocket Guide 2012. Available online: http://www.acea.be/images/uploads/files/acea_pocket_guide_2012_updated.pdf (accessed on 20 February 2017).
- Knörr, W.; Heidt, C.; Schach, A. Aktualisierung “Daten- und Rechenmodell: Energieverbrauch und Schadstoffemissionen des Motorisierten Verkehrs in Deutschland 1960–2030” (TREMOD, Version 5.3) für die Emissionsberichtserstattung 2013. Available online: https://www.ifeu.de/methoden/modelle/tremod/ (accessed on 8 October 2014).
- Lebeau, K. Electrifying Cars: The Economic Potential of Electric Vehicles; University Press: Brussels, Belgium, 2013; ISBN 9789461971333. [Google Scholar]
- Edwards, R.; Larivé, J.-F.; Rickeard, D.; Weindorf, W. Well-to-Wheels Analysis of the Future Automotive Fuels and Powertrains in the European Context—Summary of Energy and GHG Balance of Individual Pathways. Available online: http://iet.jrc.ec.europa.eu/about-jec/sites/iet.jrc.ec.europa.eu.about-jec/files/documents/report_2014/wtt_appendix_2_v4a.pdf (accessed on 1 March 2017).
- Kloess, M.; Müller, A. Simulating the impact of policy, energy prices and technological progress on the passenger car fleet in Austria-A model based analysis 2010–2050. Energy Policy 2011, 39, 5045–5062. [Google Scholar] [CrossRef]
- Gambhir, A.; Tse, L.K.C.; Tong, D.; Martinez-Botas, R. Reducing China’s road transport sector CO2 emissions to 2050: Technologies, costs and decomposition analysis. Appl. Energy 2015, 157, 905–917. [Google Scholar] [CrossRef]
- Pasaoglu, G.; Honselaar, M.; Thiel, C. Potential vehicle fleet CO2 reductions and cost implications for various vehicle technology deployment scenarios in Europe. Energy Policy 2012, 40, 404–421. [Google Scholar] [CrossRef]
- GEMIS Globales Emissions-Modell Integrierter Systeme. Available online: http://iinas.org/gemis-dokumente.html (accessed on 4 April 2017).
- Edwards, R.; Larivé, J.-F.; Rickeard, D.; Weindorf, W. JRC Technical Reports—Well-to-Tank Report Version 4.a—JEC Well-to-Wheels Analysis. Available online: http://iet.jrc.ec.europa.eu/about-jec/sites/iet.jrc.ec.europa.eu.about-jec/files/documents/report_2014/wtt_report_v4a.pdf (accessed on 24 September 2015).
- Rotmans, J.; Kemp, R.; van Asselt, M. More evolution than revolution: Transition management in public policy. Foresight 2006, 3, 15–31. [Google Scholar] [CrossRef]
- Robinson, J. Future subjunctive: Backcasting as social learning. Futures 2003, 35, 839–856. [Google Scholar] [CrossRef]
- Van Noorden, R. The rechargeable revolution: A better battery. Nature 2014, 507, 26–28. [Google Scholar] [CrossRef] [PubMed]
- Nykvist, B.; Nilsson, M. Rapidly falling costs of battery packs for electric vehicles. Nat. Clim. Chang. 2015, 5, 329–332. [Google Scholar] [CrossRef]
- Berckmans, G.; Messagie, M.; Smekens, J.; Omar, N.; Vanhaverbeke, L. Cost Projection of State of the Art Lithium-Ion Batteries for Electric Vehicles Up to 2030. Energies 2017, 10, 1314. [Google Scholar] [CrossRef]
- Pridmore, A.; Wynn, D.; Hazeldine, T.; Milnes, R. An Overview of the Factors that Limit New Technology and Concepts in the Transport Sector. Available online: www.eutransportghg2050.eu (accessed on 29 January 2015).
- Pietzcker, R.C.; Longden, T.; Chen, W.; Fu, S.; Kriegler, E.; Kyle, P.; Luderer, G. Long-term transport energy demand and climate policy: Alternative visions on transport decarbonization in energy-economy models. Energy 2014, 64, 95–108. [Google Scholar] [CrossRef]
- Cunningham, J. Achieving an 80% GHG Reduction by 2050 in California’s Passenger Vehicle Fleet: Implications for the ZEV Regulation. SAE Int. J. Passeng. Cars Electron. Electr. Syst. 2010, 3, 19–36. [Google Scholar] [CrossRef]
- OICA. Motorization Rate 2015—Worldwide. Available online: http://www.oica.net/world-vehicles-in-use-all-vehicles-2/ (accessed on 8 July 2017).
- Metz, D. Peak Car and Beyond: The Fourth Era of Travel. Transp. Rev. 2013, 33, 255–270. [Google Scholar] [CrossRef]
- Åkerman, J.; Höjer, M. How much transport can the climate stand?—Sweden on a sustainable path in 2050. Energy Policy 2006, 34, 1944–1957. [Google Scholar] [CrossRef]
- Cuenot, F.; Fulton, L.; Staub, J. The prospect for modal shifts in passenger transport worldwide and impacts on energy use and CO2. Energy Policy 2012, 41, 98–106. [Google Scholar] [CrossRef]
- Creutzig, F. Evolving Narratives of Low-Carbon Futures in Transportation. Transp. Rev. 2015, 1647, 1–20. [Google Scholar] [CrossRef]
- He, D.; Meng, F.; Wang, M.Q.; He, K. Impacts of Urban Transportation Mode Split on CO2 Emissions in Jinan, China. Energies 2011, 4, 685–699. [Google Scholar] [CrossRef]
- Vreeswijk, J.D. Scenario Analysis for Speed Assistance Development and Application of a Scenario Model for the Deployment of Speed Assistance Systems. Master’s Thesis, University of Twente, Enschede, The Netherlands, 2006. [Google Scholar]
- Miola, A. Backcasting Approach for Sustainable Mobility; Publications Office: Luxembourg, 2008; ISBN 9789279091896. [Google Scholar]
- Höltl, A.; Heinrichs, M.; Macharis, C. Analysis of Effects Resulting from Improved Vehicle Fuel Efficiency and Fuel Price Changes Applied to the Berlin City Network. In Sustainable Urban Transport; Attard, M., Shiftan, Y., Eds.; Emerald Group Publishing Limited: Bingley, UK, 2015; pp. 229–249. ISBN 978-1-78441-616-4. [Google Scholar]
- Justen, A.; Schippl, J.; Höltl, A.; Fleischer, T. Expect the unexpected: Qualitative and quantitative tools and methods to detect unintended effects of transport policies. In Proceedings of the European Transport Conference, Glasgow, UK, 11–13 October 2010. [Google Scholar]
- Macharis, C.; Mareschal, B.; Waaub, J.-P.; Milan, L. PROMETHEE-GDSS Revisited: Applications So Far and New Developments. Int. J. Multicriteria Decis. Mak. 2015, 5, 129–151. [Google Scholar] [CrossRef]
- De Brucker, K.; Macharis, C.; Wiethoff, M.; Marchau, V. Strategic analysis of stakeholder preferences regarding the design of ITS-based road safety measures. IET Intell. Transp. Syst. 2014, 8, 1–10. [Google Scholar] [CrossRef]
- Macharis, C.; De Witte, A.; Turcksin, L. The Multi-Actor Multi-Criteria Analysis (MAMCA) application in the Flemish long-term decision making process on mobility and logistics. Transp. Policy 2010, 17, 303–311. [Google Scholar] [CrossRef]
- Marchau, V.; Walker, W.; van Duin, R. An adaptive approach to implementing innovative urban transport solutions. Transp. Policy 2008, 15, 405–412. [Google Scholar] [CrossRef]
- Marchau, V.A.W.J.; Walker, W.E.; van Wee, G.P. Dynamic adaptive transport policies for handling deep uncertainty. Technol. Forecast. Soc. Chang. 2010, 77, 940–950. [Google Scholar] [CrossRef]
- Haasnoot, M.; Kwakkel, J.H.; Walker, W.E.; ter Maat, J. Dynamic adaptive policy pathways: A method for crafting robust decisions for a deeply uncertain world. Glob. Environ. Chang. 2013, 23, 485–498. [Google Scholar] [CrossRef]


| Year | 1990 | 2010 | 2050 Target (−60%) | Yearly Reduction 1990–2050 | Yearly Reduction 2010–2050 | |
|---|---|---|---|---|---|---|
| 1 | All sectors GHG (Mt CO2) | 5583 | 4721 | 2233 | −1% | −1.32% |
| 2 | Transport sector GHG (Mt CO2) | 959 | 1216 | 384 | −1% | −1.71% |
| 3 | Passenger cars (Mt CO2) | 575 | 777 | 230 | −1% | −1.76% |
| Actions to Reduce Emissions | Emission Factor | |||
|---|---|---|---|---|
| (F) | (M) | (E) | (C) | |
| Decouple travel demand increase from income growth | √ | |||
| Higher tax on vehicle registration | √ | |||
| Flexible car use through car sharing | √ | √ | ||
| Improve non-motorised (cycling, walking), rail and public transport services (bus rapid transit, light rail, intercity high-speed rail) | √ | √ | ||
| Restrict accessibility for cars in cities (Low Emission Zones) | √ | |||
| Promote home office and deliveries | √ | |||
| Reduce road and parking infrastructure | √ | |||
| Increase driving costs (congestion charge, fuel taxation, parking charges) | √ | |||
| Increase market penetration of EV, HEV | √ | |||
| Improve material use in vehicle manufacturing processes | √ | |||
| Shift to smaller cars and reduced engine power | √ | |||
| Higher investments in EV charging stations | √ | |||
| Speed regulation on highways | √ | |||
| More automated driving tasks | √ | |||
| Stricter emission standards | √ | |||
| Reduce indirect emissions of electricity through renewable energy | √ | |||
| Raise share of next generation biofuels | √ | |||
| Introduce carbon capturing and sequestration (CCS) | √ | |||
| Developments in Car Mobility | ||
|---|---|---|
| Pace of Transition | Car Ownership Prevails (B1) 1 | Shift to Multi-Modality (B2) |
| Fast car technology transition (A1) 1 | Moderate (Scenario 1) | High (Scenario 3) |
| Slow car technology transition (A2) | Low (Reference case) | Moderate (Scenario 2) |
| Influencing Factors 1 | Base Case 2010 | Reference 2050 | Scenario 1: EV Dominates | Scenario 2: Shared Mobility | Scenario 3: Green Energy |
|---|---|---|---|---|---|
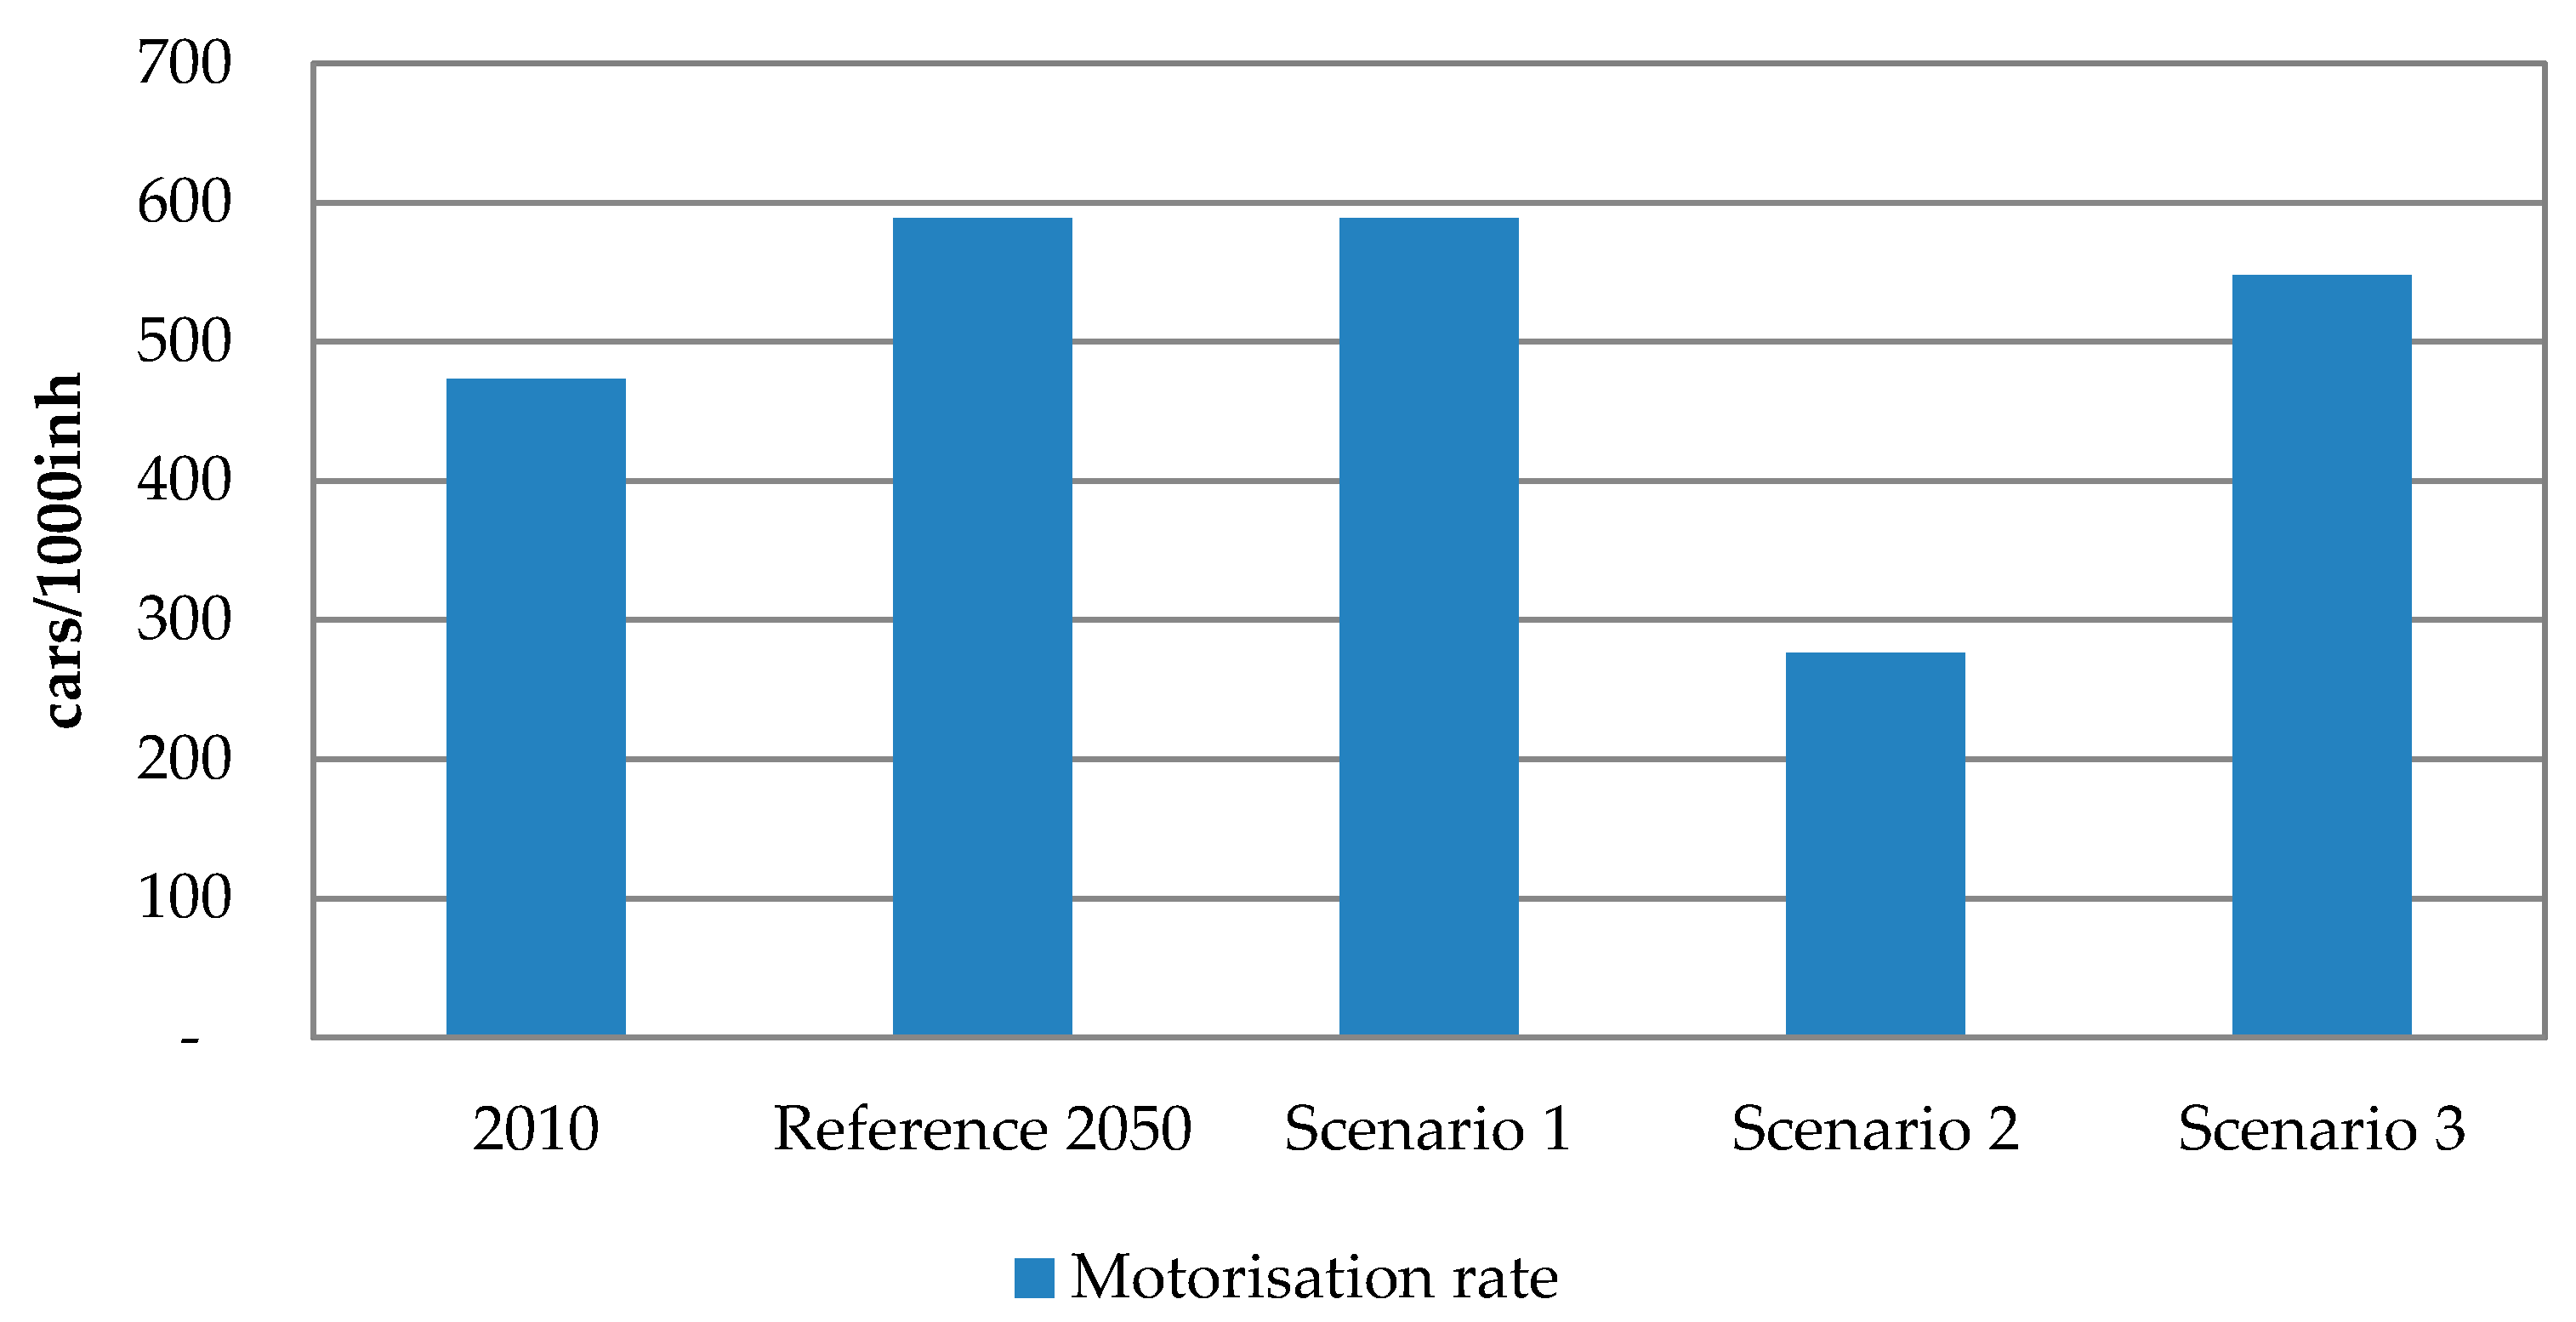
| Avg. mileage (km/vehicle) | 13,325 | 13,054 | 13,054 | 16,056 | 12,270 |
| Car fleet size (millions) | 236 | 307 | 307 | 144 | 286 |
| F × M (bn. vehicle-km) | 3144 | 4009 | 4009 | 2318 | 3505 |
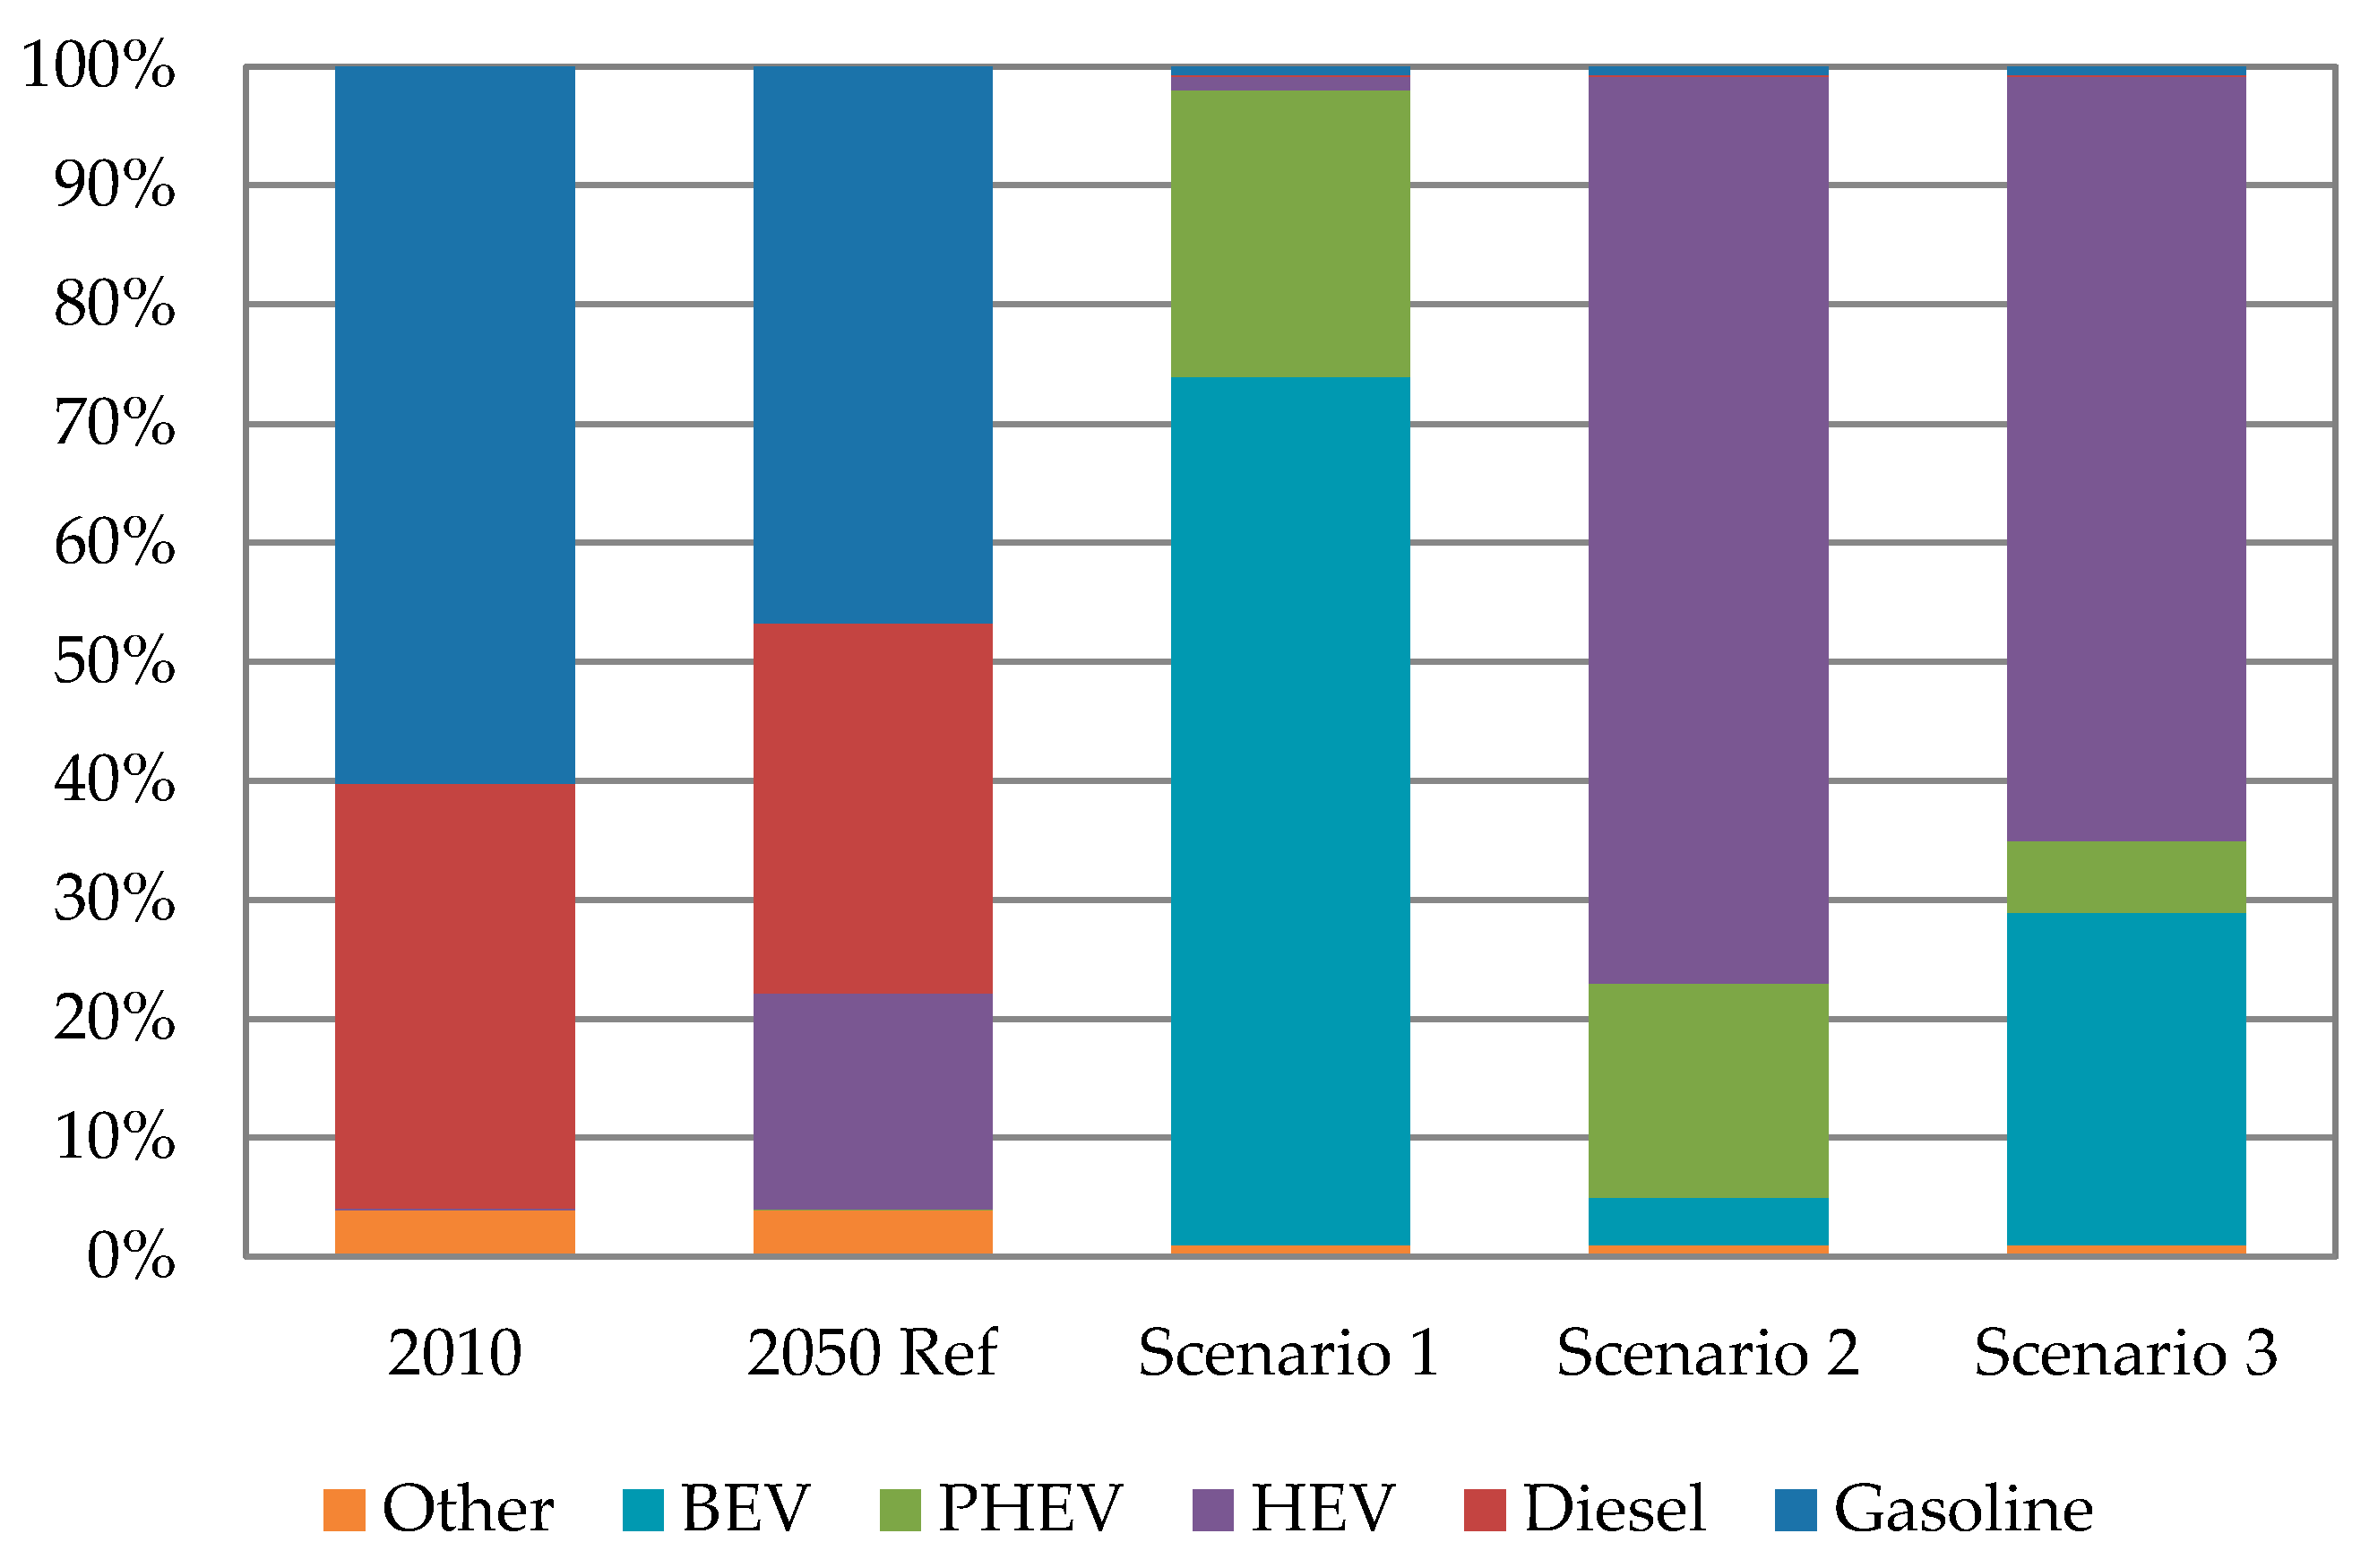
| Share of conventional cars | 100.0% | 100.0% | 3.0% | 78.0% | 66.0% |
| Share gasoline | 60.2% | 46.7% | 0.7% | 0.7% | 0.7% |
| Share diesel | 35.7% | 31.2% | 0.2% | 0.2% | 0.2% |
| Share CNG 2 | 0.5% | 0.5% | 0.5% | 0.5% | 0.5% |
| Share LPG 2 | 3.5% | 3.5% | 0.5% | 0.5% | 0.5% |
| Share HEV | 0.1% | 18.1% | 1.1% | 76.1% | 64.1% |
| Share of electric cars | 0.0% | 0.0% | 97.0% | 22.0% | 34.0% |
| Share PHEV | 0.0% | 0.0% | 24.0% | 18.0% | 6.0% |
| Share BEV | 0.0% | 0.0% | 73.0% | 4.0% | 28.0% |
| Consumption conventional/change per year (kWh/km) | 0.704 | −1.13% | −1.28% | −1.13% | −1.28% |
| Consumption electric car/change per year (kWh/km) | 0.348 | −1.03% | −1.19% | −1.03% | −1.19% |
| WTT emissions electricity (kgCO2/kWh) | 0.544 | 0.500 | 0.380 | 0.380 | 0.050 |
| E × C (gCO2/km) | 247 | 129 | 57 | 100 | 65 |
| Total emissions (Mt CO2) | 777 | 515 | 230 | 230 | 230 |
© 2017 by the authors. Licensee MDPI, Basel, Switzerland. This article is an open access article distributed under the terms and conditions of the Creative Commons Attribution (CC BY) license (http://creativecommons.org/licenses/by/4.0/).
Share and Cite
Höltl, A.; Macharis, C.; De Brucker, K. Pathways to Decarbonise the European Car Fleet: A Scenario Analysis Using the Backcasting Approach. Energies 2018, 11, 20. https://doi.org/10.3390/en11010020
Höltl A, Macharis C, De Brucker K. Pathways to Decarbonise the European Car Fleet: A Scenario Analysis Using the Backcasting Approach. Energies. 2018; 11(1):20. https://doi.org/10.3390/en11010020
Chicago/Turabian StyleHöltl, Arne, Cathy Macharis, and Klaas De Brucker. 2018. "Pathways to Decarbonise the European Car Fleet: A Scenario Analysis Using the Backcasting Approach" Energies 11, no. 1: 20. https://doi.org/10.3390/en11010020
APA StyleHöltl, A., Macharis, C., & De Brucker, K. (2018). Pathways to Decarbonise the European Car Fleet: A Scenario Analysis Using the Backcasting Approach. Energies, 11(1), 20. https://doi.org/10.3390/en11010020