Abstract
For a high penetration level of distributed energy resources (DERs) in the grid, virtual synchronous generator (VSG) control is applied to the power electronic converters to mimic the rotating mass and damping property of a conventional synchronous generator (SG), which can support virtual inertia and damping for the power system. For VSG control, a phase locked loop (PLL) is needed to estimate the angular frequency of the point of common coupling (PCC); however, the deviation of PLL will affect the accuracy of the active power reference, and even the VSG stability control. From this perspective, an enhanced active power controller without PLL was proposed for VSG control. Furthermore, an accurate small-signal model of the multiple parallel VSGs system that considers the dynamic characteristics and the changing of a steady state operation point was derived for system analysis and parameter design. Based on this model, the influence rules of the eigenvalues by droop and virtual inertia were acquired. The simulation and experimental results are presented to verify the validity of the proposed active power controller and parameter design rules.
1. Introduction
In recent years, distributed generation (DG) systems based on renewable energy have been playing an increasingly important role in power systems. As the interface between the grid and DG systems such as fuel-cells, photo-voltaic, and micro-turbines, these power electronic converters are important links to inject high-quality power into the grid [1,2]. Traditional energy mostly connects to the power grid by a synchronous generator (SG), which can provide robustness and operability during grid faults and power disturbances. Compared with conventional synchronous generators, the distributed power inverter has the advantage of a quick response; however, power electronic converters cannot offer enough inertia and damping support to the power grid [3,4,5].
When traditional generation sources based on synchronous generators (SGs) are replaced by distributed power units with power electronic interfaces, it appears that the total rotating mass of the system is seriously reduced. So, as the penetration of distributed sources increases, the problem will seriously affect the dynamic response and stability of the power system [6]. Therefore, the concept of a virtual synchronous generator was proposed and studied. The main idea of a virtual synchronous generator (VSG) is to mimic the synchronous generator operating characteristics by controlling the switching pattern of the DG inverters. Therefore, the power electronics interface of the DG system can exhibit a reaction with the inertia and damping components, which are similar to those of a synchronous generator during load changes or frequency disturbances. Due to the principle of the VSG, every DG inverter can be considered as a synchronous generator, so that the relevant control strategy and theoretical analysis of the traditional synchronous generator can be effectively transplanted into a microgrid with a high penetration of distributed renewable energy for the friendly access of the distributed energy resources (DERs) [7].
In 1997, the static synchronous generator (SSG) was first exploited as an efficient control paradigm by the task force research group of IEEE. In the relative terms of the flexible AC transmission system (FACTS), SSG was defined as that which may be coupled to an AC power system for the purpose of exchanging independently controllable real and reactive power. Based on this idea, the concept of a virtual synchronous machine (VISMA) was firstly proposed in 2007, describing a new type of grid feeding inverter which entirely operates with a storage system and exhibits the amount of inertia and damping properties of electromechanical synchronous machines. At the same time the VSYNC project funded by the European Commission under the FP6 framework program started, in which the concept of Virtual Synchronous Generator (VSG) is demonstrated and put into practice. Additionally, the synchronverter concept, another implementation of VSG, was presented in 2009, which directly embeds the mathematical model of SG into the controller to control the voltage generated [7]. The virtual inertia, friction coefficient, field inductance, and mutual inductance of a synchronverter can be flexibly set to design the parameters of a synchronverter according to the grid connected. In recent years, many researchers have conducted many studies on the virtual synchronous generator.
Up until now, VSG control technology has been developed for nearly 40 years, where the research work on VSG has mainly focused on VSG modeling, control strategy, stability analysis, and application.
● VSG Modeling
Based on SG models in a different order, the mathematical model of VSG is established such as the second order, the third order, the fourth order, and the fifth order [8]. Due to the existence of several VSG control algorithms for DG inverters, they can be classified into two categories: the high-order model and the low-order model. The high-order VSG control algorithm has two configurations: the voltage-to-current model and the current-to-voltage model [9].
However, the high order model is too complex to realize, so the low-order model has been widely used in the recent literature. Current research mainly focuses on the second-order model of a synchronous generator, which contains the mechanical part and the electrical part. The rotor inertia and damping characteristics of the synchronous generator are reflected by the mechanical rotation equation, otherwise known as the swing equation [10]. The electrical part of the low-order model is based on the stator voltage equation, which describes the relationship between stator voltage and current. If the intrinsic electromagnetic properties of the stator are considered, the electromagnetic model of the synchronous inverter can be used, as proposed in [11].
● Power-Frequency Control and Excitation Control
Actually, the power-frequency control and excitation control of VSG are used to reveal the P-f (P-ω) and Q-U droop characteristics by emulating the governor and excitation regulator of a synchronous generator, respectively.
In [12], the differential term of active power and reactive power was introduced in P-f droop control, where the active power and reactive power terms were used to ensure the steady-state characteristics; and the differential term was used to improve the dynamic characteristics. The linearized transfer equation of active power was used to decouple the damping factor from the angular deviation for reducing power and frequency oscillation in the system. In other work [13], the virtual impedance was equivalent to the VSG impedance, and the droop characteristic of the micro-power output voltage was realized through the voltage drop of virtual impedance. The VSG reactive power was precisely distributed through the influence of line impedance inconsistency on power allocation, which was reduced by dynamically adjusting the droop coefficient of parallel DGs [14]. However, the phase locked loop (PLL) is needed in droop control to obtain the frequency of the point of common coupling (PCC), and the deviation of PLL will affect the accuracy of the active power reference calculated by the method previously mentioned, and even the stability of the VSG control system.
● Small Signal Modeling and Parameter Analysis
The main purpose of VSG technology is to improve the stability of a power system that a large number of micro-power elements have access to, and the small signal analysis method is usually used to analyze the stability of the system [14,15]. Using the small-signal analysis method, state-space models are built to analyze the oscillation of output active power. The VSG control inherits the advantages of droop control, but easily appears as low-frequency oscillation [15]. Consequently, the line-frequency-averaged small-signal model of the VSG is derived for system analysis and parameter design. Based on the model, the decoupling conditions between the active power loops and the reactive power loops of the VSG are given in [16]. In [17], a high-order small signal model of VSG was established, and the influence of the main control parameters on the stability of the system was discussed by root trajectory analysis. Some studies have quantitatively analyzed the influence of the VSG’s parameter perturbation on grid power tracing, and discussed the design method of the virtual inertia and damping parameters [18]. In [19], the stability of the VSG small signal was analyzed in both the grid-connected and island modes. It was pointed out that the change of inertia time constant, damping coefficient, and reactive power droop coefficient had a great influence on system stability [20]. However, the changing of the state operation point was not considered to simplify the analysis in the above literatures as it was not accurate enough. Therefore, precise small signal modeling and the analysis of the multiple parallel VSG system have become urgent problems that need to be solved.
In this paper, an enhanced active power controller without PLL is proposed for the establishment of VSG control, and an accurate small-signal model of a multiple parallel VSG system was established step by step, before the variation of the system eigenvalues and their influence on the stability of small signals system were analyzed with the deviation of VSG key parameters (droop coefficient and virtual inertia). The design rule of the droop coefficient and virtual inertia for the main parameters of the multiple parallel VSGs system are then shown.
2. Basic Operation Principle of Inverters as VSG
Figure 1 shows the basic principle of the VSGs. The distributed energy resources such as wind and solar energy can be equivalent to a prime motor, and a classical three-phase voltage-source inverter was used as synchronous generators that can mimic the properties of SGs such as power droop, damping, and inertia. Following the principle of the VSG, every distributed grid-connected inverter operated as a synchronous generator, so that the method and theory of large-scale grid stability controlling could be transplanted into controlling a microgrid with a high penetration of distributed energy resources (DREs) [21,22]. Therefore, the problem of the fluctuating DREs affecting the voltage and frequency of the microgrid can be solved effectively.
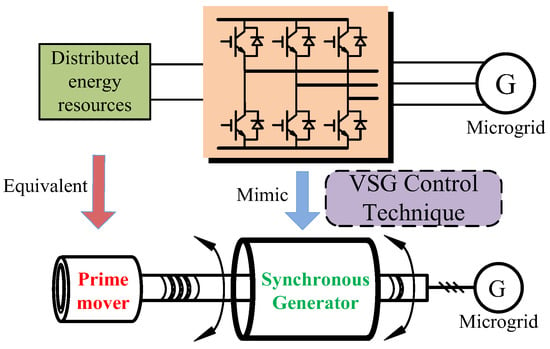
Figure 1.
Concept of a virtual synchronous generator.
There are two important parts of VSG realization: the mathematical modeling and the operation control algorithm. The existence of VSG control algorithms can be classified into two categories: high-order models and low-order models [8]. As the high-order models such as the fifth order model and seventh order model are very complex, the low-order models have been used in enormous applications in recent literature. The second order model is a typical low-order model of VSG, which consists of two parts: the mechanical part and the electrical part. The swing equation is known to describe the relation of the inertia, damping, and rotor angular velocity of SGs. Depending on the swing equation, the control algorithm of the second order model is equivalent to the traditional droop mechanism. Similarly, the swing equation has two main types, as shown in Table 1. Both of the two types of swing equation have extensive applications in a VSG control system. It is noted that the two types of the swing equation cannot be mixed. In the swing equation under System International (SI), the rotor inertia is used to denote the virtual inertia of VSG. However, the per unit inertia constant H is usually used for the swing equation in per unit (pu). In the pu type of the swing equation, is the per unit rotor angular frequency; and are the per unit mechanical and electromagnetic torque, respectively; is the damping coefficient; is the rotor phase angle with the number of pole-pairs being set to 1; and the base angular grid frequency is defined by . The corresponding parameters in Type SI are represented in Equation (1).

Table 1.
The Swing equation with type SI and type pu.
This paper adopted the classical second order model for VSG modeling, which mainly includes the mechanical part and the electrical part, as seen in Equation (1). The mechanical part is indicated by the rotor motion equation; moreover, the electrical part is shown by the stator voltage equation. It is noteworthy that all the equations in this paper are presented in SI, for unity of the variables.
where Pm is the mechanical active power that is the same as the one of the prime mover; Pe is the electromagnetic active power; ω is the rotor angular frequency; is the rated angular frequency; is the angular frequency of the grid; is the electric angle of rotor; D is the damping factor; is the virtual rotor inertia; is the armature resistance; is the synchronous reactance; is the output voltage of the VSG; is the excitation electromotive force; and is the stator current [22].
Based on the basic control principle of SG, the traditional droop control method was used in the VSG control system for mimicking the actual frequency regulator and voltage regulator. The rotor angular frequency reference and the voltage amplitude reference used for the inner voltage and current loop control can be calculated by Equation (2), which were obtained under the assumption of a purely inductive transmission line.
where PN and QN are the rated active power and reactive power, respectively; P and Q are the output active power and reactive power of VSG, respectively; DP is the damping coefficient of the P-ω control loop; and Dq is the damping coefficient of the Q-U control loop. Figure 2 shows the block diagram of the traditional frequency control and virtual inertia control of VSG. is the frequency at PCC measured by the phase locked loop (PLL). Regardless of whether the inverter was island or grid-tied, was the same when the frequency of the PCC was nearly constant with a ±0.2 Hz deviation. The frequency dynamics were determined by the droop characteristic so that the load disturbance could be shared among the VSGs with appropriate droop characteristics.
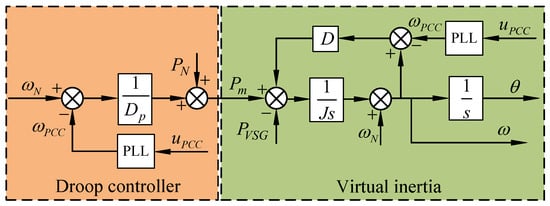
Figure 2.
Active power controller of VSG.
According to Equations (1) and (2), the active power controller—which includes the droop controller and virtual inertia controller—can be described as:
Hence, the deviation of PLL will affect the accuracy of the active power reference calculated by the method previously mentioned, and even the stability of the VSG control system. Furthermore, it is not easy to obtain the transient frequency deviation in practical projects. Therefore, a simplified active power controller of VSG without PLL is presented. In situations where the grid frequency’s offset is in general very small, can be considered as , and a new form of Equation (3) is shown as Equation (4). Thus, the simplified active power controller of VSG is shown in Figure 3.
where .

Figure 3.
Simplified active power controller of VSG.
Figure 4 shows the reactive power controller of the VSG, which is operated as an excitation regulator in the SG control system. ki is the integral constant of the proportional-integral (PI), which is used to make the voltage of PCC follow the voltage reference; and QVSG is the output reactive power feedback value of VSG.

Figure 4.
The virtual excitation regulator of VSG.
3. Modeling of Multiple Parallel VSGs System
In this work, a multiple parallel inverters system was studied where every paralleled inverter was a typical three-phase voltage source inverter using VSG control. The structure of the multiple parallel VSGs system is shown in Figure 5. VSGs #1–#n and the public load are connected to the PCC, and the PCC is connected to the grid through the isolation switch. The same control scheme was used in the paralleled VSGs #1–#n, so only the control structure of VSG #1 is presented in detail. Note that it was assumed that the multiple parallel VSGs system was connected to distributed energy resources (DERs) with an infinite capacity, so the DC side voltage of the VSG was kept stable all the time. Therefore, the impact of the DC side voltage on the modeling of the multiple parallel VSGs system will not be further discussed.
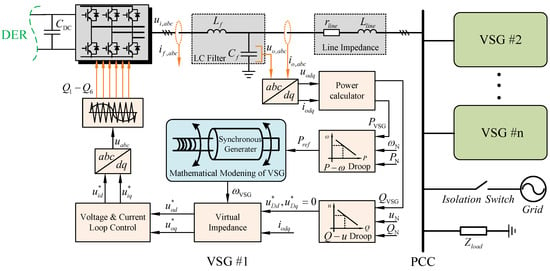
Figure 5.
Structure of the multiple parallel VSGs system.
3.1. State-Space Model of Individual VSG
To obtain the modeling of the multiple parallel VSGs system, the state-space model of an individual VSG needed to be first established. In this section, all elements in the VSG control system as shown in Figure 1 are expressed in terms of mathematical equations as a basis for the small-signal model. For clarity, the proceeding of individual VSG state-space modeling is divided into two parts.
3.1.1. Power Circuit Part
● Inverter
As is well-known, an inverter is a switch-mode circuit in nature. If the switching frequency of Insulated Gate Bipolar Transistors (IGBTs) is high enough, it can be assumed that the switching action will not affect the evolution of the model states. During the components production development, the switching frequency of IGBTs becomes higher, where the aforementioned assumption becomes more possible. As the inverter can be seen as a saturated voltage gain, no state equations are needed [23].
● LC Filter Equations
A typical LC filter was used as the output filter of the VSG, which was composed of the filter inductance Lf and its equivalent resistance Rf, and the filter capacitor is given by Cf. Following Kirchhoff’s voltage law (KVL), the state equations of the LC filter can be presented as:
where if is the filter inductor current, io is the current flowing through the transmission line and into the PCC, ui is the output voltage of the inverter, and uo is the filter capacitor voltage.
In this case, with amplitude-invariant Park transformation, Equation (1) in the two-phase synchronous reference frames (dq-axis) can be expressed as:
where ω is the angular frequency at the PCC; if the multiple parallel VSGs system is in a grid-connected operation, ω will follow the angular frequency of the grid; otherwise, ω is the angular frequency of the VSG since the system is an islanded operation.
With the losses in switching elements (e.g., IGBTs and diodes) neglected, it can be assumed that the output voltage of the VSG-controlled inverter will be equal to its reference value, as follows:
where and are the voltage reference of the inverter in the dq-axis, and uid and uiq are the actual voltage of the inverter in the dq-axis.
● Transmission Line Equations
The DER inverter interface is connected with the PCC through the transmission line, with the line parameters consisting of resistance Rline and inductance Lline, as shown in Figure 5. Like the LC filter, the state space equations of the transmission line in dq-axis are given as follows:
where and are the PCC voltage in the dq-axis.
● Load Equations
A typical RL load is represented by the combination of the resistor Rload and inductor Lload. In the case of an island operation, the state space equations describing the load dynamics are given in Equation (9). If the isolation switch closed, the voltage of the multiple parallel VSGs system is controlled by the voltage of the grid, so .
3.1.2. Control System Part
● abc-dq and dq-abc Transformation
In the control system of the multiple parallel VSGs system as shown in Figure 5, the output voltage and current of the VSG interface in the stationary reference frame are transformed into d-axis and q-axis components through a abc-dq block. Following this, after a series of mathematical algorithms, a dq-abc block is used to obtain the three-phase modulation voltage in the stationary reference frame at the end. The transformation matrices of the abc-dq block and dq-abc block are defined by Equations (10) and (11), separately.
It can be clearly seen that there are no state variables in the expressions in Equations (10) and (11), so no state space equation is needed.
● Power Calculator
The power calculator applied in this case for calculating the instantaneous active power p(t) and reactive power q(t), as well as its block diagram, is shown in Figure 6 in detail. The dq-axis output voltage uodq and the dq-axis output current iodq are taken from the measurements of the VSG interface. Then, the instantaneous power is passed through low-pass filters with the cut-off frequency , in order to obtain the active and reactive power [22,23]. The state space equations describing the power calculator are expressed by:

Figure 6.
Power calculator.
● Virtual Impedance
Droop control is an important part of the VSG control system for sharing the load power autonomously. The well-known P-ω and Q-U droop method is usually adopted to ideally make it easy for the droop control to connect with the swing equation. Furthermore, the traditional P-ω and Q-U droop control are valid under the assumption that the line impedance is inductive. However, the low-voltage line is more resistive [12], so to deal with this problem, virtual impedance is often used to meet the requirement for traditional droop control.
As shown in Figure 5, the equations of the virtual impedance block are:
where Rv and Lv are the resistor and inductor of the virtual impedance, separately.
● Voltage and Current Loop Control
The voltage and current loop control block diagram is shown in Figure 7 in detail, which is in the traditional form including all feed-back and feed-forward terms. and are the parameters of the proportional-integral (PI) controller of the outer voltage loop; and and are the parameters of the PI controller of the inner current loop. The gain factors F and H are used to disable or enable the voltage and current feed-forward, separately, with their values being set to 1 or 0. Thus, both the voltage reference (, ) and current reference (, ) for the VSG-controlled inverter are defined by:
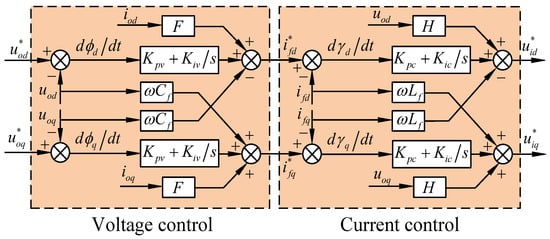
Figure 7.
Block diagram of the voltage and current loop control.
The states φ and γ are defined to assess the dynamic properties of the PI controllers in the voltage and current loop, and the corresponding state equation in the dq-axis is shown as:
3.2. Small-Signal Model of Individual VSG and Multiple Parallel VSGs System
3.2.1. Small-Signal Model of Individual VSG
As previously discussed, all the state-space equations needed for modeling the VSG have been introduced. Based on Equations (2), (3), (6), (8), (9), (12), and (15), the state-space model of the i individual VSG in the system contains 15 state variables and two input signals, and the state vector and input vector u are defined by Equations (18) and (19), respectively.
It can be seen that the voltage of PCC is considered as the input to each VSG, but the PCC voltage perturbation usually occurs with load step jumping. To effectively describe the PCC voltage by state variables, it can be assumed that a virtual resistor rn with a large enough resistance is connected at the PCC, and therefore, the virtual resistor has a negligible influence on the system dynamic. Hence, the equations about the PCC voltage are given as:
Then, the state-space model of the individual VSG system is given by:
It is clear that the steady state operating point of the ith individual VSG can be found with the condition defined by Equation (22), and the state variables at this point are denoted by .
Thus, the state space equations from Equation (21) can be linearized around the steady state operating point, and the small-signal model of the individual VSG system can be described by:
where the prefix ∆ denotes small-signal deviations around the steady-state operating point.
3.2.2. Small-Signal Model of Multiple Parallel VSGs System
In the multiple parallel VSGs system, every individual VSG connects to the PCC of the whole system where each VSG operates in its own local reference frame. For small-signal modeling of the whole multiple parallel VSGs system, all the state variables need to be converted to the same unified reference frame using the transformation method as shown in Figure 8, and the transformation equations are shown as:
where is the angle difference between the local reference frame of the VSG #i and the unified reference frame.
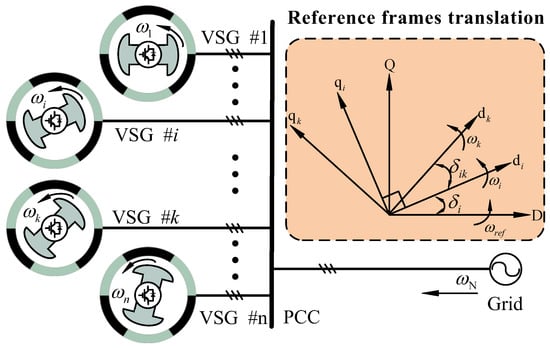
Figure 8.
Reference frame transformation.
Generally, the local reference frame of the VSG #1 is taken as the unified reference frame, so the state vector is defined by:
where is the angular difference between VSG #k and VSG #1, and k is from 2 to n.
Finally, the small-signal model of the multiple parallel VSGs system can be obtained as:
where , .
4. Results and Analysis
In this section, the results from the time-domain simulations and the electrical simulations in MATLAB/Simulink are presented for the verification of the presented small-signal model. Moreover, the stability analysis and evaluation of the parameters on the system dynamics were conducted. To explain the problem more clearly, a two-parallel VSGs system is discussed as an example, as shown in Figure 9.
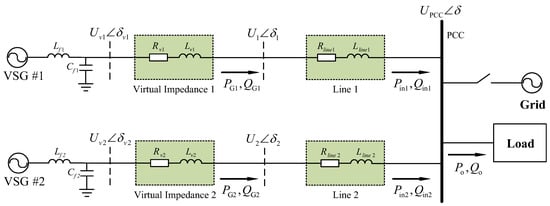
Figure 9.
Test example of the multiple parallel VSGs system (two-parallel VSGs).
4.1. Verification of Small-Signal Model
By applying the parameters listed in Table 2, the perturbation of the load occurred in the two-parallel VSGs system at 2 s. First, the averaged model was simulated in MATLAB/Simulink to obtain the stable operating points, around which the nonlinear system could be linearized. Under the parameter conditions (before the load changing and after the load changing), there were two set of operating points. The dynamic response of the state-space variables in the small-signal model (ssm) are shown in Figure 10 and Figure 11, together with the results from the electrical simulation model (esm), labeled as “(ssm)” and “(esm)”, respectively. Furthermore, the start-up transient and initial steady-state before 1.8 s are not contained in the results for simplicity. The subscripts “1” and “2” denote whether the results were from VSG #1 or from VSG #2. The dynamic response of the angular frequency, active power, and reactive power is shown in Figure 10. During stage (0 < t < 2 s), the two-parallel VSGs system was originally operated with load1, and load2 was connected to the system at t = 2 s to emulate a load perturbation at PCC. It is clear that the changed tracks of and are nearly the same, decreasing from 315.7 rad/s to 314.4 rad/s. The changed trend of active power is opposite to that of the angular frequency, which is properly in accordance with the droop control method after a load perturbation in the system. At 2.0 s, the load2 is connected to PCC, and both the angular frequency and active power change from a steady-state to another via an obvious time delay, which is the representation of virtual inertia in VSG control. The intermediate control signals of the VSGs system are shown graphically in Figure 11, and in all of the graphs, the transient response decays in about 0.6 s. For all signals considered, the prediction of the small-signal model very closely resembles that found in the electrical simulation model, both in terms of the transient and steady-state response. Additionally, the visible ripples are shown in the electrical simulation results for ifd, ifd, iod, and iod.

Table 2.
The parameters and initial conditions.
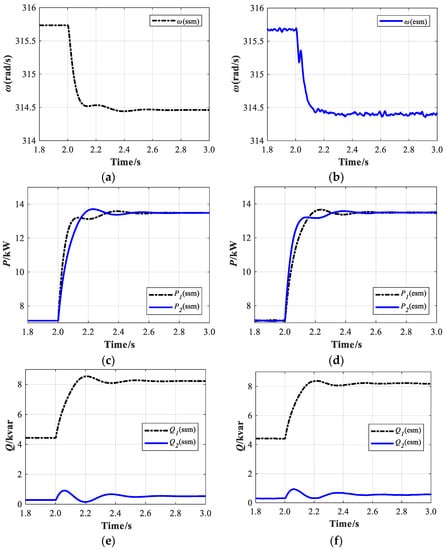
Figure 10.
Transient impact of the electrical simulation model and small-signal model with load perturbation: the angular frequency; and the active and reactive power: (a) The angular frequency at PCC in ssm; (b) The angular frequency at PCC in esm; (c) The active power of the two VSGs in ssm; (d) The active power of the two VSGs in esm; (e) The reactive power of the two VSGs in ssm; (f) The reactive power of the two VSGs in esm.
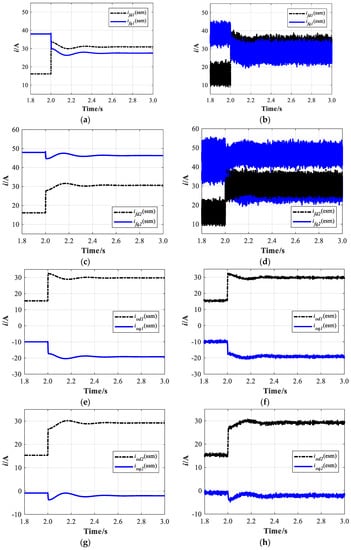
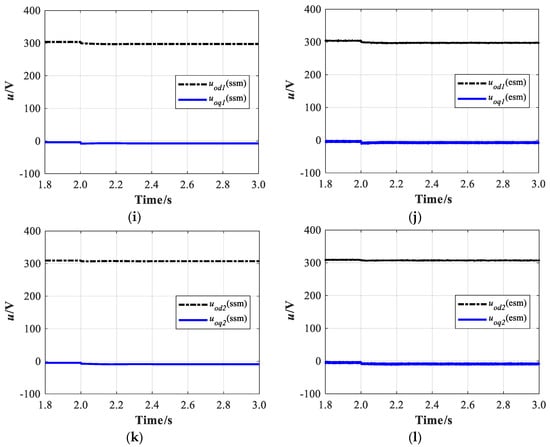
Figure 11.
Transient impact of the electrical simulation model and small-signal model with load perturbation: the intermediate control signals in the VSG control system: (a) The ifd and ifq of the VSG #1 in ssm; (b) The ifd and ifq of the VSG #1 in esm; (c) The ifd and ifq of the VSG #2 in ssm; (d) The ifd and ifq of the VSG #2 in esm; (e) The iod and ioq of the VSG #1 in ssm; (f) The iod and ioq of the VSG #1 in esm; (g) The iod and ioq of the VSG #2 in ssm; (h) The iod and ioq of the VSG #2 in esm; (i) The uod and uoq of the VSG #1 in ssm; (j) The uod and uoq of the VSG #1 in esm; (k) The uod and uoq of the VSG #2 in ssm; (l) The uod and uoq of the VSG #2 in esm.
It can be seen that the transient and steady-state response of the small-signal model and the electrical simulation model very closely resembled each other. During the transient response, the active power of the VSG varied, as opposed to the reference values from the P-ω controller. Additionally, the response of the high-frequency switching ripple was obvious for all signals.
4.2. System Stability by Eigenvalue Analysis
The small-signal dynamics of the linearized small-signal model as shown in Equation (21) were accessed by performing an eigenvalue analysis for the main parameters in the system. With the values of the main system parameters of the two-parallel VSGs system as discussed previously, the system eigenvalues are shown in Table 3. Based on the damping ratio, the eigenvalues were divided into three groups: fast states, middle states, and slow states. The eigenvalues with indexes 3 to 10 contributed to the fast dynamics, the eigenvalues with indexes 17 and 18 contributed to the slow dynamics, and the eigenvalues with indexes 11 and 14 belonged to the middle ones. The natural oscillation frequency of the first and second eigenvalues’ real parts were much more negative (on the order of 107) when compared to the rest of the eigenvalues, and their nature frequency was near the system frequency. Therefore, they have little association with the dynamic behavior of the system, and are thus neglected in the following discussion.

Table 3.
The system eigenvalues.
By plotting the eigenvalue loci in the complex plane, the impacts of the main parameters on system dynamics could be quantified. The eigenvalue loci in the complex plane with the parameters changing are shown in Figure 12 and Figure 13, such as the droop coefficient and inertia value. The eigenvalues are marked with red stars, and arrows indicate the direction of the parameter sweep. For simple analysis, the parameters of the two VSGs were set at the same value, and only the important eigenvalues were plotted.
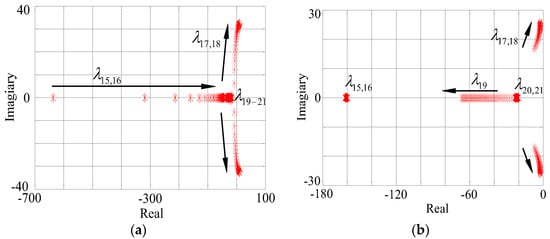
Figure 12.
Eigenvalue loci (only the important eigenvalues shown) for a parametric sweep of the droop coefficient: (a) Dp1,2 in a range from 0.00005 to 0.002; and (b) Dq1,2 in a range from 0.00015 to 0.006.
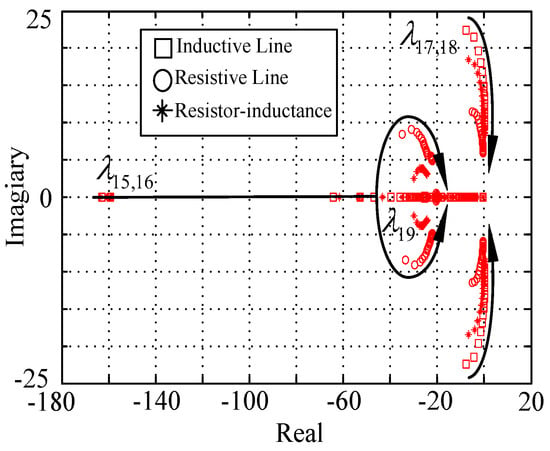
Figure 13.
Eigenvalue loci for a parametric sweep of the inertia J.
● Impact of Droop Coefficient on System Dynamics
With a variation of droop coefficient Dp1,2, which changed from 0.00005 to 0.002, the parametric eigenvalue analysis was repeated. In the overview of the eigenvalue loci shown in Figure 12a, the eigenvalues were neglected due to little change in their location. The eigenpair moved towards the right half of the complex plane, and the real part of increased as the damping ratio was reduced. Furthermore, when the value of Dp1,2 was more than 0.00055, an obvious vibration appeared, and the entered the unstable region of the complex plane that generated the instability of the system.
Figure 12b shows the eigenvalues loci in the parametric sweep of droop coefficient Dq1,2 varying in the range of 0.00015 to 0.006. Due to little location changing, the eigenvalues were neglected and are not discussed in the following. With the reactive power droop coefficient increasing, it was clear that the damping ratio of the eigenpair was reduced, and gradually became close to the imaginary axis, which was not conducive to the stability of the system. This loci showed that an increase in the reactive power droop coefficient could result in a narrow range of stable operation, and even caused instability of the system.
● Impact of Virtual Inertia on System Dynamics
The virtual inertia feature is one of the main characteristics of the VSG system when compared to the traditional DC/AC inverter, so it is needed to assess the impact of inertia on the system dynamics. For the analysis in the following, the line parameter in the system was set to different cases such as the pure inductive line, pure resistive line, and resistor-inductance line. Then, the parametric sweep of inertia was conducted in the range of 0.1 kg∙m2 to 4.1 kg∙m2.
The eigenvalue loci for the sweep of virtual inertia are plotted in Figure 13. It was observed that the range of stable operation became narrow following the variation of inertia. The eigenvalue gradually moved towards the right side of the complex plane. With the virtual inertia increasing, the eigenvalue became a pair of conjugate complex roots. The real component of the eigenvalue increased gradually, as the imaginary part decreased. Obviously, played an important role in influencing the stability of the system, and even makes the system potentially unstable. It was clear that the low value of inertia could produce a higher risk of small-signal instability with slow-frequency oscillation.
4.3. Design Rule for the Droop Coefficient and Virtual Inertia
Based on the previous sections, the design rule of the droop coefficient and virtual inertia for the main parameters of the multiple parallel VSGs system are shown as the following:
- The increase of the active power and reactive power droop coefficient may decrease the relative damping with low-frequency eigenvalues, which goes against the system stability. Too large a value of Dp and Dq can cause low-frequency oscillation in the multiple parallel VSGs system.
- Decreases in the virtual inertia will increase the damping ratio of the low-frequency eigenvalues. Even with plenty of large virtual inertia, the low-frequency eigenvalues will be presented with divergent oscillation in the multiple parallel VSGs system.
This rule is important for parameter design and optimization of the multiple parallel VSGs system such as the droop coefficient and the virtual inertia, which are the key parameters for VSG control. During the parameter design based on the small-signal model analysis, it must be ensured that all the eigenvalues of the system in every frequency range are provided with enough damping. The parameter design for the multiple parallel VSGs system must combine the stability of the eigenvalues in every frequency range.
To verify the design rule proposed, the simulation results (the active power of the two VSG, labeled by P1 and P2) are shown in Figure 14 under the parametric variation around the critical values, which can be obtained from the corresponding eigenvalue loci. In Figure 13a, it can be perceived that P1 and P2 became gradually unstable with the increasing of Dp, and the power oscillation occurred between the two VSGs when Dp reached the value of 0.00055. Furthermore, the oscillation became very violent when Dp was equal to 0.001. As shown in Figure 13b, the active power of the two VSGs could be well shared before 2.0 s. However, after 2.0 s, the virtual inertia was changed from 0.1 kg∙m2 to 3 kg∙m2, which caused power divergent oscillation in the system. The oscillation will then become strong enough to go against the system stability as time goes on.
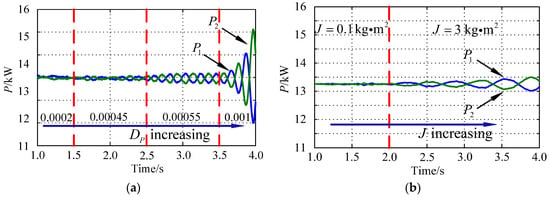
Figure 14.
Effect of the key parameters on the transient performances of the active power P1 and P2: (a) Reactive power droop coefficient Dp increasing; and (b) Virtual inertia J increasing. (The red dotted lines are the boundaries between the two areas of different parameters.)
4.4. Experimental Results
A prototype of parallel VSGs was fabricated and tested in the laboratory, in the island mode. Under laboratory conditions, the load and experiment sequence is shown in the Table 4, and other control parameters of the system are the same as those listed in Table 2. The inverter bridge was comprised of three IGBTs modules (Infineon BSM50GB120DN2) which are driven by LMY DA962. The main control algorithms were implemented in DSP (TMS320F28335). A DC analog voltage source (Aino AN51015-800) was used to emulate the DC power source instead of a renewable energy source to test the dynamic performance of the paralleled VSGs system. All the waveforms were sampled by a Yokogawa DL850 Scope Corder (Yokogawa Electric Corporation, Tokyo, Japan) and WT3000 Precision Power Analyzer (Yokogawa Electric Corporation, Tokyo, Japan).

Table 4.
Experiment sequence.
Figure 15 shows the dynamic performance of the system frequency, where the frequency f of the PCC is obtained by the extra PLL circuit and the angular frequency reference ω from the DSP I/O port. It can be seen that the change of ω very closely resembles f during the experiment sequence, but the oscillation of ω is much bigger than f when the load perturbation occurs. The angular frequency reference can follow the active load perturbation at t1 and t4, which is concordant with the P-ω droop control. At t1 and t4, only the reactive load perturbation occurs. It is clear that ω can remain steady after a small oscillation, while a big value ripple can be observed at t1 and t4. If the frequency f from PLL is put into the VSG control system as a feedback signal, it will be bound to affect the stability of the whole system. This explains why the enhanced active power controller without PLL is proposed in this paper.
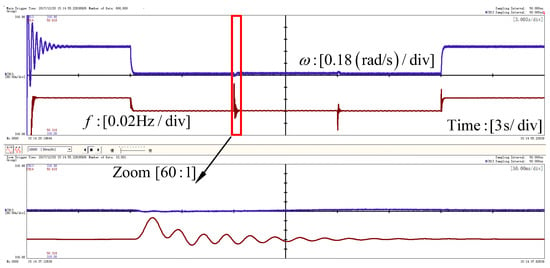
Figure 15.
Experiment results of the system frequency: the frequency f from extra PLL circuit; and the angular frequency reference ω.
Figure 16 and Figure 17 show the steady-state and dynamic waveforms of the parallel VSGs system. It is clear that the active power and reactive power can go along with the load perturbations, respectively. The decoupling of the active power and reactive power was realized well. It implies that the enhanced VSG control can track the load transition rapidly and accurately without oscillation. Their fluctuation is also acceptable for a power system application. From the zoom-in active power and angular frequency waveforms, it is obvious that virtual inertia was obtained during the load perturbations, which is one of the main purposes of the VSG control.
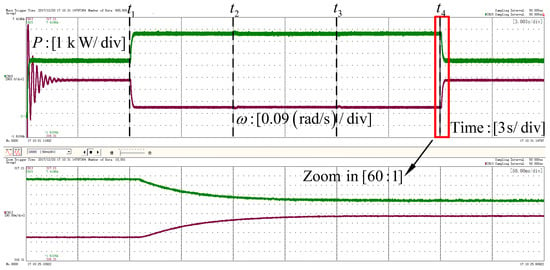
Figure 16.
Experiment results: Angular frequency reference and active power at the PCC.
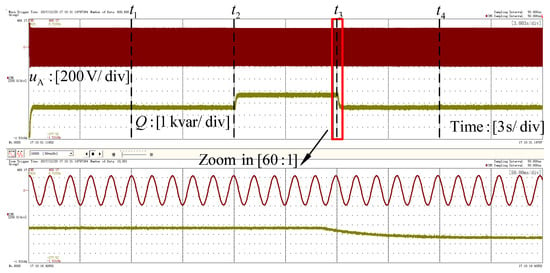
Figure 17.
Experiment results: Phase voltage waveforms of phase A and reactive power at the PCC.
5. Conclusions
With the higher penetration of DERs in the grid, more power electronic converters are used as power interfaces. In comparison to the conventional synchronous generator, the power electronic converters have little rotating mass and damping properties, which might cause stability issues in the grid. For this reason, a virtual synchronous generator that enabled the power electronics converter to behave as an SG was proposed as a solution for grid stability. This paper focused on the issues of the stable operation and small-signal stability analysis for the multiple parallel VSGs system. First, this paper pointed out that the deviation of PLL will affect the accuracy of the active power reference, and even the stability control of the multiple parallel VSGs system, and thus an enhanced active power controller without PLL was proposed. Second, based on the VSG control scheme described in the previous section, a step-by-step method for accurate small-signal modeling of the multiple parallel VSGs system was derived for system analysis and parameter design. The accuracy of the proposed model was assessed through a comparison with the results from the electrical simulation model in MATLAB/Simulink. With the proposed accurate small-signal model, the rule of system eigenvalues varying caused by the change of droop coefficient and virtual inertia was carried out and analyzed. The most important contributions of this paper were an enhanced active power controller for VSG, the proposed accurate small-signal model of the multiple parallel VSGs system, and the design rule for the key parameters of the VSG control system.
Acknowledgments
The authors would like to thank the anonymous referees for their helpful comments and suggestions. This work was supported by the Natural Science Funds of Hebei Province (Grant No. E2015502046) and the National High-tech R&D Program (863 Program) of China (Grant No. 2015AA050603), in part by the Fundamental Research Funds for the Central Universities (Grant No. 2017MS088) and the Scientific Research Program of Hebei University (Z2017132).
Author Contributions
Each author contributed extensively to the preparation of this manuscript. Bo Zhang and Xiangwu Yan performed the literature review. Bo Zhang established the small-signal model of the multiple parallel VSGs system. Xueyuan Zhang performed the electromagnetic time-domain simulations in the MATLAB/Simulink. Dongxue Li and Jinzuo Han performed the experiment in the laboratory. Bo Zhang and Xiangning Xiao wrote the paper.
Conflicts of Interest
The authors declare no conflict of interest.
References
- Katiraei, F.; Iravani, M.R. Power management strategies for a microgrid with multiple distributed generation units. IEEE Trans. Power Syst. 2006, 21, 1822–1831. [Google Scholar] [CrossRef]
- Guerrero, J.M.; Matas, J.; Vicuna, L.G.D. Decentralized control for parallel operation of distributed generation inverters using resistive output impedance. IEEE Trans. Ind. Electron. 2007, 54, 994–1004. [Google Scholar] [CrossRef]
- Chen, D.; Xu, Y.; Huang, A.Q. Integration of dc microgrids as virtual synchronous machines into the ac grid. IEEE Trans. Ind. Electron. 2017, 99, 7455–7466. [Google Scholar] [CrossRef]
- Zhong, Q.; Hornik, T. Control of power inverters in renewable energy and smart grid integration. Appl. Environ. Microbiol. 2012, 62, 3128–3132. [Google Scholar]
- Zhong, Q.C.; Weiss, G. Synchronverters: Inverters that mimic synchronous generators. IEEE Trans. Ind. Electron. 2011, 58, 1259–1267. [Google Scholar] [CrossRef]
- Chen, Y.; Hesse, R.; Turschner, D.; Beck, H.P. Improving the grid power quality using virtual synchronous machines. In Proceedings of the 2011 International Conference on Power Engineering, Energy and Electrical Drives, Málaga, Spain, 11–13 May 2011; pp. 1–6. [Google Scholar]
- Zhong, Q.C. Power-electronics-enabled autonomous power systems: Architecture and technical routes. IEEE Trans. Ind. Electron. 2017, 64, 5907–5918. [Google Scholar] [CrossRef]
- D’Arco, S.; Suul, J.A.; Fosso, O.B. Small-signal modeling and parametric sensitivity of a virtual synchronous machine in islanded operation. Int. J. Electr. Power Energy Syst. 2015, 72, 3–15. [Google Scholar] [CrossRef]
- Arco, S.D.; Suul, J.A. Equivalence of virtual synchronous machines and frequency-droops for converter-based microgrids. IEEE Trans. Smart Grid 2014, 5, 394–395. [Google Scholar] [CrossRef]
- Chen, Y.; Hesse, R.; Turschner, D.; Beck, H.P. Comparison of methods for implementing virtual synchronous machine on inverters. In Proceedings of the Conference on Renewable Energies and Power Quality, Santiago de Compostela, Spain, 28–30 March 2012; pp. 1–6. [Google Scholar]
- Alsiraji, H.A.; El-Shatshat, R. Comprehensive assessment of virtual synchronous machine based voltage source converter controllers. IET Gener. Transm. Distrib. 2017, 11, 1762–1769. [Google Scholar] [CrossRef]
- Alipoor, J.; Miura, Y.; Ise, T. Power System stabilization using virtual synchronous generator with alternating moment of inertia. IEEE J. Emerg. Sel. Top. Power Electron. 2015, 3, 451–458. [Google Scholar] [CrossRef]
- Vasquez, J.C.; Guerrero, J.M.; Luna, A.; Rodriguez, P.; Teodorescu, R. Adaptive droop control applied to voltage-source inverters operating in grid-connected and islanded modes. IEEE Trans. Ind. Electron. 2009, 56, 4088–4096. [Google Scholar] [CrossRef]
- Xia, Y.; Peng, Y.; Wei, W. Triple droop control method for ac microgrids. IET Power Electron. 2017, 10, 1705–1713. [Google Scholar] [CrossRef]
- Liu, J.; Miura, Y.; Ise, T. Comparison of dynamic characteristics between virtual synchronous generator and droop control in inverter-based distributed generators. IEEE Trans. Power Electron. 2015, 31, 3600–3611. [Google Scholar] [CrossRef]
- Wu, H.; Ruan, X.; Yang, D.; Chen, X.; Zhao, W.; Lv, Z. Small-signal modeling and parameters design for virtual synchronous generators. IEEE Trans. Ind. Electron. 2016, 63, 4292–4303. [Google Scholar] [CrossRef]
- D’Arco, S.; Suul, J.A.; Fosso, O.B. A virtual synchronous machine implementation for distributed control of power converters in smartgrids. Electr. Power Syst. Res. 2015, 122, 180–197. [Google Scholar] [CrossRef]
- Rasheduzzaman, M.; Mueller, J.A.; Kimball, J.W. An accurate small-signal model of inverter- dominated islanded microgrids using dq reference frame. IEEE J. Emerg. Sel. Top. Power Electron. 2017, 2, 1070–1080. [Google Scholar] [CrossRef]
- Pogaku, N.; Prodanovic, M.; Green, T.C. Modeling, analysis and testing of autonomous operation of an inverter-based microgrid. IEEE Trans. Power Electron. 2007, 22, 613–625. [Google Scholar] [CrossRef]
- Mo, O.; D’Arco, S.; Suul, J.A. Evaluation of virtual synchronous machines with dynamic or quasi-stationary machine models. IEEE Trans. Ind. Electron. 2016, 99, 5952–5962. [Google Scholar] [CrossRef]
- Zhang, B.; Yan, X.; Altahir, S.Y. Control design and small-signal modeling of multi-parallel virtual synchronous generators. In Proceedings of the IEEE International Conference on Compatibility, Power Electronics and Power Engineering, Cadiz, Spain, 4–6 April 2017; pp. 471–476. [Google Scholar]
- Kroutikova, N.; Hernandez-Aramburo, C.A.; Green, T.C. State-space model of grid-connected inverters under current control mode. IET Electr. Power Appl. 2007, 1, 329–338. [Google Scholar] [CrossRef]
- Rasheduzzaman, M.; Mueller, J.A.; Kimball, J.W. Reduced-order small-signal model of microgrid systems. IEEE Trans. Sustain. Energy 2015, 6, 1292–1305. [Google Scholar] [CrossRef]
© 2018 by the authors. Licensee MDPI, Basel, Switzerland. This article is an open access article distributed under the terms and conditions of the Creative Commons Attribution (CC BY) license (http://creativecommons.org/licenses/by/4.0/).