Comparison of Greenhouse Gas Reduction Potential through Renewable Energy Transition in South Korea and Germany


1
New & Renewable Energy Resource & Policy Center, Korea Institute of Energy Research, Daejeon 34129, Korea
2
Bosch Rexroth AG, Bgm.-Dr.-Nebel-Strasse 2, 97816 Lohr an Main, Germany
*
Author to whom correspondence should be addressed.
Energies 2018, 11(1), 206; https://doi.org/10.3390/en11010206
Submission received: 20 December 2017
/
Revised: 9 January 2018
/
Accepted: 10 January 2018
/
Published: 15 January 2018
(This article belongs to the Section I: Energy Fundamentals and Conversion)
Abstract
:Germany and South Korea are the world’s sixth and seventh largest emitters of greenhouse gases, respectively; their main sources of pollution being fossil-fueled power plants. Since both countries signed the Paris Agreement in 2016, renewable energy transition is emerging as an effective means and method for avoiding air pollutant emissions and for replacing old fossil-fueled power plants. This paper attempts to evaluate—by using a grid emission factor dependent on a series of energy mix scenarios—the potential for South Korea and Germany to reduce their air pollutants (CO2, NOx, SOx, PM (particulate matter)) until 2030. South Korea plans to reduce greenhouse gas emissions by increasing nuclear power, while Germany aims to do so by shutting down its nuclear power plants and expanding the proportion of renewable energy in the energy mix to over 50%. Therefore, both countries are able to achieve their voluntary greenhouse gas reduction targets in the power sector. However, since the uncertainty of the CO2 emission factor of coal power plants in South Korea is as high as 10%, efforts to reduce that uncertainty are required in order to produce a reliable assessment of the avoided emissions.
1. Introduction
According to the Intergovernmental Panel on Climate Change (IPCC) [1], twenty-five percent of global greenhouse gas (GHG) emissions originate from electricity generation. Most of the current electricity supply in both South Korea and Germany is from fossil-fueled power plants (i.e., coal, natural gas, and oil power plants) [2,3]. Thus, air pollutant emissions from power plants contribute a significant percentage of national GHG emissions in both countries.
South Korea and Germany agreed at the Paris Climate Conference 2015, otherwise known as COP21, to reduce their GHG emissions by a significant amount in order to keep the average global temperature increase below 2 degrees Celsius [4].
There are several approaches to reducing GHG emissions, such as energy saving, energy efficiency, and increasing the percentage of nuclear power in the energy mix. However, since the Fukushima Disaster in 2011, the use of nuclear power has become extremely controversial, primarily because of its potentially catastrophic impact on the environment in the case of an accident. Furthermore, the permanent disposal of nuclear waste remains a deeply problematical issue due to its huge expense and, moreover, the ecological long-term consequences cannot be fully assessed [5].
A sustainable approach would be to substitute pollutant-intensive power plants with renewable energy power plants. After the Fukushima incident, the German government decided to turn off all of Germany’s nuclear power plants until 2022 [6] with the resultant shortfall in electricity needing to be compensated by renewable energies.
South Korea has proclaimed its goal of increasing the use of renewable energies from the current 4.5% to 11% by 2030 under the ‘Fourth Basic Plan for New and Renewable Energy’ [7]. In addition, the South Korean government plans to replace older pollutant-intensive facilities with nuclear power and low-carbon fuel types such as natural gas [8].
Considering these different energy policies, we expect to provide—by comparing South Korea and Germany—valuable information about GHG reduction potential from the supply of renewable energies.
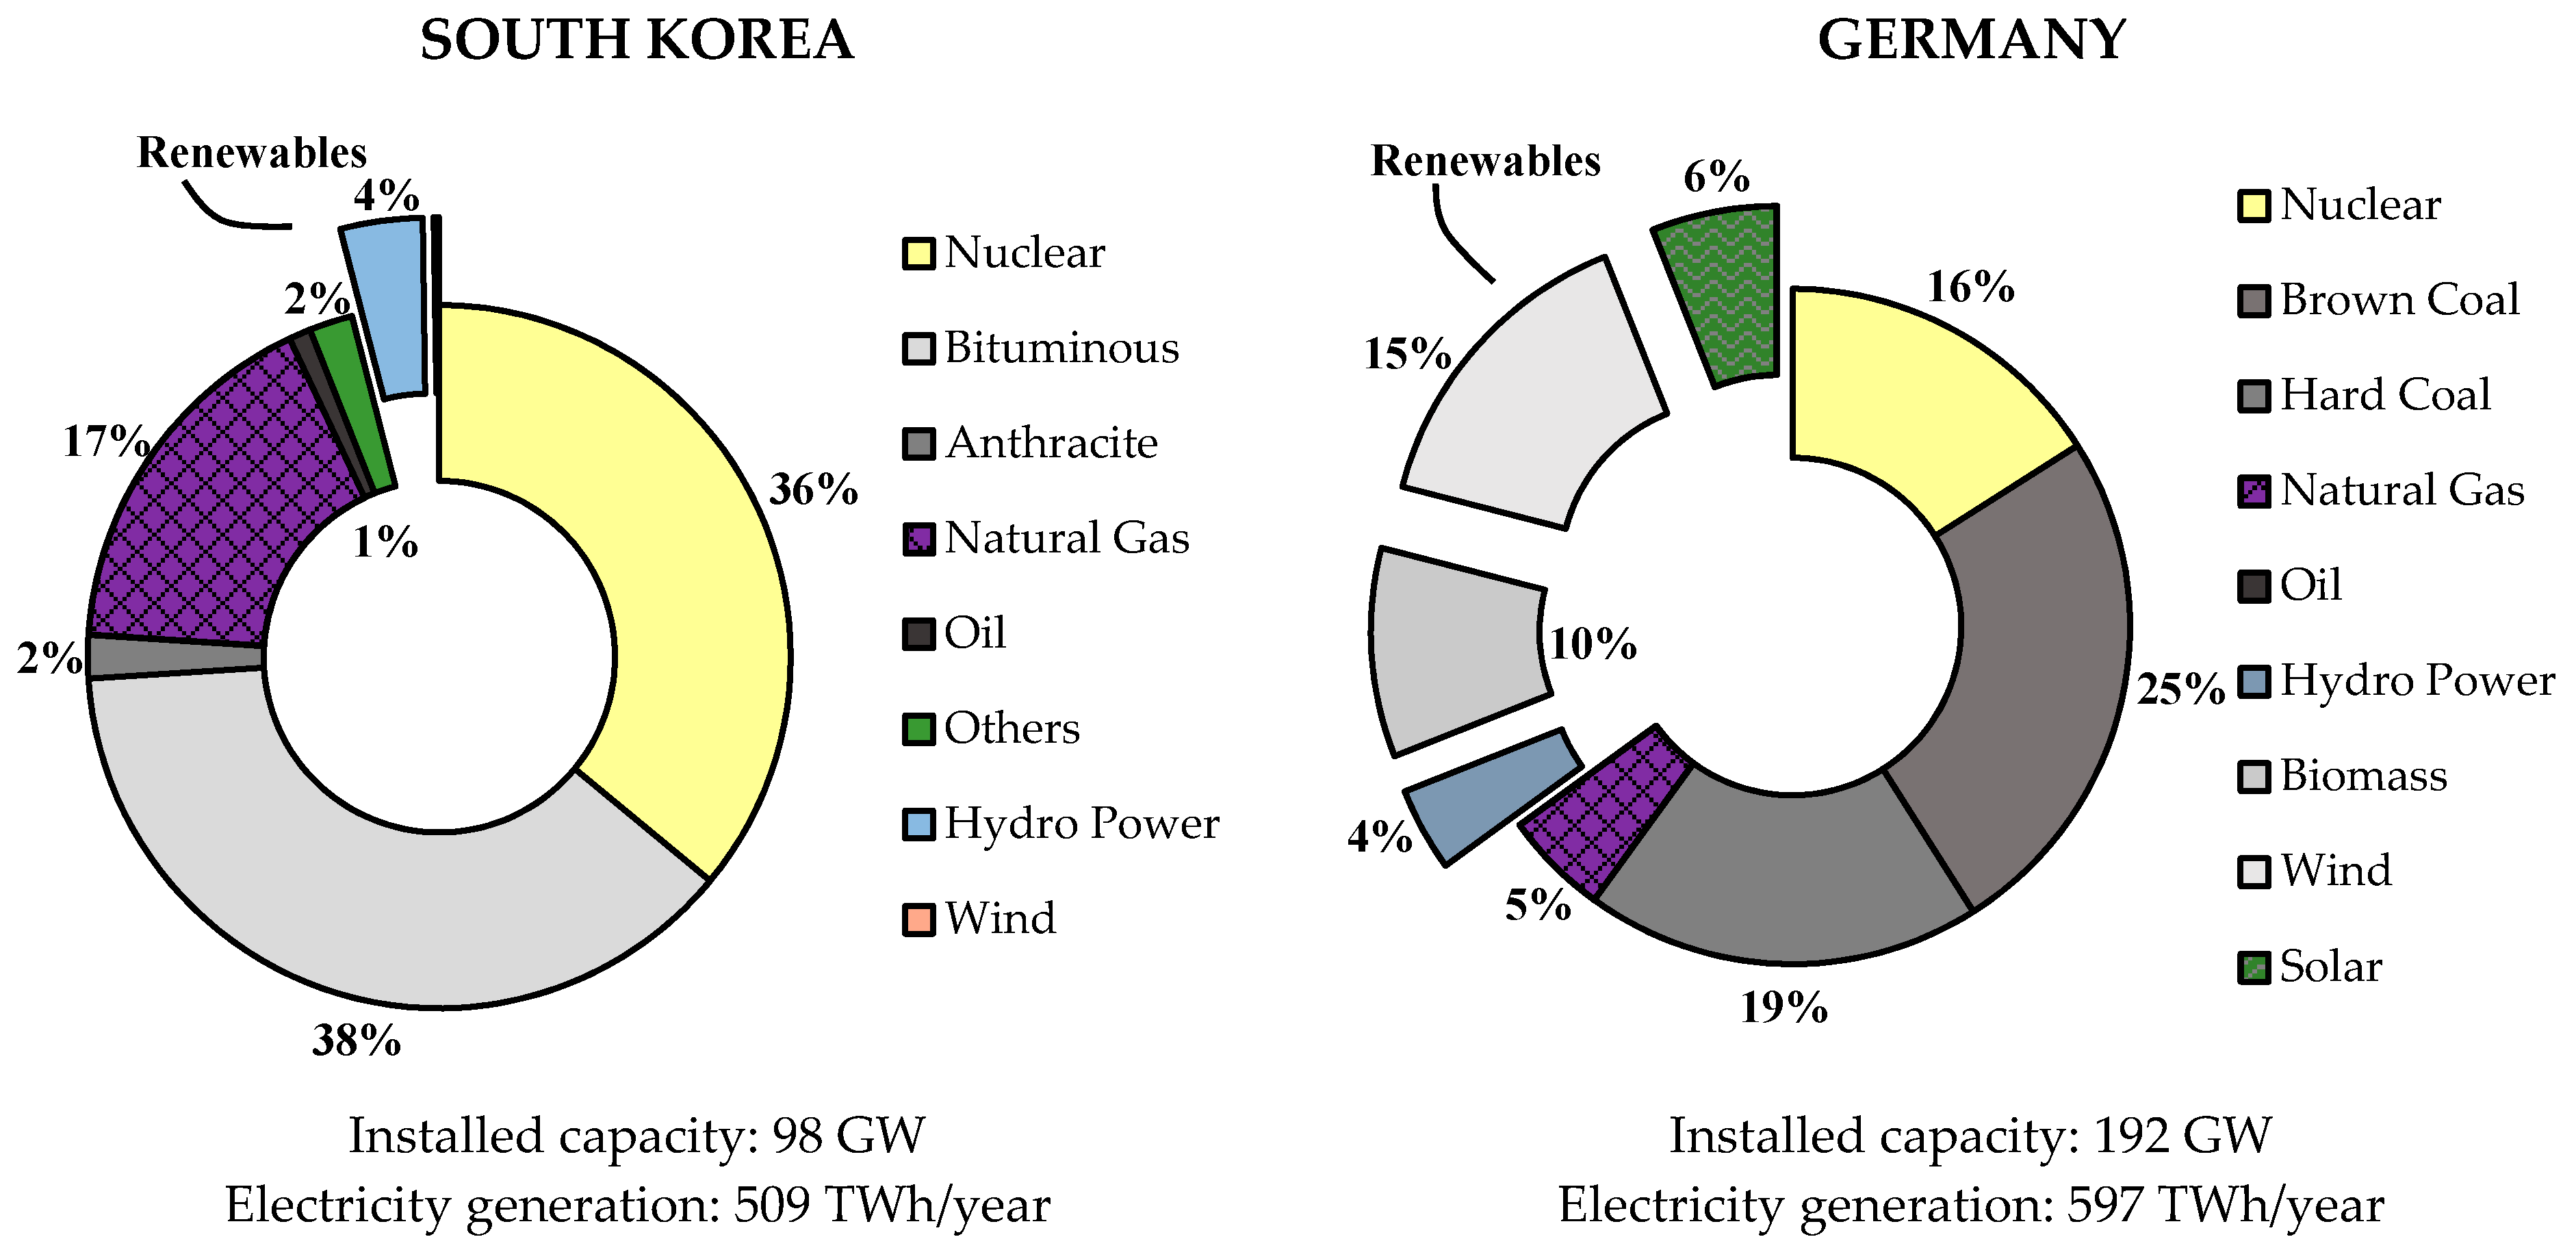
The current electricity energy mix of both countries is shown in Figure 1. The figures show that coal power plants still play a major role in both South Korea (40%) and Germany (45%). Apart from that, there are significant differences in the energy mixes of the two countries. In South Korea, almost one-third of electricity consumption is supplied by nuclear power while in Germany over one-third of electricity is supplied by renewable energies.
To assess and quantify the air pollutant emissions, GHG emissions are calculated by introducing the emission factors of fossil-fueled power plants (coal, natural gas, oil). Many studies have shown that these emission factors are not constant, but there is an underlying variability even for the same type of fossil-fueled power plant [9,10,11]. There are different reasons for this variability. First, the energy content of a fossil fuel may vary depending on the coal mine or oil deposit. Second, the combustion method and the efficiency of a power plant can also influence the energy yield. Third, the emission factors are subject to different environmental protection regulations in different countries, which power plant operators must comply with. For this reason, regulations of different strengths are adopted to reduce air pollutant emissions, which result in the variance of emission factors. Lastly, the measurement of emission factors also includes uncertainty [10].
In this study, we set up a reference scenario with a weak increase of renewable energies in the energy mix until 2030 and a target scenario with a strong increase of the renewable energy supply in order to estimate the future GHG reduction potential of South Korea and Germany. The purpose of the two scenarios is to consider the uncertainty of the future renewable energy development, which strongly depends on political decisions. By contrasting these two scenarios, it is easier to understand the far-reaching consequences of such political decisions.
The GHG emissions originating from the electricity generation of each plant is estimated with the Monte Carlo method by considering its variability in terms of process efficiency and GHG emissions regulations.
2. Method and Data
To assess future GHG emissions and the potential for their reduction in the energy sector, it is necessary to know the development plan of the electricity supply together with the planned energy mix until 2030 and to know how much energy each type of power plant contributes to the grid. In this study, the data on the development of the future electricity supply is based on the official plans announced by the two countries’ energy ministries, which oversee the national power supplies.
For that reason, this study is organized as follows: First, an introduction of the data and then a detailed explanation of the two different scenarios are given in Section 2.1. Afterwards, the future electricity generation and future emissions, as well as emissions avoided by using renewable energies, are calculated in Section 2.2 and Section 2.3 based on these two scenarios. Finally, in Section 2.4, it is shown how variations of the emission factors are to be considered by a Monte Carlo simulation.
In South Korea, these plans are the ‘Seventh Basic Plan for Long-term Electricity Supply and Demand’ [2] and the ‘Second South Korea Energy Master Plan’ [7], which have been established by the Ministry of Trade, Industry, and Energy. In Germany, the Federal Ministry for Economic Affairs and Energy established the plans for energy transition in ‘An Electricity Market for Germany’s Energy Transition’ [6] and ‘Entwicklung der Energiemärkte—Energiereferenzprognose’ (Development of Energy Markets—Energy Reference Prognosis) [12], and the ‘Emissionsbilanz erneuerbarer Energieträger’ (Emissions Balance of Renewable Energies) [13] established by the German Environment Agency. These national plans provide detailed information about the increase of installed capacity and a prediction of future electricity consumption until 2030.
The air pollutant emission factors of power plants can be taken from several studies [10,11] and the resources of various organizations such as the emission factor database (IPCC Emission Factor Database, n.d.) provided by the Intergovernmental Panel on Climate Change (IPCC), the Updated Greenhouse Gas and Criteria Air Pollutant Emission Factors of the U.S. Electric Generating Units in 2010 [13], and the Umweltbundesamt (UBA) emission factors.
The CO2 and NOx emission factors of fossil fuels for different types of coal, natural gas, and oil are summarized in Table 1 and Table 2. As is clearly shown, the values of the emission factors for the same type of fossil fuel differ depending on the literature sources.
To assess the GHG reduction potential, it is important to describe a future assumption of energy development until 2030 for each country. This requires knowledge of how much a country plans to expand the amount of renewable energy, how much emission-intensive coal power plants will play a role in the next fifteen years, and how comprehensively a country can implement grid efficiency and energy savings plans.
2.1. Energy Mix Scenarios
In this study, two different scenarios are considered for South Korea and Germany. The first scenario is called the ‘reference scenario’, which assumes that efforts toward energy transition are not intensified and remain at the current level. The other scenario is called the ‘target scenario’, which assumes that the two governments intensify their efforts to meet their self-set commitments to mitigating or decreasing energy consumption and GHG emissions by increasing energy efficiency, developing smart grids, promoting public awareness of the importance of saving energy, and substituting fossil-fueled power plants with renewable energy sources. A detailed series of measures can be found at the relevant ministries of each country [2,3].
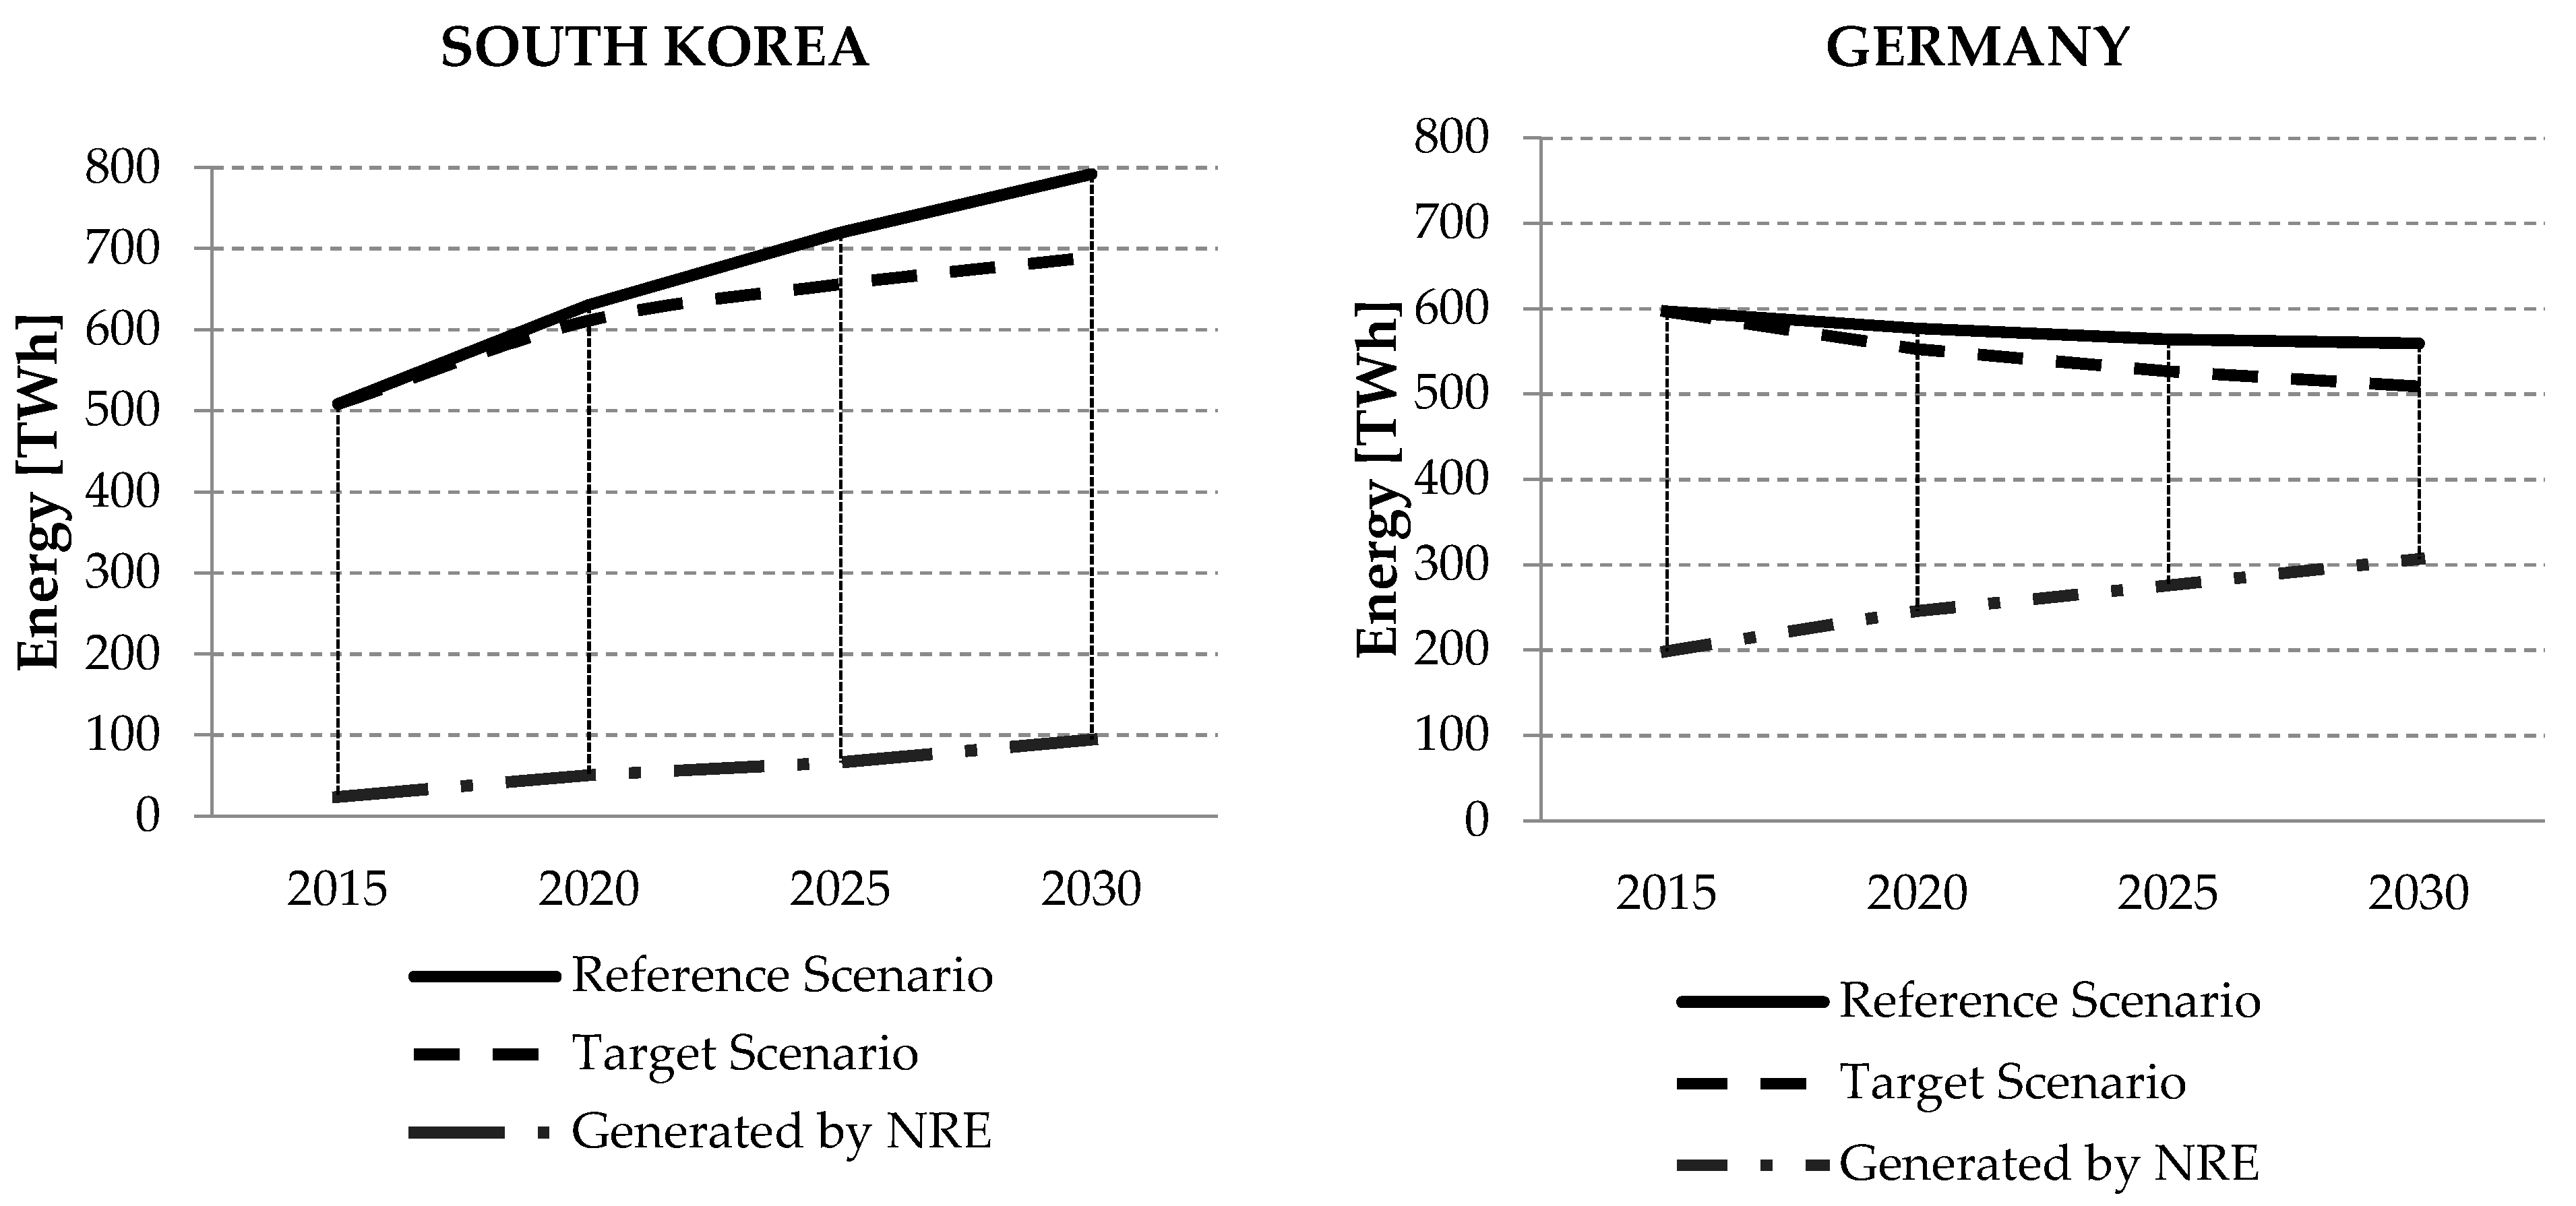
The future gross electricity generation of South Korea and Germany under both scenarios is illustrated in Figure 2, where the solid line represents the reference scenario and the dashed line the target scenario.
The above graphs show that energy demand in South Korea will continue rising in both scenarios over the next fifteen years (from 500 TWh to 800 TWh in the case of the reference scenario). The target scenario shows that South Korea will keep energy demands under 700 TWh by 2030 if it intensifies its goals of energy saving and efficiency. The electricity supply provided by renewable energies in South Korea is 4.5% as of 2015, and this portion will increase to 11% by 2030 according to the ‘Fourth Basic Plan for New and Renewable Energy’ [7].
In the case of Germany, future electricity demand barely changes in the reference scenario, while a decrease of approximately 100 TWh is possible in the target scenario. In Germany, the relationship between economic growth and energy consumption could most widely be decoupled, and the decreasing population is leading to a decline in energy demand [14]. Since the German nuclear phase-out in 2011, the amount of renewable energy has been increasing significantly, reaching 35% in 2015, and will increase to 50% by 2030.
2.2. Emission Factors of Electricity Generation
The electricity generation EGgrid (MWh) is calculated for South Korea’s and Germany’s power grid as follows:
where Pm (MW) is the installed capacity of each power plant m in the national grid; and m stands for all installed power plants in the grid, including fossil-fuel, nuclear, and renewable power plants. For South Korea, m ~ 100 power plants (>5 MW) whereas in the case of Germany m ~ 200. CF is the corresponding capacity factor of the power plant, which is the ratio of actual electricity generation to maximum possible electricity generation over a given period t (h). In other words, the capacity factor is an expression of the real operation time of a power plant. The period t is 8760 h, which corresponds to one year.
In the second step, the emission factor of the grid EFgrid is calculated. The grid emission factor is the ratio of the amount of an air pollutant that is emitted for a certain amount of energy generation [15] and is calculated as follows:
where EGm is the electricity generation of each power plant, including all types of power plants, with the corresponding emission factor EFm. Both the amount of electricity generation and the emission factors are calculated for South Korea and Germany until 2030.
2.3. Avoided Emissions Through Renewable Energies
In order to calculate the annual volume of avoided emissions, the so-called substitution factor (SF) first proposed in Memmler et al. [12] is introduced. This relative value describes the proportion of the amount of energy for each kind of fossil-fueled power plant, which is substituted by a certain kind of renewable power plant.
For instance, the substitution factors for wind power plants in South Korea are 74% for coal power plants, 25% for natural gas power plants, and 1% for oil power plants, which means that 1 MWh of electricity generated by wind power plants substitute 0.74 MWh of electricity generated by coal power plants, 0.25 MWh by natural gas power plants, and 0.01 MWh by oil power plants.
These values were calculated for the German energy market by Fraunhofer Institute for Systems and Innovation Research (ISI). For South Korea, similar values were assumed. Hence, the SF of natural gas is assumed to be more and the SF of coal to be less compared to Germany. These adjustments of the substitution factors are necessary to take into account the differences between South Korea’s energy mix and Germany’s.
The avoided emissions for a specific renewable energy source EARE can be obtained as follows:
where EGRE is the electricity generated by renewable energy power plants, SF is the substitution factor for a specific renewable energy source, and EFFossil is the corresponding emission factors of pollutant-intensive power plants used to calculate the corresponding avoided emissions.
To obtain a more reliable estimate, the air pollutant emissions of renewable energy power plants are also considered. It should be noted that renewable energy sources also emit air pollutants if the entire lifecycle—from manufacturing to maintenance and disposal—of a power plant is considered.
Table 5 lists in detail all the substitution factors for Germany and South Korea. As can be seen, the value for nuclear power plants is 0% in each case because the substitution of nuclear power plants with renewable energy is not considered.
The substitution factor approach determines the reduction potential of air pollutant emissions, which is only caused using renewable energy power plants. Other reduction measures such as an increase in the amount of nuclear power or a change from old pollutant-intensive power plants to newer more efficient power plants are not considered in this approach. This is different to the grid emission factors, which include all measures and not only the substitution of fossil-fueled power plants with renewable sources.
2.4. Variation of Emission Factors and Monte Carlo Simulation
In order to assess the uncertainty of the air pollutant emission reduction potential caused by variations in the air pollutant emission factors, a Monte Carlo simulation was performed. As mentioned in Section 2.1, variations of the emission factors can be caused by different factors such as regional characteristics (mining region of fuel), combustion methods, environmental protection requirements, and measurement uncertainty, etc. In general, these variations are divided into natural conditions and artificial conditions (i.e., conditions defined by humans such as environmental protection regulations).
In the case of the CO2 emission factors (Table 1), the variation is relatively low compared to NOx emission factors (Table 2). The high variation in the case of NOx is due to different combustion methods and environmental protection regulations, whereas in the case of CO2 the emission factors have more natural reasons, such as regional characteristics.
To perform a Monte Carlo simulation, random input values having a corresponding probability distribution around the expectancy value are generated repetitively [16]. In this study, the input values are the emission factors. However, it is important for appropriate simulation results to properly define the probability distribution of the input values.
The input value of the CO2 emission factors is modeled as a normal distribution considering both regional and natural conditions. For NOx, SOx, PM—with significantly higher variations caused by artificial effects—the uncertainty is modeled as a uniform distribution with the range of the highest and lowest emission factors set as the maximum and minimum values of the distribution.
Figure 3 shows the probability density function of two emission factors. The graph on the left represents the emission factors for CO2 emission, which is defined as normal distribution; the graph on the right shows the NOx emission factors for natural gas. The blue bars in the figure indicate the emission factors used in the literature.
However, there are also emission factors that have only one reference source and value. For example, German brown coal is provided only by UBA (Table 1 and Table 2). It is not possible to define a distribution with only one value. In this case, a distribution is assumed, similar to the emission factor distributions for the same pollutant and power plant type.
After all the distributions are defined, the Monte Carlo simulation can be run and Equations (2) and (3) are performed within the simulation as follows:
where N is the number i iterations in the simulation and stands for the input value of each probability distribution. The Monte Carlo simulation is performed with N = 100,000 iterations to obtain sufficiently accurate results.
3. Results and Discussion
3.1. Grid Emission Factor
Table 6 (reference scenario) and Table 7 (target scenario) present the grid emission factors until 2030 for both countries. For reference, the emission factors are given with a 90% confidence interval. For the CO2 emission factor, a normal distribution is assumed while a uniform distribution is used for the others.
These tables show that South Korea could decrease its national grid emission factor by shifting toward more nuclear power and natural gas power plants, which would substitute old and inefficient coal power plants. This trend is more apparent in the target scenario (0.35 t CO2/MWh in 2030) than in the reference scenario (0.47 t CO2/MWh in 2030). In the target scenario, the higher goals of reducing energy consumption and the higher energy savings benefit a lower grid emission factor.
In Germany, the grid emission factor remains at the same level until 2030 in the reference scenario (0.46 t CO2/MWh in 2030), despite the increasing amount of renewable energy sources. This is due to Germany’s nuclear power phase-out; the last nuclear power plant will be shut down in 2022.
This lack of electricity can only partially be compensated by renewable energy sources because renewable energy power plants are inappropriate for baseload supply. For this reason, new coal power plants will be built to compensate for this supply gap, which will lead to additional air pollutant emissions. Subsequently, a simultaneous increase in the use of renewable energy power plants and the installation of new coal power plants will lead to the emission factor remaining at the same level.
In the target scenario of Germany, the emission factor decreases slightly (0.36 t CO2/MWh in 2030). This is due to the greater efforts to increase energy efficiency, which will lead to the introduction of a relatively higher amount of renewable energies.
The CO2 grid emission factors of South Korea and Germany have almost the same value but they vary to a significantly higher degree (±0.05 t CO2/MWh in 2030) in South Korea than in Germany (±0.01 t CO2/MWh in 2030). This is due to the higher variations of anthracite and bituminous coal emission factors used in South Korea.
3.2. Avoided Emissions and Emitted Air Pollutants
Table 8 shows all of the results for avoided GHG and air pollutant emissions for South Korea and Germany, which include CO2, NOx, SOx, and PM. For reference, the confidence interval shown in Table 8 is 90%.
Both countries will increase the number of renewable energy power plants in the period 2015–2030 and, consequently, the avoided amount of emissions of all air pollutants will also increase. The amount of electricity supplied by renewable energies as a proportion of the overall energy mix will reach 11% in South Korea and at least 46% in Germany by 2030, depending on the scenario. This difference can be directly attributed to the higher avoided emissions by Germany, which are three times the amount achieved in South Korea.
The amount of South Korea’s avoided air pollutant emissions will rise by about 3.5–4.3 times between 2015 and 2030, whereas the amount in Germany will rise by about 1.4–1.5 times. Although Germany’s renewable energy share will be more than four times that of South Korea by 2030, its avoided air pollutant emissions will remain 2.4–3.7 times higher than South Korea’s, because Germany will replace nuclear power plants with coal-fired power plants.
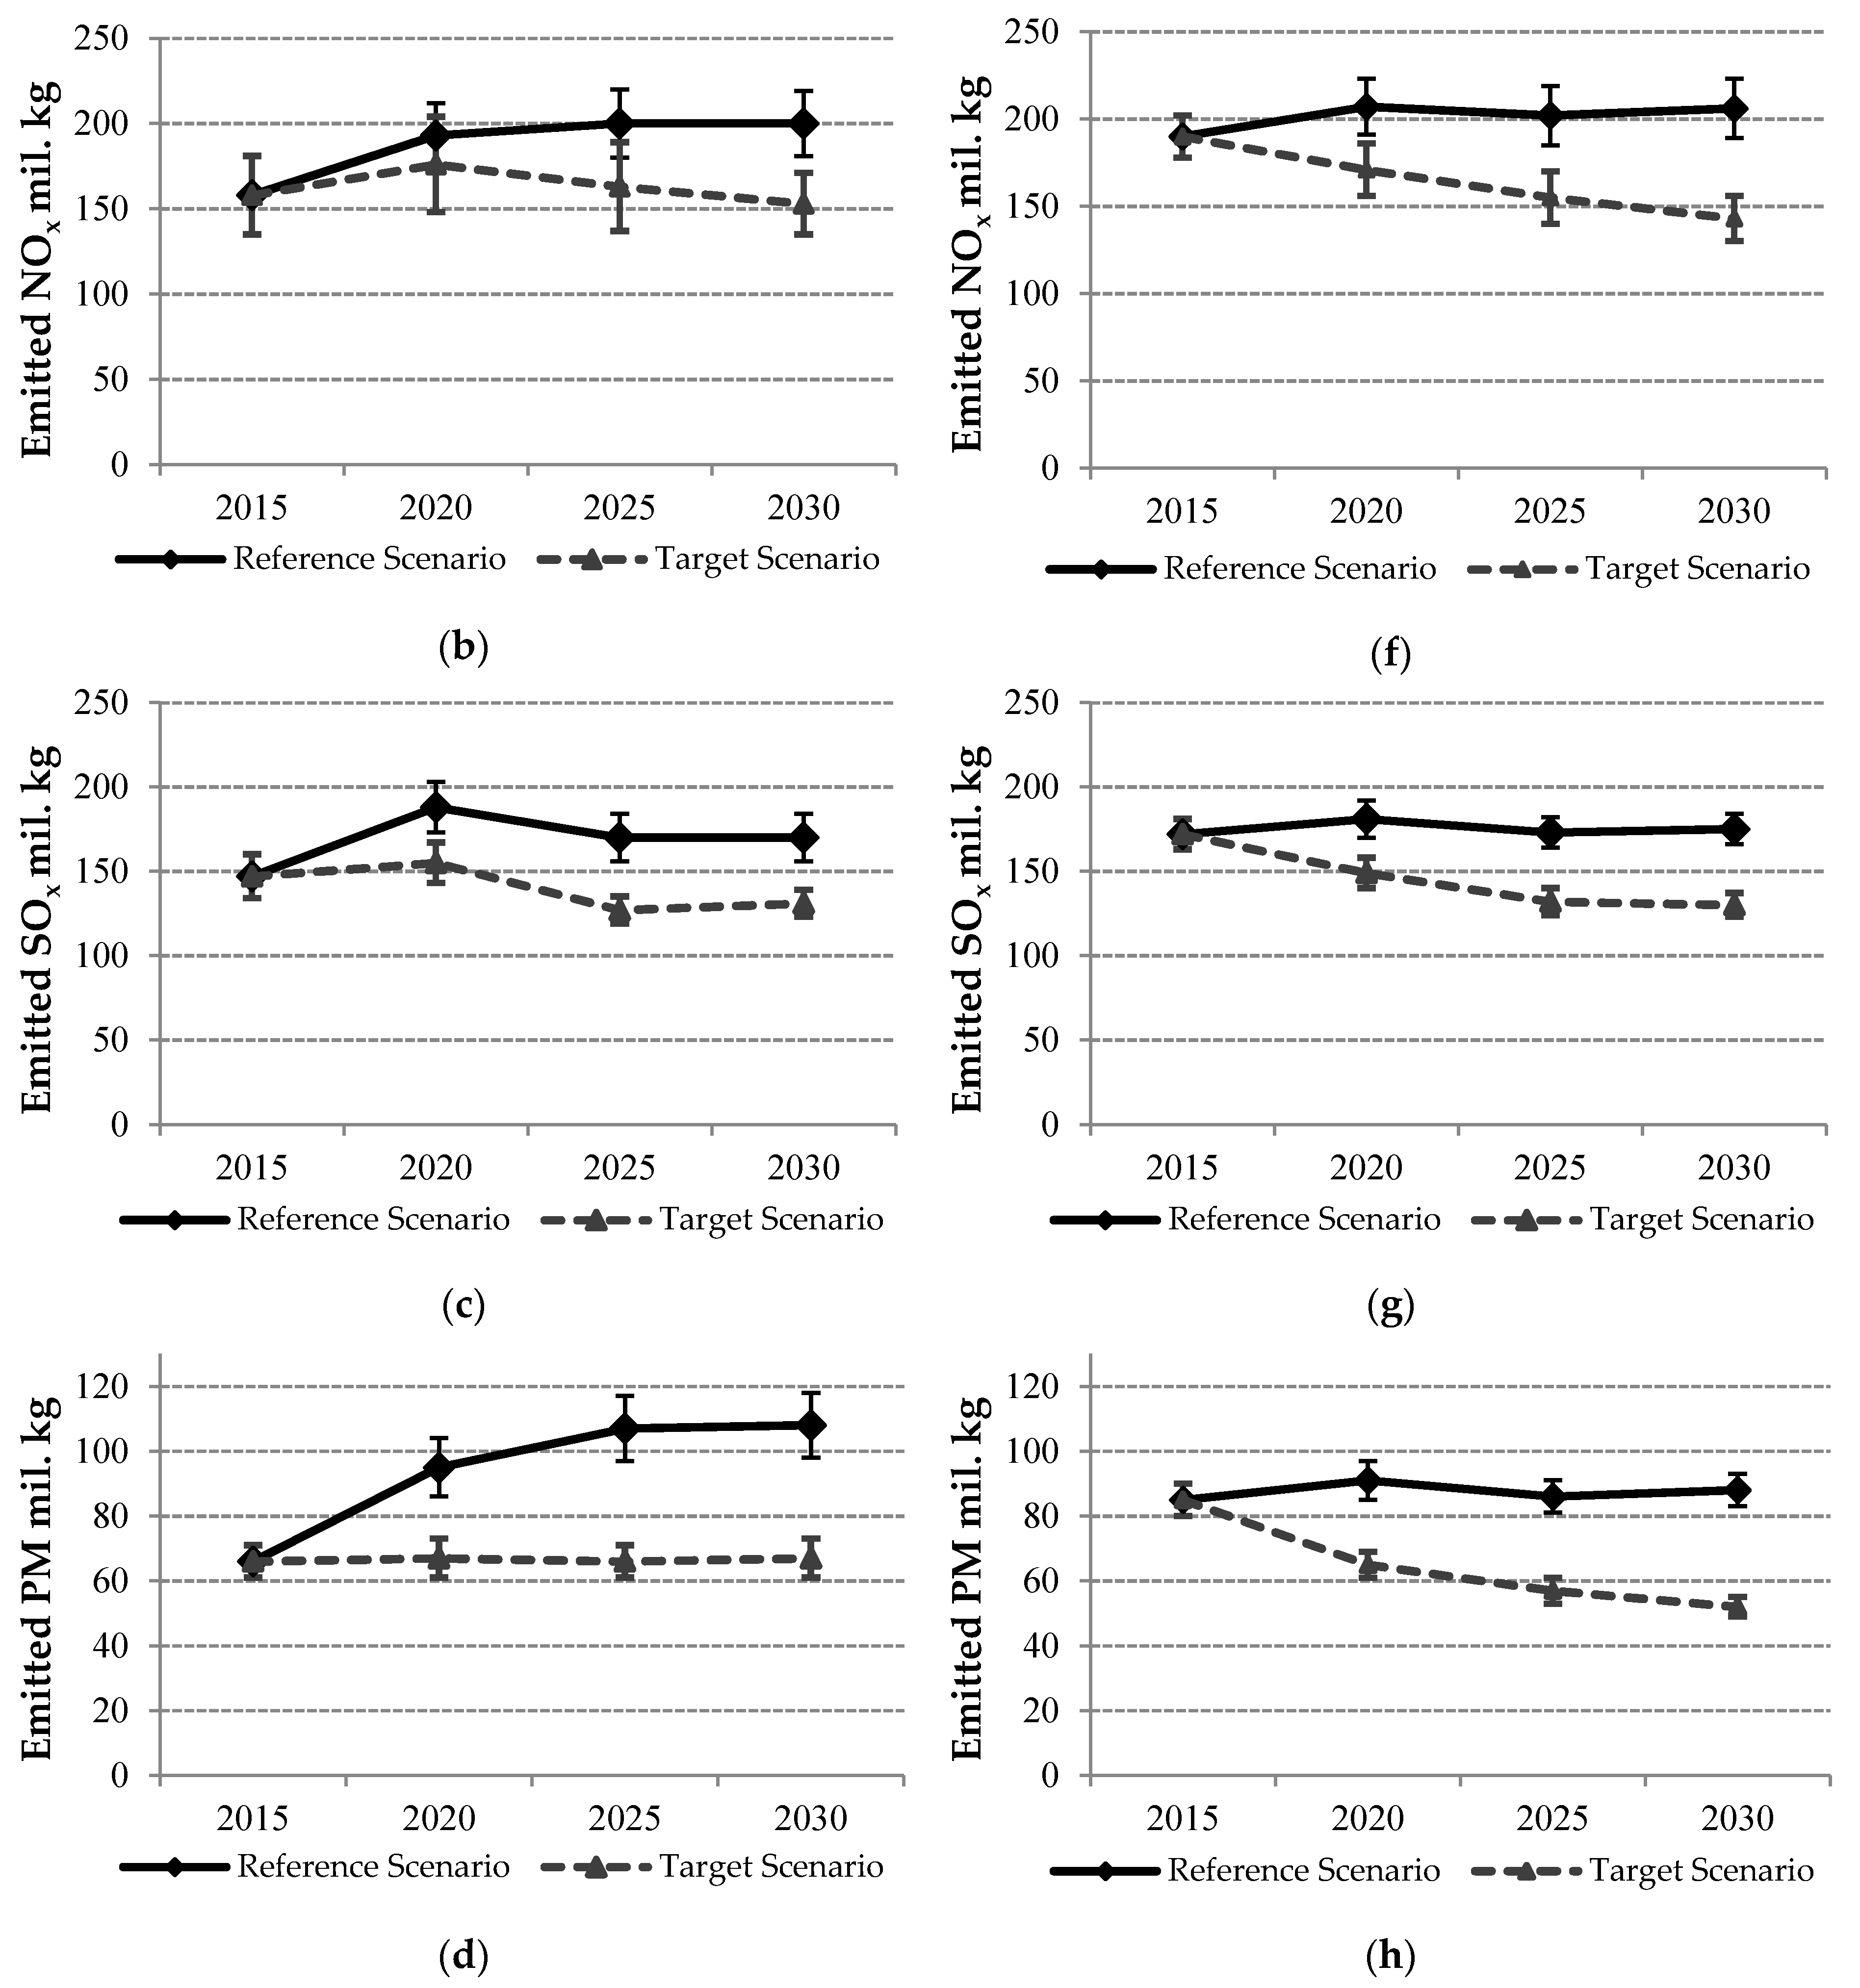
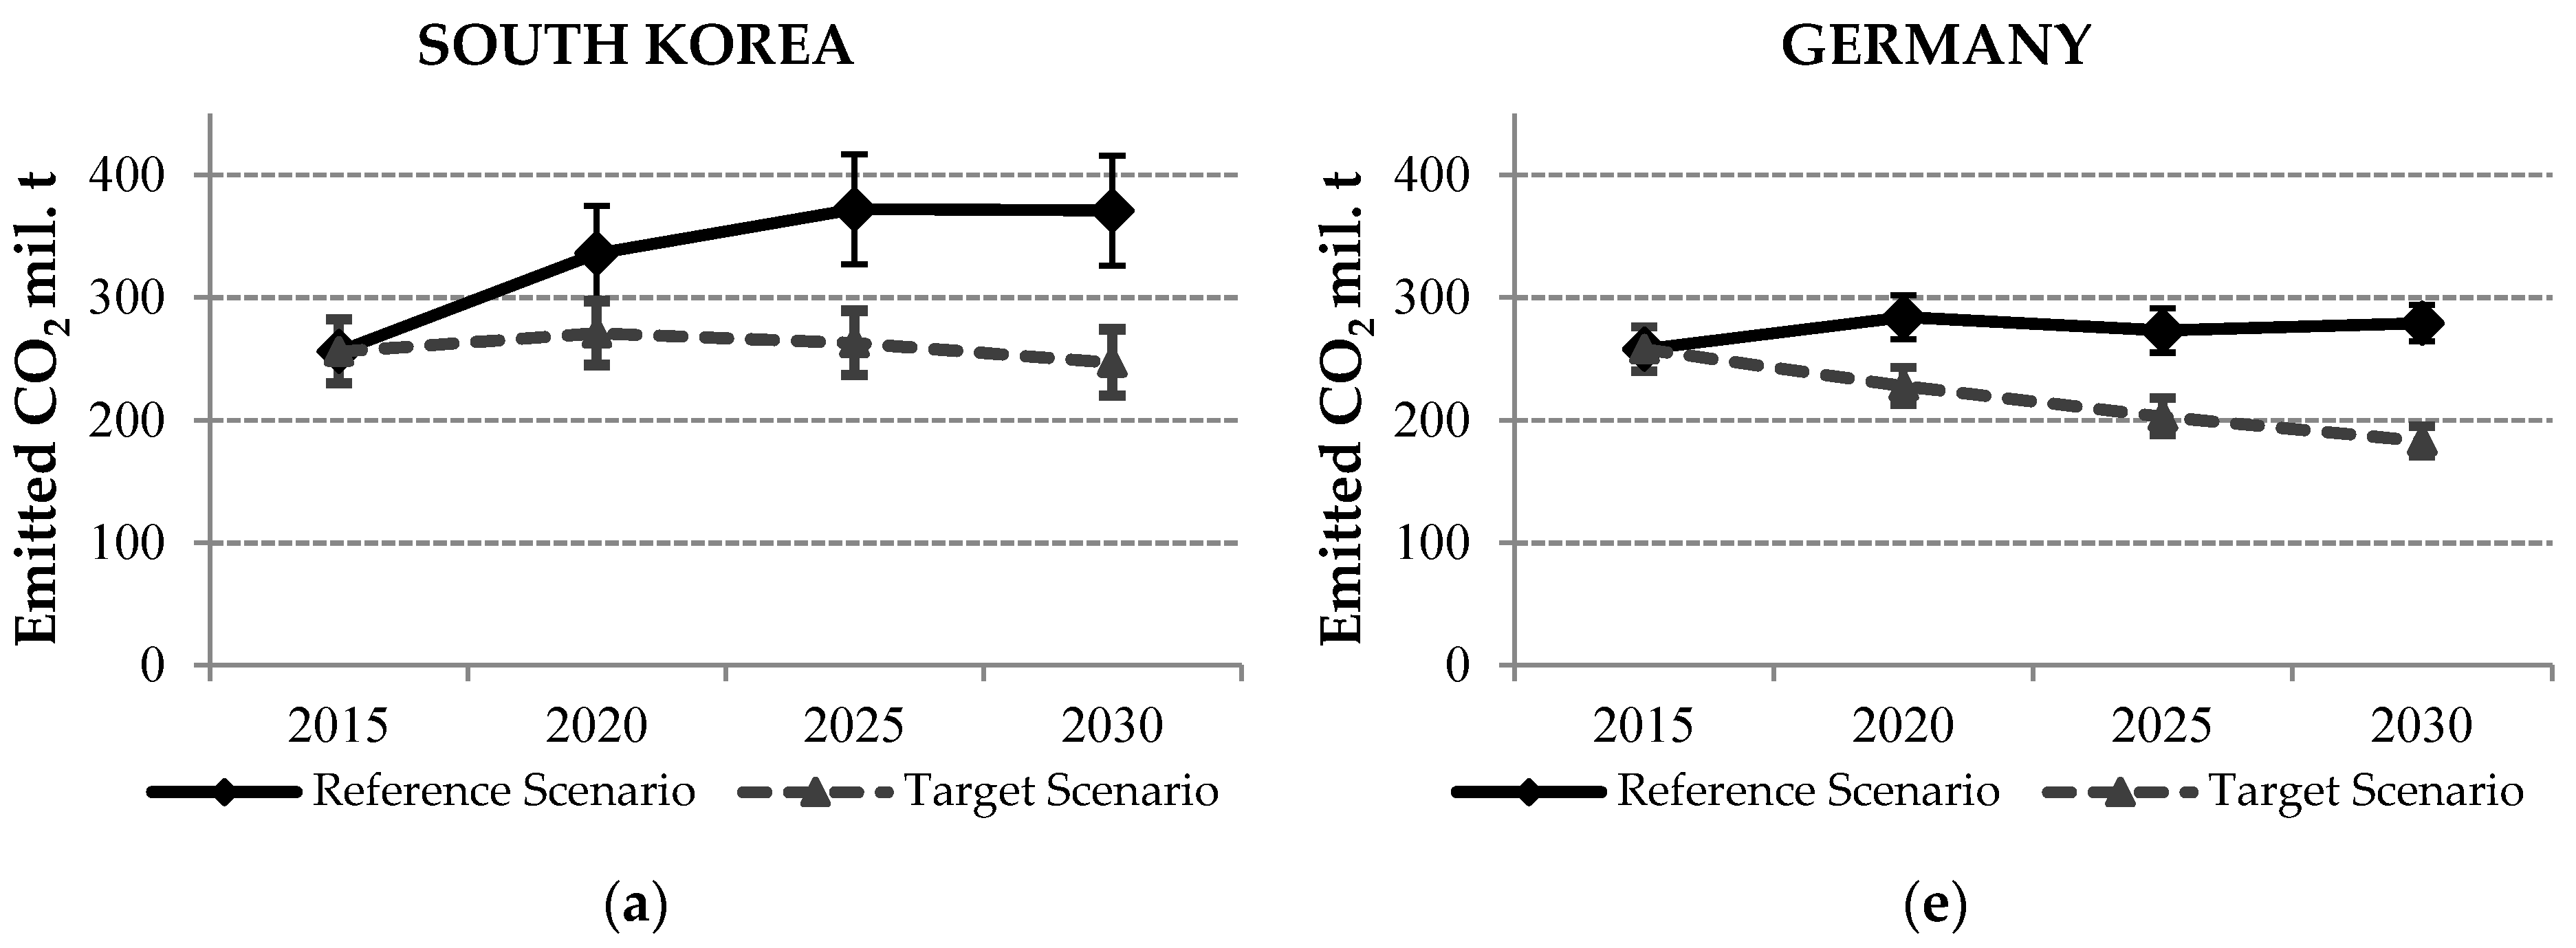
Figure 4 illustrates the trend of emitted air pollutants until 2030 where the reference scenario is indicated by a solid black line and the target scenario by a solid gray line.
In the case of South Korea, the emissions of air pollutants will increase until 2025 and remain the same afterwards if the reference scenario is assumed. This is because new bituminous coal power plants will be constructed by 2025. From 2025 on, mainly new nuclear power plants will be added to the grid. Conversely, in the target scenario, emissions will decrease continuously from 2020 thanks to the higher efforts to mitigate energy consumption and energy savings goals.
In Germany, the emissions of air pollutants remain at the same level until 2030 in the reference scenario but they will decrease noticeably according to the target scenario. The reason for emissions remaining at the same level in the reference scenario can be found in Germany’s policy of phasing out nuclear power by 2022.
4. Conclusions
This study evaluated and compared the air pollutant emission reduction potential by 2030 for South Korea and Germany using grid emission factors and has drawn the following conclusions.
- (1)
- If no effort is made for energy transition, South Korea’s GHG emissions will increase by up to 30% by 2030 compared to 2015. Conversely, South Korea could fully prevent this increase in air-pollutant emissions and keep them slightly under the level of 2015 by supplying 11% of the nation’s electricity demands using renewable energy. By increasing the share of nuclear power in the country’s energy mix and substituting old emission-intensive power plants with renewable energy power plants, South Korea could lower the grid emission factor from 0.50 t CO2/MWh in 2015 to 0.35 t CO2/MWh in 2030 (i.e., a 30% reduction). South Korea is expected to reduce its greenhouse gas emissions by 315 Mt CO2-eq. by 2030 under the COP21 Agreement, which requires a reduction of 92.7 Mt CO2-eq. in the power sector. This study estimates a reduction of 74.6 Mt CO2, which means that South Korea’s GHG reduction target for 2030 would be satisfied.
- (2)
- In Germany, a policy of conservative energy transfer whereby nuclear power plants will be replaced by coal-fired power plants will maintain greenhouse gas emissions at current levels until 2030. On the other hand, if renewable energy is expanded to 50%, it could reduce air pollutant emissions by 2030. The grid emission factor for Germany is predicted to decrease by 16% from 0.43 t CO2/MWh in 2015 to 0.36 t CO2/MWh in 2030. Through this it will be possible to reduce carbon dioxide emissions by 210.4 Mt CO2-eq by 2030. This is a sufficient reduction potential to satisfy Germany’s target of reducing greenhouse gas emissions by 183 Mt CO2-eq. by 2030, as announced in its Clean Action Plan 2050.
- (3)
- The power plant emission factors were defined as a probability distribution to evaluate the uncertainty of the grid emission factor by the Monte Carlo simulation. The CO2 emission factors of South Korea and Germany are similar but the uncertainty of South Korea (10%) is three times higher than that of Germany (3%). This is because of the high uncertainty of the anthracite and bituminous coal emission factors used in South Korea, which makes it necessary to accurately evaluate the emission factor for those power plants in order to conduct a reliable assessment of the national avoided emission potential.
This study showed that South Korea and Germany are able to achieve their COP21 obligation by the different approaches under the assumed scenarios. Germany has completely shut down all nuclear power plants and will increase renewable energies tremendously up to 50%, whereas South Korea plans to increase a mix of nuclear power plants and renewable energies up to 11%. However, in the case of Germany, this study does not consider how many fossil-fueled power plants (mostly natural gas power plants) must be kept active or in standby in order to guarantee energy security in the case of weak wind or solar resource conditions. Because of the volatile availability and regional dependencies of wind and solar energy, there might be future changes in the corresponding capacity factors when the renewable energies take its share up to 50%. Therefore, further research is anticipated to consider the influence of variable renewable energies.
Acknowledgments
This work was conducted under the framework of the research and development program of the Korea Institute of Energy Research (B8-2424-02).
Author Contributions
Hyun-Goo Kim conceived and designed the investigations; Alexander Maennel analyzed the data and performed the analysis; Hyun-Goo Kim and Alexander Maennel wrote the paper.
Conflicts of Interest
The authors declare no conflict of interest.
References
- IPCC. Climate Change 2014: Mitigation of Climate Change, Contribution of Working Group III to the Fifth Assessment Report of the Intergovernmental Panel on Climate Change; Edenhofer, O., Pichs-Madruga, R., Sokona, Y., Farahani, E., Kadner, S., Seyboth, K., Adler, A., Baum, I., Brunner, S., Eickemeier, P., et al., Eds.; Cambridge University Press: Cambridge, UK; New York, NY, USA, 2014; ISBN 978-1-107-05821-7. [Google Scholar]
- Ministry of Trade, Industry and Energy. The Seventh Basic Plan for Long-term Electricity Supply and Demand (2015–2029); Rep. of Korea; Korea Power Exchange: Naju, Korea, 2015. Available online: https://www.kpx.or.kr/eng/selectBbsNttView.do?key=328&bbsNo=199&nttNo=14547&searchCtgry=&searchCnd=all&searchKrwd=&pageIndex=1&integrDeptCode= (accessed on 12 July 2016).
- Schlesinger, M.; Lindenberger, D.; Lutz, C. Entwicklung der Energiemärkte—Energiereferenzprognose; Studie im Auftrag des Bundesministeriums für Wirtschaft und Technologie: Basel, Switzerland, 2011; Available online: http://www.bmwi.de/BMWi/Redaktion/PDF/Publikationen/entwicklung-der-energiemaerkte-energiereferenzprognose-kurzfassung,property=pdf,bereich=bmwi2012,sprache=de,rwb=true.pdf (accessed on 25 July 2016).
- UNFCCC. Report of the Conference of the Parties on Its Twenty-First Session, Held in Paris from 30 November to 13 December 2015. Available online: https://unfccc.int/resource/docs/2015/cop21/eng/10.pdf (accessed on 3 January 2017).
- IAEA. Safety of Radioactive Waste Disposal. In Proceedings of the International Conference on the Safety of Radioactive Waste Disposal, Tokyo, Japan, 3–7 October 2005. [Google Scholar]
- Federal Ministry for Economic Affairs and Energy. An Electricity Market for Germany’s Energy Transition. White Paper by the Federal Ministry for Economic Affairs and Energy; Federal Ministry for Economic Affairs and Energy (BMWi) Public Relations: Berlin, Germany, 2015. Available online: http://www.bmwi.de/English/Redaktion/Pdf/weissbuch-englisch,property=pdf,bereich=bmwi2012,sprache=en,rwb=true.pdf (accessed on 9 September 2016).
- Ministry of Trade, Industry and Energy. The Fourth National Basic Plan for New and Renewable Energies (2014–2035), Rep. of Korea, 2014. Available online: http://www.index.go.kr/com/cmm/fms/FileDown.do?apnd_file_id=1171&apnd_file_seq=6 (accessed on 12 July 2016).
- Ministry of Trade, Industry and Energy. The Second Korea Energy Master Plan. Outlook & Policies to 2035, Rep. of Korea, 2014. Available online: https://policy.asiapacificenergy.org/sites/default/files/2nd%20Energy%20Master%20Plan.pdf (accessed on 4 August 2016).
- Toma, Y.; Kimura, S.D.; Hirose, Y.; Kusa, K.; Hatano, R. Variation in the emission factor of NO2 derived from chemical nitrogen fertilizer and organic matter: A case study of onion fields in Mikasa, Hokkaido, Japan. Soil Sci. Plant Nutr. 2007, 53, 692–703. [Google Scholar] [CrossRef]
- Jeon, E.-C.; Myeong, S.; Sa, J.-W.; Kim, J.; Jeong, J.-H. Greenhouse gas emission factor development for coal-fired power plants in Korea. Appl. Energy 2010, 87, 205–210. [Google Scholar] [CrossRef]
- Lee, J.; Kim, J.; Kim, S.; Im, G.; Lee, S.; Jeon, E.C. Development of a country-specific CO2 emission factor for domestic anthracite in Korea, 2007-2009. Environ. Sci. Pollut. Res. 2012, 19, 2722–2727. [Google Scholar] [CrossRef] [PubMed]
- Memmler, M.; Merkel, K.; Pabst, J.; Rother, S.; Schneider, S.; Dreher, M. Emissionsbilanz Erneuerbarer Energieträger, 2013. Available online: http://www.umweltbundesamt.de/sites/default/files/medien/378/publikationen/climate_change_15_2013_emissionsbilanz_erneuerbarer_energietraeger.pdf (accessed on 9 August 2016).
- Cai, H.; Wang, M.; Elgowainy, A.; Han, J. Updated Greenhouse Gas and Criteria Air Pollutant Emission Factors of the U.S. Electric Generating Units in 2010; Argonne National Laboratory: Lemont, IL, USA, 2013. [Google Scholar] [CrossRef]
- Nitsch, J.; Pregger, T.; Naegler, T.; Heide, D.; Luca de Tena, D.; Trieb, F.; Scholz, Y.; Nienhaus, K.; Gerhardt, N.; Sterner, M.; et al. Langfristszenarien und Strategien für den Ausbau der Erneuerbaren Energien in Deutschland bei Berücksichtigung der Entwicklung in Europa und Global; Project Report; DLR: Stuttgart, Germany; Fraunhofer IWES: Kassel, Germany; IFNE: Teltow, Germany, 2012; Available online: https://doi.org/BMU-FKZ03MAP146 (accessed on 11 July 2016).
- UNFCC. Methodological Tool: Tool to Calculate the Emission Factor for an Electricity System; Version 06.0; UNFCC: New York, NY, USA, 2017; Available online: https://cdm.unfccc.int/methodologies/PAmethodologies/tools/am-tool-07-v6.pdf (accessed on 13 September 2016).
- Kalos, M.H.; Whitlock, P.A. Monte Carlo Methods, 2nd ed.; John Wiley & Sons: Hoboken, NJ, USA, 2008; ISBN 978-3-527-40760-6. [Google Scholar]
Figure 1.
Gross electricity energy mix of South Korea and Germany, 2015.

Figure 2.
Gross electricity generation of South Korea and Germany.

Figure 3.
Probability density function of anthracite CO2 emission factors (normal distribution) and natural gas NOx emission factors (uniform distribution).
Figure 3.
Probability density function of anthracite CO2 emission factors (normal distribution) and natural gas NOx emission factors (uniform distribution).
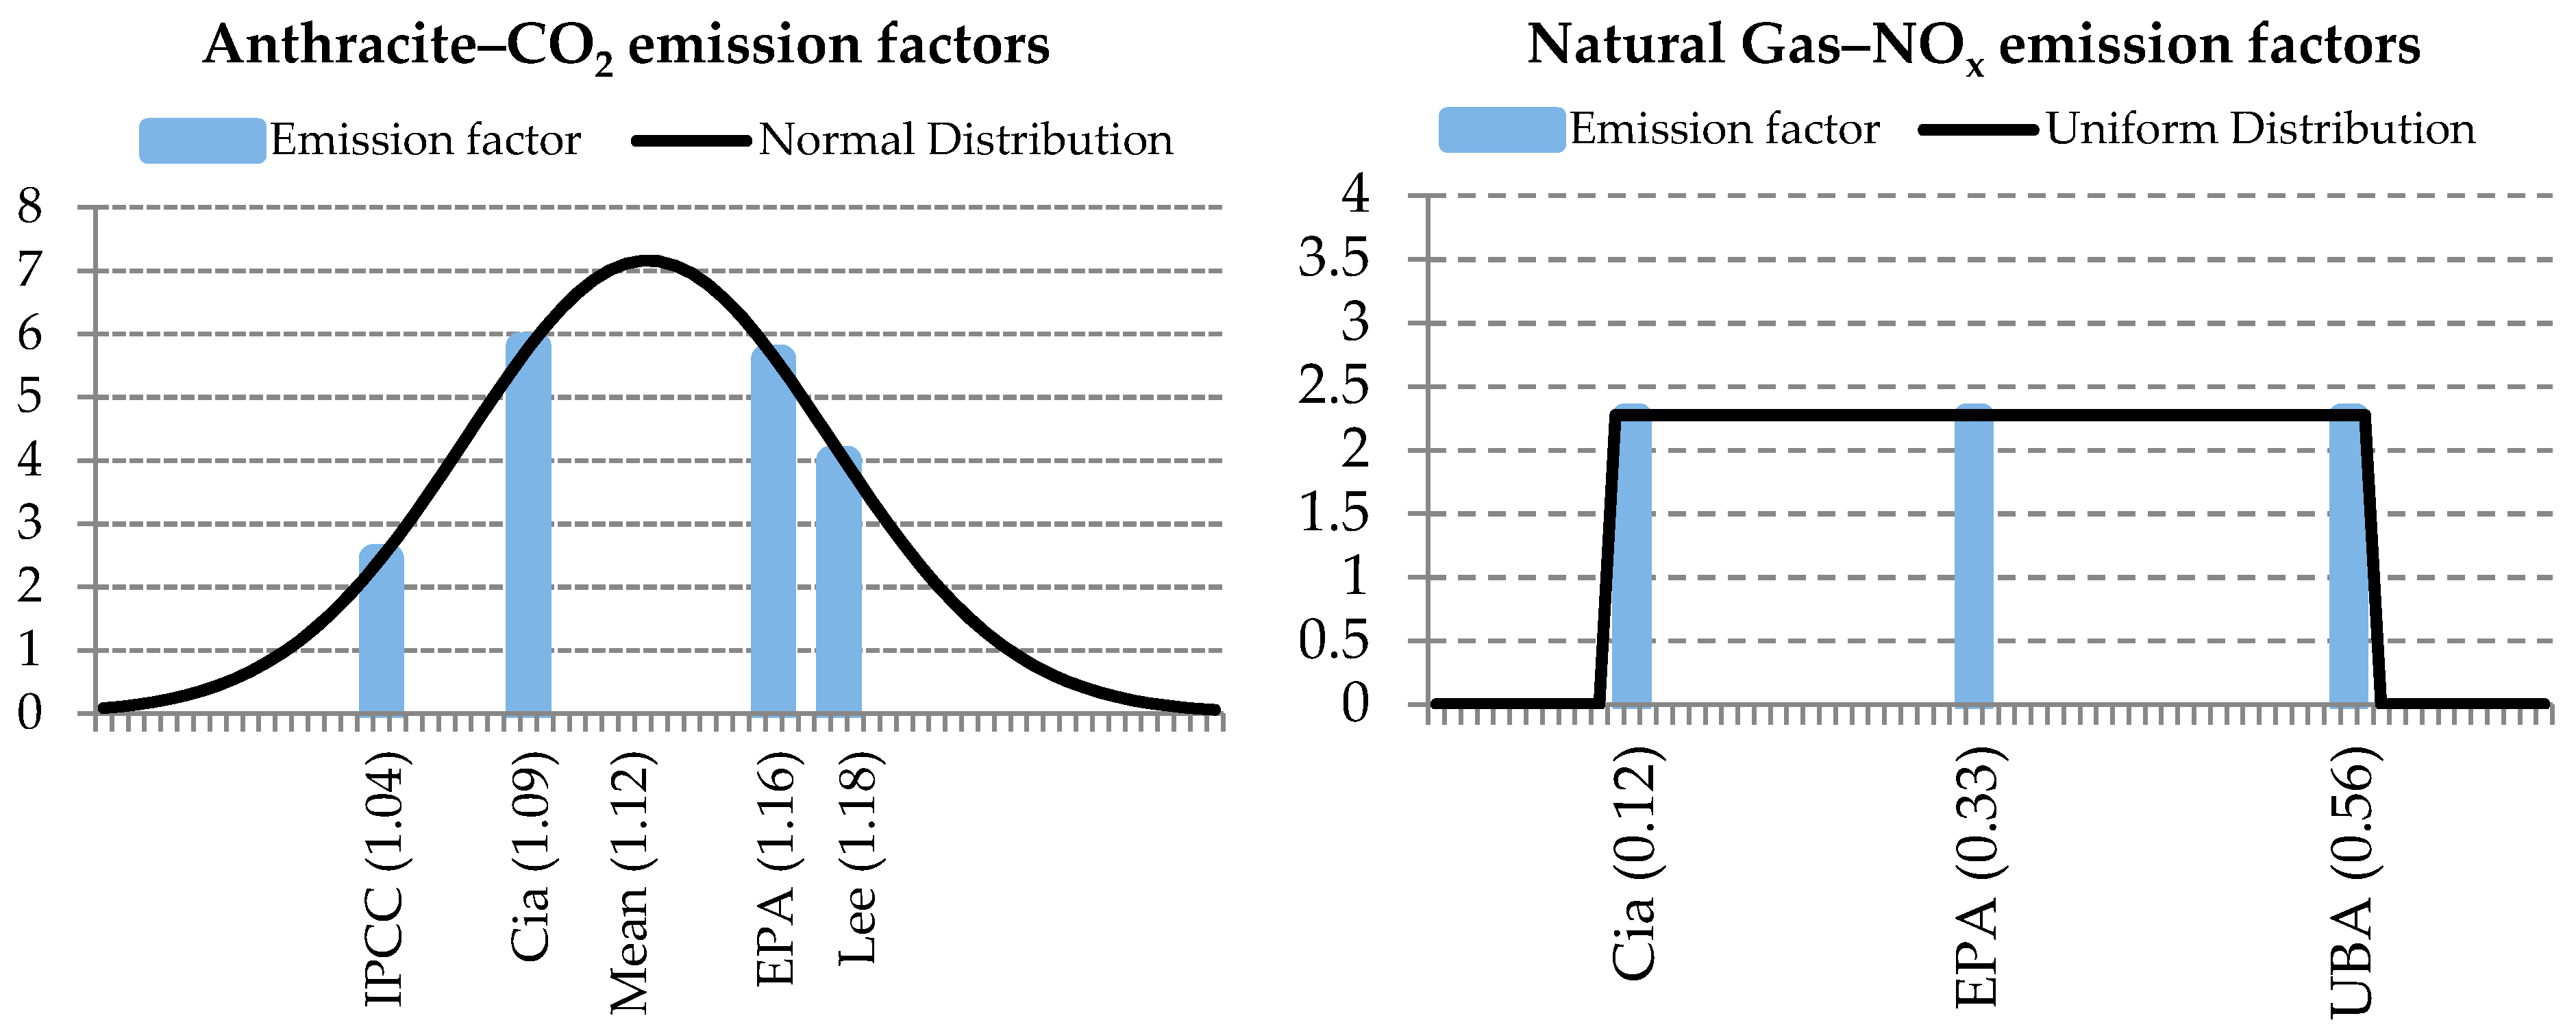
Figure 4.
GHG and air pollutant emissions. (a) CO2 of South Korea, (b) NOx of South Korea, (c) SOx of South Korea, (d) PM of South Korea, (e) CO2 of Germany, (f) NOx of Germany, (g) SOx of Germany, (h) PM of Germany.
Figure 4.
GHG and air pollutant emissions. (a) CO2 of South Korea, (b) NOx of South Korea, (c) SOx of South Korea, (d) PM of South Korea, (e) CO2 of Germany, (f) NOx of Germany, (g) SOx of Germany, (h) PM of Germany.


Table 1.
CO2 emission factors by fuel type (unit: t CO2/MWh).
| Fuel | EPA 1 | IPPC 2 | Lee et al. [11] | UBA 3 | Cai et al. [13] |
|---|---|---|---|---|---|
| Anthracite | 1.16 | 1.04 | 1.18 | - | 1.09 |
| Bituminous | 1.20 | 0.99 | - | - | 1.06 |
| Brown Coal | - | - | - | 0.96 | - |
| Hard Coal | - | 0.90 | - | 0.89 | - |
| Natural Gas | 0.40 | 0.40 | - | 0.40 | 0.44 |
| Oil | 0.80 | 0.80 | - | 0.87 | 0.90 |
1 Environmental Protection Agency (USA), 2 Intergovernmental Panel on Climate Change, 3 Umweltbundesamt (Germany).
Table 2.
NOx emission factors by fuel type (unit: t NOx/MWh).
| Fuel | EPA | IPPC | UBA | Cai et al. [13] |
|---|---|---|---|---|
| Anthracite | - | 1.18 | - | 1.14 |
| Bituminous | - | - | - | - |
| Brown Coal | - | - | 0.69 | - |
| Hard Coal | - | - | 0.55 | - |
| Natural Gas | 0.33 | - | 0.56 | 0.12 |
| Oil | 1.38 | - | 0.85 | 2.98 |
Table 3.
Energy mix scenarios for South Korea, 2015–2030.
| Scenario | Power Plant Type | 2015 | 2020 | 2025 | 2030 |
|---|---|---|---|---|---|
| Reference | Anthracite | 2% | 1% | 1% | 1% |
| Bituminous | 38% | 44% | 44% | 40% | |
| Gas | 17% | 13% | 10% | 8% | |
| Oil | 2% | 1% | 1% | 1% | |
| Nuclear | 36% | 33% | 35% | 38% | |
| Renewable | 5% | 8% | 9% | 12% | |
| Target | Anthracite | 2% | 1% | 1% | 1% |
| Bituminous | 38% | 31% | 29% | 28% | |
| Gas | 17% | 25% | 21% | 13% | |
| Oil | 2% | 1% | 0% | 0% | |
| Nuclear | 36% | 34% | 39% | 44% | |
| Renewable | 5% | 8% | 10% | 14% |
Table 4.
Energy mix scenarios for Germany, 2015–2030.
| Scenario | Power Plant Type | 2015 | 2020 | 2025 | 2030 |
|---|---|---|---|---|---|
| Reference | Hard coal | 19% | 17% | 17% | 18% |
| Brown coal | 25% | 25% | 25% | 25% | |
| Gas | 5% | 11% | 14% | 11% | |
| Oil | 0% | 0% | 0% | 0% | |
| Nuclear | 16% | 10% | 0% | 0% | |
| Renewable | 35% | 37% | 44% | 46% | |
| Target | Hard coal | 19% | 8% | 8% | 6% |
| Brown coal | 25% | 26% | 23% | 22% | |
| Gas | 5% | 13% | 16% | 12% | |
| Oil | 0% | 0% | 0% | 0% | |
| Nuclear | 16% | 11% | 0% | 0% | |
| Renewable | 35% | 42% | 53% | 60% |
Table 5.
Substitution factors for different types of renewable energies.
| Power Plant Type | Photovoltaic | Wind Energy | Hydropower | Biomass |
|---|---|---|---|---|
| South Korea | ||||
| Anthracite | 1.0% | 1.0% | 2.0% | 3.0% |
| Bituminous | 73.0% | 73.0% | 72.0% | 72.0% |
| Gas | 25.0% | 25.0% | 25.0% | 25.0% |
| Oil | 1.0% | 1.0% | 1.0% | 0.0% |
| Nuclear | 0.0% | 0.0% | 0.0% | 0.0% |
| Germany | ||||
| Hard coal | 3.0% | 2.0% | 3.0% | 3.0% |
| Brown coal | 75.0% | 80.0% | 73.0% | 75.0% |
| Gas | 22.0% | 18.0% | 24.0% | 22.0% |
| Oil | 0.0% | 0.0% | 0.0% | 0.0% |
| Nuclear | 0.0% | 0.0% | 0.0% | 0.0% |
Table 6.
Grid emission factors (reference scenario).
| Year | CO2 [t/MWh] | NOx [kg/MWh] | SOx [kg/MWh] | PM [kg/MWh] |
|---|---|---|---|---|
| South Korea | ||||
| 2015 | 0.50 ± 0.05 | 0.31 ± 0.05 | 0.29 ± 0.03 | 0.13 ± 0.01 |
| 2020 | 0.53 ± 0.06 | 0.31 ± 0.03 | 0.30 ± 0.02 | 0.15 ± 0.02 |
| 2025 | 0.51 ± 0.06 | 0.28 ± 0.03 | 0.24 ± 0.02 | 0.15 ± 0.02 |
| 2030 | 0.47 ± 0.05 | 0.25 ± 0.02 | 0.21 ± 0.02 | 0.14 ± 0.02 |
| Germany | ||||
| 2015 | 0.43 ± 0.01 | 0.32 ± 0.02 | 0.29 ± 0.02 | 0.14 ± 0.01 |
| 2020 | 0.46 ± 0.01 | 0.34 ± 0.02 | 0.30 ± 0.02 | 0.15 ± 0.01 |
| 2025 | 0.47 ± 0.01 | 0.35 ± 0.03 | 0.30 ± 0.02 | 0.15 ± 0.01 |
| 2030 | 0.46 ± 0.01 | 0.33 ± 0.03 | 0.29 ± 0.02 | 0.14 ± 0.01 |
Table 7.
Grid emission factors (target scenario).
| Year | CO2 [t/MWh] | NOx [kg/MWh] | SOx [kg/MWh] | PM [kg/MWh] |
|---|---|---|---|---|
| South Korea | ||||
| 2015 | 0.50 ± 0.05 | 0.31 ± 0.05 | 0.29 ± 0.03 | 0.13 ± 0.01 |
| 2020 | 0.50 ± 0.05 | 0.29 ± 0.05 | 0.25 ± 0.02 | 0.11 ± 0.01 |
| 2025 | 0.40 ± 0.04 | 0.25 ± 0.04 | 0.19 ± 0.01 | 0.10 ± 0.01 |
| 2030 | 0.35 ± 0.04 | 0.22 ± 0.03 | 0.20 ± 0.01 | 0.10 ± 0.01 |
| Germany | ||||
| 2015 | 0.43 ± 0.01 | 0.32 ± 0.02 | 0.29 ± 0.02 | 0.14 ± 0.01 |
| 2020 | 0.40 ± 0.01 | 0.30 ± 0.03 | 0.26 ± 0.02 | 0.11 ± 0.01 |
| 2025 | 0.39 ± 0.01 | 0.30 ± 0.03 | 0.26 ± 0.02 | 0.11 ± 0.01 |
| 2030 | 0.36 ± 0.01 | 0.28 ± 0.02 | 0.25 ± 0.01 | 0.10 ± 0.01 |
Table 8.
Avoided emissions by the use of renewable energy sources.
| Year | CO2 [mil. t] | NOx [mil. kg] | SOx [mil. kg] | PM [mil. kg] |
|---|---|---|---|---|
| South Korea | ||||
| 2015 | 21.6 ± 2.4 | 12.1 ± 1.6 | 9.7 ± 0.8 | 4.6 ± 0.5 |
| 2020 | 49.5 ± 5.2 | 25.4 ± 3.4 | 20.5 ± 1.7 | 10.1 ± 1.1 |
| 2025 | 59.9 ± 6.8 | 33.0 ± 4.0 | 26.6 ± 2.2 | 13.6 ± 1.4 |
| 2030 | 74.6 ± 8.5 | 46.6 ± 6.3 | 37.6 ± 3.1 | 19.8 ± 2.0 |
| Germany | ||||
| 2015 | 145.7 ± 1.7 | 78.5 ± 12.1 | 59.6 ± 6.4 | 52.3 ± 4.6 |
| 2020 | 167.9 ± 1.9 | 92.7 ± 13.7 | 69.7 ± 7.3 | 59.8 ± 5.2 |
| 2025 | 191.4 ± 2.1 | 107.0 ± 15.5 | 80.6 ± 8.4 | 67.8 ± 5.9 |
| 2030 | 210.4 ± 2.3 | 118.8 ± 16.9 | 89.3 ± 9.2 | 74.3 ± 6.5 |
© 2018 by the authors. Licensee MDPI, Basel, Switzerland. This article is an open access article distributed under the terms and conditions of the Creative Commons Attribution (CC BY) license (http://creativecommons.org/licenses/by/4.0/).
Share and Cite
MDPI and ACS Style
Maennel, A.; Kim, H.-G. Comparison of Greenhouse Gas Reduction Potential through Renewable Energy Transition in South Korea and Germany. Energies 2018, 11, 206. https://doi.org/10.3390/en11010206
AMA Style
Maennel A, Kim H-G. Comparison of Greenhouse Gas Reduction Potential through Renewable Energy Transition in South Korea and Germany. Energies. 2018; 11(1):206. https://doi.org/10.3390/en11010206
Chicago/Turabian StyleMaennel, Alexander, and Hyun-Goo Kim. 2018. "Comparison of Greenhouse Gas Reduction Potential through Renewable Energy Transition in South Korea and Germany" Energies 11, no. 1: 206. https://doi.org/10.3390/en11010206
Note that from the first issue of 2016, this journal uses article numbers instead of page numbers. See further details here.