Spatial and Temporal Day-Ahead Total Daily Solar Irradiation Forecasting: Ensemble Forecasting Based on the Empirical Biasing


Electrical Engineering, Konkuk University, Seoul 05029, Korea
*
Author to whom correspondence should be addressed.
Energies 2018, 11(1), 70; https://doi.org/10.3390/en11010070
Submission received: 30 November 2017
/
Revised: 17 December 2017
/
Accepted: 25 December 2017
/
Published: 29 December 2017
(This article belongs to the Section L: Energy Sources)
Abstract
:Total daily solar irradiation for the next day is forecasted through an ensemble of multiple machine learning algorithms using forecasted weather scenarios from numerical weather prediction (NWP) models. The weather scenarios were predicted at grid points whose longitudes and latitudes are integers, but the total daily solar irradiation was measured at non-integer grid points. Therefore, six interpolation functions are used to interpolate weather scenarios at non-integer grid points, and their performances are compared. Furthermore, when the total daily solar irradiation for the next day is forecasted, many data trimming techniques, such as outlier detection, input data clustering, input data pre-processing, and output data post-processing techniques, are developed and compared. Finally, various combinations of these ensemble techniques, different NWP scenarios, and machine learning algorithms are compared. The best model is to combine multiple forecasting machines through weighted averaging and to use all NWP scenarios.
1. Introduction
Solar power forecasting for the next day is required for utility-scale solar farms to profitably participate in the day-ahead electricity market [1]. Participation in the day-ahead market requires accurate solar power forecasting for the next day because the expected amount of solar generation for the next day has to be offered today, and then the offered amount of solar energy must be dispatched the next day. The dispatched amount of solar generation should be within a certain range, which is specified by independent system operators (ISOs) on the basis of the hourly forecasted amount, so deviation above or below the range may lead to penalties or the risk that deviation must be sold at unattractively low prices or bought at unattractively high prices [2]. In order to minimize the deviations and additional costs, the solar power for the next day can be predicted using the next day’s forecasted solar irradiation and NWP. The difficulty in solar irradiation forecasting is to interpolate NWP at multiple target solar farms using unsupervised interpolation techniques in case weather stations are not installed at exact target solar farm locations. In addition, the NWP is generally provided at integer grid points. Therefore, to forecast the solar power accurately, the NWP should be interpolated, and the relationship between the NWP and solar irradiation should be analyzed.
1.1. Literature Review
To respond to the issues mentioned above, solar forecasting has been studied for a long time. In this literature review, solar forecasting is introduced according to the various types of approaches: measurable physical properties, forecasting time steps and horizon, forecasting machines, and forecasting techniques. It is worth noting that the forecasting machines represent widely used machine learning algorithms such as support vector machine (SVM) and neural network (NN), and that the forecasting techniques represent methods to tailor input and output data sets, for example, the pre-processing, post-processing, and feature engineering techniques.
First, solar forecasting can be classified into solar irradiance (), solar irradiation (), which is the aggregated irradiances, and solar power (W) forecasting. In this study, the global horizontal irradiation (GHI), instead of the direct normal irradiation (DNI) and diffuse horizontal irradiation (DHI) are forecasted, but forecasting methodologies in this paper can also be used for DNI, DHI, or power forecasting.
Second, solar forecasting can be classified into hourly and daily solar forecasting. Most solar irradiation is forecasted hourly for a horizon from one hour to 48 h, based on solar irradiation or NWP values [3]. Total daily solar irradiation was forecasted using the wavelet-network model, which is an NN that uses wavelets as a transfer function, to estimate the size of a photovoltaic power system [4]. Total daily solar irradiation was also forecasted using the NN [5]. Paoli et al. used the clearness index, which is the ratio between solar irradiation and the daily extraterrestrial solar irradiation. In addition, seasonal trends were subtracted to make the observation data stationary. However, since the predictors in this study have seasonal trends, seasonal trends in the target data are not separately designed. The seasonal trends in the predictions are automatically regressed from the seasonal trends in the predictors.
Third, various machine learning algorithms are used in solar forecasting. These include the time series models, NN, SVM, Markov chain, K-nearest neighbors, and others. For time series models, the autoregressive (AR) model was first used to forecast solar irradiance [6]. Recently, the AR with exogenous input was proposed to forecast solar power [7]. It was shown that the AR with observed solar power and the forecasted solar irradiance performs better than the AR model for solar power alone. Furthermore, an autoregressive integrated moving average (ARIMA) model was designed to forecast the GHI [8]. The ARIMA model predicted a cloud index and then forecasted the GHI through a look up table of a cloud index based on a zenith angle and the predicted cloud index. It was shown that the cloud index improved the forecasting performance.
NN has been the most widely used forecasting machine in solar forecasting, and it was first used to forecast solar irradiance based on weather data [9]. Furthermore, different types of NN, such as the feed-forward, recurrent Elman, and radial basis NN, were also used to forecast the hour ahead solar irradiance based on the cloud index [10]. In this study, it was concluded that the feed-forward NN that was trained by the Levenberg–Marquardt algorithm and that received the cloud index as input had the best performance. Moreover, in order to reduce the dimension of NN input data, the Gamma test combined with a genetic algorithm was used to select weather data as the NN input [11].
Solar forecasting can be further categorized according to additional techniques that are specialized for solar forecasting. The first technique is to use satellite images. Since the cloud index was first determined from satellite images in the 1980s [12], satellite images have been used to design the global and direct irradiance model, cloud index model, and the conversion model between global and direct irradiance [13]. These models were used to forecast the short-term solar irradiance forecasting in [14] where the satellite-derived cloud motion model and hourly GHI were used. It was shown that the satellite-image derived model can improve the forecasting performance up to four hours ahead. However, according to [15], the forecasted cloud index from satellite images is not accurate after five hours, so it is difficult to use in day-ahead forecasting. Therefore, in our application, the cloud cover in percent, which is forecasted from the NWP model, is represented as a cloud index.
Input data classification is a second technique that has been used to improve forecasting performance. For example, input data were classified into nine cases based on the DHI and GHI using the maximum-likelihood method with Gaussian distributions [16]. It was shown that the DHI has a higher performance than the GHI as a classification factor. Day-ahead sky conditions were also classified by a self-organized map (SOM) with respect to the cloud index, and solar irradiance into cloudy, sunny, and rainy conditions [17]. In this study, the radial basis NN was used to forecast the hourly solar power for the next day. It was concluded from both cases that input data classification improves the forecast accuracy.
Hybrid forecasting models that use multiple forecasting models have also been used in solar forecasting. The NN was combined with the wavelet model [18]. Cao and Lin developed the diagonal recurrent wavelet neural network (DRWNN), which is a full recurrent NN of wavelet transfer functions without connections among hidden neurons. It was shown that the DRWNN outperforms other NN-based forecasting models. Furthermore, some hybrid models represent input training data as the sum of two variables. For example, in [19], the NN and Autoregressive Moving Average (ARMA) models were combined to forecast hourly solar irradiation. They trained the ARMA with input training data, and then they trained the time delayed NN with residuals that are the difference between the input training data and the outputs from the ARMA. They showed that the hybrid model outperforms individual forecasting machines. However, in these hybrid models, the performance of target data segregation should be checked.
Additionally, many different types of data affect the solar irradiance and can possibly be considered in solar irradiance forecasting. First, water vapor affects solar irradiance [20] and should be considered in solar forecasting. Second, aerosol information is important in solar irradiance forecasting since the DNI loses energy when it passes through aerosol. Forecasting aerosol compensates for the lost DNI and DHI [21]. Third, the infrared data is important. According to [22], dual band solar illuminance of a shortwave spectrum—the Ultraviolet (UV) band (0.29–0.7 nm) and the near infrared band (0.7–4.0 nm)—is important to model the solar irradiance on clear days. Therefore, in this study water vapor, aerosol, and dual-band irradiance data are used to forecast the solar irradiation.
1.2. Motivation and Contribution
The literature review suggests the motivations and research goals. The motivation is to combine several advanced forecasting techniques and to forecast the total daily solar irradiation () for the next day in spatial and temporal environment. While much research has been done on forecasting hourly solar energy on a target day, not much research has been done on forecasting next day total daily solar irradiation. In addition, the distributed solar power has rarely been forecasted in spatial and temporal environment. Therefore, the goal is to forecast the distributed total daily solar irradiation for the next day with a high accuracy. In this subsection, the key contributions to accomplish the research goal are enumerated.
- The first contribution is to develop the ensemble forecasting model specialized for the total daily solar power forecasting. In the previous research, a single forecasting machine is used to forecast the solar power. However, it could be beneficial to aggregate the advantages of all the individual forecasting machines using the ensemble of NWP. Therefore, two ensemble configurations of various forecasting machines and multiple sets of NWP scenarios are suggested. In this application, the performances of simple averaging and weighted averaging algorithms are evaluated to combine different forecasting machines, a set of NWP scenarios, and forecasting techniques.
- The second contribution is to create a unified framework to forecast solar irradiation so that all the various forecasting approaches can be combined to build a better model in the ensemble forecasting. Under this framework, users can select forecasting architectures and add forecasting techniques. Many solar irradiation forecasting models with various forecast horizons were compared in [23], but recently developed algorithms, such as the Gaussian process (GP), bootstrap aggregation (BAG), and the gradient boosting machine (GBM) have not been considered. Therefore, seven algorithms are compared in the unified framework in this paper: ridge regression, random forest (RF), GBM, SVM, GP, NN, and BAG.
- The third contribution is to develop six NWP interpolation functions and compare their performances to increase the performance of the spatial and temporal solar power forecasting. If the NWP values are not provided at target solar farms, the NWP values need to be interpolated because NWP is usually given at regular and fixed grids in integer latitudes and longitudes.
- The fourth contribution is to develop many innovative forecasting techniques, such as outlier detection, input data expansion, and post processing in the spatial and temporal ensemble forecasting.
- The fifth contribution is to develop the input data classification to consider seasonal trends. Since solar power has a very strong yearly pattern, classifying the input data into a few categories and building a forecasting machine for each model might improve the performance. Therefore, five innovative input data classification methods are developed, and clusters are trained by separate forecasting machines.
As noted earlier, daily solar irradiation is forecasted in this paper, not solar power. Solar power that is generated on a solar farm can be easily calculated from the solar irradiation at the target location since the relationship between solar irradiation and solar power is nearly linear [24]. Furthermore, although hourly solar irradiation forecasting is much more useful for power system applications, it is beyond the scope of this paper, and, if necessary, hourly solar irradiation could be estimated from the total daily solar irradiation since solar irradiation follows a strong daily pattern even on cloudy days.
2. Program Architecture
In this section, the data and overall structure of the forecasting models are introduced. The forecasting models are verified using the data from the American Meteorological Society 2014 Solar Energy Prediction Competition in [25] by observing the post-competition rankings.
2.1. Description of the Dataset
Forecasted weather information that is predicted at 144 integer grid points comes from the Earth System Research Laboratory Global Ensemble Forecast System Reforecast Version 2 (National Oceanic and Atmospheric Administration, Boulder, CO, USA) [25]. Measured total daily solar irradiation is provided at 98 Oklahoma Mesonet sites, which serve as the “Solar farms” for the contest. The geographical locations of feature spaces do not match the locations of solar farms. The locations of solar farms and grids are plotted in Figure 1. At each grid point, 15 types of daily weather data are given.Weather data includes accumulated precipitation (kg/m), downward long-wave flux (W/m), downward short-wave flux (W/m), air pressure (Pa), precipitable water over the entire depth of the atmosphere (kg/m), humidity (kg/kg), cloud cover (%), total column-integrated condensate over the entire atmosphere (kg/m), maximum temperature (K), minimum temperature (K), current temperature (K), upward long-wave radiation at the surface (W/m), upward long-wave radiation at the top of the atmosphere (W/m), and upward short-wave radiation at the surface (W/m).
The NWP is usually obtained from NWP models that predict atmospheric conditions by solving nonlinear differential equations of physical information in a three-dimensional grid at different initial values. By changing the initial values in the NWP models, a set of NWP scenarios can be obtained. The other way to generate scenarios is to use different physical NWP models. For a single day, weather data is forecasted five times at 12, 15, 18, 21, and 24 h. Therefore, there are feature space on a single day. Furthermore, weather data is estimated 11 times with different initial conditions. Since the training data is given for seven years (5113 days), the final dimension of the feature space is . The goal of this competition is to forecast the total daily solar irradiation at 98 solar farms for 1796 days.
The forecasting performance is measured by the mean absolute error (MAE), which is defined by
where N is the number of predictions, the is the ith actual value, and the is the ith prediction.
2.2. External Forecasting Processes
The overall process consists of three steps, and it is shown in Figure 2. In the first step, weather data on the target solar farms are interpolated by selecting one of six interpolation functions. In the second step, the performances of many combinations of forecasting machines and weather data scenarios are evaluated through the cross validation. In this study, 20% of the data is randomly selected as validation data. In the third step, a few best combinations of scenarios and forecasting machines are selected, and the selected combinations are re-trained with all training data. Then, the predictions of selected combinations are multiplied by weight factors, which are the inverse of the measured performance in the second step. Finally, the multiplications of weights and forecasts are averaged. It should be noted that, when forecasts are just averaged without weight factors, the external cross validation in the second step is omitted.
2.3. Internal Forecasting Process
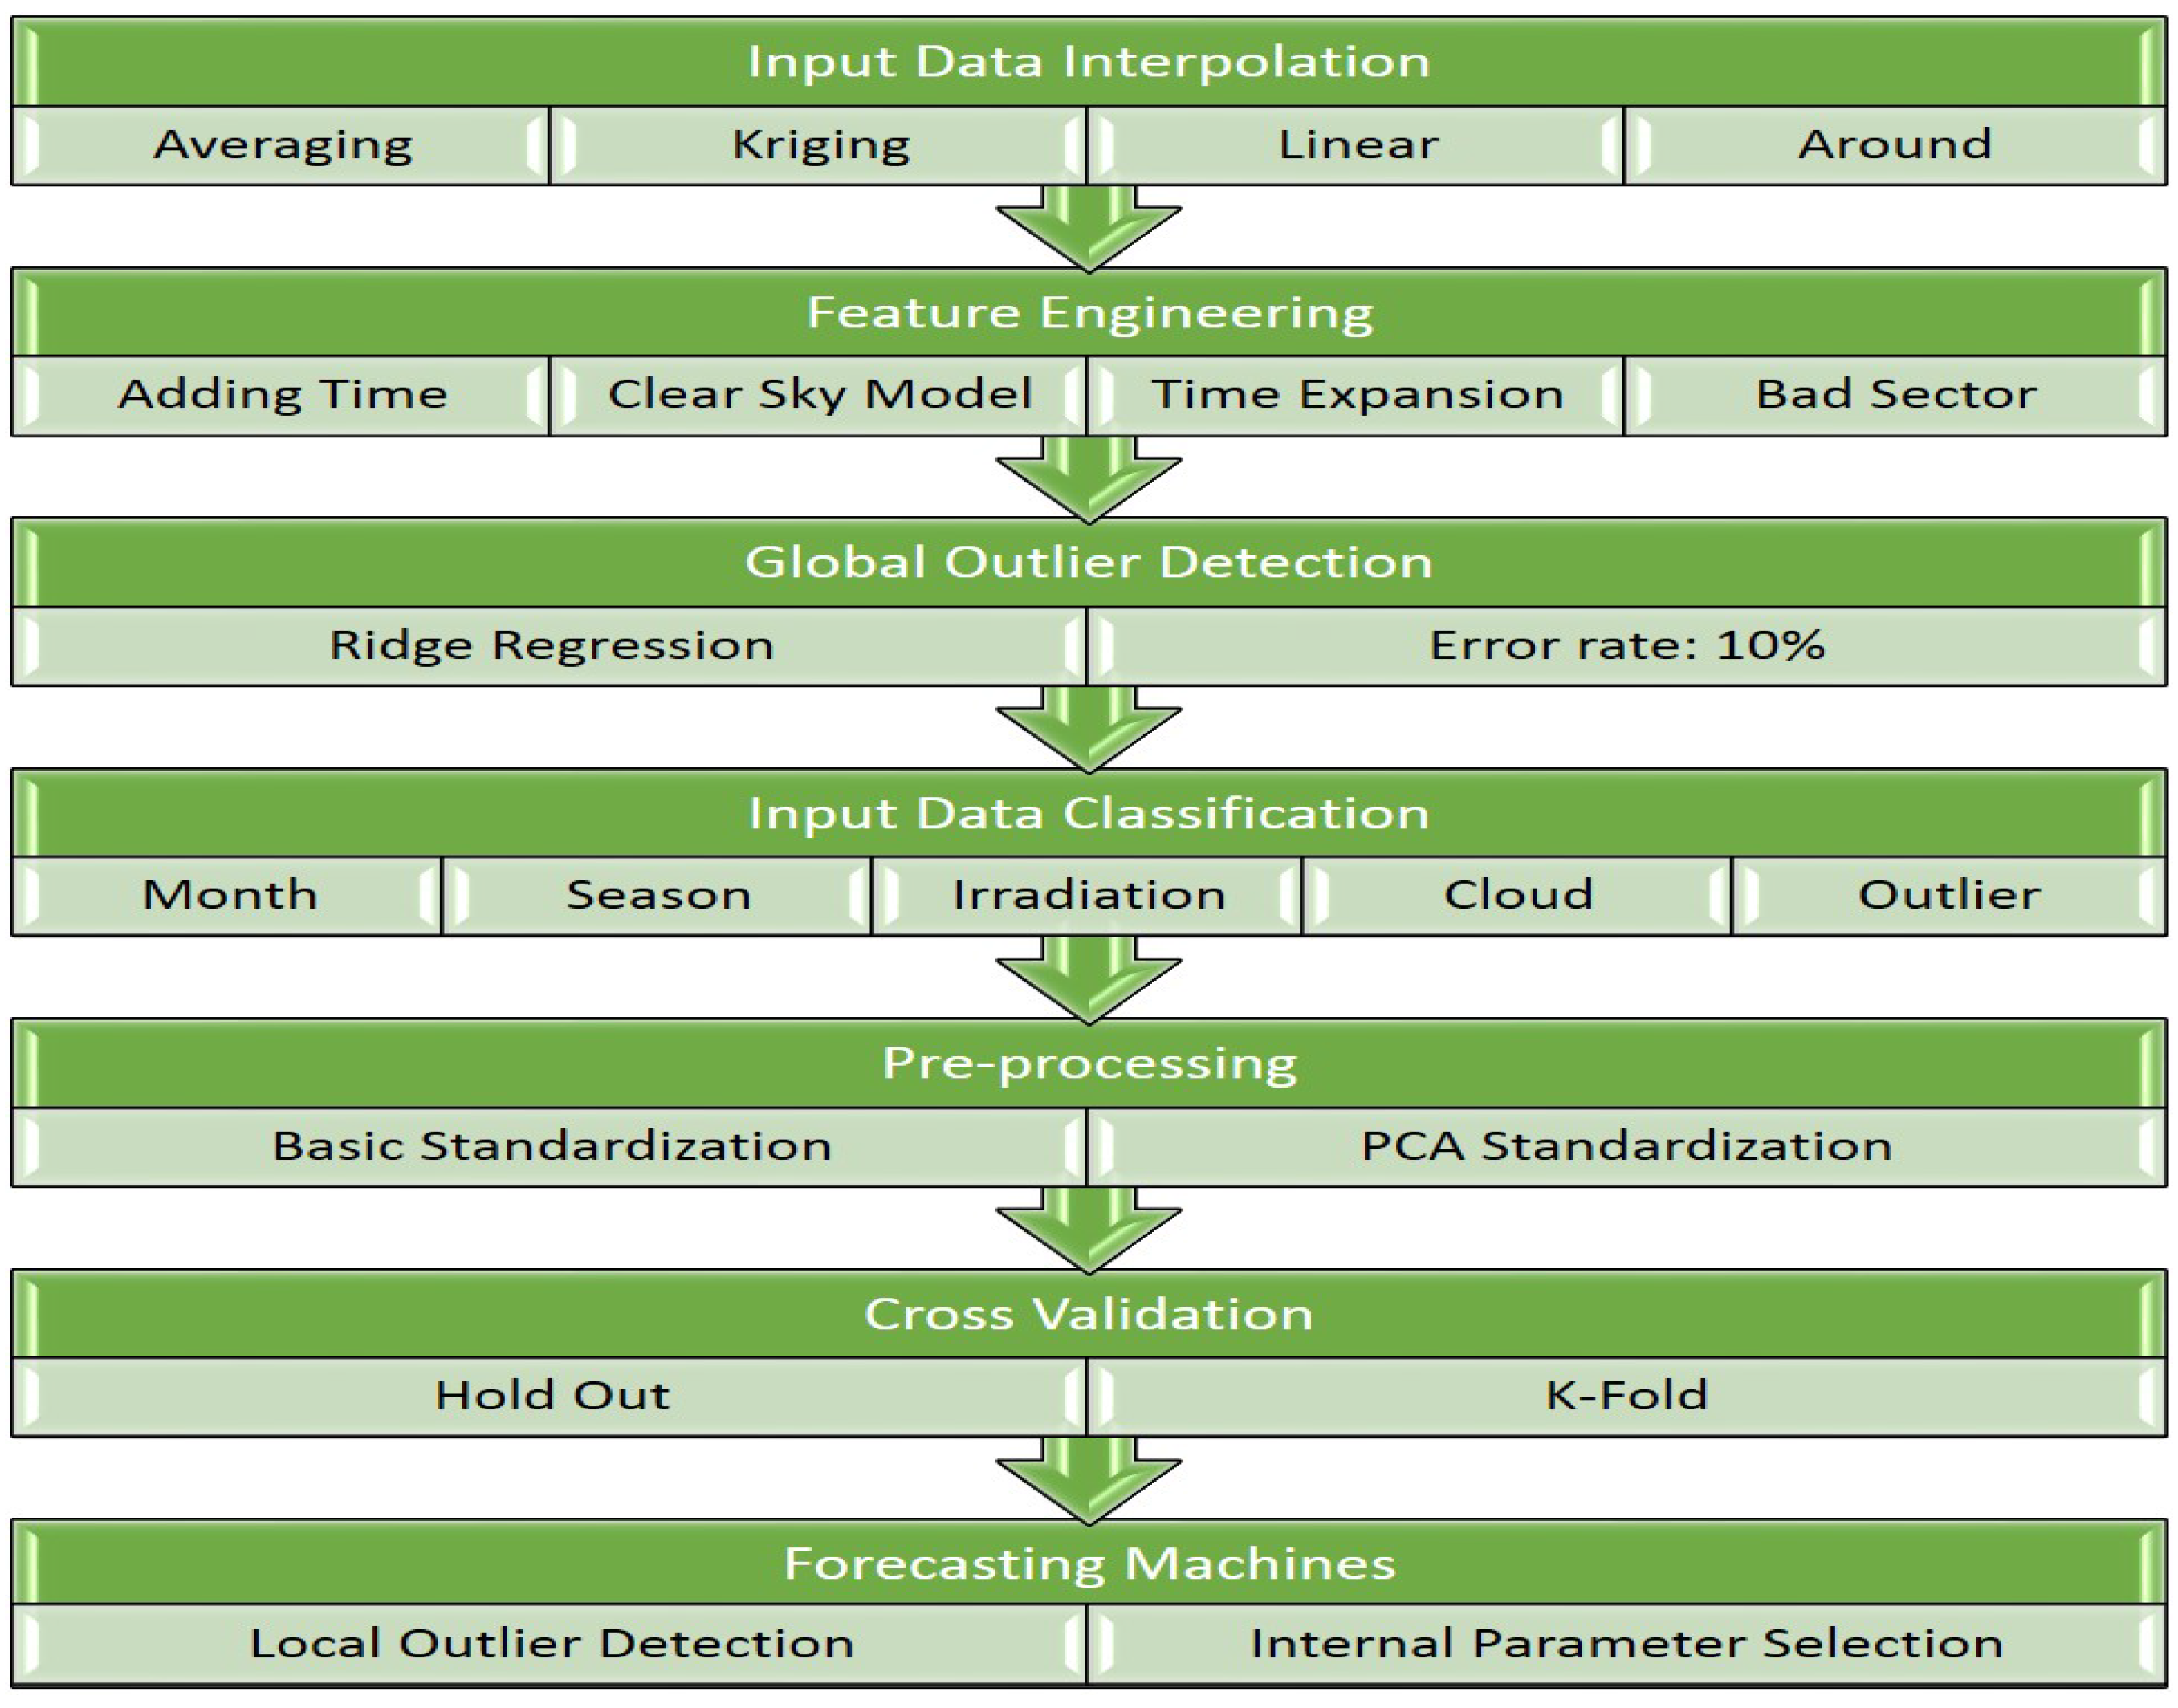
In the second and third steps, solar irradiation is predicted according to the sequence shown in Figure 3. In this sequence, the interpolated features on the target day and target solar farm are expanded by adding new features that include predicted weather data on the day before, predicted weather data the day after the target day, and time information. Then, outliers are deleted. Moreover, the selected training data is grouped by the given criteria: monthly data, cloud index, or irradiation in the upper atmosphere. Each group is trained by its own multiple machine learning algorithms. In the pre-processing, each feature of each class is normalized to have zero mean and uniform standard deviation (STD). In the internal forecasting process, cross validation is used to determine the optimal parameters in the forecasting machines. To verify the internal parameters, 20% of the training data is set aside. Finally, the predictions are smoothed, and the minimum predictions are limited to zero.
3. Feature Engineering
The goal of the feature engineering is to design predictors by controlling the numbers of rows and columns of original NWP data. These columns and rows represent the explanatory variables, which are input variables, and the number of training data, respectively. First, the original input data is interpolated on the solar farms. Then, the explanatory variables on a day can be expanded by adding NWP data on other days, or additional time information. The number of training data is reduced by deleting outliers or splitting the NWP data into a few groups.
In the pre-processing, input data has a zero mean, and it is standardized. In the post-processing, output data recovers its own mean and STD. Furthermore, negative predictions are converted to a zero, but other predictions are not limited by minimum and maximum values. In addition, since daily solar irradiation is less correlated with solar irradiation on adjacent days, a smoothing technique is not used.
3.1. Input Data Interpolation
The NWP data at target solar farms should be interpolated through a two-dimensional interpolation function. The input variables of the interpolation function are NWP data, longitudes, and latitudes, and the output variable is the new NWP data. Furthermore, this interpolation is usually an unsupervised regression, since it is difficult to install weather stations on target solar farms. In order to find the best interpolation function, six functions are compared to each other with different forecasting machines under the same simulation conditions for the first NWP scenario, which is the first scenario among 11 scenarios. In Table 1, the performance of six functions is measured by the MAE in . In this simulation, 10% of data is considered as outliers and removed, and data is not classified into various groups.
The interpolation functions are called “Around”, “Linear”, “Averaging”, “IDW”, “Cubic”, and “Kriging”. The Around function uses all NWP data at the four nearest grids simultaneously. The Linear function uses the linear function in each dimension. In the Averaging function, the NWP data at the four nearest grids are averaged. Then, in the inverse distance weighted (IDW) function, the NWP data at the surrounding four grids are averaged after multiplying weights that are linearly proportional to the inverse of distances. The Cubic interpolation is implemented by using a cubic convolution of four data points in each dimension. Finally, the NWP data is interpolated by the ordinary Kriging function [26]. In the ordinary Kriging function, the mean is estimated through the linear interpolation function, and the bias from the mean is estimated by averaging measurements after multiplying by weight factors. The key idea of the Kriging function is that the covariances between measurements and interpolation can be described as a linear combination of covariances among measurements by weighting coefficients, and that these coefficients can also be used to estimate interpolation through the linear combination of measurements. The important assumption is that the covariances between measurements and interpolation follow a function of distance, such as spherical, exponential, and Gaussian functions [27]. Therefore, if the distance between the measurement and interpolation point is known, the covariance of the measurements and interpolation can be estimated. Then, the coefficients are estimated by multiplying the inverse of the covariance matrix to the estimated covariance vector from the function of distance. Finally, the interpolation is estimated by averaging the coefficient-weighted measurements.
Among six functions, the linear interpolation function shows the best performance for all forecasting machines. The second best function is the Kriging function, and the third function is the IDW. The Averaging function shows the second-worst performance, but the performances of the IDW and Averaging functions are similar. The Cubic function always shows the worst performance. From the simulation results in Table 1, it is clear that the distance between the measurement and interpolation points is an important factor in interpolation functions. By observing the performance difference between the Linear and Kriging, it can be observed that four NWP sets from the four nearest grid points are enough to interpolate and that more NWP data might distort the interpolation. This can also be observed by comparing the performance of Cubic and other functions. Furthermore, the Linear function that considers the distance on each dimension perform better than interpolation functions that consider the direct distance between the locations of the solar farms and the NWP data points.
The Around function is excluded from the general ranking because its performance varies greatly with respect to the different forecasting machines. The Around function uses 302 features, which is four times the number of variables in other functions. Therefore, simulation settings for other functions might not work for those of the Around function. Furthermore, capturing nonlinear relationship between the solar power and weather data depends on forecasting machines. The performance of the Around function fluctuates between the second and fourth best of the six tested functions. The GBM, NN, and SVM show good performance, but ridge and GP show low performance with the Around function.
3.2. Outlier Detection and Data Expansion
Outliers are defined and removed from the feature space. Predictors are ranked according to the difference between the target value and the prediction value that are estimated by the ridge regression. The error is measured as the absolute of this difference, and the error is sorted in a descending order. To find the optimal percentage, different percentages are tested in Table 2. In this simulation, the Linear interpolation function is used to train the first scenario, the number of variables is 77, and the data is not classified into different groups. It is clear that excluding outliers much improves the forecasting power and that the forecasting power is maximized when 10% of training data is defined as an outlier.
It is also interesting to observe that every forecasting machine has a different ability to resist outliers. For example, the NN seems to be weak for outliers, but the SVM is resistant to outliers because the post-competition Ranking of SVM with outliers is the same as the post-competition Ranking of SVM without 20% of outliers. Furthermore, the GBM and RF are well known to be resistant to outliers [28], but they are susceptible to outliers in this study.
It is also checked whether the NWP on the previous day and NWP on the next day is useful for increasing the forecasting power, but including the NWP on the day before and after the target day deteriorates the forecasting power. Therefore, data expansion is not recommended to forecast the daily solar irradiation.
The standardization can be performed in two ways. First, the input features are divided by their STDs. Second, the input features are decomposed by the principal component analysis (PCA), and they are divided by their eigenvalues [29]. The second method can have unit covariance so that the input features are de-correlated. However, in this simulation, the performance of the first method is better than that of the second method, so the first method is used.
In the post-processing, the minimums of all predictions are set at zero, but the smoothing, non-zero minimum value, and maximum value per solar farm are not used. Since daily solar irradiance is less correlated with solar irradiance on adjacent days, smoothing deteriorates the performance. Furthermore, since the minimum and maximum solar irradiance values change every year, and training data for five years is too short to measure the non-zero minimum and maximum values accurately, the non-zero minimum and maximum values are not used to limit predictions.
3.3. Data Classification
Six data classification methods are tested on the first averaged scenario without outliers, and the best method is used in the final ensemble forecasting. The simulation result is enumerated in Table 3. In this simulation, averaging interpolation function is used to train the first NWP scenario, and 10% of data is considered as an outlier and removed.
First, training data is classified into four, six, and twelve groups of data from three months, two months, and one month, respectively. However, the performance of grouped data for all cases is worse than the performance of a single group. The reason is that the yearly trends are already inherent in the training data. Therefore, data classification does not improve the detection of the yearly trends, but the data classification decreases the amount of training data for each group. Therefore, if the yearly trends are encapsulated in the training data, monthly classification does not improve the forecasting power. Second, training data is also classified into clear days and cloudy days. Training data is classified as a clear day if the total daytime cloud cover is less than 10 percent, and it is classified as a cloudy day if the total daytime cloud cover is more than 10 percent. As shown in Table 3, the performance of all of the forecasting machines except for the SVM deteriorates. Since the cloud cover data is already included in the training data, if the training data is classified into a few groups according to users’ intention, the forecasting performance might be worse than the continuous regression by the forecasting machines. Third, training data is classified with respect to the total daily downward shortwave irradiation. If the irradiation is more than the averaged irradiation, the training data is classified as a clear day. If it is less than the averaged irradiation, it is classified as a cloudy day. Similarly, classifying training data according to one of its features does not improve the forecasting performance.
4. Forecasting Models
In this section, three forecasting machines, ridge regression, SVM, and GBM, are introduced. Seven forecasting machines used in this paper are explained in [30]. For each forecasting machine, methods to avoid over-fitting by controlling the internal parameters are also introduced. The forecasting machines in this paper are classified into kernel-based models, regression-based models, and tree-based models. In the forecasting models, the nth target value is predicted as , which is the linear combination of weights and kernel of the nth predictor as:
where , , and .
4.1. Ridge and Lasso Regressions
The ridge and lasso regression models are regression-based models. The ridge regression is a regularized by the shrinkage penalty to avoid over-fitting [28]. The goal of the ridge regression is to minimize the sum of the regularized coefficients and the squared errors as
where is the coefficient vector. In Equation (3), q is 2 for the ridge regression and 1 for the lasso regression. In this paper, through the cross validation, the is chosen from the set of candidate s. Equation (3) is transformed to the quadratic optimization problem below:
The can be considered as a Lagrangian multiplier of the inequality constraint in Equation (5) at the given budget limit s. By reducing s, the is increased.
The strong point of the ridge regression is the short computational time, so the ridge regression is good for testing the completeness of the forecasting program fast. However, since is generally non-zero, the coefficients for less correlated features are not fully suppressed. For the ridge regression, q in Equation (5) is 2. Since the constraint in Equation (5) is circular, the meeting point between the constraint region and the contour around optimal , which might not be zero because of training data x and y, is not on an axis, so is always non-zero.
This disadvantage can be overcome by the lasso regression where the coefficients of uncorrelated variables are set to zero. In the lasso regression, q in Equation (3) is 1, so the feasible region is a simplex. If a vertex meets the contours of the un-regularized error functions, the coefficients are pushed to zero. This characteristic of the lasso regression can be used to select variables and to lead to a sparse model. It is difficult to compare the performances of the ridge and lasso regressions [28], but one clear difference is that the computation time required to estimate the lasso regression is much higher than that of the ridge regression.
4.2. Support Vector Machines
The SVM is one of famous kernel-based forecasting machines. The kernel can transform the feature space and the feature space dimension. In the SVM, the sum of the upper deviation and the lower deviation between the forecasts and target values is minimized. When the prediction is bigger than the target value, becomes positive, and when the prediction is smaller than the target value, becomes positive.
If and fall in an insensitive region, they are set at zero, and the sum of errors becomes sparse. In order to describe the insensitive region mathematically, the -sensitive error function is used as below:
Target values that are not in the insensitive region are defined as support vectors because they support target values in the insensitive region. These support vectors confine forecasted values in the insensitive region to minimize forecasting errors. The mechanism is describes as a minimization problem:
However, it takes a lot of time to solve the quadratic optimization problem in Equation (7) using the typical Lagrangian relaxation. However, it can be quickly solved by the sequential minimal optimization (SMO) algorithm [31]. In Equation (7), the cost of deviation C, size of the insensitive region , kernel function , and tolerance v for optimization are found from many sets of parameters through the cross validation to reduce the over-fitting. The is chosen as the best set of parameters. Moreover, it takes five seconds to solve a SVM problem, so the SVM is one of the fast running forecasting algorithms. Furthermore, as shown in Table 2, the SVM are not affected by outliers because of the support vectors and loss functions. Even without removing the outliers, the SVM achieves 37th ranking in 160 participants, which outperforms other forecasting machines.
4.3. Gradient Boosting Machines
The GBM, which is well explained in [32], is one of representative tree-based forecasting machines. In the GBM, the regression function is built by recursively adding multiple weak learners. A shallow regression tree, whose number of branch levels is small, is usually used as a weak learner. The premise of the GBM is that the next tree is trained from the residuals between the outputs of sum of previous trees and actual values. Therefore, the GBM can have a reinforce system that can improve the forecasting power for difficult samples, which were not easily learned by . The forecasting power is increased by having bigger weight factors for difficult samples, which are difficult to learn, and by having smaller weight factors for easy samples, which are easy to learn.
The in the GBM can be designed by minimizing the quadratic loss function L, which is defined as:
The L is minimized by updating by the steepest descent as:
where is the mth gradients for , and is the mth step length. First, should be obtained. However, it is difficult to obtain the gradients for new data since the GBM is not based on a continuous function but based on a non-parametric function. In order to have the forecasting power on new data, is considered as a new tree to be added. The values of branches in become gradients. Therefore, the new data will have the same gradients of input training data in the same leaf, where the new data is belonging. For example, the at nth input data and at the mth iteration is given as:
Then, the internal parameters in are obtained by solving the least square problem below
where is used for normalization.
Second, the can be calculated by minimizing L as:
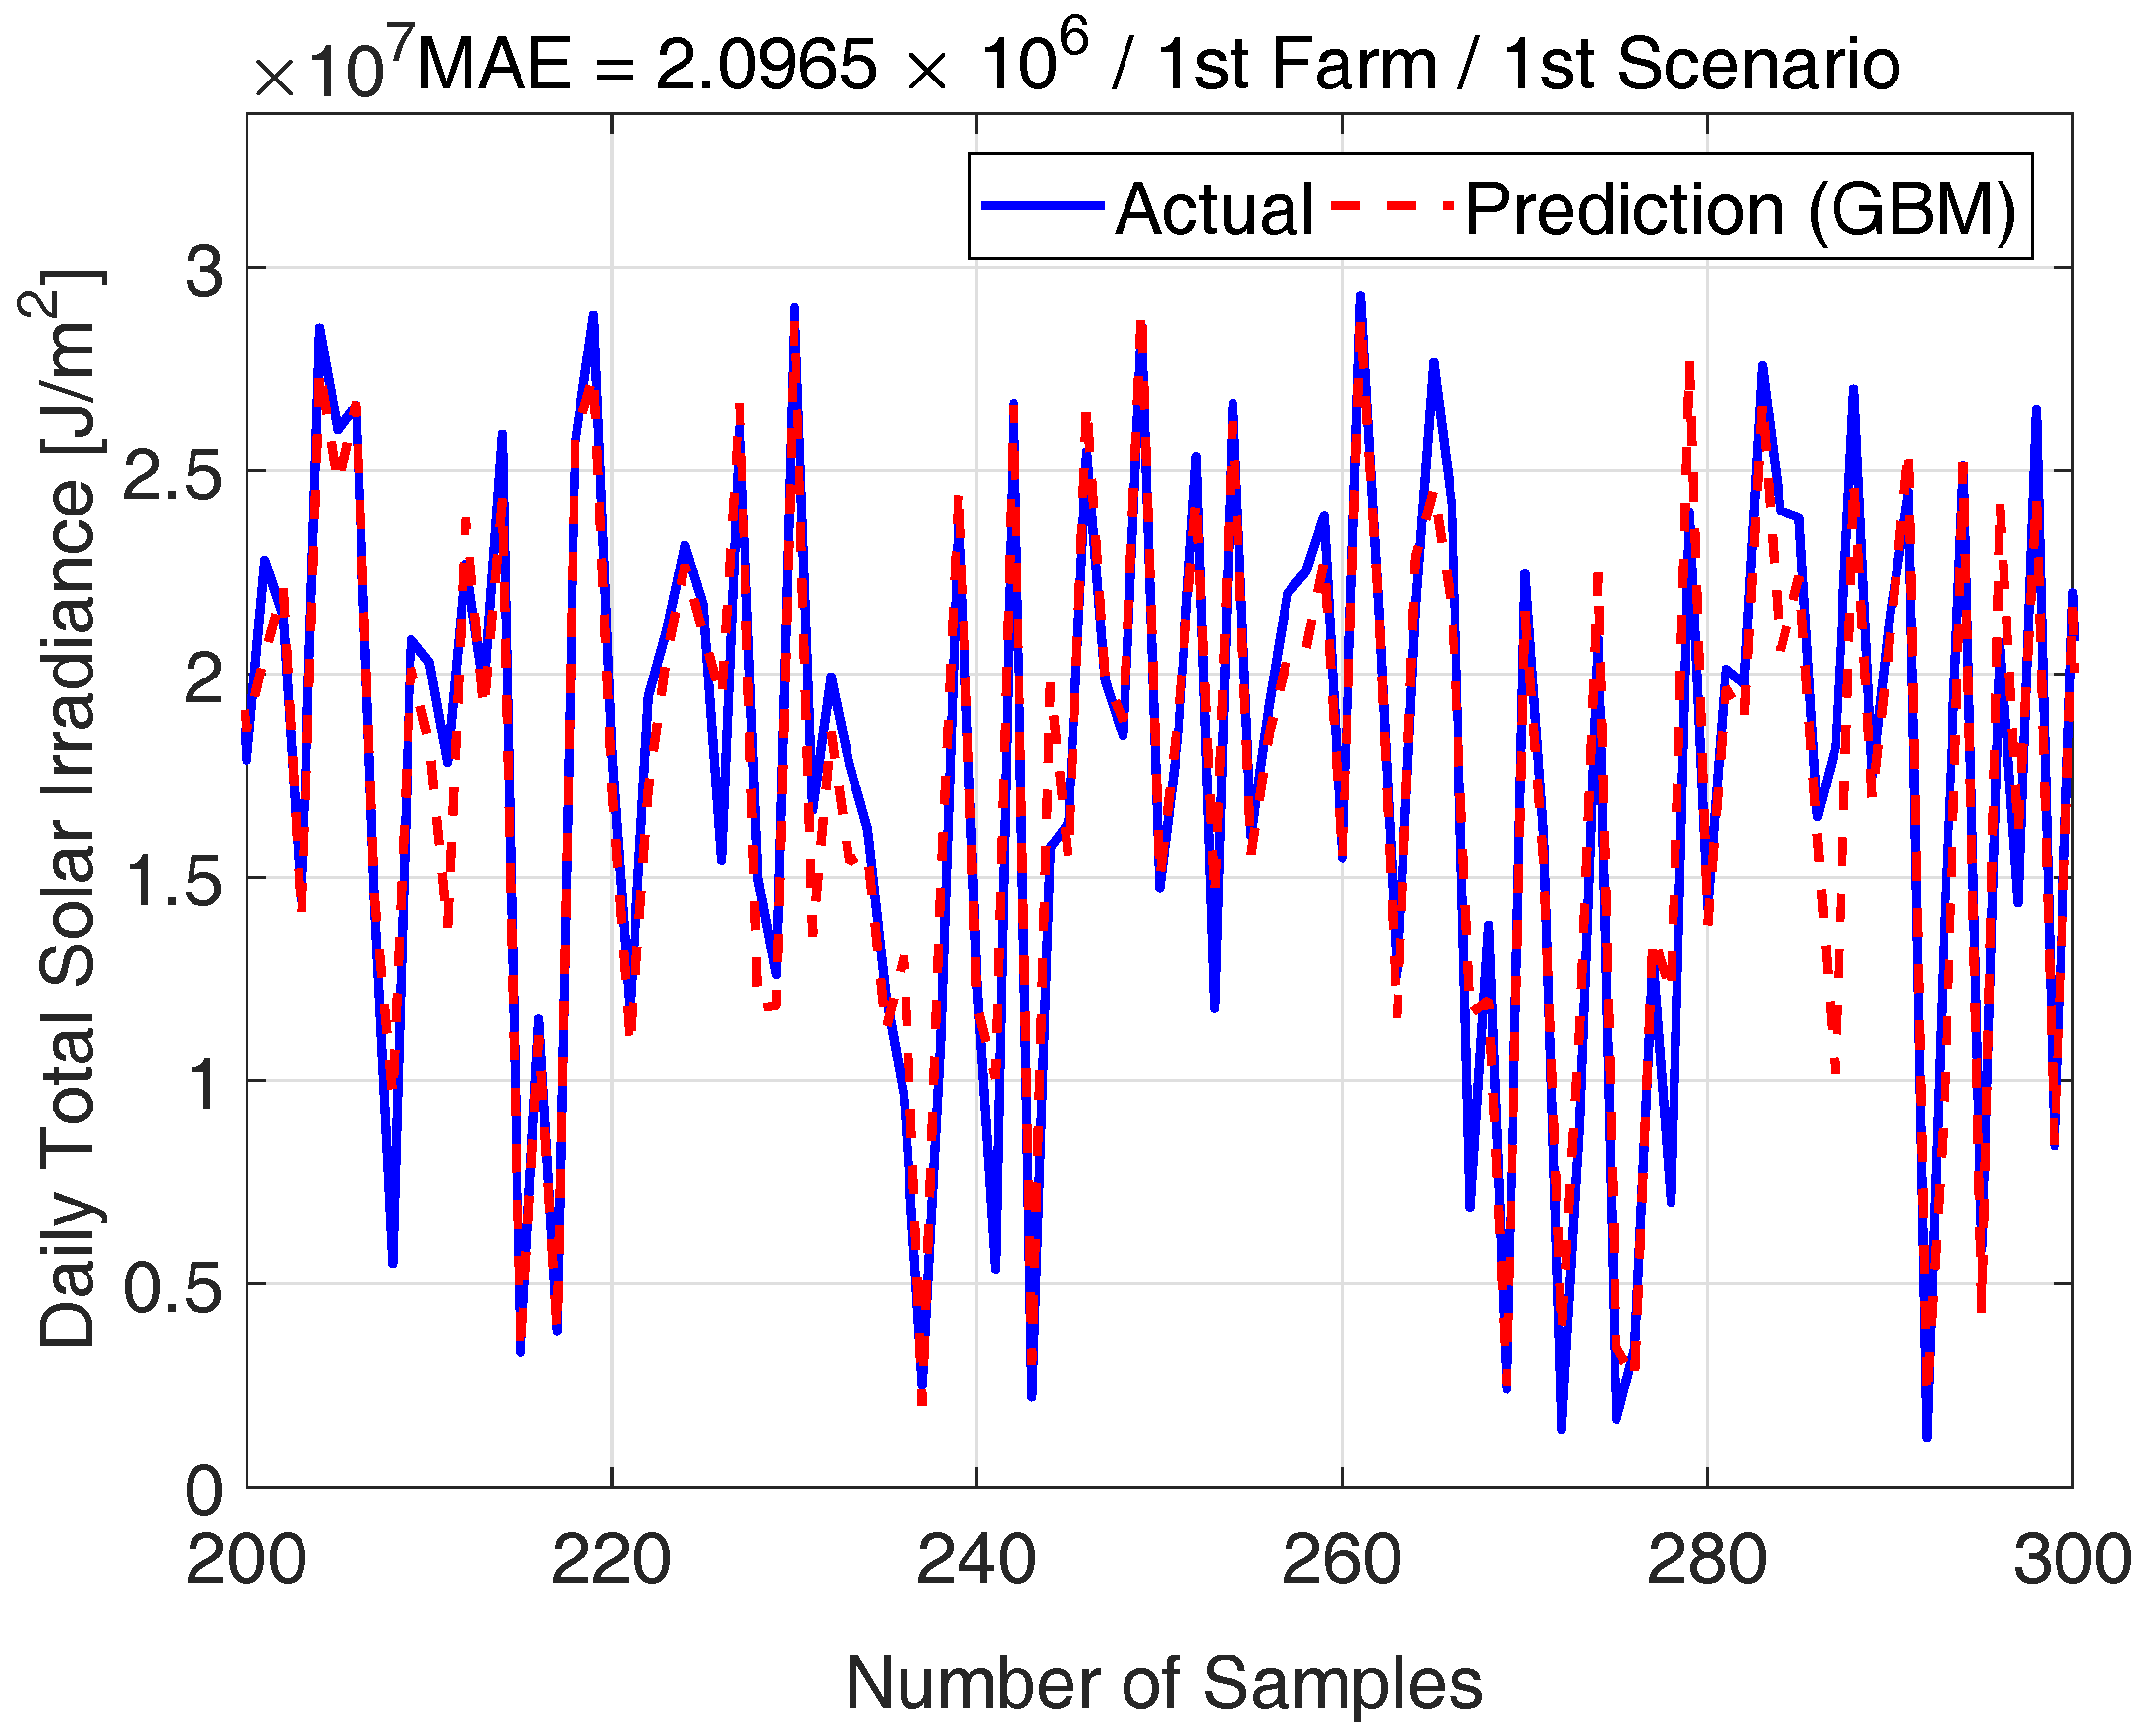
In the GBM, the sampling rate, number of iterations m, shrinkage v, and minimum node sizes can be controlled to reduce the over-fitting. First, the sampling rate is 0.5. The sampling rate is used to train a tree with differently sampled training cases. By training a tree with sampled cases, the computational time can be reduced. Furthermore, by training a tree with different cases, the variance of the forecasting power can be reduced [33]. It should be noted that, if the sampling rate is too low, each tree is trained with few cases. If the sampling rate is too high, almost trees are trained with similar cases. Second, v is between 0.01 and 0.05, and m is between 2000 and 4000 with respect to the quality of the training data. If v is low even with the high m, the tree is updated many times with a small learning step, and then the over-fitting can be reduced. Third, the number of node size of all trees is limited by five. If the number of node size is too large, a tree has many internal parameters, and the GBM could be easily over-fitted. The test data is predicted by the GBM in Figure 4.
5. Ensemble Forecasting
In this section, the performances and characteristics of forecasting machines and ensemble forecasting algorithms are compared. Furthermore, it is shown that the forecasting power can be increased simply by adjusting the biased mean and STD.
5.1. Performance Comparison of Individual Forecasting Machines
The performance of forecasting machines is compared by evaluating the accuracy of their forecasts on the first NWP scenario, the averaged predictions of 12 scenarios (11 scenarios plus the averaged scenario), the best prediction of the 12 scenarios, the prediction of the averaged scenario without weight factors, and the averaged predictions of the 12 scenarios with weight factors. Furthermore, under the same conditions, the performance of each forecasting machine is compared not only using the performances for different ensemble configurations in Table 4, but also using overall performances through this study. In this simulation, the linear interpolation function is used, 10% outliers are removed, and the training data is not classified.
The characteristics of forecasting machines are compared in Table 5 for the forecasting performance, computation time, and controllability, which represents the inverse of the number of required variables. The GBM performs best in all configurations. The second best is the SVM, and next is the NN. Furthermore, the BAG, GP, and RF perform similarly, but the BAG and GP are better than the RF. However, the performance of the RF can be increased by finding the optimal internal parameters. The ridge and lasso regression perform worst. The computational time is also compared. The GBM is the slowest forecasting machine, and it requires around three hours. In contrast, the ridge regression runs faster than any forecasting machines.
The performances and characteristics of forecasting machines can be further analyzed. First, the performance of the ridge regression is affected by the length of training data. Therefore, when the regularization coefficient of the ridge regression is calculated, ten-fold cross validation is used for our training data since the ridge regression performs best at the length of ten-folded training data. In the GP, the combination of the linear, constant, and Gaussian isotropic kernels performs best. Furthermore, the performances of the SVM and NN are not affected by the existence of outliers.
5.2. Ensemble Algorithms
There are four representative ensemble algorithms. In the first algorithm, which is as known as the BAG algorithm, many individual forecasting machines are trained by differently sampled training data. Then, the forecasts of individual forecasting machines are just averaged. In the second algorithm, which is as known as the boosting algorithm, the forecasting machine is recursively updated by adding an individual forecasting learner. The next learner is fitted to learn particular cases that the sum of previous learners did not learn well. In the third algorithm, the outputs of individual forecasting machines are just averaged. In the fourth algorithm, the outputs of individual forecasting machines are averaged with weights, which are linearly proportional to the forecasting power of corresponding forecasting machines. In this application, these four ensemble methods are implemented and compared. The first ensemble algorithm is implemented through the regression tree in the BAG, the second ensemble algorithm is implemented through the regression tree in the GBM, and the third and fourth ensemble algorithms are implemented through the combination of many individual forecasting machines.
The simple averaging method performs better than the weighted averaging method with one-time cross validation as shown in Table 4. The third best method is the averaged scenario. Generally, the weighted averaging method should perform better since it uses the performance information. However, this assumption is shown to be wrong in Table 4. The first reason for this disparity is that the performances of the combinations of forecasting machines and scenarios are evaluated by a one-time cross validation. With the k-fold cross validation, the weight averaging method might outperform the simple averaging method. The second reason is the amount of the test data. In this study, training data is measured for seven years, and test data is measured for five years, so there might not be enough training data to capture all characteristics of the data.
The effect of the scenario combinations on the forecasting performance is also tested. Using all 12 NWP scenarios outperforms the averaged scenario. In all cases, a combination of multiple NWP scenarios performs better than the performance of the first scenario and the averaged scenario. Furthermore, selecting the best NWP scenario performs similarly to the first scenario. Usually, the 5th, 8th, and averaged scenario are selected as the best scenario.
Combining multiple forecasting machines always performs better than using a single forecasting machine. In Table 6, performances of multiple forecasting machines are measured by categories. Under the simple averaging method and Linear interpolation function, the three best models GBM, NN, and SVM are used. In this simulation, 10% data is considered as an outlier and removed, and grouping is not used. On the contrary, when the weighted averaging method is used to maximize the forecasting performance, all six machines are used. In the first three categories, all NWP scenarios are used in the ensemble forecasting, but, in the last three categories, the averaged scenario is used. The ranking is 17th place among 160 participants by averaging predictions from the 12 scenarios and three forecasting machines. On the contrary, the best performance of the GBM is 20th place in Table 4 with the same simulation conditions. When the weighted averaging method is used, the best performance of the GBM is 24th place, but the performance of the combination of all forecasting machines is 17th place. Furthermore, when the averaged scenario is used, the performance of a combination of multiple forecasting machines outperforms the performance of individual forecasting machines under both the simple and weighted averaging methods. For example, the performance of the combination of the GBM, NN, and SVM is 24th place under the simple averaging method, but the best performance among the individual performances is 28th place.
In addition, the k-fold cross validation is useful to increase the forecasting performance further by selecting optimal weighted factors in the weighted averaging method, but it also increases the computational time exponentially, so it is not applicable to the real-time environment. Therefore, when users select the ensemble forecasting method between the weighted averaging method and simple averaging method, they should balance between the forecasting performance and computational time.
5.3. Post-Processing
There are significant bias errors in the means and STDs of predictions. In the post-processing, the mean and STD are adjusted by observing the mean and STD bias for each solar farm. A few best predictions in Table 4 and Table 6 are modified, and their new performances are summarized in Table 7. In this simulation, the Linear function is used to interpolate the NWPs, 10% of data are considered as an outlier and removed. Furthermore, the training data is not classified into groups. The best performance in our study is fifth place. In this case, the outputs are generated by averaging the predictions of the 12 scenarios with simple averaging of the factors. It means that each scenario has its own result, and the final result is estimated by averaging all results of scenarios. The forecasting machine is the GBM. Although the model based on the GBM is implemented by collecting key ideas from the winning models, the performance of our model cannot match their performance [34]. There is a huge gap even among participants within the top five. The MAE of the best, second best, and third best models is 2,107,588, 2,128,116, and 2,158,525, respectively. On the contrary, the minimum error of our best model is 2,174,246, which corresponds to 7% of the maximum solar irradiation.
6. Discussion
In this section, the performance of our model is compared to the performance of other forecasting models in the same competition [35]. Although there are many solar power forecasting models in literature, it is difficult to directly compare our model to those models since different test data sets are used. Therefore, in this section, our model is compared to forecasting models in the same competition.
The winning team, which was led by Lucas Eustaquio [34], also used the ensemble forecasting model, where 13 individual forecasting models are blended through the weighted averaging. The weighted factors can reflect the accuracy of forecasting machines. The more accurate forecasting machine receives bigger weight factors. Both our model and the model of winning team use the weighted averaging, but there are two different things between two models. First, in our model, the inverse of the errors is defined as the weight factors so that the smaller errors the forecasting model has, the bigger its weight factors will be. On the contrary, in their model, the weight factors were optimized through the nonlinear optimization algorithm in [36]. Second, our individual forecasting models are based on different forecasting algorithms, but the winning team uses a single GBM forecasting model with 13 different input data sets. Although the performance of different input data sets is also tested in our application, the data set with the best performance is only trained by different forecasting algorithms. These two differences make their model perform better than ours. Finally, the MAE of the winning team was .
The second placed team, which was led by Benjamin Lazorthes [37], focused on transforming the training data. They averaged the NWP data at the surrounding four grids after multiplying weights that are linearly proportional to the inverse of distances. This approach is exactly the same as our IDW interpolation function. On the contrary, in our application, the linear interpolation method has the best performance. They also used the ensemble forecasting by combining 12 different GBM models with different internal parameters. Although their forecasting model is similar to our model, the key advance of their model is to use different internal parameters in the GBM models. On the contrary, in our model, only a set of optimal internal parameters are used. Finally, the MAE of the second placed team was .
The third placed team, which was led by Owen Zhang [35], also used the IDW function, but the weight factors were found by considering longitudes and latitudes. They also used the ensemble forecasting based on two GBM models. The interesting point of their model is that they used the voting system in the ensemble forecasting. A separate voting function chose one of two GBM models at every target value. The performance of the third placed team was .
7. Conclusions
In this study, the total daily solar irradiation for the next day is forecasted through the ensemble forecasting. In this process, many forecasting techniques are tested, and their contributions to forecasting performance are evaluated so that other researchers can refer our works and increase the forecasting performance of their models. The forecasting techniques can be classified with respect to the forecasting steps into three stages: preprocessing, forecasting, and postprocessing. Therefore, a few significant results are summarized below with respect to stages.
- In the preprocessing stage
- (a)
- The linear interpolation function has the best performance. However, the Kriging and Around functions are also good interpolation functions.
- (b)
- Transforming weather information does not improve the forecasting performance. Furthermore, it is not necessary to subtract or model yearly trends because predictors also have yearly trends.
- (c)
- Outliers should be removed. The ridge regression can be used to detect outliers.
- In the forecasting stage
- (a)
- Data classification does not improve the forecasting performance. However, data classification based on the cloud cover sometimes has better performance, but it depends on the forecasting machines.
- (b)
- In order to forecast the total daily solar irradiation, it is not necessary to use predictors on the previous day and the day after. Furthermore, daily solar irradiation should not be smoothed.
- (c)
- The GBM shows the best performance. The next best machine is the SVM, and the third is the NN. The GP, RF, and BAG are slightly better than the ridge regression, but considering the computation time, it is difficult to say that these three machines are certainly better than the ridge regression.
- In the postprocessing stage
- (a)
- Simple averaging is better than the weighted averaging if the cross validation is performed one time. Moreover, averaging the forecasts from 12 individual scenarios can improve the forecasting performance.
- (b)
- The means and STDs of predictions should be adjusted because the mean of target values is biased when outliers are removed.
Acknowledgments
This work was supported by the Korea Institute of Energy Technology Evaluation and Planning (KETEP) and the Ministry of Trade, Industry & Energy (MOTIE) of the Republic of Korea (No. 20174030201660) and Basic Science Research Program through the National Research Foundation of Korea (NRF) funded by the Ministry of Education (No. 2017035806).
Author Contributions
Min-Kyu Baek prepared the first draft of this manuscript, contributed to the preparation of the databases, and simulated various cases. Duehee Lee developed the ensemble forecasting model, revised the manuscript, and provided the research direction.
Conflicts of Interest
The authors declare no conflict of interest.
Abbreviations
| NWP | Numerical weather prediction |
| ISO | Independent system operator |
| NN | Neural network |
| SVM | Support vector machine |
| GHI | Global horizontal irradiation |
| DNI | Direct normal irradiation |
| DHI | Diffuse horizontal irradiation |
| AR | Autoregressive |
| ARIMA | Autoregressive integrated moving average |
| SOM | Self-organized map |
| DRWNN | Diagonal recurrent wavelet neural network |
| ARMA | Autoregressive moving average |
| GP | Gaussian process |
| BAG | Bootstrap aggregation |
| GBM | Gradient boosting machine |
| RF | Random forest |
| MAE | Mean absolute error |
| STD | Standard deviation |
| IDW | Inverse distance weighted |
| MART | Multiple additive regression trees |
References
- Wittmann, M.; Eck, M.; Pitz-Paal, R.; Müller-Steinhagen, H. Methodology for optimized operation strategies of solar thermal power plants with integrated heat storage. Sol. Energy 2011, 85, 653–659. [Google Scholar] [CrossRef]
- Kraas, B.; Schroedter-Homscheidt, M.; Madlener, R. Economic merits of a state-of-the-art concentrating solar power forecasting system for participation in the Spanish electricity market. Sol. Energy 2013, 93, 244–255. [Google Scholar] [CrossRef]
- Mellit, A.; Pavan, A.M. A 24-h forecast of solar irradiance using artificial neural network: Application for performance prediction of a grid-connected PV plant at Trieste, Italy. Sol. Energy 2010, 84, 807–821. [Google Scholar] [CrossRef]
- Mellit, A.; Benghanem, M.; Kalogirou, S. An adaptive wavelet-network model for forecasting daily total solar-radiation. Appl. Energy 2006, 83, 705–722. [Google Scholar] [CrossRef]
- Paoli, C.; Voyant, C.; Muselli, M.; Nivet, M.L. Forecasting of preprocessed daily solar radiation time series using neural networks. Sol. Energy 2010, 84, 2146–2160. [Google Scholar] [CrossRef]
- Goh, T.; Tan, K. Stochastic modeling and forecasting of solar radiation data. Sol. Energy 1977, 19, 755–757. [Google Scholar] [CrossRef]
- Bacher, P.; Madsen, H.; Nielsen, H.A. Online short-term solar power forecasting. Sol. Energy 2009, 83, 1772–1783. [Google Scholar] [CrossRef] [Green Version]
- Yang, D.; Jirutitijaroen, P.; Walsh, W.M. Hourly solar irradiance time series forecasting using cloud cover index. Sol. Energy 2012, 86, 3531–3543. [Google Scholar] [CrossRef]
- Kemmoku, Y.; Orita, S.; Nakagawa, S.; Sakakibara, T. Daily insolation forecasting using a multi-stage neural network. Sol. Energy 1999, 66, 193–199. [Google Scholar] [CrossRef]
- Sfetsos, A.; Coonick, A. Univariate and multivariate forecasting of hourly solar radiation with artificial intelligence techniques. Sol. Energy 2000, 68, 169–178. [Google Scholar] [CrossRef]
- Marquez, R.; Coimbra, C.F. Forecasting of global and direct solar irradiance using stochastic learning methods, ground experiments and the NWS database. Sol. Energy 2011, 85, 746–756. [Google Scholar] [CrossRef]
- Cano, D.; Monget, J.; Albuisson, M.; Guillard, H.; Regas, N.; Wald, L. A method for the determination of the global solar radiation from meteorological satellite data. Sol. Energy 1986, 37, 31–39. [Google Scholar] [CrossRef]
- Perez, R.; Ineichen, P.; Moore, K.; Kmiecik, M.; Chain, C.; George, R.; Vignola, F. A new operational model for satellite-derived irradiances: Description and validation. Sol. Energy 2002, 73, 307–317. [Google Scholar] [CrossRef]
- Perez, R.; Kivalov, S.; Schlemmer, J.; Hemker, K., Jr.; Renné, D.; Hoff, T.E. Validation of short and medium term operational solar radiation forecasts in the US. Sol. Energy 2010, 84, 2161–2172. [Google Scholar] [CrossRef]
- Mathiesen, P.; Collier, C.; Kleissl, J. A high-resolution, cloud-assimilating numerical weather prediction model for solar irradiance forecasting. Sol. Energy 2013, 92, 47–61. [Google Scholar] [CrossRef]
- Calbo, J.; Gonzalez, J.A.; Pages, D. A Method for Sky-Condition Classification from Ground-Based Solar Radiation Measurements. J. Appl. Meteorol. 2001, 40, 2193–2199. [Google Scholar] [CrossRef]
- Chen, C.; Duan, S.; Cai, T.; Liu, B. Online 24-h solar power forecasting based on weather type classification using artificial neural network. Sol. Energy 2011, 85, 2856–2870. [Google Scholar] [CrossRef]
- Cao, J.; Lin, X. Study of hourly and daily solar irradiation forecast using diagonal recurrent wavelet neural networks. Energy Convers. Manag. 2008, 49, 1396–1406. [Google Scholar] [CrossRef]
- Ji, W.; Chee, K.C. Prediction of hourly solar radiation using a novel hybrid model of ARMA and TDNN. Sol. Energy 2011, 85, 808–817. [Google Scholar] [CrossRef]
- Gueymard, C.A. Impact of on-site atmospheric water vapor estimation methods on the accuracy of local solar irradiance predictions. Sol. Energy 2014, 101, 74–82. [Google Scholar] [CrossRef]
- Breitkreuz, H.; Schroedter-Homscheidt, M.; Holzer-Popp, T. A case study to prepare for the utilization of aerosol forecasts in solar energy industries. Sol. Energy 2007, 81, 1377–1385. [Google Scholar] [CrossRef] [Green Version]
- Gueymard, C.A. REST2: High-performance solar radiation model for cloudless-sky irradiance, illuminance, and photosynthetically active radiation—Validation with a benchmark dataset. Sol. Energy 2008, 82, 272–285. [Google Scholar] [CrossRef]
- Reikard, G. Predicting solar radiation at high resolutions: A comparision of time series forecasts. Sol. Energy 2009, 83, 342–349. [Google Scholar] [CrossRef]
- Perpinan, O.; Lorenzo, E. Analysis and synthesis of the variability of irradiance and PV power time series with the wavelet transform. Sol. Energy 2011, 85, 188–197. [Google Scholar] [CrossRef] [Green Version]
- Basara, J.; Hamill, T.; Gagne, D.J.; Mcgovern, A. AMS 2013–2014 Solar Energy Prediction Contest. 2013. Available online: http://www.kaggle.com/c/ams-2014-solar-energy-prediction-contest/data (accessed on 15 November 2013).
- Hur, J. Spatial Prediction of Wind Farm Output for Grid Integration Using the Augmented Kriging-Based Model. Ph.D. Thesis, The University of Texas at Austin, Austin, TX, USA, 2012. [Google Scholar]
- Sherman, M. Spatial Statistics and Spatio-Temporal Data: Covariance Functions and Directional properties; John Wiley & Sons: West Sussex, UK, 2011. [Google Scholar]
- James, G.; Witten, D.; Hastie, T.; Tibshirani, R. An Introduction to Statistical Learning with Application in R; Springer: New York, NY, USA, 2013. [Google Scholar]
- Bishop, C.M. Pattern Recognition and Machine Learning; Springer: New York, NY, USA, 2006. [Google Scholar]
- Lee, D. Wind Power Forecasting and Its Applications to the Power System. Ph.D. Thesis, The University of Texas at Austin, Austin, TX, USA, 2015. [Google Scholar]
- Chang, C.C.; Lin, C.J. LIBSVM: A Library for Support Vector Machines. ACM Trans. Intell. Syst. Technol. 2011, 2, 27. [Google Scholar] [CrossRef]
- Hastie, T.; Tibshirani, R.; Friedman, J. The Elements of Statistical Learning, 2nd ed.; Springer: New York, NY, USA, 2009. [Google Scholar]
- Friedman, J.H. Stochastic gradient boosting. Comput. Stat. Data Anal. 2002, 38, 367–378. [Google Scholar] [CrossRef]
- Eustaquio, L.; da Silva, G. A Blending Approach to Solar Energy Prediction. In Proceedings of the American Meteorological Society 94th Annual Meeting, Atlanta, GA, USA, 2–6 February 2014. [Google Scholar]
- McGovern, A.; Gagne, D.J., II; Basara, J.; Hamill, T.M.; Margolin, D. Solar Energy Prediction: An International Contest to Initiate Interdisciplinary Research on Compelling Meteorological Problems. Bull. Am. Meteorol. Soc. 2015, 96, 1388–1395. [Google Scholar] [CrossRef]
- Nelder, J.A.; Mead, R. A simplex method for function minimization. Comput. J. 1965, 7, 308–313. [Google Scholar] [CrossRef]
- Lazorthes, B. A gradient boosting approach for the short term prediction of solar energy production (AMS 2013–2014 Solar Energy Prediction Contest). In Proceedings of the American Meteorological Society 94th Annual Meeting, Atlanta, GA, USA, 2–6 February 2014. [Google Scholar]
Figure 1.
Grid points where NWP (numerical weather prediction) is forecasted are plotted as blue circles. Red squares represent candidate solar farms, which are all located in Oklahoma state.
Figure 1.
Grid points where NWP (numerical weather prediction) is forecasted are plotted as blue circles. Red squares represent candidate solar farms, which are all located in Oklahoma state.

Figure 2.
Three steps in the external forecasting process are shown. In the second and third steps, the internal forecasting process in Figure 3 is used.
Figure 2.
Three steps in the external forecasting process are shown. In the second and third steps, the internal forecasting process in Figure 3 is used.

Figure 3.
The overall forecasting process is described. The cross validation shown in this figure is used to determine the optimal internal parameters in the forecasting machines.
Figure 3.
The overall forecasting process is described. The cross validation shown in this figure is used to determine the optimal internal parameters in the forecasting machines.

Figure 4.
Actual target values for the test data and outputs from the GBM (gradient boosting machine) are compared. The red dotted line represents the outputs from the GBM, and the blue line represents the solar irradiation for test.
Figure 4.
Actual target values for the test data and outputs from the GBM (gradient boosting machine) are compared. The red dotted line represents the outputs from the GBM, and the blue line represents the solar irradiation for test.


Table 1.
The performance of various interpolation functions is measured by the MAE (mean absolute error) in .
Table 1.
The performance of various interpolation functions is measured by the MAE (mean absolute error) in .
| Forecasting Machines | Kriging | Linear | IDW | Around | Averaging | Cubic |
|---|---|---|---|---|---|---|
| Ridge Regression | 2,411,495 | 2,416,173 | 2,419,689 | 2,428,387 | 2,419,690 | 2,433,544 |
| GBM | 2,309,245 | 2,299,215 | 2,312,652 | 2,308,697 | 2,312,205 | 2,314,920 |
| SVM | 2,324,170 | 2,308,946 | 2,317,002 | 2,316,937 | 2,316,893 | 2,366,987 |
| GP | 2,350,663 | 2,346,273 | 2,354,455 | 2,481,475 | 2,364,852 | 2,367,734 |
| NN | 2,329,175 | 2,315,835 | 2,331,230 | 2,325,608 | 2,329,858 | 2,342,507 |
| RF | 2,394,776 | 2,391,807 | 2,399,956 | 2,401,163 | 2,399,079 | 2,404,245 |
| BAG | 2,390,378 | 2,378,117 | 2,393,362 | 2,383,049 | 2,389,915 | 2,397,192 |
Table 2.
The performances of various outlier detection methods are measured by the MAE in . The numbers represent the percentage of ourliers.
Table 2.
The performances of various outlier detection methods are measured by the MAE in . The numbers represent the percentage of ourliers.
| Models | 0% | 90% | 80% | 70% |
|---|---|---|---|---|
| Ridge Regression | 2,553,671 | 2,419,519 | 2,417,618 | 2,433,949 |
| GBM | 2,447,806 | 2,299,215 | 2,307,438 | 2,321,579 |
| SVM | 2,333,794 | 2,308,946 | 2,334,686 | 2,358,101 |
| GP | 2,587,676 | 2,346,273 | 2,377,282 | 2,397,874 |
| NN | 2,471,444 | 2,315,835 | 2,324,171 | 2,345,819 |
| RF | 2,526,633 | 2,391,807 | 2,392,277 | 2,412,699 |
| BAG | 2,515,011 | 2,378,117 | 2,385,677 | 2,407,208 |
Table 3.
The performances of various data classification methods are measured by the MAE in .
| Models | No Group | Per Four Months | Irradiation | Cloud | Per Two Months | Per Month |
|---|---|---|---|---|---|---|
| Ridge | 2,368,734 | 2,382,986 | 2,404,012 | 2,369,020 | 2,398,489 | 2,432,491 |
| GBM | 2,312,881 | 2,350,198 | 2,341,207 | 2,333,315 | 2,373,128 | 2,377,797 |
| SVM | 2,316,893 | 2,347,858 | 2,353,271 | 2,323,026 | 2,373,228 | 2,431,282 |
| GP | 2,364,852 | 2,460,957 | 2,401,808 | 2,369,356 | 2,384,844 | 2,474,455 |
| NN | 2,329,858 | 2,372,331 | 2,346,304 | 2,313,853 | 2,379,065 | 2,398,243 |
| RF | 2,389,060 | 2,393,942 | 2,414,873 | 2,400,797 | 2,410,479 | 2,422,342 |
| BAG | 2,389,915 | 2,385,048 | 2,406,139 | 2,391,786 | 2,399,113 | 2,407,031 |
Table 4.
The performances of various NWP ensemble methods are measured by the MAE in .
| Models | First | Averaging | The Best | Averaged | Weighted |
|---|---|---|---|---|---|
| Scenario | Ensemble | Model | Scenarios | Ensemble | |
| Ridge | 2,417,618 | 2,386,508 | 2,419,108 | 2,381,906 | 2,388,288 |
| GBM | 2,299,215 | 2,263,783 | 2,318,685 | 2,288,420 | 2,274,293 |
| SVM | 2,308,946 | 2,278,510 | 2,346,282 | 2,289,948 | 2,281,058 |
| GP | 2,346,273 | 2,298,794 | 2,342,838 | 2,315,586 | 2,300,502 |
| NN | 2,315,835 | 2,283,094 | 2,310,458 | 2,300,771 | 2,283,158 |
| RF | 2,391,807 | 2,356,177 | 2,386,400 | 2,359,200 | 2,357,831 |
| BAG | 2,378,117 | 2,346,498 | 2,392,723 | 2,352,059 | 2,348,898 |
Table 5.
Forecasting machines comparison.
| Models | Performance | Speed | Controllability |
|---|---|---|---|
| Ridge | ⋆ | ||
| GBM | |||
| SVM | |||
| GP | ⋆ | ⋆ | |
| NN | |||
| RF | |||
| Bag |
Table 6.
The performances of ensemble methods with multiple forecasting machines are measured by the MAE in .
Table 6.
The performances of ensemble methods with multiple forecasting machines are measured by the MAE in .
| Category | Functions | MAE |
|---|---|---|
| All ensemble—all ensemble (Simple Average) | GBM, NN, SVM | 2,250,624 |
| All ensemble—all ensemble (Weighted) | Ridge, GBM, SVM, GP, NN, RF, BAG | 2,279,227 |
| All ensemble—all ensemble (Best of Best) | Ridge, GBM, SVM, GP, NN, RF, BAG | 2,323,061 |
| Averaged Scenarios—Simple Averaging (new) | GBM, NN, SVM | 2,261,743 |
| Averaged Scenarios—Weight Averaging (new) | Ridge, GBM, SVM, GP, NN, RF, BAG | 2,269,546 |
| Averaged Scenarios—Best of Best (new) | Ridge, GBM, SVM, GP, NN, RF, BAG | 2,298,898 |
Table 7.
The performances for ensemble with multiple forecasting machines with adjusted means and STDs (standard deviations) are measured by the MAE in .
Table 7.
The performances for ensemble with multiple forecasting machines with adjusted means and STDs (standard deviations) are measured by the MAE in .
| Category | Functions | MAE | Ranking |
|---|---|---|---|
| All Scenarios—Simple Avg | GBM, NN, SVM | 2,174,984 | 5 |
| All Scenarios—Weighted Avg | GBM, NN, SVM | 2,182,306 | 6 |
| Averaged Scenarios—Simple Avg | GBM, NN, SVM | 2,187,772 | 6 |
| Averaged Scenarios—Weight Avg | Ridge, GBM, SVM, GP, NN, RF, BAG | 2,194,493 | 8 |
| GBM: All Scenarios—Simple Avg | GBM | 2,174,246 | 5 |
| GBM: All Scenarios—Weight Avg | GBM | 2,188,446 | 6 |
© 2017 by the authors. Licensee MDPI, Basel, Switzerland. This article is an open access article distributed under the terms and conditions of the Creative Commons Attribution (CC BY) license (http://creativecommons.org/licenses/by/4.0/).
Share and Cite
MDPI and ACS Style
Baek, M.-K.; Lee, D. Spatial and Temporal Day-Ahead Total Daily Solar Irradiation Forecasting: Ensemble Forecasting Based on the Empirical Biasing. Energies 2018, 11, 70. https://doi.org/10.3390/en11010070
AMA Style
Baek M-K, Lee D. Spatial and Temporal Day-Ahead Total Daily Solar Irradiation Forecasting: Ensemble Forecasting Based on the Empirical Biasing. Energies. 2018; 11(1):70. https://doi.org/10.3390/en11010070
Chicago/Turabian StyleBaek, Min-Kyu, and Duehee Lee. 2018. "Spatial and Temporal Day-Ahead Total Daily Solar Irradiation Forecasting: Ensemble Forecasting Based on the Empirical Biasing" Energies 11, no. 1: 70. https://doi.org/10.3390/en11010070
Note that from the first issue of 2016, this journal uses article numbers instead of page numbers. See further details here.