Estimation for Expected Energy Not Served of Power Systems Using the Screening Methodology of Cascading Outages in South Korea


Department of Electrical Engineering, Sangmyung University, Seoul 03016, Korea
*
Author to whom correspondence should be addressed.
Energies 2018, 11(1), 81; https://doi.org/10.3390/en11010081
Submission received: 1 November 2017
/
Revised: 19 December 2017
/
Accepted: 27 December 2017
/
Published: 29 December 2017
(This article belongs to the Special Issue Risk-Based Methods Applied to Power and Energy Systems)
Abstract
:The uncertainty of complex power systems increases the possibility of large blackouts due to the expectations of physical events, such as equipment failures, protection failures, control actions failure, operator error, and cyber-attacks. Cascading outage is a sequence of dependent failures of individual components that successively weaken the power system. A procedure to identify and evaluate the initiating events and perform sequential cascading analysis is needed. In this paper, we propose a new screening methodology based on sequential contingency simulation of cascading outages, including probabilistic analysis and visualization model. Performance of a detail cascading analysis using practical power systems is suggested and discussed. The proposed screening methodology will play a key role in identifying the uncontrolled successive loss of system elements.
1. Introduction
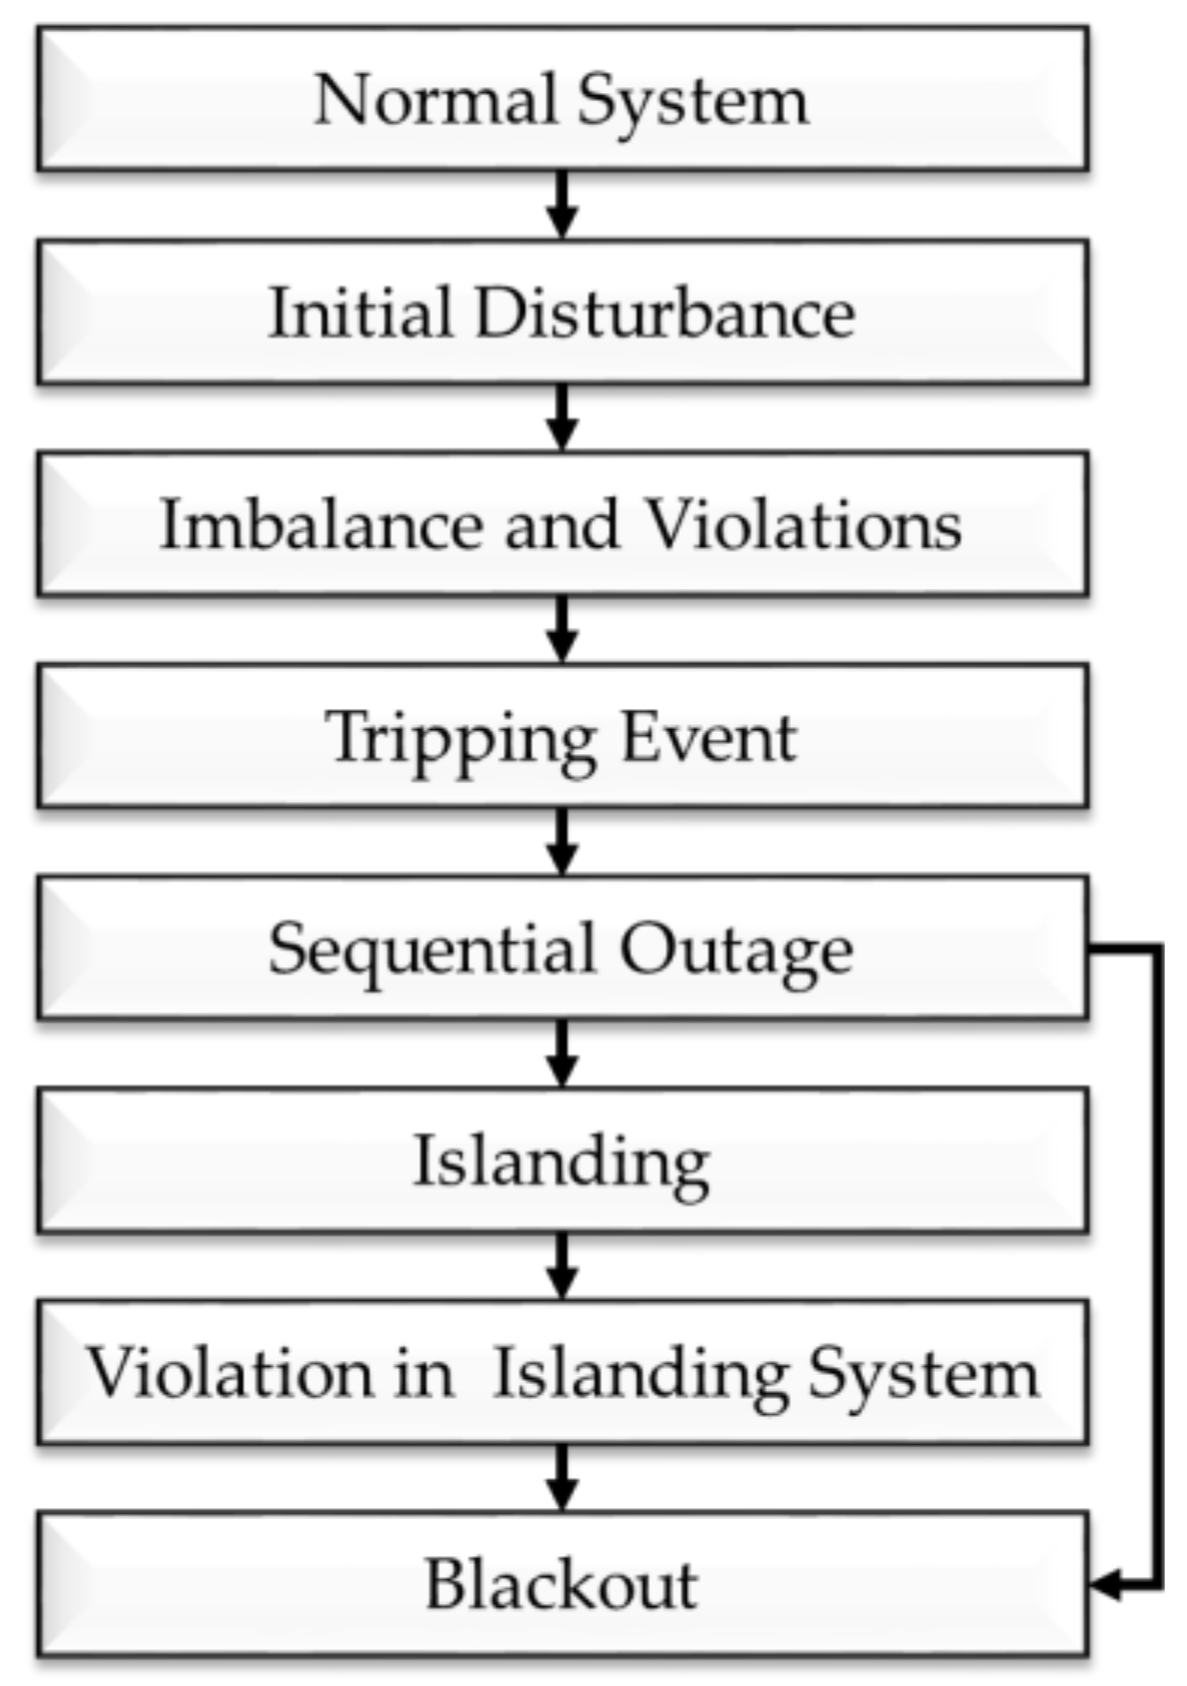
Future electrical power systems need to secure the stable supply of electric power according to the expansion of distributed power sources based on various technologies, and power systems need to be reliable against natural disasters and unexpected physical or cyber-attacks. In addition, the potential economic and social losses are so enormous that it is imperative to evaluate the risk of system failures in the event of a blackout. In the analysis of recent blackouts [1,2,3], large blackouts are described by cascading outages that cause deterioration of poser systems, as shown in Figure 1. A cascading outage is defined by sequential contingency caused by an initial disturbance. The initial disturbance includes natural disasters, imbalance and violations, and unexpected failures [4,5,6]. An initial event causes an imbalance or violation in the system. This can lead to the tripping of facilities such as transmission lines, generators, and transformers, and outages can spread in succession, depending on the operating conditions of the system. An outage can occur sequentially, resulting in a separate system [7]. If a violation occurs in the islanding system, it can be extended to a partial or total blackout.
Cascading outage is a sequence of dependent failures of individual components that successively weaken the power system. In case of an event that is related to weather, such as an earthquake or typhoon, it causes extensive power outages and creates a complex disaster that has a huge impact on society and economy. In addition, since the importance of securing social and public safety and increasing social demands of the disaster, it is necessary to consider for the influence of the power system resulted from disasters.
Transmission operations are focused on avoiding cascading that could lead to the loss of generation or load due to contingencies events. Transmission operations have to decide what kinds of the pre-determined mitigation solutions and when to avoid unacceptable system conditions or loss of generation due to cascading either in real time or study mode. Similarly, transmission planning is focused on the expected future impact of cascading on the potential loss of generation or load due to contingency events. Transmission planning involves deciding when expected system performance deficiencies are significant enough to implement system modifications [7,8,9].
Power outages that are associated with weather-related cause significant damage to the transmission system [10,11,12]. Severe weather changes can be a source of the large-scale disruptions to the system, increasing the loss of the grid and cause severe power outages along with a large amount of electricity demand concentrated in urban areas and aging of the system facilities. In the case of precipitation and strong winds, it may cause equipment damage due to contact with trees. It results in damage to the transmission power transmission which transmits large capacity electric power over a long distance. For such a reason, most of the blackouts occurred due to severe weather conditions. In Korea, there is no damage to snowstorms or hurricanes, which account for a large part of the United States (U.S.) outage rate. However, Korea is directly or indirectly influenced by three or more typhoons every year, and there is a risk of natural disasters due to a rainy season of about 30 days. Consequently, it is necessary to analyze the impacts of the power system caused be the climate change because the annual heat wave becomes severe and the heavy rainfall becomes heavy. In the Korean power system, the scale of the system is larger than that of the country, and it is complicated. In addition, the system is operated strictly in accordance with the reliability standard. Although the system is relatively robust, a partial power outage may occur, but the probability of the system collapse due to an imbalance in supply and demand is low. However, it is essential to examine the possibility of a major outage in the event of a critical situation when large-scale power transmission is concentrated in a metropolitan area and physical or cyber-attacks are carried out as in an armistice country.
In this paper, we propose a new screening methodology that is based on sequential contingency simulation of cascading outages, including probabilistic analysis and visualization model. We estimate the Expected Energy Not Served (EENS) by simulating the potential outages in the power system against serious scenarios. The screening methodology based on fast sequential contingency simulation is used to identify potential cascading events. Cascading outages are consecutively applied until thermal and voltage violations are alleviated or drop below the thresholds respectively [13,14]. Loss of load and generation is monitored and reported and probabilities of initiating events and consequences may be represented by visualization model. The rest of this paper is organized as follows. Section 2 introduces a new approach to identify the successive loss of system elements. Section 3 describes the operational algorithms that are applied to the proposed sequential outage checkers. Section 3 reports the simulation results of the proposed screening methodology applied to Korean power systems. Conclusions and discussion are given in Section 4.
2. A New Approach to Identify the Successive Loss of System Elements
In this section, we introduce the screening methodology for estimating the EENS and cascading probability analysis for identifying transmission system weakness.
2.1. Screening Methodology for Estimating the EENS
There is a possibility of a large blackout due to various changes in institutional and environmental systems. As a large blackout spreads rapidly from initial disturbances, it is necessary to develop and introduce a cascading outage model that can simulate the likelihood of sequential events and the detailed process thereof. As a result, the model development and decision criteria are needed to analyze the uncertainty of the future system as expected. In this paper, we propose a method to determine the possibility of cascading outages through the estimation of EENS.
The occurrence of natural disasters, such as typhoons and earthquakes, increase the probability of a cascading outage. It is necessary to monitor the sequence by generating cascading outages in a power system [15,16], and analyzing the load tripping amount due to the disturbance. The outage of a power transmission tower and electric power conduit pipe with many transmission lines is considered as severe scenarios in bulk power systems. Each potential candidate element from an initial disturbance is performed when considering transmission line outages and then a cascading outage is repeated. The simulation is repeated until there are no overloaded lines or transformers in the process of cascading outages. The sequence of the cascading model of the transmission line is as follows [17,18]. First, the probability of outage is calculated, according to the following equation.
where denotes the load factor of the corresponding line, and denotes the overload rate tripping criterion flowing on the line . As the tripping criterion is set at 150%, the value is 150. Equation (1) is calculated according to the overloading transmission lines in each cascading outage occurrence and the transmission line with a value of 1 or higher is eliminated.
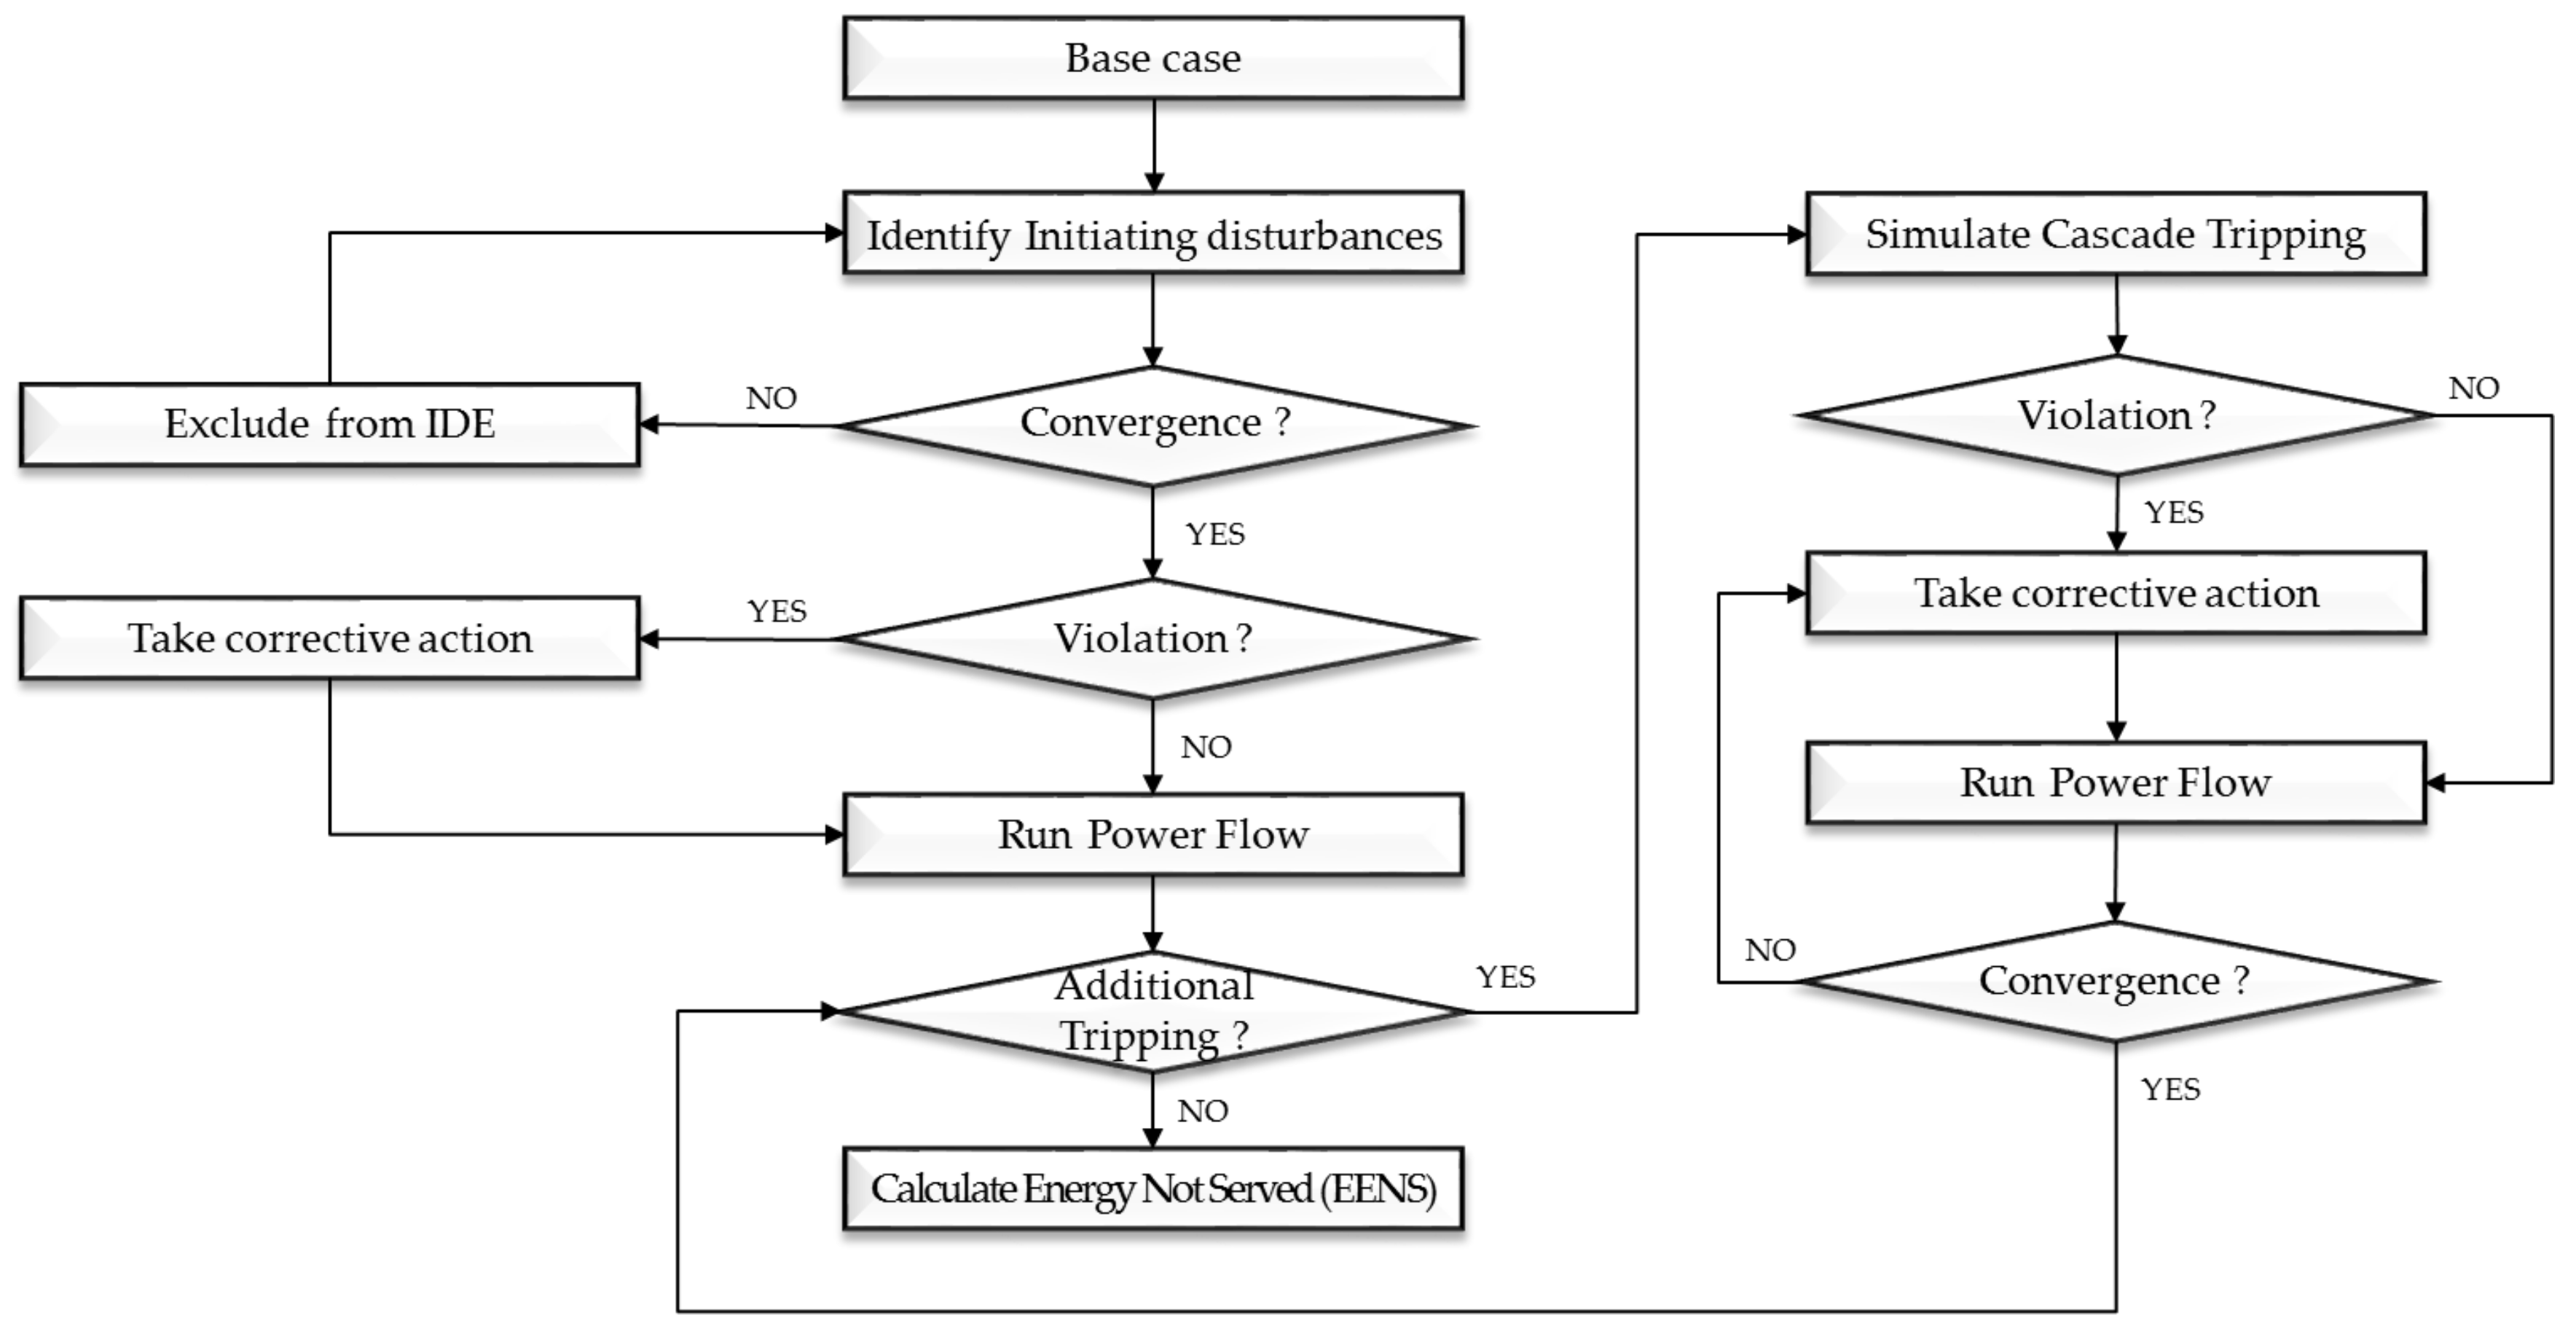
We propose the screening methodology for estimating the expected energy not served (EENS) of power systems [8,9,19], as shown in Figure 2. Firstly, the scenario setting for initial event selection should be preceded. All of the transmission lines and transformers in the system are simulated as N-1 contingency. As a result, facilities with an overload rate tripping criterion exceeding 1 are selected as initial disturbance events (IDE). According to the selected IDE, we check the convergence through the power flow analysis. As it does not converge after initial disturbance, the event is excluded from IDE and the other event is considered. In the convergence, we proceed to the following steps to continue the simulation. If the initial event has converged after simulating, then we check the violation. If there is a voltage problem, we shed off the load and install the fixed shunt reactors of the nearby area for eliminating the violation. Consequently, it is checked whether the generation range of the reference bus (slack bus) is exceeded, and corrective measures are taken by increasing or decreasing the output power of other generators, so that the power generator can be operated within the range.
If the system converges after all corrective actions are taken, we check whether the overload rate tripping criterion exceeds 1. If there are several facilities that are exceeding the overload rate tripping criterion, the one with the highest overload rate is removed and we repeat the process until no additional equipment exceeds the criterion. If the divergence cannot be resolved even after the corrective action is taken, then the simulation is judged to be divergent and the simulation is terminated. When the power generation amount of the system is smaller than the load amount or when the load shedding amount due to the corrective action exceeds a specific value, it is determined to be divergent and the operation is terminated. In addition, it there is no longer any overload facility and the amount of change as the EENS is calculated as compared to the load of the system that initiated the simulation as the screening simulation of cascading is terminated.
2.2. Cascading Probability Analysis for Identifying Transmission System Weaknesses
As a cascading outage can be a result of unexpected interactions or problems that are associated with various factors, it needs to be approached by a probabilistic model [20,21,22]. It is necessary to examine not only the possibility of blackout in a deterministic method, but also a method with a probabilistic approach and expressing it visually, which can help with evaluating the result.
In this paper, we apply the branching process [23,24,25,26] technique to simulate cascading outages for analyzing each step from the sequential process. The simulation group is divided into generation at each stage. The first generation is created due to the initial event and the generated event becomes the parent, causing the next child event.
If the number of events caused by the initial disturbance is and the number in the next step is , the propagation rate may be expressed as in initial accident. As a result, it can be expressed as Equation (2) [27,28]. Where is the number of outages in generation and means the number in generation. The following steps are necessary to stochastically approach to a cascade occurrence. Firstly, it is necessary to generate occurrence sequence data from sequential events through random occurrence failure. To some extent, it is necessary to divide events into generations based on the data. In the case, is the number of times that the event occurs in the next generation due to the event of facility i in generation m, denotes the number of effective children in facility i in generation m and denotes the set of events due to the previous event.
where is the number of times that the event occurs in the next generation due to the event of facility in generation m, denotes the number of effective children in facility in generation m, and denotes the set of events due to the previous event. Both Equations (3) and (4) may be written with the corresponding parameters.
When the value corresponding to each variable is calculated, then the propagation rate is expressed in Equation (5). Based on Equation (5), the process and probability of each event may be determined.
3. Case Studies on Korean Power Systems
In this section, we report the results of applying the proposed methodology described in details in Section 2 to practical power systems, Korean power systems.
3.1. Estimation of Expected Energy Not Served
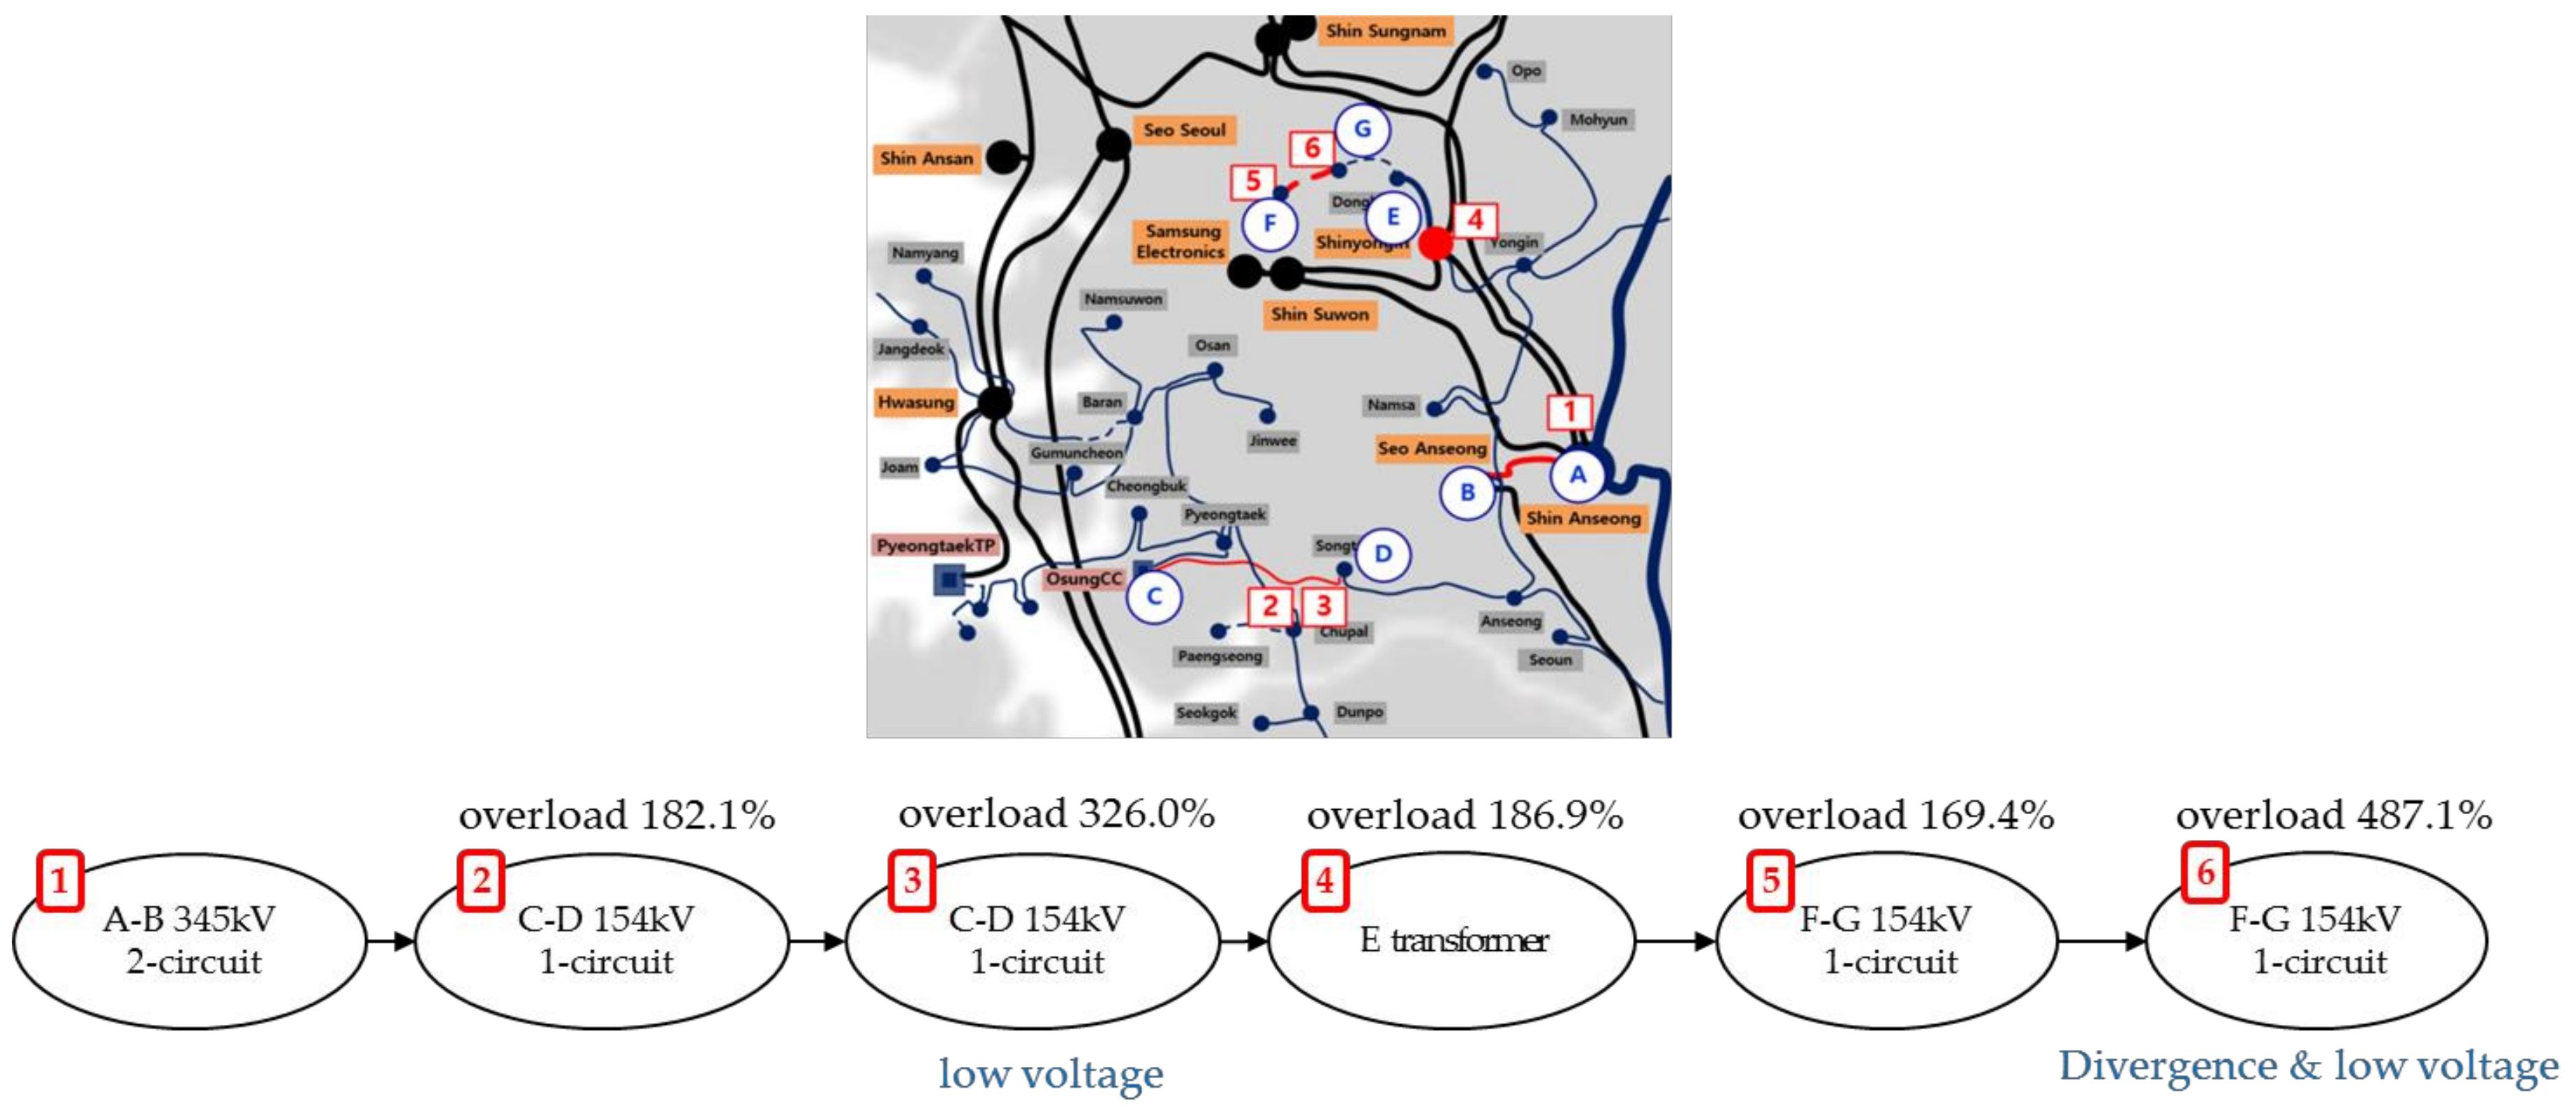
In this section, we estimate the EENS by simulating the potential outages in Korean power systems. South Korea’s peak demands for electricity in 2015 and 2020 are considered. We repeat all of the steps described in Section 2, while increasing the load level of the system and calculating the EENS for each system condition. When the estimated EENS is displayed according to the load level, there is a point where the EENS value increases dramatically, which becomes the critical load. In order to analyze this, the simulation of the cascading outages was carried out by gradually increasing the load of the system from 100% to phase. In the case where the load level is 120% in peak demand in 2015, the result of transmission line between buses A and B as the initial disturbance is shown in Figure 3. During the initial event, an overload of 182% occurred in the transmission line between buses C and D, and additional events continued by simulation steps. Based on the sequential steps, the resulting divergence and violation are stabilized by various adjustments, such as load shedding and fixed shunt reactors. The EENS amount that was calculated from the sequential steps is 1647.6 MW, which is the largest amount at the load level. The name of the buses is not clearly displayed for security reasons.
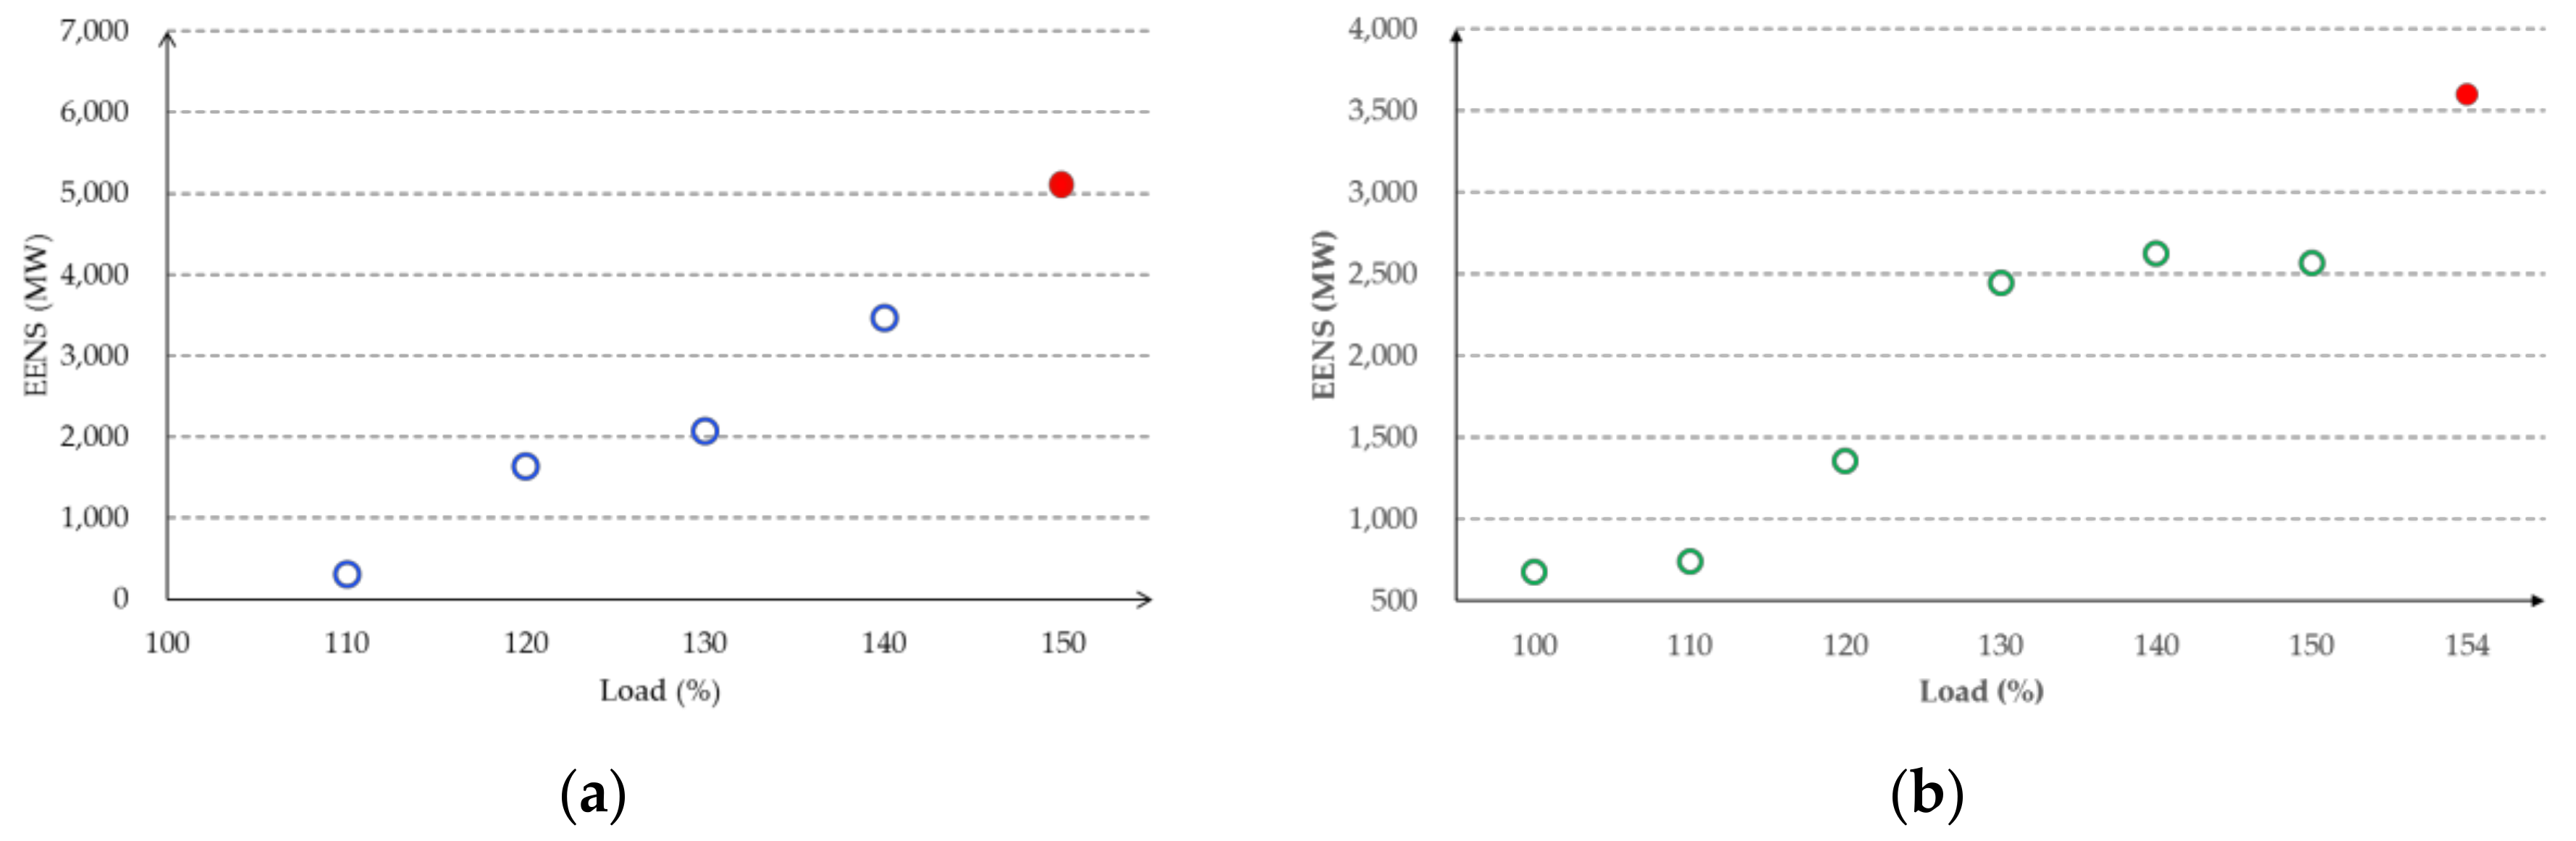
Figure 4 represents the estimated EENS using the proposed screening method. The critical load is indicated for each system. The critical load means the point at which the magnitude of the average power failure and the probability distribution increase sharply [8,29,30]. This is a reference point where cascading outage occurs and is the basis for assessing the risk of a blackout. For the Korean power system, the critical load points are indicated by 1.53% and 1.56% for peak demand conditions in 2015 and 2020, respectively. Simulation results can be considered for system planning to avoid the possibility of power outages and the phenomena that are transferred to a large-scale system can be identified. Further, if a margin of large-scale power outage is calculated and provided to system operators, more systematic operation and planning will be suggested.
The application of screening method for severe scenarios is performed to examine the possibility of major system outages. We assume 882 failures of practical power systems for 71 power transmission towers and 40 electric power conduit pipes in Korean power grids. Each facility outage would be set as an initial disturbance, and the sequential process should be recorded and analyzed for subsequent events. Cascading outages are consecutively applied until thermal and voltage violations are alleviated or drop below the thresholds, respectively. If no facilities, such as power transmission towers and electric power conduit pipes, can be removed after the initial event, the additional event to the line and transformer connected to the initial event substation is simulated. When a scenario setting is conducted, the estimated failure list is created by dividing the machined line in the steel tower into one line, two lines, and so on. We perform the cascading simulation using 882 possible cases in total, involving 71 transmission towers and 40 electric power conduit pipes for power transmissions. It assumes the collapse of a four-wire transmission tower or a fire situation on multi-wire electric power conduit pipe as the most critical outage scenario of outage that may occur in terms of a major outage. We estimate the stability of the system by assuming additional breakdowns for each event occurrence and calculate the scale of the power failure depending on scenario-specific sequential events by simulating large-scale outage scenarios.
The EENS estimated for each region can be summarized, as shown in Table 1. The name of the region is not clearly displayed for security reasons. In the outage of electric power conduit pipes, the result is blank in the area where the facility is not affected. Based on the results, if a failure occurs in this scenario, a large-scale blackout may occur that has not been experienced before. In case of region A, the EENS that occurs when a power transmission tower is somewhat small, but the EENS calculated from an electric power conduit pipes event is large. Therefore, it is necessary to establish countermeasures against the event in the area. Consequently, it is possible to analyze regional events by simulating cascading outages and estimating the EENS for each scenario. As a countermeasure against the problem, it is considered that the installation of special protection system (SPS) and the expansion of new power facilities should be considered.
We give the review of the blackout cases that are caused by cascading outages. Based on the estimated EENS, it is derived that the threshold of large-scale blackout in the Korean power system occurs at over 150%, which can help to determine the reliability of the power system. In order to analyze the damage that is caused by natural disasters that cause severe events, we simulate some scenarios, such as the collapse of a transmission line tower or fires in electric power conduit pipes, which can actually occur in the case of a large power outage scenario. The scenarios are simulated locally, calculating the scale of power outage for each region. It can be used to reinforce and enhance new facilities installation and systems in vulnerable areas. In addition, there is a plan to utilize real-time phasor measurement unit (PMU) data in order to prevent a cascading outage [31,32]. It can be used to prevent and mitigate the cascading outage through accurate and quick information acquisition from PMU data on the power system.
3.2. Visualization of Cascading for Probabilistic Analysis
To analyze the occurrence probability of cascading outages, we use the peak demand data in 2015. The underground transmission line track is considered to be one line, and the overhead transmission line is considered to be two lines. In the initial event for selecting a candidate transmission line, the transmission line with an overloading over 150% is selected for the N-1 contingency simulation. Additionally, the metropolitan area is reviewed first. Adjacent matrices are used to visualize the cascading outages, and to show that each event is propagated [33,34]. The adjacency matrix may be expressed by the following equation.
Based on Equation (6), if an event spread from to , it is set to 1; otherwise, it is 0. By analyzing the simulation results, it is possible to monitor the propagation path and the probability allowing for an adjacent matrix to be generated based on the result. We construct a visualization graph with adjacency matrices and to connect each outage by event occurrence, frequency of occurrence, and propagation rate.
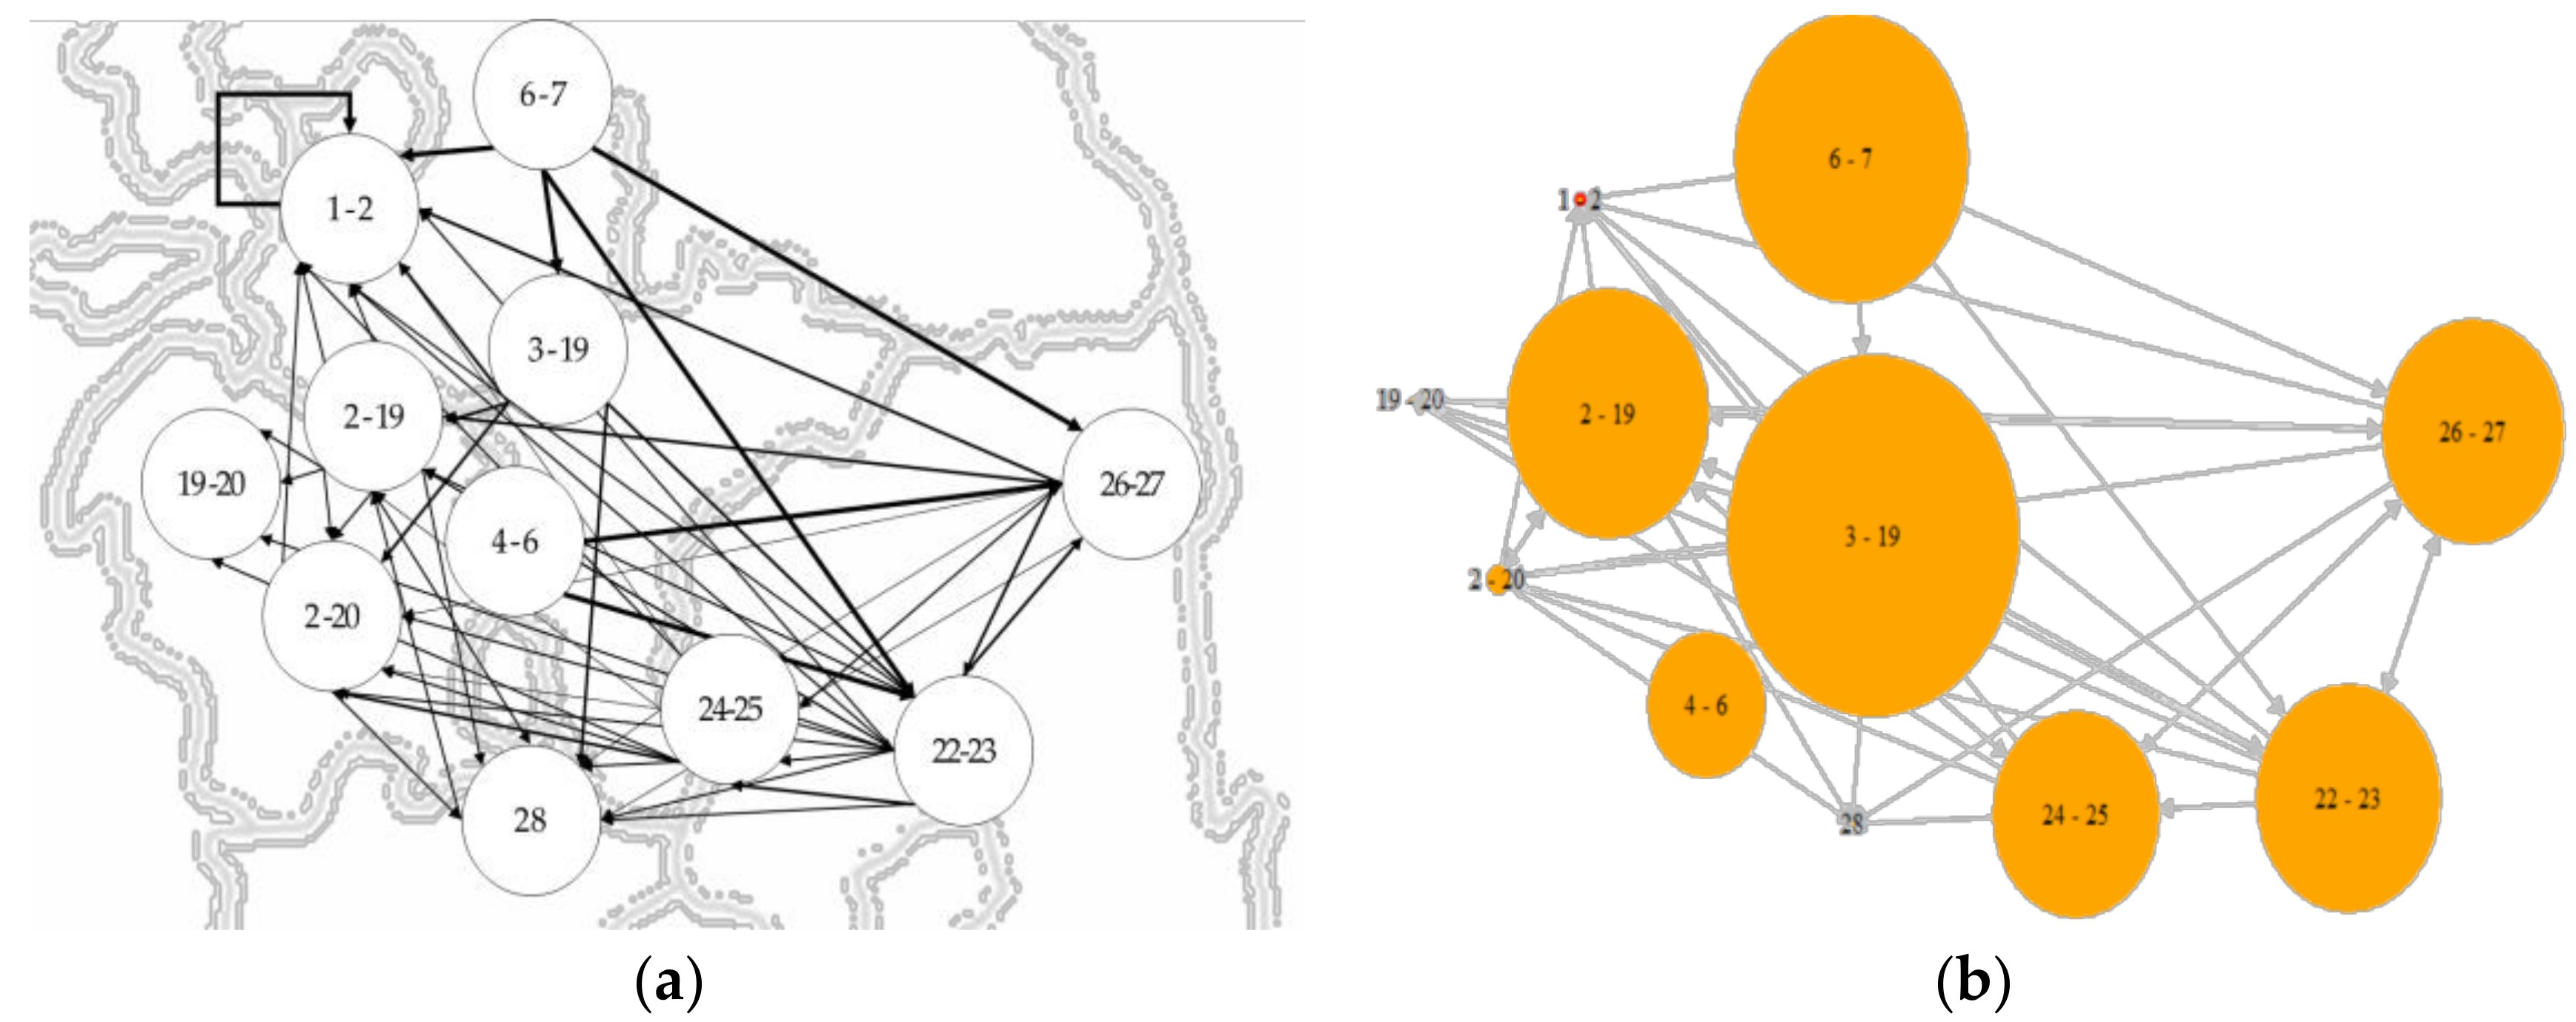
Figure 5 shows the simulation results of cascading outages in the metropolitan area at the peak demand condition in 2015. Figure 5a shows the path of the simulated event’s occurrence. From the results, the circle refers to the event that occurred, and the arrow direction refers to the process of the cascading outage. The sequential propagation step of cascading outages is expressed by the line thickness. In other words, the lower the cascading outage generation step, the larger the thickness of the line. Figure 5b is the visualization result of sequential cascading outages and shows the calculated probability. We use the cascading outage data and the number of occurrences that are derived from Figure 5a. Based on the number of occurrences, the propagation rate of the cascading outage was calculated and expressed as the size of the circle. Additionally, the transmission line connected to each circle indicates the number of events that occurred from the arrow’s beginning to the next event. In other words, the larger the circle size, the higher the probability of spreading to other lines, and the thicker the line, the more times that the event occurs. Based on these results, it is possible to recognize which route is most likely to spread to another line due to cascading outages occurring in the metropolitan area, and which route it will spread.
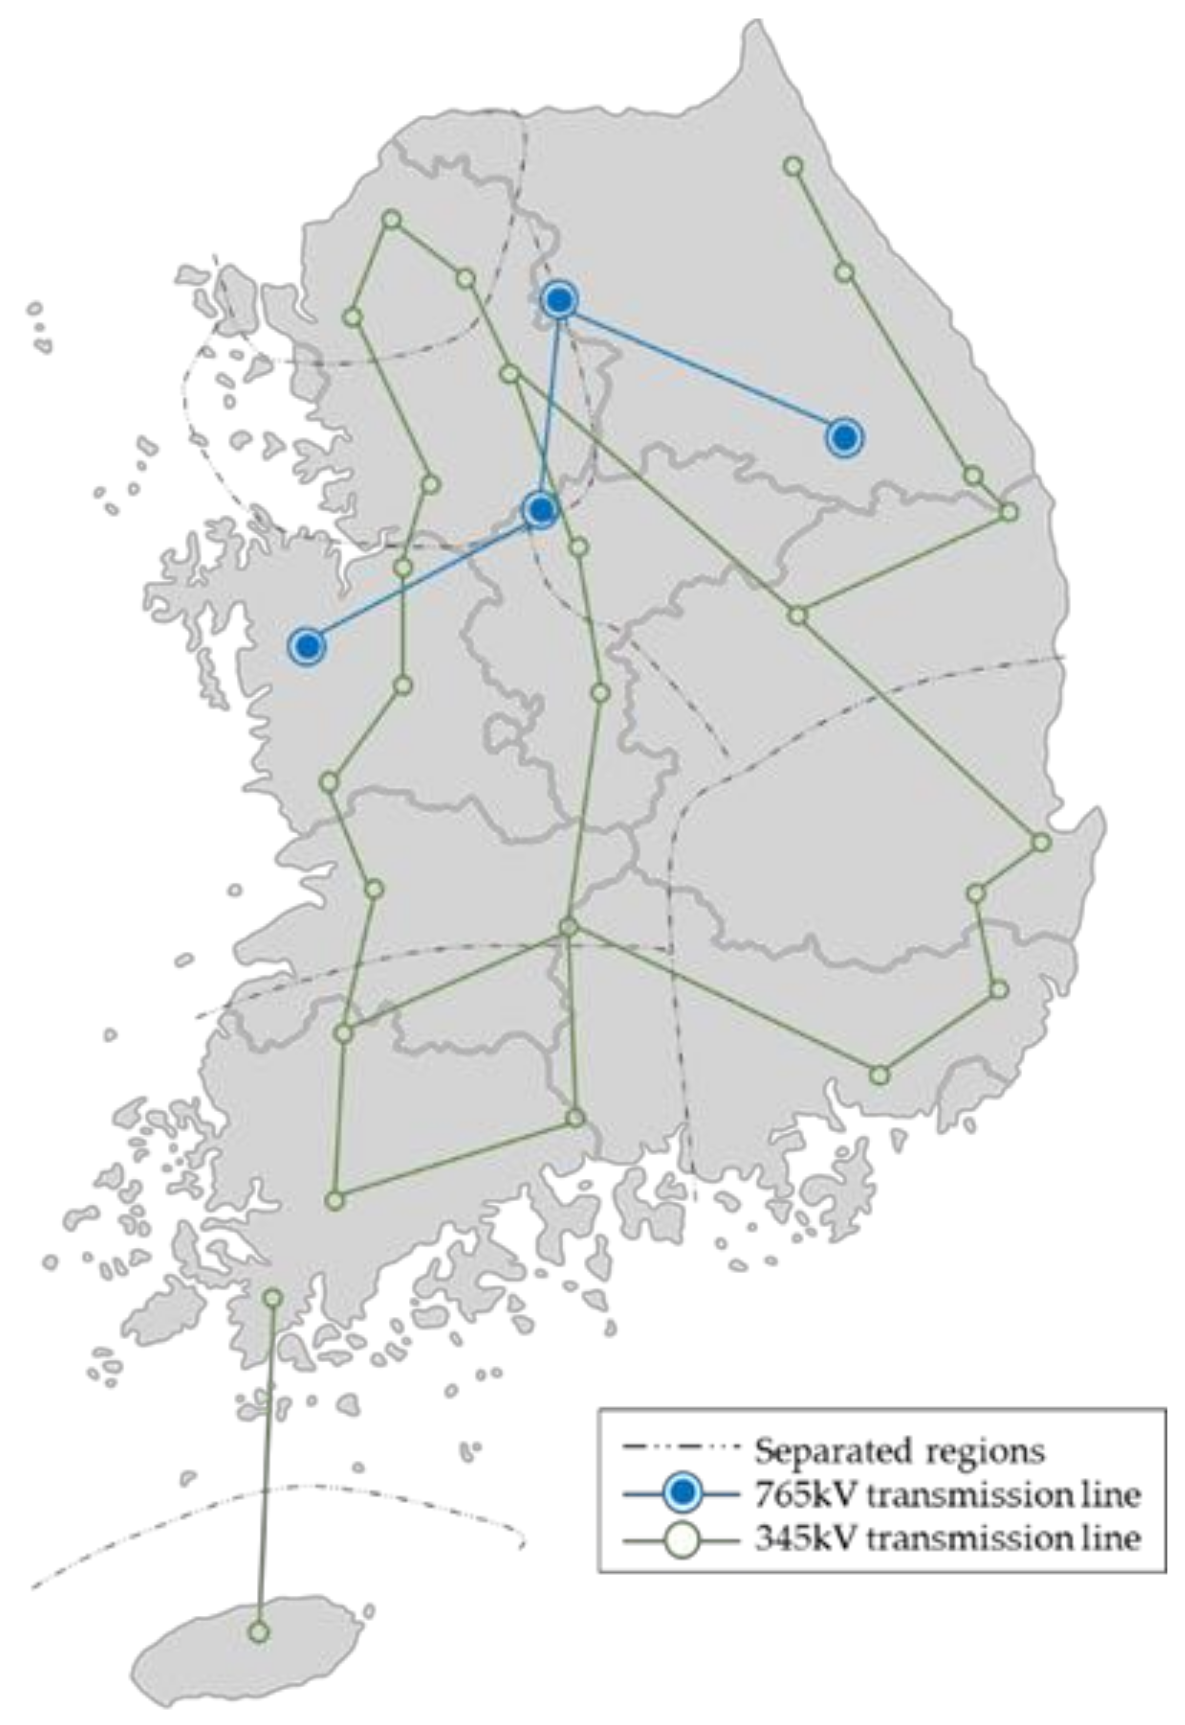
In South Korea, power transmission voltages are 154 kV and 345 kV on major grids and 765 kV facilities are operated. The power system on Jeju Island is connected to the mainland with High Voltage Direct Current transmission system (HVDC). During the restoration after a large blackout, the power system in South Korea is divided into seven regions to restore the system and synchronize it to each region. It is possible to apply the proposed screening method to the power system for the pre-defined regions if it is regarded as a regionally interconnected system, as shown in Figure 6. The proposed screening method will be applied to the interconnected system in Future.
4. Discussion and Conclusions
Cascading outage is a sequence of dependent failures of individual components that successively weaken the power system. In this paper, we propose the screening methodology that is based on sequential contingency simulations is used to identify potential cascading events. Cascading outages are consecutively applied until thermal and voltage violations are alleviated or drop below the thresholds, respectively. Loss of load and generation is monitored and reported, and the probabilities of initiating events and consequences may be represented by the visualization model.
The proposed screening methodology will play a key role in identifying the uncontrolled successive loss of system elements triggered by an incident at any location. Cascading results in widespread electric service interruption that cannot be restrained from sequentially spreading beyond an area predetermined by studies. In addition, the visualization model can identify potential future transmission system weaknesses and limiting facilities. The screening methodology implemented by Korean power systems is presented.
In future, the transient progression including voltage instability, frequency instability, and small signal instability will be added to the screening methodology and the application to practical power systems will be discussed.
Acknowledgments
This research was supported by Basic Science Research Program through the National Research Foundation of Korea (NRF) funded by the Ministry of Science, ICT & Future Planning (NRF-2015R1C1A1A02037716).
Author Contributions
Jin Hur conceived and designed the overall research; Bokyung Goo developed the sequential contingency analysis and conducted the experimental simulation; Jin Hur and Bokyung Goo wrote the paper; and Jin Hur guided the research direction and supervised the entire research process.
Conflicts of Interest
The authors declare no conflict of interest.
References
- Central Electricity Regulatory Commission (CERC). Report on the Grid Disturbance on 30 July 2012 and Grid Disturbance on 31 July 2012; Central Electricity Regulatory Commission: New Delhi, India, 2012. [Google Scholar]
- European Network of Transmission System Operators for Electricity (ENTSO-E) Project Group Turkey. Report on Blackout in Turkey on 31 March 2015; European Network of Transmission System Operators for Electricity: Brussels, Belgium, 2015. [Google Scholar]
- Vandenberghe, F.; Grebe, E.; Klaar, D.; Kleinekorte, K.; Rodriguez, J.M.; Erven, H.; Tassan, L. FINAL REPORT of the Investigation Committee on the 28 September 2003 Blackout in Italy; Union for the Coordination of the Transmission of Electricity (UCTE): Brussels, Belgium, 2004. [Google Scholar]
- Kosterev, D.N.; Taylor, C.W.; Mittelstadt, W.A. Model validation for the August 10, 1996 WSCC system outage. IEEE Trans. Power Syst. 1999, 14, 967–979. [Google Scholar] [CrossRef]
- Federal Energy Regulatory Commission; North American Electric Reliability Corporation. Arizona-Southern California Outages on September 8, 2011; Causes and Recommendations; FERC: Washington, DC, USA; NERC: Atlanta, GA, USA, 2012.
- Allen, E.; Cummings, R.W. Pacific southwest disturbance of September 8, 2011. In Proceedings of the IEEE PES General Meeting, Vancouver, BC, Canada, 24 July 2013. [Google Scholar]
- Senroy, N.; Heydt, G.T. A conceptual framework for the controlled islanding of interconnected power systems. IEEE Trans. Power Syst. 2006, 21, 1005–1006. [Google Scholar] [CrossRef]
- Nedic, D.P.; Dobson, I.; Kirschen, D.S.; Carreras, B.A.; Lynch, V.E. Criticality in a cascading failure blackout model. Int. J. Electr. Power Energy Syst. 2006, 28, 627–633. [Google Scholar] [CrossRef]
- Lindley, D.V.; Singpurwalla, N.D. On exchangeable, causal and cascading failures. Stat. Sci. 2002, 17, 209–219. [Google Scholar] [CrossRef]
- Panteli, M.; Mancarella, P. Modeling and evaluating the resilience of critical electrical power infrastructure to extreme weather events. IEEE Syst. J. 2015, 11, 1733–1742. [Google Scholar] [CrossRef]
- Kezunovic, M.; Dobson, I.; Dong, Y. Impact of extreme weather on power system blackouts and forced outages: New challenges. In Proceedings of the 7th Balkan Power Conference, Šibenik, Croatia, 10–12 September 2008; pp. 1–5. [Google Scholar]
- Campbell, R.J. Weather-Related Power Outages and Electric System Resiliency; Congressional Research Service, Library of Congress: Washington, DC, USA, 2012. [Google Scholar]
- Dizdarevic, N.; Majstrovic, M.; Coko, S.C.; Mandic, N.; Bonovic, J. Causes, analyses and countermeasures with respect to blackout in Croatia on January 12, 2003. In Proceedings of the CRIS International Workshop on Power System Blackouts-Causes, Analyses, and Countermeasures, Lund, Sweden, 3–5 May 2004. [Google Scholar]
- Newman, D.E.; Carreras, B.A.; Lynch, V.E.; Dobson, I. Exploring complex systems aspects of blackout risk and mitigation. IEEE Trans. Reliab. 2011, 60, 134–143. [Google Scholar] [CrossRef]
- Mousavi, O.A.; Bizumic, L.; Cherkaoui, R. Assessment of HVDC grid segmentation for reducing the risk of cascading outages and blackouts. In Proceedings of the 2013 IREP Symposium, Bulk Power System Dynamics and Control—IX Optimization, Security and Control of the Emerging Power Grid (IREP), Rethymno, Greece, 25–30 August 2013; pp. 1–10. [Google Scholar]
- Bernstein, A.; Bienstock, D.; Hay, D.; Uzunoglu, M.; Zussman, G. Power grid vulnerability to geographically correlated failures—Analysis and control implications. In Proceedings of the IEEE INFOCOM, Toronto, ON, Canada, 27 April–2 May 2014; pp. 2634–2642. [Google Scholar]
- Bienstock, D. Electrical Transmission System Cascades and Vulnerability: An Operations Research Viewpoint; Society for Industrial and Applied Mathematics: Philadelphia, PA, USA, 2015. [Google Scholar]
- Eppstein, M.J.; Hines, P.D.H. A Random Chemistry algorithm for identifying collections of multiple contingencies that initiate cascading failure. IEEE Trans. Power Syst. 2012, 27, 1698–1705. [Google Scholar] [CrossRef]
- Dobson, I.; Carreras, B.A.; Newman, D.E. A loading-dependent model of probabilistic cascading failure. Probab. Eng. Inf. Sci. 2005, 19, 15–32. [Google Scholar] [CrossRef]
- Dobson, I.; Carreras, B.A.; Newman, D.E. A probabilistic loading-dependent model of cascading failure and possible implications for blackouts. In Proceedings of the 36th Annual Hawaii International Conference on System Sciences, Big Island, HI, USA, 6–9 January 2003; IEEE: Piscataway, NJ, USA, 2003. [Google Scholar]
- Mei, S.; He, F.; Zhang, X.; Wu, S.; Wang, G. An improved OPA model and blackout risk assessment. IEEE Trans. Power Syst. 2009, 24, 814–823. [Google Scholar]
- Liu, H.; Chen, W.; Kokkolaras, M.; Papalambros, P.Y.; Kim, H.M. Probabilistic analytical target cascading: A moment matching formulation for multilevel optimization under uncertainty. J. Mech. Des. 2006, 128, 991–1000. [Google Scholar] [CrossRef]
- Dobson, I. Estimating the propagation and extent of cascading line outages from utility data with a branching process. IEEE Trans. Power Syst. 2012, 27, 2146–2155. [Google Scholar] [CrossRef]
- Kim, J.; Dobson, I. Approximating a loading-dependent cascading failure model with a branching process. IEEE Trans. Reliab. 2010, 59, 691–699. [Google Scholar] [CrossRef]
- Ren, H.; Dobson, I. Using transmission line outage data to estimate cascading failure propagation in an electric power system. IEEE Trans. Circuits Syst. II Express Briefs 2008, 55, 927–931. [Google Scholar] [CrossRef]
- Athreya, K.B.; Ney, P.E. Branching Processes; Courier Corporation: North Chelmsford, MA, USA, 2004. [Google Scholar]
- Hines, P.D.; Dobson, I.; Rezaei, P. Cascading power outages propagate locally in an influence graph that is not the actual grid topology. IEEE Trans. Power Syst. 2017, 32, 958–967. [Google Scholar] [CrossRef]
- Hines, P.D.; Dobson, I.; Cotilla-Sanchez, E.; Eppstein, M. “Dual Graph” and “Random Chemistry” Methods for Cascading Failure Analysis. In Proceedings of the IEEE 46th Hawaii International Conference on System Sciences (HICSS), Wailea, Maui, HI, USA, 7–10 January 2013; pp. 2141–2150. [Google Scholar]
- Carreras, B.A.; Lynch, V.E.; Dobson, I.; Newman, D.E. Critical points and transitions in an electric power transmission model for cascading failure blackouts. Chaos Interdiscip. J. Nonlinear Sci. 2002, 12, 985–994. [Google Scholar] [CrossRef] [PubMed]
- Chen, Q.; Mili, L. Composite power system vulnerability evaluation to cascading failures using importance sampling and antithetic variates. IEEE Trans. Power Syst. 2013, 28, 2321–2330. [Google Scholar] [CrossRef]
- Nabavi, S. Measurement-Based Methods for Model Reduction, Identification, and Distributed Optimization of Power Systems; North Carolina State University: Raleigh, NC, USA, 2015. [Google Scholar]
- Sun, K. Prevention and Mitigation of Cascading Outages in Power Grids Using Synchrophasor-Based Wide-Area Measurements; EPRI, Stanford University: Stanford, CA, USA, 2012. [Google Scholar]
- Rezaei, P.; Eppstein, M.J.; Hines, P.D. Rapid Assessment, Visualization, and Mitigation of Cascading Failure Risk in Power Systems. In Proceedings of the 2015 48th Hawaii International Conference on System Sciences (HICSS), Kauai, HI, USA, 5–8 January 2015; pp. 2748–2758. [Google Scholar]
- Lee, S.T. Probabilistic online risk assessment of non-cascading and cascading transmission outage contingencies. Int. Trans. Electr. Energy Syst. 2008, 18, 835–853. [Google Scholar] [CrossRef]
Figure 1.
Sequential process of a large blackout.

Figure 2.
Sequence of the screening methodology for estimating Expected Energy Not Served (EENS).

Figure 3.
Cascading progression at loading level 120%.

Figure 4.
Simulation results of EENS calculation based on load level: (a) 2015; (b) 2020.

Figure 5.
Visualization of a cascading sequence simulation: (a) Cascading sequence path; (b) Cascading probability visualization.
Figure 5.
Visualization of a cascading sequence simulation: (a) Cascading sequence path; (b) Cascading probability visualization.

Figure 6.
Power grids including seven regions in South Korea.


Table 1.
Simulation Result of the Expected Energy Not Served (EENS) for severe scenarios.
| Region | EENS (MW) | |
|---|---|---|
| Outages in Transmission Towers | Outages in Electric Power Conduit Pipes | |
| A | 724.5 | 1123.9 |
| B | 976.7 | 976.7 |
| C | 976.7 | 1502.2 |
| D | 787.9 | - |
| E | 44.6 | - |
| F | 43.2 | - |
| G | 589.1 | - |
| H | 979.5 | 876.4 |
| I | 1856.2 | - |
© 2017 by the authors. Licensee MDPI, Basel, Switzerland. This article is an open access article distributed under the terms and conditions of the Creative Commons Attribution (CC BY) license (http://creativecommons.org/licenses/by/4.0/).
Share and Cite
MDPI and ACS Style
Goo, B.; Hur, J. Estimation for Expected Energy Not Served of Power Systems Using the Screening Methodology of Cascading Outages in South Korea. Energies 2018, 11, 81. https://doi.org/10.3390/en11010081
AMA Style
Goo B, Hur J. Estimation for Expected Energy Not Served of Power Systems Using the Screening Methodology of Cascading Outages in South Korea. Energies. 2018; 11(1):81. https://doi.org/10.3390/en11010081
Chicago/Turabian StyleGoo, Bokyung, and Jin Hur. 2018. "Estimation for Expected Energy Not Served of Power Systems Using the Screening Methodology of Cascading Outages in South Korea" Energies 11, no. 1: 81. https://doi.org/10.3390/en11010081
Note that from the first issue of 2016, this journal uses article numbers instead of page numbers. See further details here.