Simulation of the Oxygen Reduction Reaction (ORR) Inside the Cathode Catalyst Layer (CCL) of Proton Exchange Membrane Fuel Cells Using the Kinetic Monte Carlo Method

Abstract
:1. Introduction
2. Modeling and Theoretical Analysis
2.1. Model of the CCL
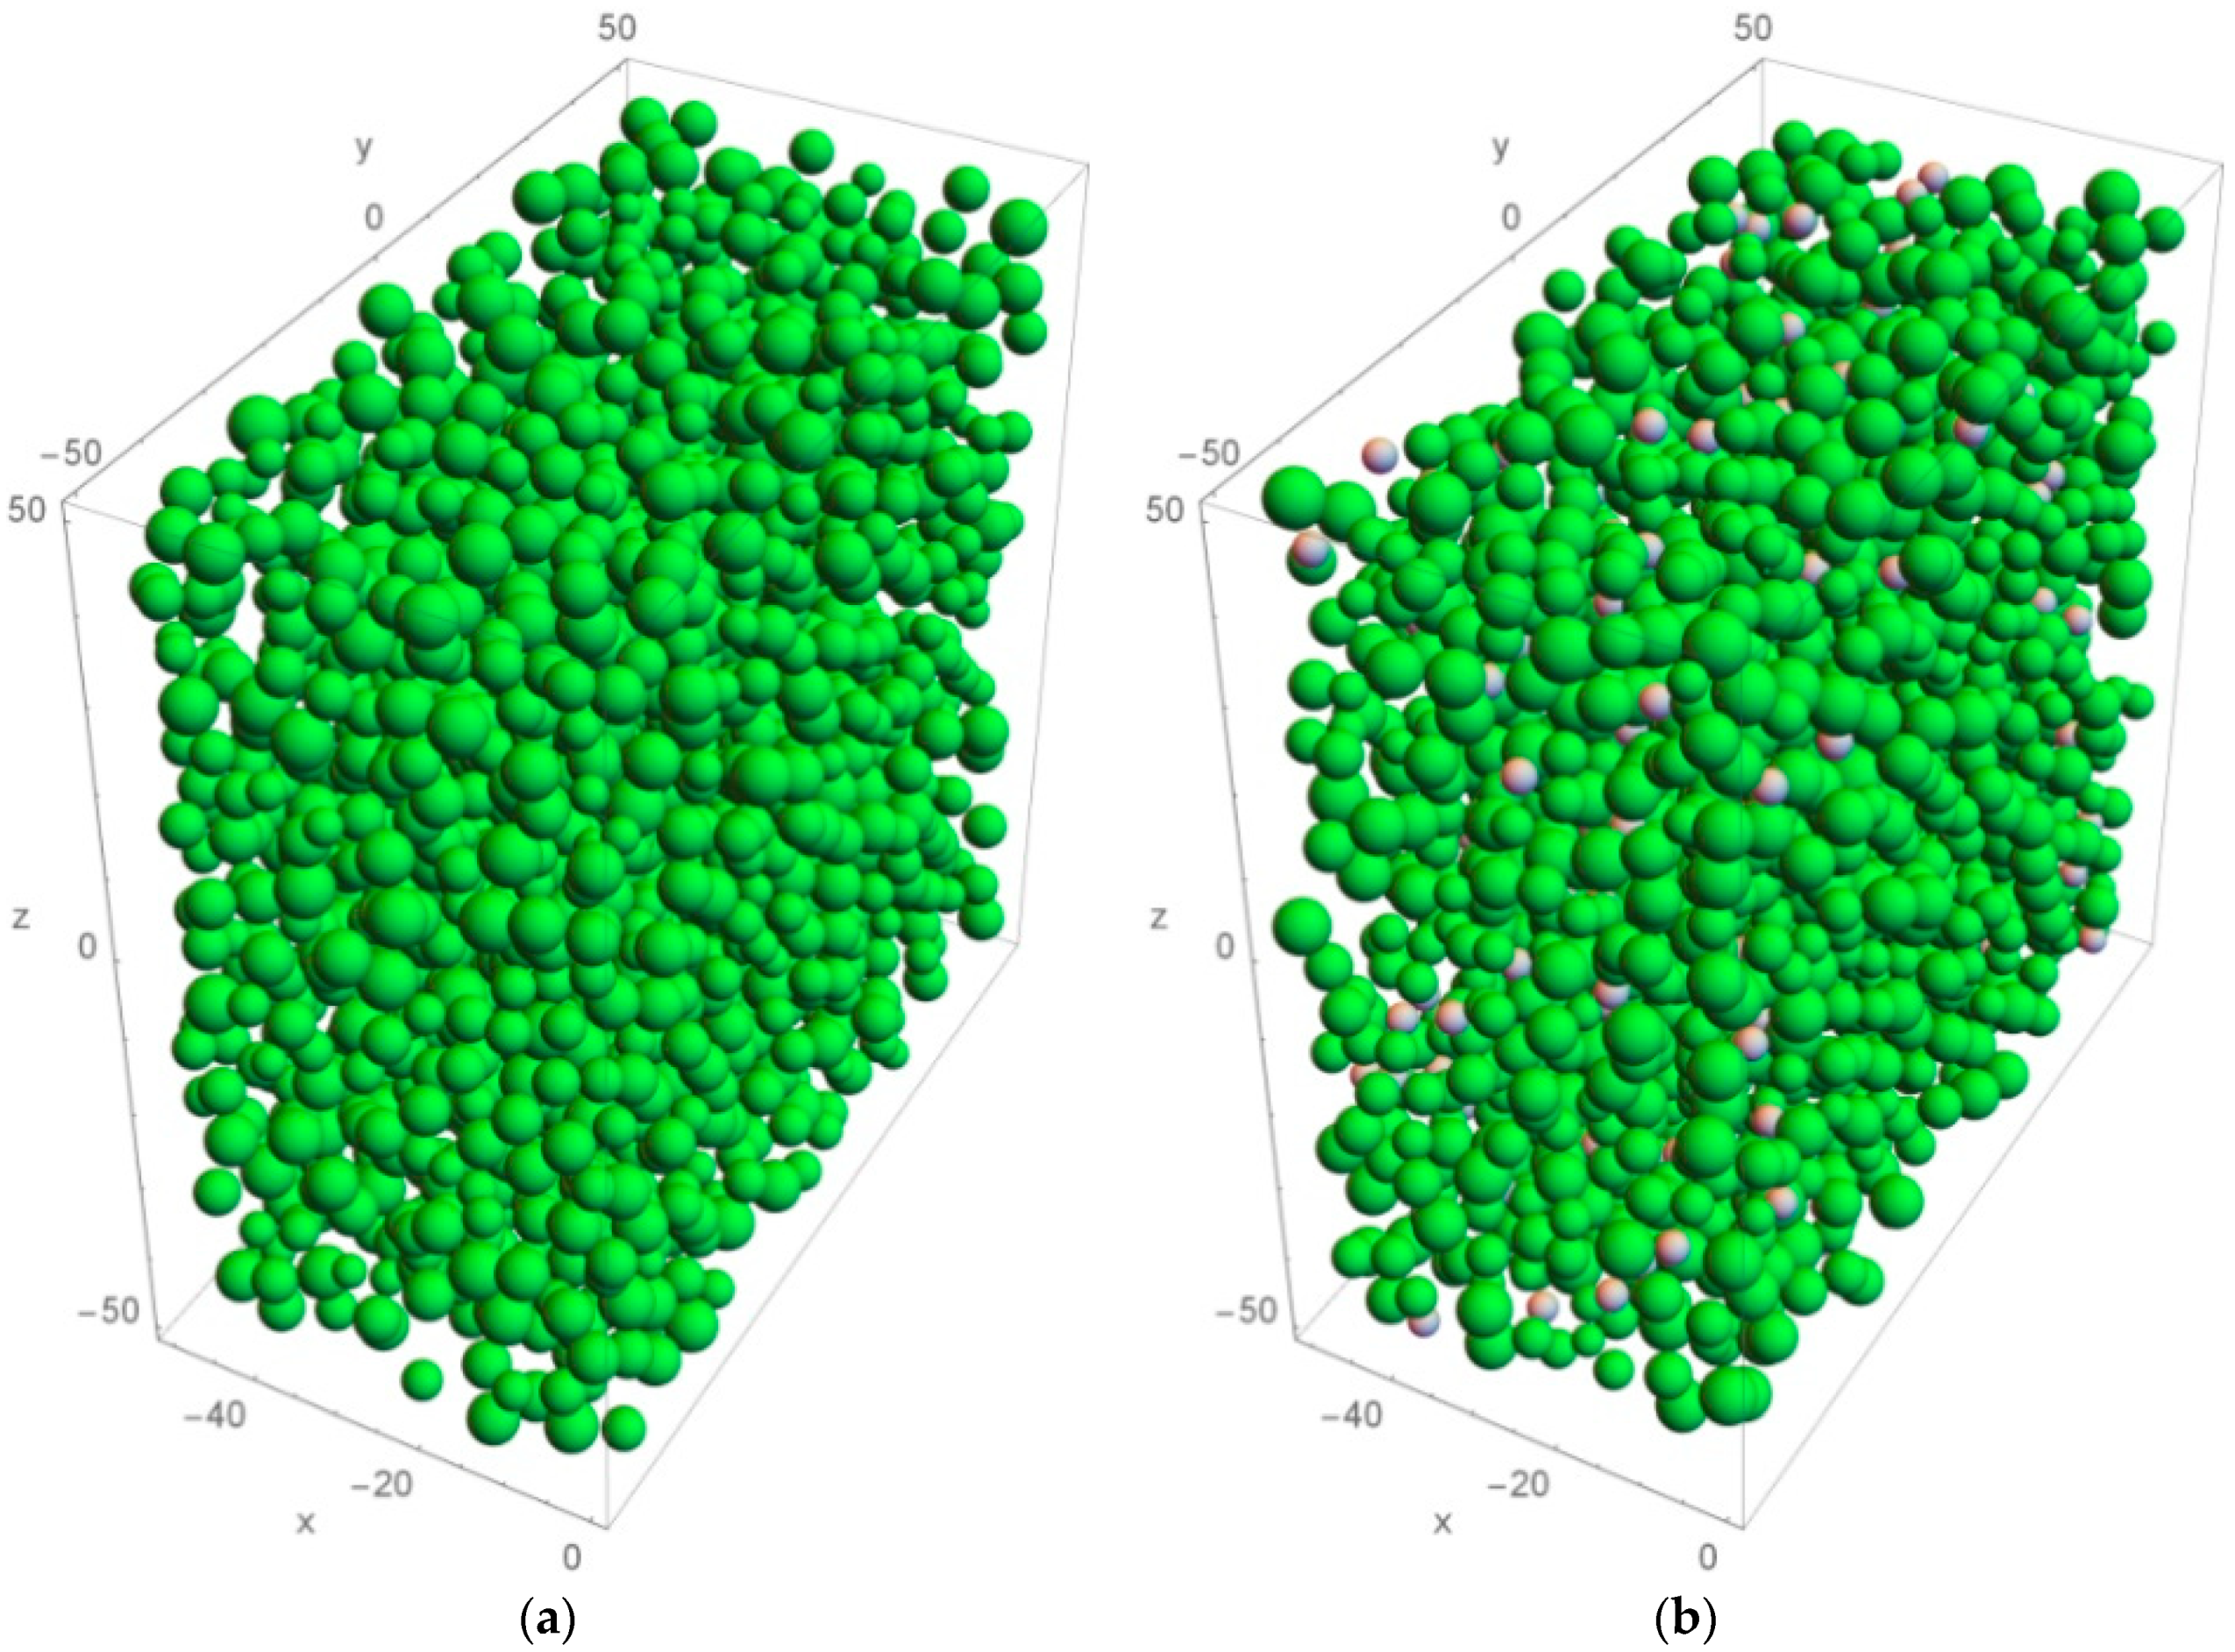
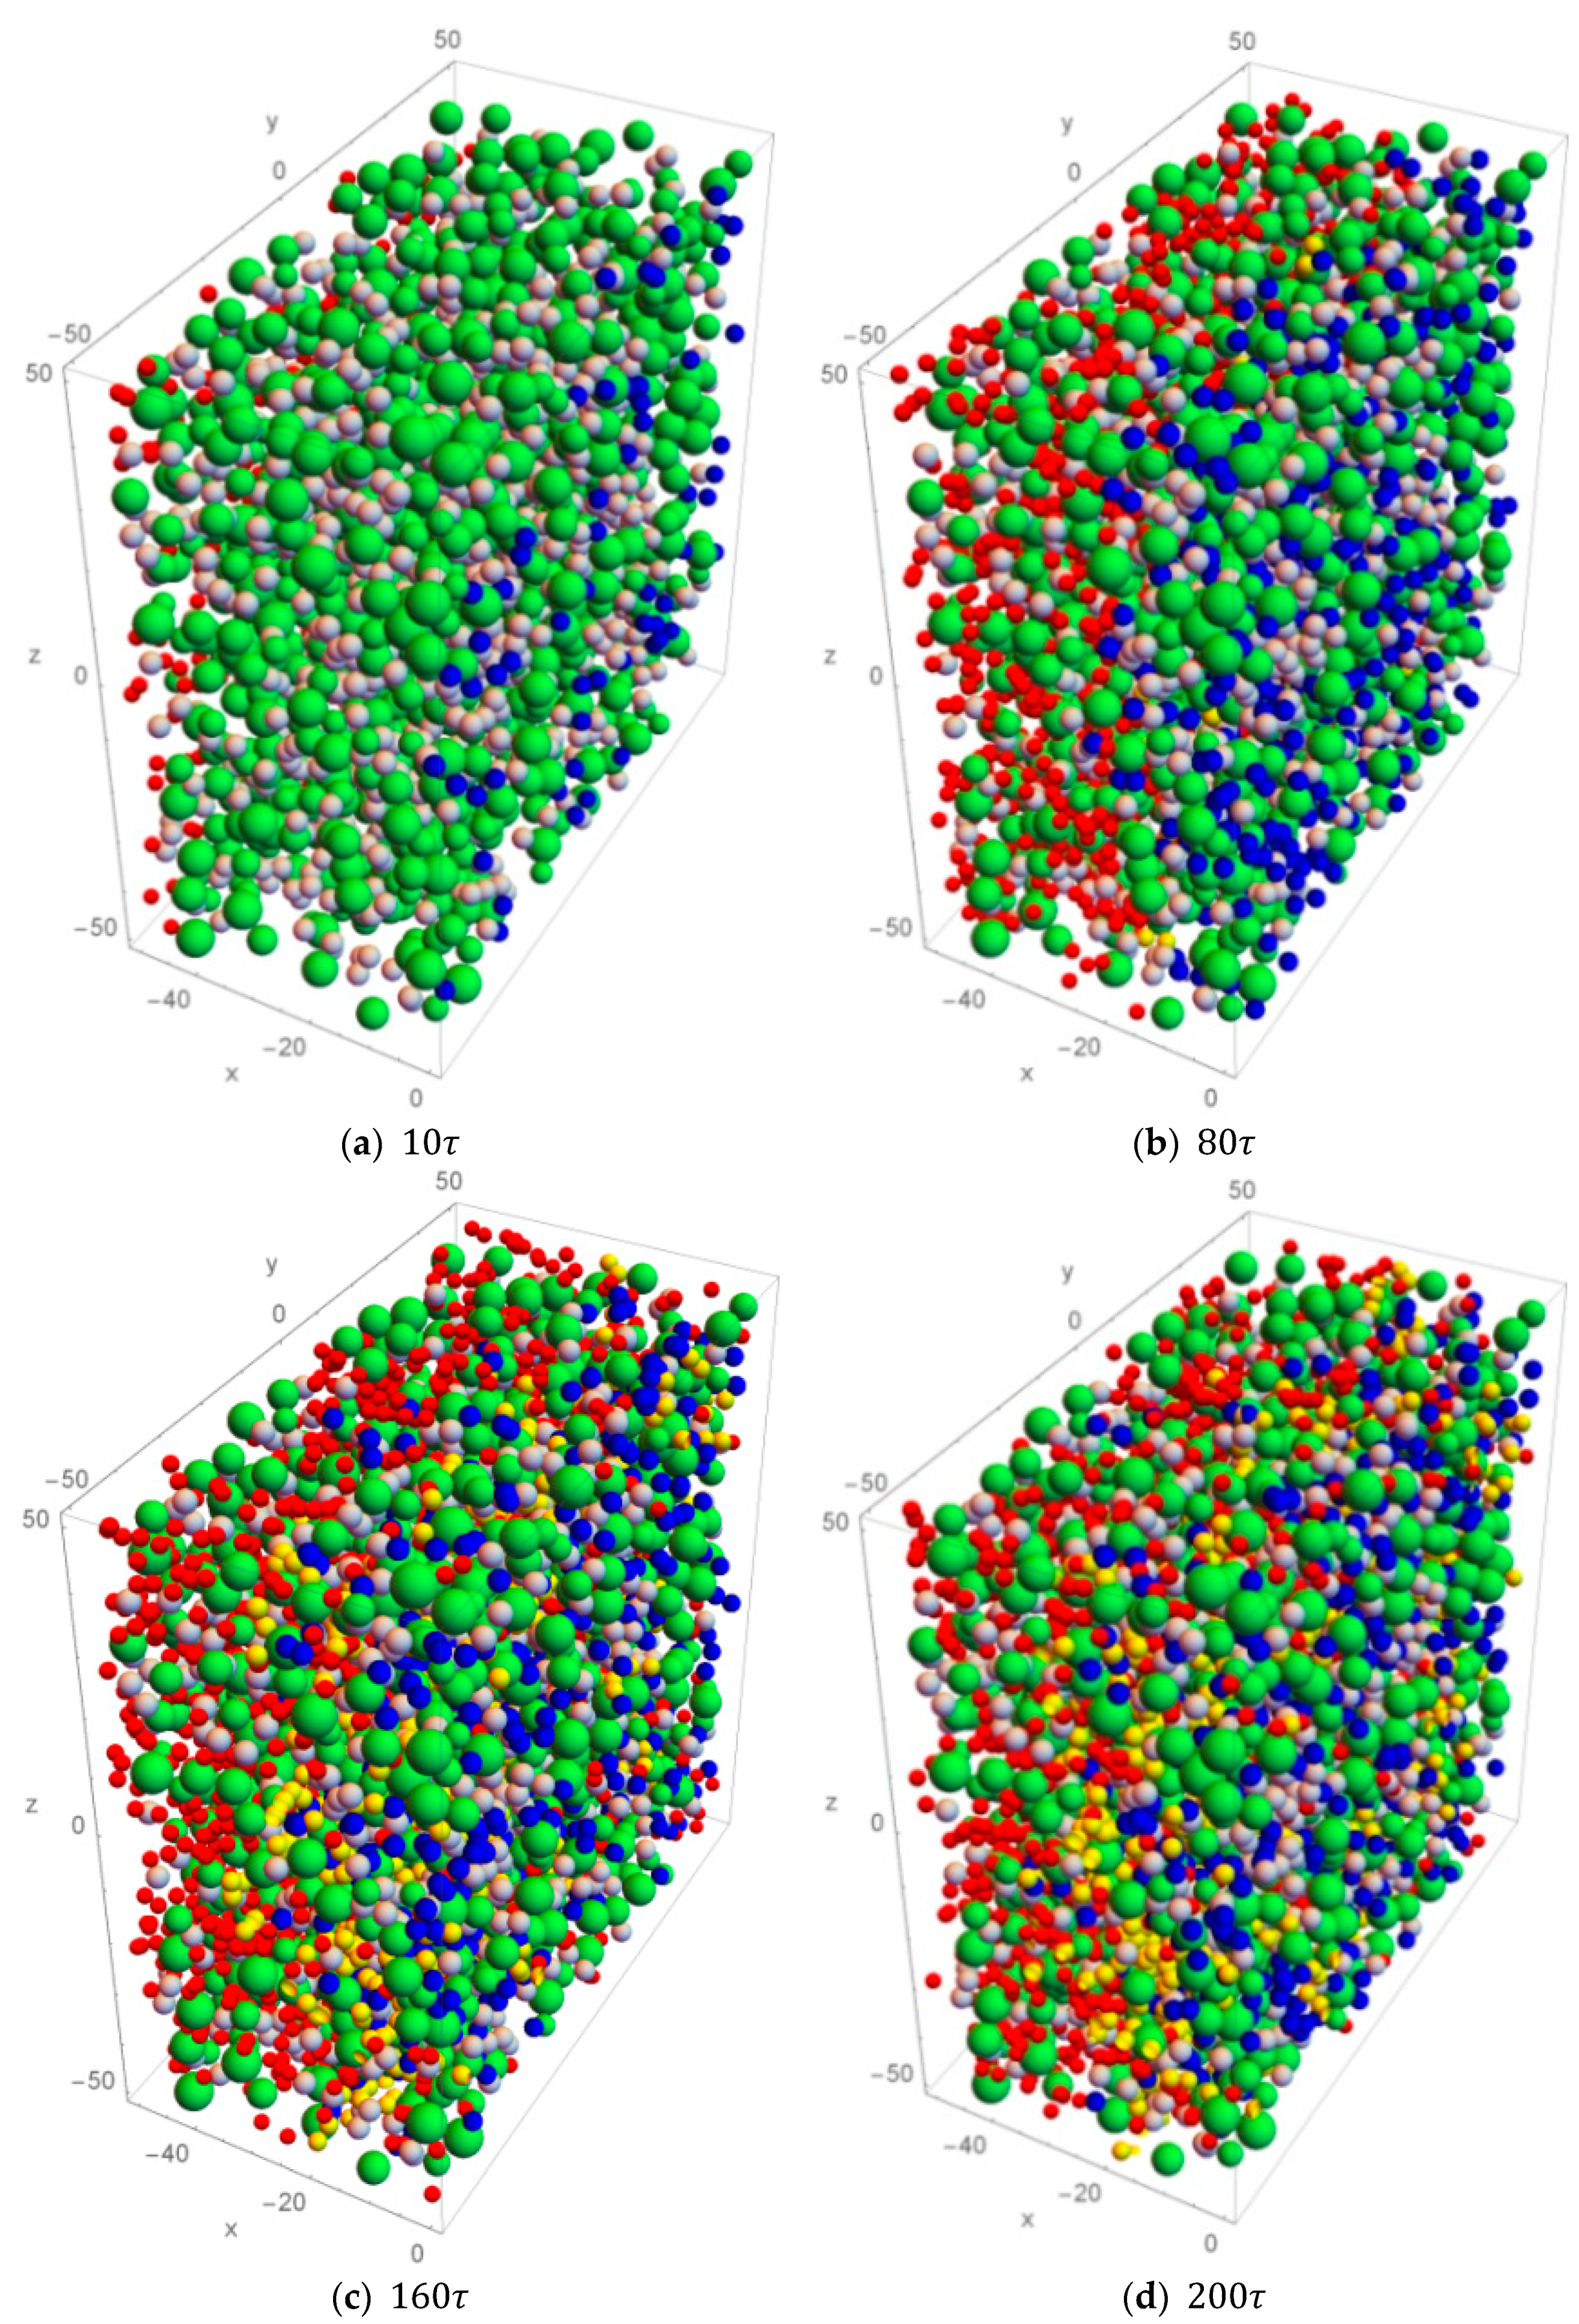
- A rectangular container, shown in Figure 2, is created and used in this paper. The thickness, height, and width of the container are 50 Å, 100 Å, and 100 Å, respectively. Therefore, the total number of spheres can be reduced to 2000.
- If Pt spheres are coated on the surface of a carbon sphere, then this carbon sphere surface is marked as green.
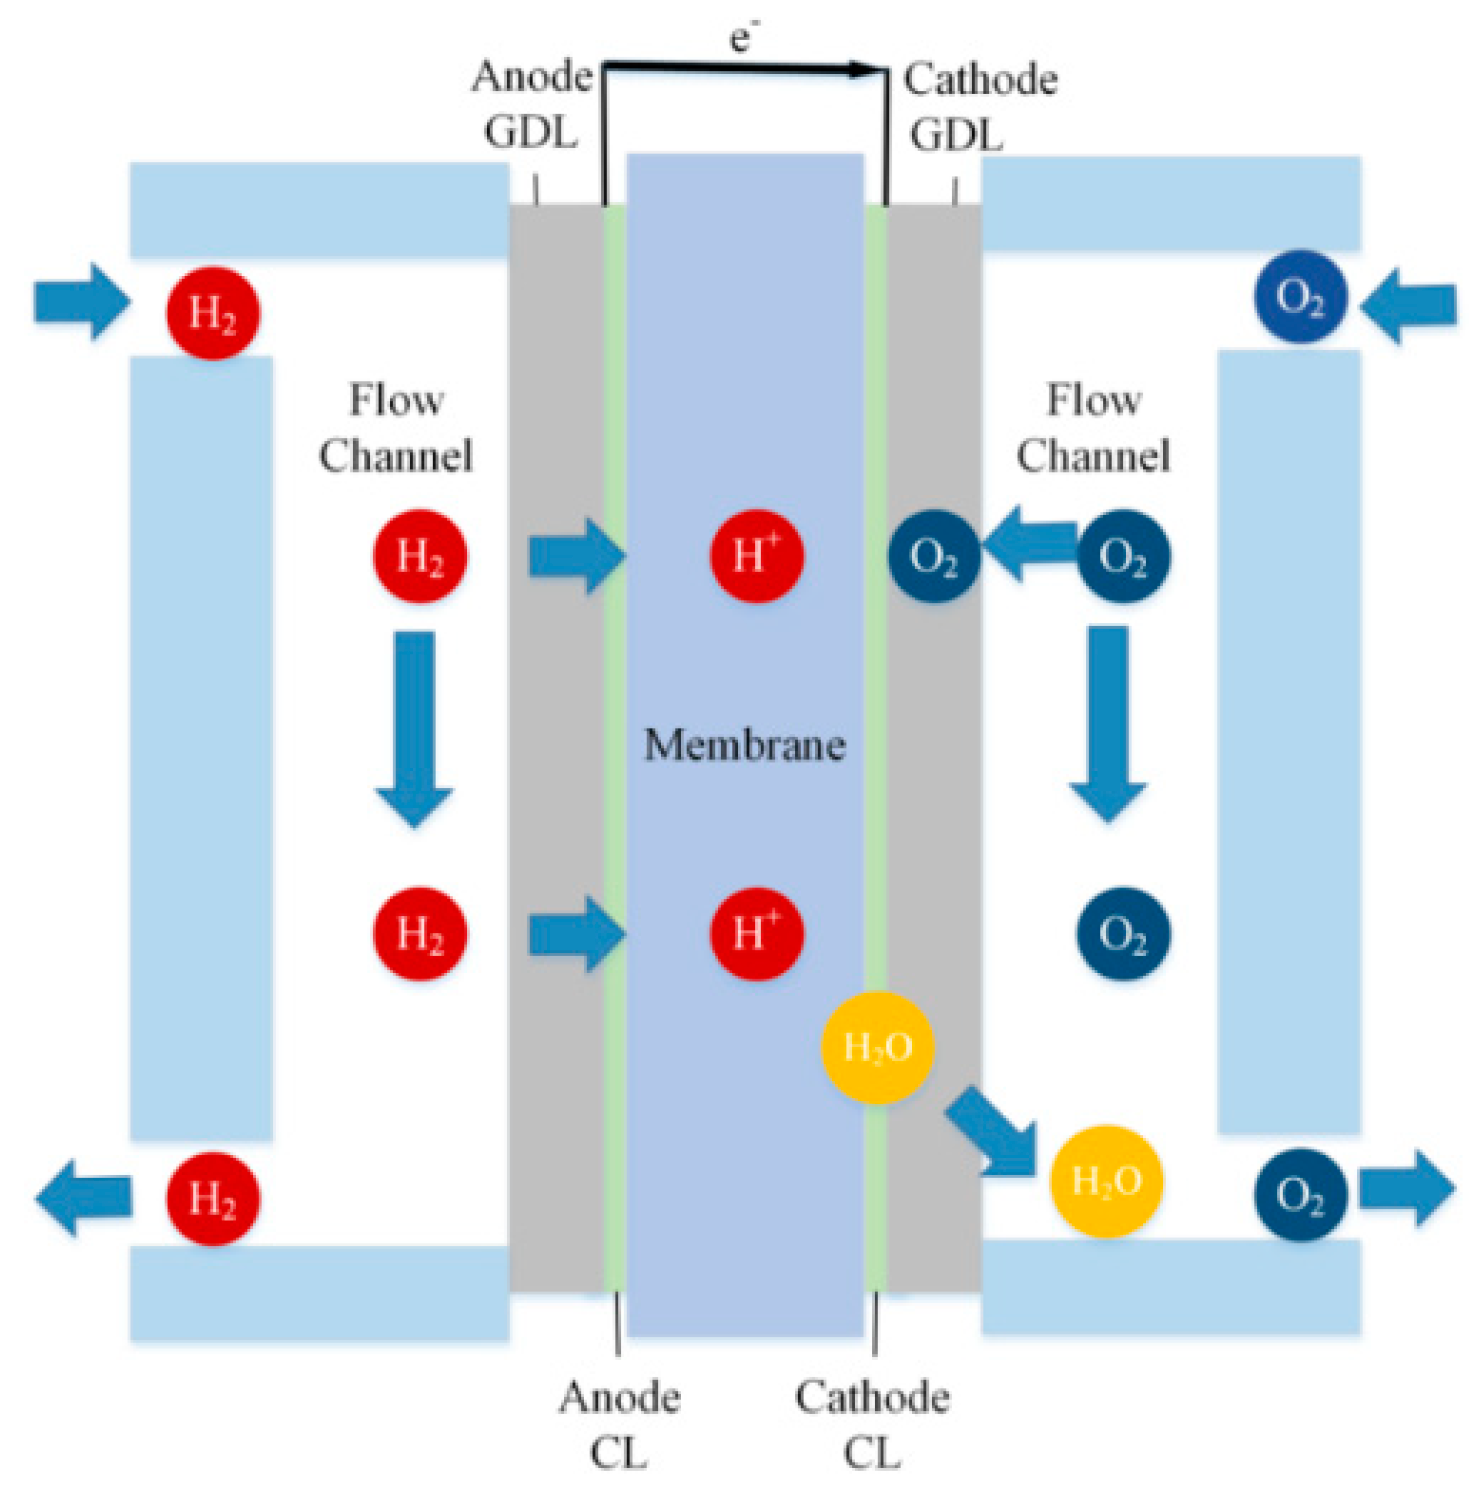
- Since only the process of the oxygen reduction reaction is investigated here, dry-air is applied to the PEM fuel cell model.
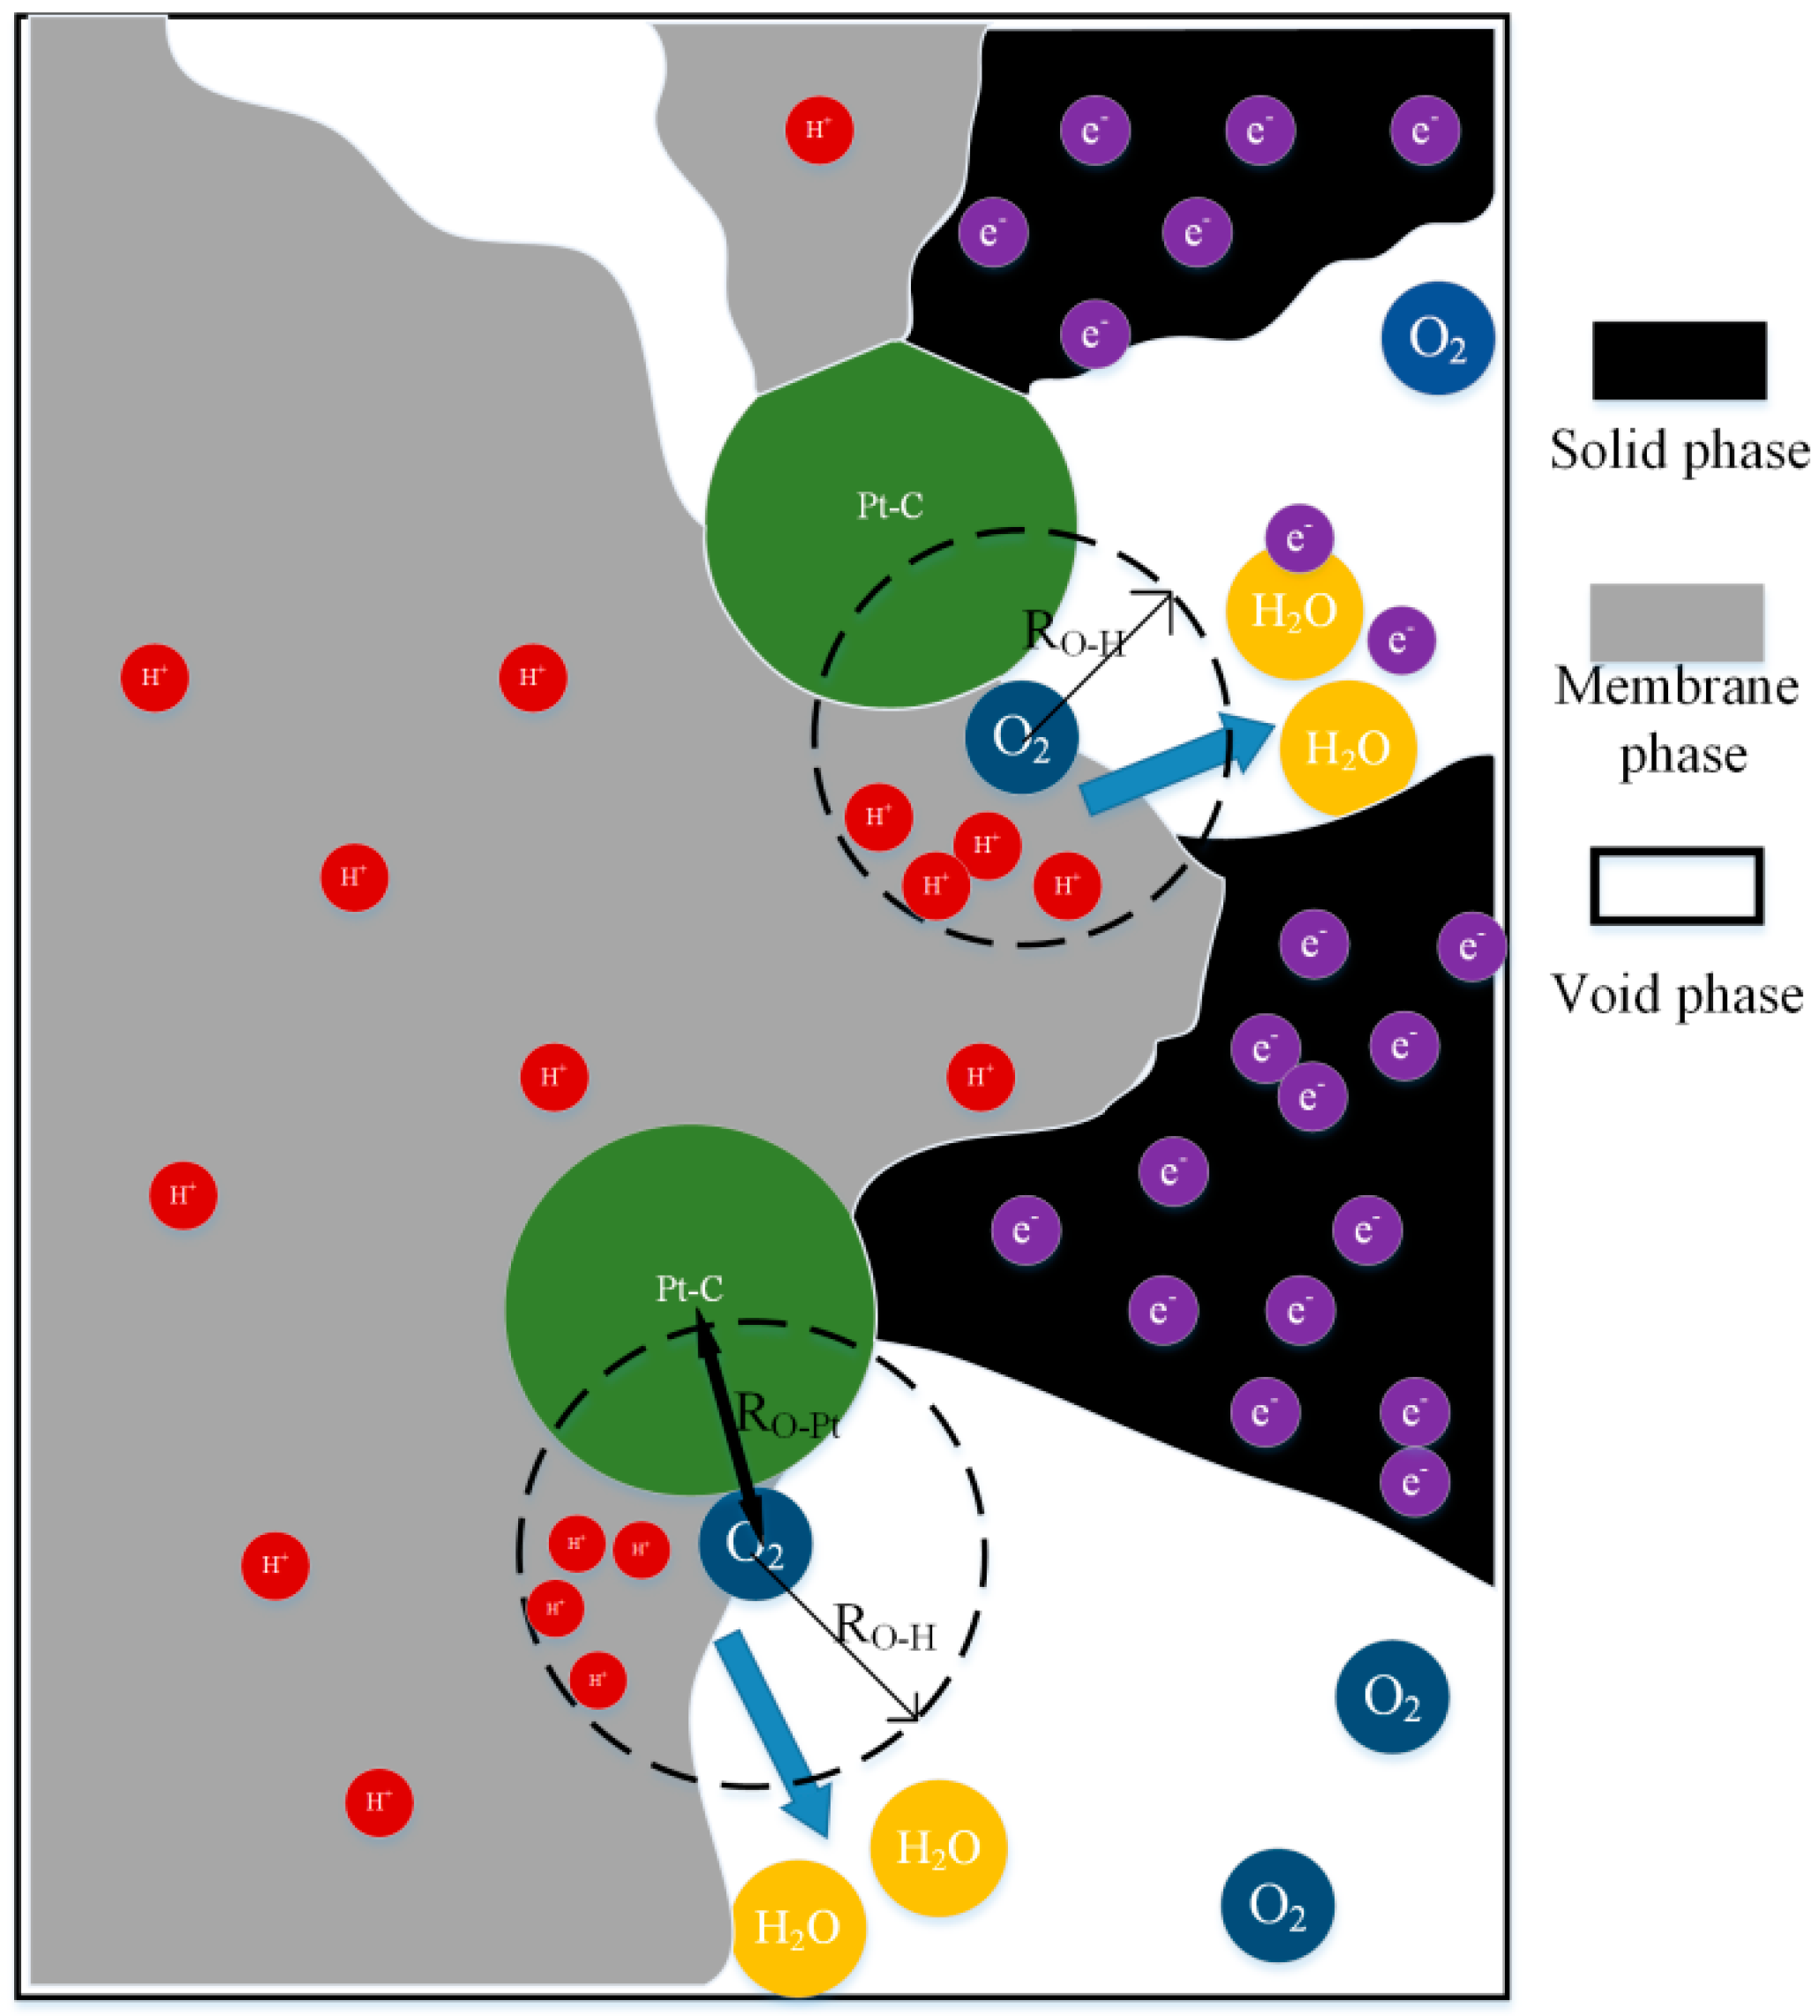
- The contact points where Pt is in contact with electrolytes, carbon, and gas are called the triple-phase boundary (TPB), and thus can be considered on the surface of Pt-carbon spheres, where the oxygen reduction reaction can occur.
- The movements of electrons are not considered in the present study because of the following two reasons: (i) The electrons are moving very fast. Electrons move very fast only through the external wire or external solid conductive phase. (ii) The number of electrons in the external solid conductive phase is very high. It is very convenient to obtain electrons for the ORR.
2.2. Theoretical Analysis
2.3. Mass Loading of Pt
2.4. Reaction Distance
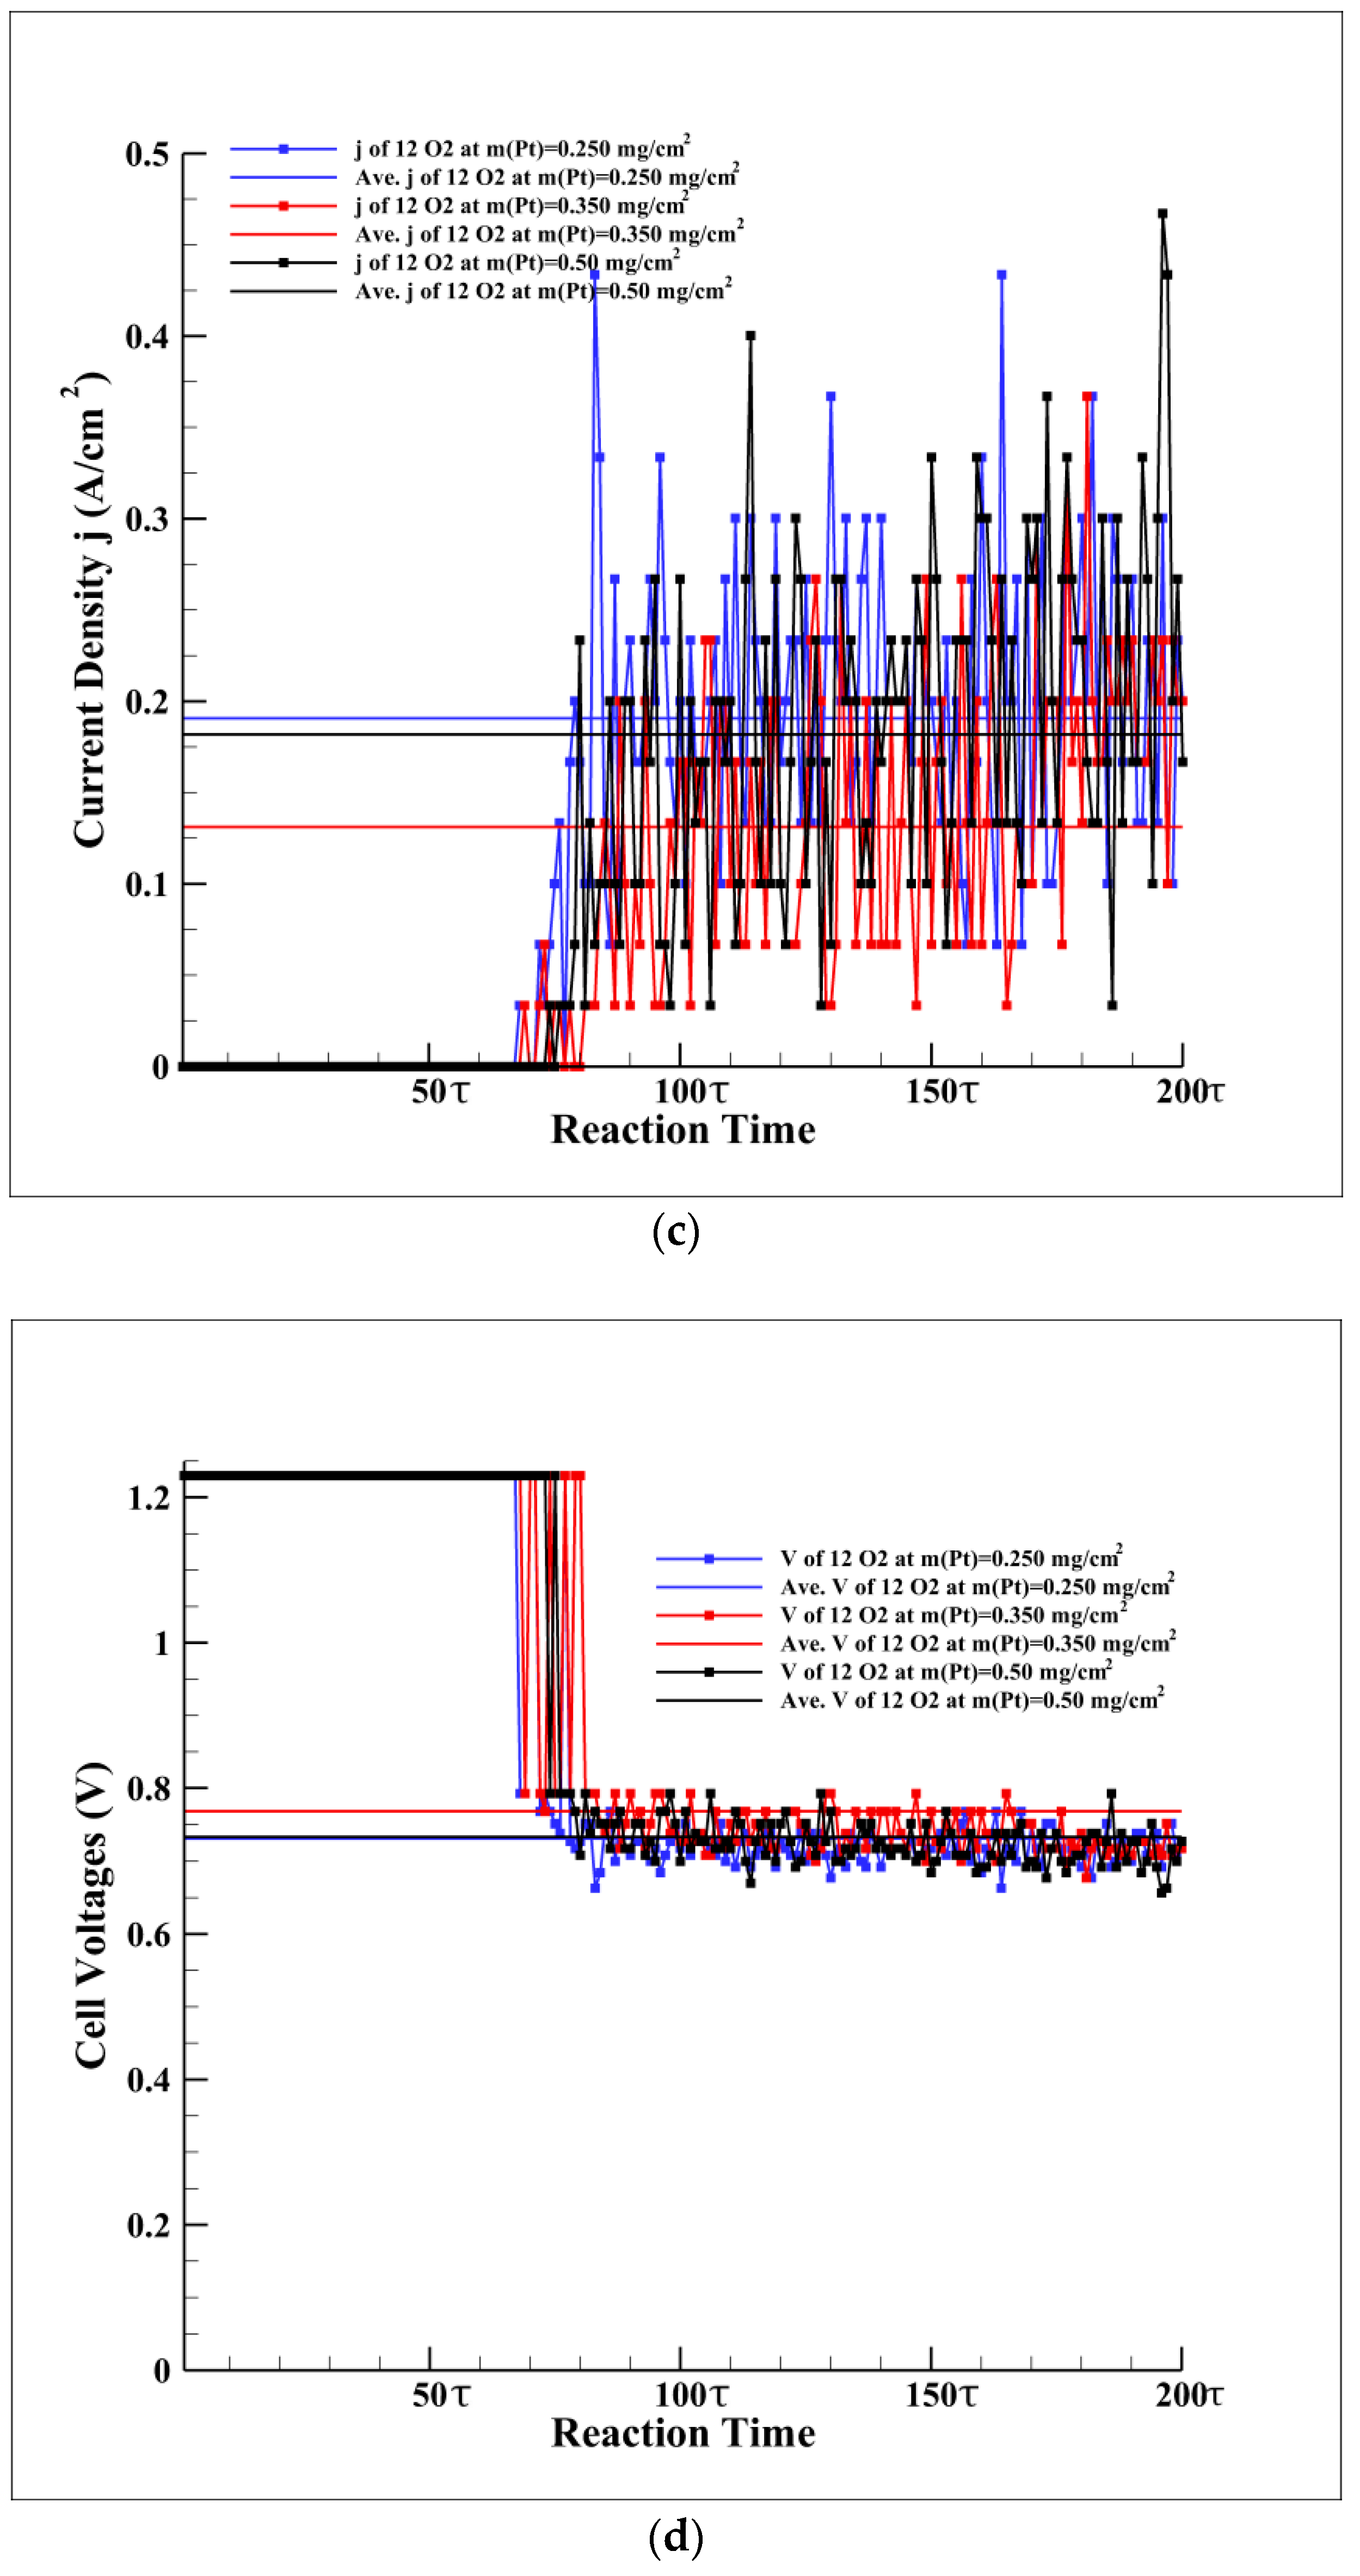
2.5. Current Density and Potentials
2.5.1. Current Density
2.5.2. Potentials
3. Results and Discussion
4. Conclusions
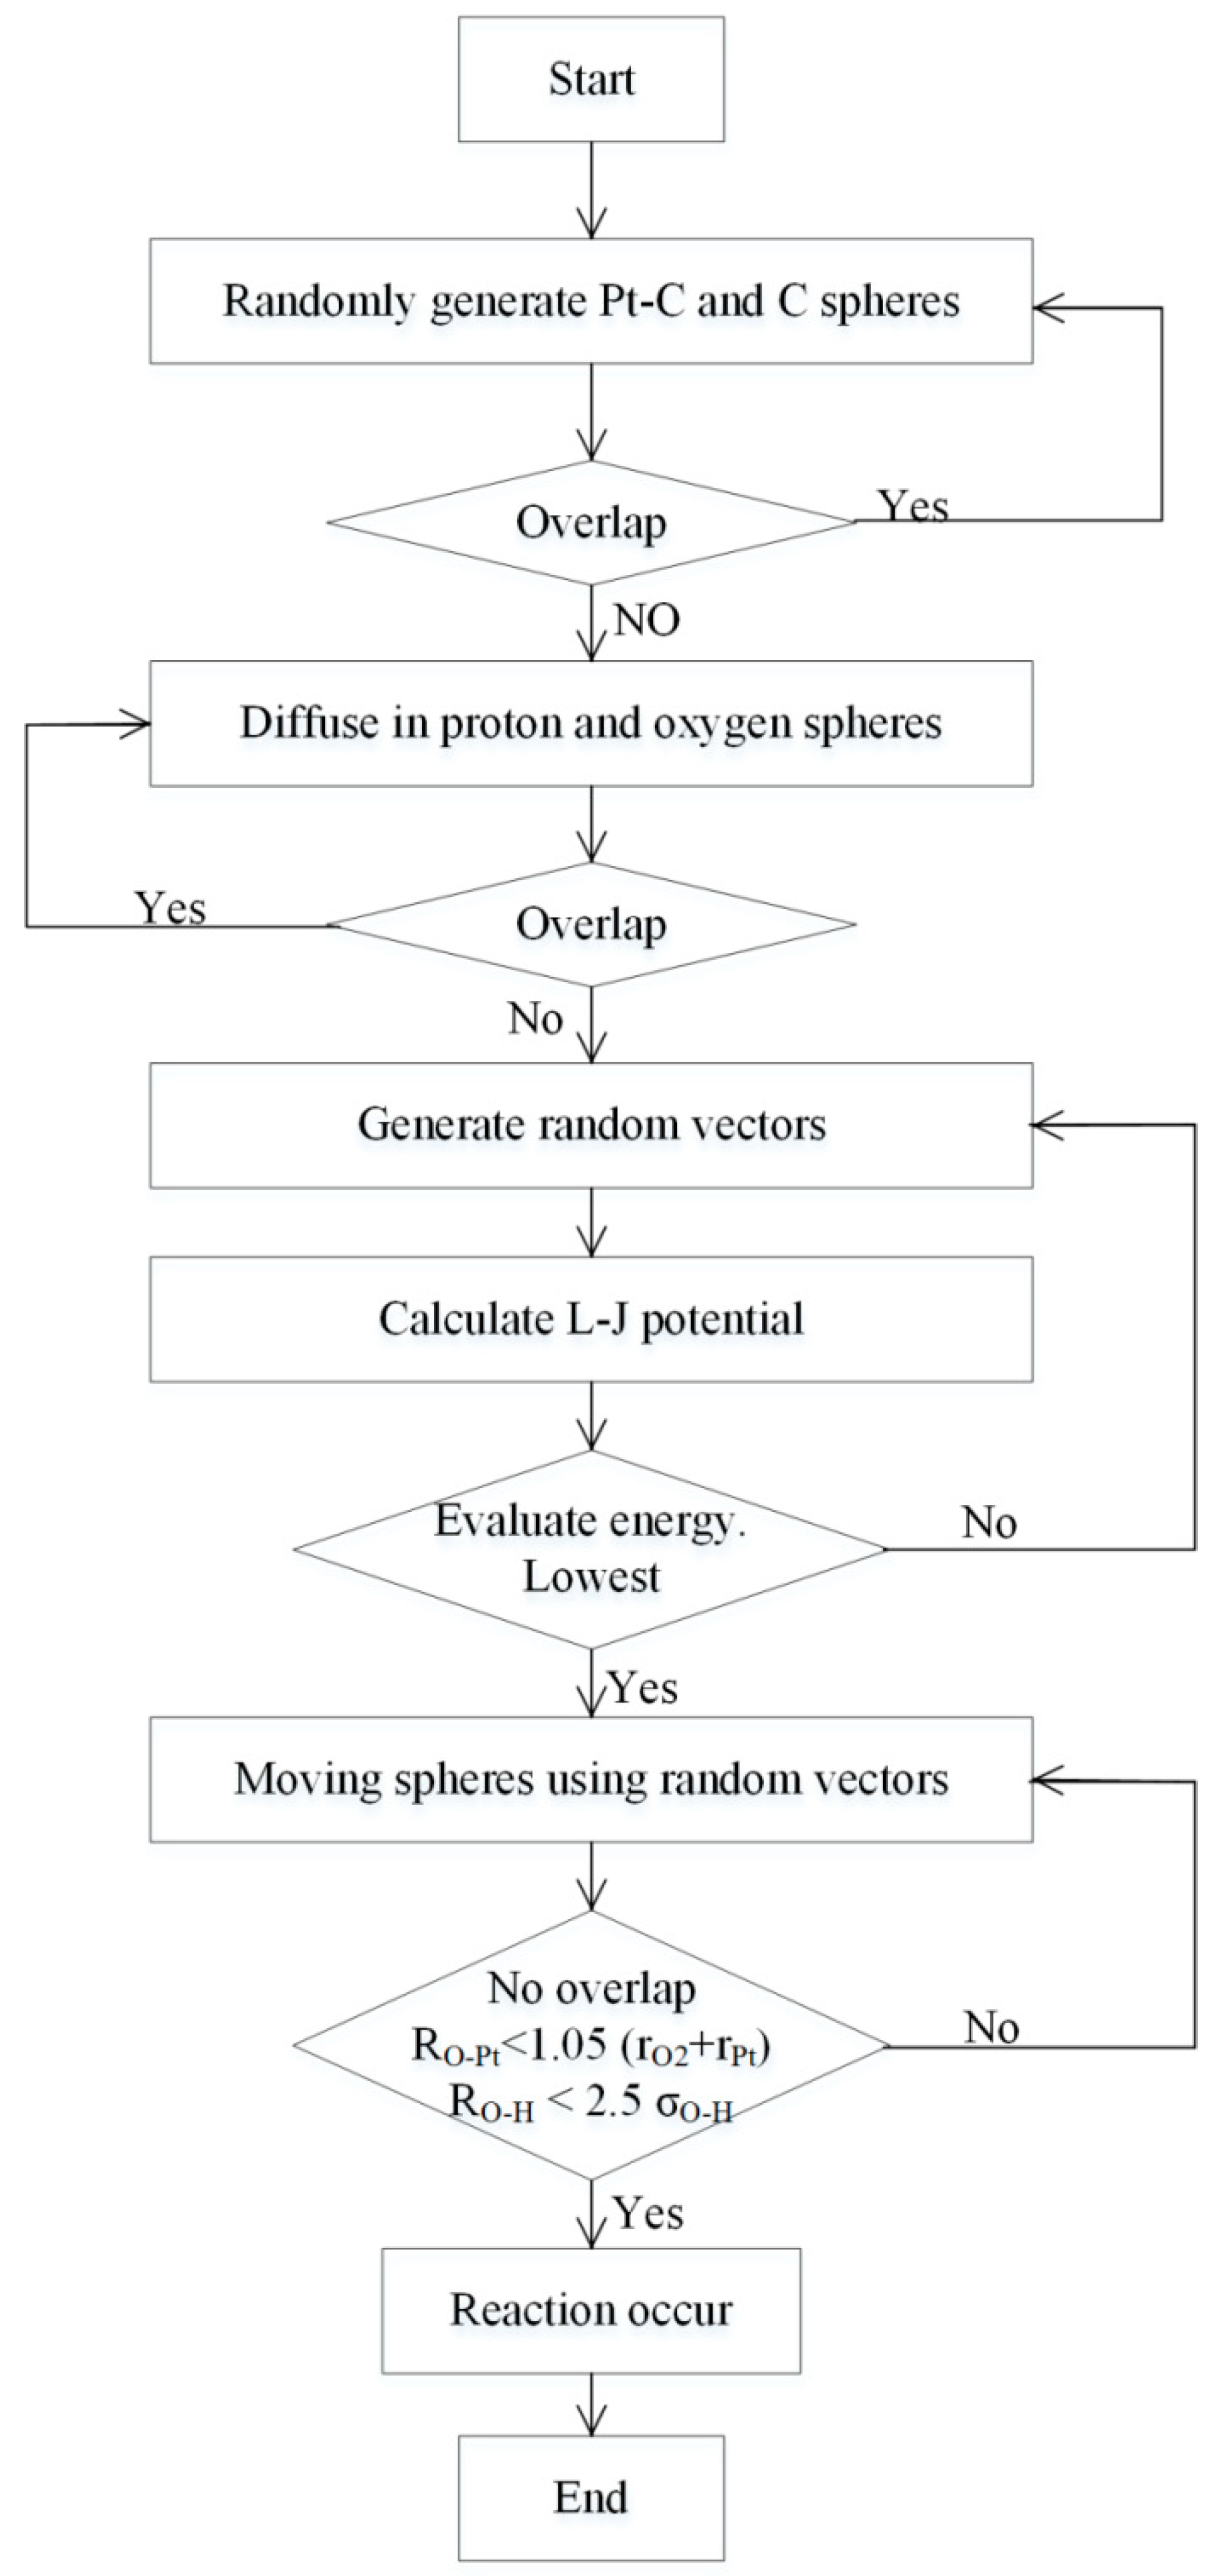
- Protons and oxygen are continuously supplied to the CCL. At each interval time, , proton and oxygen spheres diffuse into the CCL through interfaces between membranes and the CCL, and between the CCL and GDL, respectively.
- The maximum reaction distance is 8 Å, determined by the Lennard-Jones potential. This reaction distance ensures that one oxygen sphere and four proton spheres will meet and the ORR will occur.
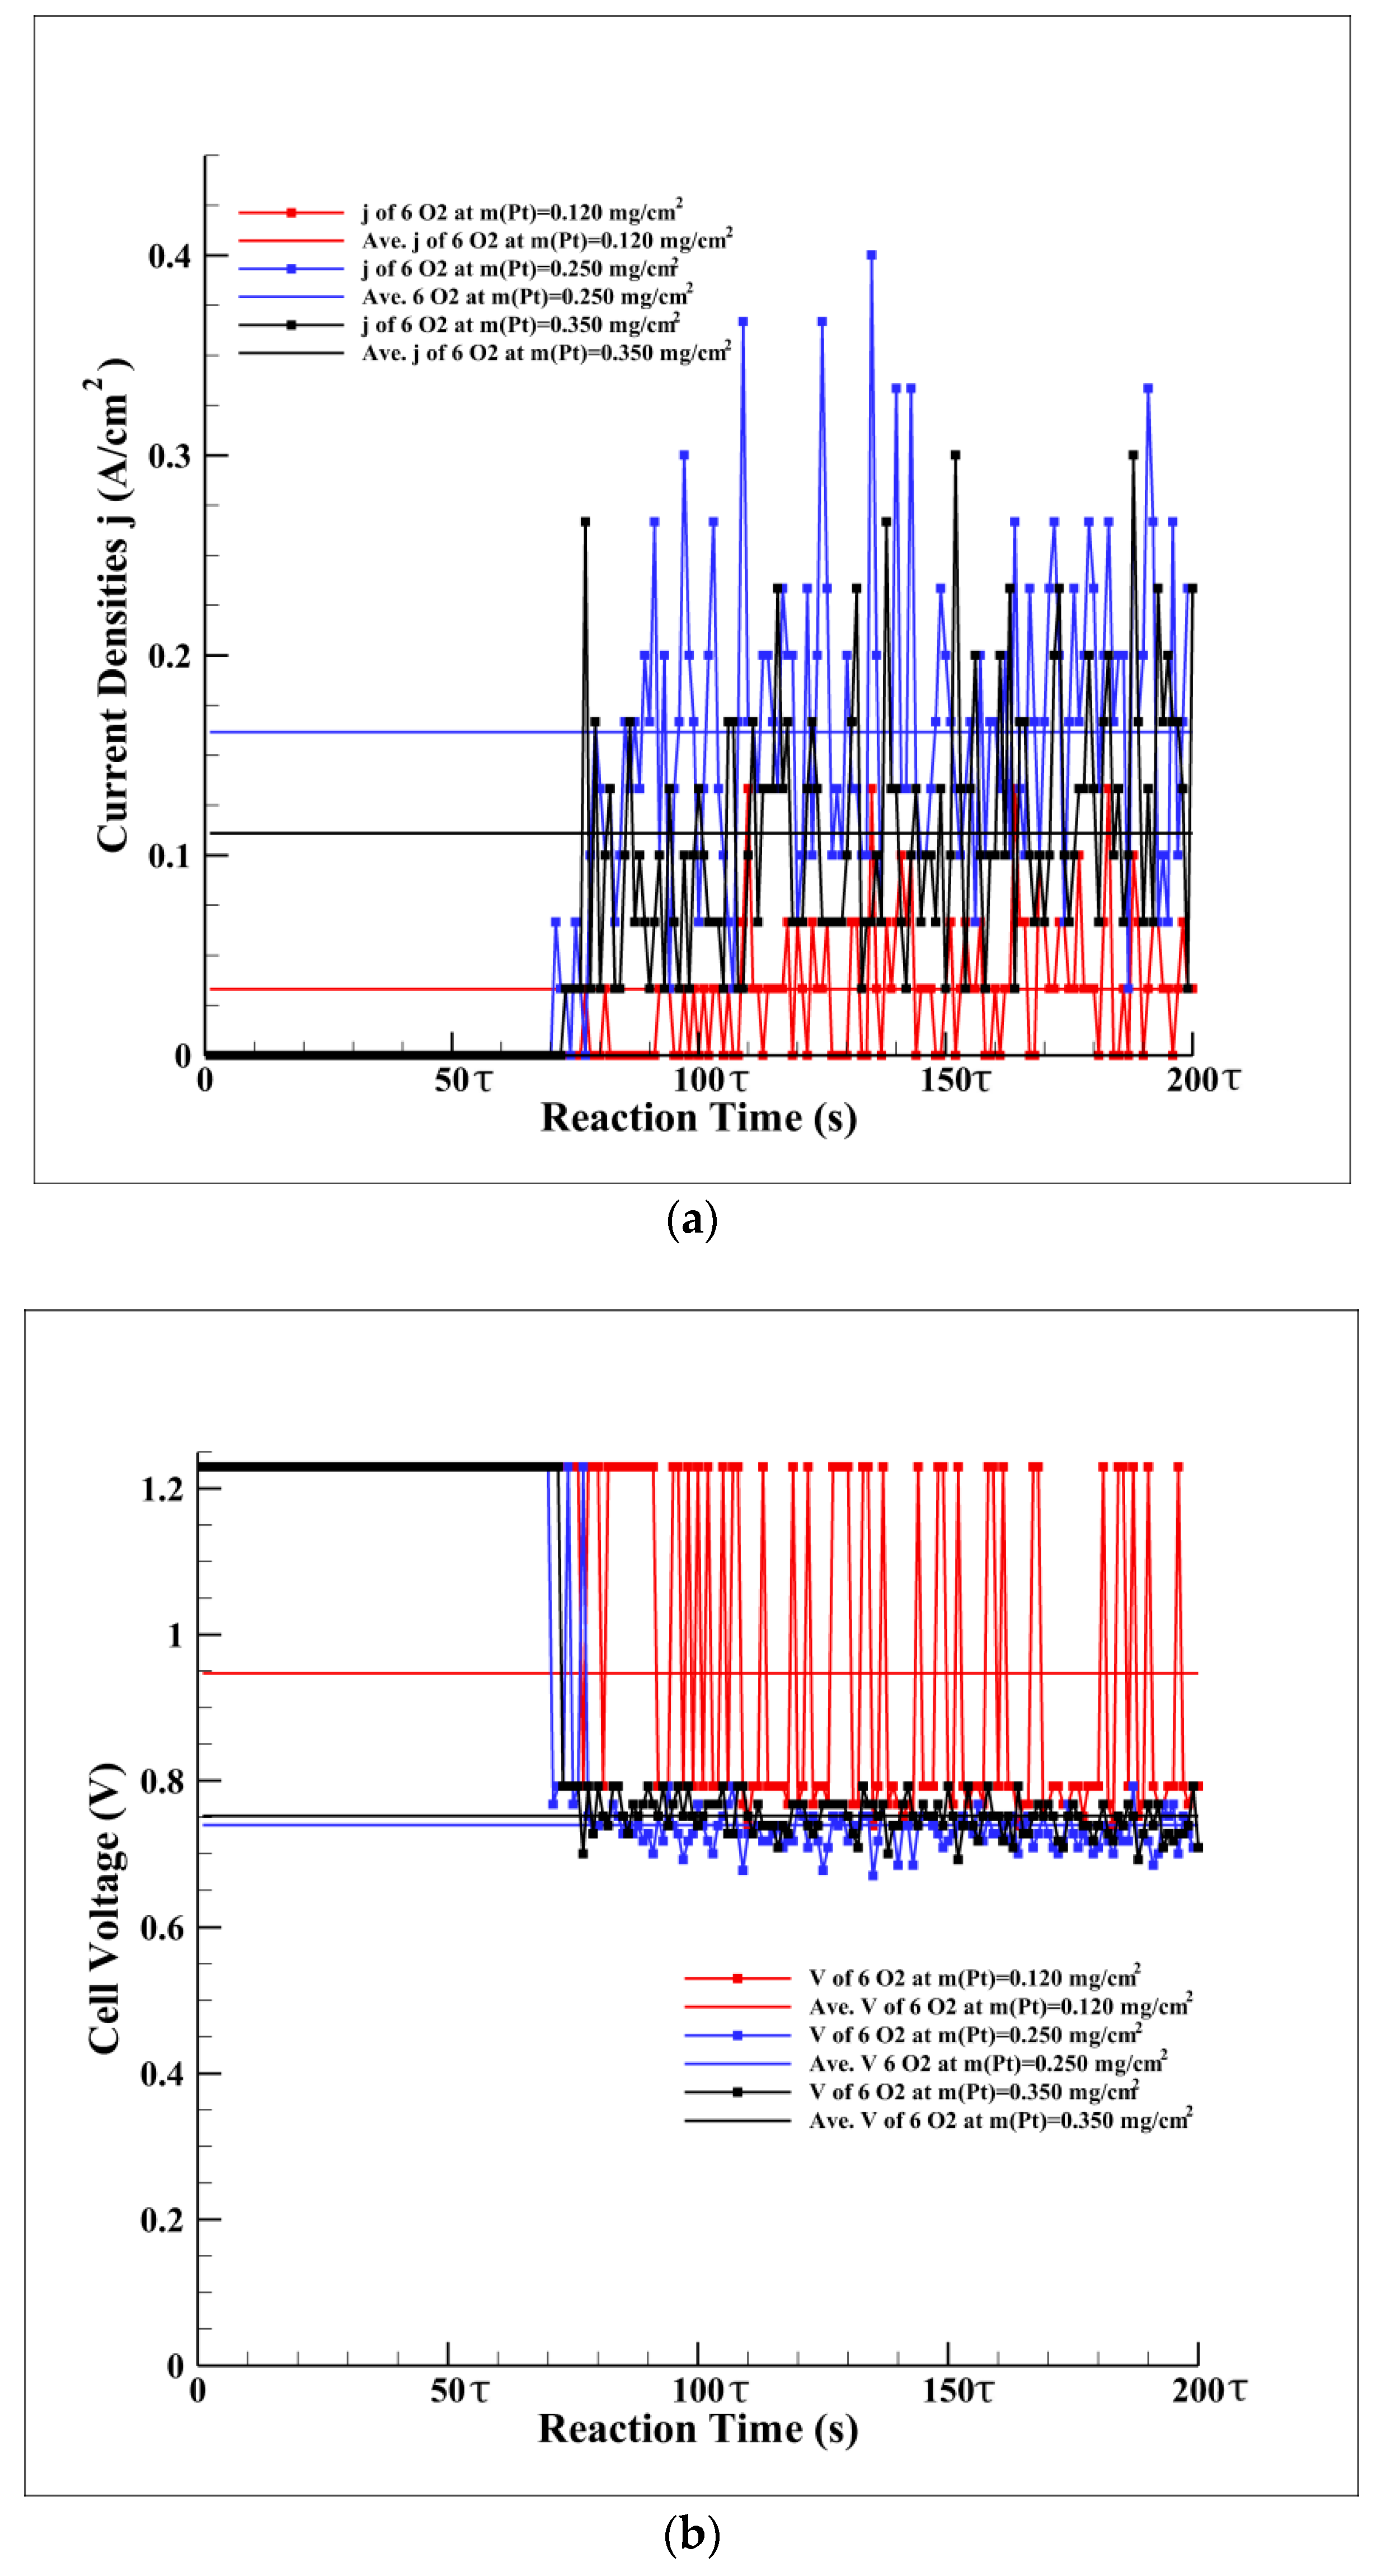
- The current density is calculated by the amount of ORR during each interval time, . The amount of ORR per interval time is monitored; thus, the total charge transferred is obtained to calculate the current density.
Author Contributions
Funding
Conflicts of Interest
Nomenclatures
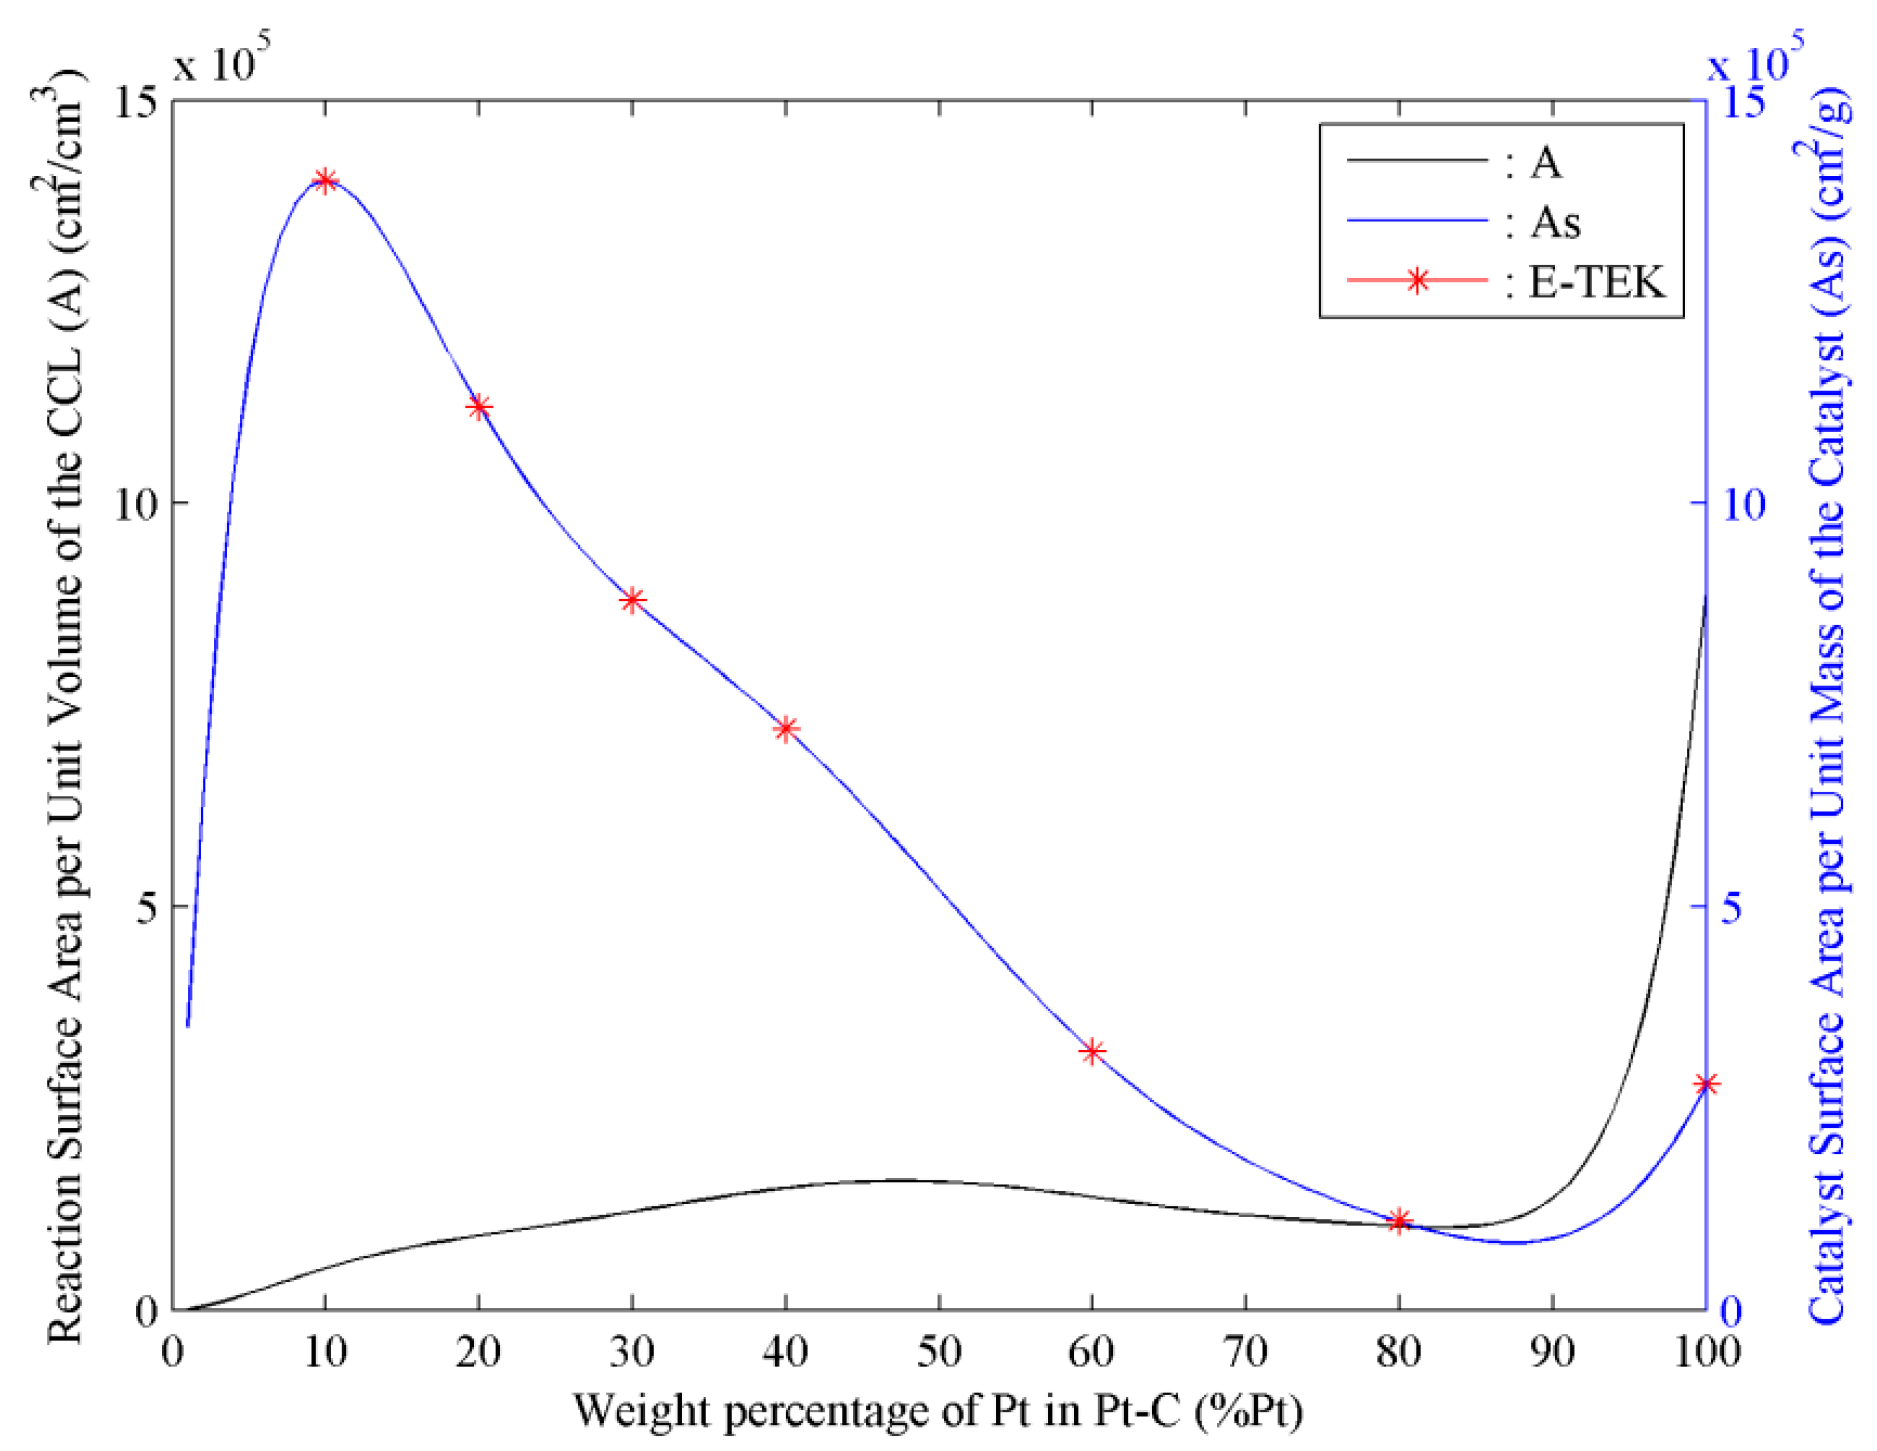
| A | reaction surface area per unit volume of the CCL, cm2/cm3 |
| As | catalyst surface area per unit mass of the catalyst, cm2/g |
| The length along and direction, | |
| Diffusivity, | |
| The effective mass loading of Pt, | |
| N | The number of particles |
| The radius of the particle, | |
| The thickness of the CCL, | |
| The porosity | |
| The density, | |
| Subscripts | |
| carbon | |
| oxygen | |
| proton | |
| platinum | |
| water | |
References
- Ji, M.; Wei, Z. A review of water management in polymer electrolyte membrane fuel cells. Energies 2009, 2, 1057–1106. [Google Scholar] [CrossRef]
- Park, J.C.; Park, S.H.; Chung, M.W.; Choi, C.H.; Kho, B.K.; Woo, S.I. Optimization of catalyst layer composition for PEMFC using grapheme-based oxygen reduction reaction catalyst. J. Power Sources 2015, 286, 166–174. [Google Scholar] [CrossRef]
- Gao, Y.; Zhang, X. Geometrical structures of catalyst layer and their impact on oxygen reduction in proton exchange membrane fuel cell. Electrochim. Acta 2016, 218, 101–109. [Google Scholar] [CrossRef]
- Zhu, S.; Wang, S.; Jiang, L.; Xia, Z.; Sun, H.; Sun, G. High Pt utilization catalyst prepared by ion exchange method for direct methanol fuel cells. Int. J. Hydrogen Energy 2012, 37, 14543–14548. [Google Scholar] [CrossRef] [Green Version]
- Weber, A.Z.; Newman, J. Modeling Transport in Polymer-Electrolyte Fuel Cells. Chem. Rev. 2004, 104, 4679–4726. [Google Scholar] [CrossRef] [PubMed]
- Soontrapa, K.; Chen, Y. Mono-sized sphere packing algorithm development using optimized Monte Carlo technique. Adv. Powder Technol. 2013, 24, 955–961. [Google Scholar] [CrossRef]
- Owejan, J.P.; Owejan, J.E.; Gu, W.B. Impact of Platinum loading and Catalyst Layer Structure on PEMFC Performance. J. Electrochem. Soc. 2012, 160, F824–F833. [Google Scholar] [CrossRef]
- Yoon, W.; Weber, A.Z. Modeling Low-Platinum-Loading Effects in Fuel-Cell Catalyst Layers. J. Electrochem. Soc. 2011, 158, B1007–B1018. [Google Scholar] [CrossRef]
- Moein-Jahromi, M.; Kermani, M.J. Performance prediction of PEM fuel cell cathode catalyst layer using agglomerate model. Int. J. Hydrogen Energy 2012, 37, 17954–17966. [Google Scholar] [CrossRef]
- Weber, A.Z.; Borup, R.L.; Darling, R.M.; Das, P.K.; Dursch, T.J.; Gu, W.; Harvey, D.; Kusoglu, A.; Litster, S.; Mench, M.M.; et al. A Critical Review of Modeling Transport Phenomena in Polymer-Electrolyte Fuel Cells. J. Electrochem. Soc. 2014, 161, F1254–F1299. [Google Scholar] [CrossRef] [Green Version]
- Seidenberger, K.; Wilhelm, F.; Schmitt, T.; Lehnert, W.; Scholta, J. Estimation of water distribution and degradation mechanisms in polymer electrolyte membrane fuel cell gas diffusion layers using a 3D Monte Carlo model. J. Power Sources 2011, 196, 5317–5324. [Google Scholar] [CrossRef]
- Seidenberger, K.; Wilhelm, F.; Haußmann, J.; Markötter, H.; Manke, I.; Scholta, J. Grand canonical Monte Carlo study on water agglomerations within a polymer electrolyte membrane fuel cell gas diffusion layer. J. Power Sources 2013, 239, 628–641. [Google Scholar] [CrossRef]
- Zhang, J.; Cao, P.; Xu, L.; Wang, Y. Modeling nanostructured catalyst layer in PEMFC and catalyst utilization. Front. Chem. Eng. China 2011, 5, 297–302. [Google Scholar] [CrossRef]
- Quiroga, M.A.; Franco, A.A. A Multi-Paradigm Computational Model of Materials Electrochemical Reactivity for Energy Conversion and Storage. J. Electrochem. Soc. 2015, 162, E73–E83. [Google Scholar] [CrossRef] [Green Version]
- Zhang, Y.; Ni, M.; Yan, M.; Chen, F. Thermal aging stability of infiltrated solid oxide fuel cell electrode microstructures: A three-dimensional kinetic Monte Carlo simulation. J. Power Sources 2015, 299, 578–586. [Google Scholar] [CrossRef]
- Zhang, Y.; Wang, Y.; Wang, Y.; Chen, F.; Xia, C. Random-packing model for solid oxide fuel cell electrodes with particle size distributions. J. Power Sources 2011, 196, 1983–1991. [Google Scholar] [CrossRef]
- Zhang, Y.; Sun, Q.; Xia, C.; Ni, M. Geometric Properties of Nanostructured Solid Oxide Fuel Cell Electrodes. J. Electrochem. Soc. 2013, 160, F278–F289. [Google Scholar] [CrossRef] [Green Version]
- Zhang, Y.; Ni, M.; Xia, C. Microstructural Insights into Dual-Phase Infiltrated Solid Oxide Fuel Cell Electrodes. J. Electrochem. Soc. 2013, 160, F834–F839. [Google Scholar] [CrossRef]
- Sun, W.; Peppley, B.A.; Karan, K. An improved two-dimensional agglomerate cathode model to study the influence of catalyst layer structural parameters. Electrochim. Acta 2005, 50, 3359–3374. [Google Scholar] [CrossRef]
- Claassens, C.H.; Terblans, J.J.; Hoffman, M.H.; Swart, H.C. Kinetic Monte Carlo simulation of monolayer gold film growth on a graphite substrate. Surf. Interface Anal. 2005, 37, 1021–1026. [Google Scholar] [CrossRef]
- Zawodzinski, T.A.; Neeman, M.; Sillerud, L.O.; Gottesfeld, S. Determination of water diffusion coefficients in perfluorosulfonate ionomeric membranes. J. Phys. Chem. 1991, 95, 6040–6044. [Google Scholar] [CrossRef]
- Chae, K.; Choi, M.; Ajayi, F.; Park, W. Mass transport through a proton exchange membrane (nafion) in microbial fuel cells. Energy Fuels 2008, 22, 169–176. [Google Scholar] [CrossRef]
- Soontrapa, K. Study of Water Transport Phenomena on Cathode of PEMFCs Using Monte Carlo Simulation. Ph.D. Thesis, University of Nevada, Las Vegas, NV, USA, 2014. [Google Scholar]
- Mohr, P.; Taylor, B.; Newell, D. CODATA recommended values of the fundamental physical constants: 2010. Rev. Mod. Phys. 2012, 84, 1527–1605. [Google Scholar] [CrossRef] [Green Version]
- Franks, F. Water: A Matrix of Life; The Royal Society of Chemistry: London, UK, 2000. [Google Scholar]
- Smit, B. Phase diagrams of Lennard-Jones fluids. J. Chem. Phys. 1992, 96, 8639–8640. [Google Scholar] [CrossRef] [Green Version]
- Frenkel, D.; Smit, B. Understanding Molecular Simulation; Academic Press: London, UK, 2002; Volume 638. [Google Scholar]
- Parthasarathy, A.; Srinivasan, S.; Appleby, J. Temperature dependence of the electrode kinetics of oxygen reduction at the platinum/Nafion interface—A microelectrode investigation. J. Electrochem. Soc. 1992, 139, 2530–2537. [Google Scholar] [CrossRef]
- O’Hayre, R.; Cha, S.W.; Colella, W.; Prinz, F.B. Chapter 5: Fuel Cell Mass Transport. In Fuel Cell Fundamentals; John Wiley & Sons, Inc.: Hoboken, NJ, USA, 2016; pp. 167–202. [Google Scholar]
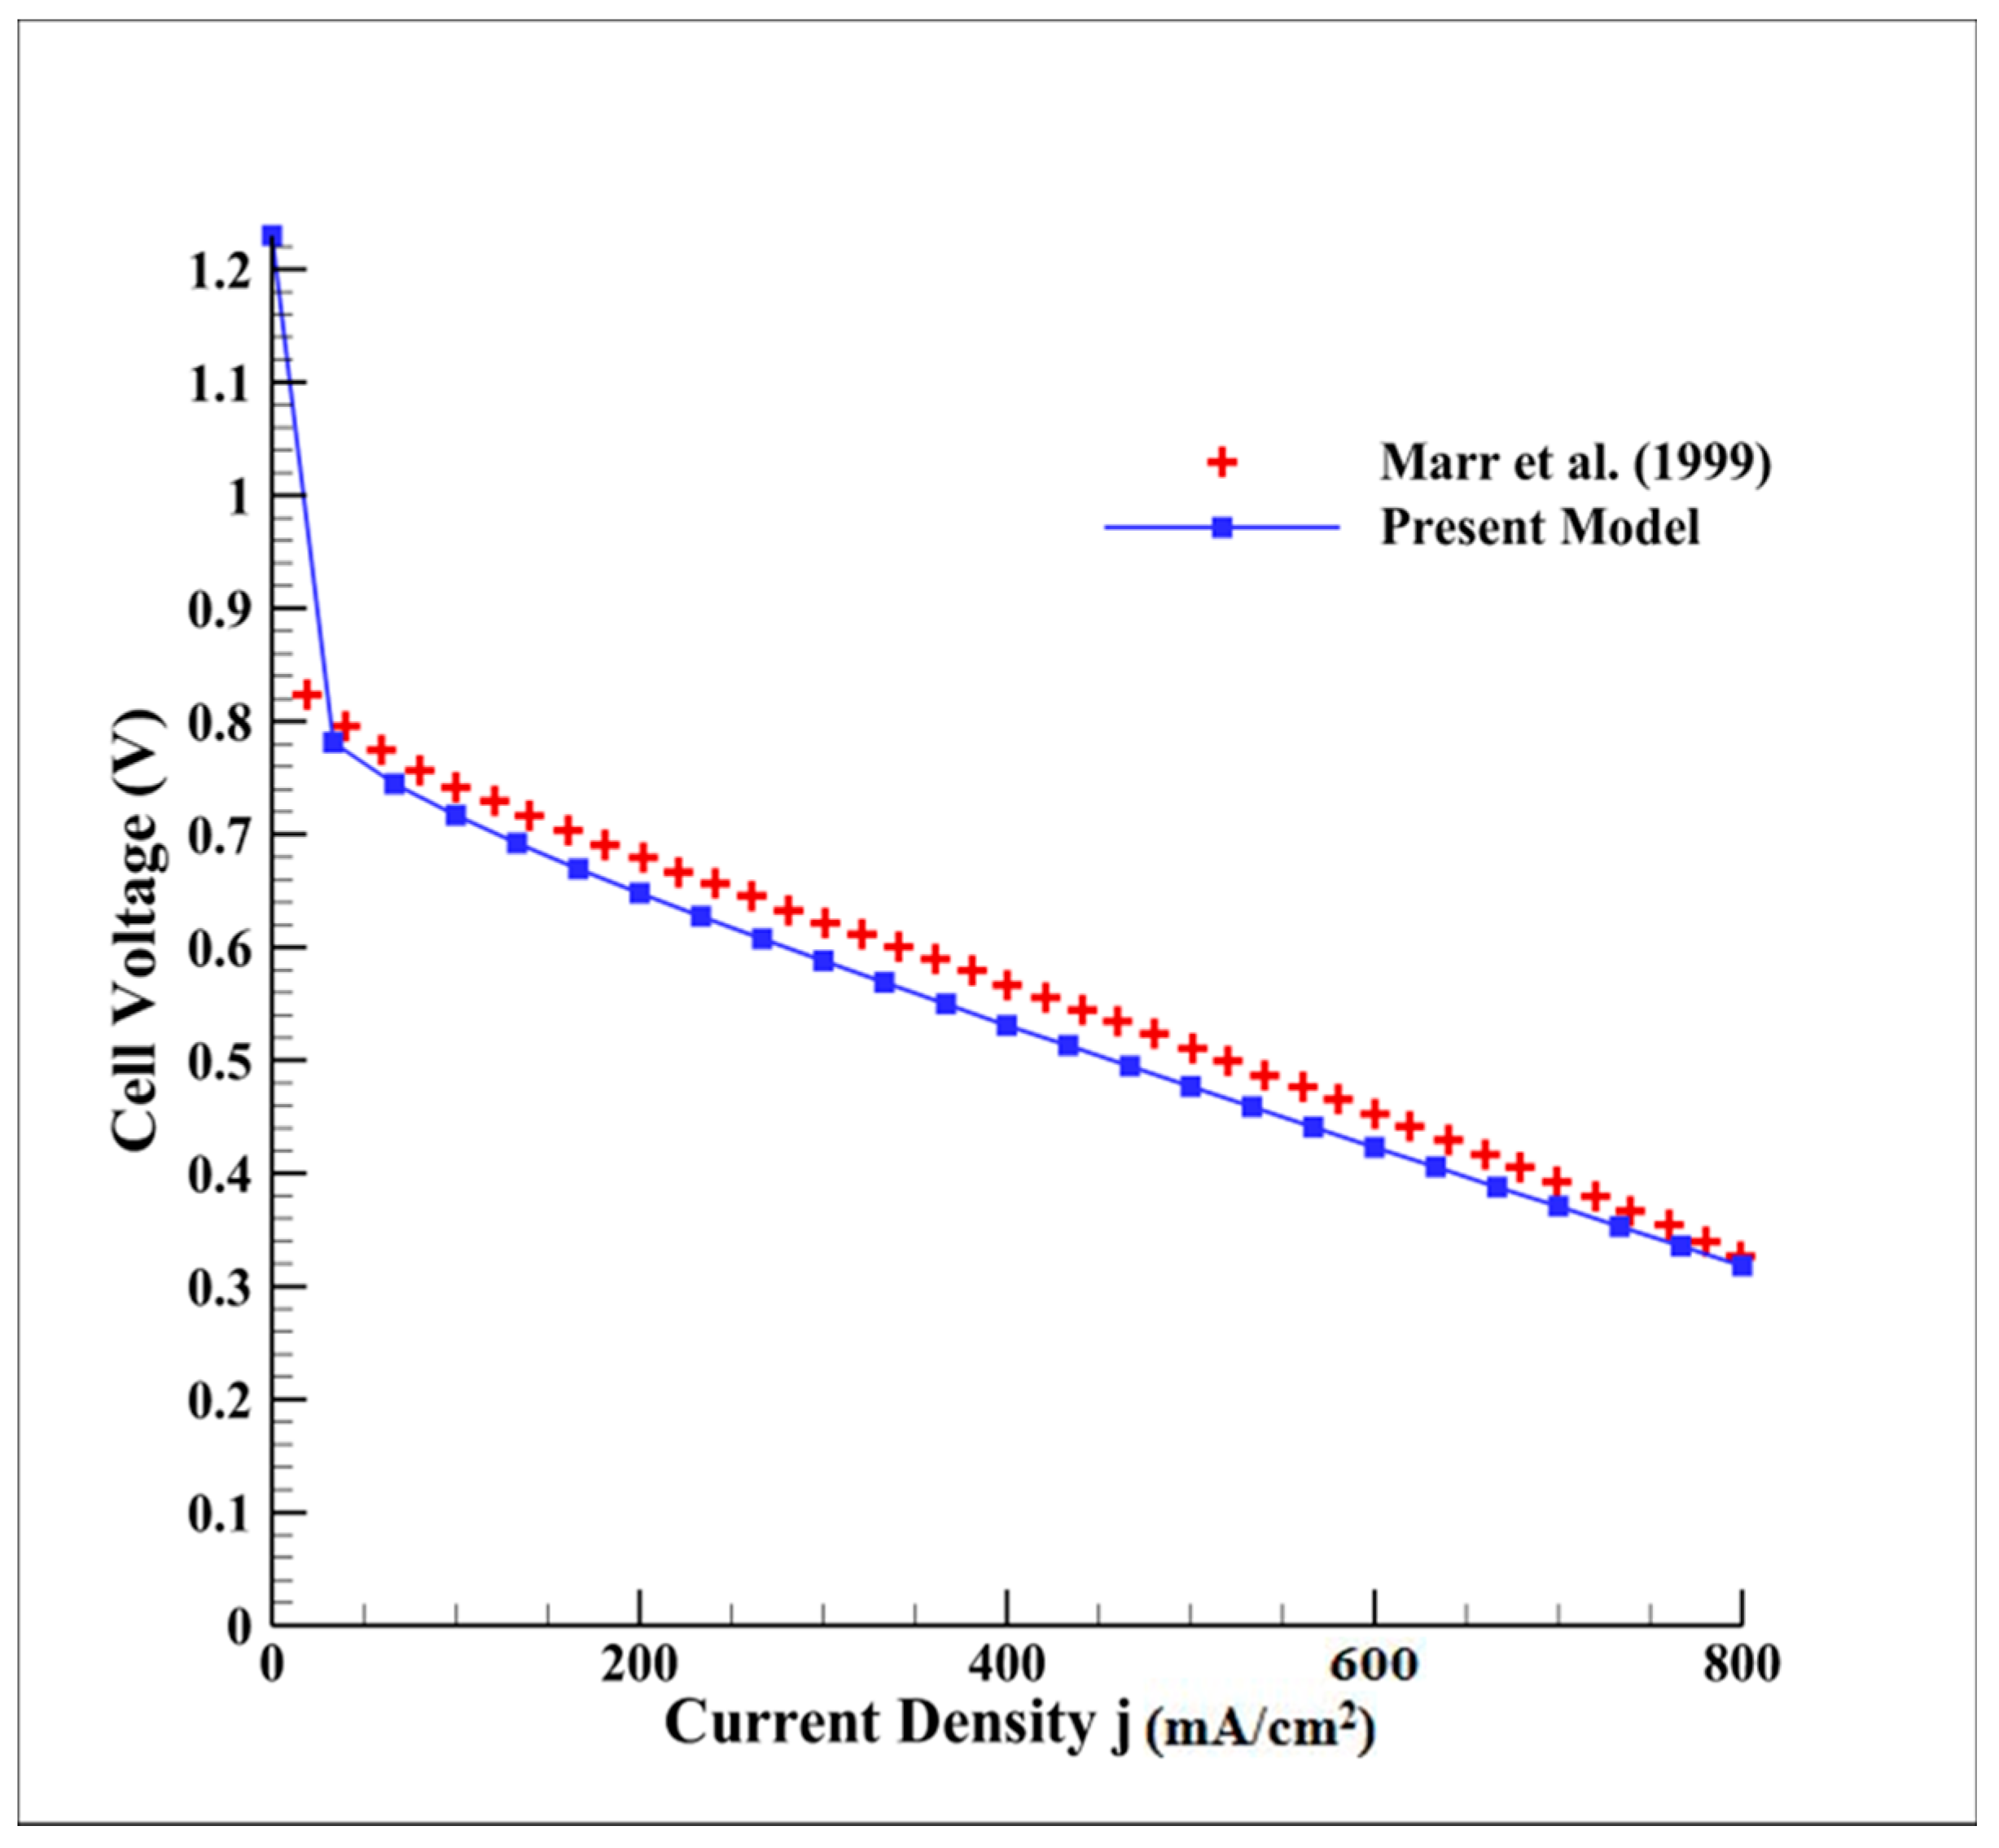
- Marr, C.; Li, X. Composition and performance modelling of catalyst layer in a proton exchange membrane fuel cell. J. Power Sources 1999, 77, 17–27. [Google Scholar] [CrossRef]
- K-TEK. Gas Diffusion Electrodes and Catalyst Materials; Catalogue: Natick, MA, USA, 1995. [Google Scholar]
- Ticianelli, E.A.; Derouin, C.R.; Redondo, A.; Srinivasan, S. Methods of advance technology of proton exchange membrane fuel cells. J. Electrochem. Soc. 1988, 135, 2209–2214. [Google Scholar] [CrossRef]
- Qi, Z.; Kaufman, A. Low Pt loading high performance cathodes for PEM fuel cells. J. Power Sources 2003, 113, 37–43. [Google Scholar] [CrossRef]

 ); carbon spheres only (
  ). All the units are in Å. (a) 100% carbon particles attached by Pt; (b) 90% carbon particles attached by Pt.
); carbon spheres only ( ). All the units are in Å. (a) 100% carbon particles attached by Pt; (b) 90% carbon particles attached by Pt.
). All the units are in Å. (a) 100% carbon particles attached by Pt; (b) 90% carbon particles attached by Pt.
); carbon spheres only ( ). All the units are in Å. (a) 100% carbon particles attached by Pt; (b) 90% carbon particles attached by Pt.


 ); carbon spheres without Pt (
  ); oxygen spheres (
  ); proton spheres (
  ); water spheres (
  ). The units of length and radius are in Å.
); carbon spheres without Pt ( ); oxygen spheres ( ); proton spheres ( ); water spheres ( ). The units of length and radius are in Å.
). The units of length and radius are in Å.
); carbon spheres without Pt ( ); oxygen spheres ( ); proton spheres ( ); water spheres ( ). The units of length and radius are in Å.


| Species | Vector Formula | Vector Magnitude (Å) | |
|---|---|---|---|
| 100,000 | 0.88 | ||
| 0.5 | 0.75 | ||
| 0.25 | 0.35 |
| Number of Oxygen Supplying into CCL Per Step | ||
|---|---|---|
| 6 | 12 | |
| 0.12 | 31 h | 45 h |
| 0.25 | 37 h | 50 h |
| 0.35 | 42 h | 57 h |
| 0.40 | 49 h | 66 h |
| 0.50 | 61 h | 77 h |
| Percentage of Pt on Carbon Black (%Pt) | |
|---|---|
| 10% | 140 |
| 20% | 112 |
| 30% | 88 |
| 40% | 72 |
| 60% | 32 |
| 80% | 11 |
| 100% | 28 |
© 2018 by the authors. Licensee MDPI, Basel, Switzerland. This article is an open access article distributed under the terms and conditions of the Creative Commons Attribution (CC BY) license (http://creativecommons.org/licenses/by/4.0/).
Share and Cite
Bai, B.; Chen, Y.-T. Simulation of the Oxygen Reduction Reaction (ORR) Inside the Cathode Catalyst Layer (CCL) of Proton Exchange Membrane Fuel Cells Using the Kinetic Monte Carlo Method. Energies 2018, 11, 2529. https://doi.org/10.3390/en11102529
Bai B, Chen Y-T. Simulation of the Oxygen Reduction Reaction (ORR) Inside the Cathode Catalyst Layer (CCL) of Proton Exchange Membrane Fuel Cells Using the Kinetic Monte Carlo Method. Energies. 2018; 11(10):2529. https://doi.org/10.3390/en11102529
Chicago/Turabian StyleBai, Baosheng, and Yi-Tung Chen. 2018. "Simulation of the Oxygen Reduction Reaction (ORR) Inside the Cathode Catalyst Layer (CCL) of Proton Exchange Membrane Fuel Cells Using the Kinetic Monte Carlo Method" Energies 11, no. 10: 2529. https://doi.org/10.3390/en11102529