Article

Performance Characteristics of Solid-Desiccant Evaporative Cooling Systems

1
Central Queensland University, University Drive, Bundaberg, QLD 4670, Australia
2
Barbara Hardy Institute, School of Engineering, University of South Australia, Mawson Lakes, SA 5095, Australia
3
Indian Institute of Technology Delhi, Hauz Khas, New Delhi 110 016, India
*
Author to whom correspondence should be addressed.
Energies 2018, 11(10), 2574; https://doi.org/10.3390/en11102574
Submission received: 28 August 2018 / Revised: 18 September 2018 / Accepted: 18 September 2018 / Published: 27 September 2018
(This article belongs to the Section A: Sustainable Energy)

Abstract

:
Air conditioning accounts for up to 50% of energy use in buildings. Increased air-conditioning-system installations not only increase total energy consumption but also raise peak load demand. Desiccant evaporative cooling systems use low-grade thermal energy, such as solar energy and waste heat, instead of electricity to provide thermal comfort. This system can potentially lead to significant energy saving, reduction in carbon emissions, and it has a low dew-point operation and large capacity range. Their light weight, simplicity of design, and close-to-atmospheric operation make them easy to maintain. This paper evaluates the applicability of this technology to the climatic conditions of Brisbane, Queensland, Australia, specifically for the residential sector. Given the subtropical climate of Brisbane, where humidity levels are not excessively high during cooling periods, the numerical study shows that such a system can be a potential alternative to conventional compression-based air-conditioning systems. Nevertheless, the installation of such a system in Brisbane’s climate zone requires careful design, proper selection of components, and a cheap heat source for regeneration. The paper also discusses the economy-cycle options for this system in such a climate and compares its effectiveness to natural ventilation.

1. Introduction

The air-conditioning industry faces many challenges as the demand for comfortable indoor environments continues to increase [1]. Air conditioning accounts for a major part, up to 40%, of energy use in buildings [2]. Widespread air-conditioning-system installation not only increases total energy consumption but also raises peak electricity demand. Peak demand in many countries and Australian cities is growing at about 50% more than base demand growth and, in some areas, up to four times the average, which, in turn, requires higher generation capacity [3]. Power generation accounts for the majority of greenhouse-gas emissions and associated climate change. These challenges lead to the need for green and sustainable and innovative systems [4] with minimum impact on the environment, materials, resources, and processes that prevail in nature [5].
Heat-driven air-conditioning systems are systems that use low-grade thermal energy such as solar energy and waste heat rather than electricity. These systems can produce significant energy savings, have low global-warming and zero ozone-depletion potential, while at the same time being able to deliver better indoor-air quality. Studies have indicated that such a system is applicable to a wide range of climatic conditions and offers a feasible alternative to conventional air-conditioning systems [6,7,8,9,10,11]. Among these systems, desiccant evaporative cooling systems are worthy of consideration due to their low dew-point operation and large capacity range. Their light weight, simplicity of design, and close-to-atmospheric operation make them easy to maintain. In terms of providing thermal comfort, the system combines the dehumidifying capability of a solid desiccant system with the sensible cooling capability of an evaporative cooling system.
For hot dry summers as experienced in Adelaide and Melbourne, evaporative cooling achieves coefficient of performance (COP) values of more than 20 [12]. Furthermore, since these systems provide 100% ventilation, they reduce the amount of heat entering the home through walls and roofs, as cooled air absorbs this heat as it exits the building. This characteristic, known as displacement ventilation, results in less cooling being required compared to a refrigeration-based system that has to remove all the heat that enters the building to achieve the desired conditions [13]. However, evaporative cooling is ineffective in humid climates, including in Brisbane, where thermal comfort is unachievable even using two-stage cooling systems [14].
In Australia, the energy efficiency of cooling systems is regulated through the Minimum Energy Performance Scheme (MEPS) and the star rating of air-conditioning systems, which is based on the COP measured at an indoor temperature of 27 °C and an outdoor temperature of 35 °C operating at 100% output (AS/NZS 3823.2:2011). The rating only considers the unit itself and does not consider the energy-efficiency impact of ducting or using multiple heads, as found in whole-of-house systems. In addition, inverter air conditioning involves the compressor within the system adjusting its rotational speed to match the load requirement. Usually, these systems have the ability to reach a cooling capacity of more than 150% of the rated capacity, which is a ‘hidden’ capacity. This will increase power demand beyond the rated capacity. There is no regulation limiting this additional capacity [12]. The COP of a refrigerated air conditioner is a function of the outdoor air temperature. The COP value is reduced by half of its rated value during hot conditions, which are more likely to occur frequently in future [12].
In a refrigerated air conditioner, air is dehumidified by cooling air below dew-point temperature to condense water vapor in the air using a cooling coil that uses a vapor-compression system. Besides being energy-intensive, these systems are not particularly effective in dealing with higher latent loads [13]. The cooling and dehumidifying process in a refrigerative air conditioner may necessitate heating after reducing moisture content to achieve comfort conditions, particularly for commercial systems. Water condensation during this process can also cause mildew, leading to material degradation and potential health problems.
This paper presents an analysis of the technical suitability of a residential desiccant evaporative cooling system for Brisbane, Queensland, Australia. According to the Köppen Climate Classification, Brisbane (and Queensland in general), has subtype Cfa (humid subtropical) climate with “relatively high temperatures and evenly distributed precipitation throughout the year” [15]. Recent studies have indicated that a desiccant evaporative cooling system is technically viable for office buildings in warm and humid climates such as Darwin and Brisbane [16,17]. The present work focuses on residential applications and shows how the values of certain system parameters affect indoor thermal-comfort conditions, as well as the system’s overall performance. The TRNSYS computer modeling package was used to analyze the performance of a system hypothetically installed in a residential building. While the paper presents the specific case for Brisbane, the outcomes of the study should be applicable to regions with climates similar to Brisbane. In addition, this study should trigger further investigations on the technical and economic viability of such a system in more challenging (humid and warm to hot) climates. The paper also presents conclusions and recommendations arising from the study.

2. Solid-Desiccant Evaporative Cooling System—Overview

A typical ventilation-mode solid-desiccant evaporative system consists of a desiccant wheel, an energy-recovery wheel, evaporative coolers (at supply and exhaust streams), and a regeneration (reactivation) source, as shown in Figure 1. The desiccant wheel dehumidifies the air, but substantially raises its temperature (Processes 1→2). The first (sensible) cooling of this supply air takes place in the energy-recovery wheel (2→3). Before entering the conditioned space, further cooling of supply air occurs in a direct evaporative cooler (3→4). Air humidity is slightly raised (3→4), but is still well below comfort requirements. As the supply air enters the conditioned space, its temperature and humidity increase due to the space-sensible and latent heat gains (4→5).
The air coming from the air-conditioned space is directed to the exhaust, where it undergoes several psychrometric processes starting with cooling in an evaporative cooler (5→6). This brings the air close to the saturation line with humidification. In the energy-recovery wheel, the air is preheated (6→7) before it passes through the heater (7→8), where its temperature is further raised so that it will be able to desorb the water from the desiccant on the regeneration side of the desiccant wheel (8→9). The regeneration heat source (E) can be either a solar thermal system or waste heat.
Typical air temperature and humidity levels at the inlet and outlet of each component of this configuration, extracted from Reference [6], are given in Table 1.
Recent numerical studies have indicated that a desiccant evaporative cooling system with solar thermal collectors, as the heat source is suitable for warm and humid climates such as Darwin and Brisbane [16,17]. This is particularly relevant in the case where cooling demand occurs during a period of maximum solar gains. The system’s dehumidification performance, however, needs to be improved to enable it to address a high latent load. Such improvement in dehumidification performance has recently been achieved [18]. The so-called ‘nonadiabatic desiccant wheel’ has been found to improve dehumidification capability by around 45%–53% under identical supply-air and regeneration-air conditions [18]. In this study, however, the standard desiccant wheel model available in the TRNSYS was employed. This means that the benefits of the improved desiccant wheel system were not considered.

3. Computer Modeling Analysis of System Performance

3.1. Computer Modelling Setup

The TRNSYS modeling package [19] was employed to analyze system performance. The main components of the system include: Brisbane weather data, a reference house modelled using TYPE56, and the components of the desiccant evaporative cooling system (available in TRNSYS/TESS library), which consist of: desiccant wheel TYPE716, energy-recovery wheel TYPE760, one direct evaporative cooler at the supply side (TYPE506), one direct evaporative cooler at the return side (TYPE506), TYPE930 to model the regeneration heat source, and several printers (TYPE25) to record all the relevant outputs. At this stage, the main purpose of this modeling is to assess the capability of the solid-desiccant evaporative system to deliver thermal comfort, hence choosing electric heater TYPE920 as the heat source. Future research will explore the most suitable regeneration heat source(s).

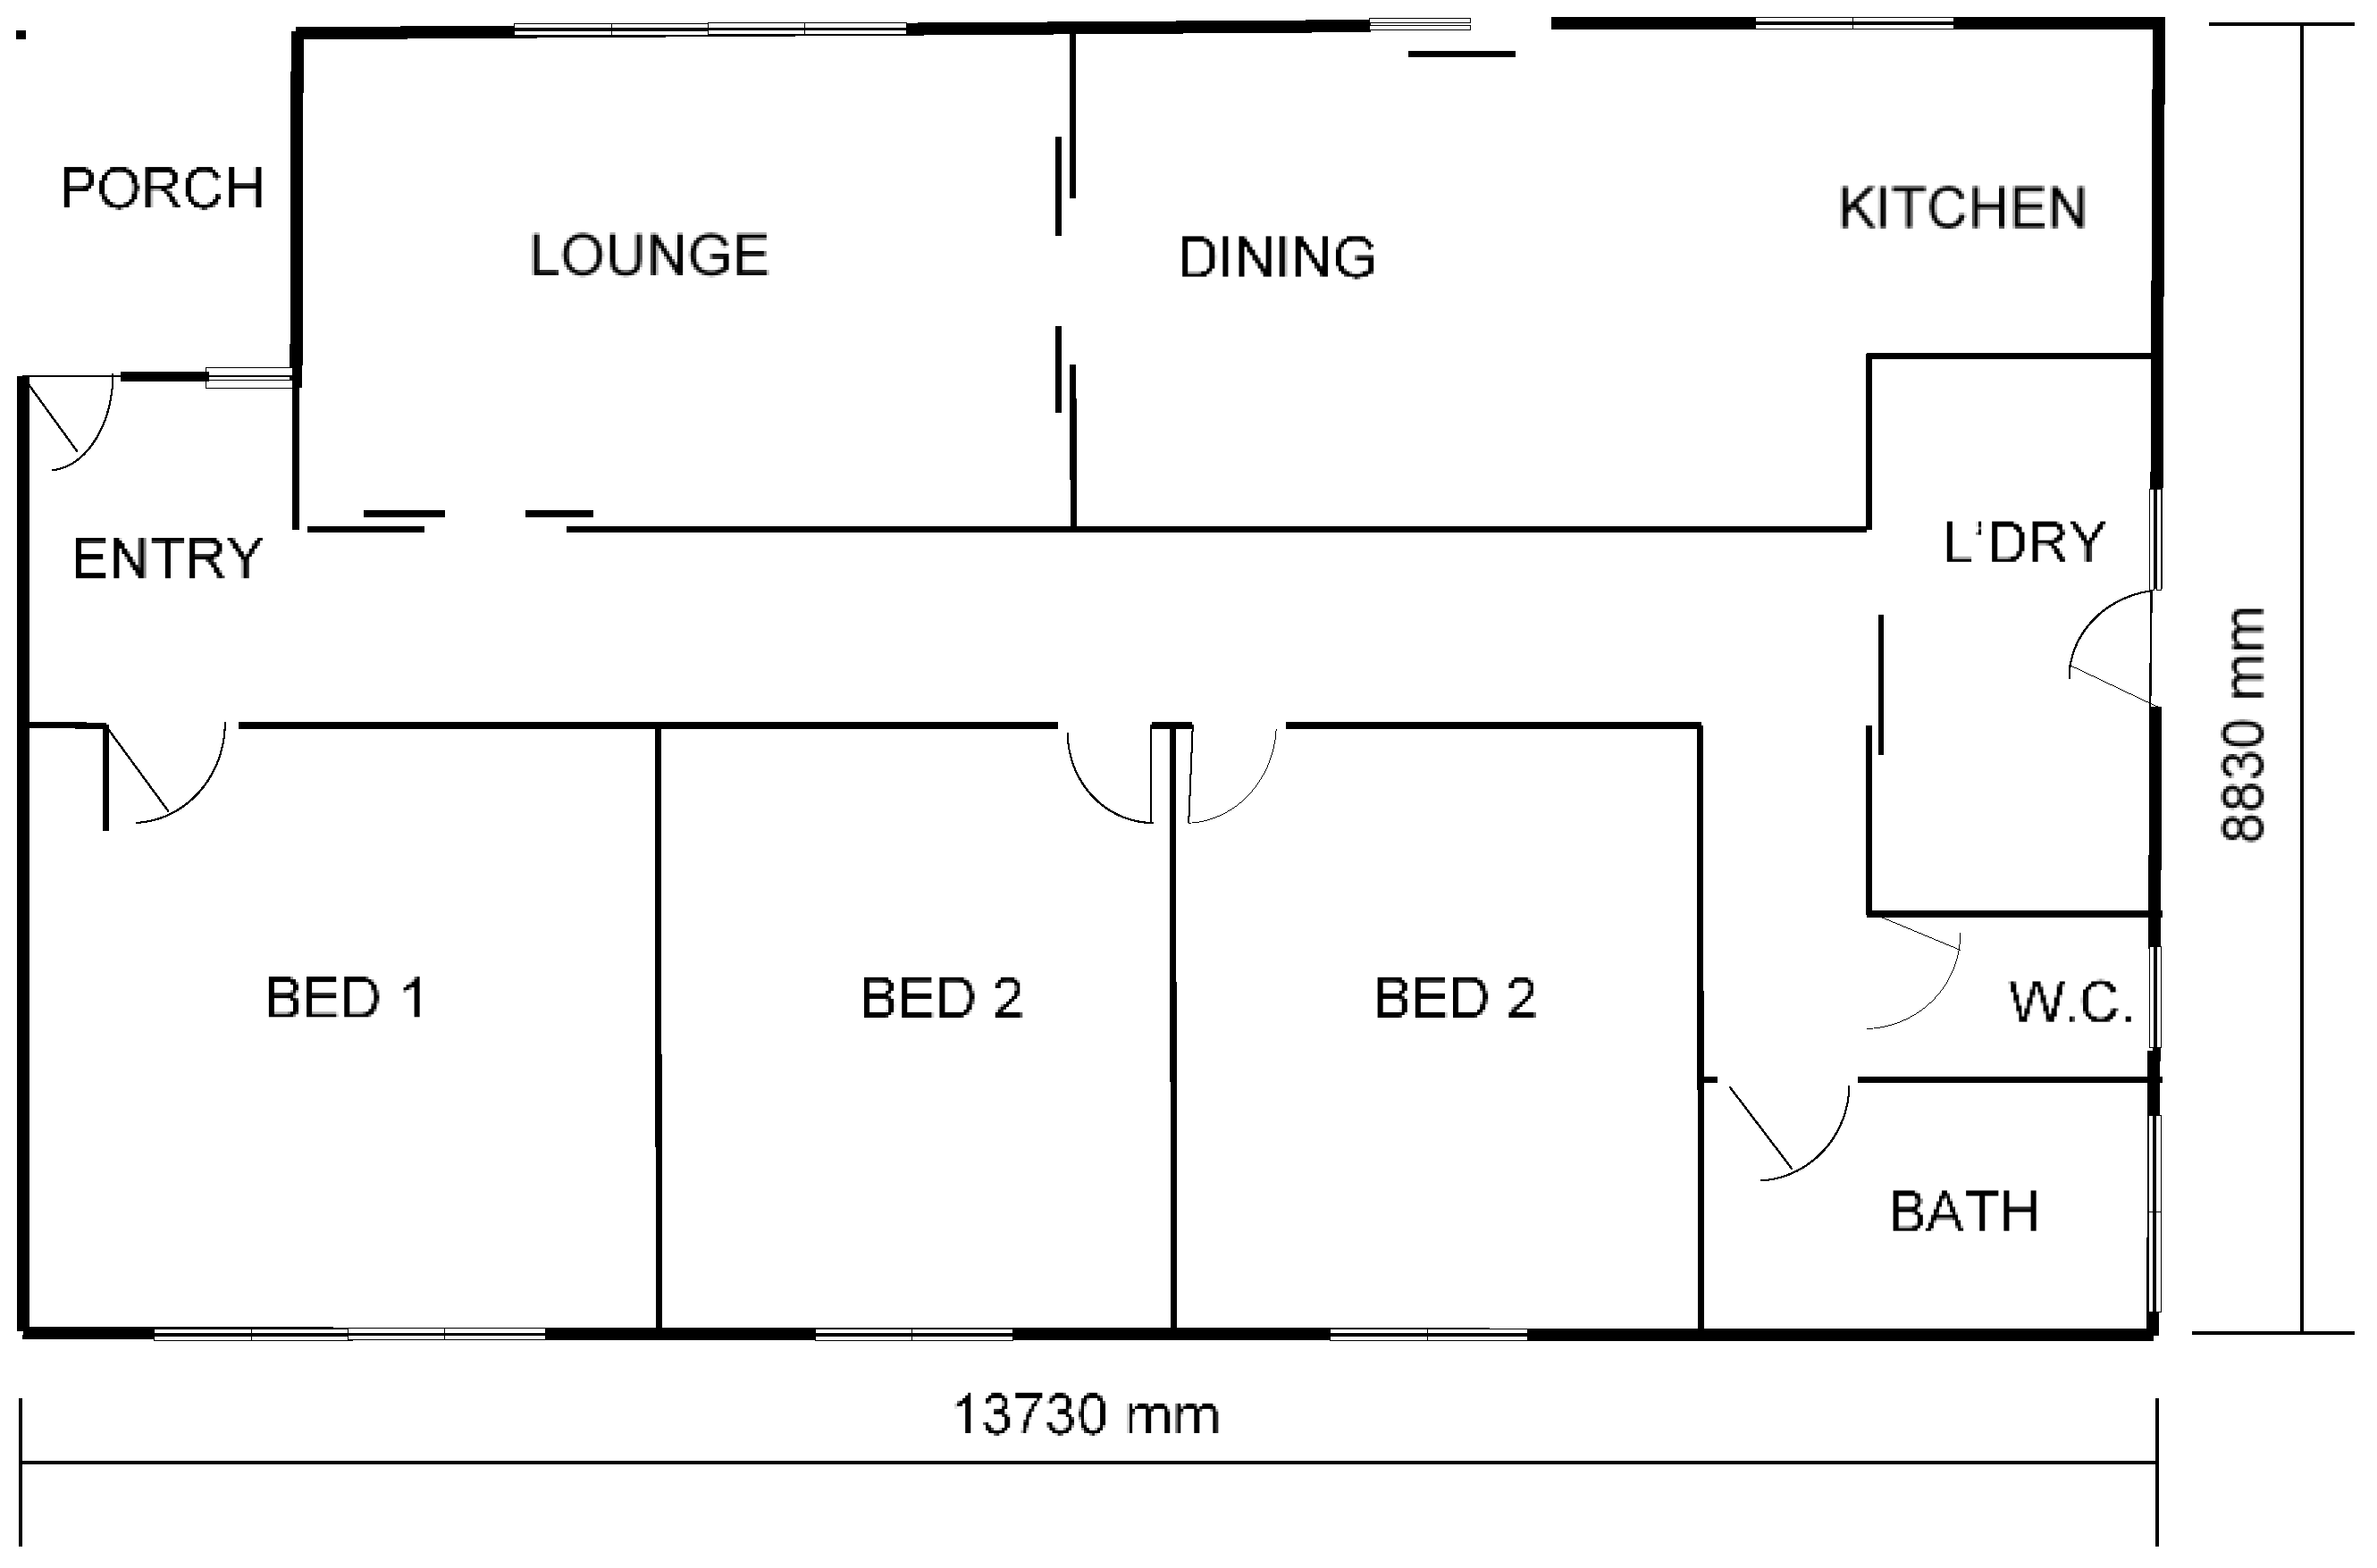
3.2. Reference House

To have an idea as to how a desiccant evaporative cooling system serves a house built in the Brisbane climate zone, a house, of which the floor plan is shown in Figure 2, has been modeled. The floor plan of the house is adapted from the “Example” house in Cheetah program [20], used in References [21,22]. The house consists of three bed rooms, one lounge, and one dining room/kitchen. A passage connects the bedrooms from the lounge and dining space as shown. The laundry room and bathroom (called service section) are located close to each other at the right side of the building space. The height of the building was set to 2.4 m and the two roof sections, facing north and south, respectively, have 25° pitch.
The thermal zoning of the house was set so that only the living room and bedrooms were conditioned, while the passage and service sections were not. Internal heat gains came from five occupants, kitchen appliances, a computer, a TV set, and lights in every room and passage. Heat gains were estimated according to the scheduled conditioning of rooms: 07.00–23.00 (living room) and 23.00–07.00 (bedrooms).
The house has single-glass external windows in the external walls of the living room and bedrooms. The external wall consists of gypsum, foil, airspace, and brick layers. The total area of the glass windows on living-room walls was 6.3 m2, and of those on bedroom external walls was 4.5 m2. Internal and adjacent walls were made of two 10 mm gypsum layers separated by a 100 mm airspace layer. The ceiling separating the roof space and the rooms was made of 10 mm gypsum and a layer of insulation having an R1.3 value. The roof consisted of 0.8 mm corrugated steel, 20 mm airspace, and a 0.6 mm thick GI sheet layer. The floor was made of stone, concrete, silencer, and insulation. All other main dimensions of the house are shown in Figure 2. In addition to internal shading devices (internal curtains), the windows were protected from direct sunlight by the eaves surrounding the upper part of the roof.

3.3. Room Set Point Temperature-Design Indoor Temperature

In a residential home conditioned by a refrigerative cooling system, the set-point temperature is based on the ASHARE/Fanger’s comfort chart [23]. For Australian homes, the Australian Institute of Refrigeration, Air Conditioning, and Heating (AIRAH) specifies the acceptable indoor-design temperature range of 22.5–26 °C while maintaining dew point at or below 13 °C [24]. Realising the different nature of evaporative cooling, Australian Standard AS 2913 Evaporative air-conditioning equipment [25] specifies 27.4 °C as the target indoor temperature.

4. Results and Discussion

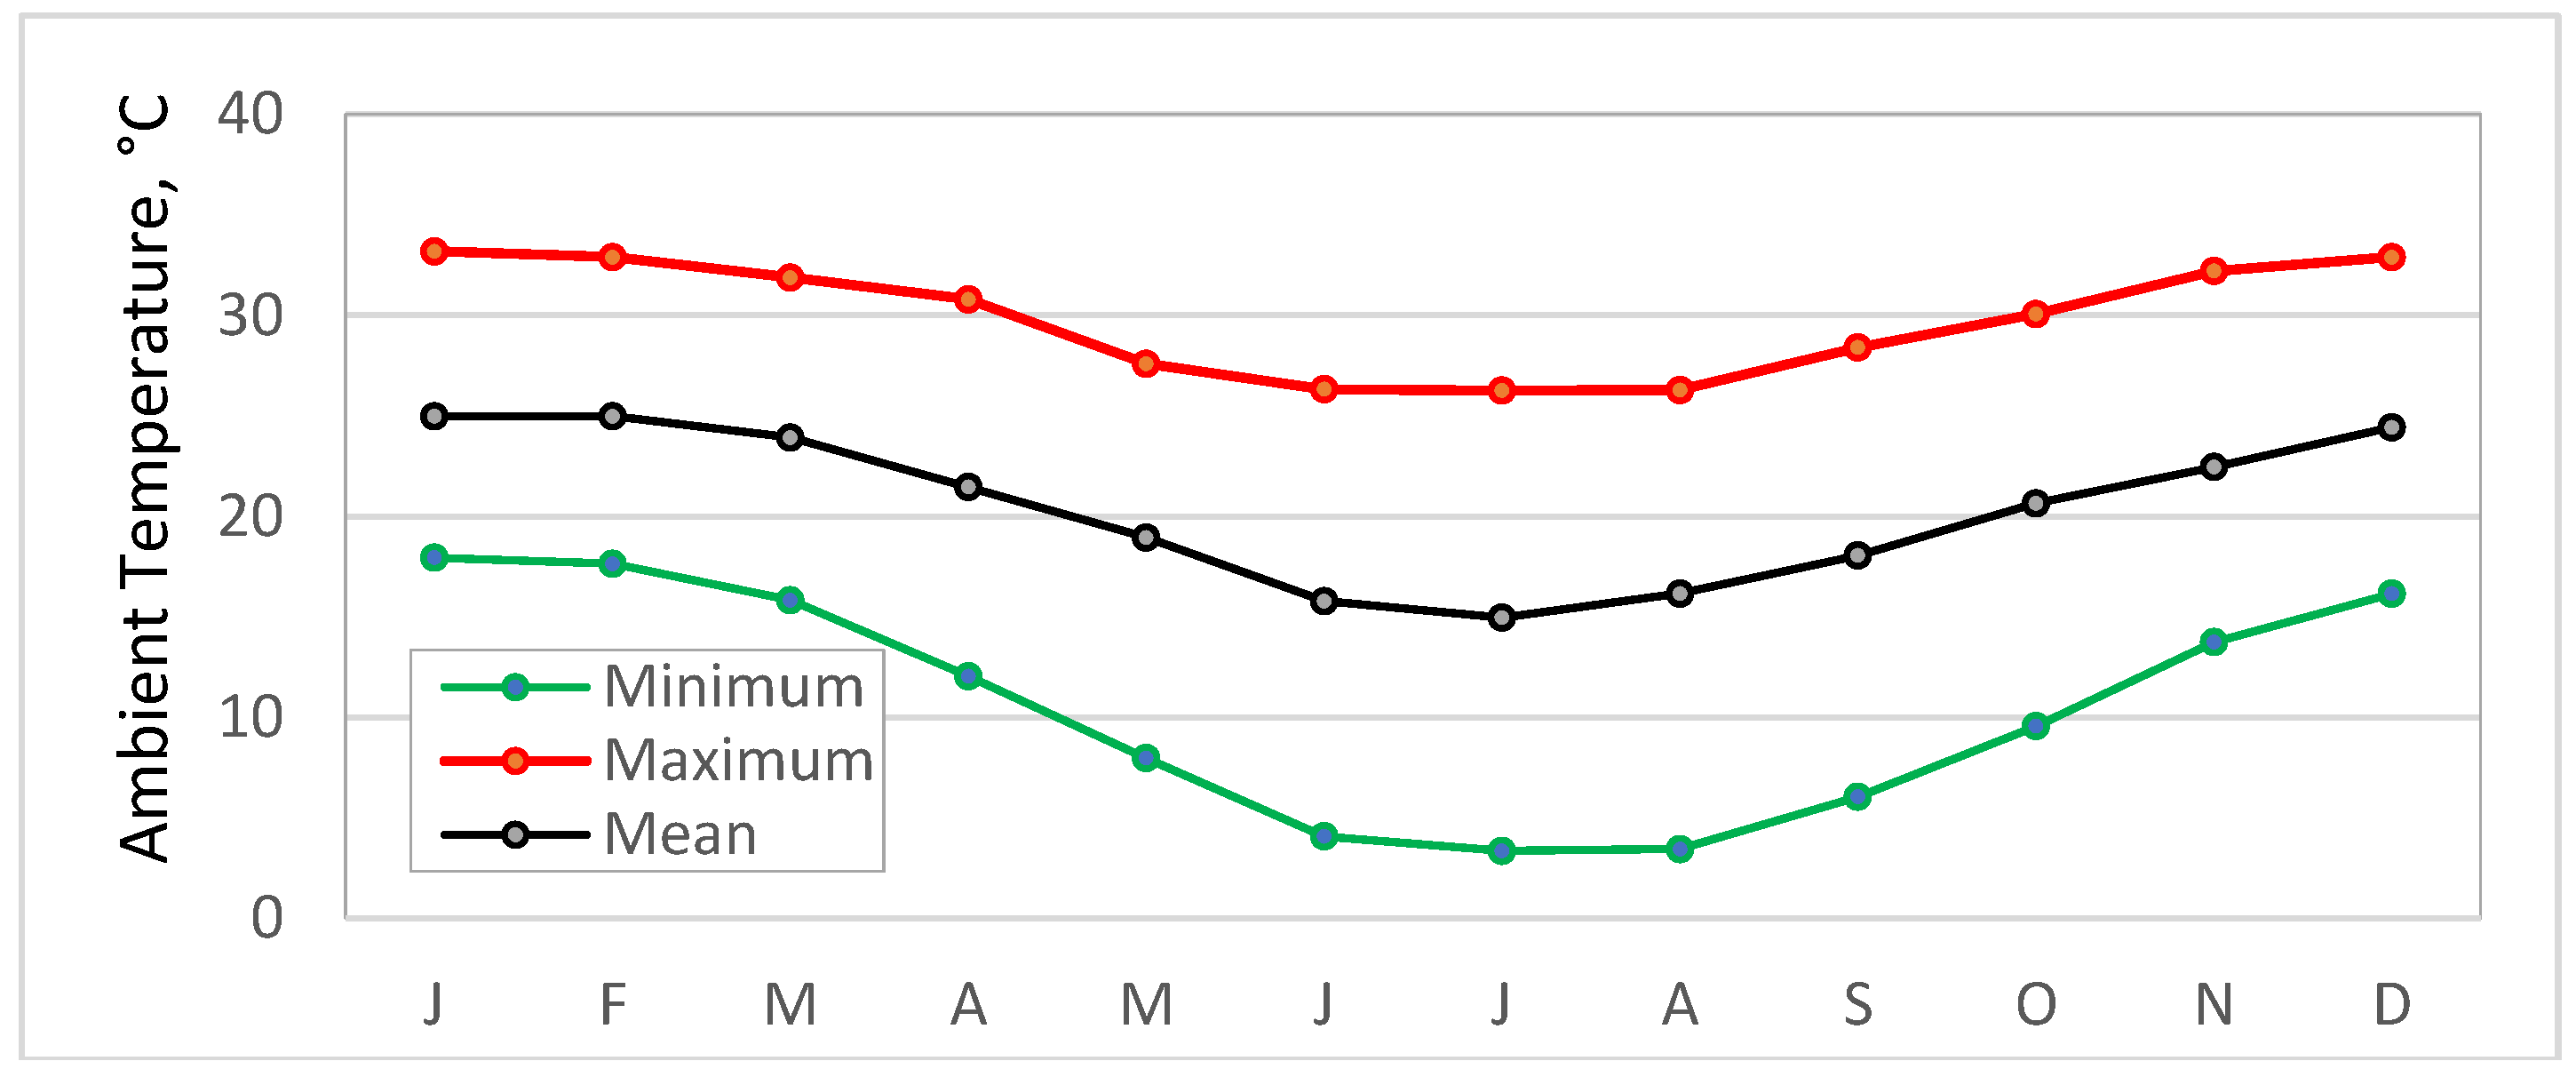
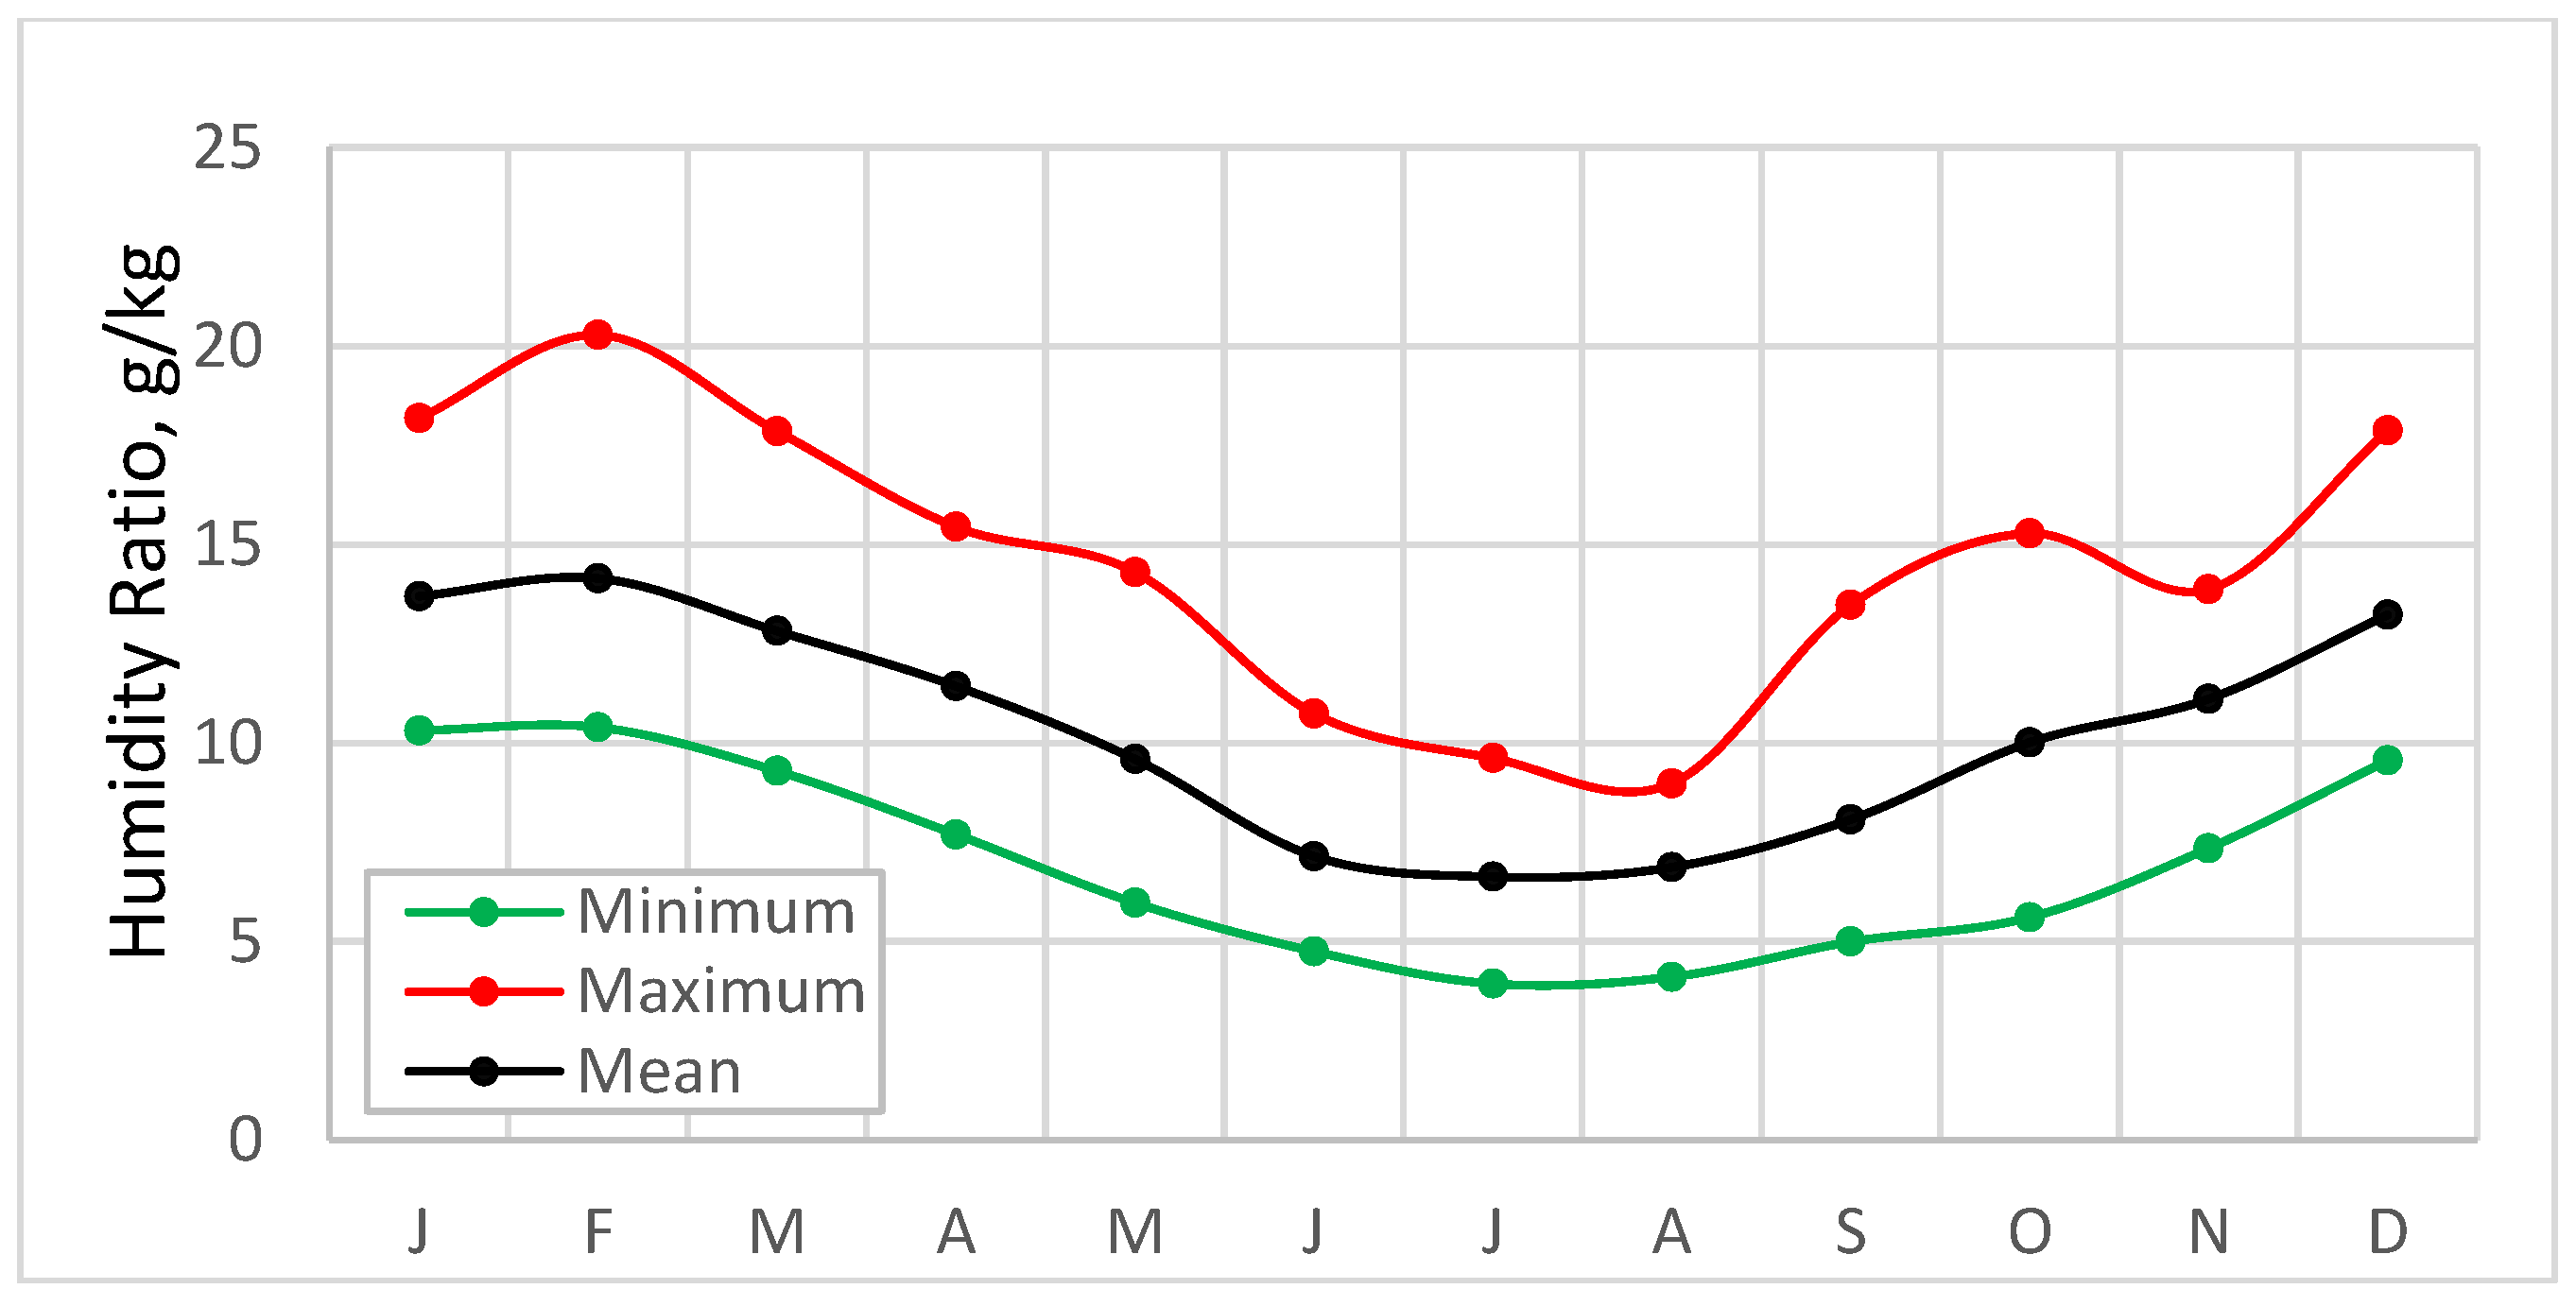
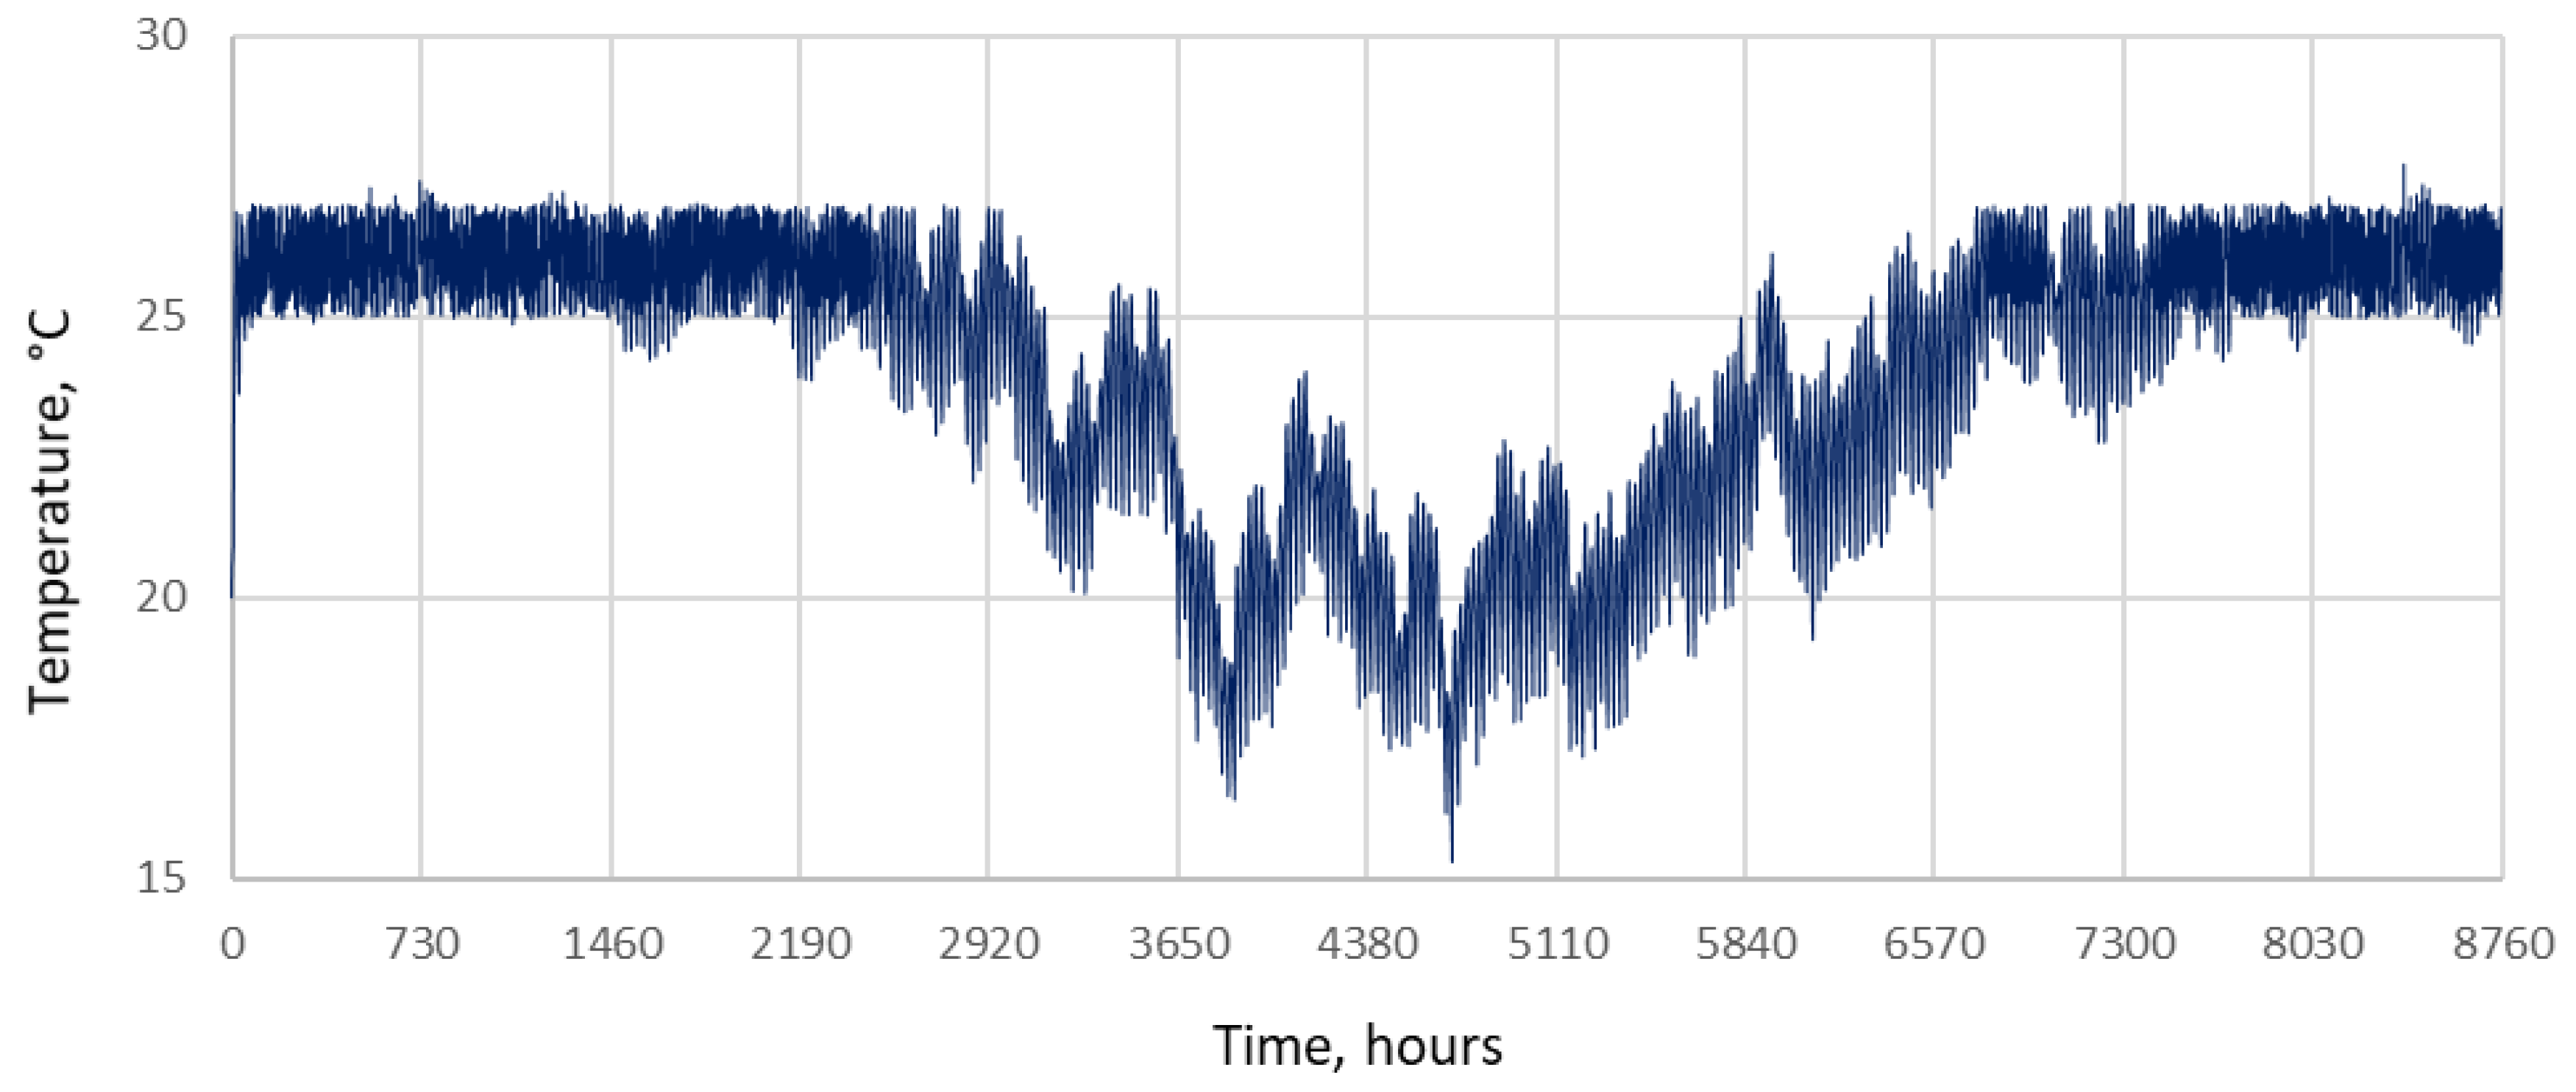
4.1. Temperature, Humidity, and Irradiance Profiles

According to TRNSYS weather data used in the model, Brisbane has an annual maximum temperature of 33.2 °C and a minimum temperature of 3.4 °C, with an annual mean of 20.5 °C, Figure 3. As expected, the maximum occurs during the four summer (or warmer) months of January, February, November, and December. Cooling can be expected to occur with less frequency during transition periods to and from winter. The winter months of May to August are practically free from cooling demand when some heating is needed. In terms of humidity, typical of subtropical climates, Brisbane is relatively dry, although some dehumidification is required during the summer months. The information processed from the TRNSYS weather data (Figure 3, Figure 4 and Figure 5) is very close to that reported in Reference [15].
Figure 6 shows the plot of the humidity ratio against the dry bulb temperature of air in Brisbane during the cooling months. As shown, the number of points where humidity ratios are below ASHRAE’s upper recommended value and that lie between 20–26 °C are quite significant. In such a situation, mechanical cooling is not required and, as discussed in Section 4.3.4, the economy cycle is not required, either. However, the same figure also shows that mechanical cooling is required for a significant number of hours during the cooling season.

4.2. Living-Room and Bedroom Temperature and Humidity Profiles

Living-room and bedroom temperature profiles are shown in Figure 7 and Figure 8. As shown, during the conditioning periods, temperature in both types of room stays at around the room-temperature set point of 26 °C (±0.5 K). The peaks in the profile indicate the temperatures where the zone (bedroom) is not conditioned.
It is worth noting that the peaking of the temperature profile of the bedrooms is much more pronounced than that of the living room. This is because the living zone, situated in the northern part, gets less sun exposure and it is conditioned during the whole day through to near midnight (7–23 h). On the other hand, the bed zone, situated in the southern part, gets more sun exposure during the day when it is not conditioned.

4.3. Cooling-Energy Demand

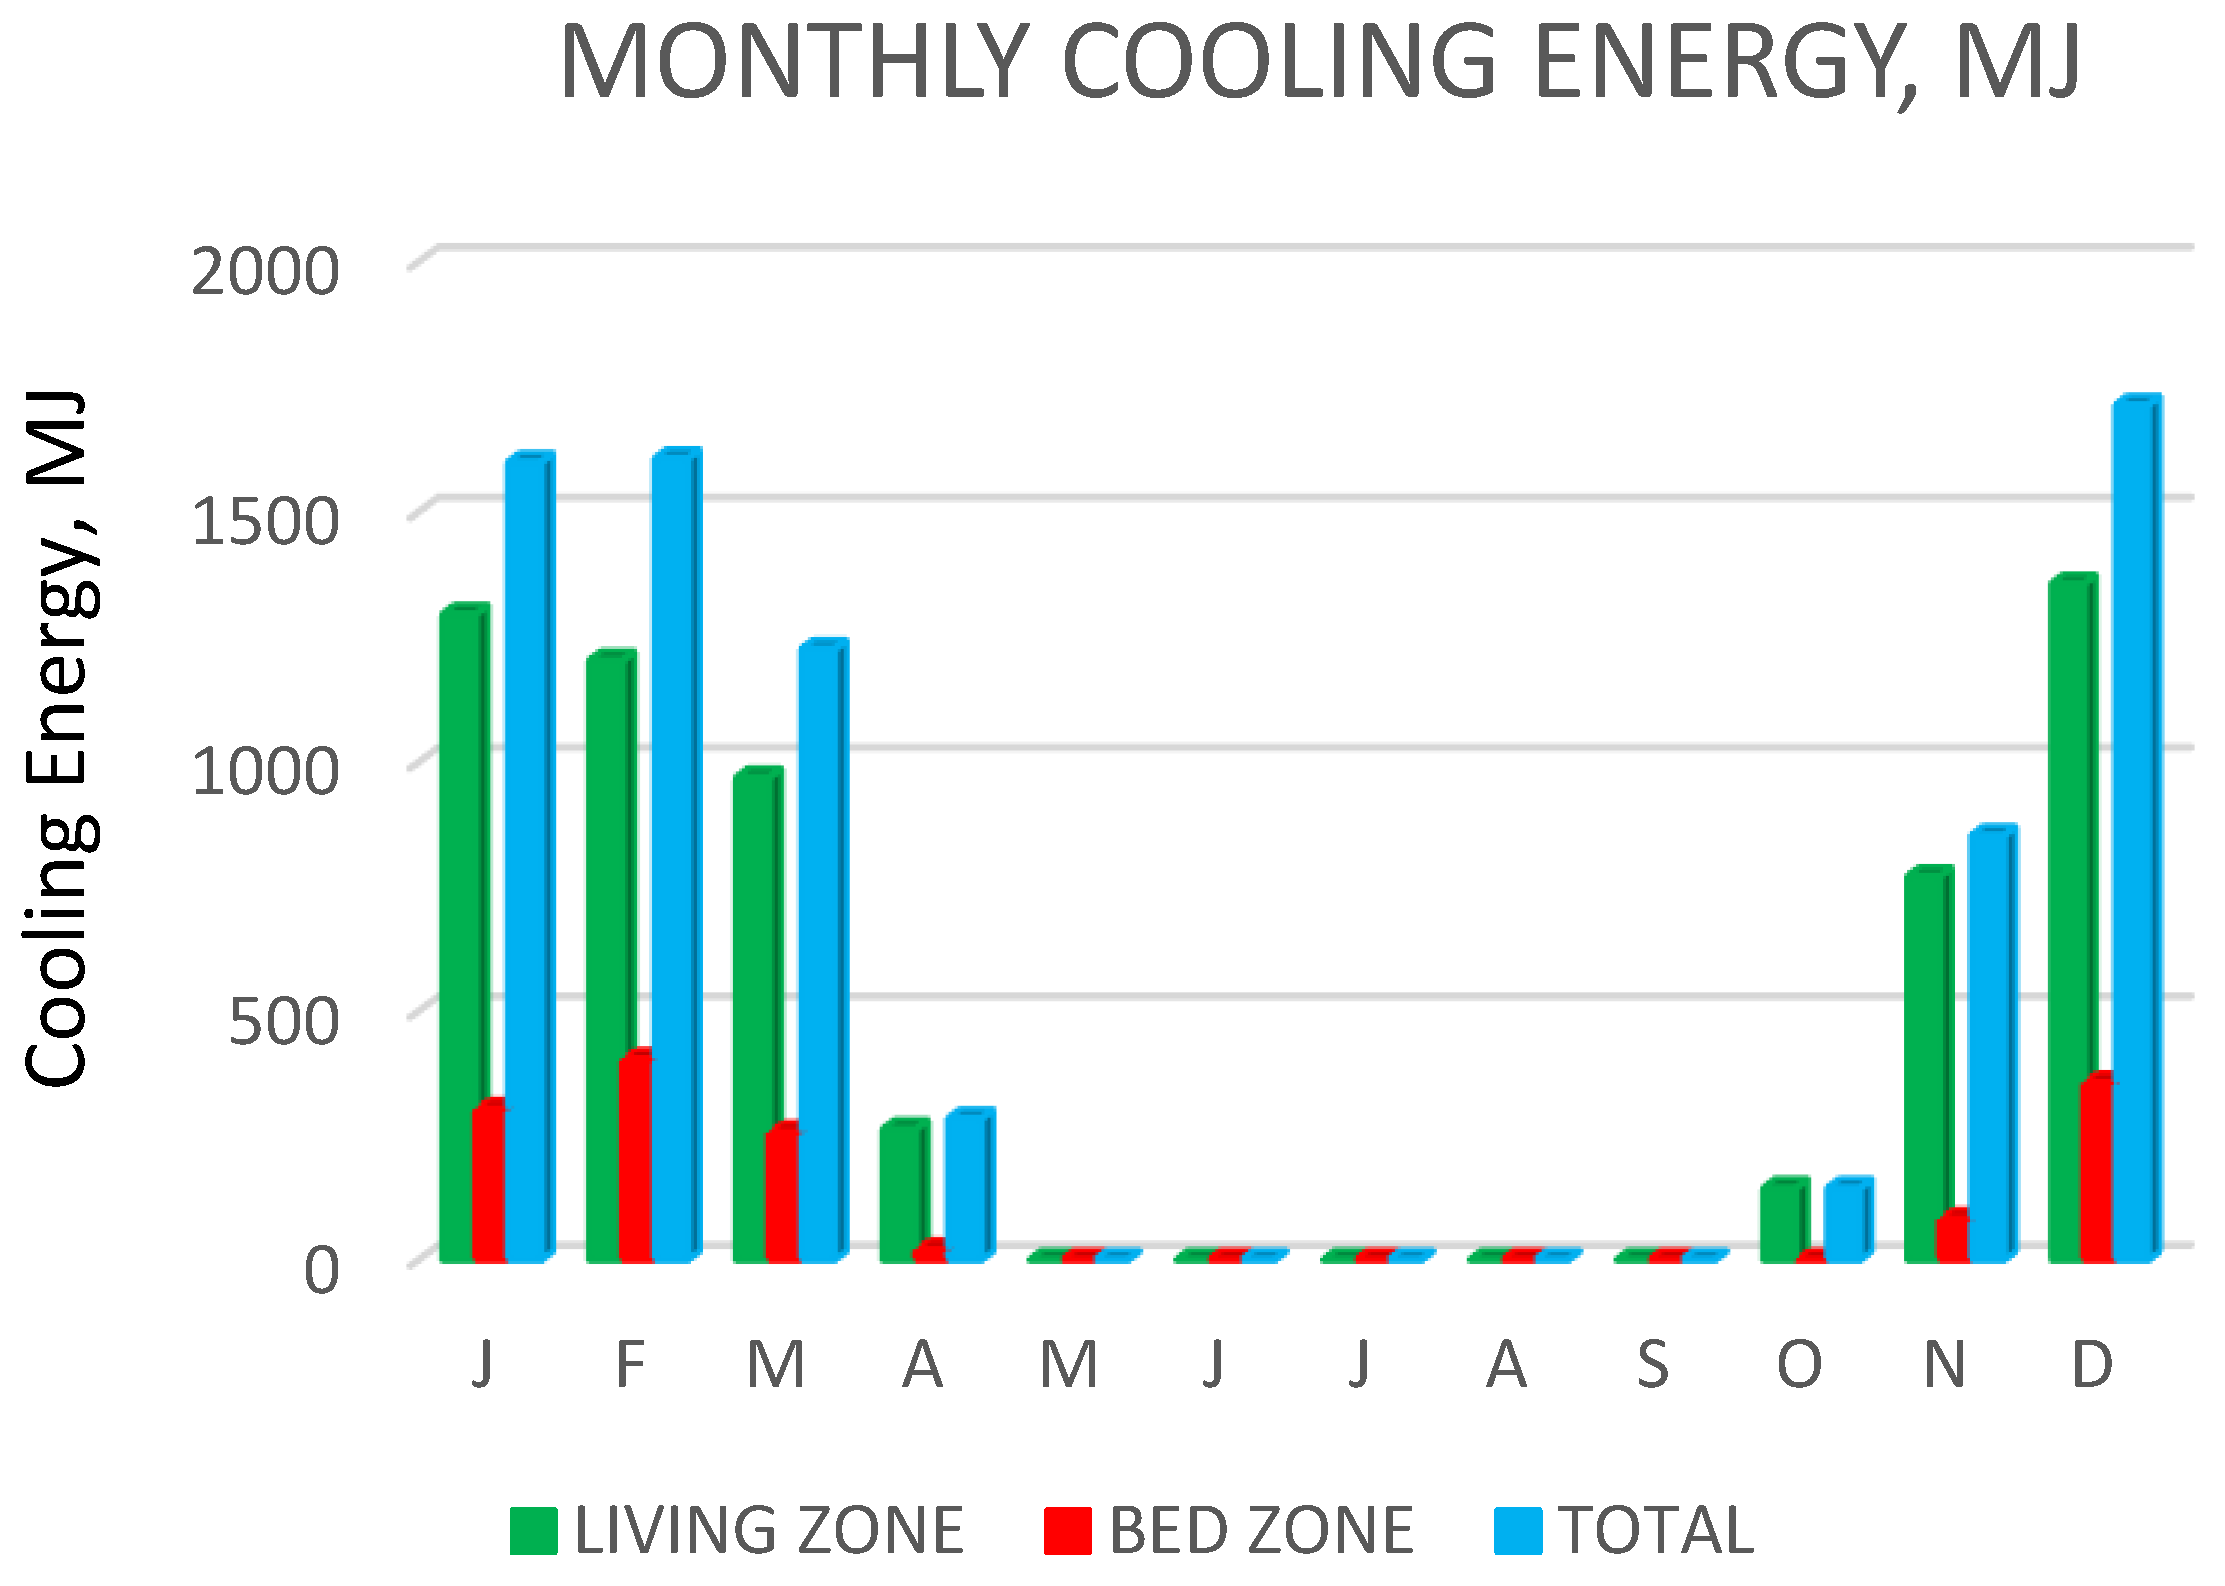
4.3.1. Cooling Demand During Normal Operation

Figure 9 shows the cooling-energy demands of the living room and bedrooms as well as the total cooling demand of the house with normal operation of the system (i.e., no use of economy cycle). As shown, the monthly cooling demand of the living room is twice as high as the monthly cooling demand of the bedrooms. This is understandable as the cooling demand of bedrooms occurs during night time, when heat gains are low. On the other hand, the cooling demand of the living room is high because of high heat gains during the day: radiation gain as well as the internal gains, such as the gain from the appliance operations.
It is also interesting to note that the latent energy demands for both zones are relatively low as shown in Figure 10. This confirms the previous brief/general observation in Section 4.1.

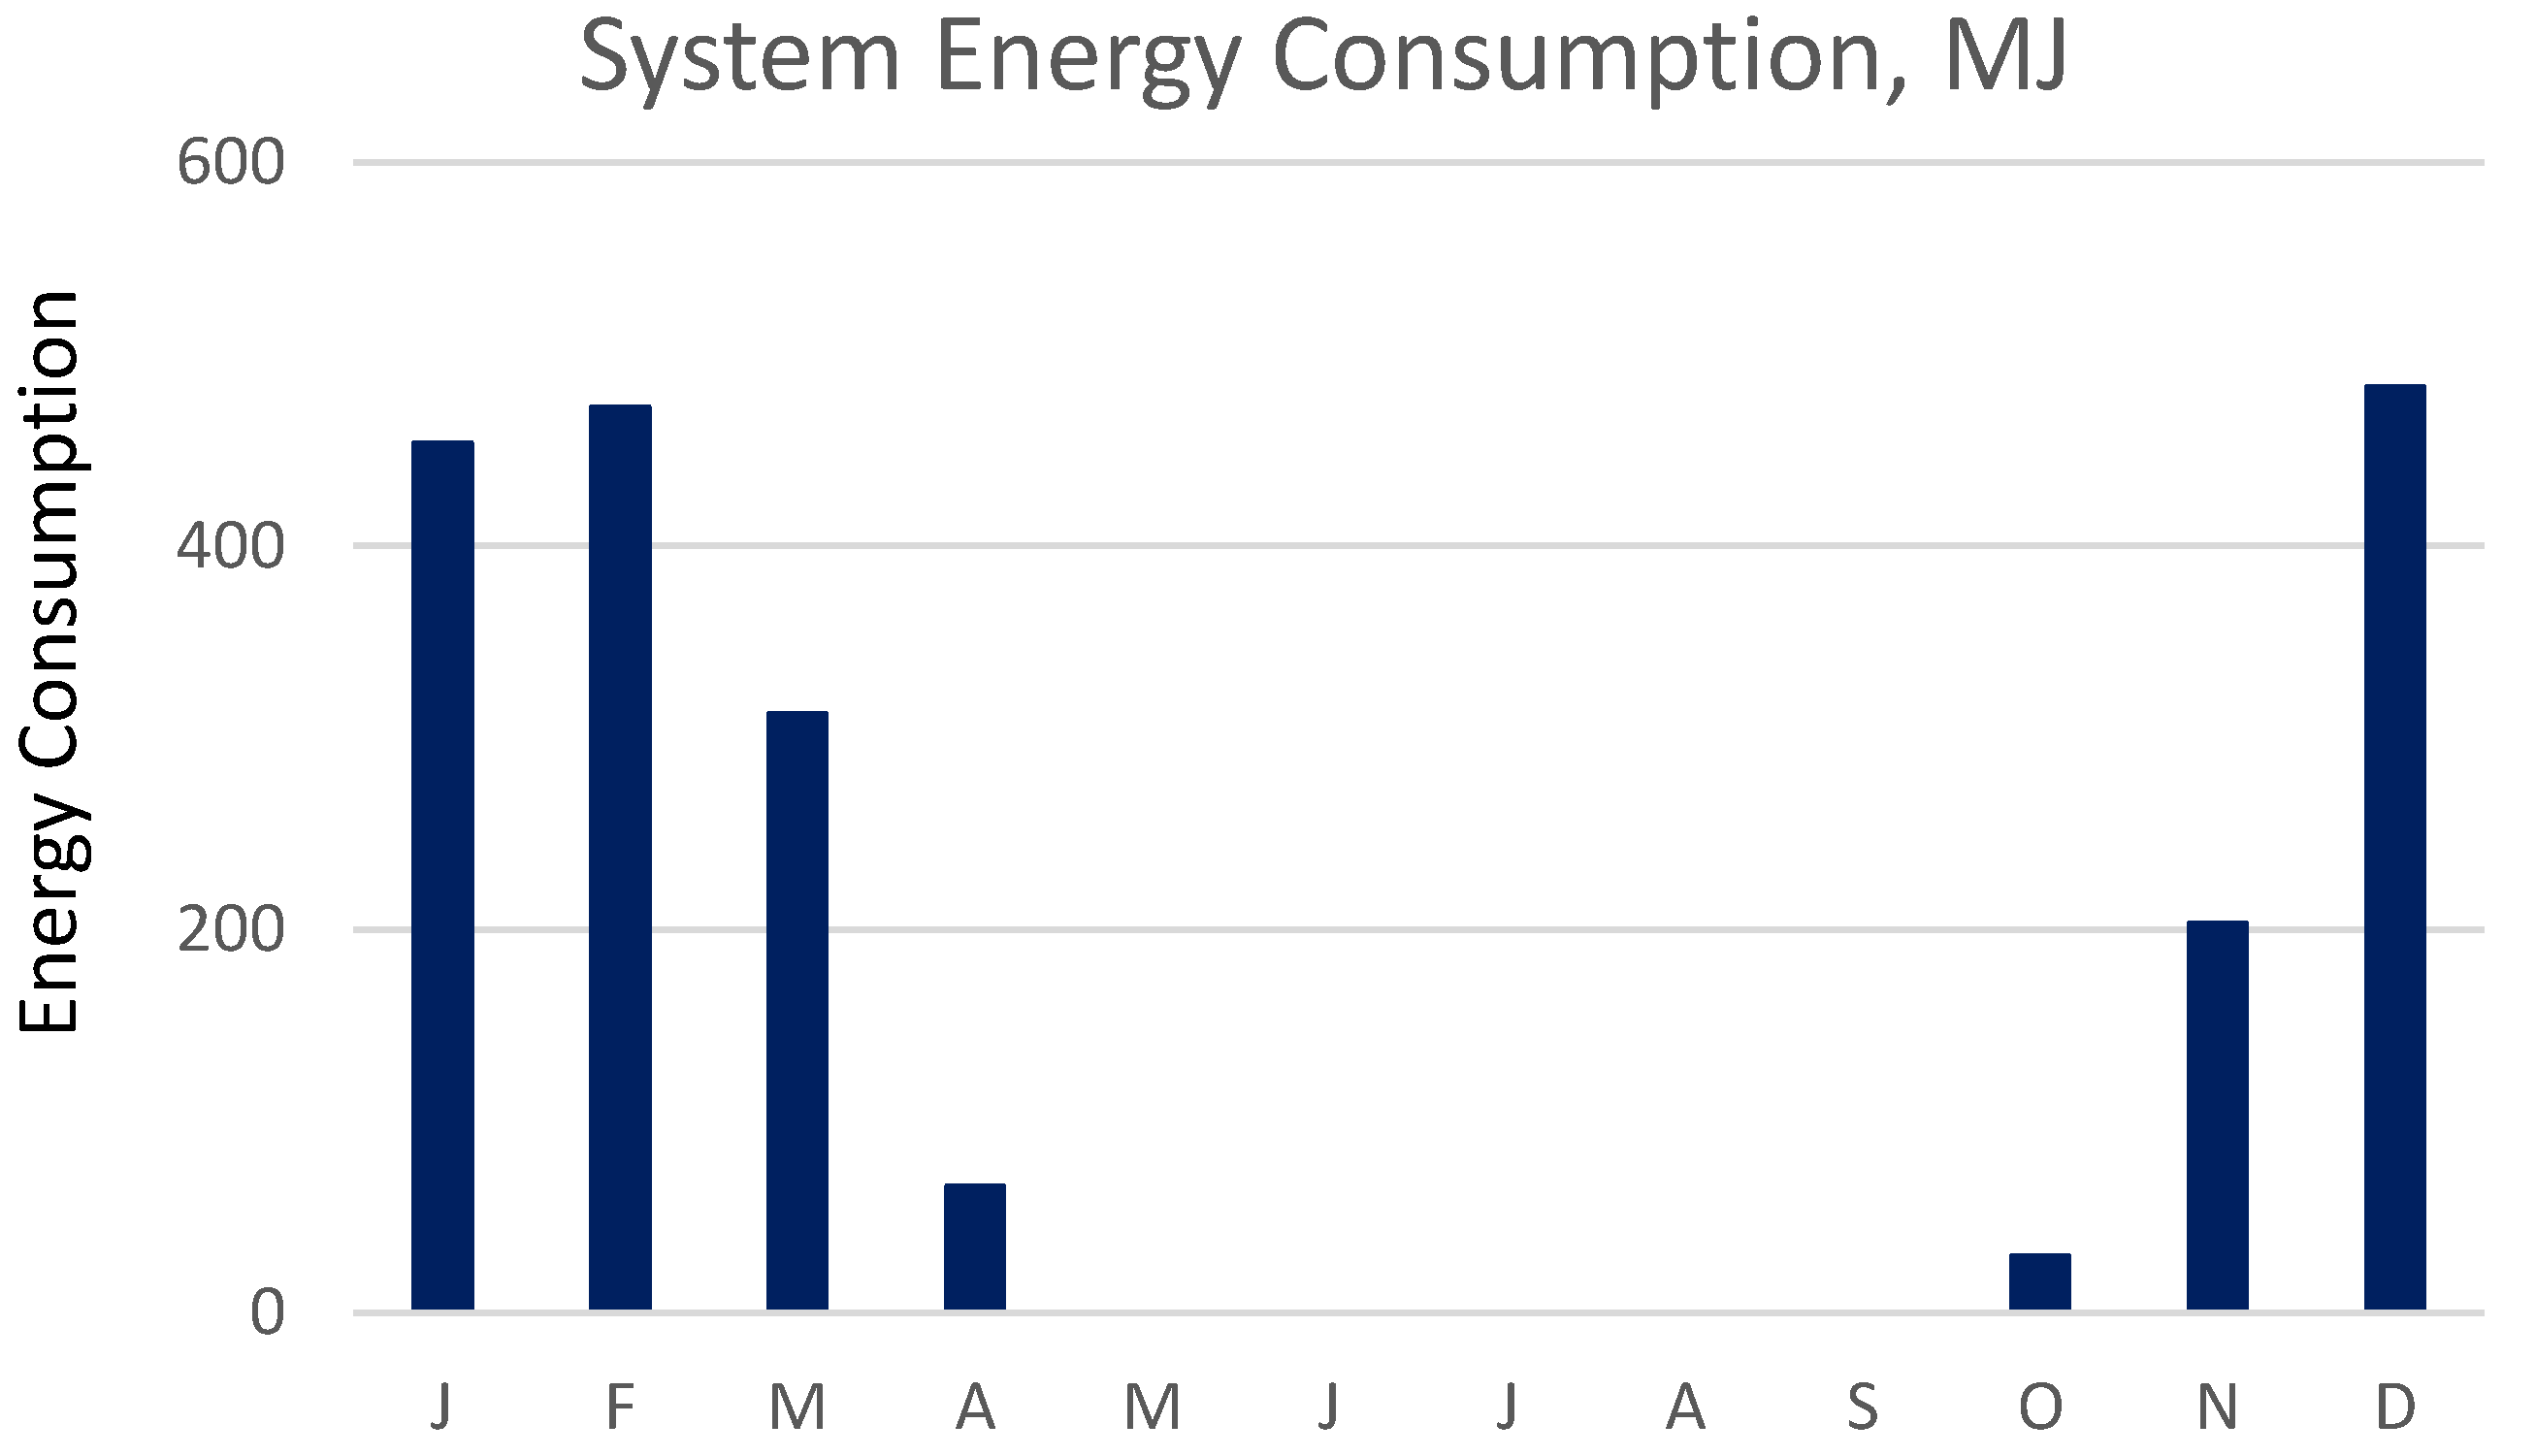
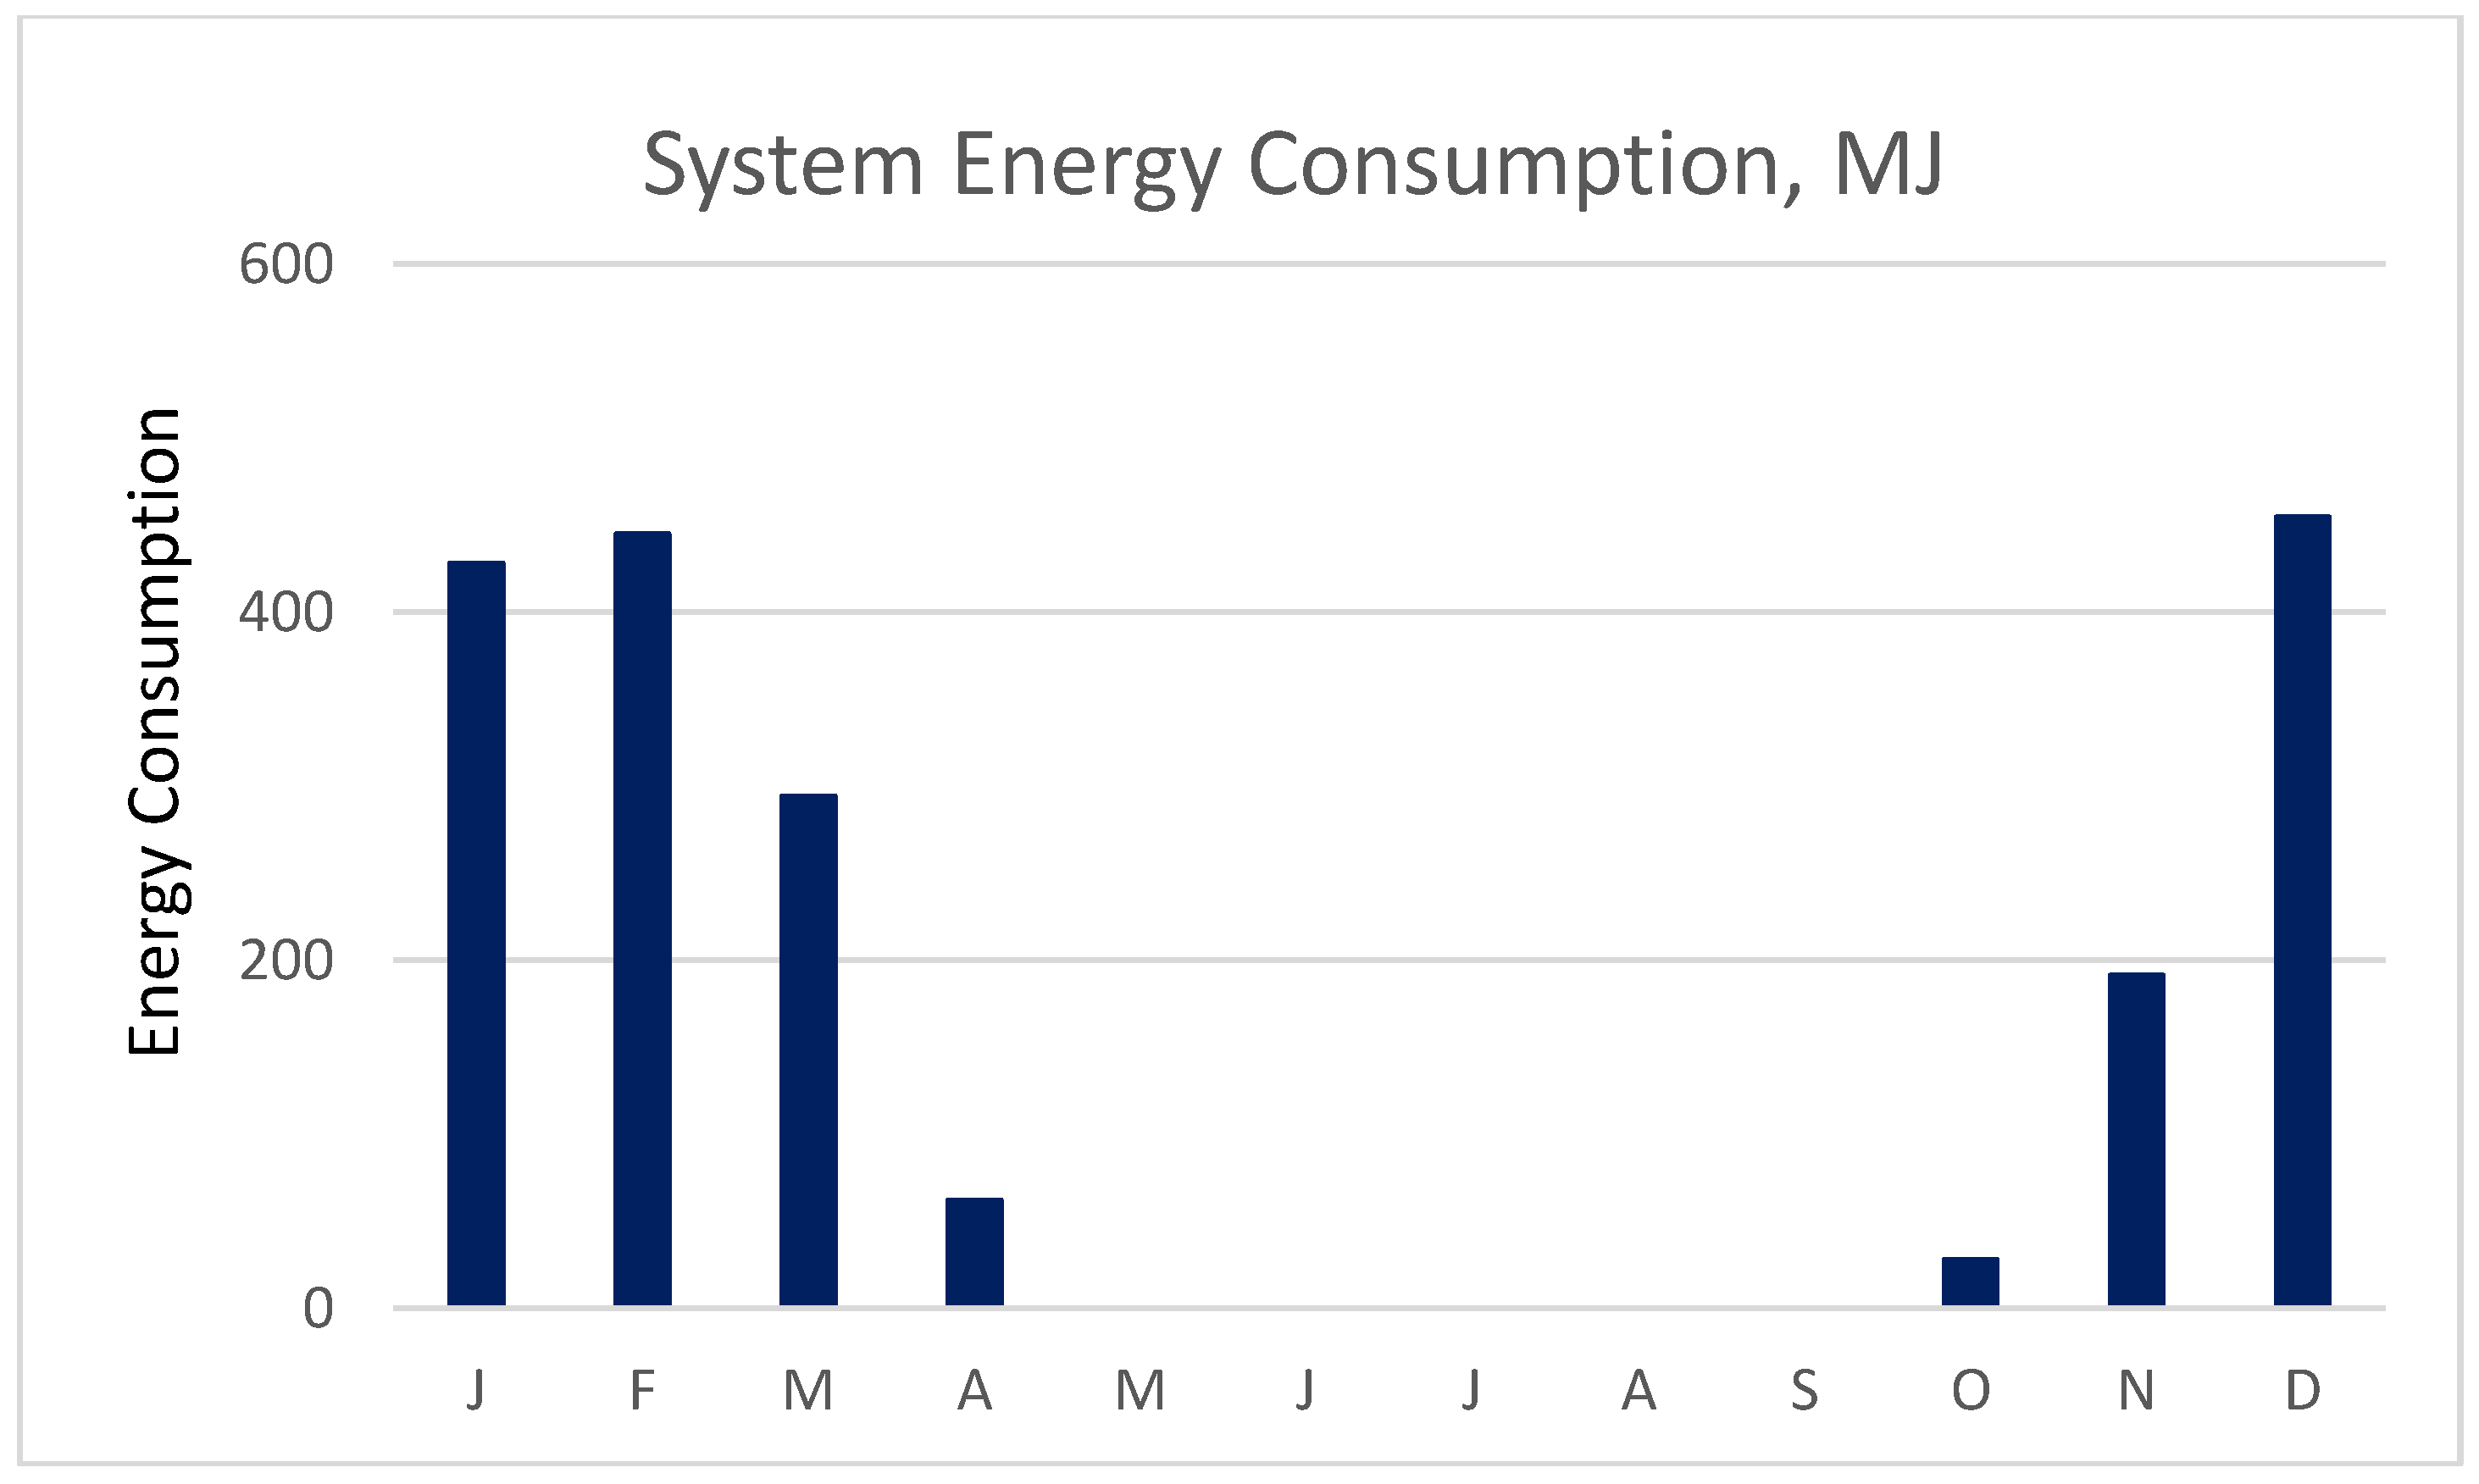
4.3.2. System’s Electrical Energy Consumption

In this research, it is assumed that the energy required for desiccant regeneration comes from nonelectrical sources, such as solar thermal or waste heat, although, during modeling, it was modeled using an electrical heater TYPE930. Therefore, the system’s electrical-energy consumption comes from the operation of the supply air fan, desiccant wheel, energy-recovery wheel, and evaporative coolers. Figure 11 show the monthly electrical-energy consumption of the system. On an annual basis, the performance coefficient of the system is around 4.0–4.9, which is comparable to the refrigerative cooling system. On a monthly basis, peak energy consumption occurs during the summer months of December, January, and February. This is expected, as high cooling demands occur during this period that require the system to work longer.
It should be stressed that the seemingly rather low COP of the system compared with the results of the recent studies for office buildings [16,17] can be caused by several factors, two of which are briefly discussed here, namely: the saturation efficiency of the evaporative cooler (TYPE506), and the sensible effectiveness of the energy-recovery wheel (TYPE760) used in the model. The saturation efficiency of the evaporative cooler dictates the air outlet temperature and relative humidity (or humidity ratio). For instance, the value of 0.85 typically used in the system evaluation [14] will give the outlet temperature of 16.5 °C from inlet temperature 27.1 °C, or a ΔT of 10.6 K across the evaporative cooler, but with an outlet humidity ratio of 9.6 g/kg. On the other hand, the effectiveness value of 0.65 gives a ΔT of 8.2 K with a lower humidity ratio of 8 g/kg. In other words, higher effectiveness results in higher ΔT (a desirable factor from a system-efficiency point of view), but with a higher outlet-humidity ration (an undesirable factor from a thermal-comfort standpoint). In short, higher effectiveness of the evaporative cooler results in a more efficient system but with more hours of humidity levels being pushed above the acceptable comfort boundary. The same can be said of the effectiveness of the energy-recovery wheel, which affects the inlet and outlet conditions of the evaporative cooler.

4.3.3. Humidity Levels in Air-Conditioned Spaces

Shown in Figure 12 and Figure 13 are plots of humidity ratio vs dry bulb temperature for living room and bedrooms, respectively, during the times of cooling demand while the system is operating. As shown, only for around 50% of cooling hours for the living room does the humidity ratio fall within the comfort boundary, i.e., below 12 g/kg dry air as recommended by ASHRAE [23] while the rest falls beyond the upper boundary. The upper value of humidity ratio is for the room expected to be conditioned by a conventional refrigerative system where the air velocity is below 0.1 m/s. In the room cooled by an evaporative cooling system, the cooling effect from higher room air velocity compensates for slightly higher humidity. However, although the system under study has an evaporative cooling component, its air conditioning (i.e., cooling and dehumidification) capability should be expected to be similar to conventional refrigerative systems. In Figure 13, the number of data plots is much less than that in Figure 12. This merely indicates that, during bed-time cooling, the number of hours where cooling is active is lower compared to that for the living room.

4.3.4. Impact of the Economy Cycle on Cooling Energy Consumption and Comfort

When temperature of the outside air is significantly less than the room temperature, and when outside humidity levels are acceptable, then the economy cycle can be considered for reducing the cooling energy provided to the conditioned space [26]. In this exercise, the economy-cycle control strategy is based solely on the temperature of the outside air. The use of humidity sensors in economy-cycle strategies is possible [26], but it may be impractical. In this case, the economy cycle is activated when the ambient temperature is 20 °C or below, as in Reference [26]. Figure 14 shows cooling-energy demands when the economy cycle of the system is activated. As shown, there is insignificant reduction of cooling-energy demand on a monthly and annual basis compared to the normal operation of the system. As expected, most (in fact: all) economy-mode occurs during the night when bedrooms are being conditioned.
The values shown in Figure 14, Figure 15 and Figure 16 are very much similar to those for normal cycle (Figure 9, Figure 10 and Figure 11) indicating insignificant impact of the economy-cycle operation.
Increasing the temperature when economy cycle is set from 20 to 22 °C results in insignificant reduction of system energy consumption, from 1902 to 1891 MJ p.a. (for 21 °C set point) and 1856 MJ p.a. (for 22 °C set point), respectively. On the other hand, this rise in economy-cycle set points results in the rooms’ humidity ratio being pushed much further beyond the upper limit prescribed by ASHRAE. Furthermore, anecdotal evidence shows that people sometimes opt to rely on natural ventilation by opening windows and/or doors when the ambient temperature is below 25–26 °C even if that means humidity is slightly or rather high. In such a case, economy-cycle consideration is no longer relevant.

5. Conclusions and Recommendations

The performance evaluation of a residential desiccant evaporative cooling system operating in the Brisbane climate zone was carried out using the TRNSYS modelling package. The following are the initial findings of the research:
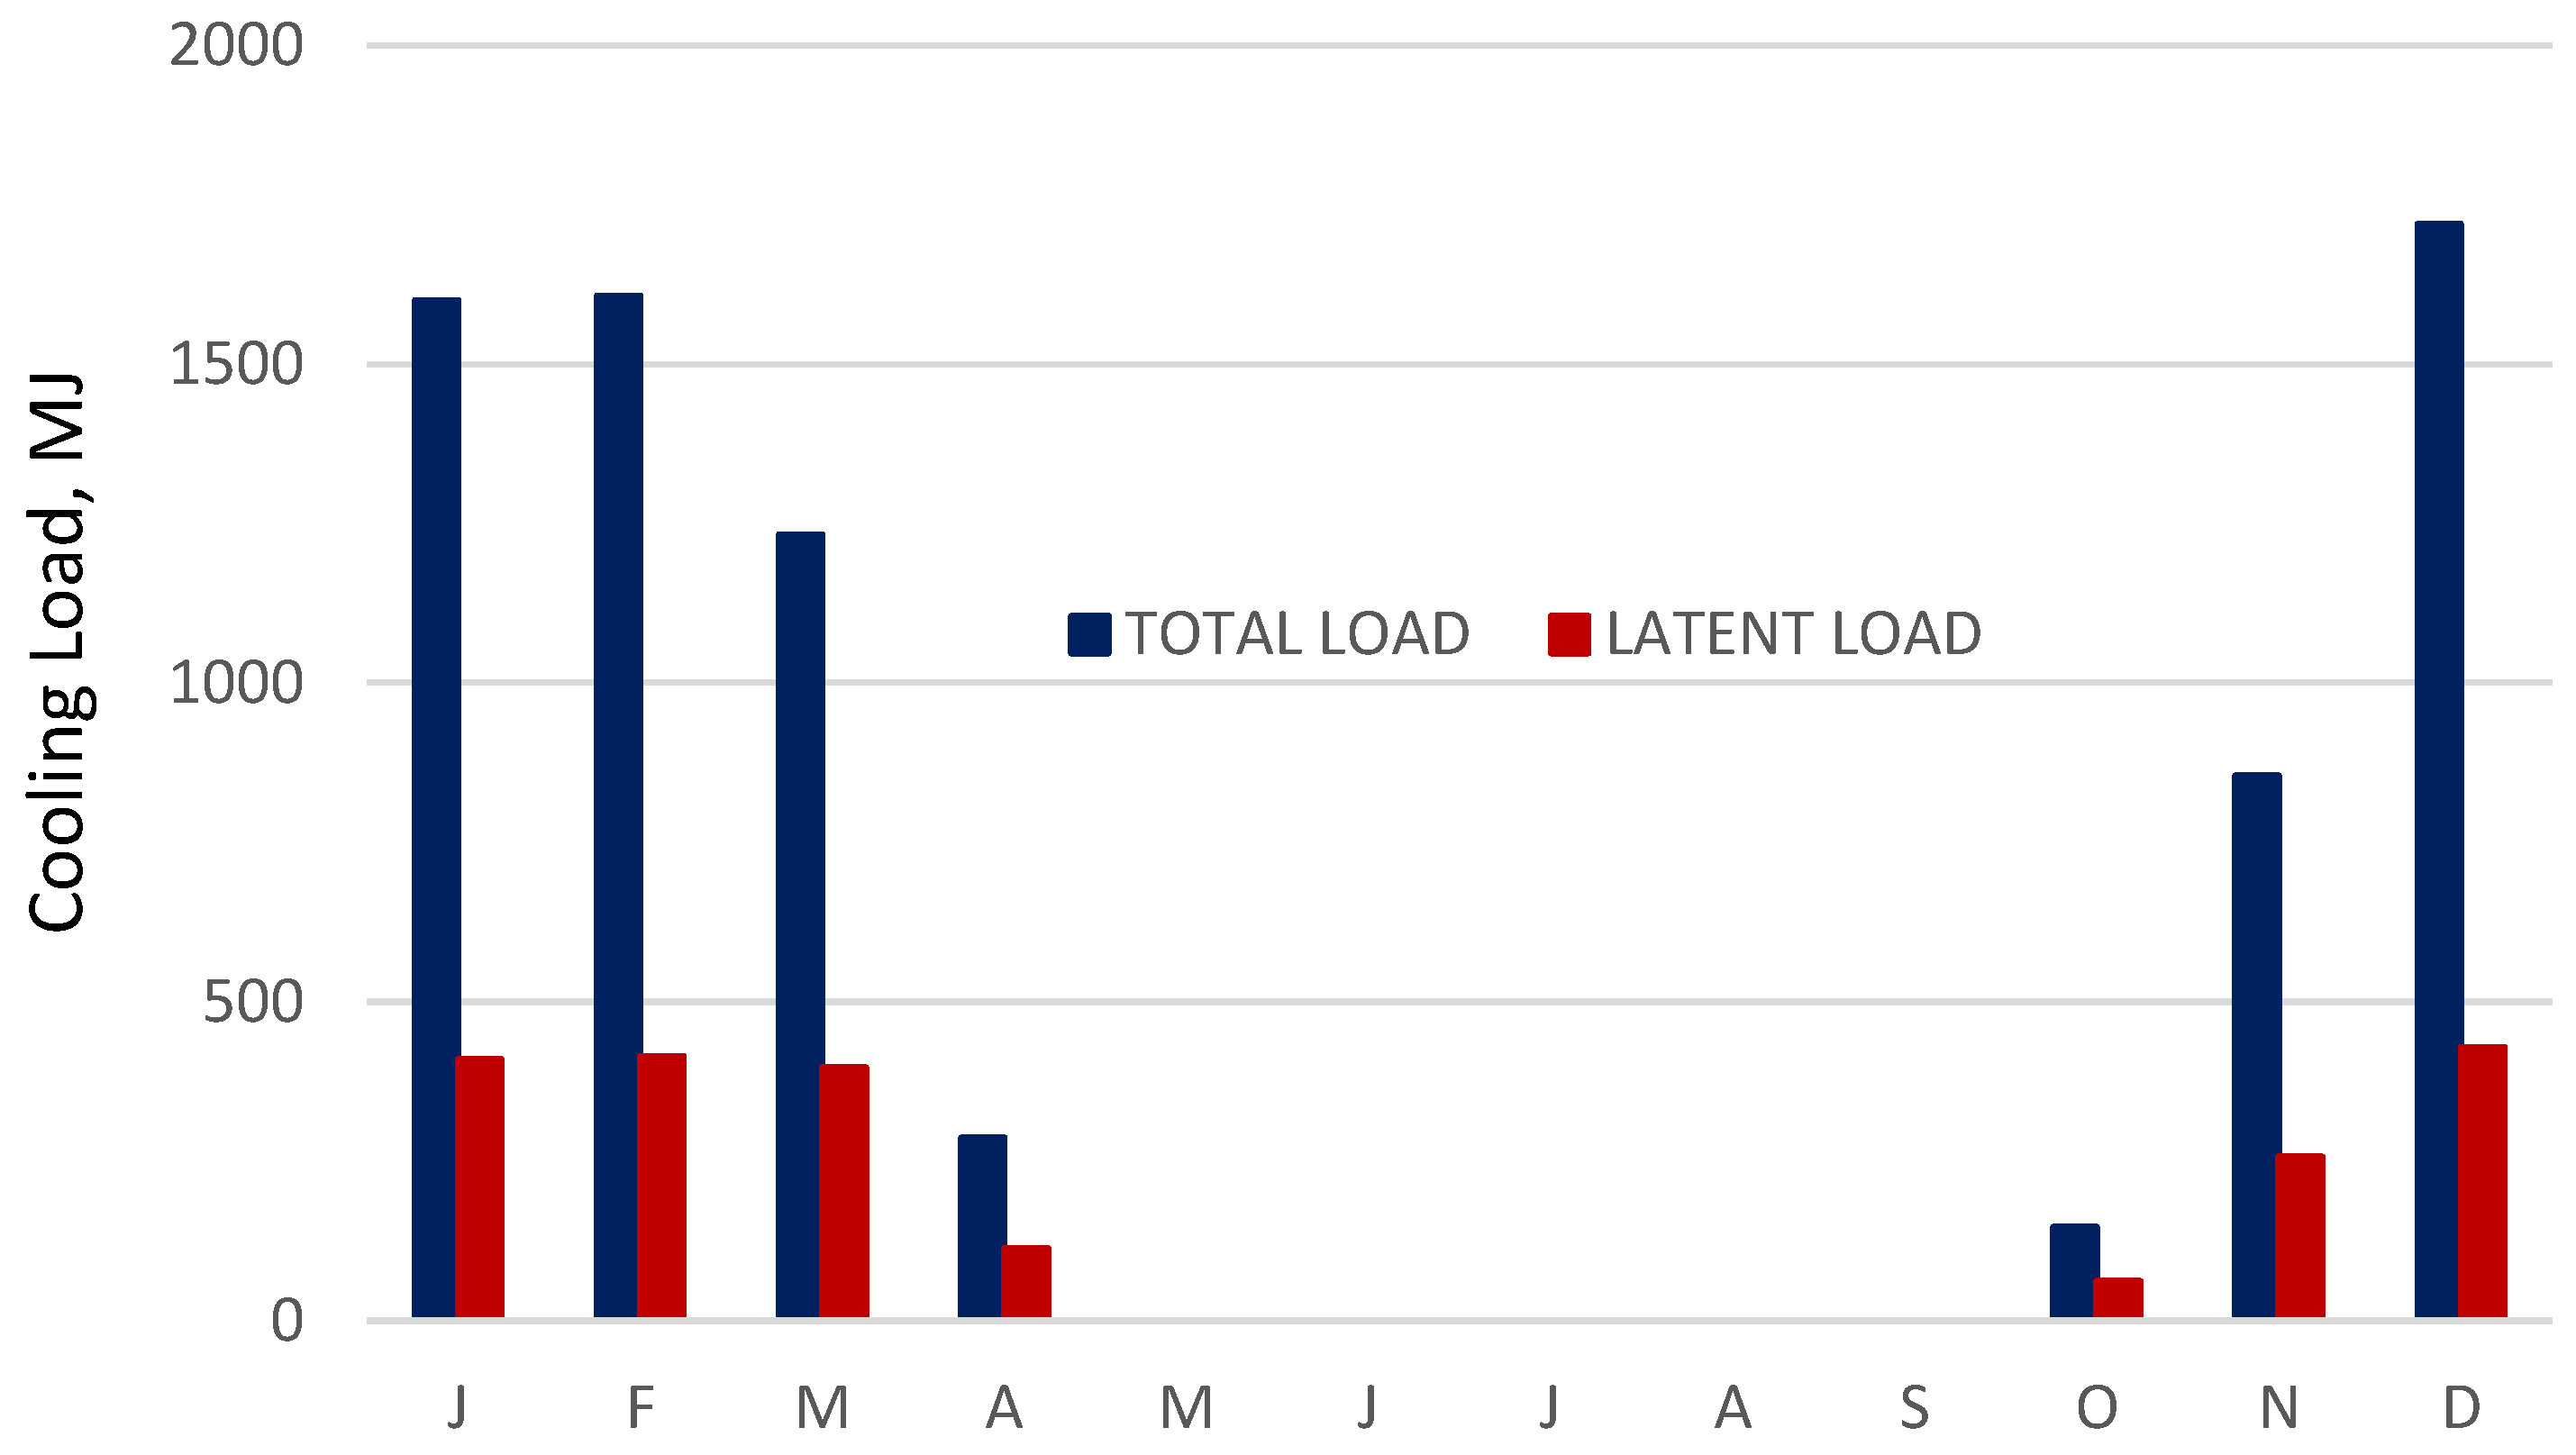
  • The study based on the TRNSYS supplied weather data, which seem confirmed by other observations, found that the sensible cooling demand is the predominant load, while the monthly latent load during the cooling periods represents about 20% of the total cooling load. This, however, is still significant in terms of providing comfort to the occupants of the house.
  • The number of hours where plots of humidity ratio vs. temperature are within the comfort zone during the cooling season are quite significant. During these hours, occupants can rely on the natural ventilation or economy cycle for thermal provision by allowing outside air entering the room though open windows or doors.
  • Likewise, the number of hours where plots of humidity ratio vs. temperature are outside the comfort zone during the cooling season are equally quite significant. During most of these hours, the proposed desiccant evaporative cooling system can technically provide thermal comfort, and its thermal performance is comparable to refrigerative cooling systems. Specifically, the following is the summary of the findings:
    -
    About half of the plots of temperature vs. humidity ratio during system operation fall beyond the upper acceptable boundary. The system’s capability to provide suitable temperature and humidity air levels supplied to the room is dependent on the performance of ‘exhaust components’ of the systems, namely, the evaporative cooling system, energy-recovery system, and heat-regeneration system.
    -
    The heat required to regenerate the desiccant on the exhaust side can be quite significant. Therefore, the availability of a cheap or waste-heat source is essential in making this system economically viable.
    -
    It is observed that the admission of some return air to the conditioned space, as normally practiced in conventional cooling systems to save energy, seems to have some, albeit limited, benefit in this system. This is because while the return air reduced the system’s burden on the supply side in terms of temperature and humidity, the exhaust side requires raising the temperature for regeneration purposes. In this particular study, the optimum ratio of return air and supply admitted to the room and that which returns to the exhaust side for treatment is 50:50.
    -
    For the Brisbane climate, the introduction of an economy cycle seems to not be very prospective since periods in which it is applicable are mostly at night, when people may be expected to opt for natural ventilation.
  • The values of some of the parameters can significantly affect system performance, especially the humidity level of the conditioned space. These include saturation effectiveness of the evaporative cooler and the energy-recovery device. The proper selection of these values should be considered in the design stage of the system.
The research scope presented in this paper is limited to analyzing the capability of the system to satisfy the sensible and latent demands of the house being modeled.

Author Contributions

R.N. initiated the project and developed the initial TRNSYS model. E.H. assisted in the detailed development of the TRNSYS model and provided inputs and analysis based on the model outcomes. S.J. provided general inputs and comments for the manuscript.

Funding

The APC was funded by Central Queensland University.

Acknowledgments

Funding for this project was provided by CQ University. The authors also acknowledge the constructive comments on the manuscript of Stephen White of the Commonwealth Scientific and Industrial Research Organisation (CSIRO).

Conflicts of Interest

The authors declare no conflict of interest.

References

  1. Kohlenbach, P.; Dennis, M. Solar Cooling in Australia: The Future of Air Conditioning? Ecolibrium 2010, 12, 32–38. [Google Scholar]
  2. Narayanan, R. Developmnet of a Thermally-Driven Solid Desiccnat System for Dehumidification Cooling. Ph.D. Thesis, University of South Australia, Adelaide, Australia, 2012. [Google Scholar]
  3. Saman, W.; Halawa, E. NATHERS-Peak Load Performance Module Research; Institute of Sustainable Systems and Technologies: Adelaide, Australia, 2009. [Google Scholar]
  4. Piccolo, A.; Siclari, R.; Rando, F.; Cannistraro, M. Comparative Performance of Thermoacoustic Heat Exchanges with Different Pore Geometries in Oscillatory Flow. Implementation of Experimental Techniques. Appl. Sci. 2017, 7, 784. [Google Scholar] [CrossRef]
  5. American Society of Heating Refrigerating and Air-Conditioning Engineers. Green Guide-Design, Construction and Operation of Sustainable Buildings; American Society of Heating, Refrigerating and Air-Conditioning Engineers: New York City, NY, USA, 2010. [Google Scholar]
  6. Henning, H.M. Solar assisted air conditioning of buildings—An overview. Appl. Therm. Eng. 2007, 27, 1734–1749. [Google Scholar] [CrossRef]
  7. Narayanan, R.; Saman, W.Y.; White, S.D.; Goldsworthy, M. Comparative study of different desiccant wheel designs. Appl. Therm. Eng. 2011, 31, 1613–1620. [Google Scholar] [CrossRef]
  8. Narayanan, R. Heat-Driven Cooling Technologies. In The Clean Energy for Sustainable Development: Comparisons and Contrasts of New Approaches; Elsevier: London, UK, 2017; Chapter 7; pp. 191–212. [Google Scholar]
  9. Narayanan, R.; Saman, W.Y.; White, S.D.; Goldsworthy, M. Modeling and Parametric Analysis of Silica-gel Desiccant Wheels. In Proceedings of the International Institute of Refrigeration Gustav Lorentzen Conference, Sydney, Australia, 12–14 April 2010. [Google Scholar]
  10. Balaras, C.A.; Grossman, G.; Henning, H.M.; Infante Ferreira, C.A.; Podesser, E.; Wang, L.; Wiemken, E. Solar air conditioning in Europe-An overview. Renew. Sustain. Energy Rev. 2007, 11, 299–314. [Google Scholar] [CrossRef]
  11. Narayanan, R. Investigation of geometry effects of channels of a silica-gel desiccant wheel. Energy Procedia 2017, 110, 20–25. [Google Scholar] [CrossRef]
  12. Saman, W.; Bruno, F.; Tay, S. Technical Research on Evaporative Air Conditioners and Feasibility of Rating and their Energy Performance; Technical Report for SA Department for Transport, Energy and Infrastructure: Adelaide, Australia, 2010. [Google Scholar]
  13. Parsons, R. Ashrae Handbook Fundamentals; American Society of Heating, Refrigerating and Air-Conditioning Engineers: Atlanta, GA, USA, 2005. [Google Scholar]
  14. Saman, W.; Bruno, F.; Liu, M. Technical Background Research on Evaporative Air Conditioners and Feasibility of Rating Their Water Consumption; University of South Australia: Adelaide, Australia, 2009. [Google Scholar]
  15. Brisbane, Queensland. Available online: http://www.weatherbase.com/weather/weather-summary.php3?s=87549&cityname=Brisbane,+Queensland,+Australia&units (accessed on 14 April 2018).
  16. Ma, Y.; Guan, L.; Brown, R. Techno-economic Analysis of a Solar Desiccant-Evaporative Cooling System with Different Collector Types for Australian Office Buildings. In Proceedings of the 2015 Asia-Pacific Solar Research Conference, Sydney, Australia, 4–6 December 2015. [Google Scholar]
  17. Ma, Y.; Saha, S.C.; Miller, W.; Guan, L. Comparison of Different Solar-Assisted Air Conditioning Systems for Australian Office Buildings. Energies 2017, 10, 1463. [Google Scholar] [CrossRef]
  18. Narayanan, R.; Saman, W.; White, S.D. A non-adiabatic desiccant wheel: Modeling and experimental validation. Appl. Therm. Eng. 2013, 61, 178–185. [Google Scholar] [CrossRef]
  19. A Transient Systems Simulation Program. Available online: http://sel.me.wisc.edu/trnsys (accessed on 22 September 2018).
  20. Delsante, A.E. Computer User Manual for Program Cheetah: A Thermal Design Tool for Small Buildings; Commonwealth Scientific and Industrial Research Organisation: Canberra, Australia, 1987. [Google Scholar]
  21. Vakilaltojjar, S.M. Phase Change Thermal Storage System for Space Heating and Cooling. Ph.D. Thesis, University of South Australia, Adelaide, Australia, 2012. [Google Scholar]
  22. Halawa, E. Thermal Performance Analysis of a Roof Integrated Solar Heating System Incorporating Phase Change Thermal Storage. Ph.D. Thesis, University of South Australia, Adelaide, Australia, 2005. [Google Scholar]
  23. ASHRAE Inc. ANSI/ASHRAE Standard 55, Thermal Environmental Conditions for Human Occupancy; ASHRAE Inc.: Atlanta, GE, USA, 2010. [Google Scholar]
  24. The Australian Institute of Refrigeration Air Conditioning and Heating. Design Guide DA20 Humid Tropical Air Conditioning; The Australian Institute of Refrigeration Air Conditioning and Heating: Melbourne, Australia, 2017. [Google Scholar]
  25. AS 2913-2000: Evaporative Air Conditioning Equipment–Standards Australia. Available online: https://www.saiglobal.com/PDFTemp/Previews/OSH/as/as2000/2900/2913.pdf (accessed on 20 September 2018).
  26. Skills Workshop—HVAC and R Optimisation—Ventilation and airflow, Part 1 of 2—VAC and R Nation. Available online: www.hvacrnation.com.au (accessed on 22 September 2015).
Figure 1. Solid-desiccant evaporative cooling system. A: desiccant wheel, B: energy-recovery wheel, C and D: evaporative cooler, E: regeneration source.
Energies 11 02574 g001
Figure 2. A reference house based on Reference [20].
Energies 11 02574 g002
Figure 3. Monthly ambient temperature profiles.
Energies 11 02574 g003
Figure 4. Monthly relative humidity profiles.
Energies 11 02574 g004
Figure 5. Monthly humidity ratio profiles.
Energies 11 02574 g005
Figure 6. Air-humidity ratio vs. ambient temperature for cooling months.
Energies 11 02574 g006
Figure 7. Living room temperature profile.
Energies 11 02574 g007
Figure 8. Bedroom temperature profile.
Energies 11 02574 g008
Figure 9. Monthly cooling energy for living room and bedrooms, and the total (normal operation).
Energies 11 02574 g009
Figure 10. Monthly total and latent cooling demands for the house (normal operation).
Energies 11 02574 g010
Figure 11. Electrical-energy consumption of the cooling system.
Energies 11 02574 g011
Figure 12. Temperature vs.humidity ratio—living room.
Energies 11 02574 g012
Figure 13. Temperature vs humidity ratio-bedrooms.
Energies 11 02574 g013
Figure 14. Monthly cooling energy for living room and bedrooms, and the total (economy-cycle mode).
Energies 11 02574 g014
Figure 15. Monthly total and latent cooling demands for the house (economy cycle mode).
Energies 11 02574 g015
Figure 16. Electrical-energy consumption of the cooling system during economy-cycle mode.
Energies 11 02574 g016
Table 1. Typical air-temperature and humidity levels at the inlet and outlet of each component of solid-desiccant evaporative air-cooling (SDEAC) system whose configuration is shown in Figure 1. DW: Desiccant wheel, ERW: Energy-recovery wheel, DEC: Direct evaporative cooler, REG: Regenerator.
°C35 53 27 20Temp
DWERWDECSup. Side
g/kg11 6 6 8.5Humidity Ratio
°C48 75 45 20 27Temp
DWREGERWDEExhaust
g/kg19 13 13 13 11Hum

