Article

On the Potential of Power Generation from Thermoelectric Generators in Gas Turbine Combustors

by
Panagiotis Stathopoulos
* and
Javier Fernàndez-Villa
Hermann Föttinger Institute, Technische Universität Berlin, Müller Breslau Str. 8, 10623 Berlin, Germany
*
Author to whom correspondence should be addressed.
Energies 2018, 11(10), 2769; https://doi.org/10.3390/en11102769
Submission received: 24 September 2018 / Revised: 2 October 2018 / Accepted: 10 October 2018 / Published: 16 October 2018
(This article belongs to the Section I: Energy Fundamentals and Conversion)

Abstract

:
Thermoelectric generators (TEGs) offer an attractive power generation option. They have no moving parts, are robust and emit no pollutants. The current work explores the integration of high temperature TEGs in gas turbine combustors. The latter have a thermal shield at their inner surface to protect them against high temperatures. This is supplemented by convective and film cooling. This work studies the replacement of the thermal shield with high temperature TEGs and evaluates their techno-economic potential. A gas turbine model is developed and validated to compute the fuel and air flow rate in the combustion chamber. A heat transfer model is subsequently implemented to compute the temperature distribution inside the combustor wall, on which the TEG is constructed. The investment in TEGs is then analyzed for peaker, intermediate load and base load gas turbines. The work concludes with a sensitivity analysis of the investment economic performance. It is concluded that, despite the low power generation, the installation of TEGs makes economic sense, even if their price becomes 50% higher than current estimations. It is also concluded that electricity prices have a much stronger effect on the economic viability of the investment than the price of the generators.

1. Introduction

Thermoelectric generators (TEGs) operate in a manner very similar to thermocouples, but have a much higher Seebeck coefficient and factor of merit. Typically, a thermoelectric module consists of a positive (p) and a negative (n) leg of different (or the same) thermoelectric materials connected electrically in series and thermally in parallel. The two legs are fixed between two plates that provide mechanical robustness and electric insulation from the environment [1]. This material is in most cases a ceramic or a polymer, for high or low temperature applications, respectively [2]. TEGs offer a very attractive power generation option. They have no moving parts, are very robust and reliable and, depending on the application, they emit no gaseous pollutants. Despite these advantages, the use of rare, sometimes toxic and expensive materials for their production, their high installation costs and their low heat-to-electricity efficiency limit their practical applications [3,4]. The most prevalent application has been in space exploration, where radioisotope thermoelectric generators have been the main electricity providers of deep space probes [5]. In recent years, several pilot and demonstration activities in other fields have been presented. The automotive industry has been particularly interested in harvesting power from the exhaust heat of engines [5]. The combination of thermoelectric generators with renewable energy sources, in particular geothermal and concentrated solar, has been another very active field [6].
Intensive research and development on thermoelectric materials have led to a continuous increase of their efficiency, while at the same time reducing the use of toxic and rare materials. Especially in the field of high temperature materials, the developments in thermoelectric oxides and silicides are quite promising [7]. This also motivated recent efforts to integrate thermoelectric generators in various combustion chambers, be it in residential heating [8], waste incineration facilities [9] or steam generators [10].
Despite these efforts, studies on the combination of thermoelectric generators with gas turbines have been rare. TEGs have been mostly considered as a bottoming system that makes use of the exhaust heat of gas turbines [11]. However, their low efficiency and relative high installation costs makes competition against conventional combined cycles less favorable. Other researchers have studied theoretically a system that operates as a topping cycle for gas turbines [12,13]. In this case, a high temperature thermoelectric generator directly utilizes the high temperature heat of a flame and rejects heat at a relatively lower temperature. A heat exchanger transfers this heat to the working medium of a bottoming Brayton cycle. Although this idea may enhance the efficiency of gas turbines with low Turbine Inlet Temperature (TIT), its application is limited by the availability of heat exchangers that can operate at such temperatures. Furthermore, combustion at very high temperatures is not a feasible option mainly due to NO x emissions, which increase exponentially with flame temperature.
The current work explores the possibility of integrating, and not just combining, thermoelectric generators in conventional gas turbine combustors. The latter are considered here as typical heat exchangers, in the hot side of which a flame is operated. Their cold side is fed with cooling air from the compressor to keep the combustion chamber wall below its melting temperature. State of the art gas turbine combustors operate with flame temperatures around 2000–2500 K and already have a ceramic thermal shield at their inner surface. This ceramic shield is the first protection measure that is supplemented by active convective and film air cooling. It is the aim of this work to investigate the possibility of replacing this thermal shield with high temperature thermoelectric generators and evaluate their technical and economic potential and their impact on the total heat flux across the combustor wall.

2. Methods and Modeling Approach

Modern gas turbines operate at turbine inlet temperatures well above the melting point of their combustor’s materials. This is possible due to very sophisticated cooling systems and ceramic shielding of the parts that experience the highest thermal loads. Cooling is realized by extracting part of the air leaving the compressor and directing it to the hot gas path components, while the remaining air enters the combustion chamber. The latter air stream is in turn split in two, one taking part directly in the combustion reaction and the other used to cool the walls of the chamber. To compute the power generated from thermoelectric generators installed in a gas turbine combustion chamber, the temperature distribution in the walls of the chamber must be first calculated. This can be achieved only if both the chamber geometry and the air and fuel mass flow rates are known.
The multi-level modeling approach adopted in the current work is depicted in Figure 1. On a first level, a full gas turbine thermodynamic model, with the respective secondary air system, is built and validated. This model computes the flow rate, pressure and temperature of the working fluid in all major stations of the gas turbine process. This way, the air flow rate used for cooling and sealing in the turbine expander is estimated along with its temperature and pressure. The same model delivers values of the air and fuel flow rates entering the combustion chamber, along with their inlet temperature and the outlet temperature of the exhaust gases. On a second level, a separate model of the combustion chamber is developed to compute the mass flow rates of the air streams in its interior and the temperature distribution in its walls. The wall temperature distribution is first computed in a conventional combustion chamber with ceramic heat shields as a benchmark case. Subsequently, the heat shields are replaced by high temperature thermoelectric generators (TEGs) and the wall temperature distribution is computed again. This result is fed in a final model that computes the power generated from the TEGs for the available temperature difference across them. For each TEG configuration (length, fill factor, etc.), the detailed combustion chamber model is used anew to compute the new wall temperature distribution. The modeling approach is depicted graphically in Figure 1, whereas the details of the models are given in the following sections.

2.1. Gas Turbine Model

The Joule–Brayton cycle is typically used to model gas turbine processes. Figure 2 shows the cycle temperature-specific entropy diagram for its ideal and non-ideal versions. For the calculations of the current work, the non-ideal cycle with the following assumptions is used:
  • The working fluid is considered a real gas and its properties are expressed as functions of temperature.
  • The compression process is adiabatic with a given constant polytropic efficiency.
  • During the combustion process, an amount of fuel remains unburned which is taken into account by the combustion efficiency. Additionally, the combustion products are taken as the working fluid of the turbine expander.
  • The expansion process is divided in stages and the effect of cooling air injection is taken into account in the adiabatic expansion of each stage.
Modelica and its open source platform OpenModelica 1.9.6 was chosen for the simulation of the gas turbine operation [14]. Its ThermoSysPro library [15] has been applied with minor modifications on the compressor and turbine models. The combustion chamber model has been modified to define the firing temperature as a parameter instead of the fuel mass flow rate. This is necessary when the secondary air system of the gas turbine is accounted for, because the computation of the cooling air mass flow rate strongly depends on the combustor outlet temperature. Apart from this change, the model used to calculate the combustion process is inherited from ThermoSysPro model.

2.1.1. Secondary Air System Modeling

The secondary air system model calculates the cooling air mass flow rates for each turbine blade row and the pressure losses associated to the mixing processes, and is based on the works of Kurzke [16] and Horlock [17]. The effect of cooling is considered on individual blade rows, which we describe here for one turbine stage.
Figure 3 presents the h-s diagram of the expansion in a cooled turbine stage according to the applied model. It is divided into three sub-processes, in the first of which the turbine stator cooling air is mixed to the main exhaust gas stream before its expansion in the rotor. The pressure drop due to the mixing process is taken into account by an appropriate pressure loss coefficient. The expansion of the resulting stream in the rotor is modeled in the same way as in an uncooled expander. This way, the coolant stream added at the stator stage will generate work. Finally, the rotor cooling air stream is mixed with the expanded gas at the outlet of the rotor blade. In this case, the air flow will generate work only in the succeeding turbine stage.
The cooling air flow rates are computed based on the assumption that the external Stanton number S t g remains constant as engine design parameters TIT and compression ratio are changed [17]. For the respective model, the chosen cooling system technology level, its effectiveness and a pressure loss coefficient are presented in Table 1. The blade material temperature, although being a parameter, is not included in this table as it varies on each blade row.
On top of these calculations, the expansion ratio of each turbine stage ( x e x p i ) must be defined. This is done manually under the condition that the cooling pressure loss ratio π l o s s c o o l is taken into account for each stage [17].

2.1.2. Gas Turbine Reference Case and Model Validation

The Siemens SGT5-4000F gas turbine is chosen as a reference case for the validation of the cycle model. Its main design and operational data are shown in Table 2. The gas turbine consists of a 15-stage axial compressor, an annular combustion chamber with heat shields and a four-stage turbine. Three of the four stages of the turbine are film cooled and equipped with thermal barrier coatings. The schematic of the process is depicted in Figure 4.
Air enters the compressor at atmospheric conditions and gets compressed to approximately 18 bar. Six cooling air streams are extracted at the compressor outlet and are fed into the three first turbine stages. The remaining air is fed to the combustor that has an exhaust temperature of approximately 1700 K. The exhaust gas is then directed to the cooled turbine, where it expands to enter the exhaust duct, where a 3% pressure drop is assumed to occur. Table 3 presents the model parameters in detail along with the chosen expansion ratio distribution for the turbine stages. The polytropic efficiencies have been estimated based on the performance data of the reference gas turbine. The efficiency reduction due to the cooling air injection has been chosen based on [18]. The pressure ratio distribution and the blade temperatures for the cooling air flow rate calculation were computed according to the considerations of Young et al. [19,20].
Table 4 shows the simulation results and their comparison to the performance parameters published by the manufacturer of the reference gas turbine. It can be seen that the relative errors of overall efficiency and exhaust temperature are insignificant. Nevertheless, there is a slight overestimation of the gross power output (relative error 3%). As the efficiency and expansion distribution values have been estimated, discrepancies may appear in comparison to the theoretical ones. Regarding the results of the cooling system, the total coolant mass flow rate is 113.5 kg/s, meaning that around 17% of the compressor mass flow rate is used for cooling of the turbine blades. This is a common value found in the literature [17,20]. At any rate, the results offer a good estimation of the combustion chamber inlet conditions.

2.2. Combustor Model

The aim of the current work is to study the power generation potential of thermoelectric generators when they are integrated in the liner wall of a gas turbine combustor. The power generated from TEG depends on the temperature difference across them. This temperature distribution will result from a study of the heat transfer conditions in the combustion chamber.
To simplify the analysis and make the findings easier to evaluate, a tubo-annular combustion chamber is modeled as a co-flow heat exchanger with a complex wall structure (Figure 5). The inlet conditions of the combustion chamber are taken from the gas turbine model, described in the previous section. Combustion takes place in the inner side of the chamber and cooling air flows in the outer annulus.
The temperature distribution in the combustor is computed based on the recommendations of Lefebvre and Ballal [21]. The applied model computes the convective and film cooling heat transfer coefficients along with radiative heat transfer from the hot gas side and assumes one-dimensional heat transfer through the inner combustor wall. The outer wall of the chamber is taken as perfectly insulated.
The studied chamber has seven film cooling slots at a distance of 5 cm from each other and a cooling hole at the end of each film cooling region. The distance of the slots and holes is chosen so that the film of air is not perturbed. Ideal mixing is assumed between the hot combustion gases and the film cooling air. Furthermore, it is assumed that the hot gases’ compositions remain the same along the length of the combustion chamber. The cooling air that does not flow through the film cooling slots and holes is mixed with the main stream at the end of the chamber (not shown in Figure 5). A sketch of the chamber geometry along with the geometrical assumptions [20,22] made for the film cooling are presented in Figure 5 and in Table 5.
The depth of film cooling s determines the liner wall diameter variation. After every film cooling slot, the liner wall inner diameter increases as shown in the following equation:
d W i + 1 = d W i + 2 · s
In contrast, the outer casing diameter remains constant along the axial length, resulting in a reduction of the annulus flow area after every film cooling slot.

2.3. Thermoelectric Generator Model

As part of the combustor liner wall, the thermoelectric generator replaces the ceramic heat shield layer, as depicted in Figure 6. It is placed between the hot combustion products, which become its high temperature heat source, and the metal liner, which is its heat sink. Two thin ceramic insulation layers, on which the semiconductor materials are fitted, are still present to protect the TEG from the aggressive hot combustion gases and insulate its cold junction from the liner metal wall.
The introduction of TEG in the combustion chamber does not affect its basic geometry. The diameter of the metal liner wall remains the same as in the case with simple ceramic heat shield. The number of junctions in the TEG and its length “L” (see Figure 6) depend on its materials and the techno-economic optimization of the heat transfer system.
For the application of energy conservation at the hot and cold junctions, four energy transport mechanisms are taken into account, which result in Equations (2) and (3) for the hot and the cold junction, respectively [23,24].
Q H = P T E + Q c o n d Q J o u l e = n T E G · S · I · T H + k · T H T C 1 2 · R · I 2
Q C = P T E + Q c o n d + Q J o u l e = n T E G · S · I · T C + k · T H T C + 1 2 · R · I 2
In these equations, Q H and Q C are heat input from the heat source to the hot junction and the heat output from the cold junction to the heat sink, respectively. Q J o u l e represents internal resistive heating, while P T E is the electrical energy output from thermoelectric effect P T E . Finally, Q c o n d corresponds to the heat conducted from the hot to the cold junction. It may be assumed that the Joule heating is equal for both junctions, since the temperature profiles for the studied materials are nearly linear [23,25]. The generated electrical power and the efficiency of the TEG can be thus given from Equations (4) and (5).
P e l = Q H Q C = n T E G · S · I · ( T H T C ) R · I 2
η T E G = P e l Q H
For the computation of the temperature distribution in the TEG and the liner, the same convective and radiative heat transfer models are applied as in the reference case. The heat balance statement for the two TEG junctions can be developed to a closed system of five independent equations with the five wall temperatures as unknowns (see Figure 6). The system is solved under the assumption that the total wall thickness is small compared to its length (i.e., the same heat exchange surface is assumed both at the cold and the hot end).
Q c o n v + Q r a d = k T B C δ T B C 2 · A W a l l · ( T W C C T T E G H )
k T B C δ T B C 2 · A W a l l · ( T W C C T T E G H ) = n T E G · S · I · T T E G H + k · T T E G H T T E G C 1 2 · R · I 2
n T E G · S · I · T T E G C + k · T T E G H T T E G C + 1 2 · R · I 2 = k T B C δ T B C 2 · A W a l l · ( T T E G C T W i )
k T B C δ T B C 2 · A W a l l · ( T T E G C T W i ) = k M e t a l δ M e t a l · A W a l l · ( T W i T W A N )
k M e t a l δ M e t a l · A W a l l · ( T W i T W A N ) = h c a · A W a l l · ( T W A N T A N )

2.4. Thermoelectric Module Optimization Model

Up to date, TEGs have demonstrated efficiencies (see Equation (5)) in the region of 2–3% [4]. It is thus expected that the generated power from the proposed system will be relatively low, compared to that generated by the host gas turbine. Hence, a simple power output optimization of the TEG would not make much sense if it was not supported by a techno-economic optimization. In other words, materials and geometrical characteristics have to be optimized on a techno-economic basis. On the other hand, the economic evaluation of high temperature TEGs is challenging, because they have not reached commercial maturity yet. Under this premise, the TEG optimization in this work relies on the work of LeBlanc et al. [3] and the material prices reported in it. For the same reason, the following analysis is more an attempt to identify the most important parameters that affect the financial viability of TEGs, rather than providing absolute numbers for their economic performance.
The figure of merit of a thermoelectric material relates its properties to the device efficiency but does not take into account costs. Much more appropriate for the intended optimization is the use of the specific power generation costs (Equation (11)).
G = C P
The installation and operation of TEGs in the configuration in question will incur only investment costs, while no additional operating and maintenance costs will be present. The investment costs include the volumetric ( C ) and areal ( C ) TEG module costs and the heat exchanger costs for the energy conversion system [3], and can be expressed by Equation (12).
C = C · L T E G + C · A · F + C H X · U · A
where F represents the fill factor of the TEG module, U A is the overall heat transfer coefficient of the heat exchanger and C H X is the specific costs of heat exchanger ($/Wk). The fill factor is defined as the ratio of the area covered by the active thermoelectric material to the plate area of the TEG module (cf. [3]). In the current work, the heat exchanger is the combustion chamber and the respective costs have been neglected. In addition to the thermoelectric system cost, balance of plant and installation costs are estimated each as a 10% of the total system costs [26]. The resulting total cost of the TEG is thus 20% higher than that resulting from Equation (12).The optimization objective is to minimize G while the TEG length, its fill factor F and its dimensionless figure m are being varied. The latter is defined as the ratio between the electrical load resistance R L and the internal resistance of the module R. According to LeBlanc et al. [3] (Equation (13)), the value of m that minimizes G is the load matching condition m = 1. Hence, the two final design parameters to be optimized are L and F.
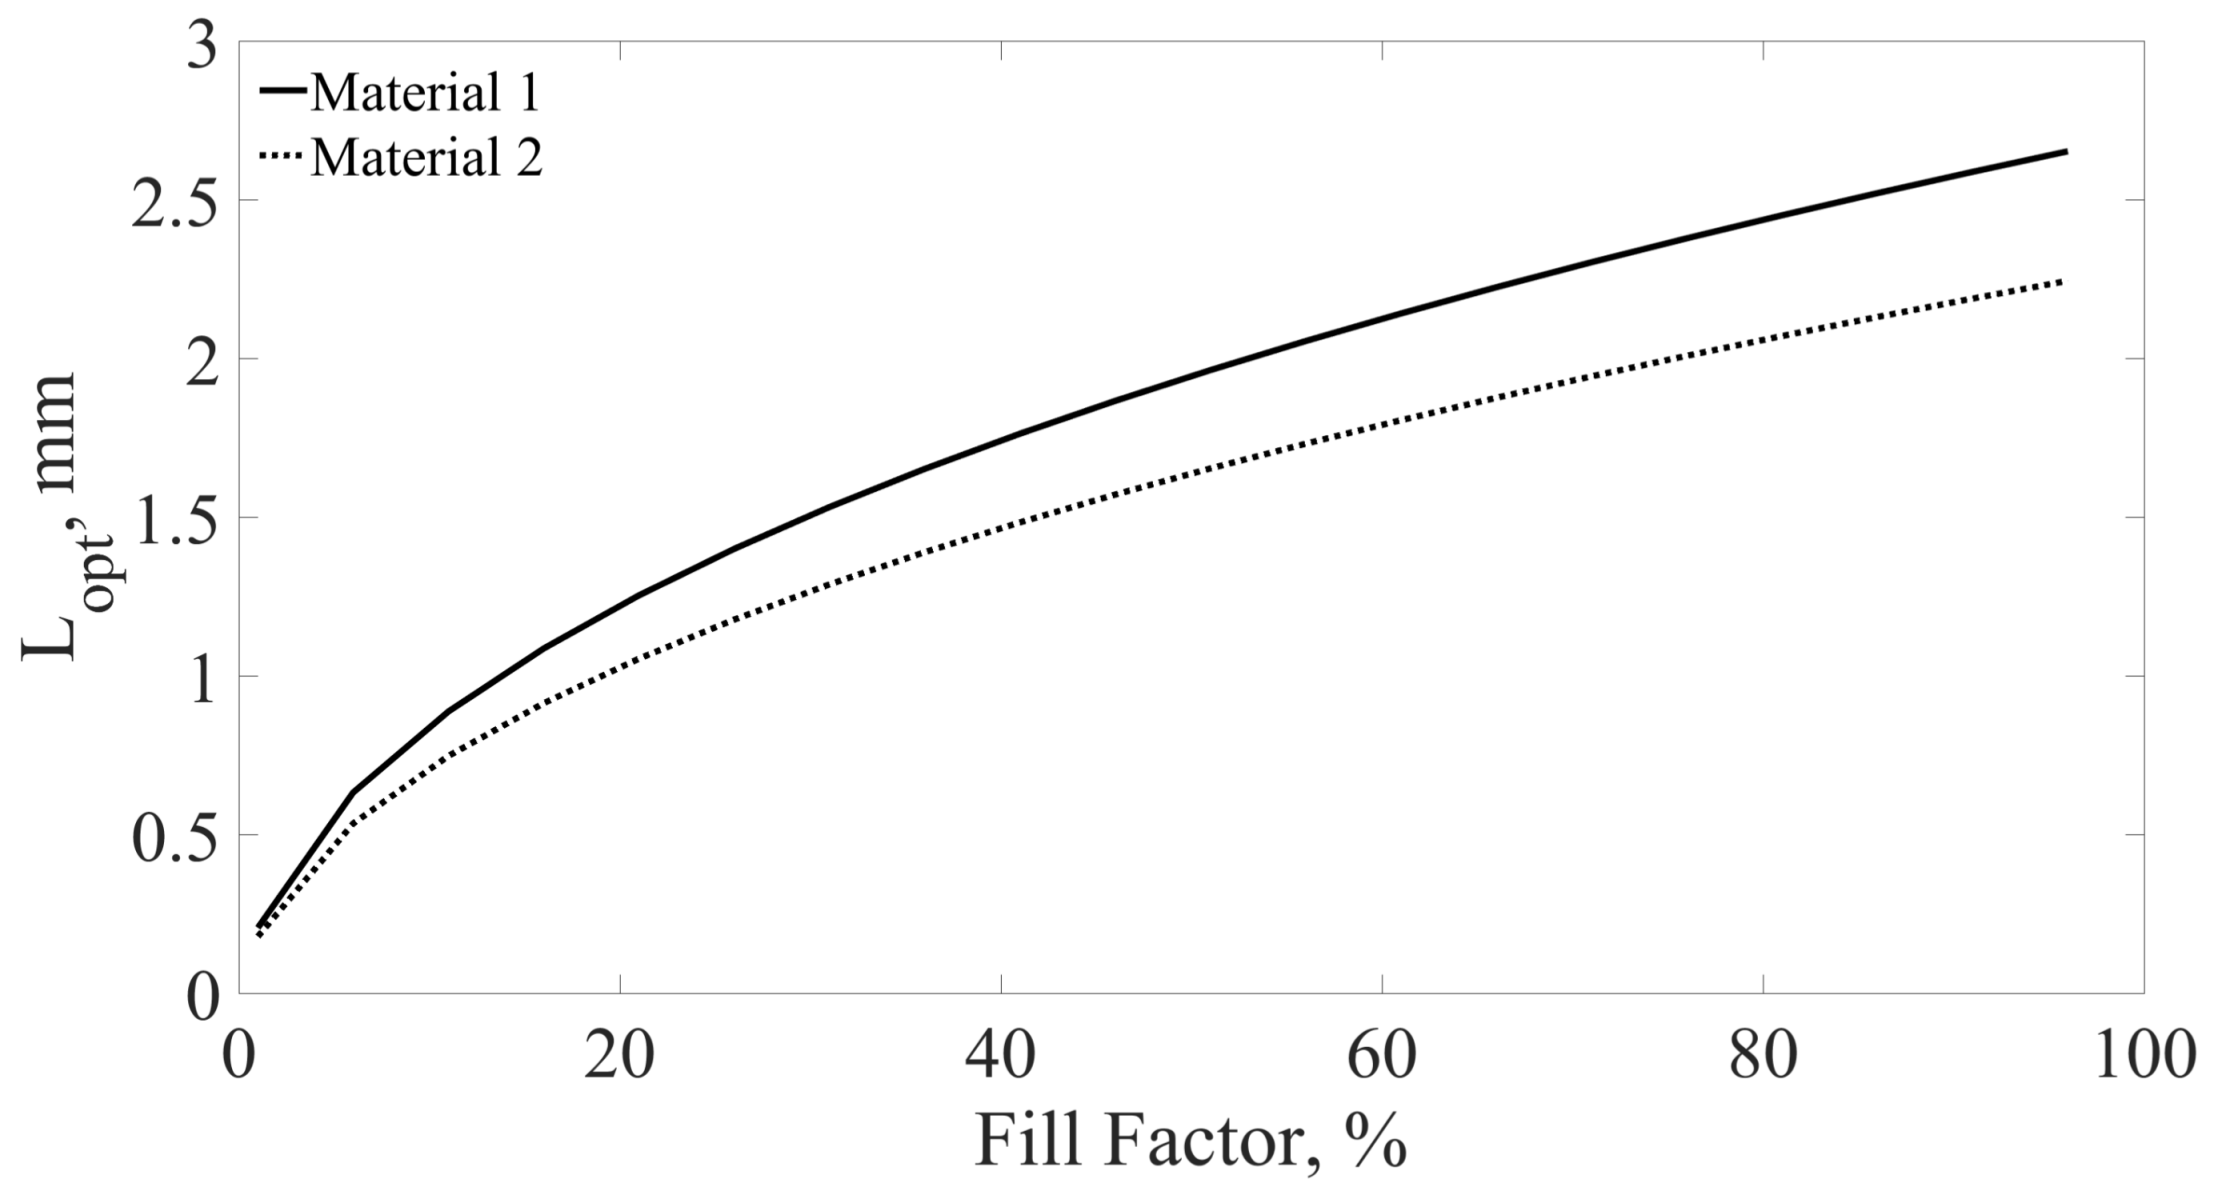
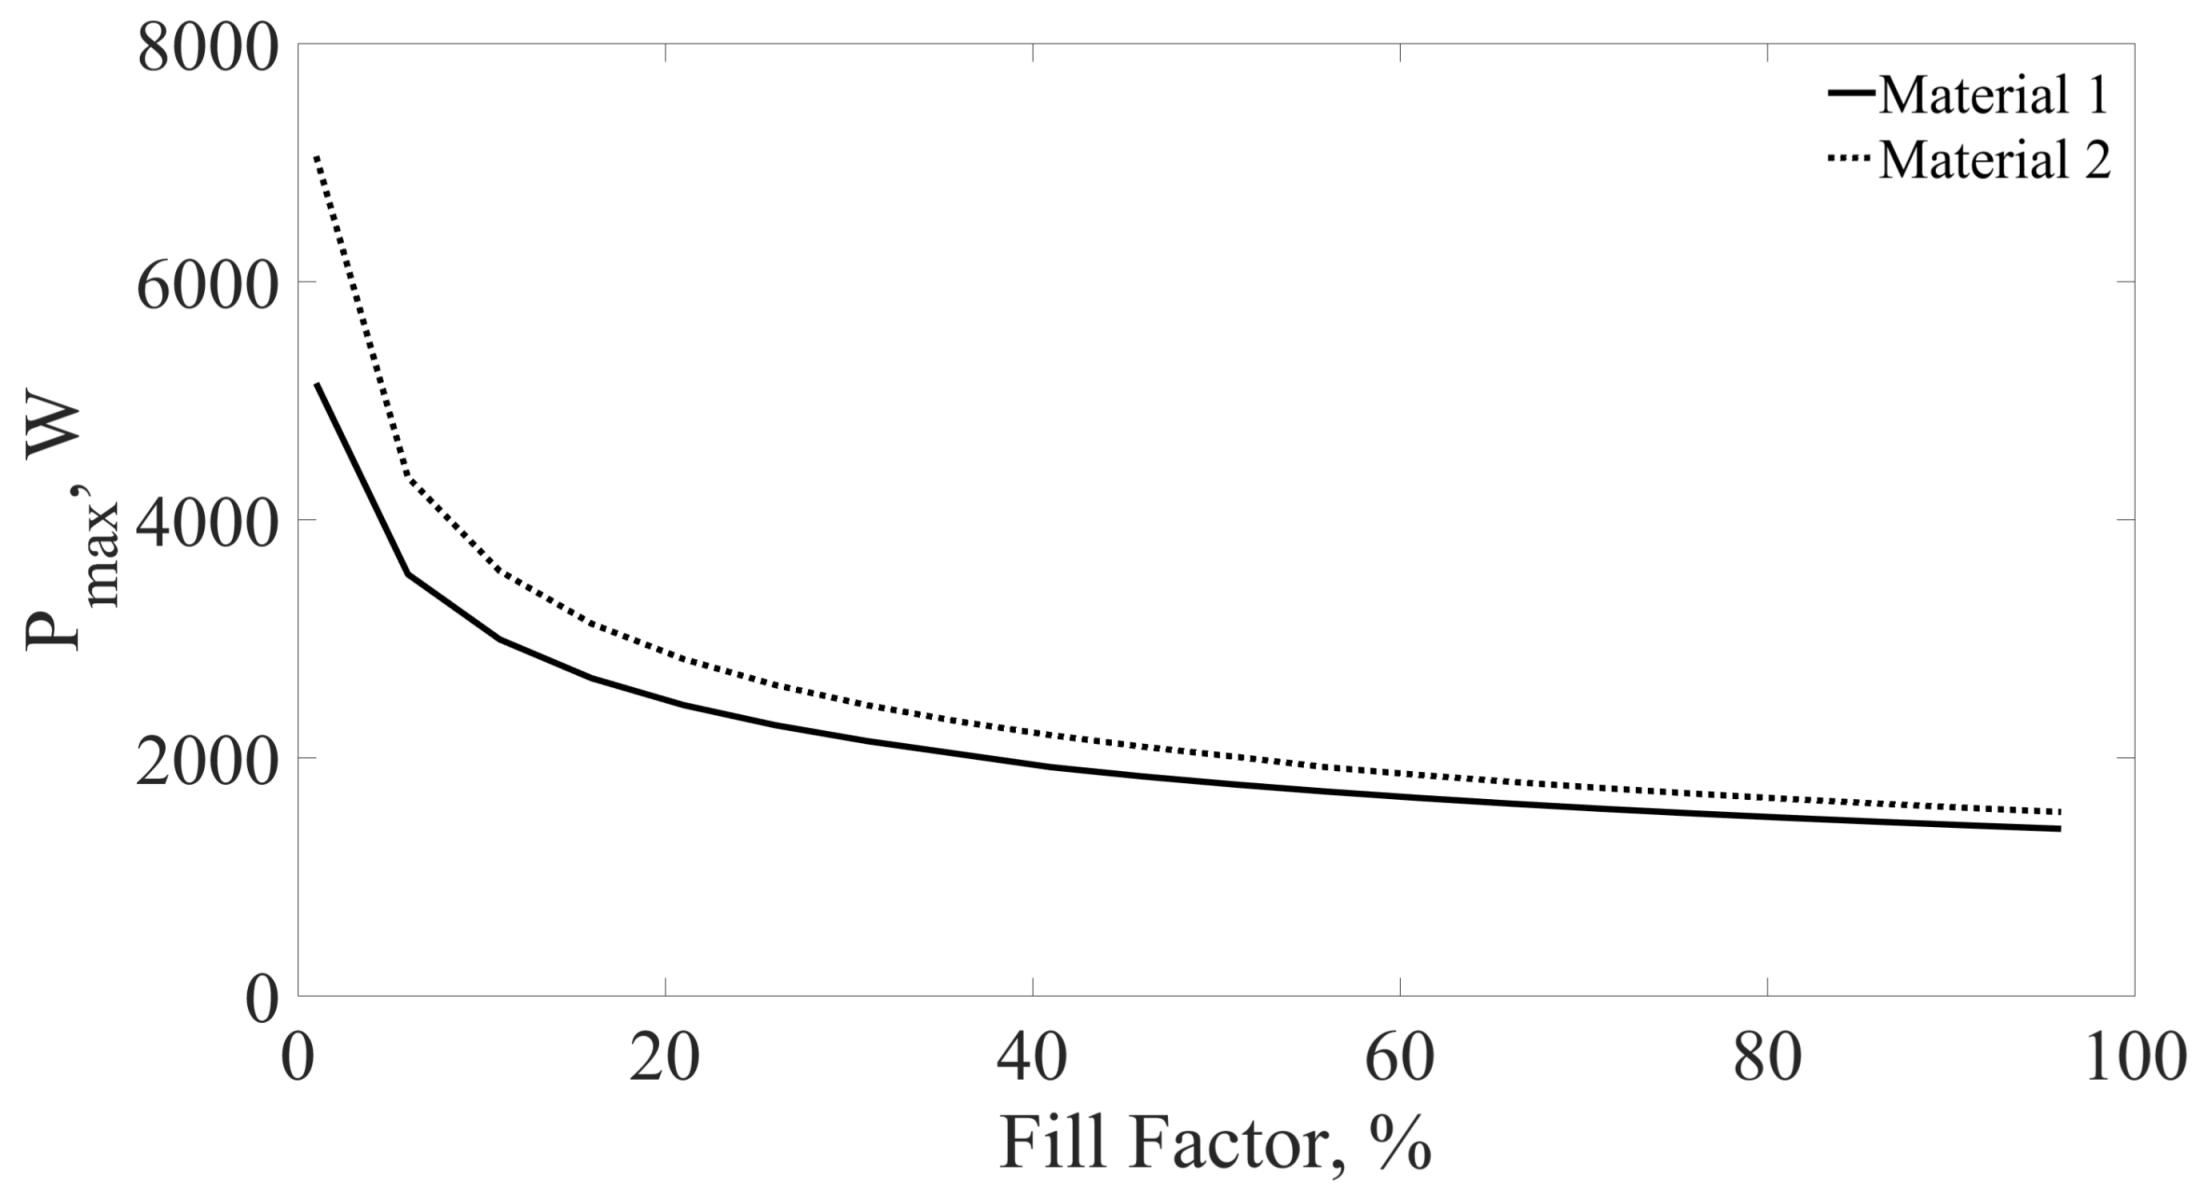
In general, as the TEG leg length or its fill factor decrease, less material is used and the costs are reduced. However, reducing the leg length also reduces the temperature drop between the TEG junctions, resulting in less power output, which increases G. At the same time, manufacturing feasibility must be taken into account as well, since the thermoelectric device cannot be arbitrarily small. As stated in [3], there is not a minimum value for G, but there is a point of diminishing returns at finite L and F. The task of the presented optimization is to find this point. This is done by fixing the TEG fill factor F at values between 0 and 1 and computing the respective optimal leg length based on Equation (13) from [3].
L o p t = 4 · k U · F 1 + 1 + 16 · F · C · k C · U
For each combination of the two varying parameters, L and F, the power output, the cost and G are determined and compared. From the thermoelectric materials presented in the work of LeBlanc et al. [3], only nanostructured bulk silicon [27] and Al-doped ZnO [28] qualify for the expected wall temperatures in a gas turbine combustion chamber, which are presented in Table 6. The costs for each material are computed according to LeBlanc et al. [3].
Once these parameters, the design of the TEG, its costs and the power it generates are defined, and the net present value and the internal rate of return for the respective investment are computed. The former is computed with Equation 14, where N is the lifetime of the investment in years, CF is the net cash-flow of each year and “i” is the discount rate used to project each cash-flow to the starting year of the investment. The internal rate of return (IRR) is the discount rate value that results to a net present value equal to zero.
N P V = n = 1 N C F n 1 + i n
The annual cash flows are the difference between the generated income and the incurred costs. In the system in question, income is generated by selling electricity, whereas only the initial installation cost is accounted for (see Equation (12)).

3. Thermal Analysis Results and Discussion

The present section focuses on the results of the combustion chamber thermal analysis and the dimensioning of the TEGs. The combustion chamber with ceramic heat shields and film cooling is studied first. This is used as reference for the combustion chamber with thermoelectric generators. The temperature distribution in the TEGs is the topic of the second part of the section.

3.1. Temperature Distribution in the Reference Combustion Chamber

The gas and liner temperatures along the length of the combustion chamber are presented in Figure 7. The highest temperature is that of the combustion gases. The sudden temperature drop at seven points along the length of the chamber are caused from the injection of film cooling air at the respective slots in the liner wall.
This effect can also be recognized at the liner inner wall temperature, presented in the same figure. It is interesting to emphasize that the effect of film cooling is no longer appreciable after 0.05 m and a new cooling air slot is necessary to keep the wall temperature from rising. It can also be observed that the cooling air injection effect is less pronounced closer to the outer surface of the wall. In addition, one cannot fail to observe that, once film cooling ceases, the wall temperature recovers, albeit at a level below that at the chamber entrance, since the exhaust gas has a lower temperature.
In terms of temperature values, the inner liner wall reaches a maximum temperature of 1320 K, which is within the operational limits of ceramic materials. Furthermore, the average temperature of the ceramic heat shield along the length of the chamber is 1130 K. The thermal insulation by the ceramic shield results in a lower maximum temperature of the combustor metal wall, which is equal to 1150 K. Similarly, the average liner temperature is 1020 K. These values are in line with the values reported in literature [21].
At the end of the chamber length, the two streams (exhaust gas and cooling air) are mixed and the resulting temperature is equal to that of the global gas turbine model presented in Section 2.1.2.

3.2. Temperature Distribution in the Combustion Chamber with TEG

In this section, the temperature distribution in the combustion chamber with TEGs is presented for generators made of S i . The second TEG material in Table 6 has comparable heat conductivity and the results are representative for both. The case presented in Figure 8 corresponds to the operation of the combustion chamber with the optimum design of the TEGs (see Section 3.3) and at the current value that results to maximum power generation. In Figure 8, it can be observed that the temperature distribution along the wall follows the same trend as in the previous section.
Although the TEG material has a higher thermal conductivity than the TBC material, the relatively low fill factor of the TEG modules results in a comparable heat conductivity of the module and the TBC. By the same token, very similar maximum and average temperatures are observed across the combustion chamber. More interesting in this case is the temperature change across the TBC and the TEG. More specifically, Figure 9 shows that the TEG operates at a slightly lower temperature difference compared to that of the ceramic heat shield.

3.3. Dimensioning and Power Generation from the TEGs

As already discussed in Section 2.4, the TEG design should be techno-economically optimized. The parameters to be optimized are the leg length, the fill factor and the operation current for each TEG. Figure 10 presents an example for the power output of a TEG as a function of the current for two points along the length of the combustion chamber.
The power generated close to the inlet of the combustion chamber is higher, because the temperature gradient over the TEGs is higher (see also Figure 9). It is also interesting to mention that the optimum operational electric current is reduced for lower temperature gradients across the TEG. Ideally, the current sent to each TEG would be chosen to maximize its power generation for a given temperature difference. This would however lead to very complicated power electronics and high costs for this installation. Instead, in the current work, we assume that all TEGs are fed with the same current and are connected electrically in series. The current value is then chosen in such a way that the cumulative power generation from all TEGs is maximized.
The optimization procedure followed in the current work for the dimensioning of the TEGs and the computation of their power generation comprises the following steps:
  • A value is chosen for the fill factor of the TEGs.
  • An initial guess for the TEG leg length is made.
  • A value for the operation current of the TEGs is chosen.
  • The heat transfer model from Section 2.2 is applied to compute the temperature distribution across the combustor wall at each point along its length. This computation delivers the temperature distribution in each TEG.
  • The power generation of each TEG is computed.
  • The optimum TEG leg length is computed, based on Equation (13)
  • The optimum current for each individual TEG is calculated iteratively by changing its value and performing the computation Steps 3–6.
  • The cumulative maximum power P from all TEGs in the combustor is computed.
  • The cost functional G is computed for the given set-up of the TEG.
  • The next value of the TEG fill factor is chosen and Steps 2–9 are repeated.
Figure 11 shows the optimum leg length (see Equation (13) for each material of Table 6 as a function of the fill factor F. As expected, the length of the TEG legs is increased for increasing fill factors. This is mainly a result of the increase in the equivalent heat conductivity of the TEG for higher fill factors. To compensate this effect, longer TEG legs are necessary to keep the temperature difference across the TEG at an optimum level. The results in Figure 11 are also an indication about the manufacturing viability of each thermoelectric material. Generally, it is very important to install the TEG in the combustion chamber walls with a minimum impact on the existing geometry. This way, no changes will result on the flow field of the chamber and the efficiency of the combustion process. Hence, the leg length must be comparable to the size of the TBC but at the same time the TEG must extract enough power to make its installation profitable.
Figure 12 and Figure 13 present the maximum power output P in one combustion chamber and the respective cost functional G as functions of the fill factor for the optimum TEG leg length presented in Figure 11. In Figure 12, it can be seen that a maximum in power output occurs at low values of the fill factor. This result is again expected mainly due to the increased temperature difference across the TEG for low fill factors. For the materials in question, the minimum value of the cost functional corresponds to a very small fill factor, which is not realistic in practical applications.
Based on the above considerations, the TEGs’ fill factor has been chosen with the aim to minimize their effect on the combustor’s operation. The latter can be either altered by changes in the inner diameter—i.e., in the aerodynamic conditions of the combustor—or different wall temperatures. The former influence is avoided by keeping the inner diameter of the combustor the same for the TEG and the conventional thermal barrier. This leaves the average inner wall temperature of the combustor as the sole criterion to choose the TEG optimum fill factor. The configuration of the combustor with the simple ceramic thermal barriers results to an average inner wall temperature across its hole length of 1228 K. Figure 14 presents the average temperature of the inner combustor wall along its length as a function of the TEG fill factor, for the two TEG materials considered in the current work. These materials have heat conductivity values that are approximately four times higher than that of the conventional TBC (see Table 6).
Hence, the resulting TEGs must have a very small fill factor in order to have a combustor with similar inner average inner wall temperature. At the same time, the optimum length of the TEG legs (see Equation (13)) that results for these fill factors is very small, thus making their construction very difficult. Consequently, the fill factor is chosen in a way that the resulting TEG has a minimum leg length of 1 mm. The final design parameters for the TEGs made of the materials in question are shown together with the most important performance parameters in Table 7.
The reference gas turbine from Section 2.1.2 has an equivalent firing thermal power of 24 tubular combustion chambers resulting in a TEG power output of approximately 70.56 kW for Material 1 and 66.96 kW for Material 2.

4. Case Studies for the Operation of Gas Turbines with TEGs in the Combustion Chamber

The current section aims to answer the question of economic viability for the application of thermoelectric generators in gas turbine combustion chambers. The three most common types of gas turbine operations, and the respective operational limitations of the TEG installed in them, are firstly analyzed. The section concludes by a sensitivity analysis on the basic parameters of the economic model.

4.1. Economic Performance of TEGs in Three Different Types of Gas Turbines

Generally, power generation facilities are categorized according to the amount of annual full load equivalent operating hours in peaker facilities, intermediate load and base load plants. Peaker gas turbines run when there is high demand of power and reach between 600 and 1000 equivalent full load operating hours per year. Intermediate load gas turbines adjust their power output as demand for electricity changes and operate usually between 2000 and 4000 h per year at their full load. Finally, base load gas turbines are intended to continuously provide with energy whole regions or industrial areas, and are in most cases part of a combined cycle power plant. Energy is produced at an almost constant power and the full load equivalent operating hours normally lie between 5000 and 7000 h/year.
During the evaluation of an investment in TEGs for each type of gas turbine, it is assumed that the TEGs will be replaced every time that the combustion chamber is inspected. Usually, TEGs are known for their reliability and low maintenance needs, which can last up to more than 20 years in very harsh operational environments [5]. Nevertheless, the application in question is very demanding and the considered TEGs have not yet reached the technological maturity of the ones applied in space missions. This is the reason the inspection time has been fixed in 16,000–18,000 h, which are typical values for industrial gas turbines. the project lifetime for each case is set equal to 20 years, which is a typical value for a general overhaul of gas turbine installations. Table 8 presents the time interval between combustion chamber inspection and the replacement of the TEGs during the lifetime of the project and for each gas turbine type.
The income generated by the investment in question comes from the additional electricity that the TEG generates during its lifetime. The initial investment on the TEGs and the supporting power electronic equipment is the only cost considered here. The cost for the TEG is taken from the values computed in Section 3.3. As the TEGs generate DC power, a power electronics module very similar to that of photovoltaic systems will be necessary to feed the power to the grid. Hence, the price and efficiency of the power electronics module are taken from the report of the National Renewable Energy Laboratory [29]. For the sake of simplicity, a fixed electricity price is considered in the current study that corresponds to the average EEX German peak and base load prices for the year 2017 [30]. The peak price is taken for the peaker gas turbine operation, while the base load price is used for the income computation of the remaining two gas turbine types. Table 9 presents the basis assumptions of the economic model.
Table 10 presents the net present value and the internal rate of return for the investment in TEGs that are installed in the combustion chamber of each gas turbine type. As expected, the TEGs installed in the intermediate and base load system have a better economic performance, because they run for many more hours and thus generate higher income. This also has. an effect of the relative low price of the TEGs and their materials compared to the price of the power electronics module. In Table 10, the total cost for the TEGs and that for the power electronics system are depicted. It becomes clear that, although the TEGs for the intermediate and base load plant have to be replaced more often, their price does not have a major impact on the economic performance of the installation. In fact, the power electronics modules are 69–88% of the total investment cost for Material 1 and 77–92% for Material 2.
Concerning the values of the internal rate of return and the net present value, Material 2 demonstrates a slightly better economic performance and both are very effective financially even for peaker units.

4.2. Sensitivity Analysis of the Economic Performance

As already mentioned, high temperature thermoelectric generators have not yet reached a technological maturity that would allow their reliable economic evaluation [3]. Nevertheless, the current analysis can deliver a well studied answer to the question: Under which market conditions could the installation of high temperature TEG in gas turbine combustors be economically viable?
To answer this question, combustors of aero-engines are not considered, mainly because of weight considerations. The walls of these combustors are considerably thinner than these of stationary gas turbines and they cannot afford the installation of relatively heavy TEGs. In the market of stationary gas turbines and by considering the current global trends towards renewable energy generation, gas turbines are mostly expected to operate as peaker units in the future [31]. Very large combined cycle power plants will continue to come on line but their numbers will most likely decline as more renewable power is installed in power systems across the globe. For this reason, only peaker gas turbines are considered for the sensitivity analysis in question. The remaining two parameters of the economic model with a considerable influence on the results and a high uncertainty about their values is the electricity price (defines the income) and the installation cost of the TEGs.
The starting point for the sensitivity analysis are the data presented in Table 7, Table 8 and Table 9 for the case of the peaker host gas turbine. In a second step, one of the variables in interest is varied between 50% and 150% of the original values and the NPV and IRR is calculated for each case, while all other variables are kept constant. This analysis is quite straight forward for the variation of the electricity price, since this variable has no effect on the actual design of the TEGs. The price of the TEG materials influences on the optimum leg length, the respective fill factor, and consequently on the design and thermal performance of the TEGs. However, by looking at Equation (13), it becomes clear that the optimum TEG leg length will change only if the relation between the volumetric and the surface construction costs changes ( C and C in Equation (13)). If this relation stays the same and only the total cost changes, the design of the TEG will remain the same as the price is varied.
Figure 15 and Figure 16 present the sensitivity analysis results for the internal rate of return of the investment in TEGs made of Material 1, and the net present value of the investment in TEGs made of Material 2, respectively. In these figures, it is clear that, although the cost of the TEG materials is important for the economic performance of the investment, the price of electricity has a much higher influence on the latter. In fact, a change of 50% in the price of thermoelectric Material 1 results in a change of the internal rate of return of about 10%. A similar trend is seen for the net present value (and the IRR) of Material 2. On the other hand, a change of 50% in the price of electricity leads to an even higher (around 60%) change of the NPV and the IRR of the investment for both materials.

5. Conclusions

The current work is an attempt to estimate the energetic and economic performance of high temperature thermoelectric generators installed in the combustion chamber of gas turbines. The basic idea is to replace the thermal protection layers of combustors with TEGs and take advantage of the existing temperature difference and its potential to generate power.
As expected, the energetic performance has shown that relatively small amounts of power can be generated, mainly because combustion chambers are not designed as heat exchangers for this specific application. Their goal is rather to accommodate the combustion process and not to maximize the amount of heat exchanged between the two streams, here the combustion products and the cooling air. Nevertheless, this also has the positive effect that TEGs simply take advantage of a yet untapped temperature difference potential that already exists in combustion chambers of gas turbines, without having any influence on the actual energy conversion process.
This consideration also made the economic evaluation of the respective investment more interesting. In this context, it has been shown that, based on the current prices of high temperature thermoelectric materials, an investment would definitely make sense, even for the case of the installation in a peaker gas turbine with relatively limited operating hours in a year. However, during the analysis, it also became clear that more information is necessary on the cost of thermoelectric materials and the way it is expected to change in the future. The subsequent sensitivity analysis of the economic evaluation results has shown that the latter are more sensitive to the price of electricity than the TEG price.
This result has several implications for future investments in high temperature TEGs for gas turbines. It is expected that mass production of TEGs and their technological evolution will lower their price. On the other hand, peaker gas turbines face the problem of “the merit order effect” of renewables [32]. If energy markets continue to operate purely on the merit order principle, it is expected that peak electricity prices will become comparable to base load prices. From the current analysis, we can conclude that this effect would have a stronger impact on the financial performance of TEGs in gas turbines. A way around this issue would be to individually support the respective investments through an electricity price bonus or a carbon tax. Although the first instrument will have a clear impact on the profitability (see Figure 15), we need to have an estimation of the CO 2 emissions avoided by the installation of the TEGs in a peaker gas turbine to evaluate the second instrument. From this basic consideration and the prevailing peak price of electricity, one could then compute the carbon tax necessary to make the respective investment in TEGs viable.
In conclusion, one can state that the installation of TEGs in carefully chosen positions at power conversion systems can be a very interesting way to generate electricity, without any effect in the host cycle. The given example is only one realization of this idea. In the future, further concepts will be explored not necessarily limited to gas turbines.

Author Contributions

P.S. has developed the concept of the presented the work, had the initial idea and carried out the literature study. J.F.-V. has carried out his master’s thesis on the idea and was supervised by P.S. J.F.-V. carried out the largest part of the modeling and computational effort with the support of P.S. The economic study has been carried out in cooperation and the two authors contributed equally to this part. The final manuscript is based partly on the master’s thesis of J.F.-V. P.S. wrote the manuscript in its final form.

Funding

This work has been carried out without any external funding.

Acknowledgments

We acknowledge support by the German Research Foundation and the Open Access Publication Funds of TU Berlin.

Conflicts of Interest

The authors declare no conflict of interest.

Abbreviations

FCash flow
IRRInternal Rate of Return
NPVNet present value
OEMOriginal Equipment Manufacturer
TEGThermoelectric Generator
TITTurbine Inlet Temperature
Symbols
Latin Characters
A W a l l Wall surface area m 2
CTEG total cost
C C Combustion chamber
FTEG Fill factor%
hSpecific enthalpy J k g
h c a Convective heat transfer coefficient J k g
iInterest rate-
IElectric currentA
KEquivalent heat conductivity of a TEG W m K
L T E G TEG lengthm
n T E G Number of legs in a TEG-
nNumber of investment year-
PPowerkW
RElectric resistance Ω
Q c o n v Heat convected from/to a wallW
Q r a d Heat transferred with radiation to a wallW
sSpecific entropy J k g K
SSeebeck coefficient of a TEG μ V K
S t g Stanton number
T C TEG cold junction temperatureK
T H TEG hot junction temperatureK
Greek Letters
δ T B C Heat shield thicknessm
δ m e t a l Metal wall thicknessm
η C Compressor polytropic efficiency
η C o m b Combustion chamber efficiency
η T Turbine stage polytropic efficiency
π C Compressor pressure ratio
π T s t a g e Turbine stage expansion ratio
π C C Combustion chamber pressure loss coefficient
π l o s s c o o l Turbine stage cooling pressure loss
ρ Density k g m 3
χ e x p i Turbine stage pressure ratio

References

  1. Rowe, D.M.; Min, G. Design theory of thermoelectric modules for electrical power generation. IEE Proc. Sci. Meas. Techol. 1996, 143, 351–356. [Google Scholar] [CrossRef]
  2. Goldsmid, H.J. Introduction to Thermoelectricity. In Introduction to Thermoelectricity; Hull, R., Parisi, J., Osgood, R.M., Warlimont, H., Eds.; Springer: Berlin, Germany, 2016; pp. 167–190. [Google Scholar]
  3. LeBlanc, S.; Yee, S.K.; Scullin, M.L.; Dames, C.; Goodson, K.E. Material and manufacturing cost considerations for thermoelectrics. Renew. Sustain. Energy Rev. 2014, 32, 313–327. [Google Scholar] [CrossRef]
  4. Battaglia, C.; Widmer, R.; Helbling, T.; Hug, L.; Miller, B.; Neumann, W.; Götze, M.; Sägesser, C.; Dubois, Y. Potential of Thermoelectrics for Waste Heat Recovery; Technical report; Swiss Federal Office of Energy SFOE: Bern, Switzerland, January 2016. [Google Scholar]
  5. Champier, D. Thermoelectric generators: A review of applications. Energy Convers. Manag. 2017, 140, 167–181. [Google Scholar] [CrossRef]
  6. Suter, C.; Jovanovic, Z.R.; Steinfeld, A. A 1 kWe thermoelectric stack for geothermal power generation. Modeling and geometrical optimization. Appl. Energy 2012, 99, 379–385. [Google Scholar] [CrossRef]
  7. Bux, S.K.; Yeung, M.T.; Toberer, E.S.; Snyder, G.J.; Kaner, R.B.; Fleurial, J.P. Mechanochemical synthesis and thermoelectric properties of high quality magnesium silicide. J. Mater. Chem. 2011, 21, 12259. [Google Scholar] [CrossRef]
  8. Alanne, K.; Laukkanen, T.; Saari, K.; Jokisalo, J. Analysis of a wooden pellet-fueled domestic thermoelectric cogeneration system. Appl. Therm. Eng. 2014, 63, 1–10. [Google Scholar] [CrossRef]
  9. Kristiansen, N.R.; Snyder, G.J.; Nielsen, H.K.; Rosendahl, L. Waste Heat Recovery from a Marine Waste Incinerator Using a Thermoelectric Generator. J. Electron. Mater. 2012, 41, 1024–1029. [Google Scholar] [CrossRef] [Green Version]
  10. Miller, E.W.; Hendricks, T.J.; Peterson, R.B. Modeling Energy Recovery Using Thermoelectric Conversion Integrated with an Organic Rankine Bottoming Cycle. J. Electron. Mater. 2009, 38, 1206–1213. [Google Scholar] [CrossRef]
  11. Onoroh, F.; Ikebudu, K.O.; Okafor, I. Assessment of Economic Impact and Efficiency of a Combined Gas Turbine with a Thermoelectric Generator. Int. J. Multidiscip. Sci. Eng. 2012, 3, 1–6. [Google Scholar]
  12. Brady Knowles, C.; Lee, H. Optimized working conditions for a thermoelectric generator as a topping cycle for gas turbines. J. Appl. Phys. 2012, 112, 073515. [Google Scholar] [CrossRef]
  13. Yazawa, K.; Fisher, T.S.; Groll, E.A.; Shakouri, A. High exergetic modified Brayton cycle with thermoelectric energy conversion. Appl. Therm. Eng. 2017, 114, 1366–1371. [Google Scholar] [CrossRef]
  14. Fritzson, P. Principles of Object-Oriented Modeling and Simulation with Modelica 3.3: A Cyber-Physical Approach; Wiley-IEEE Press: Hoboken, NJ, USA, November 2014. [Google Scholar]
  15. El Hefni, B.; Bouskela, D.; Lebreton, G. Dynamic modelling of a combined cycle power plant with ThermoSysPro. In Proceedings of the 8th International Modelica Conference, Dresden, Germany, 20–22 March 2011; pp. 365–375. [Google Scholar]
  16. Kurzke, J. Performance Modeling Methodology: Efficiency Definitions for Cooled Single and Multistage Turbines. In Proceedings of the ASME Turbo Expo 2002: Power for Land, Sea, and Air, Amsterdam, The Netherlands, 3–6 June 2002. [Google Scholar]
  17. Horlock, J.H. Advanced Gas Turbine Cycles; Krieger Publishing Company: Malabar, FL, USA, 2003. [Google Scholar]
  18. Saravanamuttoo, H.I.H.; Rogers, G.F.C.; Cohen, H.; Straznicky, P.V. Gas Turbine Theory, 6th ed.; Pearson Education Canada: North York, ON, Canada, 2008. [Google Scholar]
  19. Young, J.B.; Wilcock, R.C. Modeling the air-cooled gas turbine: Part 1—general thermodynamics. J. Turbomach. 2002, 124, 214–221. [Google Scholar] [CrossRef]
  20. Young, J.B.; Wilcock, R.C. Modeling the air-cooled gas turbine: Part 2 — Coolant Flows and Losses. J. Turbomach. 2002, 124, 207–213. [Google Scholar] [CrossRef]
  21. Lefebvre, A.H.; Ballal, D.R. Heat transfer. In Gas Turbine Combustion: Alternative Fuels and Emissions, 3rd ed.; CRC Press: Boca Raton, FL, USA, 2010; pp. 315–358. [Google Scholar]
  22. Mellor, A.M. Design of Modern Turbine Combustors; Academic Press: Cambridge, MA, USA, 1990. [Google Scholar]
  23. Decher, R. Direct Energy Conversion: Fundamentals of Electric Power Production; Inter-University Electronics Series; Oxford University Press: Oxford, UK, 1997. [Google Scholar]
  24. Bitschi, A. Modelling of Thermoelectric Devices for Electric Power Generation. PhD Thesis, Swiss Federal Institute of Technology, Zurich, Switzerland, 2009. [Google Scholar]
  25. Min, G.; Rowe, D. Optimisation of thermoelectric module geometry for ‘waste heat’ electric power generation. J. Power Sources 1992, 38, 253–259. [Google Scholar] [CrossRef]
  26. Benday, N.S.; Dryden, D.M.; Kornbluth, K.; Stroeve, P. A temperature-variant method for performance modeling and economic analysis of thermoelectric generators: Linking material properties to real-world conditions. Appl. Eng. 2017, 190, 764–771. [Google Scholar] [CrossRef] [Green Version]
  27. Bux, S.K.; Blair, R.G.; Gogna, P.K.; Lee, H.; Chen, G.; Dresselhaus, M.S.; Kaner, R.B.; Fleurial, J.P. Nanostructured Bulk Silicon as an Effective Thermoelectric Material. Adv. Funct. Mater. 2009, 19, 2445–2452. [Google Scholar] [CrossRef]
  28. Tsubota, T.; Ohtaki, M.; Eguchi, K.; Arai, H. Thermoelectric properties of Al-doped ZnO as a promising oxide material for high-temperature thermoelectric conversion. J. Mater. Chem. 1997, 7, 85–90. [Google Scholar] [CrossRef]
  29. Fu, R.; Feldman, D.; Margolis, R.; Woodhouse, M.; Ardani, K. U.S. Solar Photovoltaic System Cost Benchmark: Q1 2017; Technical Report; National Renewable Energy Laboratory: Alexandria, VA, USA, September 2017. [Google Scholar]
  30. European Energy Exchange—EEX. Statistical Data on Electricity Prices Phelix Day Base and Phelix Day Peak. Available online: https://www.eex.com/en/ (accessed on 3 October 2018).
  31. Agency, G.E. Ancillary Services Study 2030—Security and Reliability of a Power Supply with a High Percentage of Renewable Energy; Technical Report; dena: Berlin Germany, November 2014. [Google Scholar]
  32. Sensfuss, F.; Ragwitz, M.; Genoese, M. The Merit-order effect: A detailed analysis of the price effect of renewable electricity generation on spot market prices in Germany. Energy Policy 2007, 36, 3086–3094. [Google Scholar] [CrossRef]
Figure 1. Overview of the applied modeling approach.
Energies 11 02769 g001
Figure 2. Temperature-specific entropy diagrams of the ideal prime 12 3 4 and real 1234 Joule–Brayton cycles.
Energies 11 02769 g002
Figure 3. Expansion model in a cooled turbine stage after [16,17].
Energies 11 02769 g003
Figure 4. Schematic of the reference gas turbine model.
Energies 11 02769 g004
Figure 5. Sketch of the combustion chamber geometry.
Energies 11 02769 g005
Figure 6. Sketch of the combustor liner wall, equipped with the TEG and the respective computation stations for the solution of the heat balance equations.
Energies 11 02769 g006
Figure 7. Temperature variation at various points across the conventional combustion chamber wall.
Energies 11 02769 g007
Figure 8. Temperature variation at various points across the combustion chamber wall with TEGs made of S i . Fill factor: 21%, L T E G :0.0011 m, I: 23.5A.
Energies 11 02769 g008
Figure 9. Temperature difference across the ceramic heat shield and the TEG along the length of the combustor, for the case TEGs made of S i . Fill factor: 21%, L T E G :0.0011 m, I: 23.5A.
Energies 11 02769 g009
Figure 10. Example on the dependency of a TEG power output on its operation current at two points along the combustion chamber.
Energies 11 02769 g010
Figure 11. Optimum leg length (Equation (13)) of each TEG material in Table 6 as a function of the fill factor.
Energies 11 02769 g011
Figure 12. Maximum possible power generation per combustion chamber as a function of the TEG fill factor, for the values of L o p t presented in Figure 11.
Energies 11 02769 g012
Figure 13. Cost functional as a function of the TEG fill factor.
Energies 11 02769 g013
Figure 14. Combustor average inner wall temperature as a function of the TEG fill factor. The temperature of a conventional combustion chamber wall is also presented for comparison.
Energies 11 02769 g014
Figure 15. Sensitivity of the internal rate of return of the investment with Material 1 on the price of electricity and that of the TEG construction.
Energies 11 02769 g015
Figure 16. Sensitivity of the net present value of the investment with Material 2 on the price of electricity and that of the TEG construction.
Energies 11 02769 g016
Table 1. Cooling system model parameters. Values taken from [17].
ParameterSymbolValue
Cooling efficiency η 0.8
Film cooling effectiveness ε F 0.4
Level of technology constantC0.045
Pressure loss constantK0.07
Table 2. Reference gas turbine design and operational data.
Gross power output [MW]292
Gross efficiency [%]39.8
Exhaust temperature [K]850
Exhaust mass flow [kg/s]692
Pressure ratio18.2
Turbine stages4
Cooled turbine stages3
Table 3. Model parameters.
SymbolValue
Compressor π C 18.2
η C 0.92
Turbine π T s t a g e 0.28/0.26/0.24/0.22
Cooled stages η T 0.865
Uncooled stage η T 0.885
Combustor T 4 t 1700 K
π C C 0.95
η C o m b 0.99
Cooling system T b l 940–1150 K
Atmosphere p 0 101,325 Pa
T 0 288.15 K
ϕ 20%
Table 4. General simulation results and validation.
Performance ParametersOEM DataCalculated
Gross power output [MW]292301
Gross efficiency [%]39.839.7
Exhaust temperature [K]850852
Exhaust mass flow [kg/s]692692
Coolant fraction [%]-16.87
Total coolant mass flow [kg/s]-113.5
Table 5. Combustion chamber geometrical characteristics and film cooling parameters.
NameSymbolValue
Casing diameter [m] d C a s i n g 0.29
Combustion chamber length[m] L C C 0.55
Inner liner wall diameter [m] d W C C 0.212
Wall thickness [m] t W 0.01
Ceramic heat shield layer thickness [m] t T B C 0.0015
Nimonic wall thickness [m] t M e t a l 0.0085
Length of calculation element [m]x0.01
Depth of film cooling slot [m]s0.0035
Distance downstream of slot [m] x s 0.01
Slot lip thickness [m] t s 0.0014
Film cooling mass flow rate k g s m ˙ s 0.37
Cooling mass flow rate k g s m ˙ c 0.8
Table 6. Thermoelectric materials used for the evaluation and their properties at 800 C [27,28].
k , W m · k σ , S m S , μ V K ρ , kg m 3
1Si11.81646301472330
2 ( Z n 0 . 98 A l 0 . 02 ) O 12.49655251505920
Table 7. TEG design parameters used for the case studies in Section 4. The power generation and cost are per combustion chamber.
MaterialF opt L opt , mP max , kWC,€I P max , A
10.210.00112.9446.7323.5
20.160.00112.7928.9420.5
Table 8. Types of turbine operation and replacement intervals of the TEGs installed in the combustion chamber.
PeakerIntermediate LoadBase Load
Operating time800 h a 3000 h a 6000 h a
Inspection16,000 h18,000 h18,000 h
Table 9. Basic assumptions for the economic evaluation of TEGs.
TEG installation cost per combustorsee C at Table 7
Power electronics investment cost, €/kW D C 170 [29]
Power electronics DC-to-AC ratio1.15 [29]
Electricity price feed-in base load, €/kWh0.035 [30]
Electricity price feed-in peak load, €/kWh0.043 [30]
Investment lifetime, a20
Interest rate for NPV , %10
Table 10. TEG economic performance results based on the reference case presented in Table 9.
PeakerIntermediate LoadBase Load
Mat.1PE cost ,%888069
NPV,€181.1135,88384,090
IRR,%10.2548.3285.13
Mat.2PE cost ,%928677
NPV,€575.2234,81281,202
IRR,%10.8851.8595.4

