Fabrication and Frosting Properties Study of Surface-Active Agents Coating Based on Nanoporous Aluminum Substrate


1
School of Civil and Transportation Engineering, Guangdong University of Technology, Guangzhou 510006, China
2
School of Materials and Energy, Guangdong University of Technology, Guangzhou 510006, China
3
School of Engineering, University of Hull, Hull HU6 7RX, UK
*
Authors to whom correspondence should be addressed.
Energies 2018, 11(10), 2797; https://doi.org/10.3390/en11102797
Submission received: 21 September 2018
/
Revised: 9 October 2018
/
Accepted: 11 October 2018
/
Published: 17 October 2018
(This article belongs to the Special Issue 2018 EU–China Symposiums on Renewable Energy/Sustainable Energy and Energy Storage Technologies)
Abstract
:In order to solve the frosting and blockage problem of an air conditioning evaporator’s fin in winter, the nanoporous aluminum plates with low surface energy has been proposed in this paper, which are fabricated by an anodizing method and then modified by lauric acid. The nanoporous aluminum plates with different nanoporous diameters ranging from 15 nm to 400 nm are obtained by changing the magnitude of the oxidation current. The surface contact angle of the nanoporous aluminum plates is an important factor influencing its surface frost and condensation. The test results show that the surface contact angle is decreased with the increasing of nanoporous diameter. When the nanoporous aluminum plates are modified by lauric acid, the contact angle is proportional to the nanoporous diameter, and the maximum contact angle can reach about 171°. A set of experimental instruments has been set up to simulate the typical winter climate in northern China, and the frosting properties of the nanoporous aluminum plate’s fin is analyzed by experiment. The results show that increasing the contact angle of aluminum plates can effectively improve its anti-frosting properties. The average frosting rate of the aluminum plate with the contact angle of 60° is about 0.33 [g/(min∙m2)], which is 1.74 times that of the aluminum plate with the contact angle of 171°, whose frosting rate is about 0.19 [g/(min∙m2)]. After taking the expanded aperture processing to the aluminum plate, the diameter with 30 nm, 100 nm, 200 nm, 300 nm, and 400 nm nanoporous aluminum plates are obtained and the polished aluminum plates are also prepared for comparing. Through the test results, the nanoporous aluminum plates are shown to have anti-frosting properties, and the nanoporous aluminum plates with diameter of 300 nm are shown to have the best anti-frosting properties. The calculation mode of frosting growth is derived on the base of experimental results. This research will be helpful in indicating the potential research area of the low-carbon-emission and energy-saving technology for the researchers all over the world.
1. Introduction
Frosting on solid surfaces is common and it can result in energy waste, such as in air conditioning—the frost and ice accumulated in heat exchangers can lead to a decline in heat transfer efficiency [1]. According to reports, due to the formation of frost, the reduction of heat transfer may be as high as 50–75% [2]. Due to the extra pressure drop and thermal resistance, continuous and uncontrolled frost layer growth on the heat transfer surface will adversely affect the performance of the refrigeration system. Therefore, the study of frost formation mechanism has attracted many researchers, and they have tried to establish effective defrosting methods [3,4].
The most commonly used techniques are electrical heaters, heat recovered from other parts of the process and regular shutdown of the system for active or passive defrosting. Obviously, these methods all consume energy and it is always accompanied overall efficiency reduction [5]. In all cases, delay as much as possible, or avoid the ice crystal nucleation and the subsequent growth and densification of a frost layer on the surface [6]. Bio-inspired surfaces with micro/nanostructures such as the lotus-leaf-like structure usually can be researched for its special surface characteristics [7]. Many micro/nanostructures surfaces have been fabricated for this kind of surface with parallel microgrooves; it was observed that air pockets associated with the wetting of this kind of surface does not exist during condensation [8]. Also in the later part of the condensation process, the large water droplets are no longer in a Cassie–Baxter wetting state, but are in a Wenzel wetting regime, and increased ice adhesion due to a larger contact area compared to a smooth surface [9]. In order to change this negative phenomenon, a special coating is gradually developed [10].
Many researchers found that the surface energy and the contact angle had the most important influence on the surface foresting or condensation. Forest et al. [11] the use of polymer coatings was evaluated to reduce surface energy, thereby reducing ice adhesion. He concluded that “zero surface energy” coatings can achieve the effect of surface defrosting. If the surface energy is zero, the contact angle should be 180° [12]. Wang et al. developed a sprayable silica nanoporous coating assembled from fluorinated nanochains. Due to the large number of nanopores in the random multilayer stack of nanochains, dewdrops are continuously removed by a self-pushing or self-triggering motion [13]. Wang et al. investigated the performance of water icing on a superhydrophobic surface with a nanofluorocarbon film with an average thickness around 10 nm. His test results show the nanofluorocarbon coating expresses a good anti-icing performance and can be used as a coating material to avoid ice-blocking in the dynamic ice-making system [14]. Moallem et al. the frost quality and thickness growth rate of five kinds of microchannel coils with different surface coating were measured and discussed. Experimental data show that the hydrophilic and hydrophobic surface coated coils have accumulated frost on the heat transfer surface. Under the same test conditions, the difference of heat transfer ability between hydrophobic and hydrophilic coatings on microchannel coils under frost conditions is up to 15% [15]. Wang et al., through a simple method to get modified CaCO3 and a polyacrylate weight ratio of 8/2, developed a superhydrophobic coating for use at a contact angle is 155°. They also found that the frost formed on the superhydrophobic surface was significantly delayed compared to the bare copper surface [16]. Hu et al. a very low cost and simple method is developed to produce superhydrophobic surface by precipitating calcium carbonate (PCC) and fatty acids. The films formed by these hydrophobic PCC show superhydrophobic and self-cleaning properties [17]. Huang et al. [18] used a flower-like superhydrophobic surface that was fabricated on the copper foil base by chemical etching and a fluorination modification. The surface, as seen by scanning electron microscope (SEM), has a double layer of rough structure and low surface energy, such as the lotus leaf. In addition, the water contact angle is as high as 156.2°, on the surface of the water droplets present ideal spherical shape. Zuo et al. [19] superhydrophobic (SHP) surface with ZnO nanorods was prepared by radio frequency (RF) magnetron sputtering. Compared with the bare glass surface and the glass surface coated with permanent room temperature vulcanized silicone rubber, the prepared SHP ZnO surface showed excellent frost resistance. Frost formation on the as-prepared SHP ZnO surface was delayed for 140 min at −10 °C. Chen et al. [20] put forward a kind of simple, low cost, rapid preparation of super hydrophobic surface method, the water contact Angle and rapeseed oil contact Angle is 160° and 15°. The preparation process consists of phosphate co-deposition in phosphating solution and low surface energy materials modified by 1H, 1H, 2H, 2H-perfluorodecyl triisopropyl silane (FAS-17). These methods could achieve the relatively high anti-frosting properties, but usually lead to the weakly adhesive materials, which suffer from the degradation over a long period and easily absorb water and other air impurities, resulting in the degradation of the optical performance of the materials, especially in high-temperature and high-humidity environments [21,22,23].
At present, aluminum plates are widely used in air conditioner evaporators due to their high thermal conductivity, low density, easy processing, wide source and low cost.
In this paper, a novel anti-frosting material was made and the frost testing system was set up. This material was prepared by anodic oxidation method on the polished 99.99% aluminum plates with different nanoporous, then modified with lauric acid to reduce its surface energy. This frost testing system contain the low temperature humidity chamber and air conditioning box. This design can be proposed and tested under different temperature and humidity environment to study the defrosting performance of this novel material. The main purpose of this research is to improve the frost resistance performance of air conditioning evaporator in the winter, reduce the defrosting cycle, achieve energy saving and improve indoor comfort.
As in many papers, the nanoporous aluminum surface is prepared by anodization and then modified by a modifier to reduce the surface energy of the aluminum plates. The main difference between this paper and other papers is the test device, test method, test environment, and data analysis methods. The modifier used in this manuscript is lauric acid, which is cheap but effective. The test device can simulate the real environment in winter, so that the samples can test their performance in real working environment. This test method is a weighing method and improves test accuracy; the scientific analysis of the test data and establishment of a calculate model to promote the use of this test results is beneficial to practical engineering.
2. Experimental Preparation
2.1. Materials
The purity of the aluminum plates are 99.99% (dimensions: 100 mm Length, 50 mm width, 0.2 mm thickness) as substrates, purchased from Guantai Metal Materials Co., Ltd. (Xingtai, China). Ethanol (CH3CH2OH), acetone (CH3COCH3), sodium hydroxide (NaOH), perchloric acid (HClO4) and oxalic acid ((H2C2O4·2H2O) are purchased from Shanghai Bio-way Technology Co., Ltd. (Shanghai, China). Lauric acid is purchased from Henan Dongyang Chemical Products Co., Ltd. (Zhengzhou, China). All of the reagents are of analytical reagent grade.
2.2. Fabrication of Nanoporous Anodic Aluminium Oxide (AAO)
The detailed processes can be summarized as follows. First, the aluminum plates are placed in the ethanol/acetone solution and then cleaned for 10 min in the ultrasonic cleaner to eliminate the oil. Then activation is conducted in 1 mol/L sodium hydroxide solution for 5 min to further remove the dirt and completely remove the natural oxide film on the surface to reveal the pure metal matrix, which is to ensure the uniformity of the surface. After that, the samples are polished in the polishing liquid (perchloric acid/ethanol solution mixed in the ratio of 1:9) by using the aluminum as the anode and graphite as the cathode, and stirring using the magnetic rod for 2 min, then change the polished liquid to oxalic acid solution at 0 °C control box for 10 min. In this process, the magnitude of current is changed to made different aperture of the nanoporous surface, and the current includes 0 A, 1 A, 2 A, 3 A, 4 A, 5 A, 6 A, 7 A (It should be mentioned that in this experimental environment, continuous increase of current could damage the aluminum plates substrates). According to the equifield strength model, the main chemical reactions are as follows [24]:
2Al + 3O2− → 2Al2O3 + 6e−
2Al + 3OH− → Al2O3 + 3H+ + 6e−
Al2O3 + nH2O → 2Al3+ + (3 + n − x)O2− + xOH− + (2n − x)H+
Finally, the samples are immersed in ethanol solution with 1% lauric acid for 30 min, then transmitted into a 120 °C oven for 30 min drying. The super-hydrophobic surface can be successfully prepared. Lauric acid is a saturated fatty acid and is insoluble in water. After nano-alumina surface modifying by lauric acid, a complete single-molecular organic modification layer can be formed on the nano-alumina surface, so that the nano-alumina surface changes from hydrophilic to hydrophobic. At the same time, lauric acid is inexpensive and easy to obtain. Therefore, lauric acid was selected as the surface treatment agent in this experiment. After each step it must be washed with deionized water and dried in a dryer.
2.3. Characterization
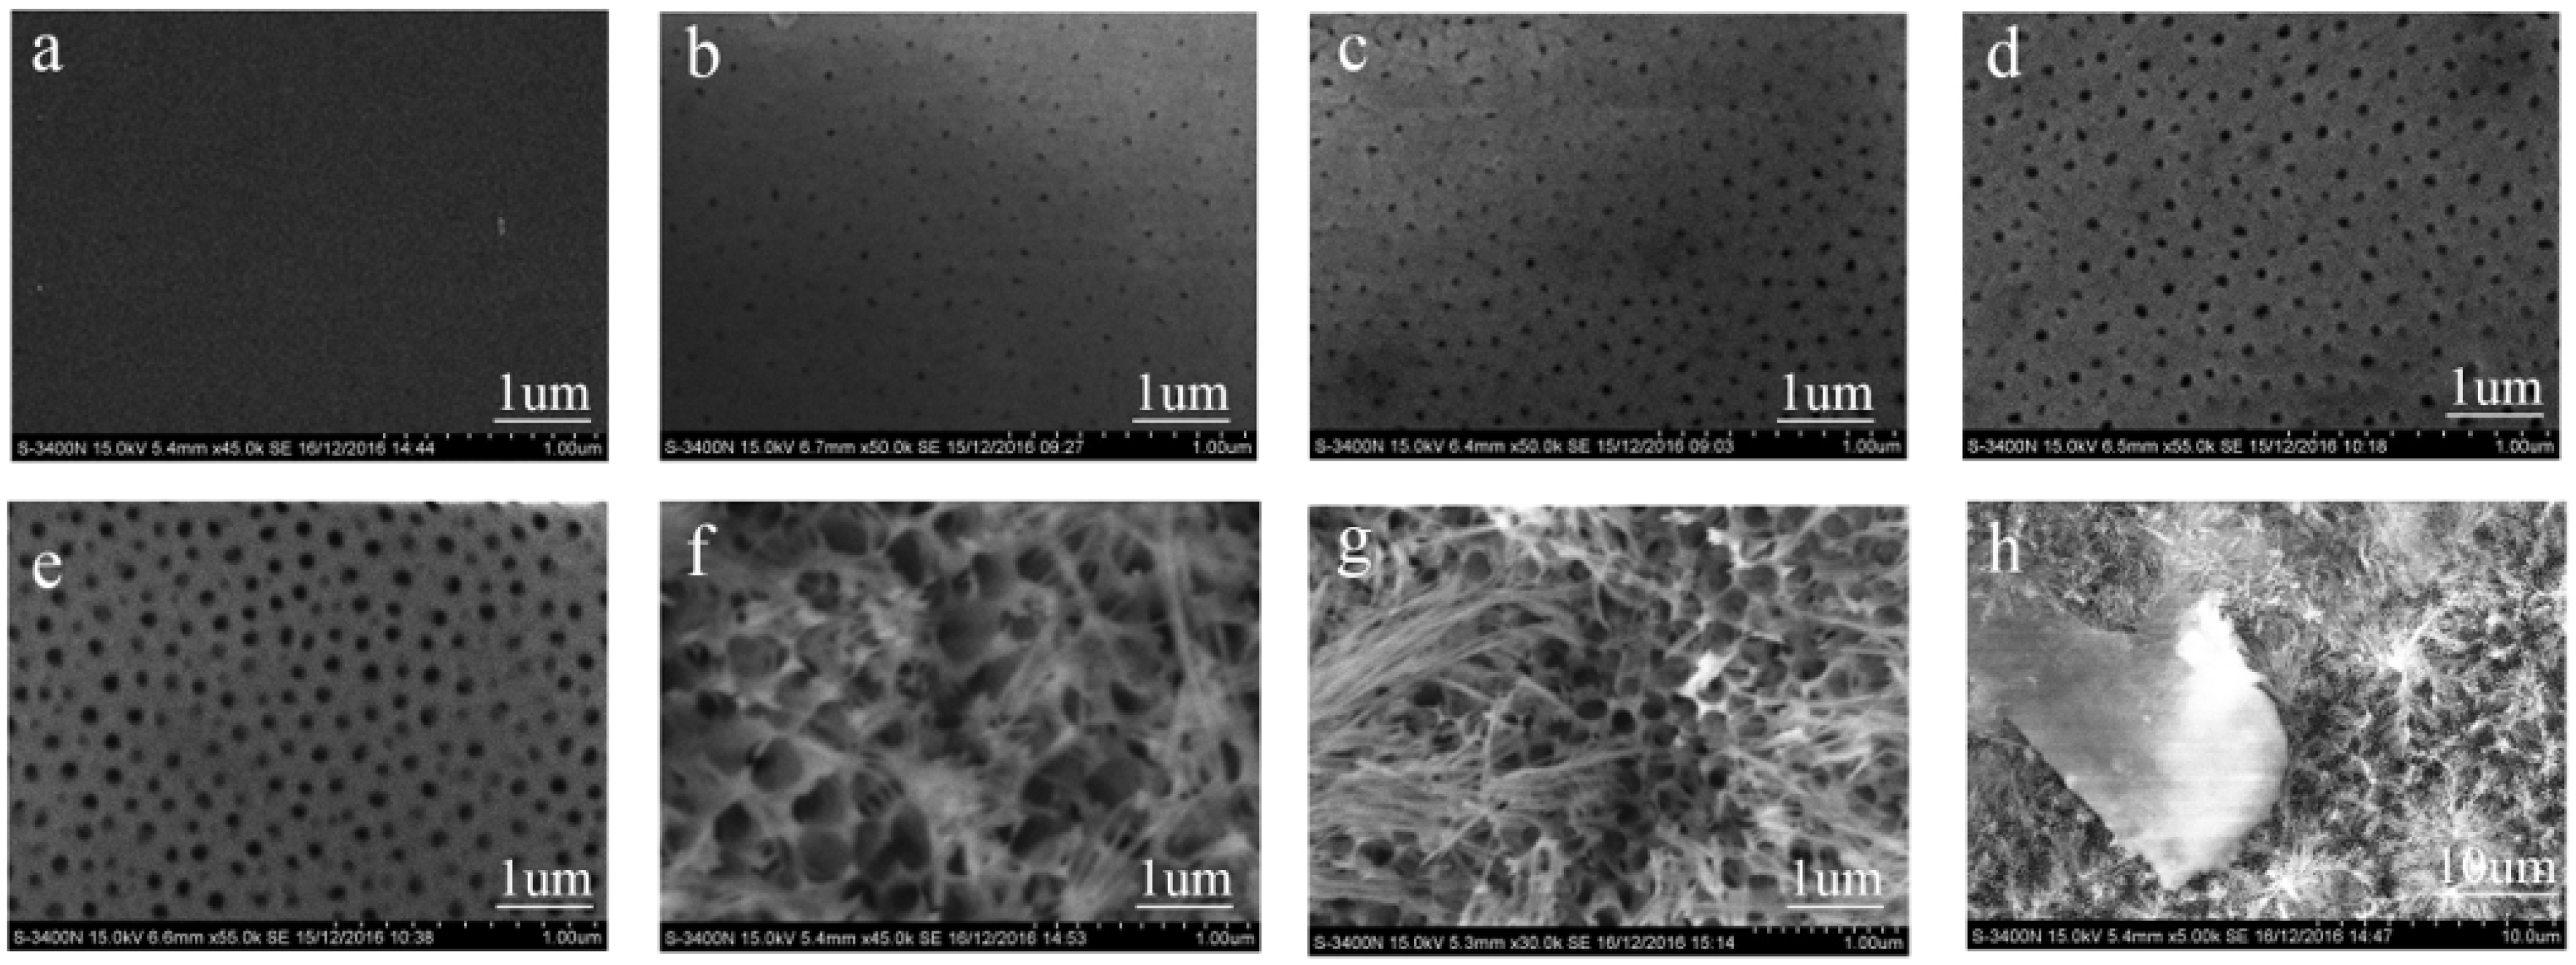
The surface morphology of the prepared coatings was investigated by scanning electron microscope (SEM) (S-3400N, HITACHI, Japan). The wetting property was evaluated by water contact angle using contact angle measuring instrument (MHT-SD1, China). Each sample was measured in five different locations with an 8-μL deionized water drop and averaged as the final value. The test results are shown in Figure 1, Figure 2 and Figure 3. Figure 1 shows the SEM images of AAO by anodized with different magnitude of current. Figure 2 and Figure 3 show the corresponding wettability of the prepared surfaces.
Figure 1a shows the aluminum plates that were just polished, being smooth and flat. When the magnitude of current was increased to 1 A (Figure 1b), it was observed that the nanoporous surfaces were arranged in a dense order on the surface template and shape of the rules of the hexagonal structure, exactly like “honeycomb”. The current was increased to 2 A, 3 A, and 4 A (Figure 1c–e), respectivelyl. The number of nanoporous did not obviously change, but the size increased with the current. The average nanopore size was 15–70 nm. With the magnitude of current increased to 5 A (Figure 1f), the nanoporous diameter continues to increase, close to 110 nm, another change is that the linear structure appears on the surface, in other words, the surface roughness had increased, while the surface structure had a tendency to be destroyed. Figure 1g showed the SEM images of AAO with current magnitude of 6 A. It could be observed that the nanoporous was fully covered with linear structure, and the porous size were difficult to determine, but it was certain that the surface roughness was further increased; in addition, some nanoporous had been damaged, but still had nanostructures. However, as the current magnitude was increased to 7 A (Figure 1h), some parts of the surface of the nanostructures were completely destroyed, and the polishing layer appeared. In other words, the surface roughness evolved toward the polishing sheet. In conclusion, both the size of nanoporous and the surface roughness increase as the current increases until the surface structure is destroyed.
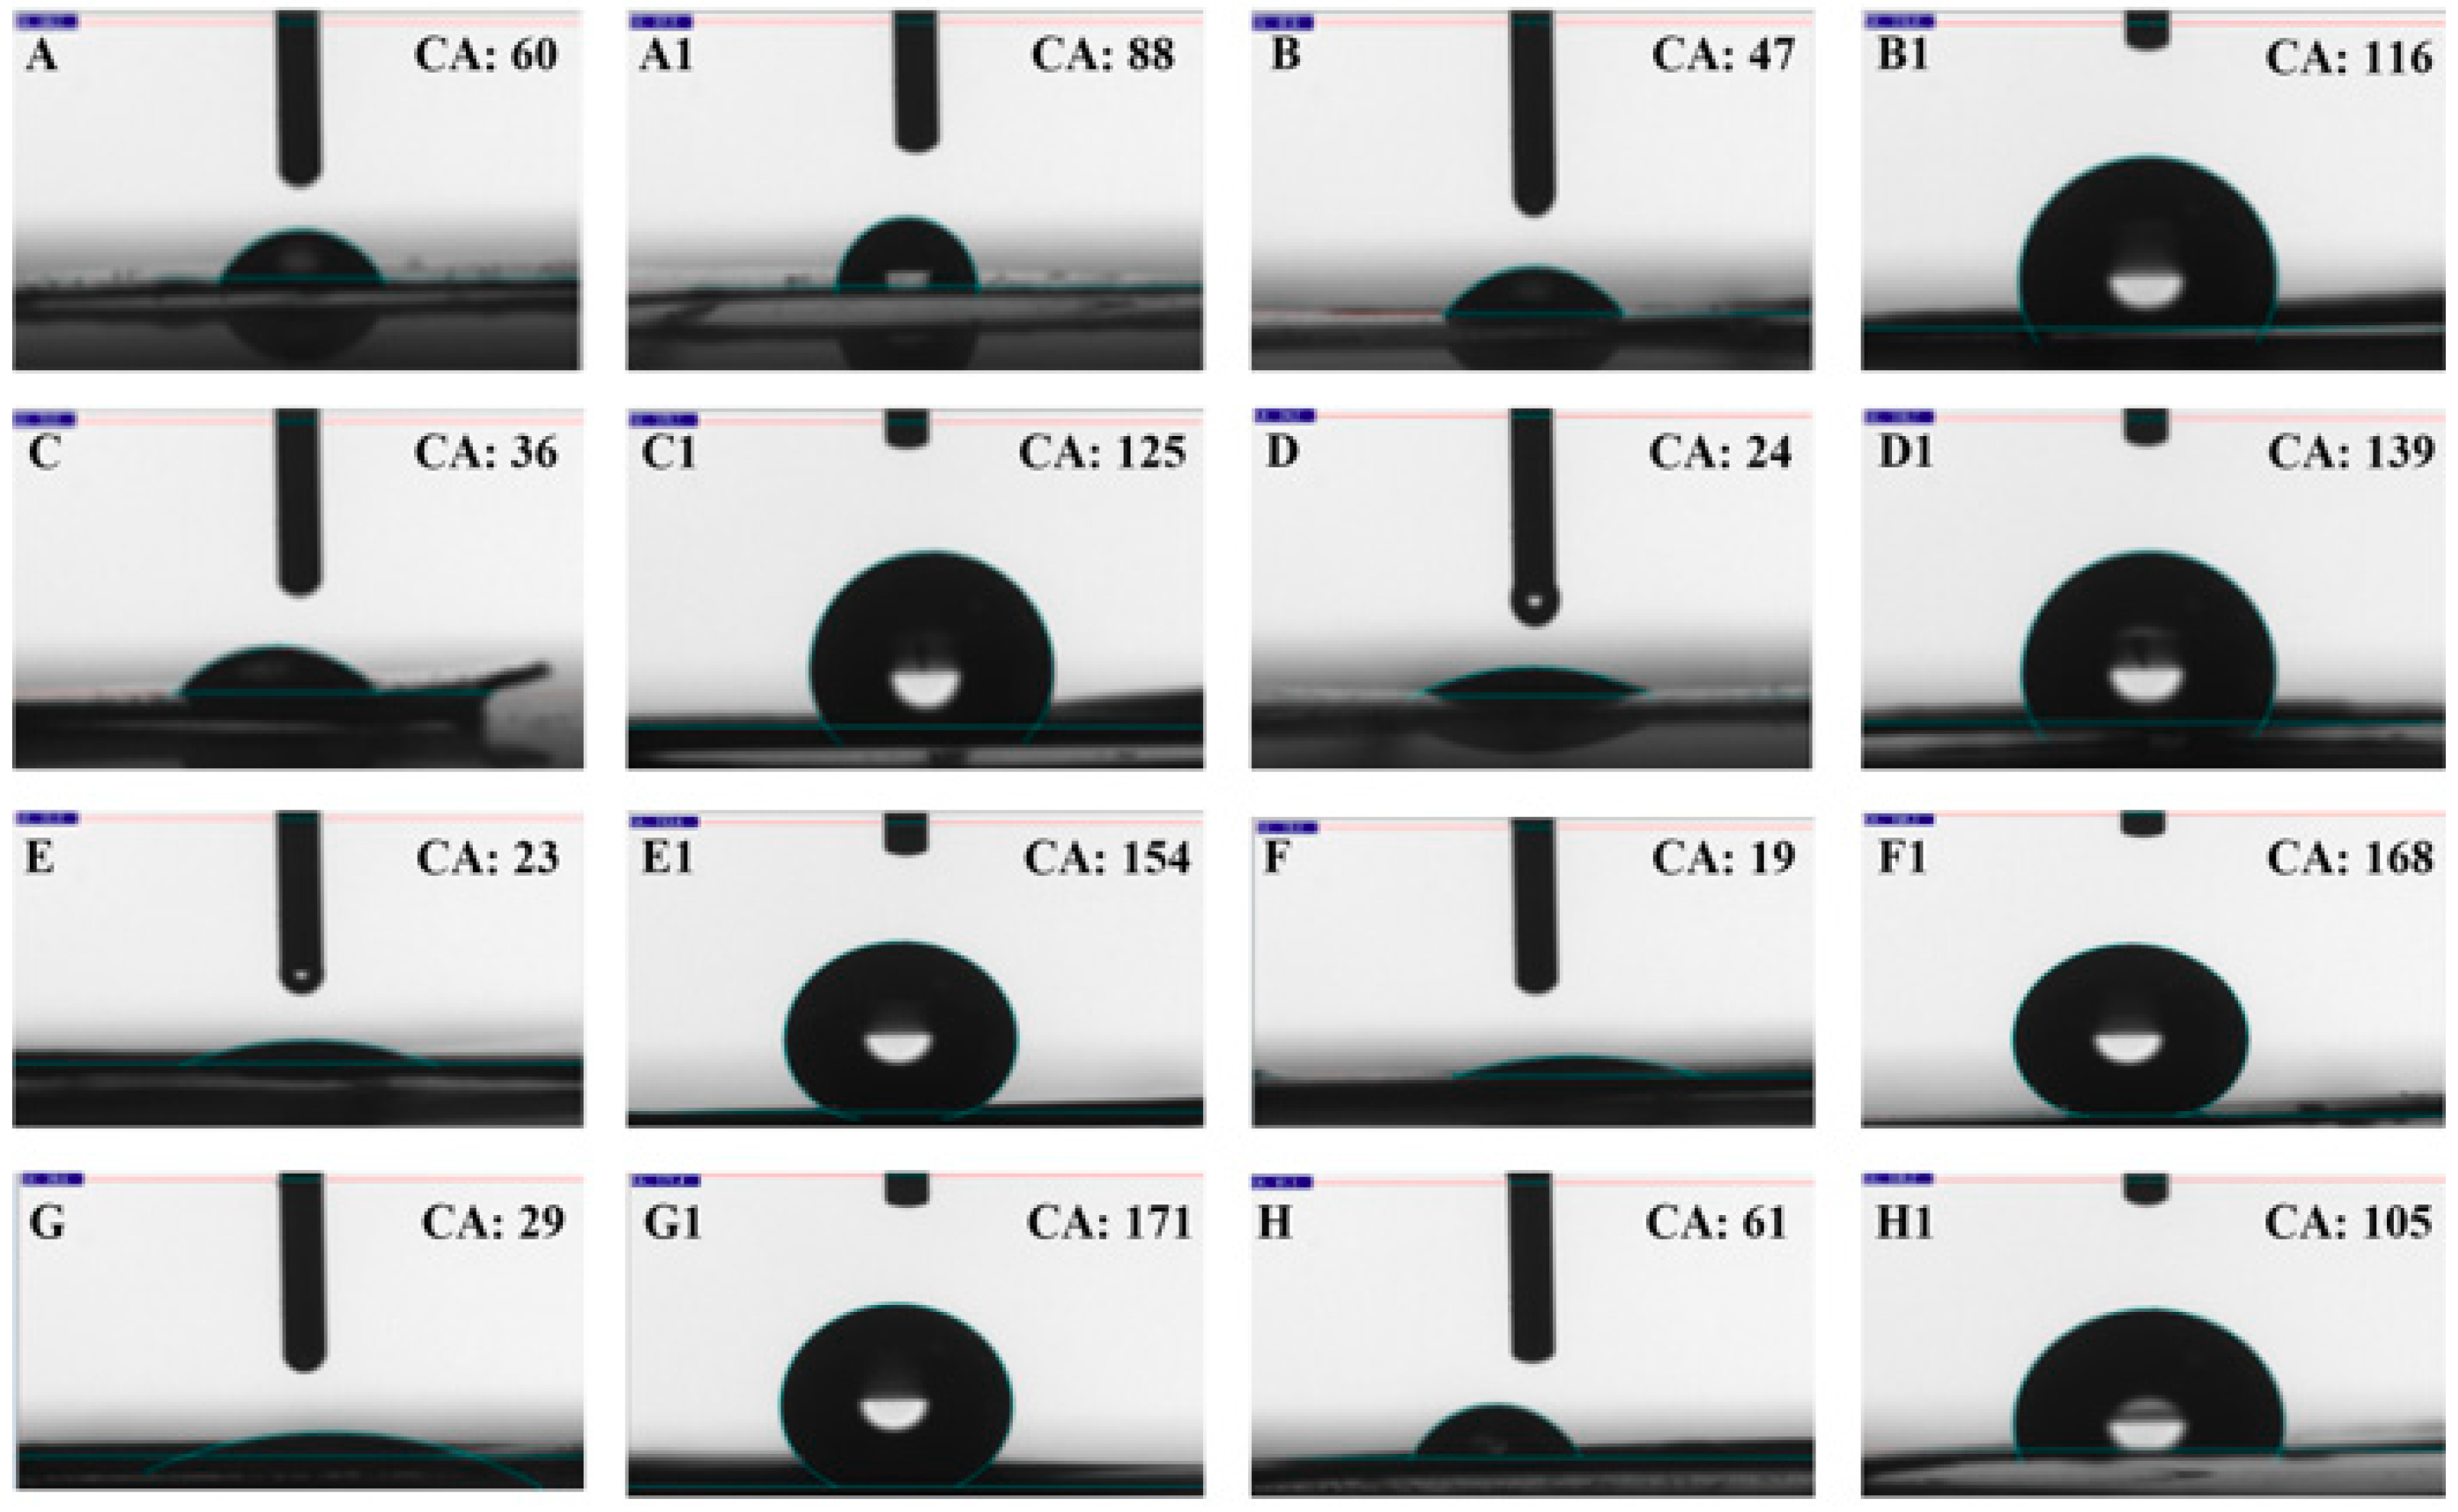
Figure 2 and Figure 3 show that when the current is 0 A, 1 A, 2 A, 3 A, 4 A, 5 A, 6 A and 7 A, the contact angle can be reached at 60°, 47°, 36°, 24°, 23°, 29°, 61°, respectively, before the surface modified by lauric acid. Obviously, the wettability should be the Wenzel mode (Figure 4b). At 0–5 A, the contact angle is inversely proportional to the current. The main reason is that the surface has little or no apparent linear structure. The only impact factor is pore size, and the current is proportional to the pore size. Large nanoporous size increases the new surface area, and then the surface energy can be increased as well [25]. So, the surface energy is inversely proportional to the contact angle. With current increased to 6 A, the contact angle is increased slightly; due to the appearance of the linear structure, the contact of the droplets with the surface may be reduced. As the current increased to 7 A, the surface morphology tends to be polished, therefore it has a similar contact angle with the polishing plate (0 A). After modification by lauric acid, the prepared coating has been changed from hydrophilic state to hydrophobic state, and the contact angle increases with increasing current until the surface damaged. The main reason is that lauric acid can reduce the surface energy of aluminum plates, so that it cannot destroy the droplet surface intermolecular force, showing the Gassie state (Figure 4c). The maximum contact angle is 171°, which occurs when the current is 6 A. Therefore, it can be concluded that increasing the surface roughness can increase the air pocket area. Then, by using surfactant modification to reduce the surface energy, the contact area of aluminum plate surfaces can be reduced with droplet surfaces, and increase the contact angle of the aluminum plates.
3. Theoretical Analysis
Frost formation on a cold surface need to water vapor removal a part of energy which is expressed by Gibbs free energy [6].
And its differential form is given by
The process of phase change is isothermal, so
The latent free energy [6]
Under thermodynamic equilibrium, the water vapor nucleation tends to reach a minimum energy state in which either a homogeneous or a heterogeneous is attained [26]. As shown in Figure 5.
Both surface area and volume of heterogeneous nucleation are smaller than homogeneous nucleation, which is mainly caused by surface tension at the three interfaces. As a consequence, the energy required to initiate the nucleation process is lower.
Associated with the surface tensions at the embryo interfaces, the total nucleation energy can be calculated from [6]
By a mathematical geometry calculation for a semispherical embryo of radius r as in Figure 5b, this equation could be obtained
Combining Equation (6) to Equation (10), Equation (5) can be rewritten as
The Gibbs free energy is the potential barrier for supersaturated vapor to change from its metastable phase into the stable phase. And the phase transition can happen only if the process will result in a decrease in the Gibbs free energy of the system. There will be an critical radius, r′ for the initial water droplet to promote the Gibbs free energy decrease as the water droplet grows.
Making:
which yields
So the minimum energy barrier to be overcame could be obtained by substituting Equation (13) into Equation (11).
From Equation (14), the conclusion can be obtained that at the same temperature and same relative humidity, minimum energy barrier is proportional to ƒ(θ).
From Equation (15) can have
Since θ is within 0° and 180°, and sinθ ≥ 0, therefore,
That is to say, ƒ(θ) is monotonically increasing with θ. Hence, increasing the surface contact angle will increase its energy barrier to improve the surface’s frost resistance.
4. Experimental Test
In order to investigate the frosting properties of the prepared aluminum sheets, a set of testing rigs were designed and test results analyzed by a weighing method. The testing was carried out on a cold surface temperature of −10 °C, ambient temperature of −6 °C, relative humidity of 58%, and the average wind speed at the surface was 1.5 m/s, which is a typical winter environment in northern China. Further tests will be conducted for wide range of the temperature and relative humidity. The testing rigs can simulate the real running environmental of the evaporator heat transfer fins. The testing time is 30 min, 60 min, 90 min, 120 min, 150 min, and 180 min, respectively. Then, by calculating the difference in weight with the initial aluminum plate, the frosting properties can be analyzed.
4.1. System Description
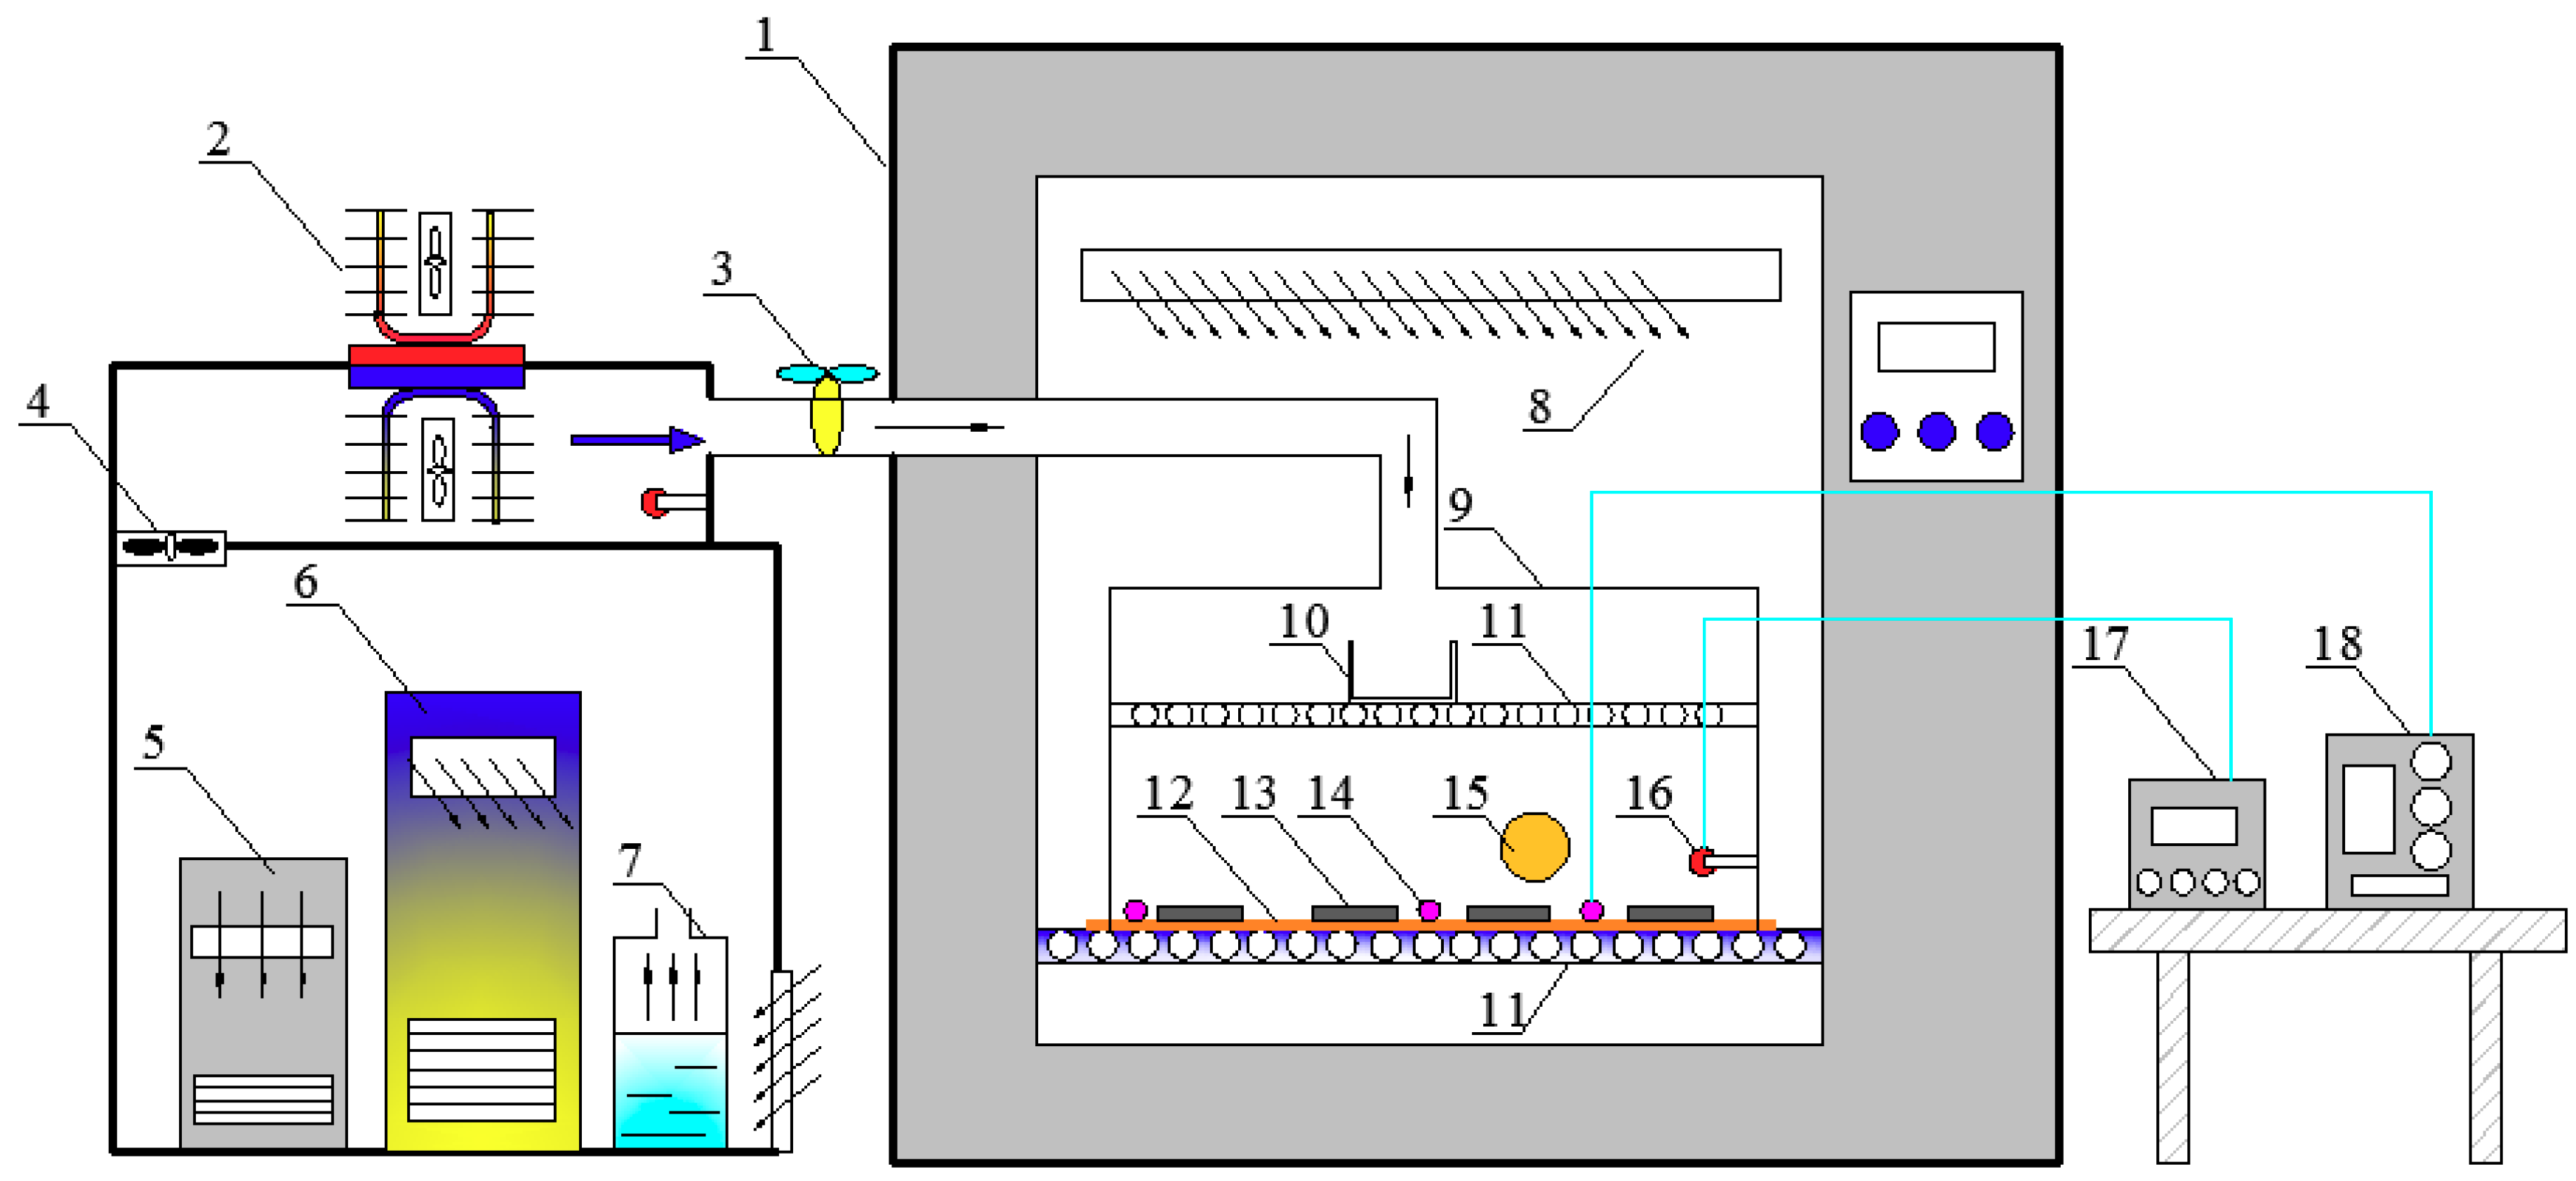
The proposed system (as shown in Figure 6) is constituted of the low temperature humidity chamber, semiconductor refrigerator, temperature and humidity control box (contain dehumidifier, mobile air conditioning and ultrasonic humidifier), duct, closed box, condensate container, diversion grid, and copper plate.
The working principle of the system can be summarized as follows: Air going into the low temperature humidity chamber will first pass through the temperature and humidity control box, which is guarantee the testing rig to adapt the variety environment conditions, and to keep the air parameters consistent. The function of the semiconductor refrigerator is to reduce the enthalpy of the air to decreases the air temperature difference with the closed box, and the draught fan can draw the air enter into the low temperature humidity chamber. The air will produce condensate in the pipe, so a condensate container is set up. When the air enters the closed box, it first passes through the diversion grid that can insure the air enters the lower layer of the box and reaches the testing aluminum plate’s surface uniformly. The low temperature humidity chamber is cooled by air; the cold air will pass through the diversion grid and reach at the copper plate, and the temperature of the copper plate is tested by thermocouples. Before starting a test, the low temperature humidity chamber is turned on, and the temperature is set to the prescribed value. During the cooling process of the copper plate, the temperature and humidity control box and semiconductor refrigerator will run, but the draught fan and the air valve did not to turn on. The purpose is to isolate the aluminum plate surfaces from the air. When the plate’s temperature reached its prescribed value and the whole system is keeping steady, the draught fan begins to operate, the valve is opened, and date acquisition begins to run.
4.2. Construction of the Testing Rig
In order to investigate the frosting properties of the prepared aluminum plates, the testing rig (shown in Figure 7) was constructed at the laboratory of Guangdong University of Technology, China. The characteristics of the devices used in the experiments are presented in Table 1. The temperature and humidity control box of 1200 mm in length, 700 mm in width, and 900 mm in height is made of color-coated steel insulation panels of 50-mm thickness, which includes a dehumidifier, mobile air conditioning, and a humidifier for producing different air humidity. The mobile air conditioning is present to ensure the parameters of the air entering the low-temperature humidity chamber is kept consistent. The duct is made of plastic with a 40-mm diameter and it is wrapped with insulating material with a thermal conductivity in the range of at 0.04–0.2 W/(m·k) to prevent ice formation. The closed box with a length, width, height and thickness of each at 250 mm, 200 mm, 150 mm, and 20 mm, respectively, are made of extruded sheet. The condensate container is made of plastic with 50 mm diameter and 50 mm in height. The upper diversion grid is made of wood with a 5-mm diameter pores and the pitch of the pores are 10 mm. The under diversion grid is made of stainless steel with 20 mm diameter porous and the pitch of porous are 10 mm. The copper plate with the length, width and thickness of each at 300 mm, 250 mm, and 0.5 mm respectively, and the thermal conductivity is about 400 W/(m·k).
5. Results and Discussion
Through the above testing equipment, the frost weight of different aluminum plates under different working conditions can be obtained. The frost weight changes with time can be derived, and the effect of contact angle and nanopores on the frosting properties of aluminum plates can be analyzed.
5.1. The Effect of Contact Angle on the Frosting
From the experimental measurements and calculation, the weight of the frost and the average frosting rate can be derived and analyzed, the effect of contact angle on the frosting properties of aluminum plates can be gained. The results of the testing is presented and discussed as follows.
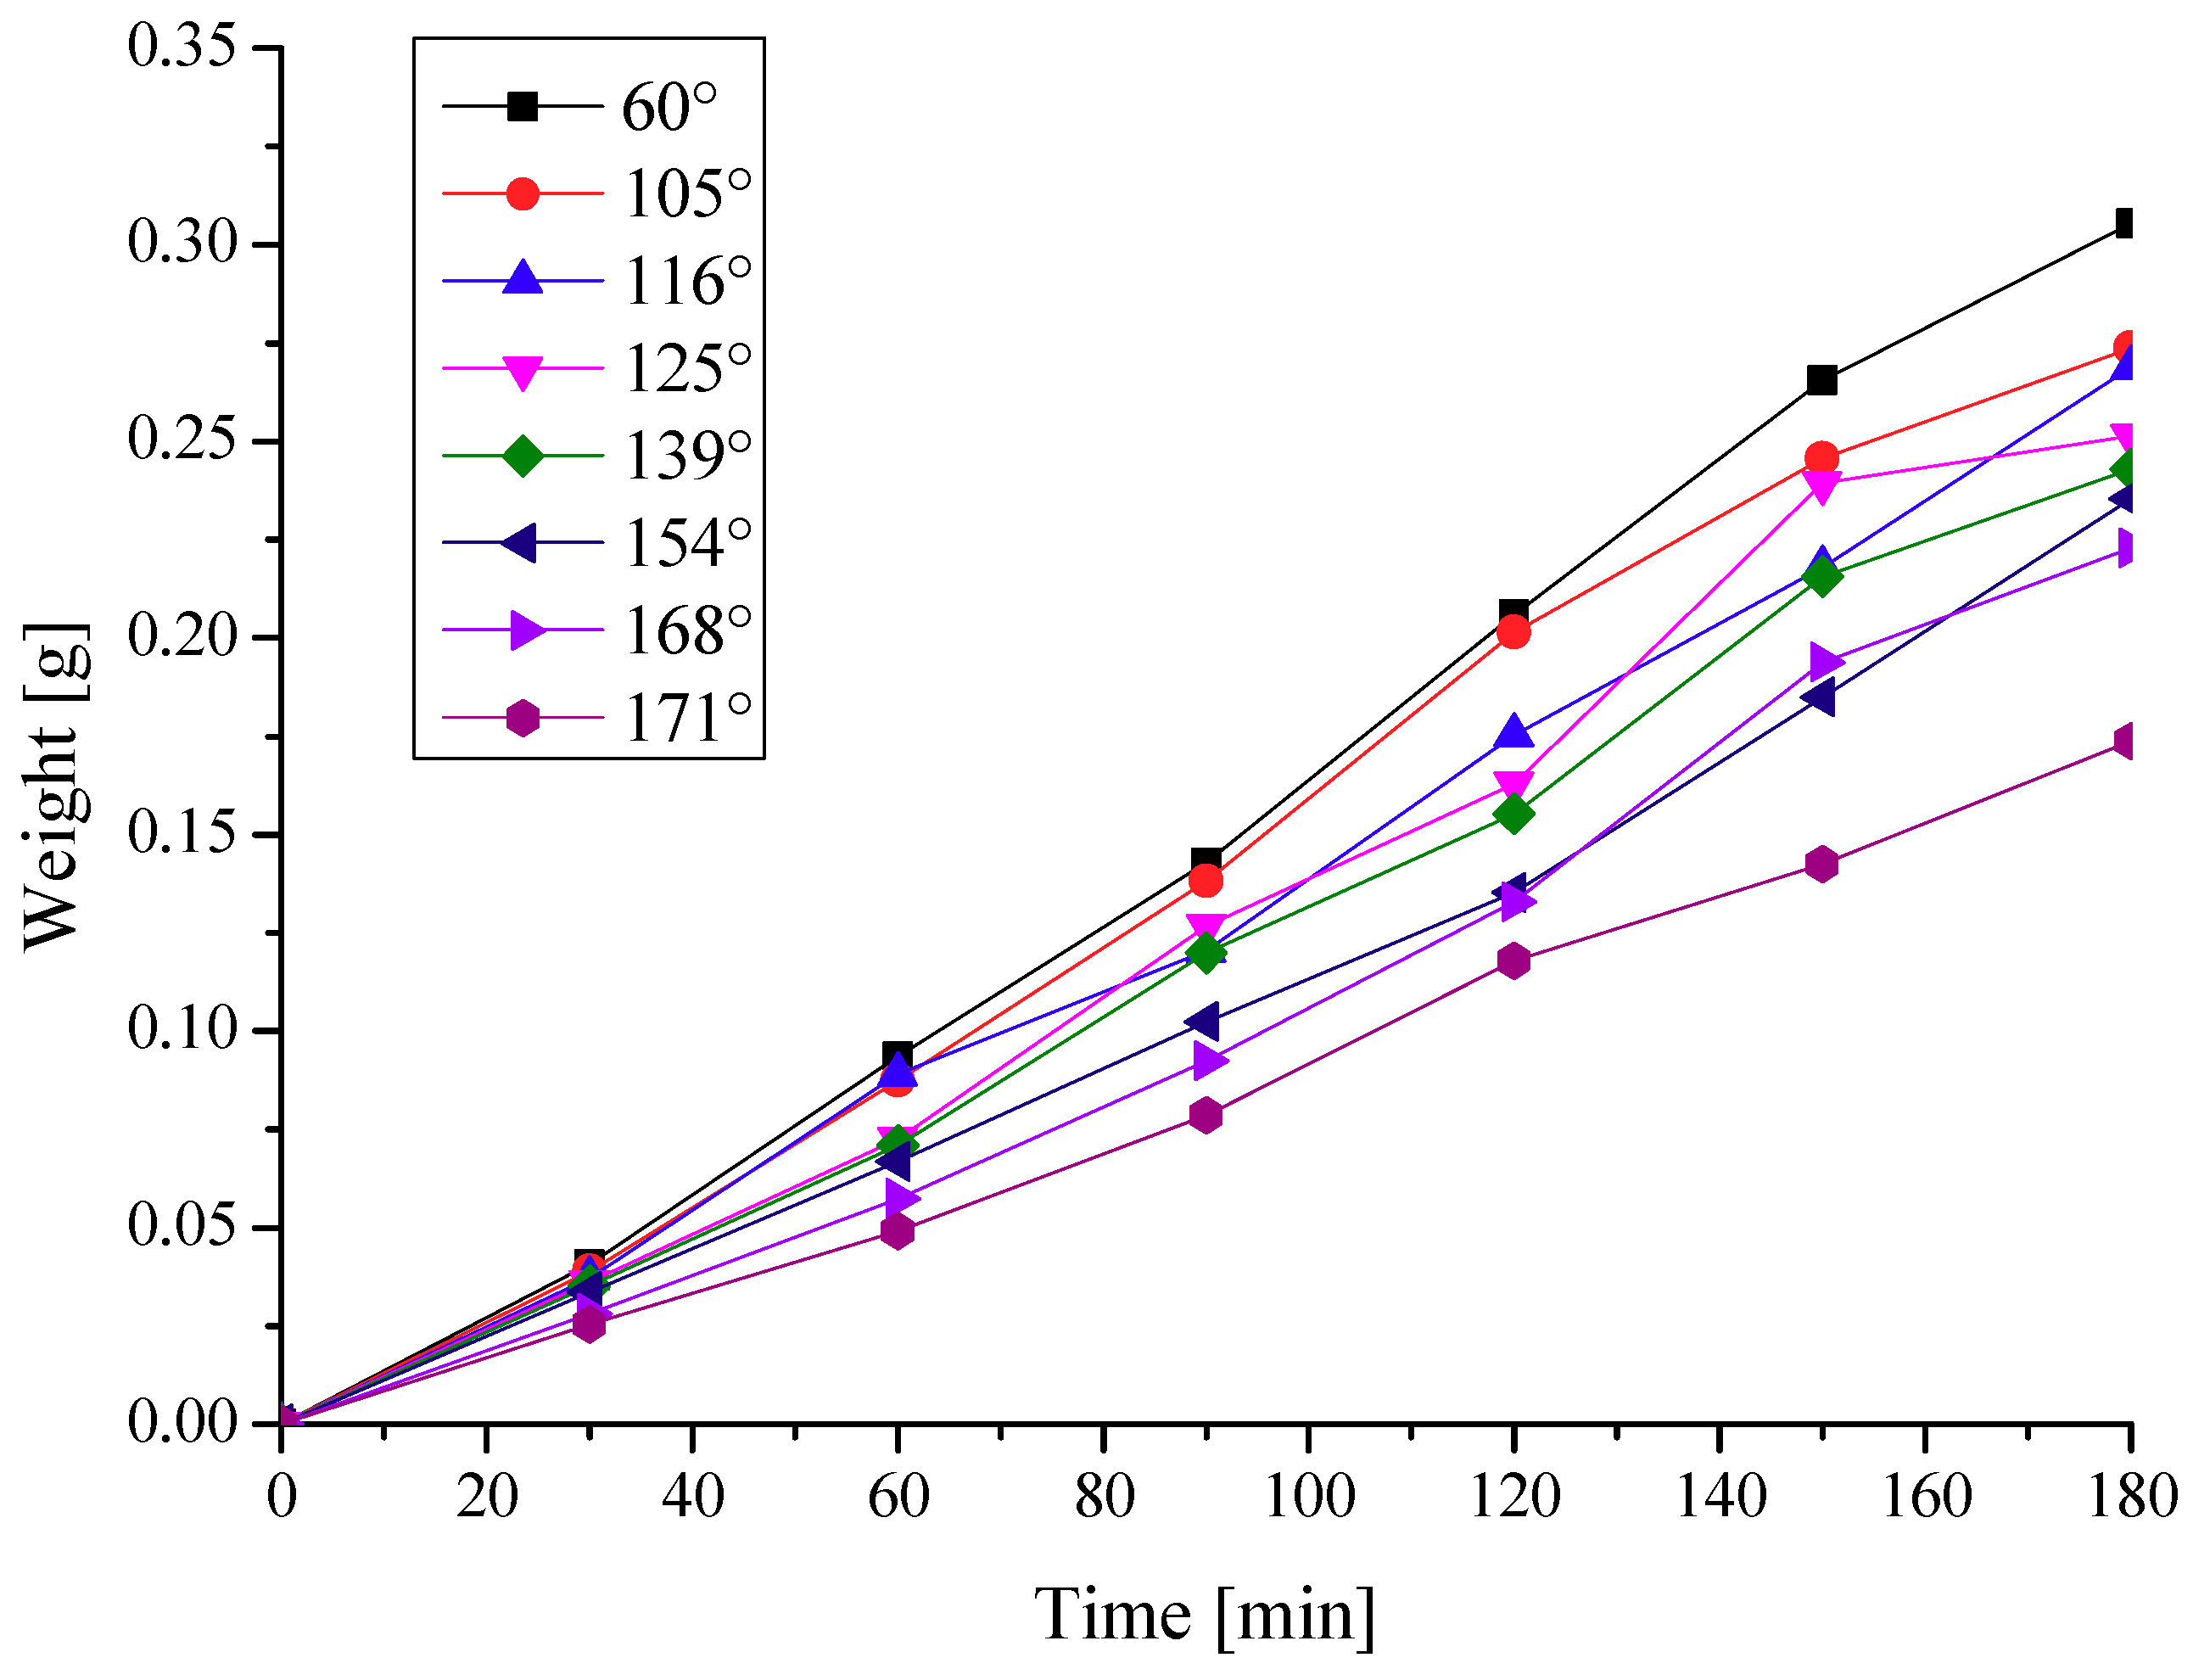
- The frost weight is increased with the time and it has a linear growth trend with the time increasing. The fitting models formula between frost weight and time are shown in Table 2.
- It can be seen from this diagram that the contact angle has a strong effect on the frost deposition process. The frost weight reaches the maximum at 0.31 g, corresponding to the aluminum plate with the contact angle of 60°, which is 1.8 times to the aluminum plate with the contact angle of 171° (0.17 g).
- After 1 h, except for the aluminum plates with the contact angle of 154°, 168° and 171°, the other aluminum plates corresponding to the curve in Figure 8 are a cross-phenomenon or very close to it, and after 2 h, only the aluminum plate with the contact angle of 171° did not appear cross-phenomenon or very closely. It is due to the surface hydrophobicity that can only influence the early-stage behavior of frost formation before the aluminum sheet is completely covered by the frost. It will not produce any significant effects on the longer-term frost deposition process [27]. So it can be concluded that the aluminum plates with the contact angle of 60°, 116°, 125° and 139° are completely covered by the frost after 1 h, and the superhydrophobic aluminum plates with the contact angle of 154° and 168° are completely covered by the frost after 2 h, and the superhydrophobic aluminum plate with the contact angle of 171° ca not be completely covered by the frost after 3 h yet. These test results show that the frosting time can be prolonged with the increasing contact angle.
- Figure 9 shows the average frosting rate with a different contact angle. As the aluminum plates contact angle increases, the frost weight growth rate is decreased sharply. The frosting rate correspond to the aluminum plate with the contact angle of 60° is 0.33 [g/(min∙m2)], and correspond to the aluminum plate with the contact angle of 171° is 0.19 [g/(min∙m2)].
- The phenomenon of this experiment is consistent with the results of theoretical analysis. A large contact angle can lead to a large Gibbs free energy, and then the potential barrier needed for frost formation can also be improved, therefore the aluminum plates with large contact angle will have a better anti-frosting performance than those with small contact angle.
5.2. The Effect of Nanoporous Size on Frosting
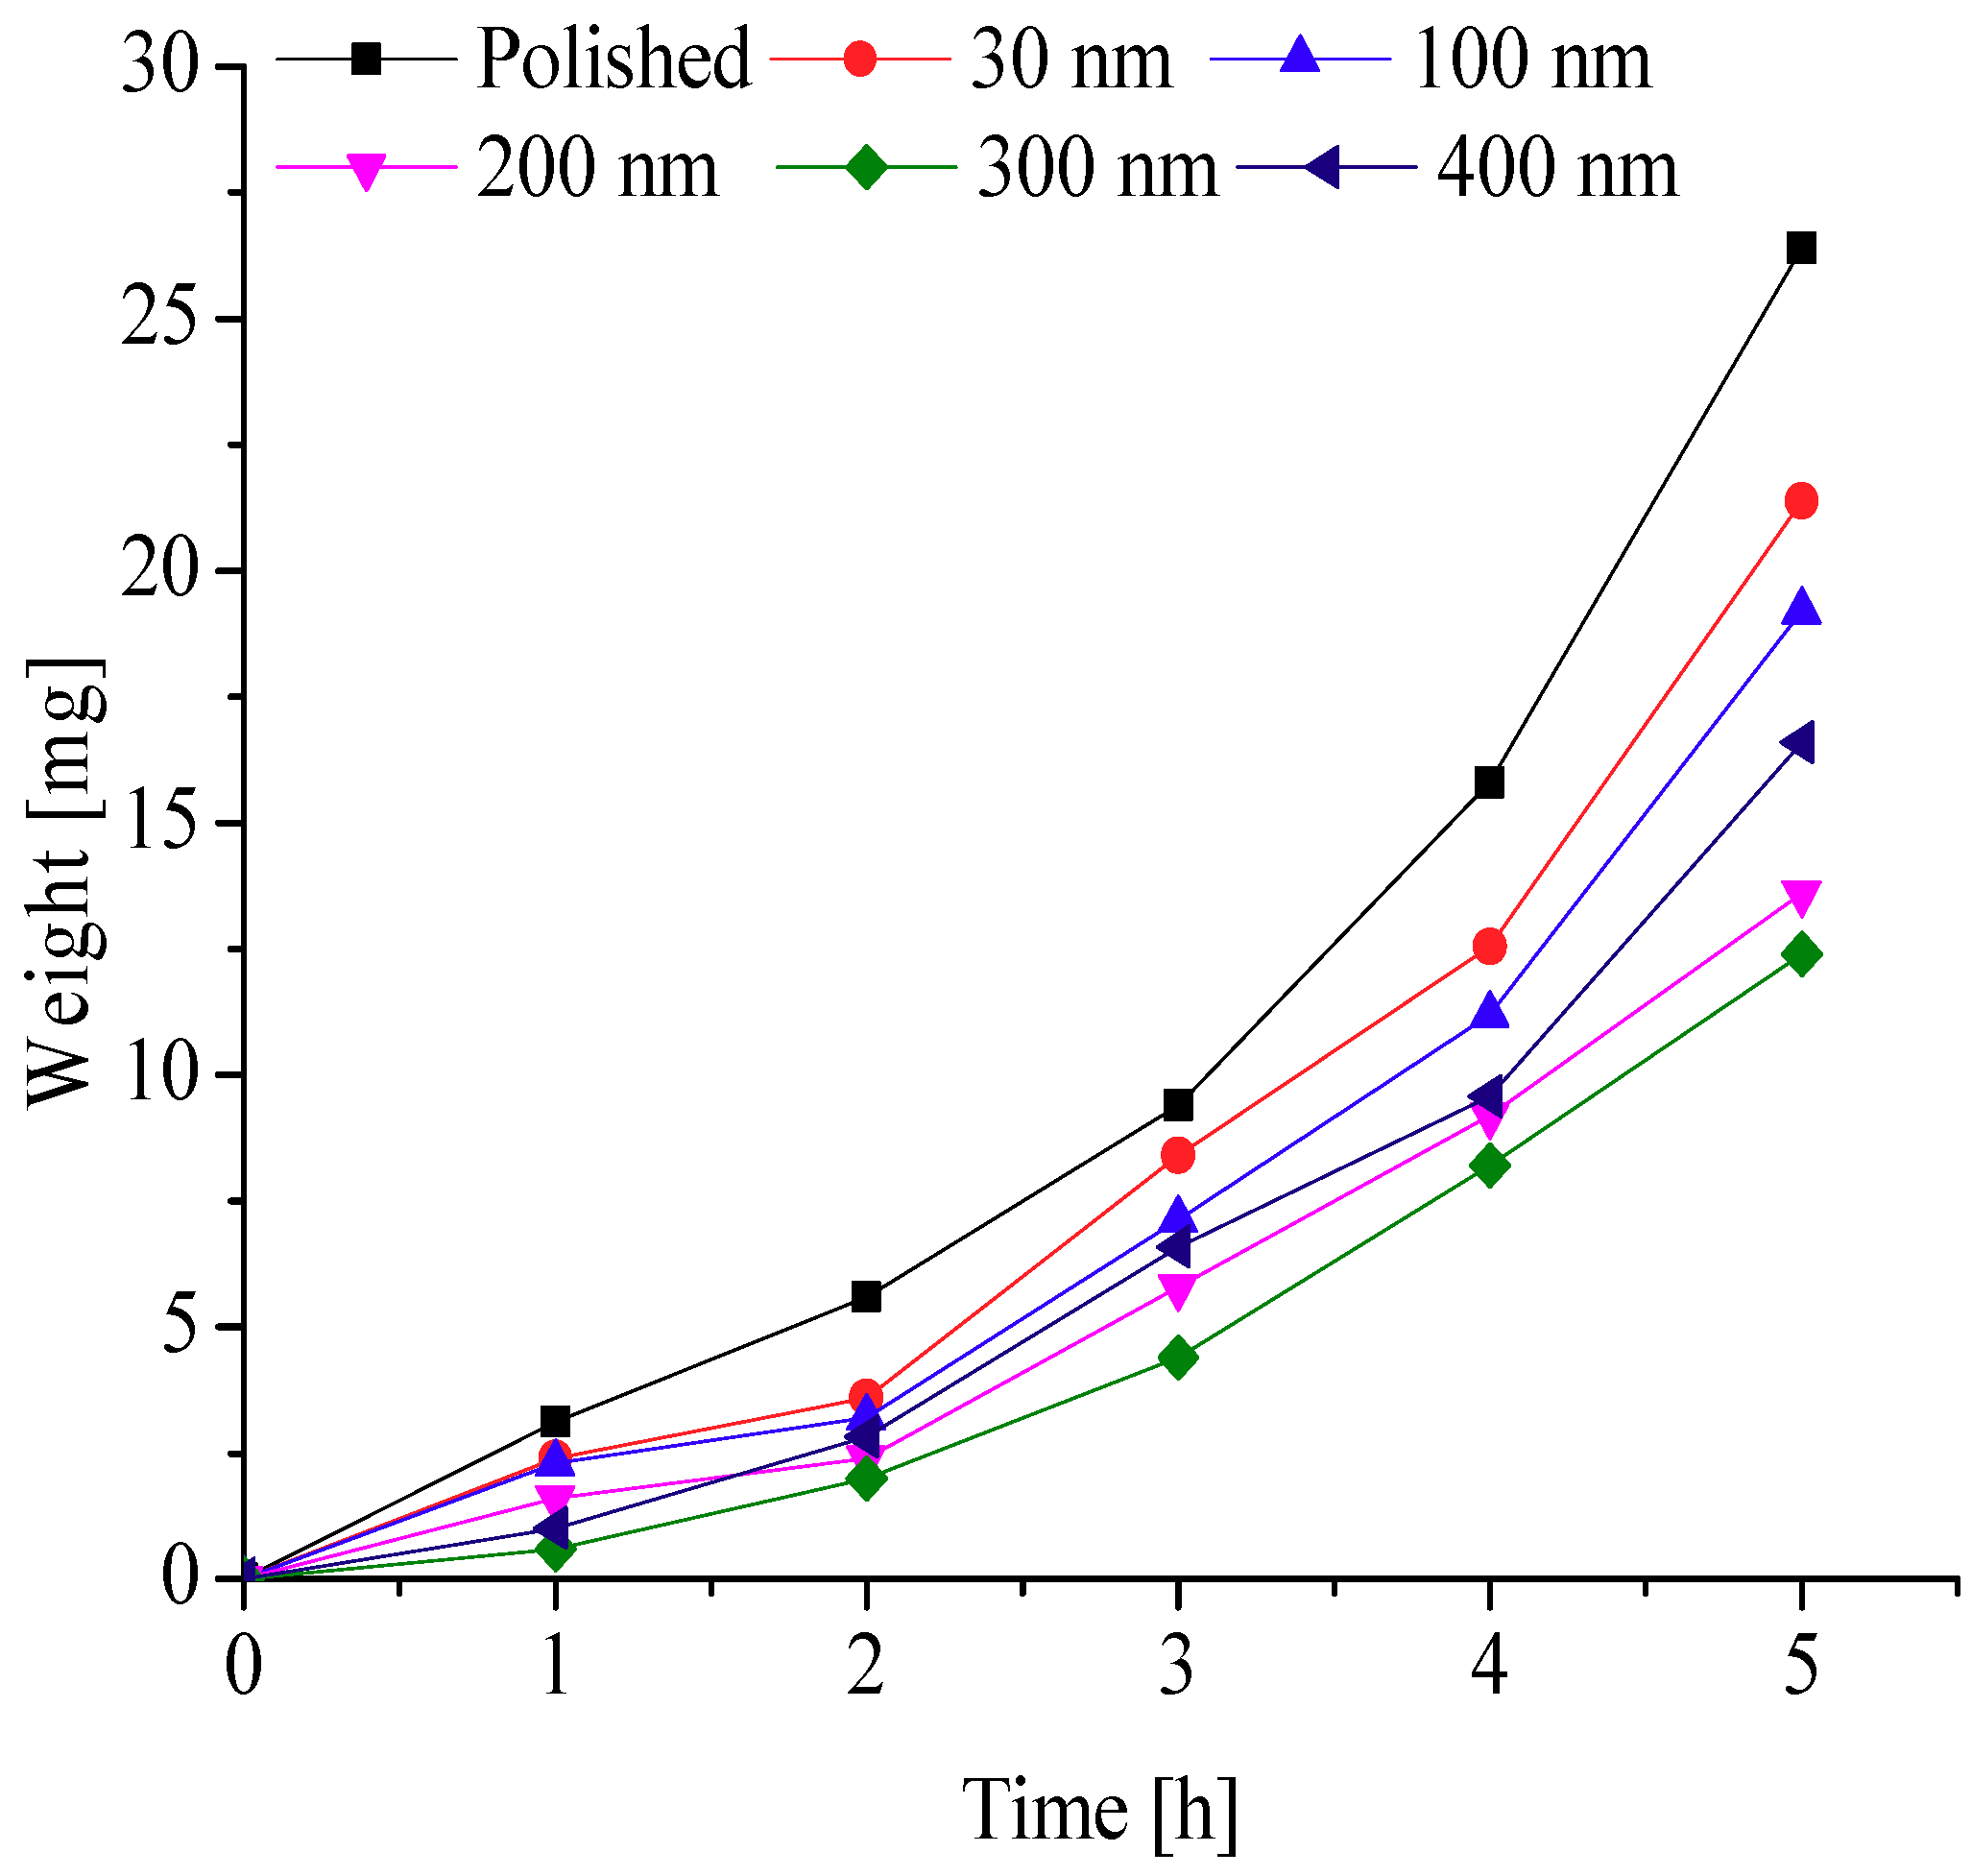
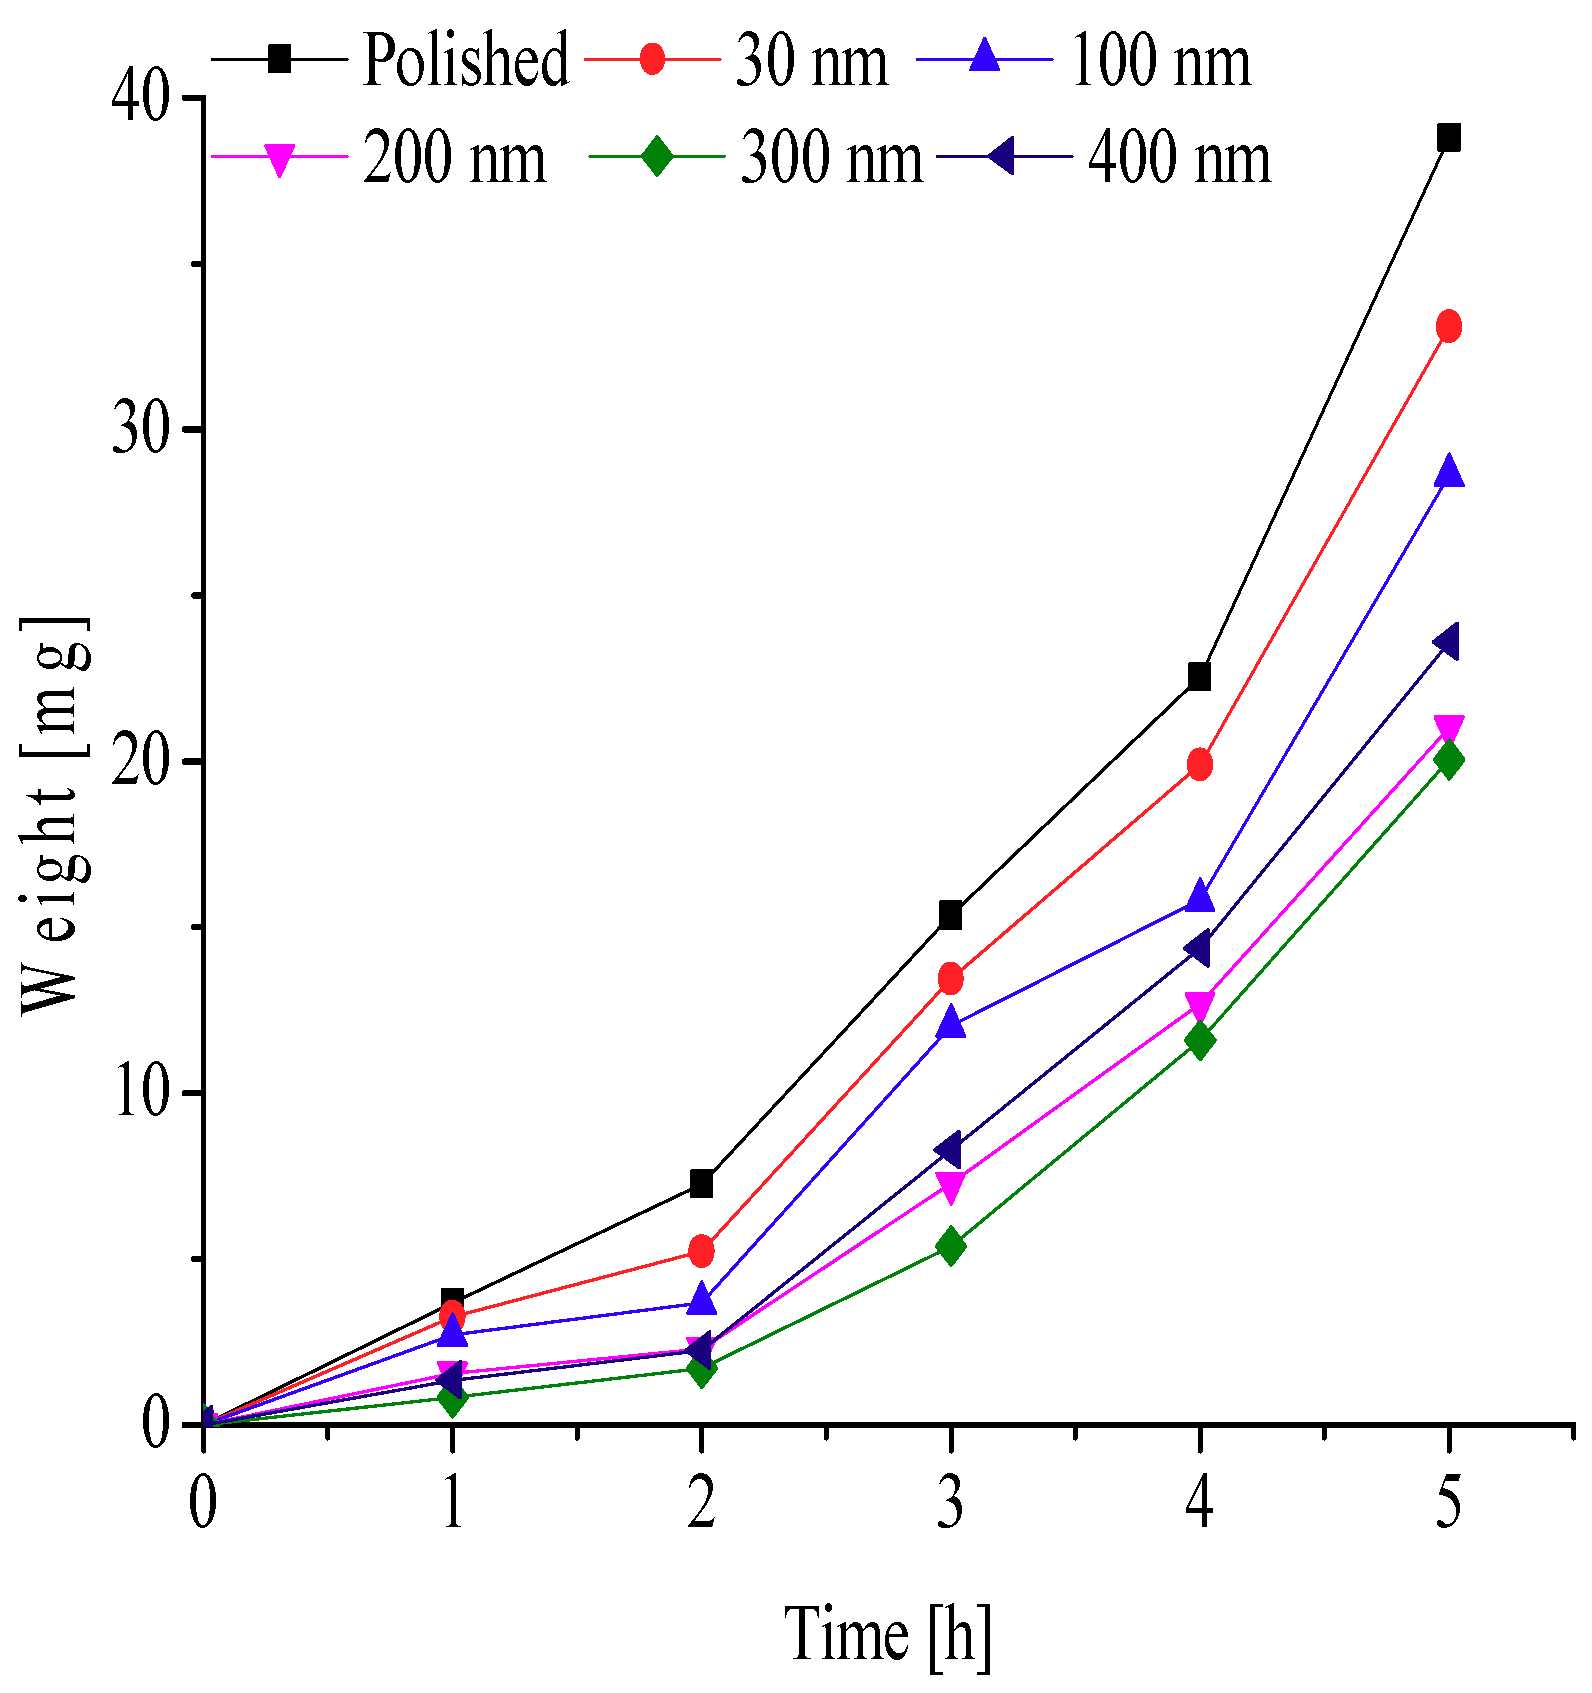
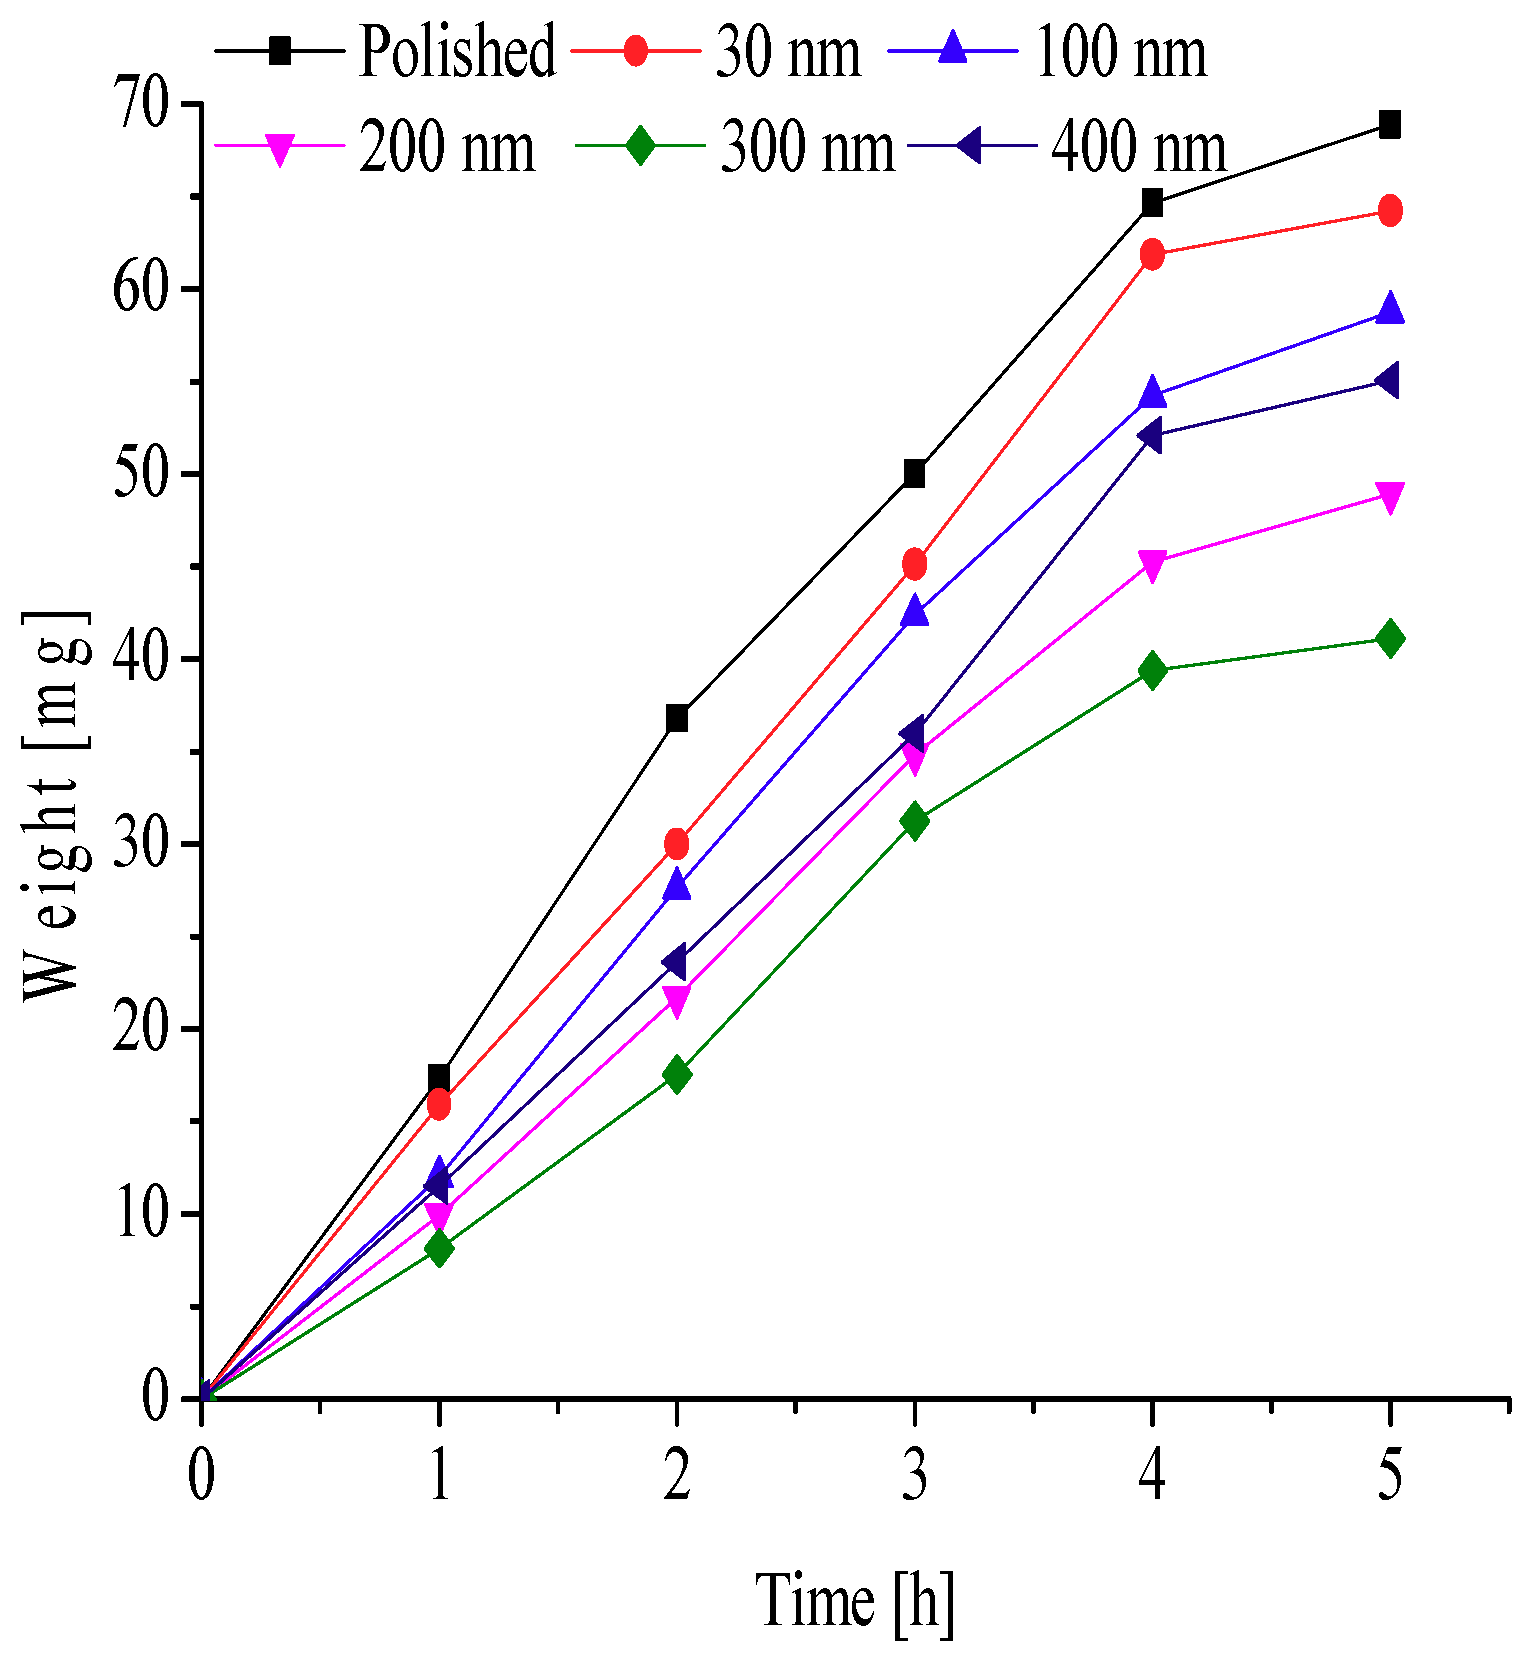
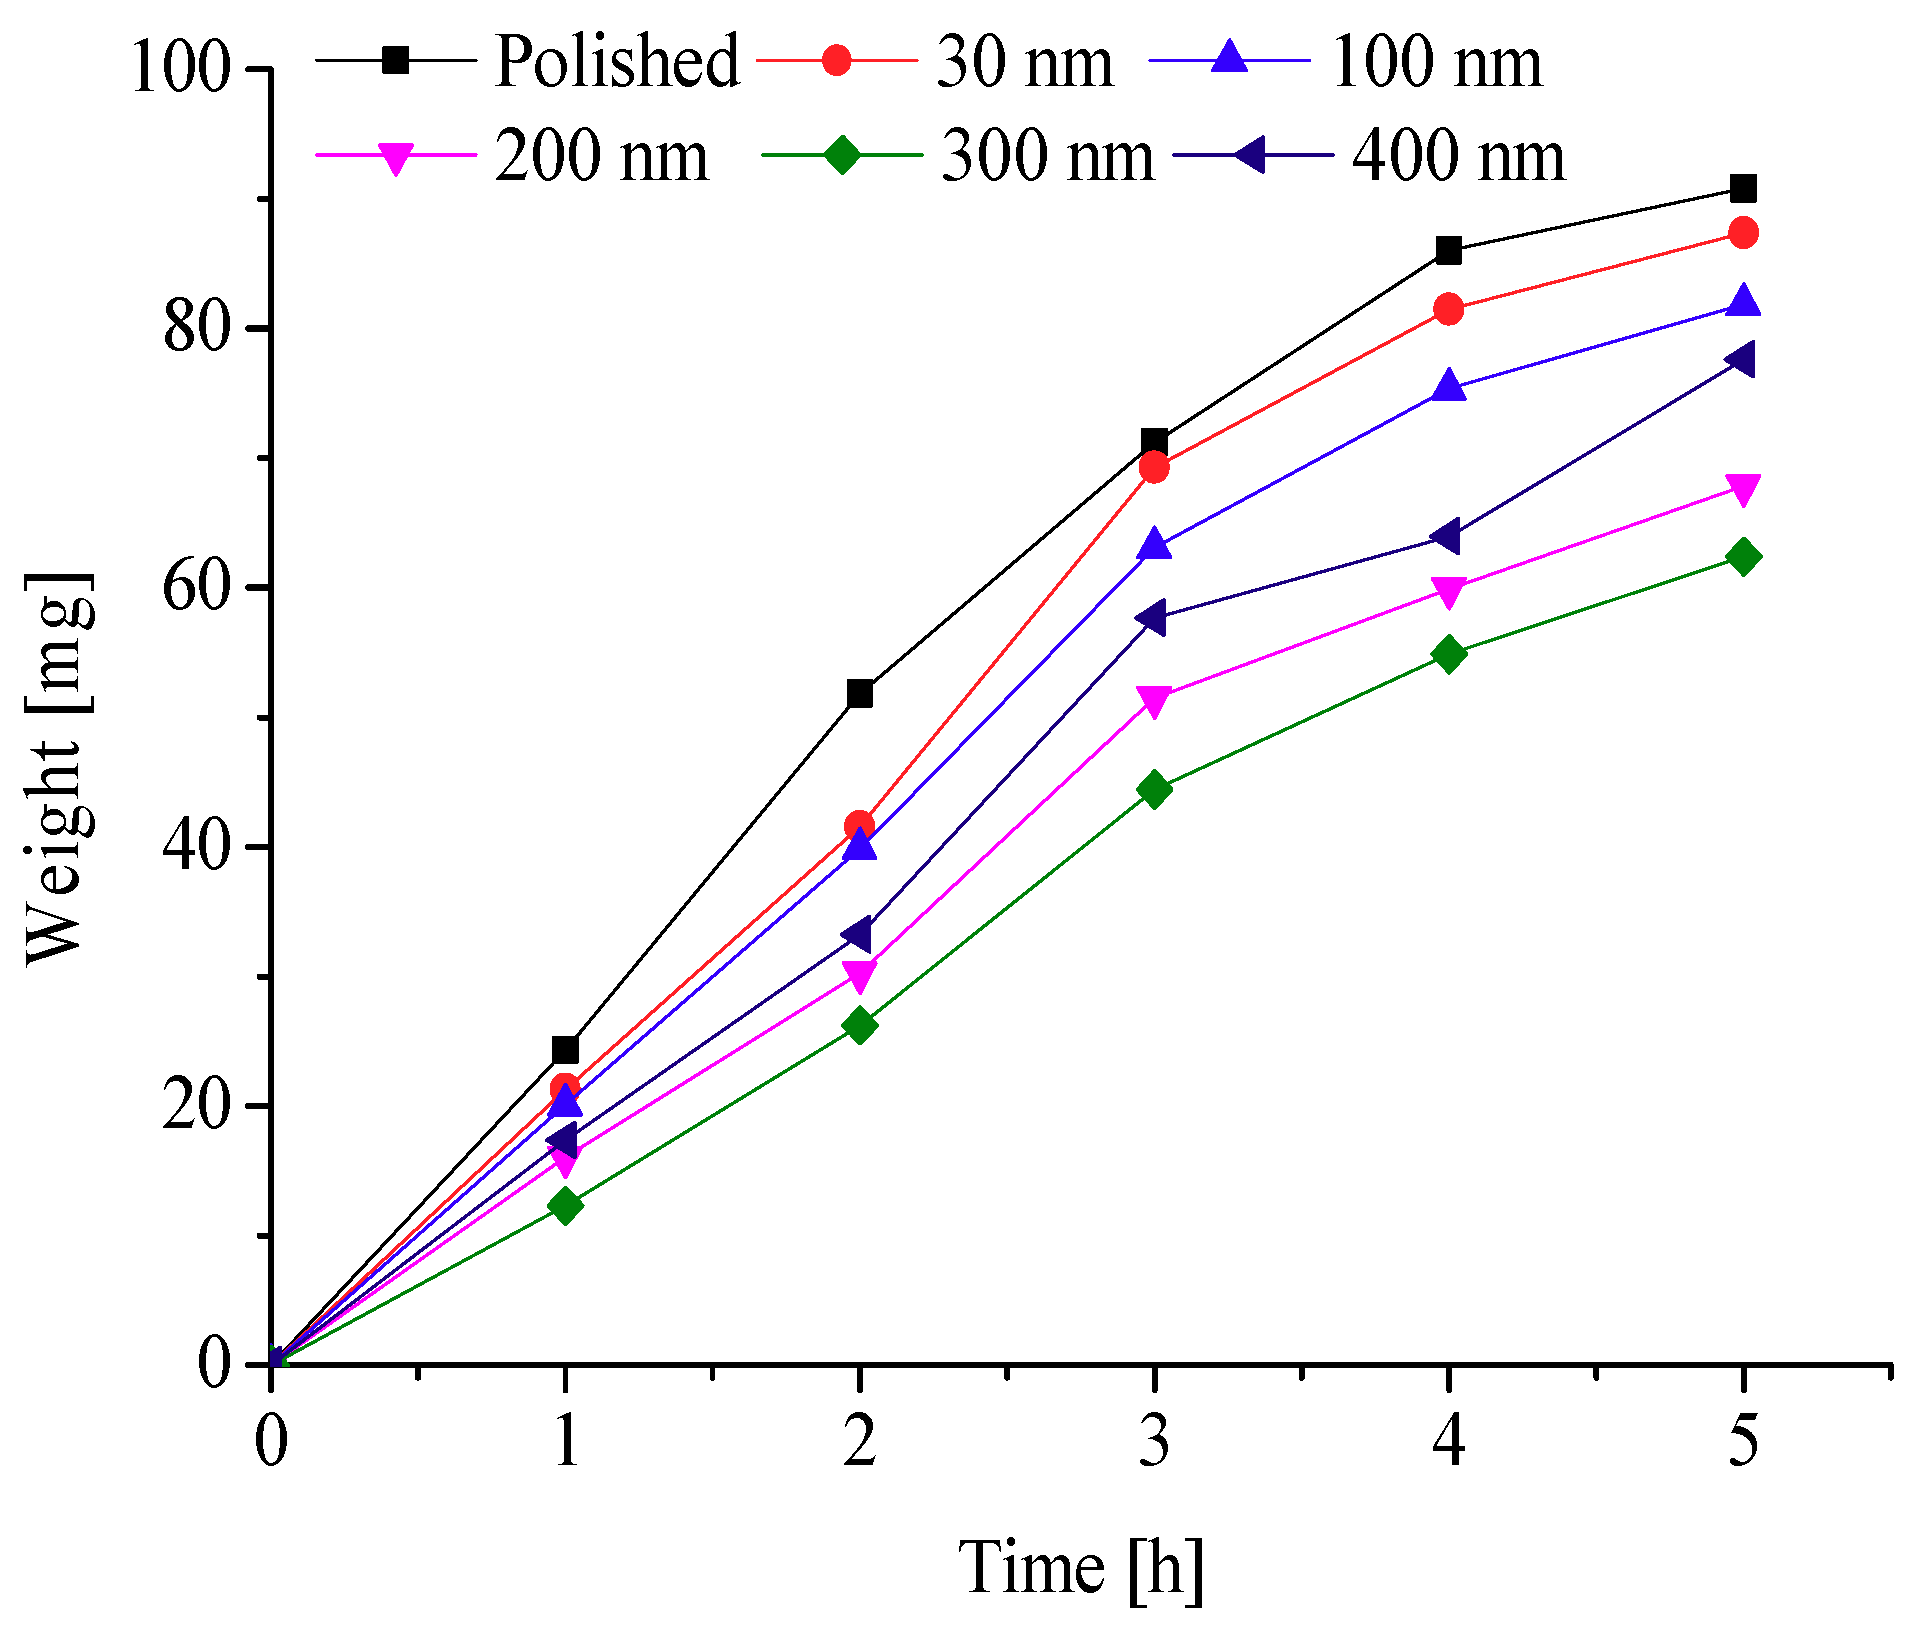
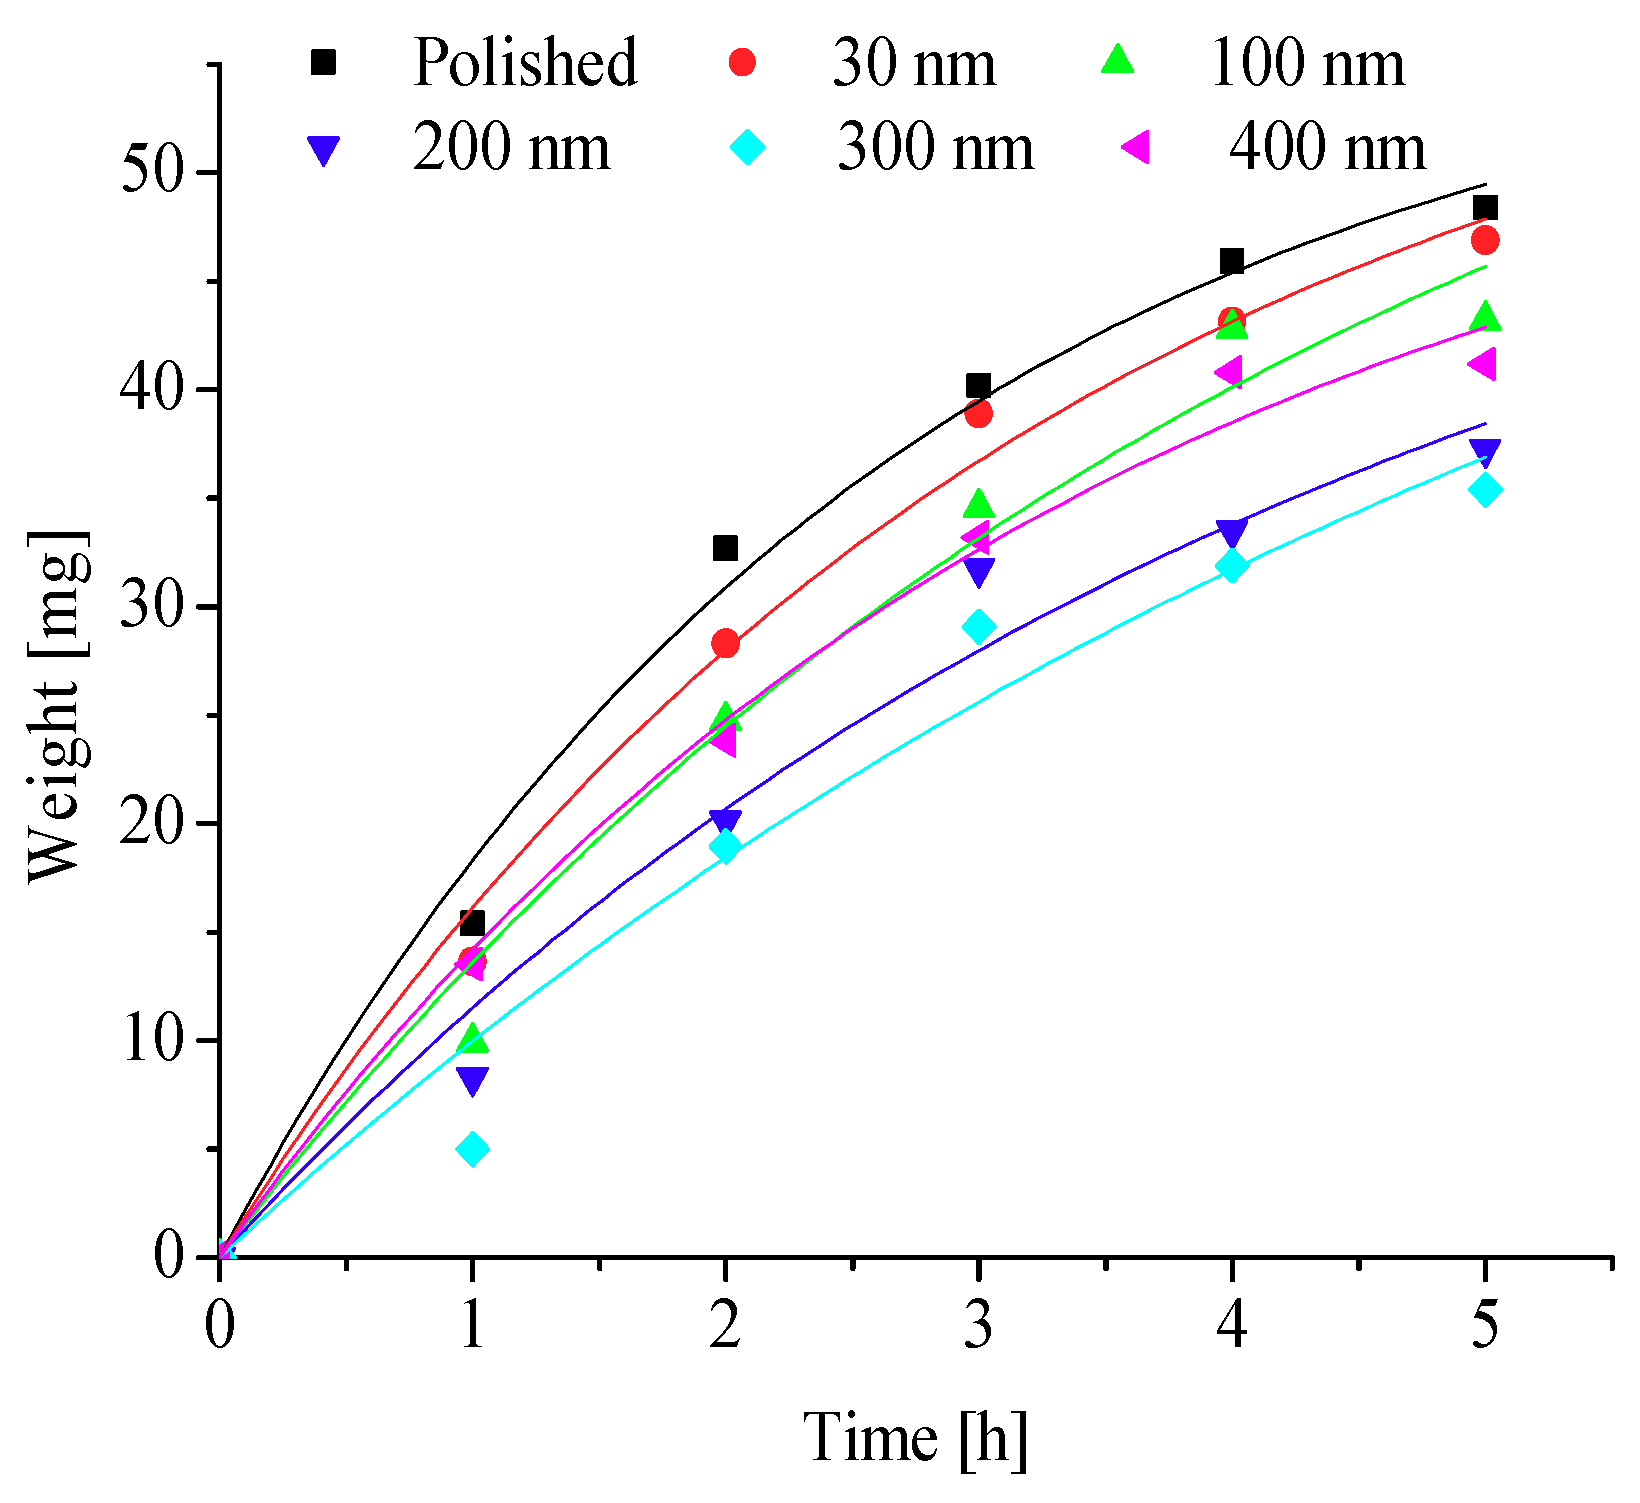
To further explore the effects of different nanopore diameters on surface frosting properties, nanoporous aluminum plates with 30 nm, 100 nm, 200 nm, 300 nm, and 400 nm diameter were prepared by anodic oxide and then undergo expand aperture processing (It should be mentioned that the aperture-expanding process was completed by another company), the polished aluminum plates was also be prepared in order to compare. Keeping the same test equipment and test methods, the test conditions are as followings: aluminum surface temperature is about −5 °C, −10 °C, −15 °C, −20 °C and −25 °C, ambient relative humidity is about 60% and 90%, and the environment ambient temperature is always keeping about −5 °C, which can invest the frosting properties of different nanoporous aluminum plates under different conditions. The testing time are 1 h, 2 h, 3 h, 4 h and 5 h, respectively, then the difference in weight comparing with the initial aluminum plate can be calculated and the frosting properties can be analyzed. The results of the testing can be presented and discussed as follows.
By analyzing Figure 10, Figure 11, Figure 12, Figure 13 and Figure 14, some conclusions can be obtained:
- The frost weight of six aluminum plates increases with time, when the aluminum surface temperature is −5 °C or −10 °C, the rate of frost growth increases with time. At −15 °C, the rate of frost growth increases with time firstly, and then gradually slow down. At −20 °C or −25 °C, the rate of frost growth is gradually decreasing with time, and the growth rate is very large at the beginning;
- In low relative humidity environments, the amount of frosting increases as the surface temperature of the aluminum plates decreases, which means that increasing the surface temperature can reduce the amount of frost on the aluminum plates.
- Among the six aluminum plates, the 300-nm diameter aluminum plates have the best anti-frosting properties, and the nanoporous diameter aluminum plates have better anti-frosting properties than the polished aluminum plate.
- Take the frosting weight of the polished aluminum plates as a reference, the reduction rate of frosting weight can be calculated of the nanoporous diameter aluminum plates relative to the polished aluminum plates, when the ambient relative humidity is 60%. The results shown in Table 3.
- The frosting weight reduction rate of the aluminum plates is increased with the nanoporous diameter until it reaches to 300-nm, which is the best nanoporous diameter to exhibit anti-frosting properties. The nanoporous aluminum plates with 400-nm diameter has better frosting reduction rate than the plates with 30-nm diameter and 100-nm diameter.
- For the same aluminum plates, the frosting weight reduction rate is increased with the aluminum surface temperature. So, increasing the aluminum surface temperature can improve the anti-frost properties of the nanoporous aluminum plates;
- When the aluminum surface temperature is −5 °C, the frosting weight reduction rate of the 300-nm diameter nanoporous aluminum plates can be reached to the maximum value, which is 53.03%, and the 30-nm diameter nanoporous aluminum plates is 19.02%.
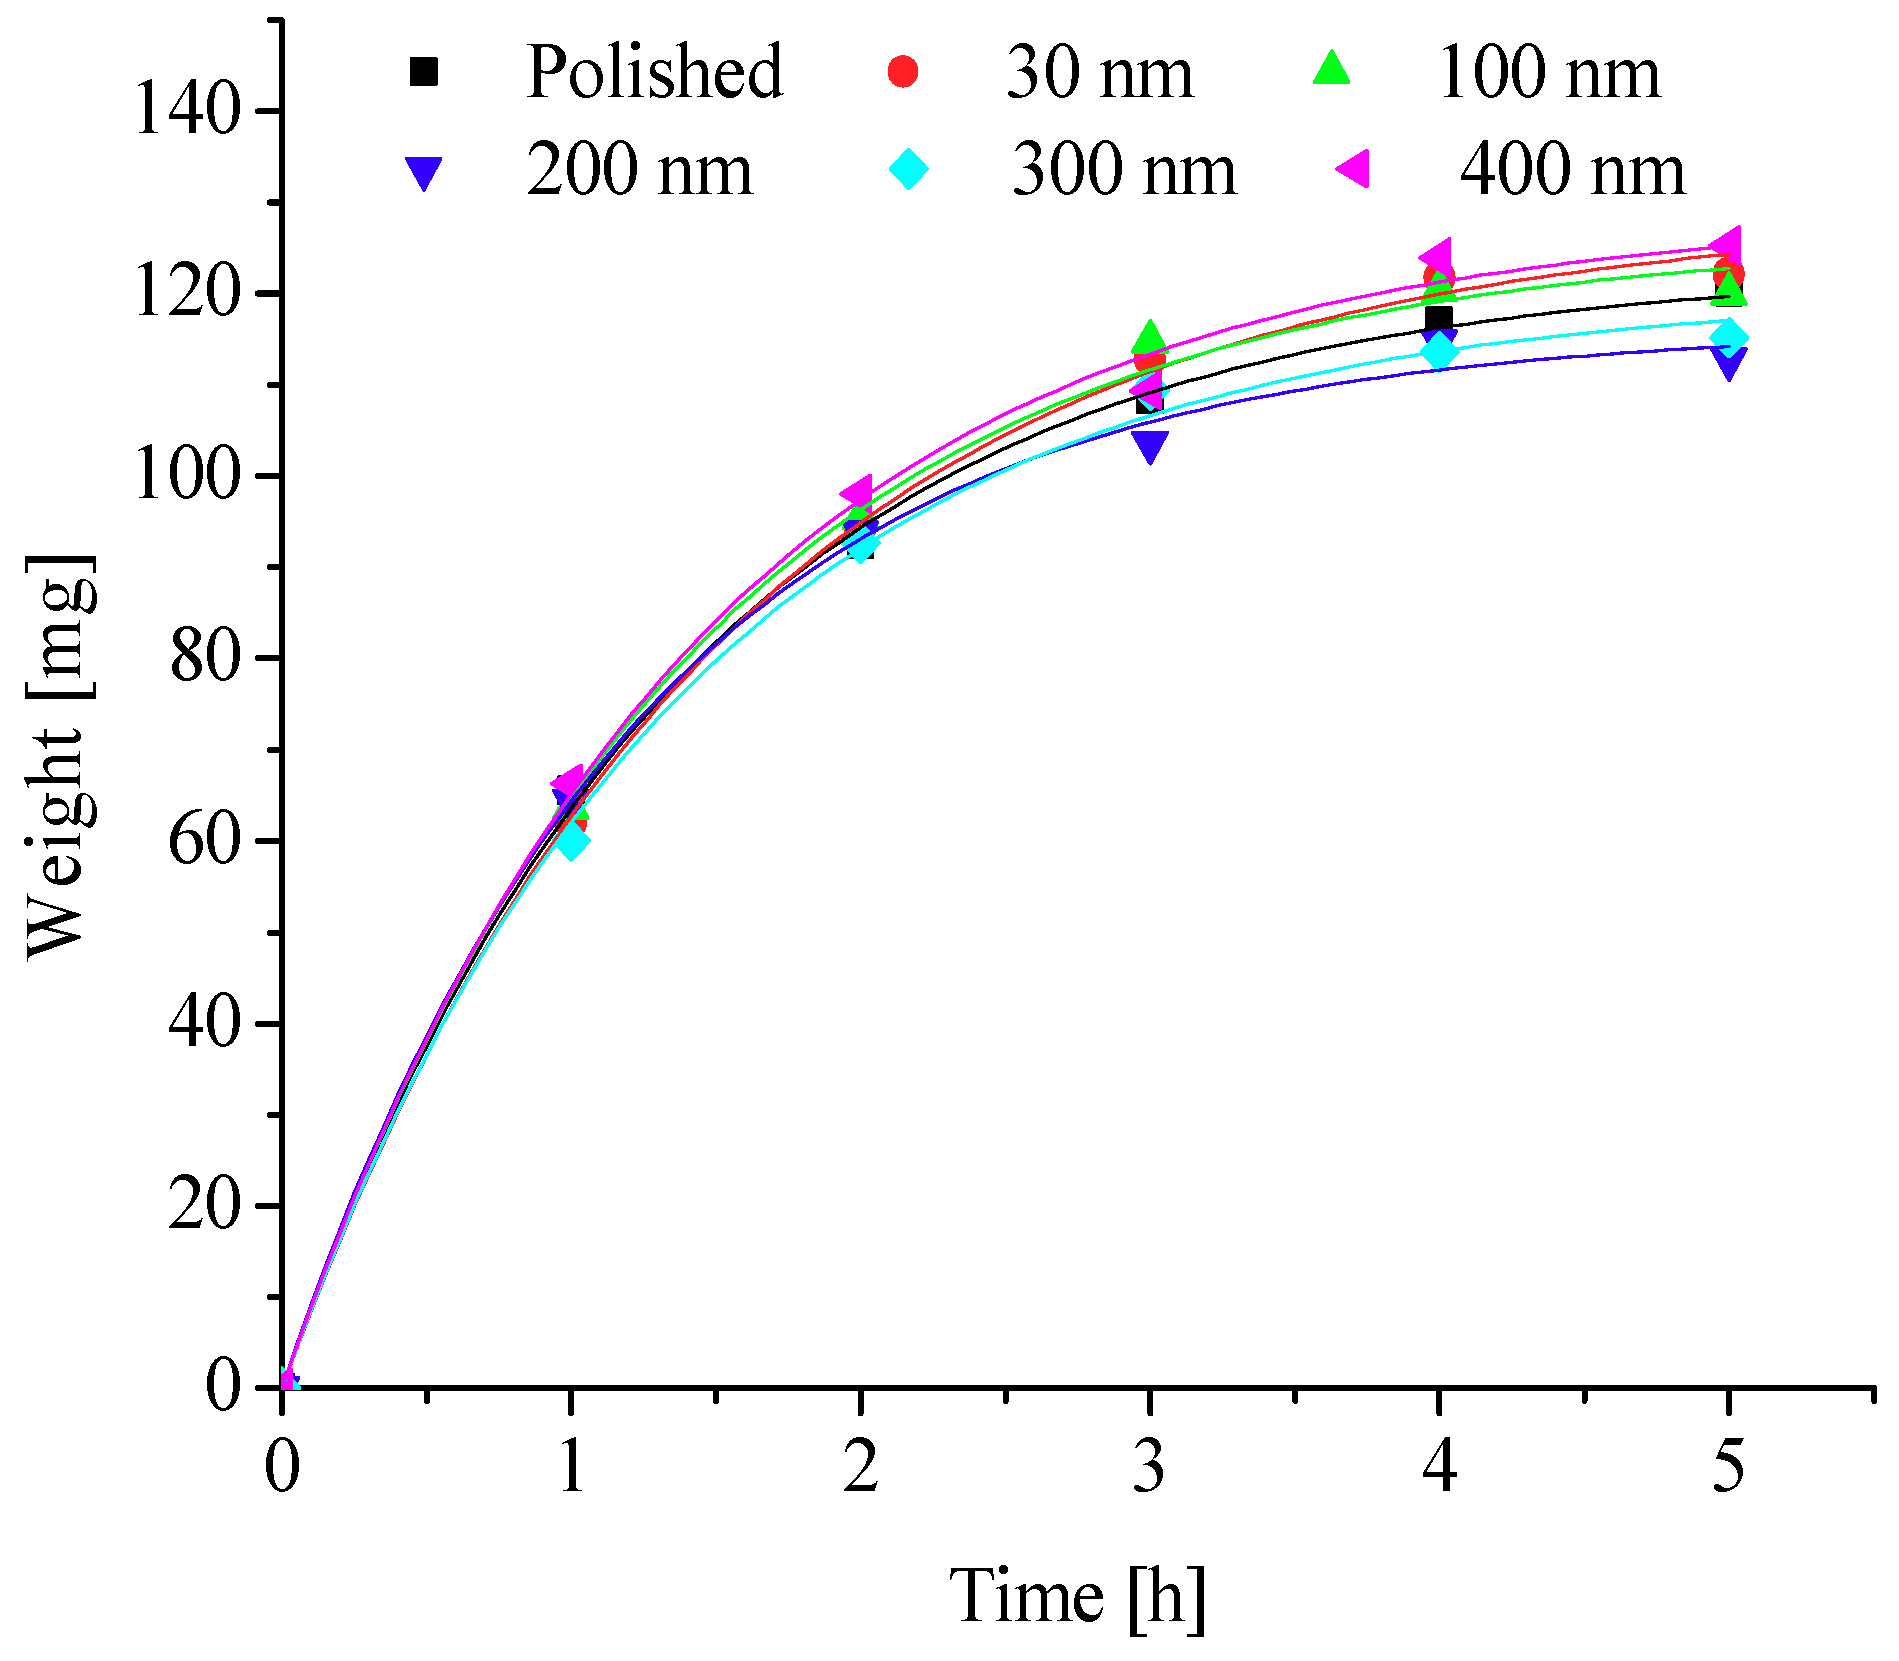
By analyzing Figure 16, Figure 17, Figure 18, Figure 19 and Figure 20, some conclusions can be obtained:
- When the relative humidity reaches about 90%, the growth rate of frosting at different temperatures shows a decreasing trend gradually.
- In high relative humidity environments, when the aluminum surface temperature is −5 °C or −10 °C, the nanoporous aluminum plates show a certain anti-frosting performance relative to polished aluminum plates, and −5 °C is better than −10 °C. At −15 °C, anti-frosting properties of the nanoporous aluminum plates is significantly decreased comparing with the polished aluminum plates. When it reaches to −20 °C or −25 °C, the nanoporous aluminum plates completely lost its anti-frosting properties, and their frosting increasing curve keep the same.
- Frosting weight increases with temperature decreasing, when the surface temperature is −25 °C, the nanoporous aluminum plates with 400 nm diameter can be reached to the maximum value, which is 125.27 mg.
- Take the frosting weight of the polished aluminum plates as a reference, the reduction rate of frosting weight can be calculated of the nanoporous diameter aluminum plates relative to the polished aluminum plates, when the ambient relative humidity is 90%. The results shown in Table 4.
- The frost weight reduction rate of each nanoporous aluminum plate can change greatly at different temperatures. The frost weight reduction rate is 0 at T = −20 °C and T = −25 °C, implying that the anti-frosting properties of the nanoporous aluminum plates have completely been lost at a low-temperature and high-humidity environment;
- The frost weight reduction rate of nanoporous aluminum plates with 30-nm diameter and nanoporous aluminum plates with 400-nm diameter cannot increase with the surface aluminum temperature due to the influence of humidity on frosting is greater than temperature.
- The maximum frost weight reduction rate is 26.68%, when the nanoporous aluminum plates with 300 nm diameter at −5 °C, and the 30 nm diameter nanoporous aluminum plates is 3.14%.
5.3. Calculation Model
In order to promote the test results, the calculation model is established for predicting the trend of frost weight increasing with test time. From the test results it can be seen that the frost weight with time shows different increasing trend. Under the test conditions where the temperature is higher than −15 °C and the relative humidity is 60%, in time, the frost weight shows the polynomial increasing trend. When the temperature is lower than −15 °C and the relative humidity is 60%, in time, the frost weight shows the exponential polynomial increasing trend.
According to the changing trend of test results, we can suppose the polynomial model formula and the exponential model formula as the following:
The coefficients and regression formula correlation are gained by the test results and shown in Table 5 and Table 6.
Comparing the test results with the calculating value by the calculation model, the calculation model can perform well in predicting the frost weight with the test time under different test conditions. The comparison of the test results with the model calculating value are shown from Figure 22, Figure 23, Figure 24, Figure 25, Figure 26, Figure 27, Figure 28, Figure 29, Figure 30 and Figure 31 under some typical test conditions.
6. Conclusions
From the above research some conclusions can be derived:
- The frost weight of the aluminum plate with a contact angle of 60° can reach the maximum of 0.31 g, and it is 1.8 times that of the aluminum sheet with the contact angle of 171° (0.17 g).
- The frosting rate of the aluminum plate with the contact angle of 60° is 0.33 [g/(min∙m2)], and the aluminum plate with the contact angle of 171° is 0.19 [g/(min∙m2)].
- The influence of the prepared aluminum plates on frost formation is only limited to the aluminum plates which are not completely covered by the frost. It also showed that the frost layer formed on the high contact angle after it melts into water rolls down much easier. This may provide some assistance in reducing the defrost time.
- The nanoporous aluminum plates have anti-frosting properties and the nanoporous aluminum plates with diameter of 300 nm shows the best anti-frosting properties, but the anti-frosting properties can be lost in a low-temperature and high-humidity environment.
- The frosting weight reduction rate of the 300 nm diameter nanoporous aluminum plates can be reached about 53.03% on the test conditions of T= −5 °C and φ = 60%.
Author Contributions
Methodology, W.Y.; software, B.Z.; validation, S.H., Y.Z. and W.Y.; formal analysis, X.Z.; investigation, Y.Z.; resources, W.Y.; data curation, S.H.; writing—original draft preparation, S.H; writing—review and editing, X.Z; visualization, Y.Z; supervision, W.Y.; project administration, Y.Z.; funding acquisition, W.Y.
Funding
This research was funded by “National Key R&D Program of China: Low Energy Dew Point Cooling for Computing Data Centres, grant number 2016YFE0133300; ROPEAN COMMISSION: Horizon 2020-Research and Innovation Framework Programme: Low Energy Dew Point Cooling for Computing Data Centres, grant number 734340-DEW-COOL-4-CDC-MSCA-RIS; Department of Science and Technology of Guangdong Province, China, grant number 2014A010106031; Department of Science and Technology of Guangdong Province, China, grant number 2013B091500094” and “The APC was funded by National Key R&D Program of China: Low Energy Dew Point Cooling for Computing Data Centres, grant number 2016YFE0133300”.
Acknowledgments
This work was financially supported by the National Key R&D Program of China: Low Energy Dew Point Cooling for Computing Data Centres (2016YFE0133300); ROPEAN COMMISSION: Horizon 2020-Research and Innovation Framework Programme: Low Energy Dew Point Cooling for Computing Data Centres (734340-DEW-COOL-4-CDC-MSCA-RIS); Department of Science and Technology of Guangdong Province, China (2014A010106031 & 2013B091500094).
Conflicts of Interest
The authors declare no conflicts of interest.
Nomenclature
| A | area (m2) |
| G | Gibbs free energy (J) |
| h | embryo height (m) |
| m | mass (g) |
| M | molar mass of water (kg mol−1) |
| P | partial pressure of steam (Pa) |
| R | ideal gas constant (J mol−1 K−1) |
| r | embryo radius (m) |
| r’ | embryo critical radius (m) |
| S | entropy (J/K) |
| T | temperature (K) |
| U | internal energy (J) |
| v | frosting rate (g min−1 (m2)−1) |
| V | volume (m3) |
| γ | surface energy (J m−2) |
| ρ | ice density (kg m3) |
| θ | contact angle (degrees) |
| humiddity ratio (kgv kga−1) | |
| φ | relative humidity |
| τ | time |
| Subscripts | |
| a | dry air |
| e | embryo |
| ew | interface embryo-wall |
| lat | latent |
| s | surroundings |
| sat | saturation |
| se | interface embryo-surroundings |
| sw | interface surroundings-wall |
| tot | total |
| w | wall |
References
- Kim, K.; Lee, K.S. Frosting and defrosting characteristics of a fin according to surface contact angle. Int. J. Heat Mass Transf. 2011, 54, 2758–2764. [Google Scholar] [CrossRef]
- Lv, J.; Song, Y.L.; Jiang, L.; Wang, J.J. Bio-Inspired Strategies for Anti-Icing. ACS Nano 2014, 8, 3152–3169. [Google Scholar] [CrossRef] [PubMed]
- He, M.; Wang, J.X.; Li, H.L.; Jin, X.L.; Wang, J.J.; Liu, B.Q.; Song, Y.L. Super-hydrophobic film retards frost formation. Soft Matter 2010, 6, 2396–2399. [Google Scholar] [CrossRef]
- Huang, L.Y.; Liu, Z.L.; Liu, Y.M.; Gou, Y.J.; Wang, L. Effect of contact angle on water droplet freezing process on a cold flat surface. Exp. Therm. Fluid Sci. 2012, 40, 74–80. [Google Scholar] [CrossRef]
- Liu, Z.L.; Wang, H.Y.; Zhang, X.H.; Meng, S.; Ma, C.F. An experimental study on minimizing frost deposition on a cold surface under natural convection conditions by use of a novel anti-frosting paint. Part I. Anti-frosting performance and comparison with the uncoated metallic surface. Int. J. Refrig. 2006, 29, 229–236. [Google Scholar] [CrossRef]
- Piucco, R.O.; Hermes, C.J.L.; Melo, C.; Barbosa, J.R., Jr. A study of frost nucleation on flat surfaces. Exp. Therm. Fluid Sci. 2008, 32, 1710–1715. [Google Scholar] [CrossRef]
- Guo, P.; Zheng, Y.M.; Wen, M.X.; Song, C.; Lin, Y.C.; Jiang, L. Icephobic/anti-icing properties of micro/nanostructured surfaces. Adv. Mater. 2012, 24, 2642–2648. [Google Scholar] [CrossRef] [PubMed]
- Rahman, M.A.; Jacobi, A.M. Drainage of frost melt water from vertical brass surfaces with parallel microgrooves. Int. J. Heat Mass Transf. 2012, 55, 1596–1605. [Google Scholar] [CrossRef]
- Losada, R.; Holberg, S.; Bennedsen, J.M.D.; Kamuk, K.; Nielsen, F. Coatings to prevent frost. J. Coat. Technol. Res. 2016, 13, 645–653. [Google Scholar] [CrossRef]
- Cao, S.Y.; Wang, J.; Wang, H. Effect of CVD carbon coatings on properties of SiC fibres. Surf. Eng. 2016, 33, 573–577. [Google Scholar] [CrossRef]
- Gesser, H.D.; Long, R. The adhesion of “low energy” solids. J. Polym. Sci. Part C 1967, 5, 469–470. [Google Scholar] [CrossRef]
- Liu, Z.L.; Gou, Y.J.; Wang, J.T.; Cheng, S.Y. Frost formation on a super-hydrophobic surface under natural convection conditions. Int. J. Heat Mass Transf. 2008, 51, 5975–5982. [Google Scholar] [CrossRef]
- Wang, S.L.; Zhang, W.W.; Yu, X.Q.; Liang, C.H.; Zhang, Y.F. Sprayable superhydrophobic nano-chains coating with continuous self-jumping of dew and melting frost. Sci. Rep. 2017, 7, 40300. [Google Scholar] [CrossRef] [PubMed] [Green Version]
- Wang, H.; He, G.G.; Tian, Q.Q. Effects of nano-fluorocarbon coating on icing. Appl. Surf. Sci. 2012, 258, 7219–7224. [Google Scholar] [CrossRef]
- Moallem, E.; Cremaschi, L.; Fisher, D.E.; Padhmanabhan, S. Experimental measurements of the surface coating and water retention effects on frosting performance of microchannel heat exchangers for heat pump systems. Exp. Therm. Fluid Sci. 2012, 39, 176–188. [Google Scholar] [CrossRef]
- Wang, H.; Tang, L.M.; Wu, X.M.; Dai, W.T.; Qiu, Y.P. Fabrication and anti-frosting performance of super hydrophobic coating based on modified nano-sized calcium carbonate and ordinary polyacrylate. Appl. Surf. Sci. 2007, 253, 8818–8824. [Google Scholar] [CrossRef]
- Hu, Z.H.; Deng, Y.L. Superhydrophobic Surface Fabricated from Fatty Acid-Modified Precipitated Calcium Carbonate. Ind. Eng. Chem. Res. 2010, 49, 5625–5630. [Google Scholar] [CrossRef]
- Huang, L.Y.; Liu, Z.L.; Liu, Y.M.; Gou, Y.J. Preparation and anti-frosting performance of super-hydrophobic surface based on copper foil. Int. J. Therm. Sci. 2011, 50, 432–439. [Google Scholar] [CrossRef]
- Zuo, Z.P.; Liao, R.J.; Zhao, X.T.; Song, X.Y.; Qiao, Z.W.; Guo, C.; Zhuang, A.Y.; Yuan, Y. Anti-frosting performance of superhydrophobic surface with ZnO nanorods. Appl. Therm. Eng. 2017, 110, 39–48. [Google Scholar] [CrossRef]
- Chen, T.C.; Yan, W.; Liu, H.T.; Zhu, W.; Guo, K.J.; Li, J.D. Facile preparation of superamphiphobic phosphate–Cu coating on iron substrate with mechanical stability, anti-frosting properties, and corrosion resistance. J. Mater. Sci. 2017, 52, 1–14. [Google Scholar] [CrossRef]
- Katzen, D.; Levy, E.; Mastai, Y. Thin films of silica–carbon nanocomposites for selective solar absorbers. Appl. Surf. Sci. 2005, 248, 514–517. [Google Scholar] [CrossRef]
- Cheng, B.; Wang, K.K.; Wang, K.P.; Jiang, W.; Cong, B.J.; Song, C.L.; Jia, S.H.; Han, G.R.; Liu, Y. Porous carbon–titania nanocomposite films for spectrally solar selective absorbers. Sol. Energy Mater. Sol. Cells 2015, 133, 126–132. [Google Scholar] [CrossRef]
- Diamantino, T.C.; Gonçalves, R.; Nunes, A.; Páscoa, S.; Carvalho, M.J. Durability of different selective solar absorber coatings in environments with different corrosivity. Sol. Energy Mater. Sol. Cells 2017, 166, 27–38. [Google Scholar] [CrossRef]
- Su, Z.X.; Hähner, G.; Zhou, W.Z. Investigation of the pore formation in anodic aluminium oxide. J. Mater. Chem. 2008, 18, 5787–5795. [Google Scholar] [CrossRef]
- Myers, D. Surface, Interfaces, and Colloids: Principles and Applications; John & Wiley Sons: Hoboken, NJ, USA, 1999; pp. 8–10. [Google Scholar]
- Fletcher, N.H.; Hasted, J.B. The chemical physics of ice. Phys. Today 1971, 24, 49. [Google Scholar] [CrossRef]
- Liu, Z.L.; Zhang, X.H.; Wang, H.Y.; Meng, S.; Cheng, S.Y. Influences of surface hydrophilicity on frost formation on a vertical cold plate under natural convection conditions. Exp. Therm. Fluid Sci. 2007, 31, 789–794. [Google Scholar] [CrossRef]
Figure 1.
Scanning electron microscope (SEM) images of the prepared plates with different magnitude of current: (a) 0 A; (b) 1 A; (c) 2 A; (d) 3 A; (e) 4 A; (f) 5 A; (g) 6 A; (h) 7 A.
Figure 1.
Scanning electron microscope (SEM) images of the prepared plates with different magnitude of current: (a) 0 A; (b) 1 A; (c) 2 A; (d) 3 A; (e) 4 A; (f) 5 A; (g) 6 A; (h) 7 A.

Figure 2.
The contact angles of water on the prepared plates with different magnitude of current: (A) 0 A, (A1) modification by lauric acid on (A); (B) 1 A, (B1) modification by lauric acid on (B); (C) 2 A, (C1) modification by lauric acid on (C); (D) 3 A, (D1) modification by lauric acid on (D); (E) 4 A, (E1) modification by lauric acid on (E); (F) 5 A, (F1) modification by lauric acid on (F); (G) 6 A, (G1) modification by lauric acid on (G); (H) 7 A, (H1) modification by lauric acid on (H).

Figure 3.
Variations of contact angles with different current: (a) aluminum anodic oxidation; (b) aluminum lauric acid modification after anodic oxidation.
Figure 3.
Variations of contact angles with different current: (a) aluminum anodic oxidation; (b) aluminum lauric acid modification after anodic oxidation.

Figure 4.
Scheme for the preparation of the superhydrophobic surface and a self-assembled lauric acid layer at the surface of the prepared plates.
Figure 4.
Scheme for the preparation of the superhydrophobic surface and a self-assembled lauric acid layer at the surface of the prepared plates.

Figure 5.
Schematic representation of a homogeneous (a) and a heterogeneous (b) nucleation [26].
Figure 5.
Schematic representation of a homogeneous (a) and a heterogeneous (b) nucleation [26].

Figure 6.
Schematic of the proposed system. 1—low temperature humidity chamber; 2—semiconductor refrigerator; 3—air valve; 4—draught fan; 5—dehumidifier; 6—mobile air conditioning; 7—ultrasonic humidifier; 8—air outlet; 9—closed box; 10—condensate container; 11—diversion grid; 12—copper plate; 13—Al plates; 14—thermocouples; 15—wind speed probes; 16—temperature/humidity probes; 17—multichannel temperature/humidity detection system; 18—multichannel temperature monitor.

Figure 7.
Image of the testing rig.

Figure 8.
Variations of frost weight with different contact angles.

Figure 9.
Variations of average frosting rate with the contact angles.

Figure 10.
Variations of frost weight with different nanoporous diameters at T = −5 °C, φ = 60%.

Figure 11.
Variations of frost weight with different nanoporous diameters at T = −10 °C, φ = 60%.

Figure 12.
Variations of frost weight with different nanoporous diameters at T = −15 °C, φ = 60%.

Figure 13.
Variations of frost weight with different nanoporous diameters at T = −20 °C, φ = 60%.

Figure 14.
Variations of frost weight with different nanoporous diameters at T = −25 °C, φ = 60%.

Figure 15.
Variations of frost weight reduction rate of the nanoporous diameter aluminum plates compare to the polished aluminum plates at φ = 60%.
Figure 15.
Variations of frost weight reduction rate of the nanoporous diameter aluminum plates compare to the polished aluminum plates at φ = 60%.

Figure 16.
Variations of frost weight with different nanoporous diameters at T = −5 °C, φ = 90%.

Figure 17.
Variations of frost weight with different nanoporous diameters at T = −10 °C, φ = 90%.

Figure 18.
Variations of frost weight with different nanoporous diameters at T = −15 °C, φ = 90%.

Figure 19.
Variations of frost weight with different nanoporous diameters at T= −20 °C, φ = 90%.

Figure 20.
Variations of frost weight with different nanoporous diameters at T = −25 °C, φ = 90%.

Figure 21.
Variations of frost weight reduction rate of the nanoporous diameter aluminum plates compare to the polished aluminum plates at φ = 90%.
Figure 21.
Variations of frost weight reduction rate of the nanoporous diameter aluminum plates compare to the polished aluminum plates at φ = 90%.

Figure 22.
Testing value polynomial model regression fitting at T = −5 °C, φ = 60%.

Figure 23.
Testing value polynomial model regression fitting at T = −10 °C, φ = 60%.

Figure 24.
Testing value exponential model regression fitting at T = −15 °C, φ = 60%.

Figure 25.
Testing value exponential model regression fitting at T = −20 °C, φ = 90%.

Figure 26.
Testing value exponential model regression fitting at T = −25 °C, φ = 90%.

Figure 27.
Testing value exponential model regression fitting at T = −5 °C, φ = 90%.

Figure 28.
Testing value exponential model regression fitting at T = −10 °C, φ = 90%.

Figure 29.
Testing value exponential model regression fitting at T = −15 °C, φ = 90%.

Figure 30.
Testing value exponential model regression fitting at T = −20 °C, φ = 90%.

Figure 31.
Testing value exponential model regression fitting at T = −25 °C, φ = 90%.


Table 1.
Performance parameters of the testing devices.
| Testing Device | Type | Performance Parameters |
|---|---|---|
| Low temperature humidity chamber | BYCT-TH150B | Temperature range: −40–150 °C; temperature accuracy: ±0.5 °C; relative humidity range: 20–90%; relative humidity accuracy: ±2% |
| Multichannel temperature monitor | AT4340 | Sensor: K type thermocouple; measuring range: −200–1300 °C; accuracy: ±1 °C; |
| Ultrasonic humidifier | H-010 | Atomization amount range: 0~800 mL/h; Power: 60 W |
| Temperature & humidity monitor | LS-HT211X | Temperature measurement range: −40–100 °C; temperature accuracy: ±0.5 °C; relative humidity measurement range: 0–100%; relative humidity accuracy: ±3% |
| Precision electronic balance | BSM−120.4 | Range: 0–120 g; accuracy: 0.1 mg |
| Dehumidifier | DET 25E | Power: 330 W; humidity range 30–90%; dehumidification capacity: 1.1 L/h; application area: 20–30 m2 |
| Mobile air conditioning | KY-32/MY | Power: 1260 W; temperature range: 18–24 °C; cooling capacity: 3500 W/h; circulation air volume: 350 m3/h |
| Semiconductor refrigerator | X206 | Cooling capacity: 480 W/h; applicable volume: 1–2 m2; temperature difference: 7–12 °C |
| Anemometer | 100836 | Range: 0.3–45 m/s; wind speed measurement error: ±3% ± 0.1 dgt; resolution: 0.001 m/s |
Table 2.
Fitting model formula between frost weight and time.
| Nanoporous Plates with Different Contact Angles | Regression Formula | R2 |
|---|---|---|
| 60° | m = 0.0018τ − 0.0146 | 0.9964 |
| 105° | m = 0.0016τ − 0.0069 | 0.9878 |
| 116° | m = 0.0015τ − 0.0085 | 0.9959 |
| 125° | m = 0.0015τ − 0.0132 | 0.9750 |
| 139° | m = 0.0014τ − 0.0109 | 0.9918 |
| 154° | m = 0.0013τ − 0.0133 | 0.9877 |
| 168° | m = 0.0014τ − 0.0211 | 0.9844 |
| 171° | m = 0.0010τ − 0.0082 | 0.9952 |
Table 3.
The frost weight reduction rate of the nanoporous diameter aluminum plates compared to the polished aluminum plates at the ambition relative humidity was 60% (%).
Table 3.
The frost weight reduction rate of the nanoporous diameter aluminum plates compared to the polished aluminum plates at the ambition relative humidity was 60% (%).
| Temperature/°C | 30 nm Diameter | 100 nm Diameter | 200 nm Diameter | 300 nm Diameter | 400 nm Diameter |
|---|---|---|---|---|---|
| −5 | 19.02 | 27.27 | 48.48 | 53.03 | 37.12 |
| −10 | 14.71 | 26.22 | 45.83 | 48.35 | 34.05 |
| −15 | 7.44 | 22.4 | 30.96 | 42.02 | 29.89 |
| −20 | 6.82 | 14.71 | 28.97 | 40.36 | 20.07 |
| −25 | 3.75 | 9.78 | 25.26 | 31.3 | 14.54 |
Table 4.
The frosting weight reduction rate of the nanoporous diameter aluminum plates compared to the polished aluminum plate at the ambition relative humidity was 90%.
Table 4.
The frosting weight reduction rate of the nanoporous diameter aluminum plates compared to the polished aluminum plate at the ambition relative humidity was 90%.
| Temperature/°C | 30 nm Diameter | 100 nm Diameter | 200 nm Diameter | 300 nm Diameter | 400 nm Diameter |
|---|---|---|---|---|---|
| −5 | 3.14 | 10.7 | 23.04 | 26.68 | 14.92 |
| −10 | 5.27 | 9.25 | 19.89 | 23.49 | 17.41 |
| −15 | 5.91 | 7.89 | 12.62 | 13.29 | 8.12 |
| −20 | 0 | 0 | 0 | 0 | 0 |
| −25 | 0 | 0 | 0 | 0 | 0 |
Table 5.
Polynomial model coefficients and regression formula correlation.
| (T, φ)/(°C, %) | Coefficient | Polished | 30 nm | 100 nm | 200 nm | 300 nm | 400 nm |
|---|---|---|---|---|---|---|---|
| (−5, 60) | a | 1.3201 | 1.0142 | 0.8360 | 0.8796 | 0.5175 | 0.7179 |
| b | 1.8429 | 1.8777 | 1.9310 | 1.6991 | 1.9768 | 1.9369 | |
| R2 | 0.9831 | 0.9851 | 0.9834 | 0.9931 | 0.9993 | 0.9909 | |
| (−10, 60) | a | 1.9056 | 1.5975 | 1.1810 | 0.6406 | 0.3375 | 0.6917 |
| b | 1.8544 | 1.8714 | 1.9636 | 2.1669 | 2.5397 | 2.1937 | |
| R2 | 0.9870 | 0.9892 | 0.9746 | 0.9948 | 0.9985 | 0.9952 | |
| (−15, 60) | a | 4.9494 | 3.4371 | 2.8651 | 1.2514 | 1.09484 | 2.0834 |
| b | 1.39738 | 1.5517 | 1.5686 | 2.0131 | 1.9898 | 1.7168 | |
| R2 | 0.9887 | 0.9966 | 0.9974 | 0.9972 | 0.9958 | 0.9897 |
Table 6.
Exponential model coefficients and regression formula correlation.
| (T, φ)/(°C, %) | Coefficient | Polished | 30 nm | 100 nm | 200 nm | 300 nm | 400 nm |
|---|---|---|---|---|---|---|---|
| (−20, 60) | a | 117.8 | 144.9 | 141.7 | 140.5 | 112.7 | 235.1 |
| b | 0.1848 | 0.1246 | 0.1127 | 0.0901 | 0.0977 | 0.0563 | |
| R2 | 0.9929 | 0.9852 | 0.9879 | 0.9867 | 0.9715 | 0.9832 | |
| (−25, 60) | a | 132.8 | 159.4 | 148.0 | 142.9 | 210.3 | 186.4 |
| b | 0.2452 | 0.1692 | 0.1697 | 0.1333 | 0.0729 | 0.1086 | |
| R2 | 0.9915 | 0.9824 | 0.9890 | 0.9873 | 0.9888 | 0.9858 | |
| (−5, 90) | a | 58.32 | 61.00 | 67.92 | 56.56 | 65.81 | 55.65 |
| b | 0.3770 | 0.3072 | 0.2234 | 0.2276 | 0.1644 | 0.2944 | |
| R2 | 0.9906 | 0.9912 | 0.9774 | 0.9709 | 0.9547 | 0.9909 | |
| (−10, 90) | a | 65.83 | 62.95 | 60.36 | 50.78 | 51.12 | 57.29 |
| b | 0.6147 | 0.6225 | 0.6293 | 0.6498 | 0.5613 | 0.5554 | |
| R2 | 0.9971 | 0.9961 | 0.9915 | 0.9979 | 0.9966 | 0.9849 | |
| (−15, 90) | a | 78.63 | 69.69 | 69.15 | 65.70 | 65.8865 | 68.71 |
| b | 0.6490 | 0.7179 | 0.6944 | 0.6804 | 0.6180 | 0.6457 | |
| R2 | 0.9961 | 0.9899 | 0.9877 | 0.9888 | 0.9935 | 0.9947 | |
| (−20, 90) | a | 97.03 | 93.26 | 98.13 | 95.28 | 97.64 | 101.89 |
| b | 0.6369 | 0.6703 | 0.5867 | 0.5658 | 0.5510 | 0.5631 | |
| R2 | 0.9990 | 0.9987 | 0.9941 | 0.9937 | 0.9985 | 0.9942 | |
| (−25, 90) | a | 122.9 | 128.9 | 126.3 | 116.3 | 120.3 | 129.0 |
| b | 0.7297 | 0.6664 | 0.7197 | 0.8071 | 0.7249 | 0.7036 | |
| R2 | 0.9990 | 0.9989 | 0.9977 | 0.9977 | 0.9980 | 0.9973 |
© 2018 by the authors. Licensee MDPI, Basel, Switzerland. This article is an open access article distributed under the terms and conditions of the Creative Commons Attribution (CC BY) license (http://creativecommons.org/licenses/by/4.0/).
Share and Cite
MDPI and ACS Style
He, S.; Zhang, Y.; Yang, W.; Zhao, X.; Zeng, B. Fabrication and Frosting Properties Study of Surface-Active Agents Coating Based on Nanoporous Aluminum Substrate. Energies 2018, 11, 2797. https://doi.org/10.3390/en11102797
AMA Style
He S, Zhang Y, Yang W, Zhao X, Zeng B. Fabrication and Frosting Properties Study of Surface-Active Agents Coating Based on Nanoporous Aluminum Substrate. Energies. 2018; 11(10):2797. https://doi.org/10.3390/en11102797
Chicago/Turabian StyleHe, Song, Yanmei Zhang, Wansheng Yang, Xudong Zhao, and Bin Zeng. 2018. "Fabrication and Frosting Properties Study of Surface-Active Agents Coating Based on Nanoporous Aluminum Substrate" Energies 11, no. 10: 2797. https://doi.org/10.3390/en11102797
Note that from the first issue of 2016, this journal uses article numbers instead of page numbers. See further details here.