1. Introduction
Energy is the lifeblood of the global economy since it is a critical input to all sectors of the economy including agriculture, transportation, waste collection, information technology, and communications sources. Additionally, the energy sector creates jobs and value by extracting, transforming and distributing energy goods and services throughout the economy. The energy sector is relevant in any discussion of a country’s economy in two additional ways. First, energy security is vital to the country’s economic growth on both the demand side (e.g., population growth, effects of globalization, and the aspirations of less-developed countries) and the supply side (e.g., known and likely reserves of fossil fuels). In 2011, energy expenditures amounted to approximately 10% of the world gross domestic product (GDP), in which North America accounts for 20%, Europe for 25%, and Japan for 6% of the total. About 81.4% of the world’s primary energy supply [
1] consists of oil (31.7%), gas (21.6%), and coal (28.1%), while nuclear, hydro, biofuels, and others contribute to the remaining. Each country has a different mix of energy sources. Approximately 72% of China’s energy is obtained from coal while 100% of Iceland’s energy is from renewable resources. The price and supply of the resources are significant for energy security. Second, climate change has become a global environmental challenge. Fossil fuels are the primary energy source in many countries. Increasing the consumption and burning of fossil fuels has increased the temperature of the atmosphere and emissions of greenhouse gases. This anthropogenic climate change poses a serious threat to the health, prosperity, and stability of human communities, and to the stability and existence of non-human species and ecosystems [
2,
3]. One method of mitigation of greenhouse gas emissions is the use of renewable sources of energy, including solar and wind [
4]. As such, many countries (including China) are increasing their renewable energy reliance on sources that have little to no greenhouse gas emissions. China is now the world’s biggest investor in renewable energy, both at home and overseas.
China has become a dominant player in the energy sector since 2008. China’s rapid integration into the world economy has established its status as a key economic player, further strengthened by its planning of the Belt and Road Initiative (BRI). The BRI framework calls for open cooperation and foreign direct investments (FDI) designed to lay the infrastructure and industrial foundations to secure and solidify China’s relations with 68 countries on three continents. The BRI, once complete, would reach more than 60% of the global population, account for nearly one-third of world GDP and global trade, and 75% of its known energy reserves [
5,
6]. Under this plan, China will be linked to Europe through Central Asia and Russia; to the Middle East through Central Asia; and to Southeast Asia, South Asia, and the Indian Ocean via both land and sea routes. The BRI involves the funding and construction of a system of roads, railways, oil and natural gas pipelines, fiber-optic and communication systems, ports, and airports that will have implications on global energy security in the coming decades. This infrastructure will create new forms of network connectivity across much of Central Asia and on to Europe and will lead to greater interdependence and enhanced growth for countries in this region. Central Asia is feeling the potential impact of the BRI on its energy sector. The Chinese government and banks granted US
$8 billion to Turkmenistan and US
$13 billion to Kazakhstan to develop oil and natural gas deposits and to realize east-oriented pipelines to ship fuels to China [
7]. A part of this initiative is the Khorgos–Aktau railway corridor, linking the Sino–Kazak border with the Kazakh seaport in the Caspian Sea, crossing Kazakhstan [
8]. Aktau is one of the leading oil-producing areas of Kazakhstan; Chinese companies have invested here to exploit the energy sector as well as get access to the main gateway of the BRI infrastructural and energy projects [
9,
10]. Thus, the BRI reflects China’s industrial redeployment, increased outbound investment, and the diversification of energy sources and trade routes.
This article examines the global investments in the energy sector from 2003 to 2016 of China, the US, and other countries to analyze their inbound and outbound FDI flows and to characterize the trends in energy investments in the pre- and post-recession periods. It will identify China’s investments in the various sectors of the energy supply chain compared with the US and other countries. FDI consists of two types, Greenfield (GF) investment and cross-border mergers and acquisitions (M&A). GF investment is a form of FDI [
11] where a parent company builds a new subsidiary from the ground up at a location in a foreign country where no existing facilities are currently present. For example, Mitsubishi Heavy Industries (MHI) Dongfang Gas Turbine (Guangzhou) Co., Ltd. was established in in 2004 in the city of Guangzhou in Guangdong Province, with MHI owning a 51% stake (
$67.3 M), and Dongfang Turbine holding the remaining 49%. MHI selected this location to leverage its access to low-price and high-quality labor resources in South China, as well as access to Guangdong domestic and Southeast Asian gas turbine markets. Similarly, in 2008, China National Petroleum (CNPC), a Chinese national oil company, invested (
$494.4 M) in oil extraction in Bolivar, Venezuela. Cross-border M&As, on the other hand, consist of a transfer of ownership of existing domestic firms. For example, the 2016 acquisition of the German robotics company Kuka, by Midea, a Chinese appliance company resulted in no additional production capacity in Germany. GF investment may generate additional economic activity and may lead to international technology transfers for some sectors, and potentially increase productivity growth.
Global FDI inflows rose to
$2.41 T in 2015 from
$10.17 B in 1970 [
12]. Our database shows the total FDI is at
$2.15 T in 2015, breaking out with GF at
$720.32 B and M&As at
$1426.27 B. The share of the value of global cross-border M&A to the value of total global FDI was about 66.4% in 2015. In 2016, the total FDI in our database was at
$2.16 T, with GF at
$730.41 B and M&As at
$1371.78 B. The share of the value of global cross-border M&A to the value of total global FDI was 68% in 2016. Although there is widespread recognition of the distinct nature of these investment modes, there is little research comparing GF and M&A, especially in the critical energy sector due to data constraints.
Further, with China’s increasing dominance and the proposed Belt and Road Initiative (BRI), research is necessary to create a baseline to differentiate the present patterns in the two modes of investment. While China has traditionally ranked among the top countries for inbound FDI, its outbound FDI is now becoming more consequential. Chinese companies have made some big international acquisitions in many sectors; for example, Shuanghui International Holdings Ltd. purchased Smithfield Foods (world’s largest pork producer) in 2013 for nearly $5 B. The BRI policies set forth by the Chinese government will determine China’s future outbound FDI investments and will result in major impacts in the global economy. We study both modes of investments during a critical period of the global financial crisis of 2008 by differentiating three distinct periods: (i) pre-recession period 2003–2008 (ii) peak recession period 2008–2010 (iii) post-recession 2010–2016.
Prior research has investigated the impacts of FDI; while many argue for the positive impacts of FDI [
13], some have highlighted the negative impacts [
14]. FDI generates cross-sector overflows and improves the output through its upstream and downstream enterprises [
15,
16]. FDI can drive technological progress [
17], especially in developing countries [
18]. Several factors determine FDI, [
19] including the financial market system [
20], market size [
21], the level of infrastructure, and stable macroeconomic policy, trade, and human resources [
22]. Econometric analysis helps to derive insights into how FDI promotes economic growth in host countries, including standard gravity controls in FDI regressions [
23]. Other studies have investigated the effect of various driving factors on M&A and GF FDI [
24,
25,
26,
27,
28].
China’s outbound M&A and GF FDI reveal interesting trends. One study [
29] identified four motives for outbound Chinese FDI including increased access to natural resources, markets, technology, and managerial skills. Another, [
30], discuss similar determinants of FDI outflows by Chinese multinational enterprises over the period 1984 to 2001 using case studies. Later studies [
31,
32] identified additional motives influencing Chinese outbound FDI: Strategic assets (e.g., brands, marketing networks) and diversification. Cost minimization was not a significant motivation of Chinese outbound FDI given that China was itself a low-cost production base. “Resource diplomacy” is characterized as the Chinese effort to secure the supply of raw materials and energy for its national economy [
33]. China’s large deals in 2006 and 2007 [
34] involved oil-producing African countries, Central Asian countries, and elsewhere. China had first sought oil and then other minerals such as copper, bauxite, uranium, aluminum, and manganese. The size and composition of China’s FDI outflows from 2003 to 2006 influenced by China’s “go overseas” policy at this time is significant [
35].
Chinese outbound investment in the energy markets in recent times reveals the growing importance of renewable energy, especially in southern Europe. The acquisitions by Chinese entities in Southern Europe’s renewable energy sector [
36] are in solar energy in Italy and Spain while wind energy is the prime focus in Portugal and Greece. The risks associated with the growing share of Chinese FDI into Europe’s energy sector particularly in Southern and Central Europe include challenges of fair competition and possible infringements of national security [
37]. The Chinese GF investments in solar and wind in Europe, specifically in Germany, are driven by their desire to acquire technology and markets [
38]. There are policy issues in Chinese cross-border M&As activity including government subsidization, transparency of the acquiring firms, and national security concerns [
39]. To summarize, prior studies have examined M&A and GF FDI in separate sectors or regional contexts. Some econometric modeling has shown the significance of determinants in the origin-destination flows of investment. However, there are gaps in our understanding related to the analysis of the sectors of the energy supply chain in the context of Chinese investments into the energy sector abroad.
We investigate M&A and GF FDI in the energy sector, merging two databases in order to conduct a comprehensive analysis of global investment flows. Our new methodology enables us to examine the extent to which global investment flows in the energy sector are distributed within different parts of energy value chains and characterize the spatiotemporal patterns of inflows and outflows. Specifically, we investigate the following questions: What is the level of GF accounts regarding total FDI activity? What was the impact of global financial crises on GF and M&A investments? Which recovered more quickly? What are the patterns of investment in energy after the crisis? In the energy sector, what are clear distinctions in patterns of GF and M&A in China versus other countries’ investments? What is the energy supply chain? What are the differences in investments along the segments of the supply chain? Do such sector-level FDI patterns vary according to different pairs of origin and destination countries? Does this hold true for both M&A and GF investment? What is China’s status concerning inbound and outbound investment? Does China invest consistently more in the energy sector of some countries?
The paper proceeds as follows. The next section describes the data and methodology including issues in integrating the databases, Dealogic and fDi Intelligence’s fDi Market, followed by a discussion on M&A and GF investments along various segments in the energy supply chain. We then provide a qualitative analysis of China and other countries’ inbound and outbound investments. We then discuss future research.
2. Materials and Methods
M&A and GF are the two primary forms of FDI, captured in two commercial databases, Dealogic, and fDi Intelligence’s fDiMarket, respectively. In this paper, we characterize the landscape of FDI, with a focus on the energy sector, origins, and destinations of energy investment flow as well as critical segments of the energy sector supply chain by integrating the two databases.
fDiMarket is the dataset that includes GF FDI projects. It is developed and owned by Financial Times (
www.fdimarkets.com). Although it is designed mostly for business clients, academic research now uses the dataset, especially in economics and political science [
40,
41]. The information consists of media reports, and for each project, the database collects information regarding both its investors (name and source country) and project details (amount of capital investment, destination country and, economic sector). fDiMarket is a unique global database covering all economic sectors. However, the database has limitations due to missing reports or zombie deals (that are announced but never realized). Our current database captures 171,465 GF FDI projects from 2003 to 2016, with capital investment totaling
$10.6 T (See
Appendix A Table A2). The database classifies the energy sector in two ways: First, by industrial activity; classes include mining and extraction, distribution and transmission, electricity generation, manufacture, retail and wholesale, and other business services. Second, by type of fuel; types include oil & gas, coal, wind, solar, biomass, and hydroelectricity.
Dealogic is a commercial database mostly serving clients in the investment banking sector and includes significant debt, equity investment, loans, and cross-border M&A cases (
www.dealogic.com). We focus on the M&A segment of this database to complement the fDi Market database. The Dealogic database suffers less from missing reports or zombie deals, and hence can help us deal with the limitations of the fDi Market database. The M&A database includes deals from 1996 to 2016 but we consider the period 2003 to 2016 in this study. For each M&A deal, the record includes an acquiror (acquirer or buyer), divestor (seller), and target by their name, nationality, and five-digit North American Industry Classification System (NAICS) code (
Appendix A Table A1). Federal statistical agencies use the NAICS codes in classifying business establishments to collect, analyze, and publish statistical data related to the U.S. business economy. The NAICS code in the Dealogic database provides critical information regarding the primary economic sector of the acquirer, divestor, and target. However, since the original NAICS code is six-digit, the sector-related information provided by Dealogic is limited to only a five-digit code resulting in certain data issues. In the energy sector, for instance, a target of an M&A deal is labeled as electricity generation on an aggregate level without specifying information on the type of electricity generation. Similarly, the semiconductor manufacture class includes a solar module manufacturer, which makes it impossible to identify any solar module manufacturer in a region. Therefore, this mismatch of NAICS codes in Dealogic results in our inability to track sector-specific flows without making specific assumptions or approximations. In this study, we only include real cross-border M&A deals and exclude any deals where the origin country is the same as the recipient country.
We examine the characteristics of energy supply chains related to fossil fuels and renewables globally in the context of M&A and GF FDI investments. There are uncertainties in the values recorded in the two databases. First, both databases estimate the deal values and the number of jobs created using a specific methodology that may differ from the values that the companies publicly announce at a later stage. Second, in both databases, the announced deal value (publicly reported) may differ from the final, actual deal value, causing further uncertainties in the database.
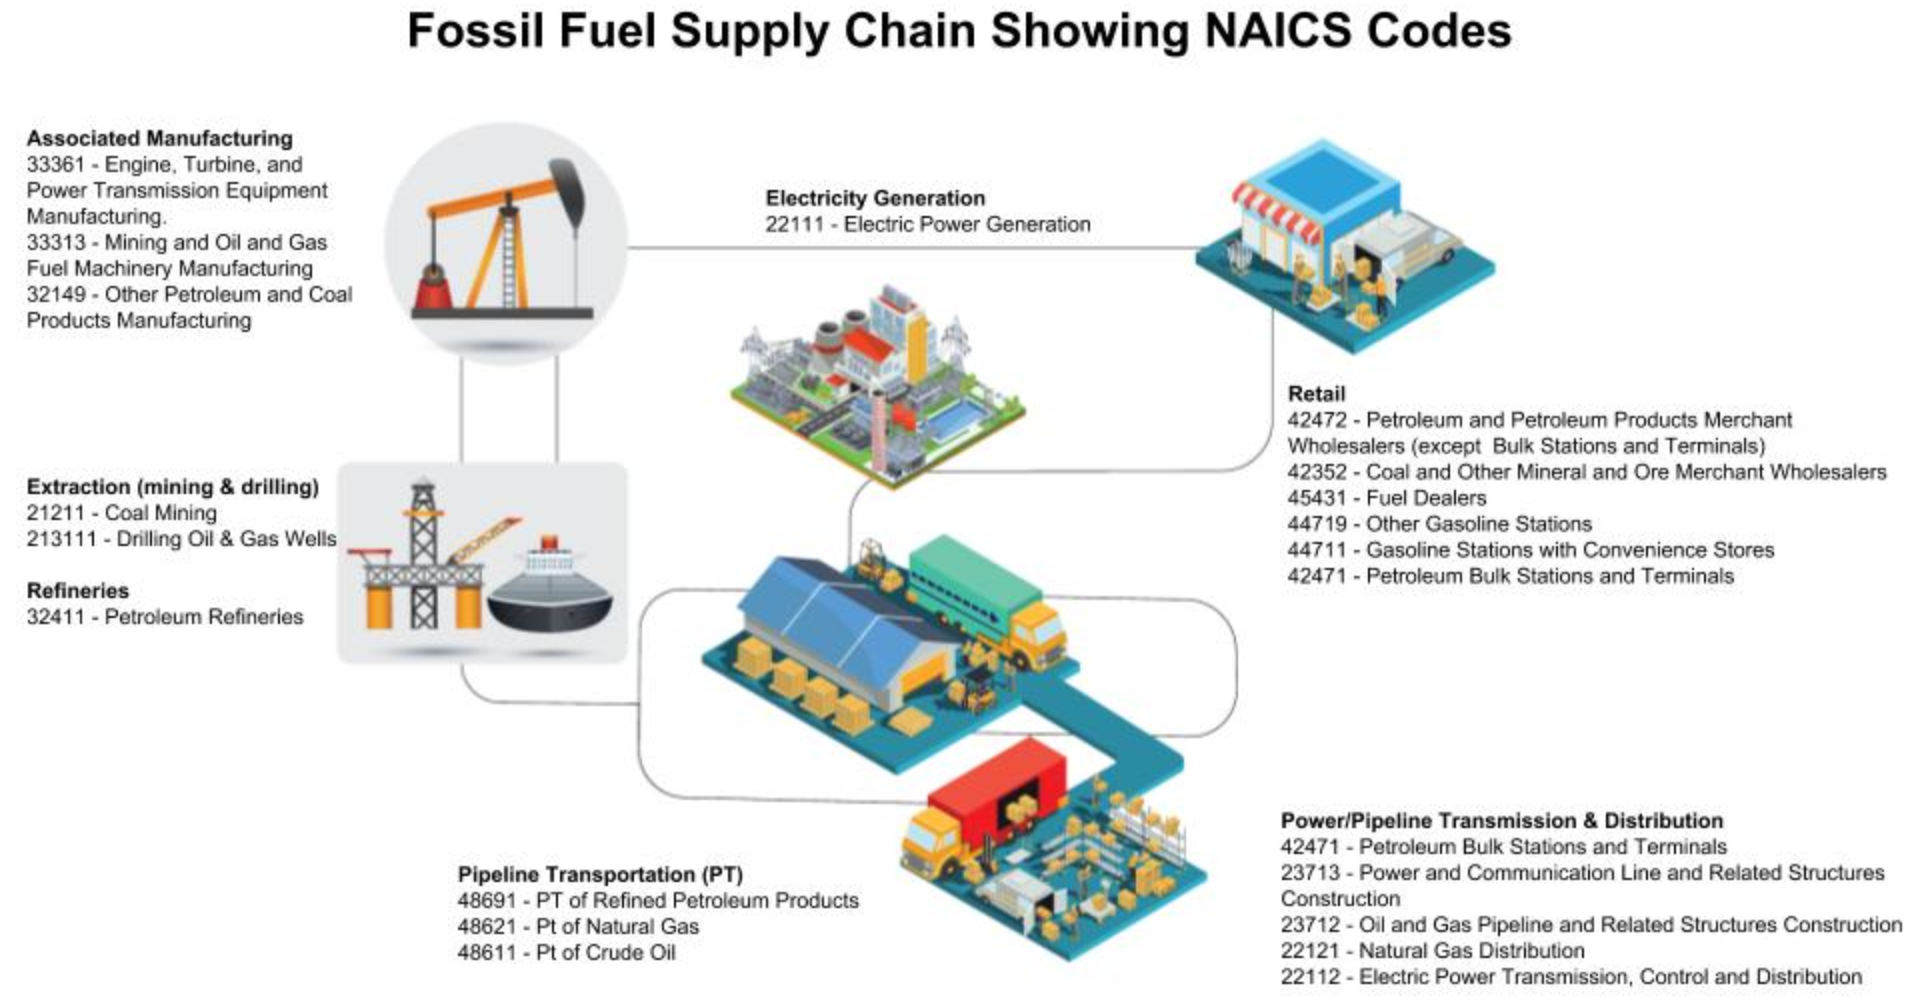
The first step in our methodology is to crosswalk between the elements (or fields) of the two databases, GF FDI and M&A data, to show equivalent elements (or “fields”) in more than one database. We choose four energy sub-sectors that represent identical elements covering all the energy-related NAICS codes present in the Dealogic and industry sectors in the fDiMarket database respectively, see
Figure 1. These elements are; (1) extraction; (2) power or electricity generation; (3) manufacturing; and (4) transmission and distribution.
Appendix A shows which five-digit NAICS codes or industry sectors each energy sub-sector includes. Each includes detailed sub-types, such as oil and gas extraction, coal mining, natural gas extraction, and crude petroleum extraction.
Second, we utilized our cross-walking strategy and identified relevant deals in the energy sector which were pertinent to this study. Instead of being categorized by NAICS code, every deal in the FDi Market GF database has four attributes, industry sector, cluster, sub-sector, and industry activity, see
Table A4. We found that industrial activity and the industry sector are most useful to identify energy-related deals. Then, for each of four energy sub-sectors, we identified those deals which were tagged with the specific activity and industry sectors under our criteria. For instance, to derive oil and natural gas extraction deals, we include all the deals with both “extraction” under the column “Industry Activity” (
Table A4) and “oil & gas extraction” in their “sub-sector” attribute. However, deals tagged with “oil & gas extraction” in the “sub-sector” but “maintenance & servicing” in the “Industry Activity” were ignored. Such deals do not represent the right extraction sector but rather maintenance and servicing. The detailed list of our selection results is in
Table A4 (as well as A). Thus, the cross-walking strategy between the items in the two databases helps us identify those energy-related deals whose four energy sub-sectors are relevant in this study.
In the third step, we focused on the energy supply chain. We identified NAICS codes along the upstream, midstream and downstream segments of the energy supply chain. The upstream oil and gas industries include exploration, extraction, and production. The midstream industries involve transportation (by pipeline, rail, barge, oil tanker or truck), storage, and wholesale marketing of crude oil or other petroleum products. The downstream industries incorporate petroleum crude oil refining and the processing and purification of the raw natural gas, as well as the marketing and distribution of products (retail) derived from these sources. We have included the manufacturing of equipment necessary for the energy sector in our estimation of energy investments, but we have excluded the sub-type called manufacturing of petrochemicals.
The final step in our methodology is data analysis and visualization. Developing effective data integration and visualizations are critical for understanding and analyzing the merged investment data in a variety of contexts. We used Tableau Desktop software [
42,
43], an easy-to-use tool for creating customized, real-time exploration of our complex databases. We created longitudinal graphical displays of our databases, defined new groups of variables (using NAICS codes), clustered BRI countries, as well as defined phases such as pre- and post-recession and recession. We juxtaposed graphics and maps on digital “dashboards” with shared timescales and drillable details, such as M&As along the various segments of the supply chain, such as extraction, electric power generation, and retail, to facilitate a visual synthesis of multiple types of potentially relevant information.
3. Results
We analyze the differences in the energy sectors of various countries by examining the pattern of M&A and GF FDI investment. Since the energy sector includes mining and drilling, as well as electricity generation, it is useful to examine patterns of GF and M&A investment along the supply chain. The presentation of the analysis is as follows:
Global Trends in M&A and GF FDI Activities: We first explore the GF FDI and M&A (2003–2016) energy investments with a focus on tracking the impacts of the financial crisis in 2008 across the various regions on all investments.
Energy Sector Supply Chains: We next characterize the energy supply chain related to fossil fuels and renewables globally as well as in the context of China, the US, and other countries.
Origin and Destination of Energy FDI: We then describe the energy outbound investment originating in countries such as China, UK, Japan, and the US to their destinations such as China, Vietnam, and India.
China’s energy investment landscape: Lastly, we examine the investments in the energy sector through time.
3.1. Global Trends—GF and M&A Activities
We classify the period of this study 2003–2016 into three phases: (1) pre-recession period 2003–2008; (2) peak recession period 2008–2010; and (3) post-recession 2010–2016.
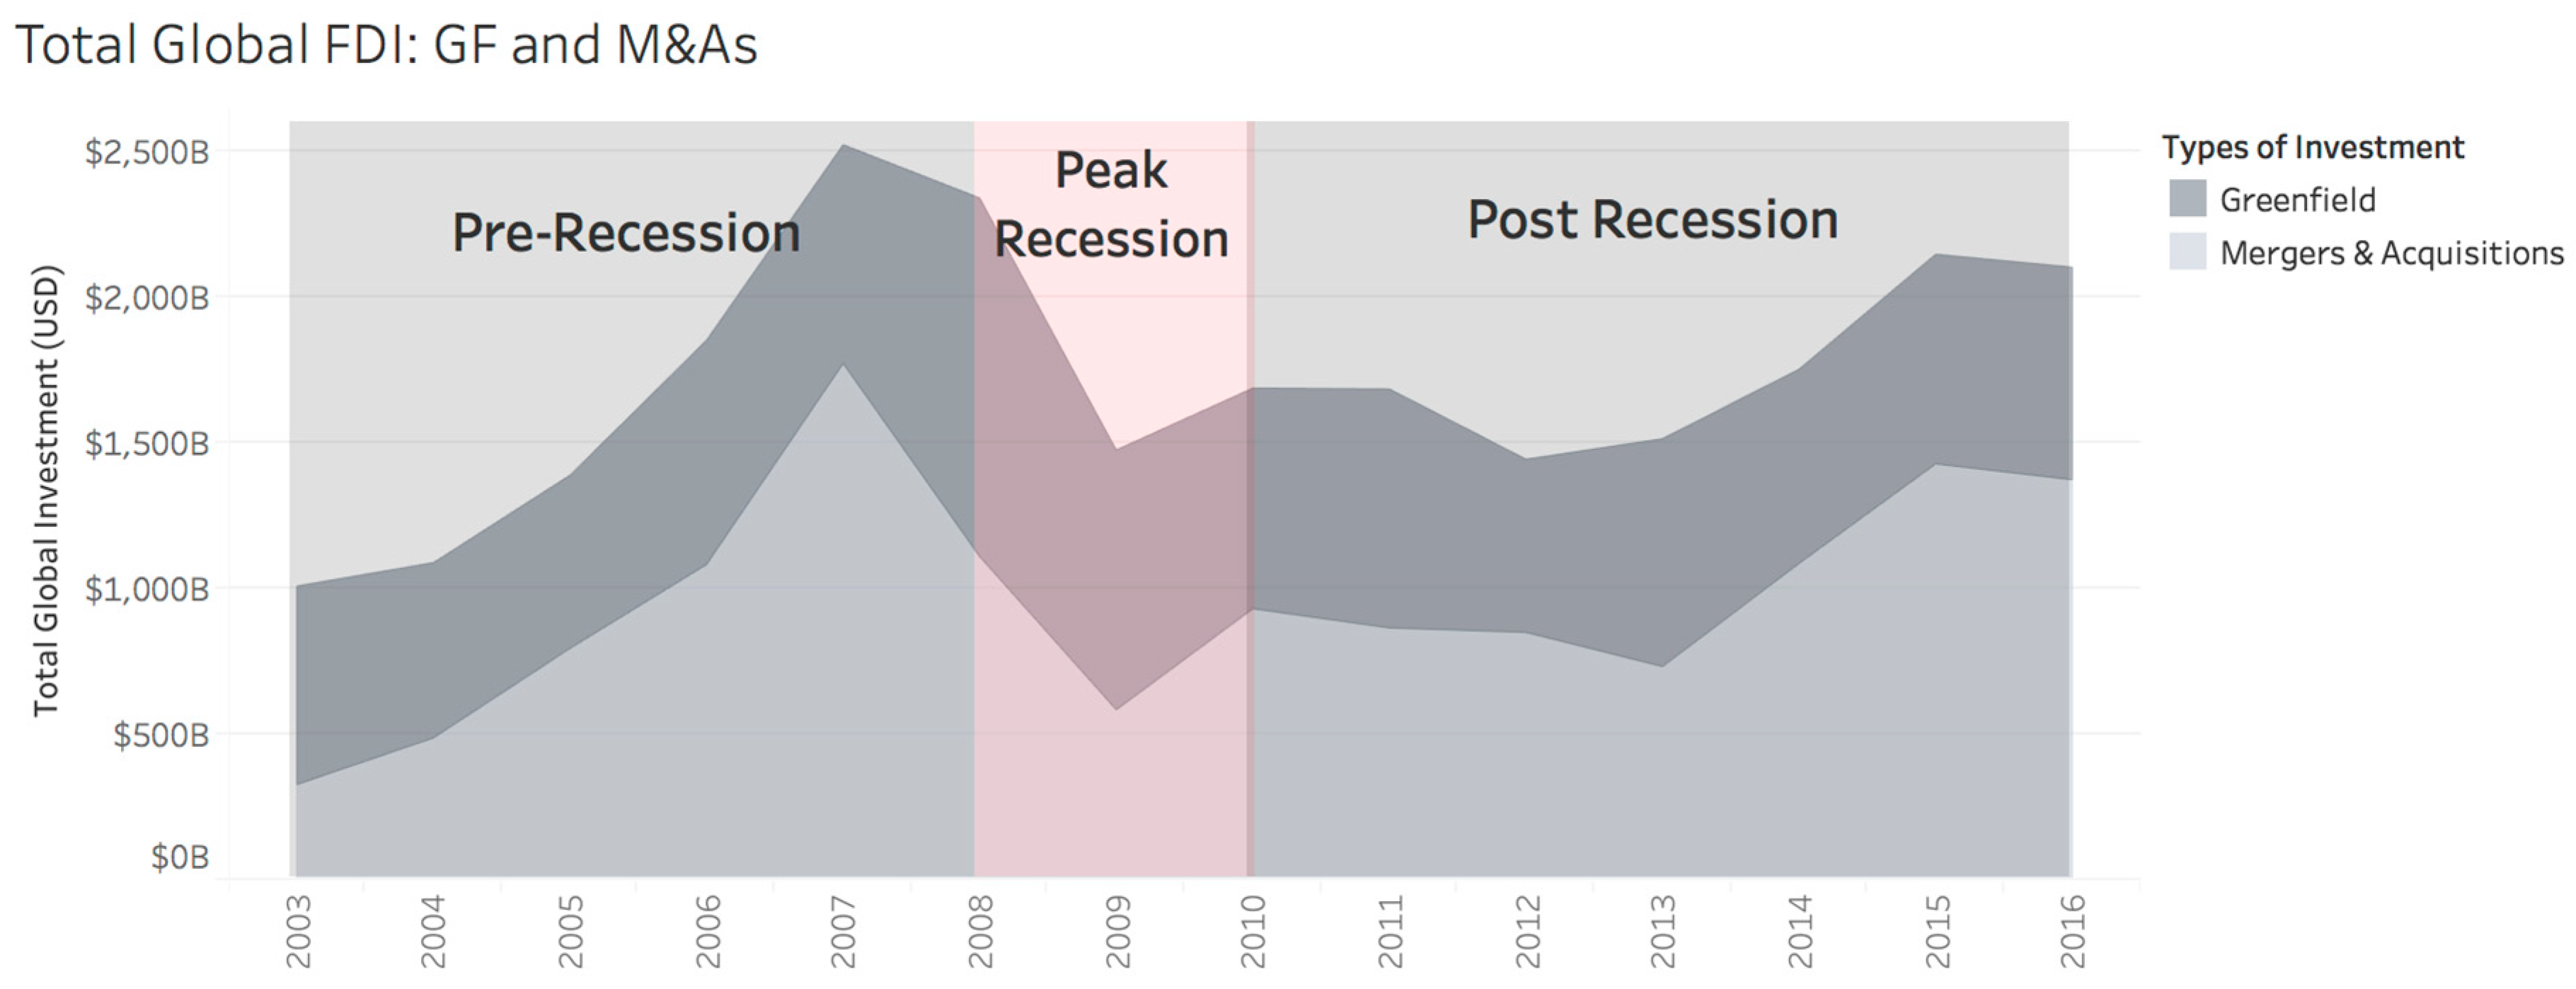
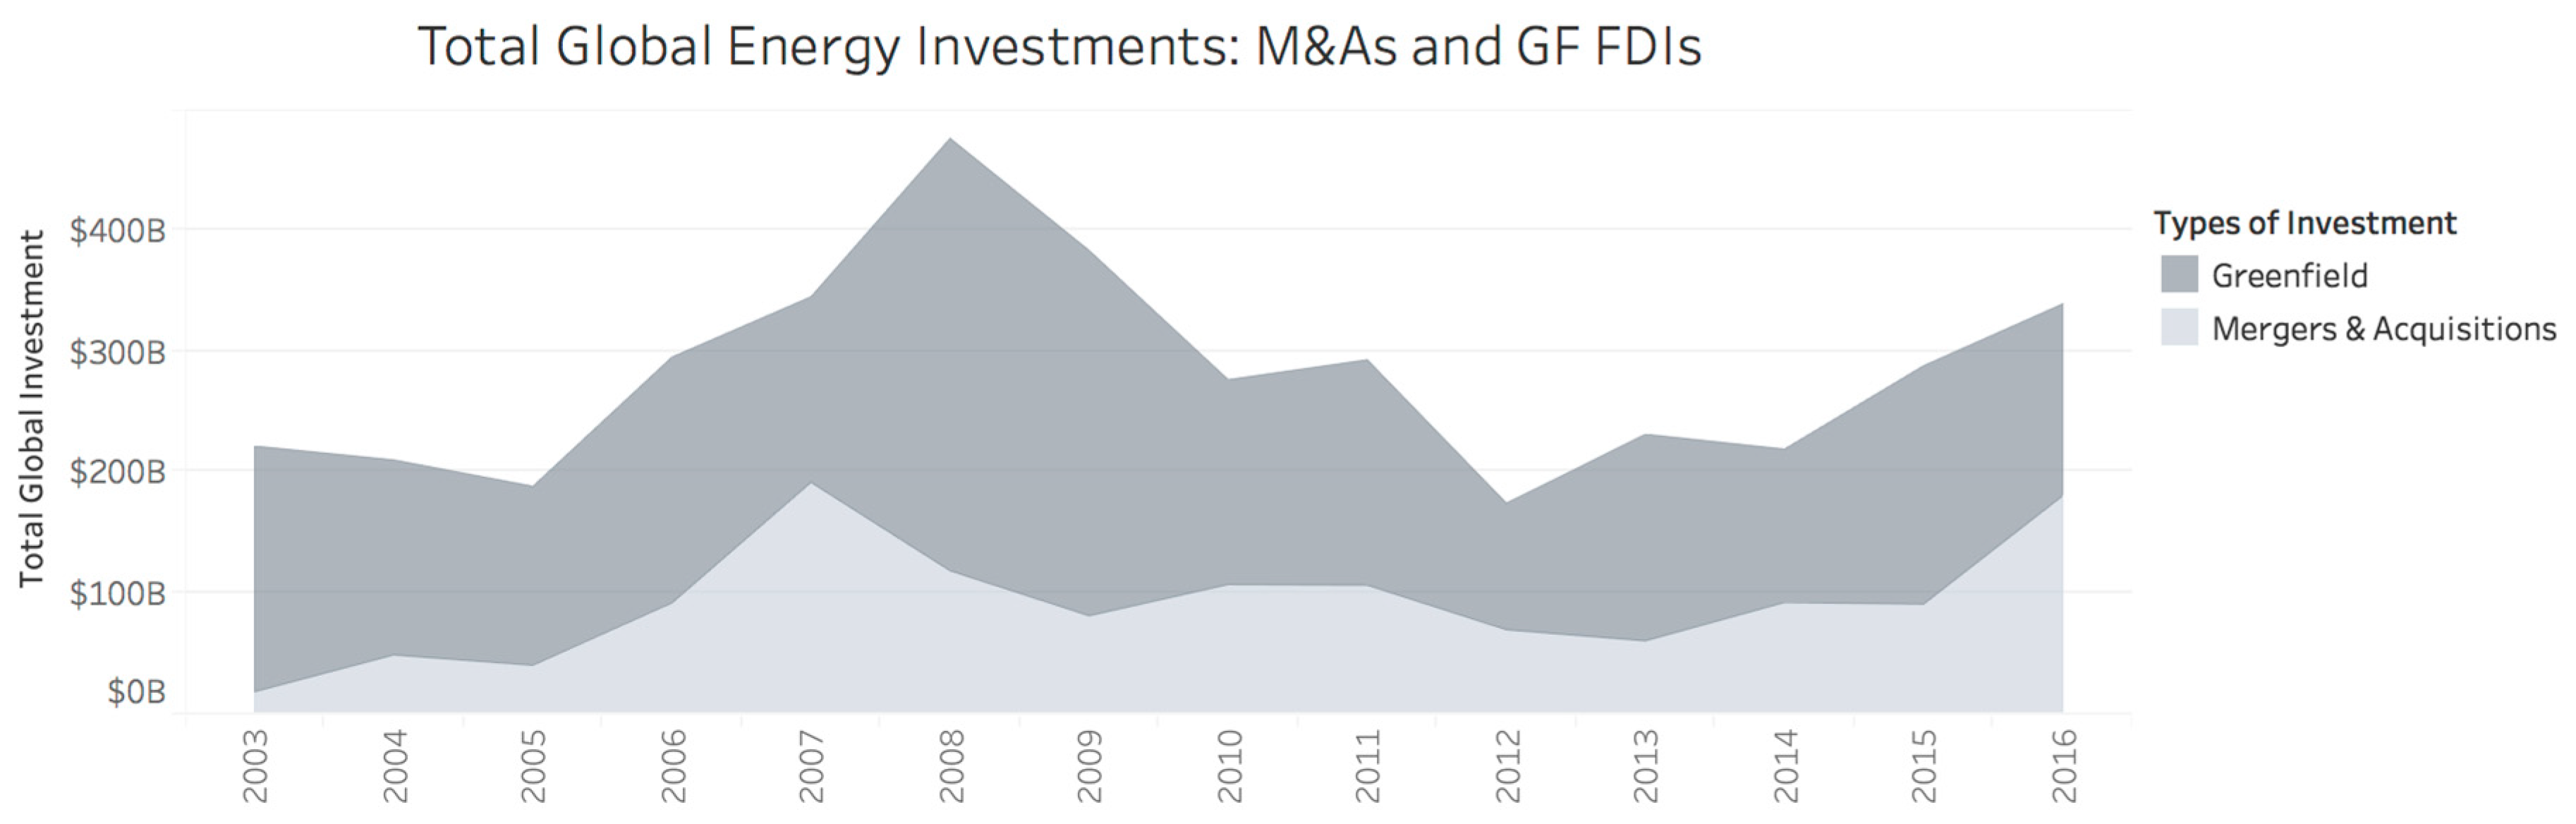
Figure 2 shows the total global GF and M&As investments from 2003 in 2016 as a stacked area graph. The lower section of
Figure 2 represents M&A (in light gray), and the stacked amount on top (in darker gray) represents GF. The overall pattern indicates that there are similar highs and lows in both investments over time. There was an increase in GF and M&A investments until 2007. During the period of recession, both activities fell. While M&As dropped after 2007, GF peaked before the economic recession, fell during the recession, and then gradually recovered in the post-recession period. In 2007, the total amount of M&A reached around
$1771 B and the GF was around
$752 B. The total of both M&A and GF is around
$2523 B. While both have exhibited an upward trend from 2013 with a peak around 2015, they never reached the pre-recession levels of investment. The number of jobs (not shown in this figure) resulting from the investment is closely related to the amount of inbound investment [
44].
Inbound FDI is the value of a direct investment made by non-resident investors into the reporting economy. Outbound FDI is the value of a direct investment made by the residents of the reporting economy to external economies. Thus, the outbound and inbound investments represent the origins and destinations of money flows.
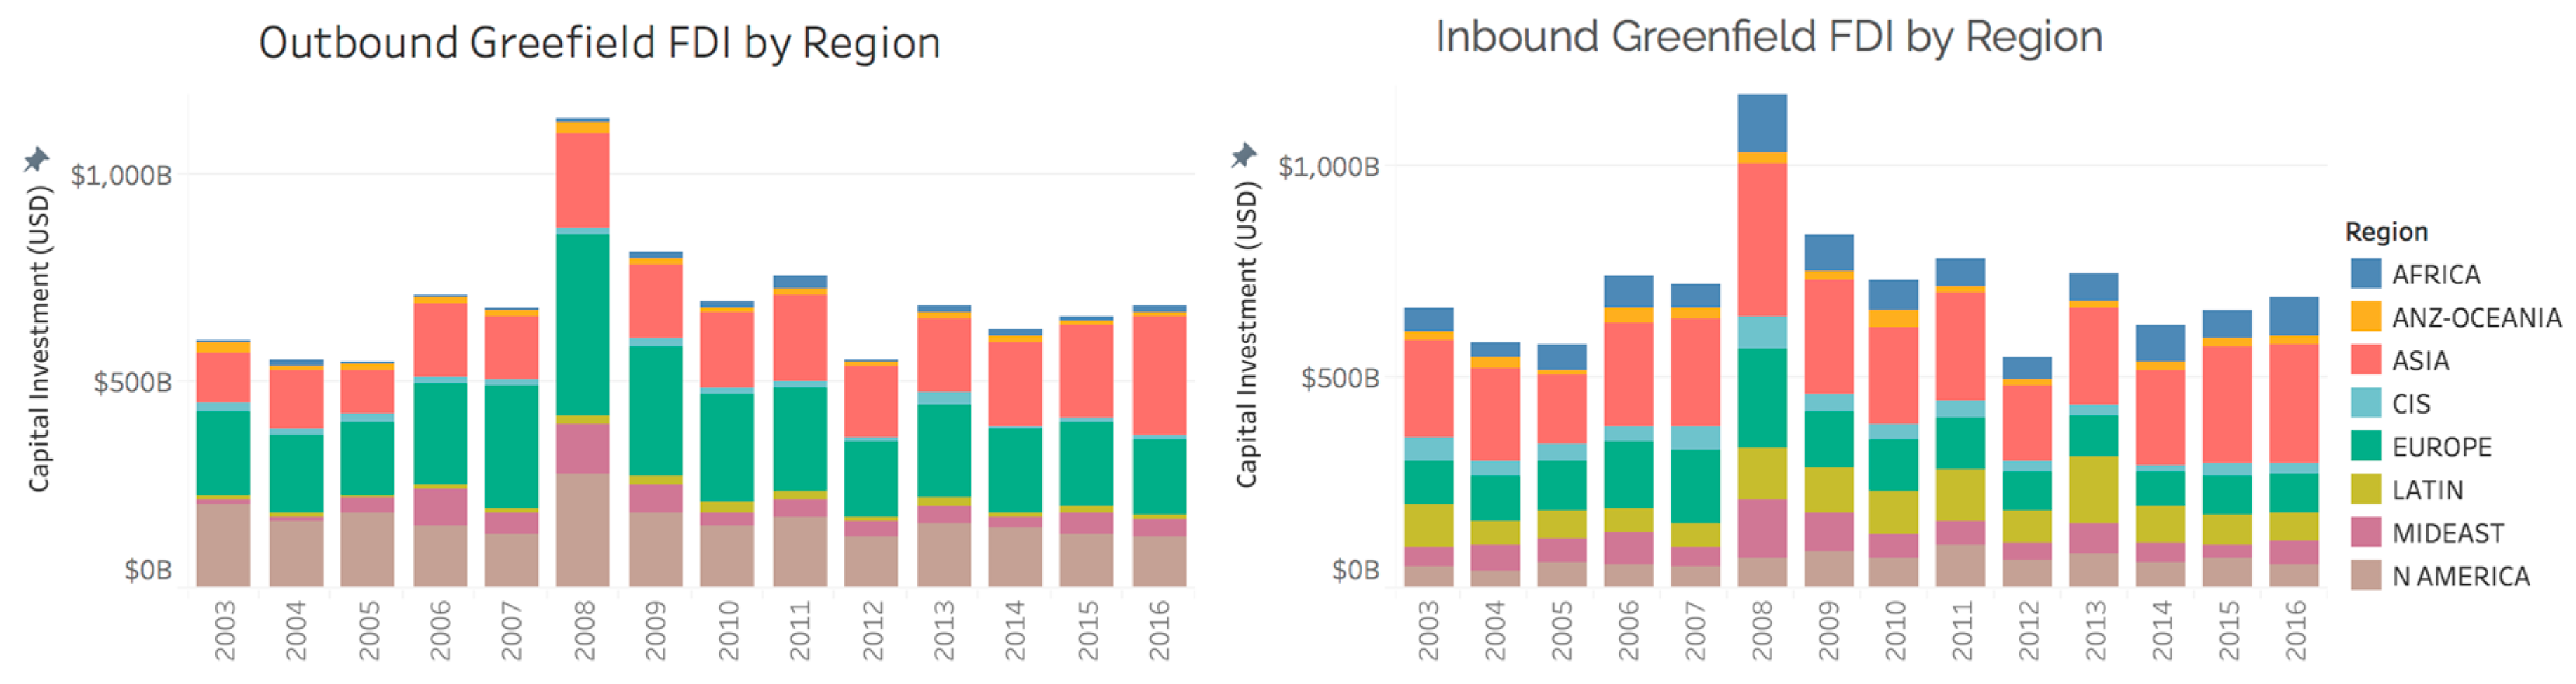
Figure 3 shows the regional total inbound and outbound GF FDI as a stacked histogram. While there is no accepted standard for region definitions, we selected regions as defined by the PLATTS database, which the team’s researchers have been using for other research projects.
Table A4 shows the countries of each region. Global
Figure 3 shows the global FDI outbound patterns on the left panel and inbound patterns on the right. We summarize the following from
Figure 3. First, Asia (China, Japan, and India) exhibit both investments, while Europe and North America exhibit primarily outbound investment. Second, 2008 (height of the recession) saw the largest investments, both inbound and outbound GF FDI. The post-recovery phase has not reached the 2008 peak yet. Third, the most substantial pattern of inbound flows to Asia (in red) occurred in 2008 (right panel) while the most substantial outbound flows from Asia occurred in 2016 (left panel).
Figure 4 shows the outbound GF FDI from the top 20 countries in the period 1996–2016. The value of China’s outbound GF FDI experienced a two-fold increase from pre- to mid-recession and a four-fold increase from mid- to post-recession while the US experienced less than a two-fold increase from recession to post-recession. Notably, in 2008, the beginning of the Great Recession, there is a peak in Chinese investment. This likely reflects the completion of deals signed before the Great Recession or that China was relatively well insulated from the crisis due to its pre-emptive stimulus package that prevented the initial negative shock from turning into a major recession [
45]. Of the seven largest economies in the world by GDP, only China grew by 9% in the third quarter of 2008 [
46,
47]. Note that Australia survived the global economic crisis well, reflecting its sound macroeconomic policies and strong demand for raw materials from China [
48].
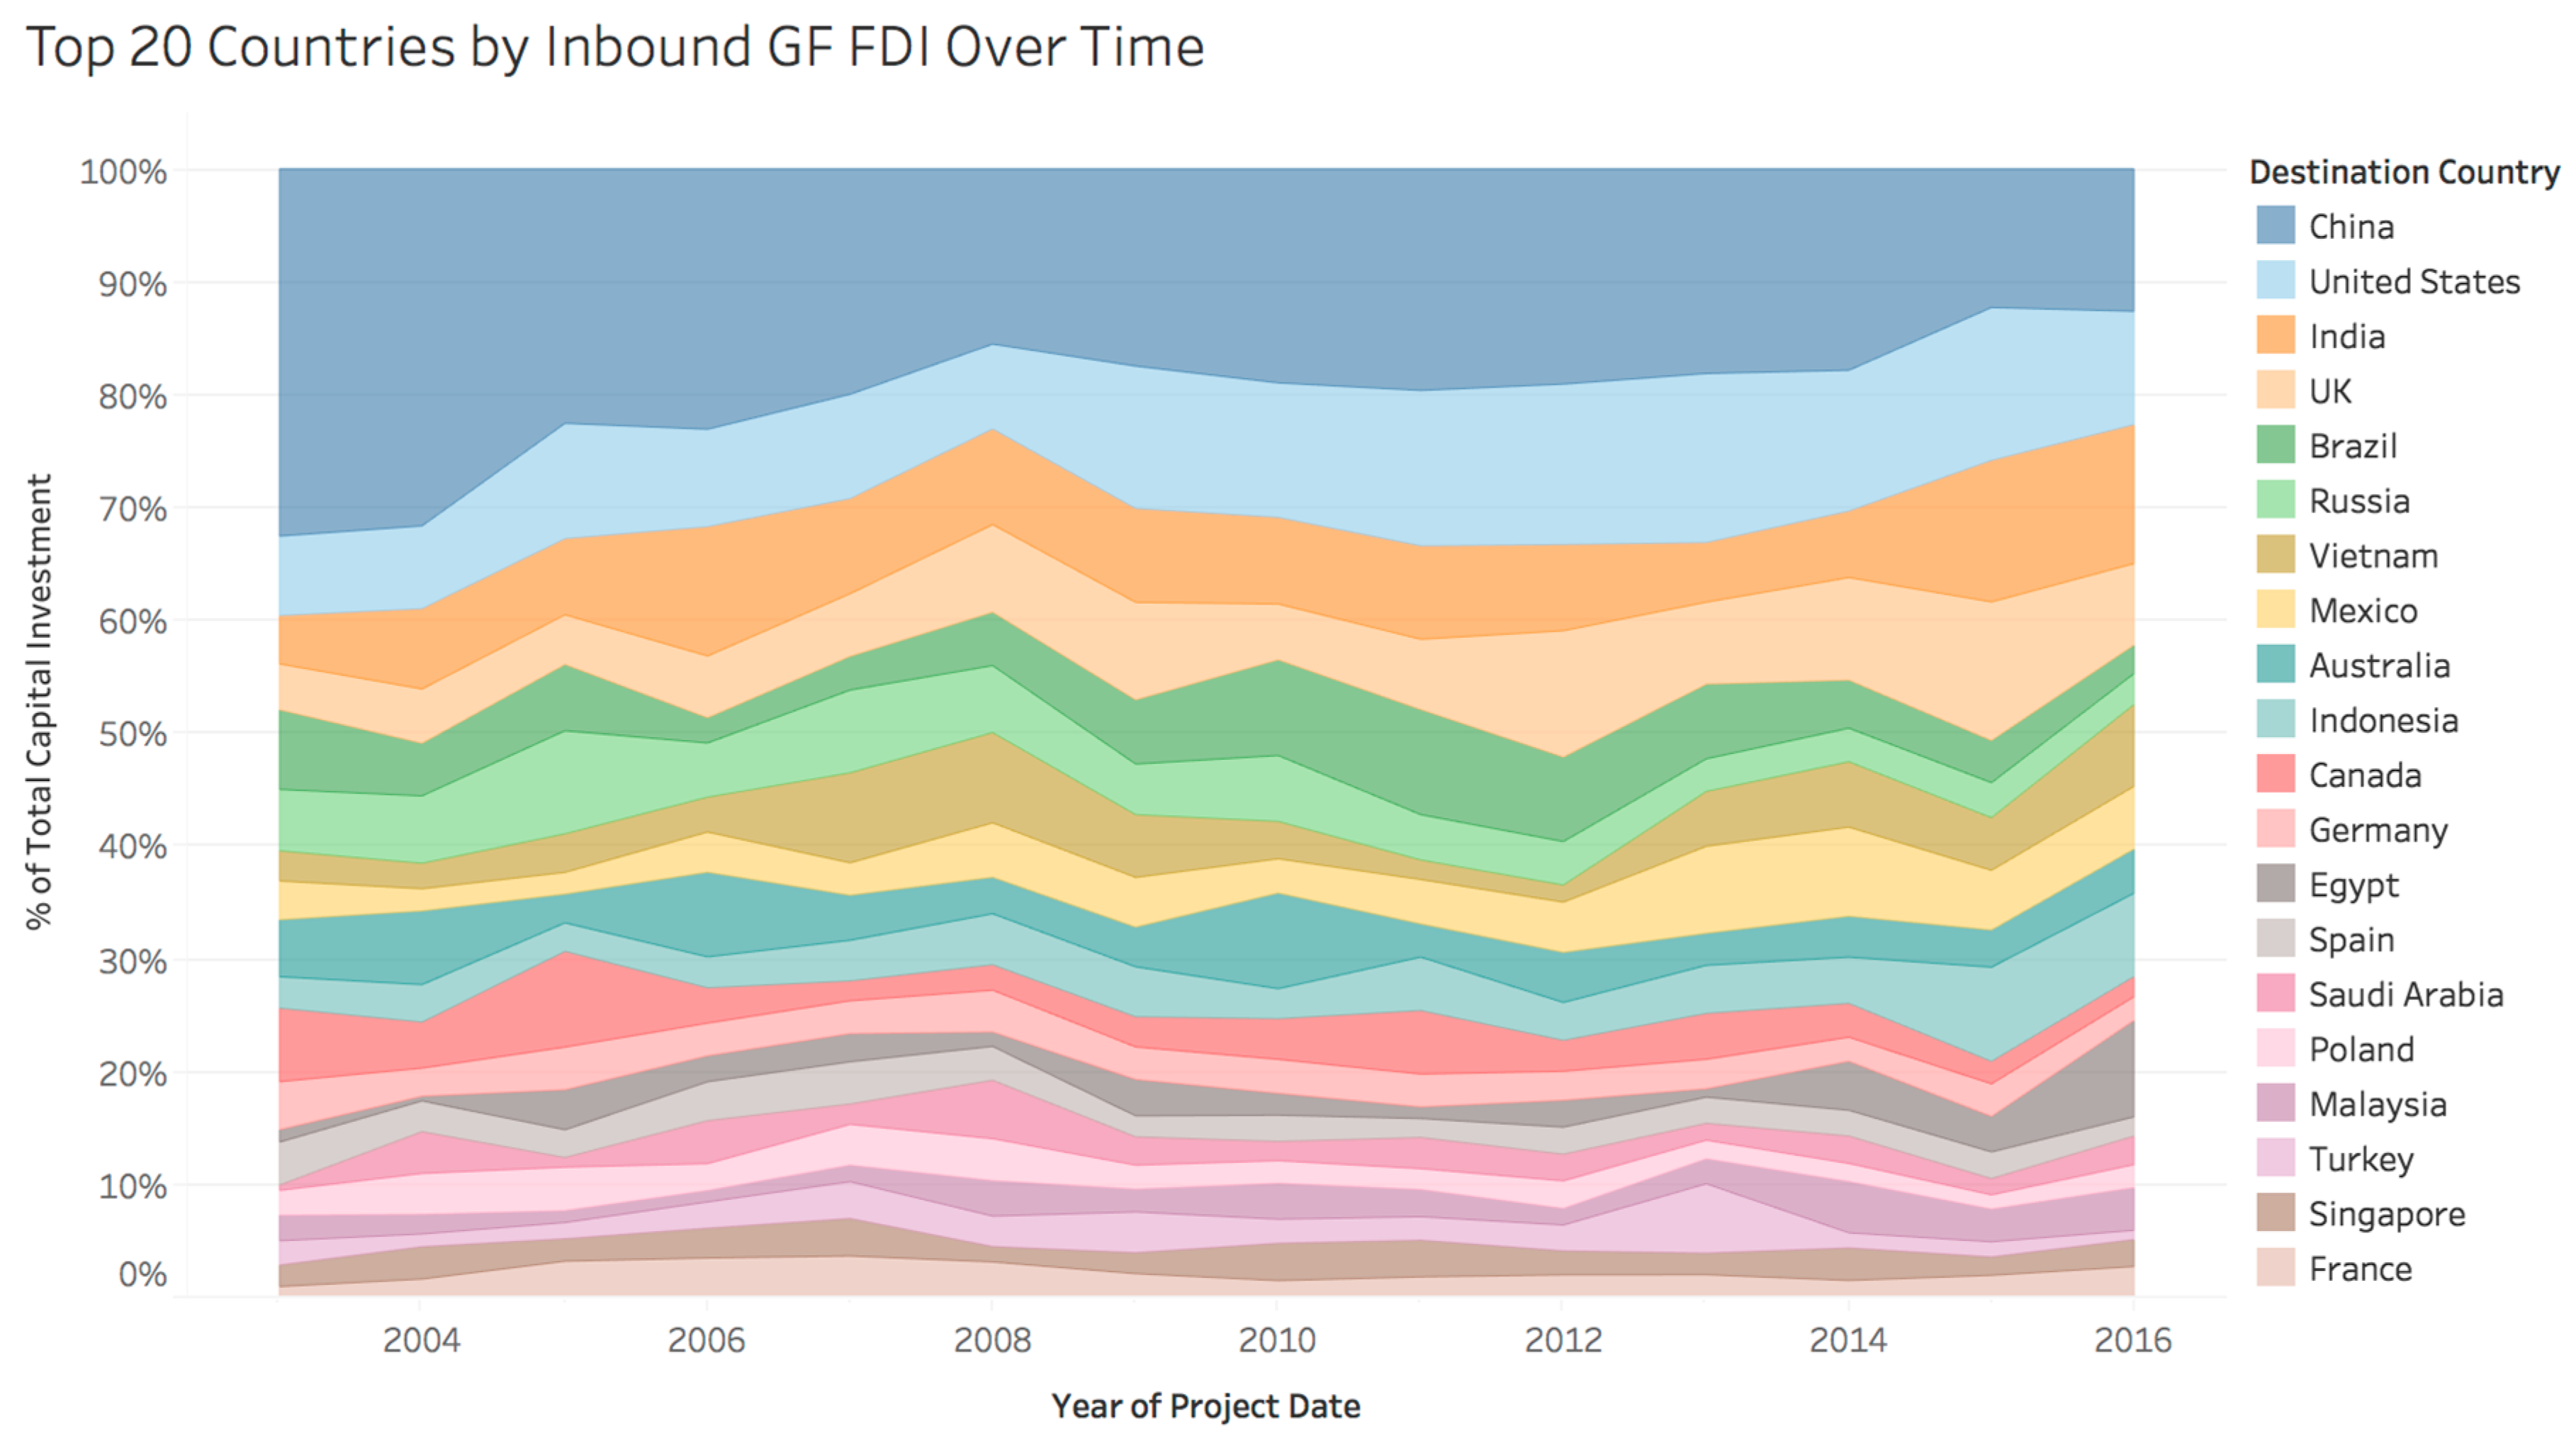
Figure 5 displays the breakout of the top 20 countries by inbound GF FDI investments (2003–2016). It shows China is the dominant player followed by the US, India, UK, Brazil, Russia, and Vietnam by substantially smaller FDI amounts. While in 2003, China received about 30% of the top 20 Countries FDI inbound investments, by 2016 it was receiving only 12.3%. The US retained the second spot in global inbound investment in the period 2008–2015. In 2016, India gained the second rank, receiving around 12% of inbound FDI investment.
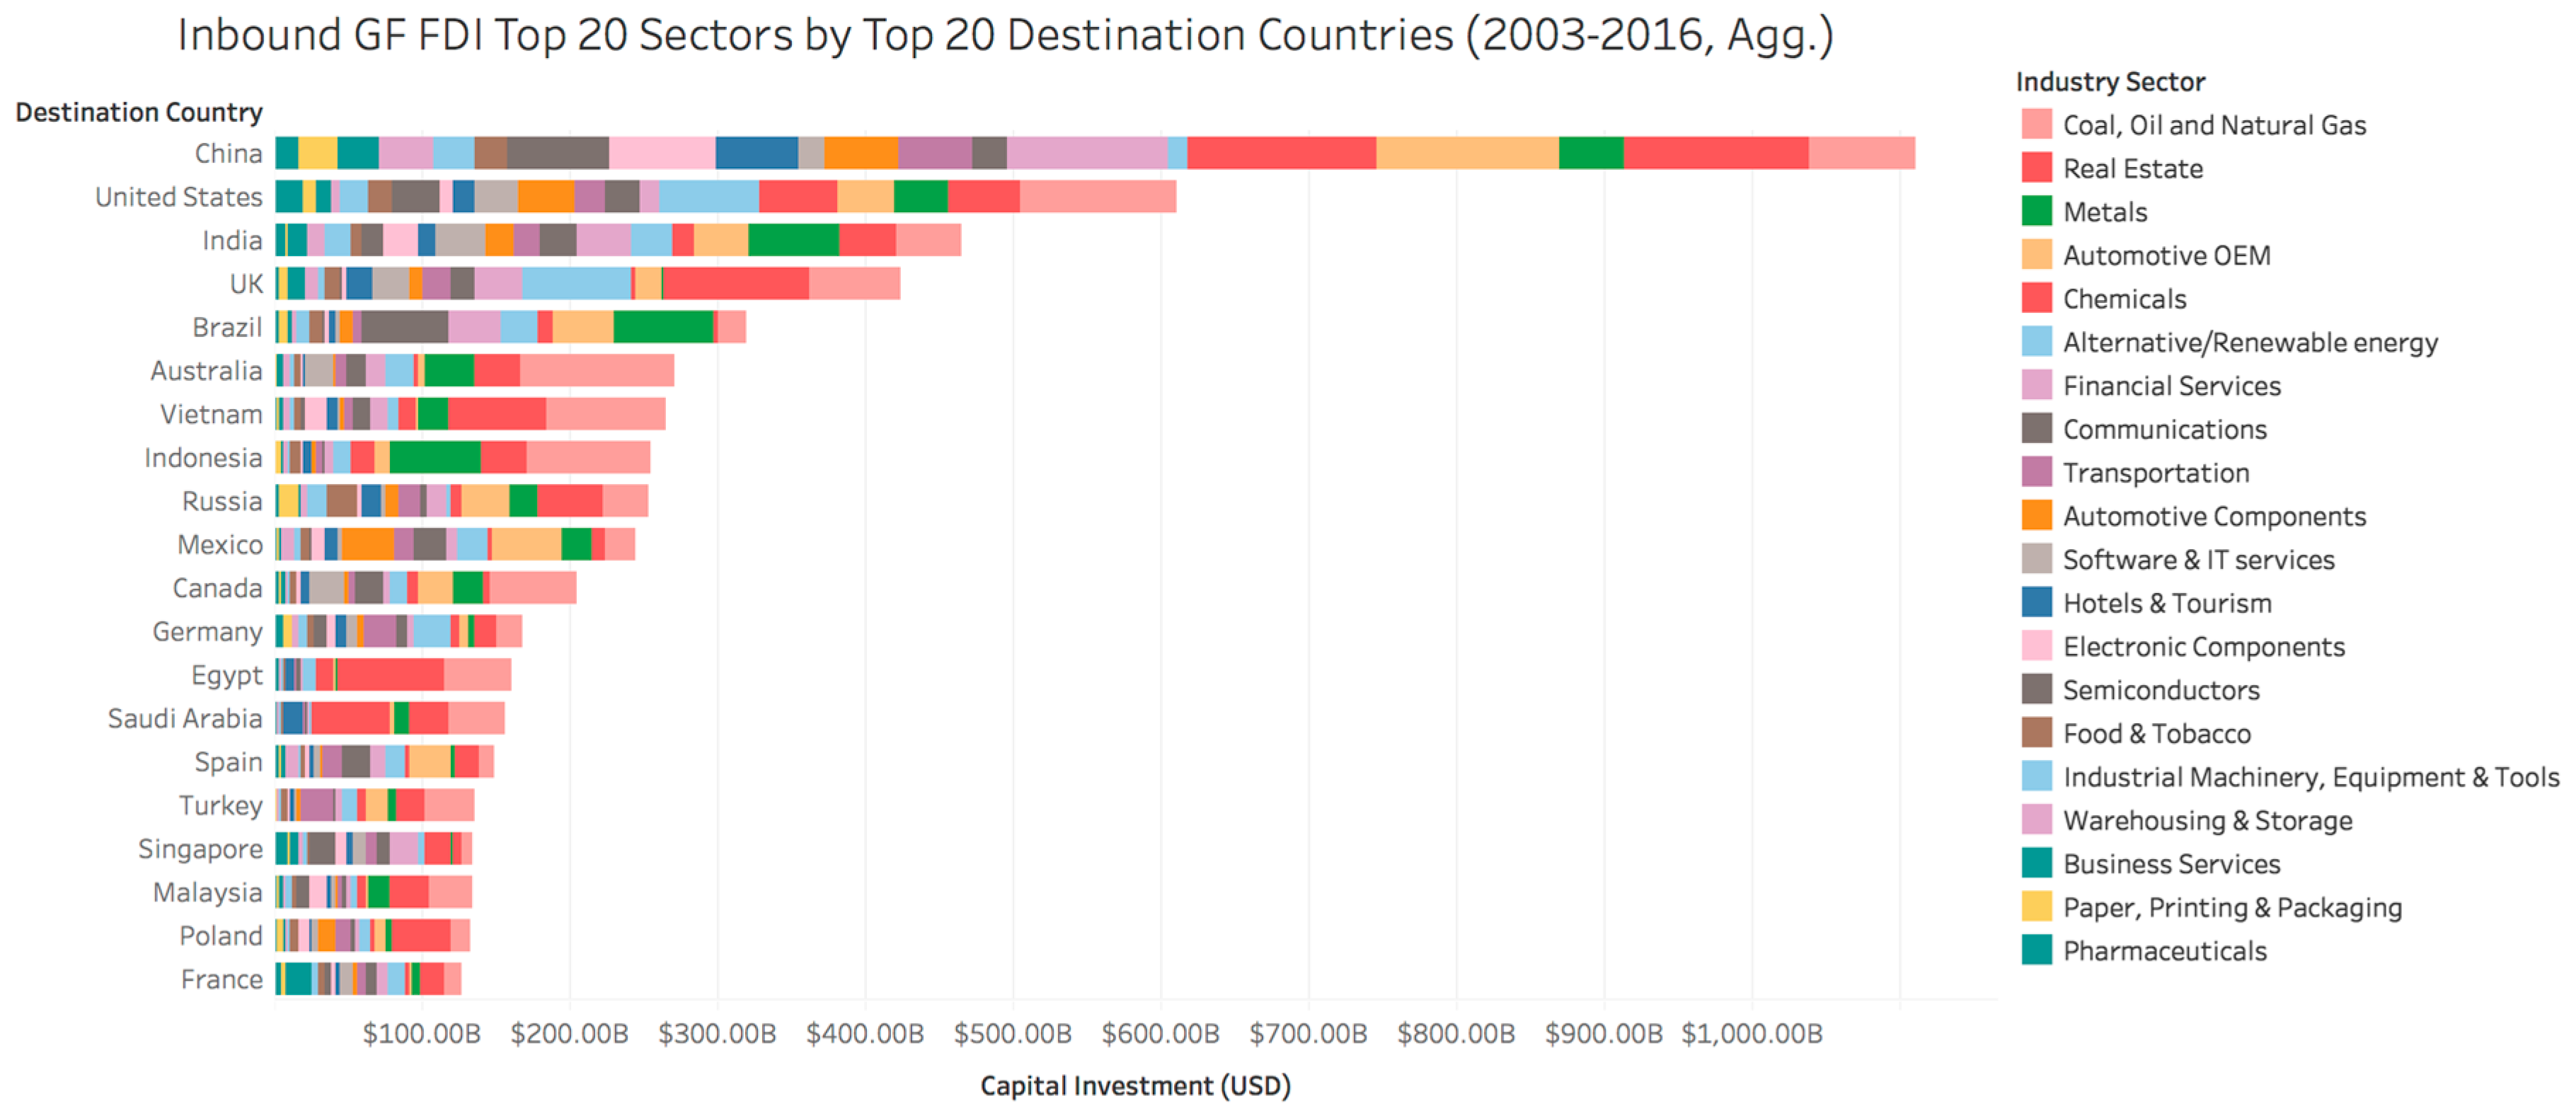
Figure 6 breaks down the inbound GF FDI investment by the top 20 industrial sectors in the same set of countries. The energy sector is represented by coal, oil, and natural gas (in pink—first block on extreme right), and alternative/renewable energy (light blue—sixth box from left) for each destination country in
Figure 6. China and the US show different patterns of inbound GF investment. In China, real estate, financial, chemical, and automotive sectors exceed energy GF FDI during this period [
49]. In contrast, energy dominates in the inbound GF FDI investment of the US, as fracking has attracted massive foreign investments including Canada, South Africa, Egypt, Saudi Arabia, and Taiwan. Also, investment is directed towards the construction facilities to chemically convert natural gas into diesel fuel, as well as to produce petrochemical and plastic-related products.
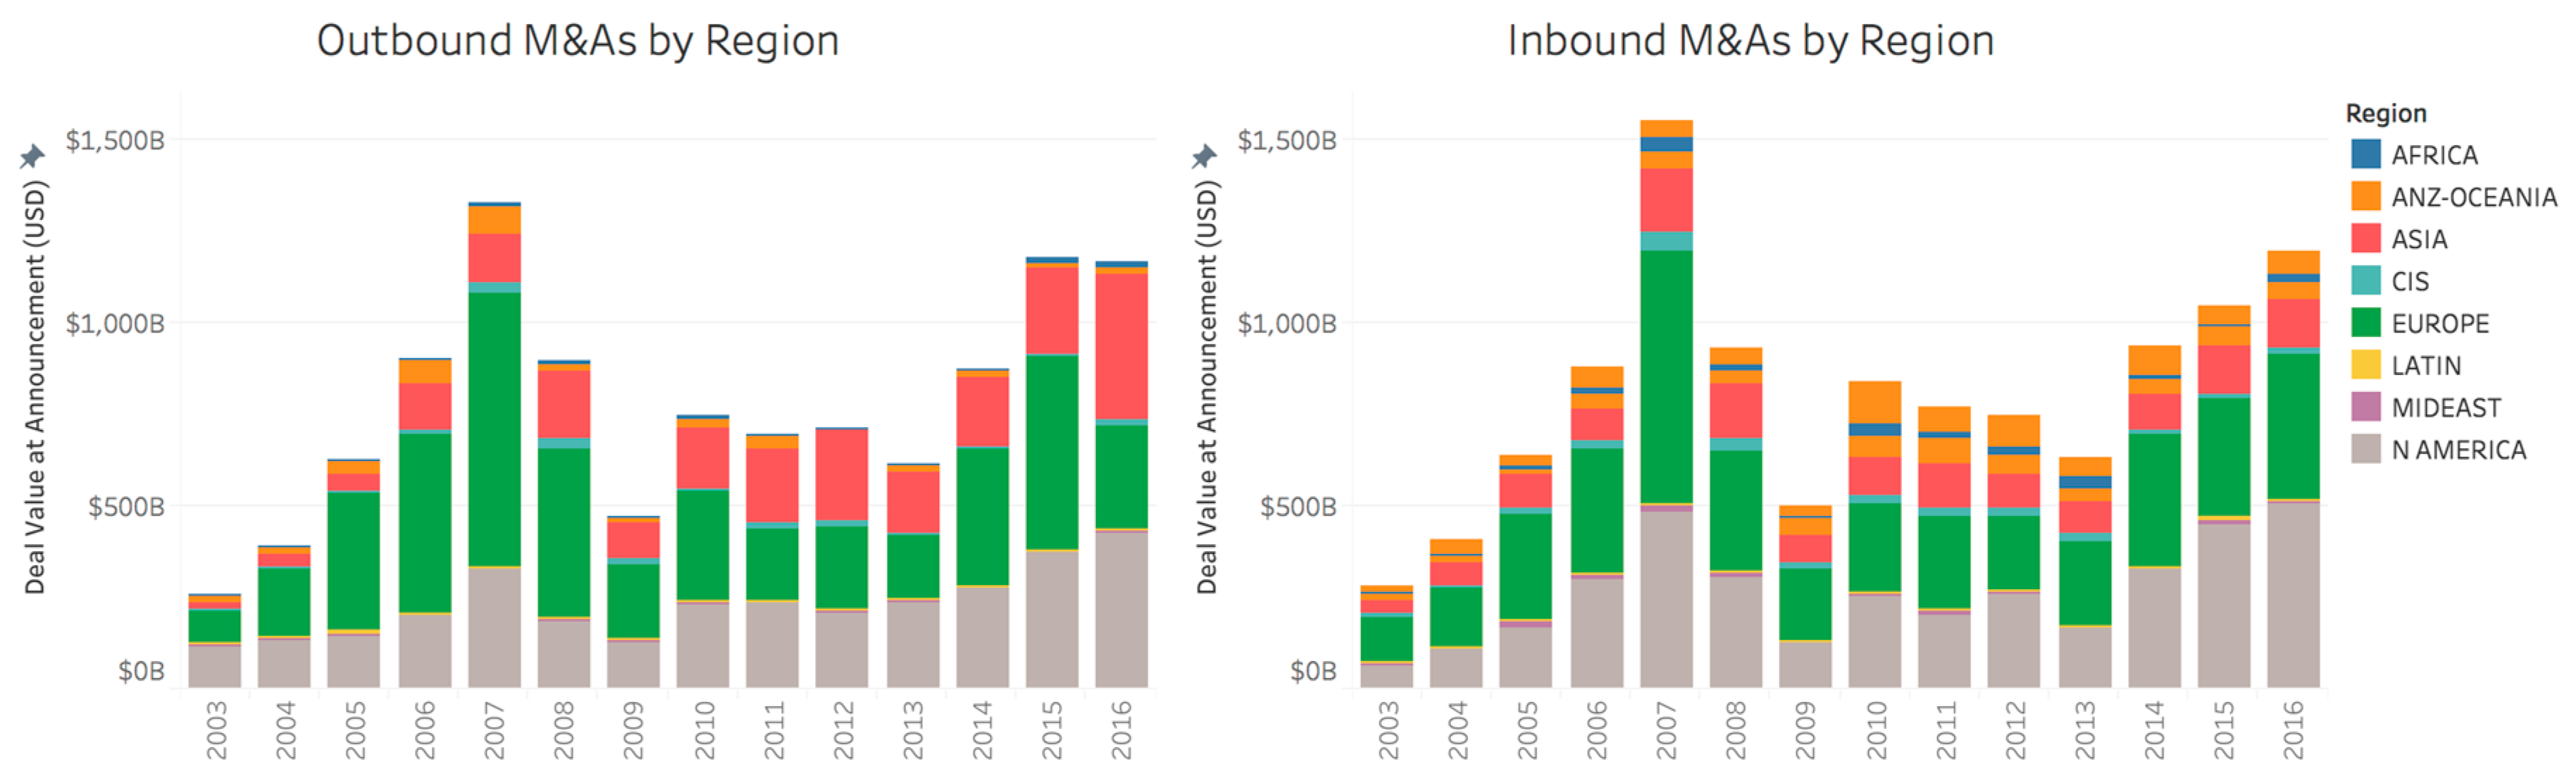
Figure 7 shows the inbound and outbound M&A (similar to
Figure 3 with GF FDI) in which Europe and North America, see
Table A4, exhibit both outbound and inbound investments suggesting a dominant north-north M&A pattern. While GF FDI shows the inclusion of Asia, consisting of China and India, Western Europe and North America dominate the M&A.
Figure 7 shows that inbound M&A are far less prevalent in Asia until 2007 and dropped off substantially in 2009 before recovering after 2010. While outbound M&A show the increasing role played by Asia (China) beginning in 2008, followed by a drop in 2009, before showing some recovery from 2010. Asia displays a strong dominance in outbound M&A in 2016.
Inbound and outbound investments of countries offer further insights on investment patterns.
Table 1 also shows the top ten outbound and inbound investment countries by number and value of investments in the Dealogic M&A database; USA and UK are the top two countries in terms of the value and the number of outbound deals (left panel).
The US has nearly double the number of M&As compared with the second highest country (UK) during this period. China ranks at number 13 (not shown in the table) with 3988 M&As compared with that of the US at 23,830 during this period. Thus, the US is nearly six times larger than China in terms of the volume of outbound M&As during this period. China occupies the seventh rank in the outbound investment with $657 B but is not listed in the top ten in the number of investments, suggesting that its investments are larger in size. Western Europe, along with Japan and Hong Kong are in this top ten list of outbound investing countries. The USA and UK are the top two countries in terms of the number of inbound deals (last column on the right) followed by China and Germany in this period. China ranks third in the number of M&A inbound investments (#deals is 9159), but it ranks ninth in the total value of inbound investments ($421 B) during the same period suggesting a smaller value of the deals. The US is nearly seven times larger than China in terms of the number of inbound M&As during this period. US, Western Europe, Canada, and Australia are in the top seven rankings indicating they attract larger M&A deals.
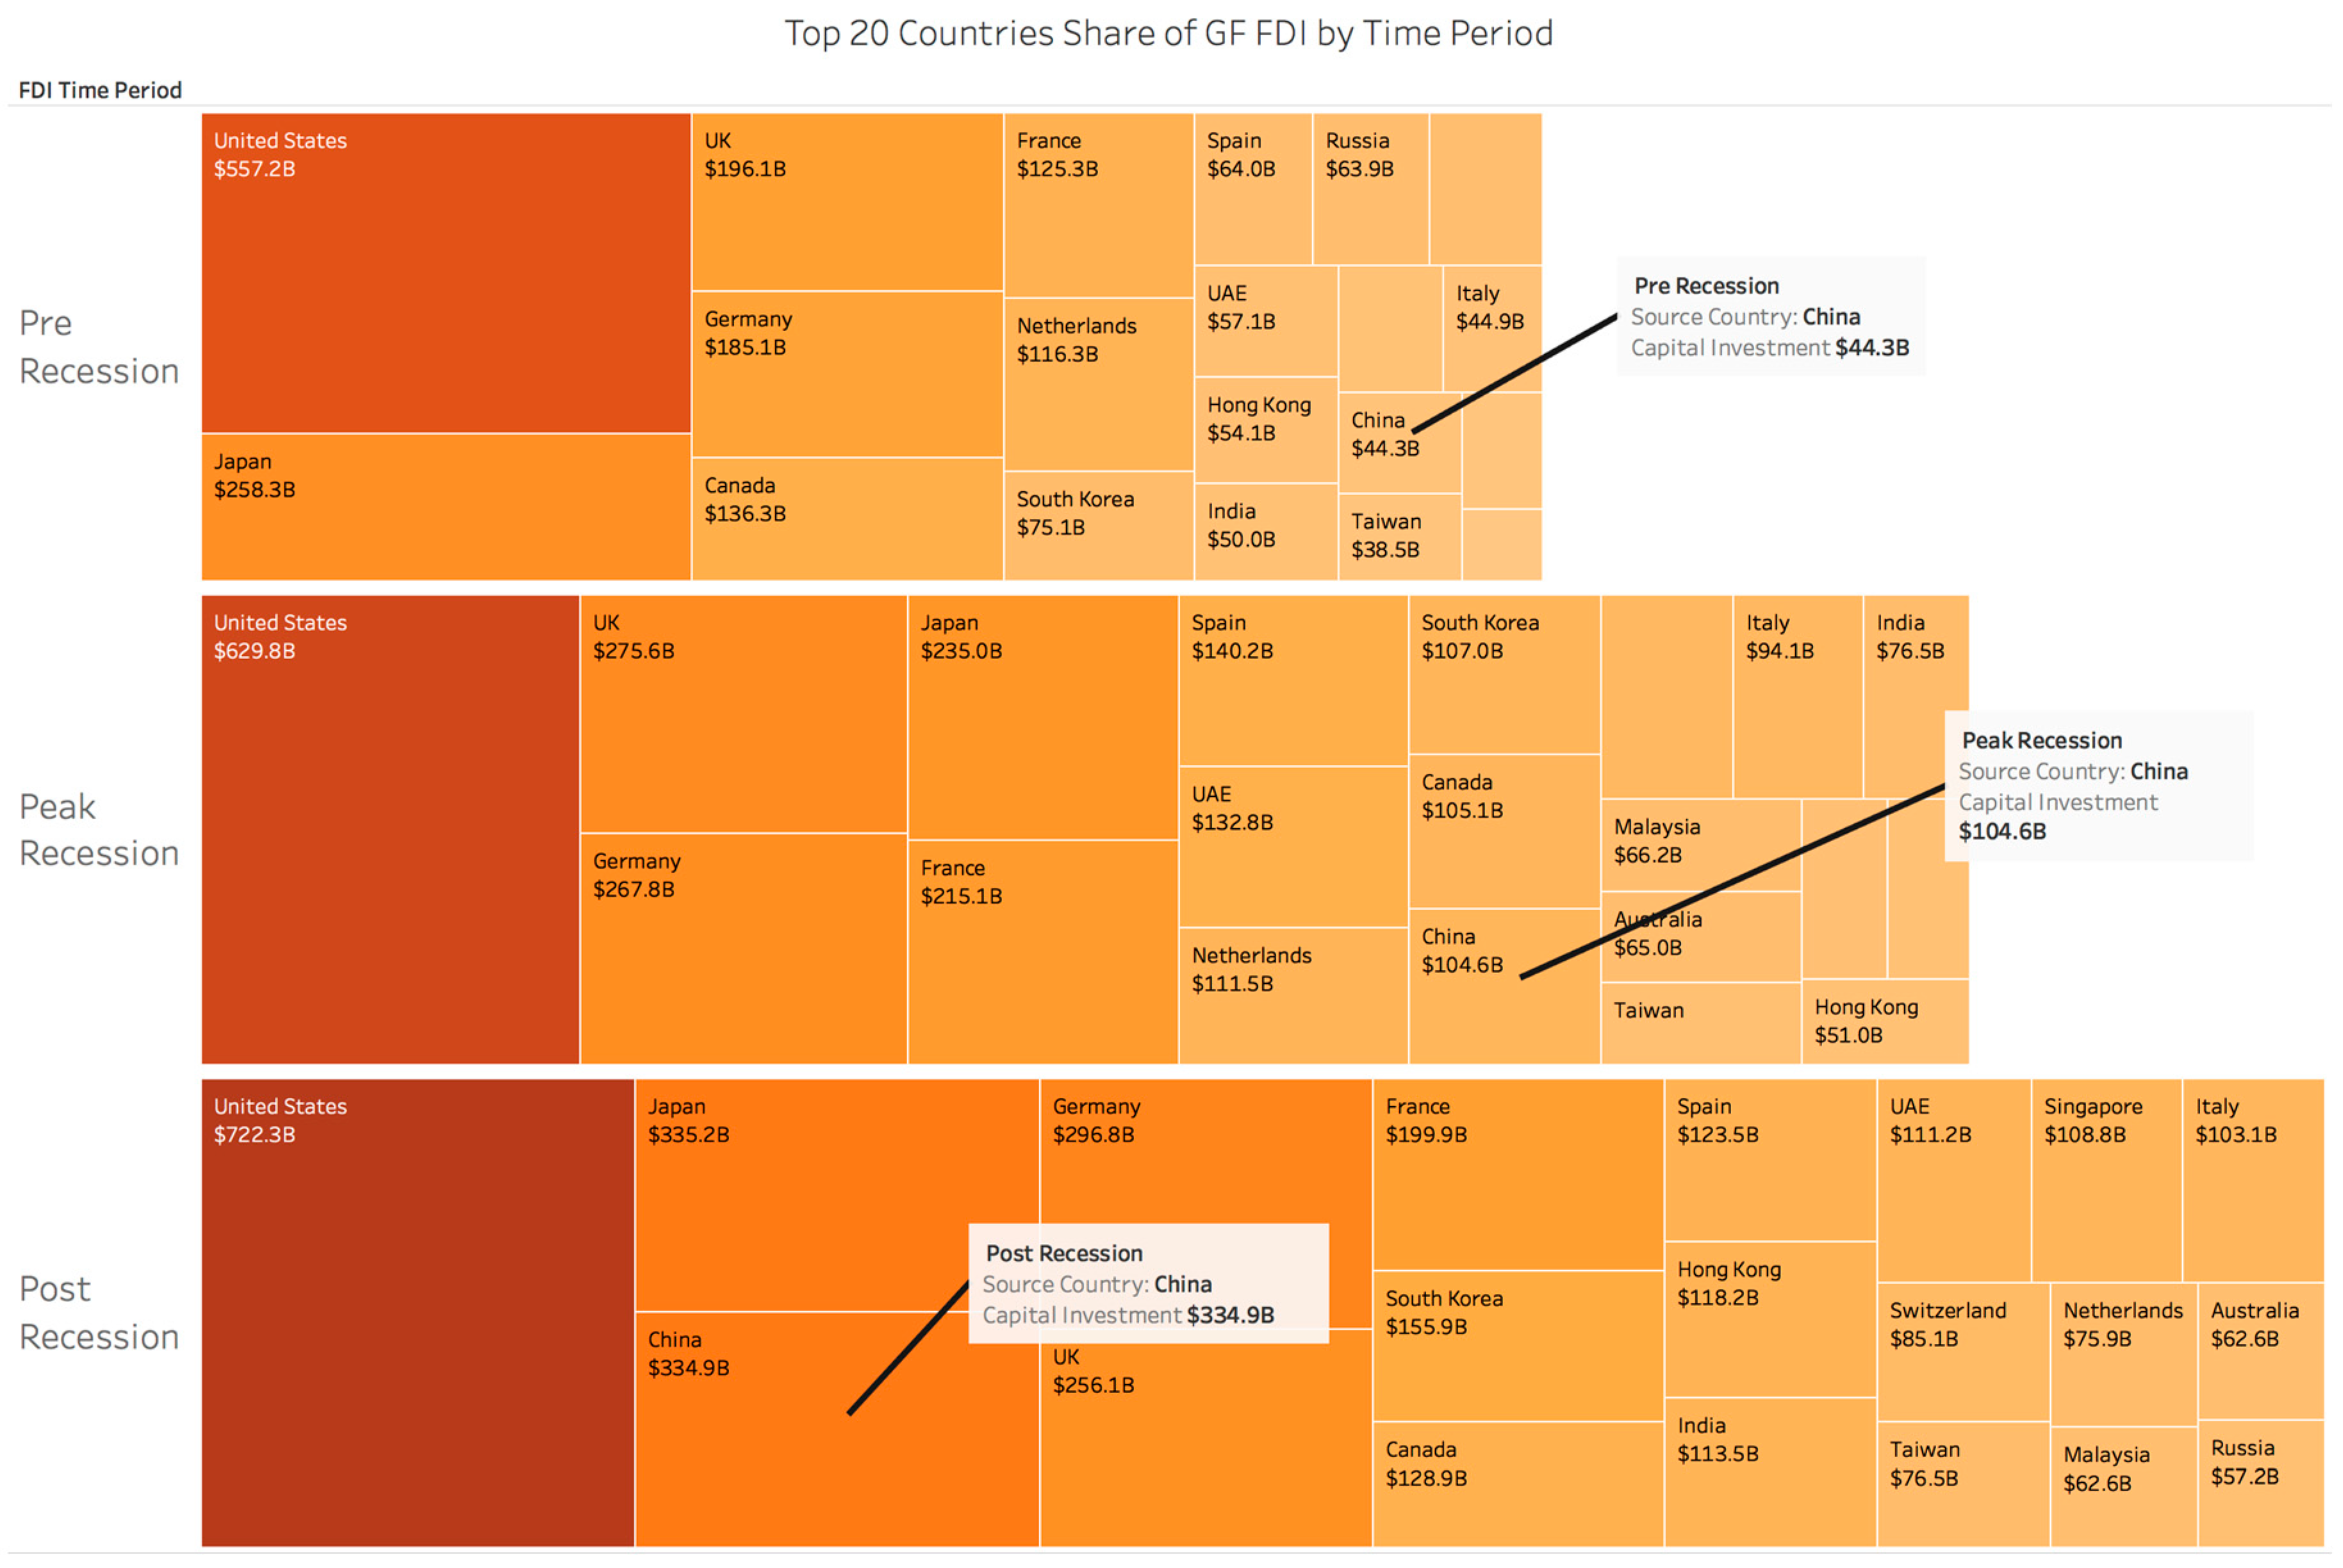
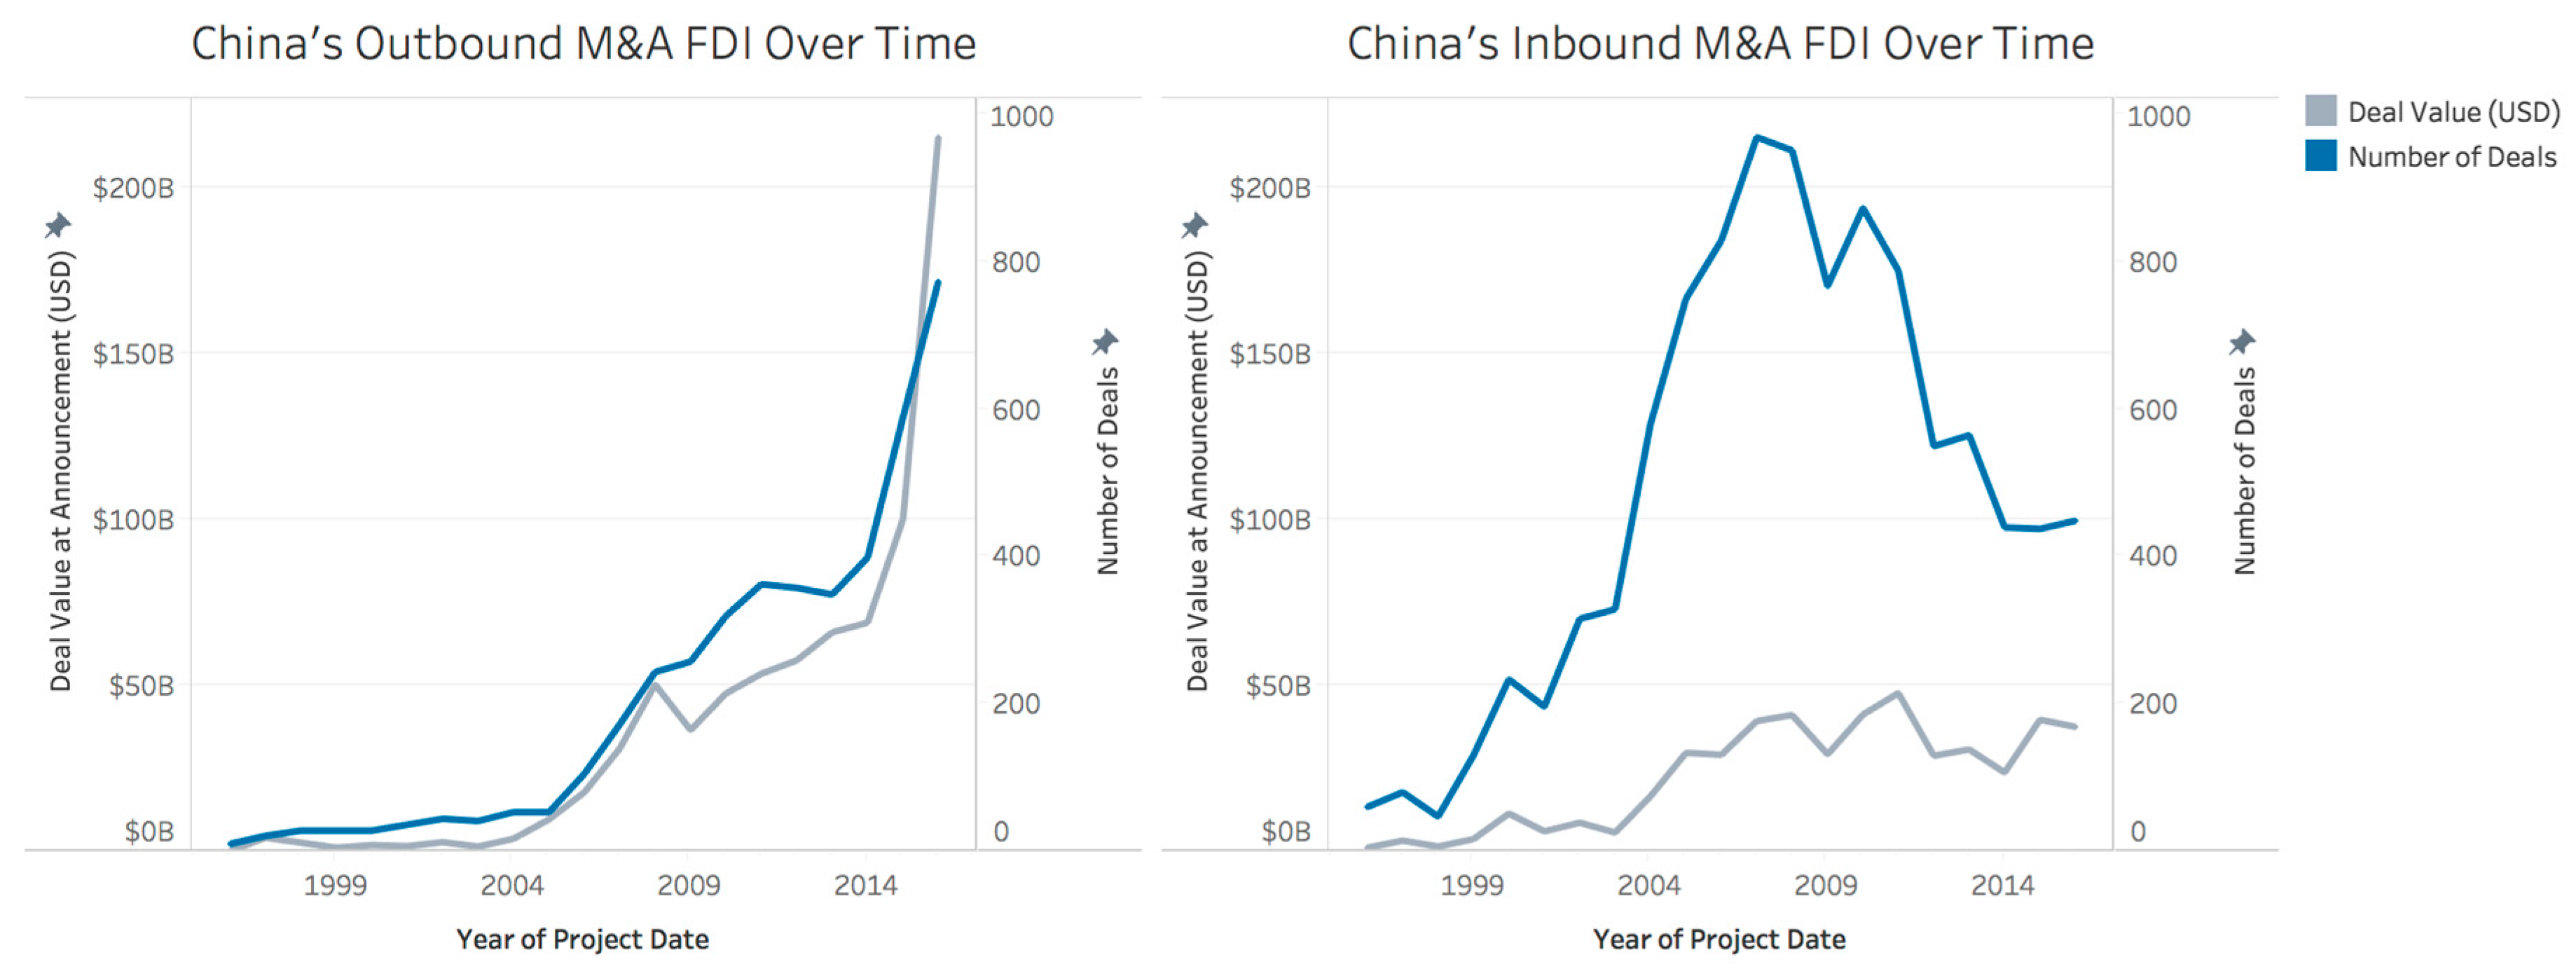
Figure 8 shows China’s inbound and outbound M&A during the longer time span of 1996–2016. While China’s outbound M&A (left panel) has shown an increasing trend from 2005, its inbound M&A (right panel) displays a decreasing trend from 2008. China’s GF FDI was insignificant during the pre-recession period. Its outbound investment grew from
$44.38 B to
$104.68 B to
$334.98 B—close to Japan in the post-recession years. China has changed its status from having more outbound than inbound investments, as shown in
Figure 8. Both investment types show the rise of China in the global economy in the period following the recession. Thus,
Figure 8 shows a reversal in China’s position in its inbound and outbound M&A in the time span of 1996–2016.
3.2. M&As and GF FDI in the Energy Sector
While energy accounts for nearly 25% of all FDI, it only accounts for 4.82% of the total M&A activity during 2003–2016. The share of energy M&As as a share of total global M&As in the three phases of recession is around 5% while the share of energy as a share of total global GF FDI is around 25–26% during pre-recession and recession. However, the share of energy in GF FDI has decreased to 21% in the post-recession phase. Thus, the proportion of global M&A and GF FDI in the energy sector is 5:1 in the period 2003–2016.
Figure 9 exhibits an overall trend in energy investments similar to that shown in
Figure 2, with a peak in 2007–2008. GF FDI is the dominant form of energy FDI, which peaked around 2008 while M&A peaked in 2007, before the recession hit and both investments fell sharply. Energy GF patterns experienced a second downturn in 2012, swung upwards in 2013, followed by a slight downturn in 2014 and a generally upward trajectory since 2014. On the other hand, M&A shows an upward trend from 2013. To summarize, GF and M&A investment in energy reflect the period of recession in the global economy around 2008–2009.
As a first step, we analyze general inbound and outbound global energy FDI for both M&A and GF investment types. We present the energy investments in
Table 2 (similar to
Figure 3 and
Figure 7). We show the outflows and inflows in each region. For example, outflows from Africa amount to
$25,958 while inflows into Africa amount to
$139,368 for GF FDI investments. Note that Asia (China, Japan, and India), Africa, and to a smaller degree, Latin America represent the destination for inbound investment while Europe and North America are mostly sources of outbound investment. In the last decade, India has eased its policy and now permits 100% FDI in the power sector for the generation, transmission, and distribution of electricity and power trading, (except atomic energy). As a result, India could receive more GF FDI from China as would other BRI countries.
Table 2 indicates that many North-North deals are consisting of intra-Europe and intra-North American M&A deals. Latin America and Africa have lesser amounts of M&As inflows but have some outflows. Asia has inflows and outflows of FDI GF and more outflows of M&A (compared with inflows).
We primarily focus our analysis on post-recession years (2010–2016) to understand the emerging FDI patterns in the most recent years. The US is the leading outbound source in FDI energy sector investment. Overall, the US has an investment of $852 B while Japan and Germany have $387 B and $362 B each. China holds the fourth rank with $355 B. Germany, France, UK, and Canada are other sources.
Table 3 shows the GF FDI of the top ten countries in the various segments of the energy supply chain, revealing patterns of specialization. Malaysia and China lead in GF investment in power/pipeline transmission, followed by Canada. Besides, China leads in GF FDI in electricity generation followed by Spain and the US. (China invests in Europe, India, and Turkey). China has seen over 50% increases in its outbound investment of power/pipeline transmission from pre-recession (
$1 B) to post-recession (
$7 B). China’s outbound GF FDI in electricity generation is remarkable given its meteoric rise from around
$5 B to
$7 B in the pre-to-peak recession period to over
$54 B in post-recession. China’s focus on electricity generation can be seen as an effective way of securing energy supply, similar to the world’s leading energy-consuming countries. The US and South Africa lead in outbound GF FDI in manufacturing followed by UK and Russia, as shown in
Table 3. The US and France lead in extraction followed by UK and Italy. China is not in the top ten FDI GF investing countries in resource extraction but is prominent in both inbound and outbound GF FDI investments in power/pipeline transmission, electricity generation, and manufacturing.
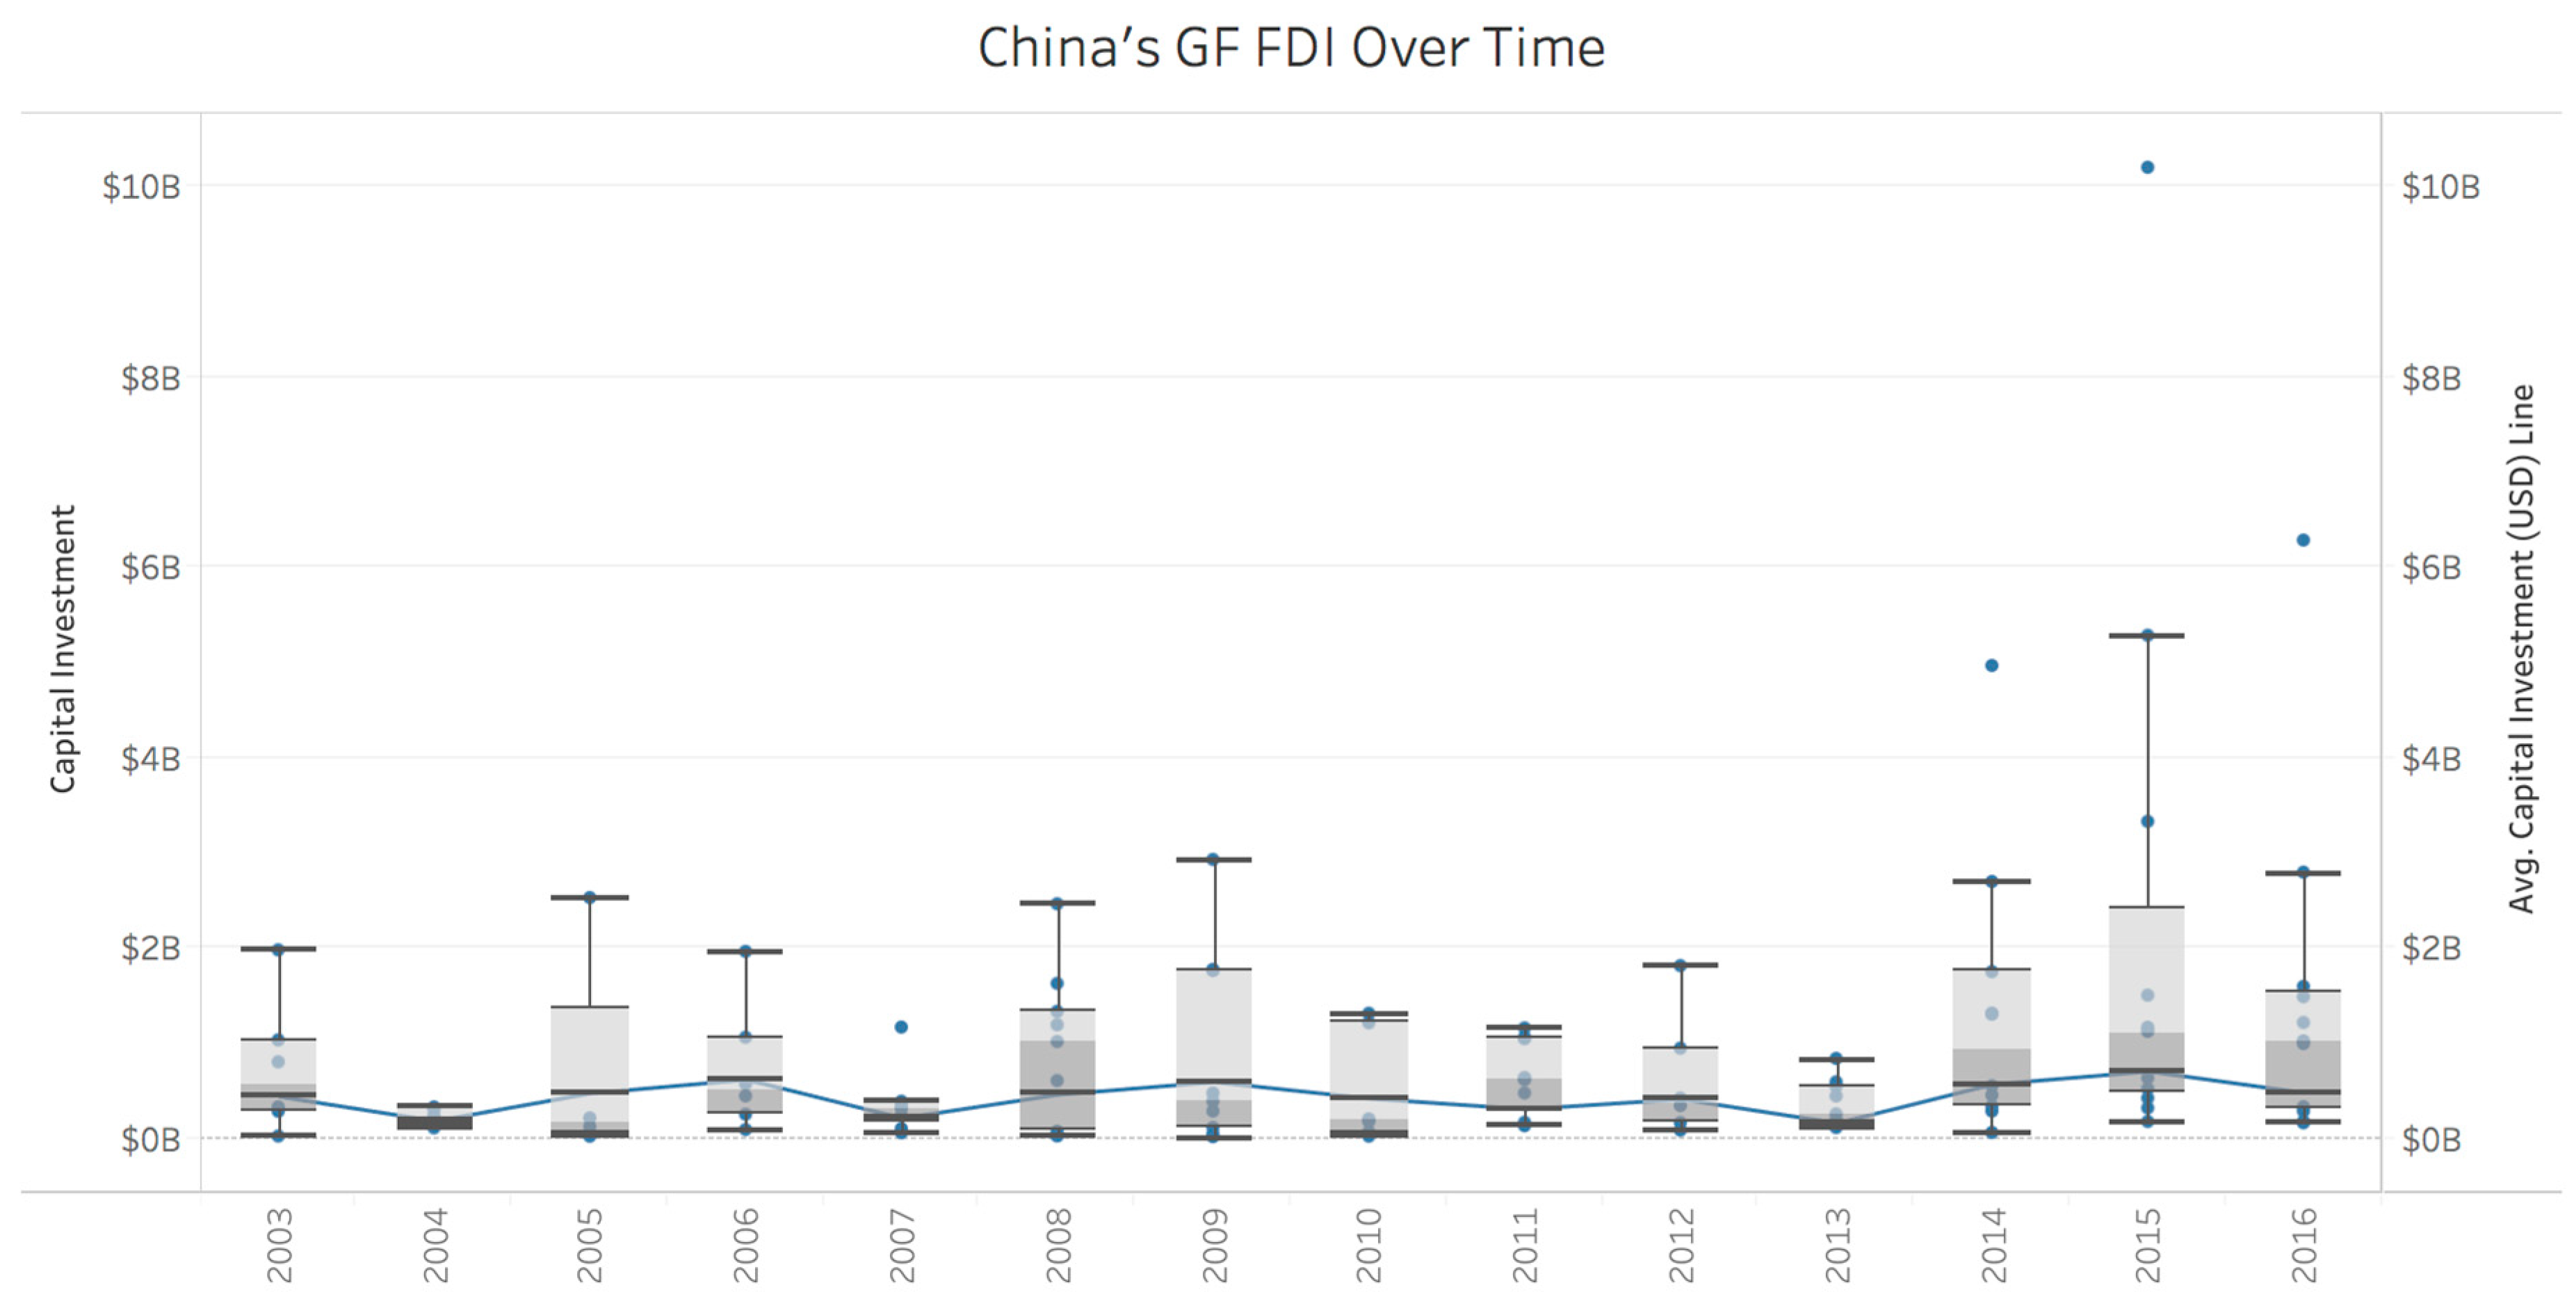
We next examine China’s FDI statistical outbound investment distribution in the energy sector in 2003–2016 as a box-whisker plot in
Figure 10. Each year’s investments are shown as a quartile distribution with whiskers from the first to the third quartile along with outliers (shown as dots in 2007, 2014–2016). The median value of the investment is around
$1 B with variations in the distribution over this time period. China has made larger investments in 2014–2016, as indicated by the outliers in
Figure 10. In 2015, China invested
$10 B in an energy project while in 2014 and 2016 it invested over
$5 B in projects. We can expect China’s outbound FDI GF investments to grow in the energy sector given the BRI that encompasses 75% of known global energy reserves [
5].
Table 4 shows M&A activity in the energy supply chain for the period 2003–2016 concerning the announced deal. China leads in extraction; Italy in electricity generation; Canada in power/pipeline transmission, and distribution. China ascended to this position in extraction following the economic recession.
3.3. Origin and Destination of Energy FDI
We discuss the energy flows from origin countries such as China, UK, Germany, and the USA in the post-recession period along various segments of the supply chain. In the context of M&As, China has around 65% in the extraction segment, 33% in electricity generation, and approximately 20% in pipeline transmission and distribution in the post-recession period, as shown in
Figure 11. In contrast, the US invests approximately 31% in the extraction segment and 17% in electricity generation. Other significant M&A investments for the US are 27% in pipeline transmission and distribution and 21% in manufacturing. Thus, the US has a more even spread of M&As in all segments of the energy supply chain compared with China’s concentration in the upstream segment of the oil and gas sector.
Figure 11 concerns M&A; China is still focused on extraction, experiencing over 100% growth in M&A in this segment during this period. While the US has experienced over 200% growth in M&A in pipeline transmission and distribution, manufacturing, and electricity generation. To summarize, China’s focus is mostly on the upstream segment of the supply chain whereas the US’s focus is on all segments except refineries and retail/wholesale. China’s strategy in the future is perhaps one of diversification through its BRI.
The origin-destination in
Table 5 shows outbound M&A and GF FDI of China, USA, Japan, and France. While China’s greatest M&A outflow is to Australia, Brazil, and Portugal, its largest recipients in GF are in Asia, Pakistan, and India. The USA exhibits a different pattern. USA’s greatest M&A outflows are to countries in Europe and Canada. The USA’s seventh largest M&A destination is China. USA’s greatest GF outflow is into Canada with some investments in Turkey, Brazil, and Nigeria.
Japan’s most substantial GF outflows are to countries in Asia including Myanmar, Vietnam, Indonesia, and Malaysia, while its most significant M&As are to the US, Australia, Canada, and the UK. France’s strategy for both GF and M&A is to countries in Europe and the US. Its eighth largest GF is to Russia, which does not appear elsewhere in the top ten outbound destinations of any other country in this consideration set. To summarize, China’s pattern of GF investment flows into the countries in Asia and Africa in addition to the US and UK. While the US, UK, and Japan choose Western Europe, Canada, and Australia as the top four destinations in their M&A, their GF is more inclusive of the rest of the world. China, on the other hand, seems to be moving away from this North-North model as it invests in other regions of the world especially in the energy sector as exemplified by their M&A in Brazil, Malaysia, and Pakistan and their FDI in Pakistan and India. We next describe specific cases of Chinese outbound FDI in the energy sector to provide representative examples detailing Chinese investment in all energy sub-sectors across different regions around the world.
3.4. China’s Energy Investment Landscape
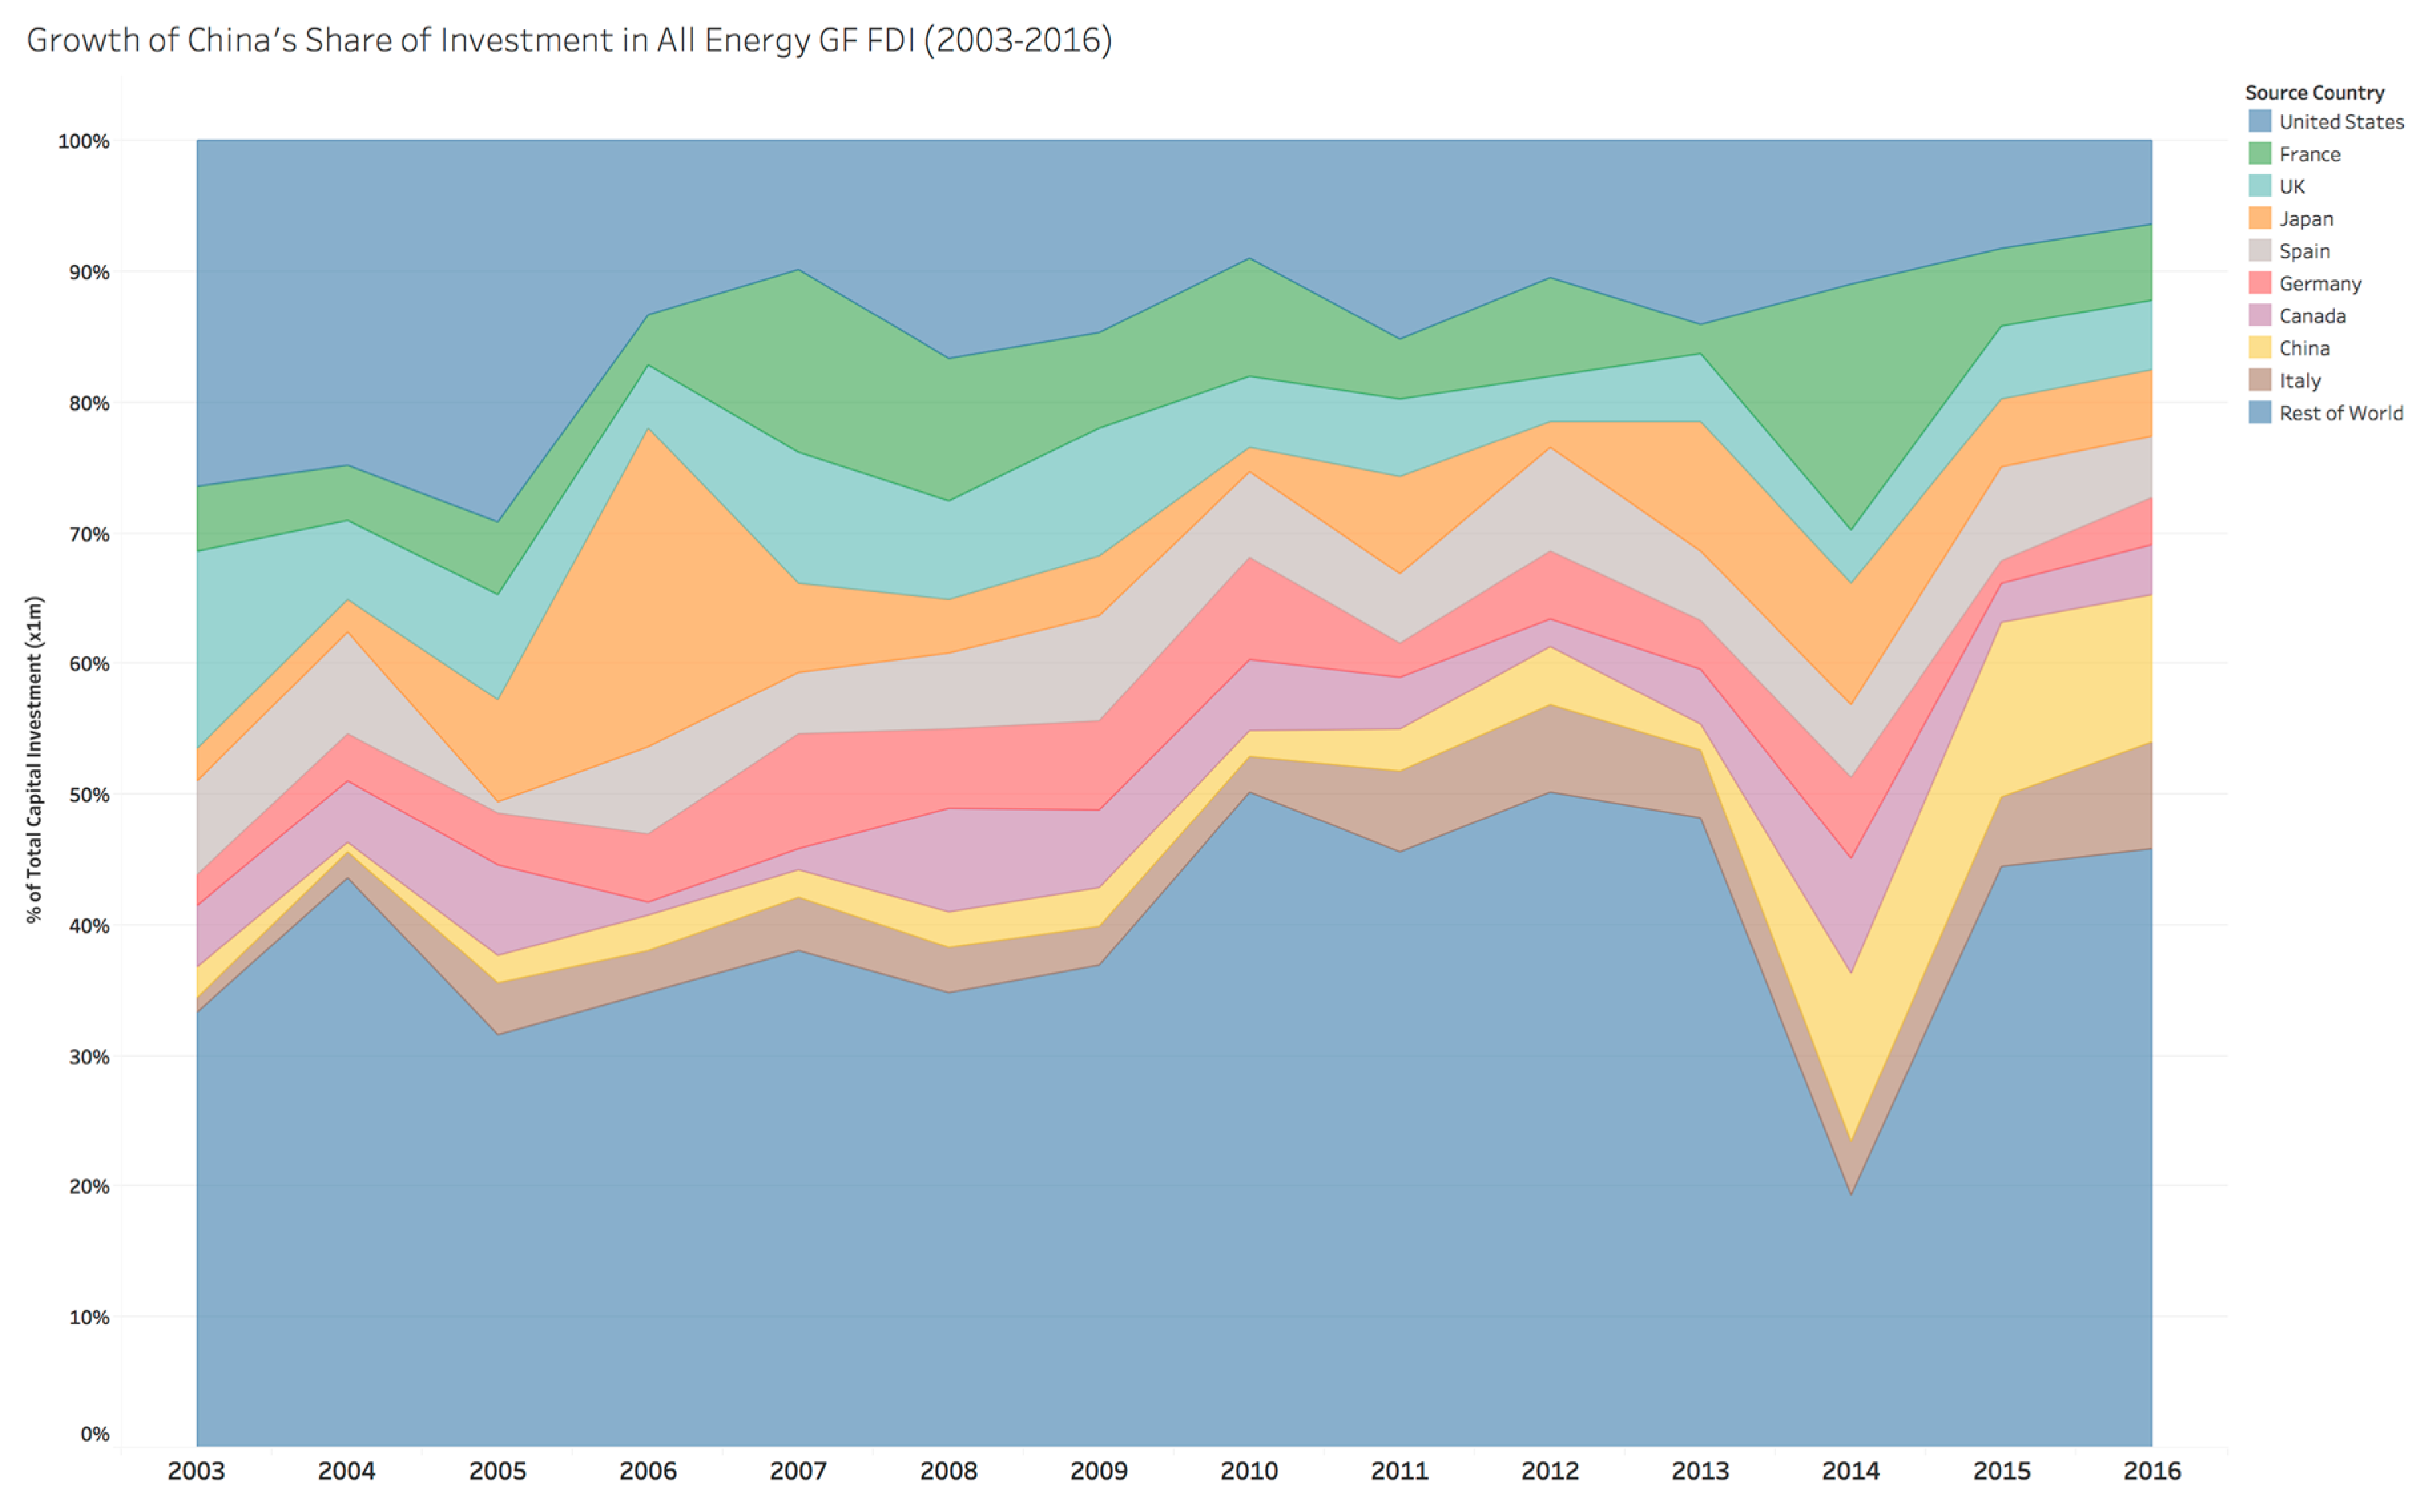
Since the turn of the century, China has emerged as a significant player in both the GF and M&A markets overseas. As shown in
Figure 12, in 2003, China’s overseas assets were just 2.3% (compared with the US at 26%), whereas their investment in 2016 is upwards of 11.3%, growing by 391% over this period while the US decreased its share by 76% during the same period. The UK also shows a decrease. China’s share of M&A activities in the global energy sector has grown from 0% to 9% from 1996 to 2016. The US during the same period showed a 76.53% decrease in its M&A in the energy sector. That said, Chinese entities are still only 5% of all overseas investment over the period, and the Chinese investment is more concentrated in GF FDI rather than M&A.
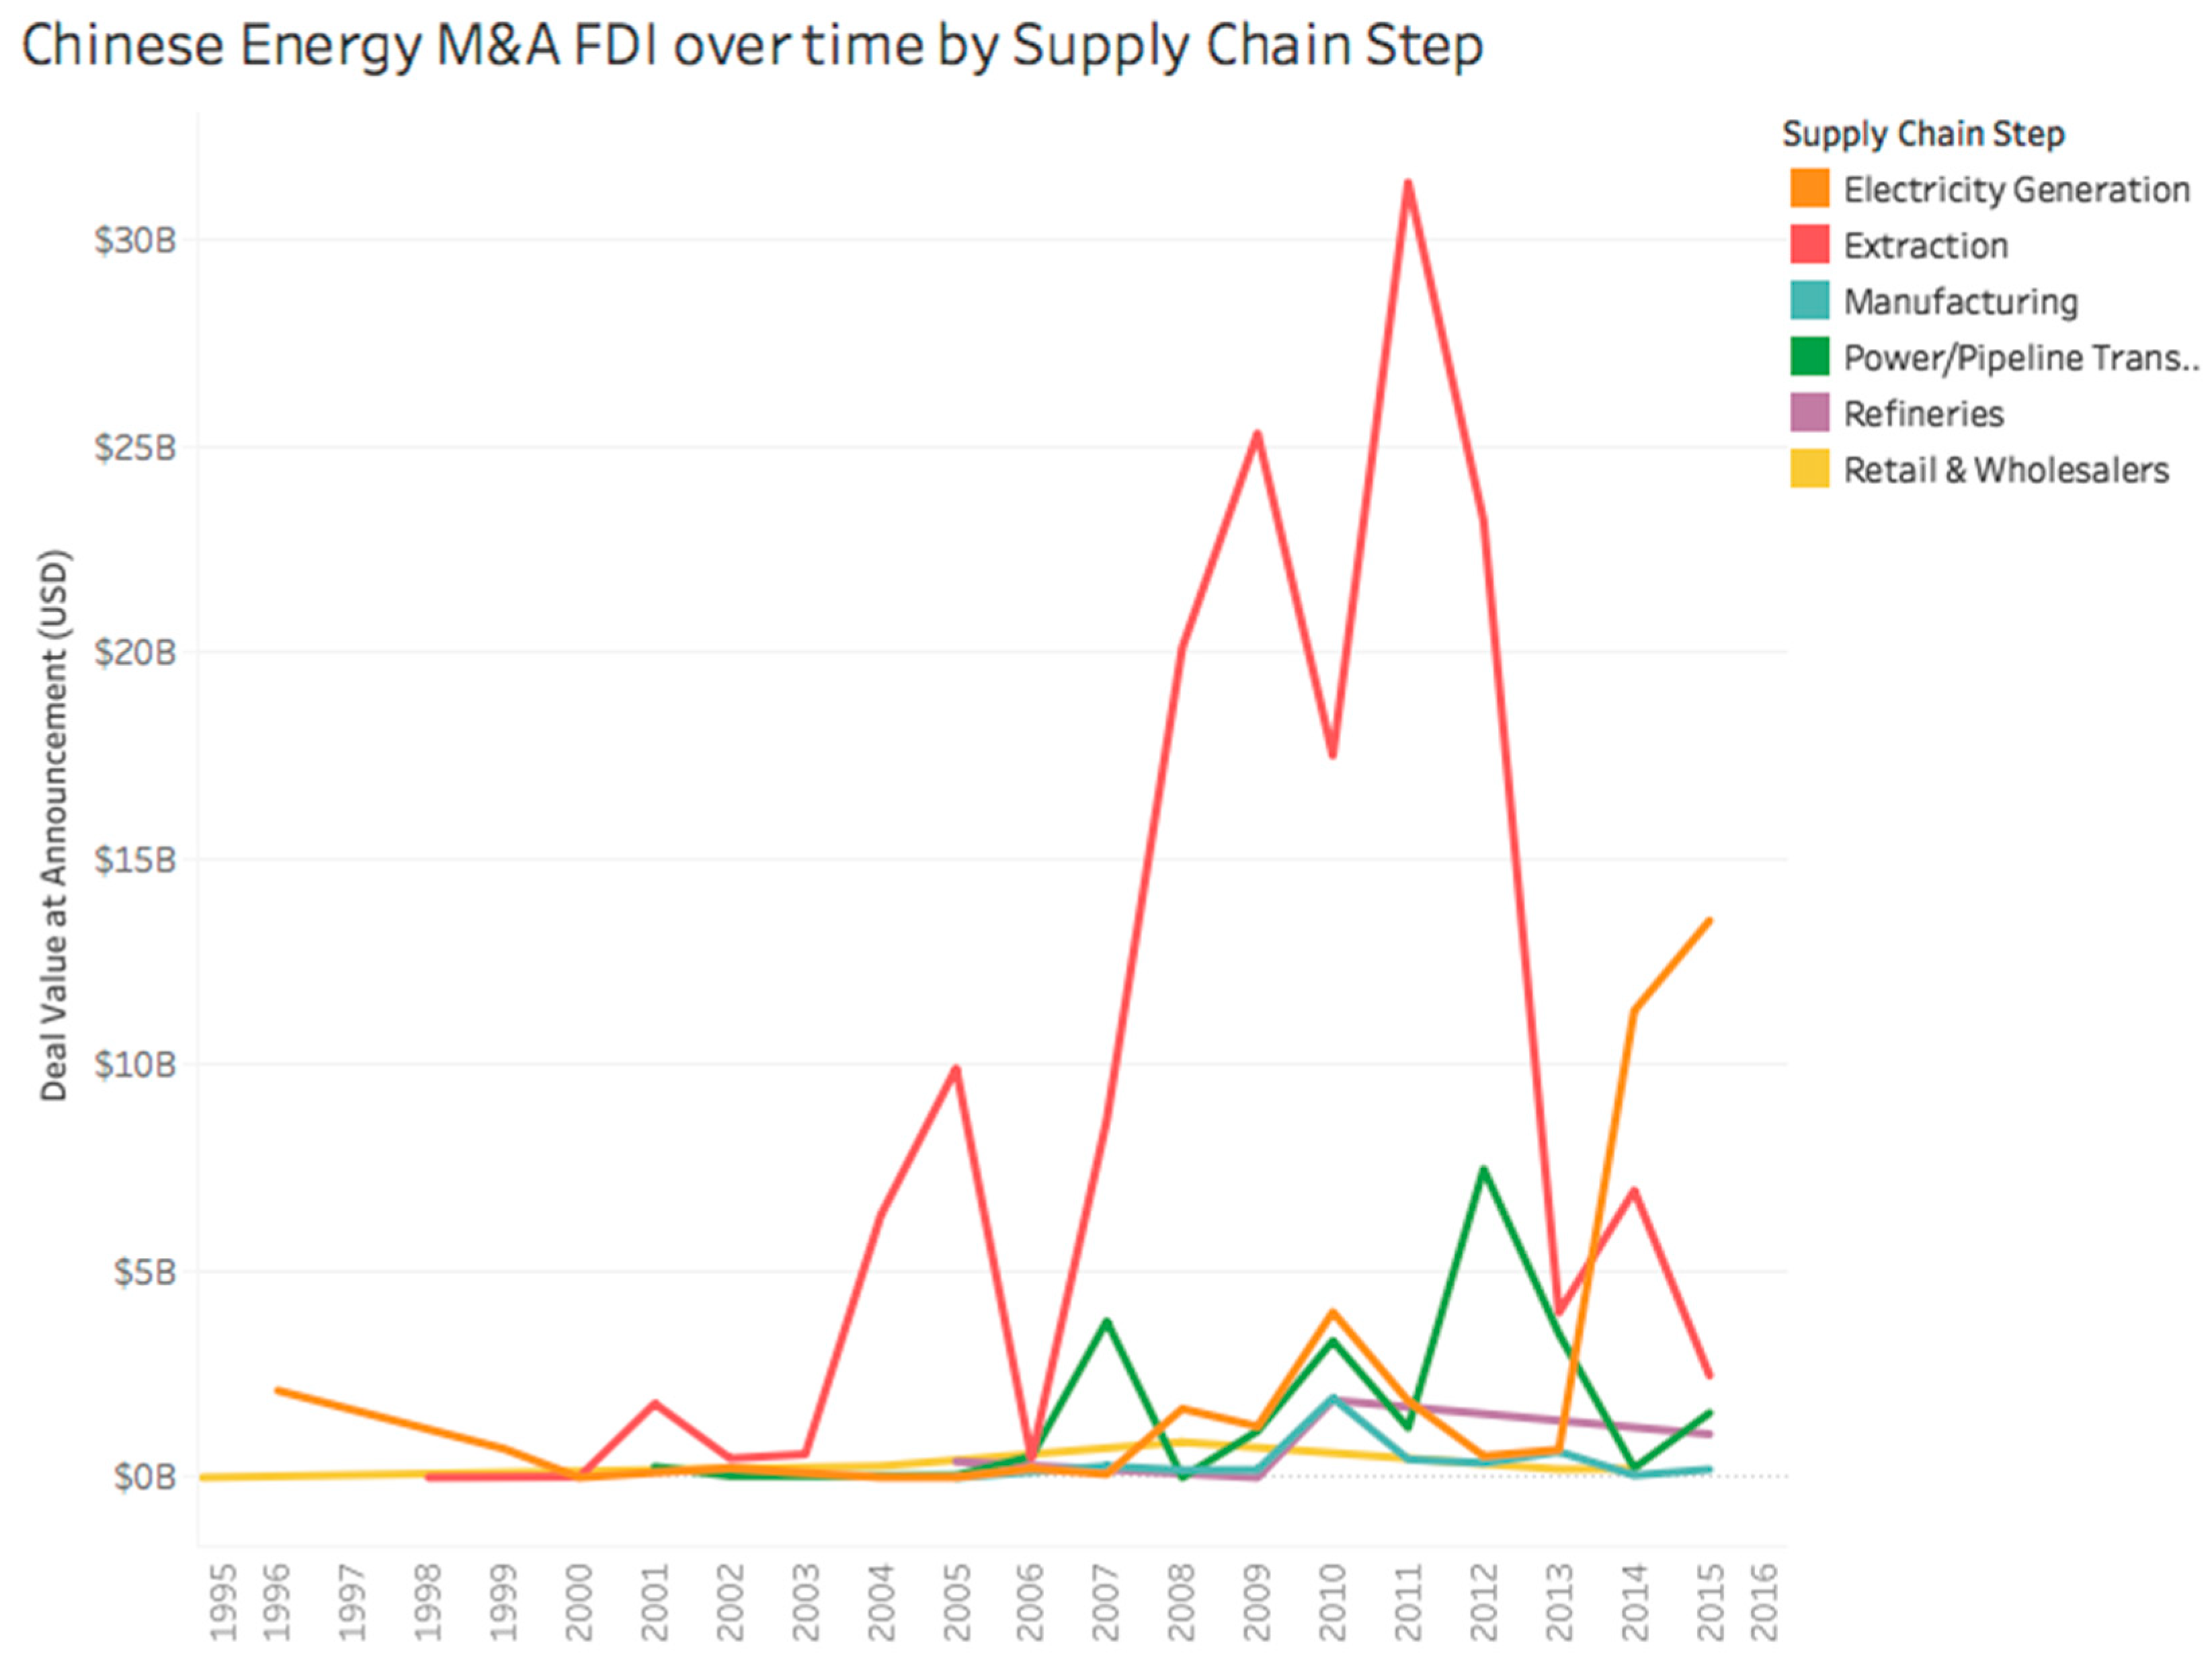
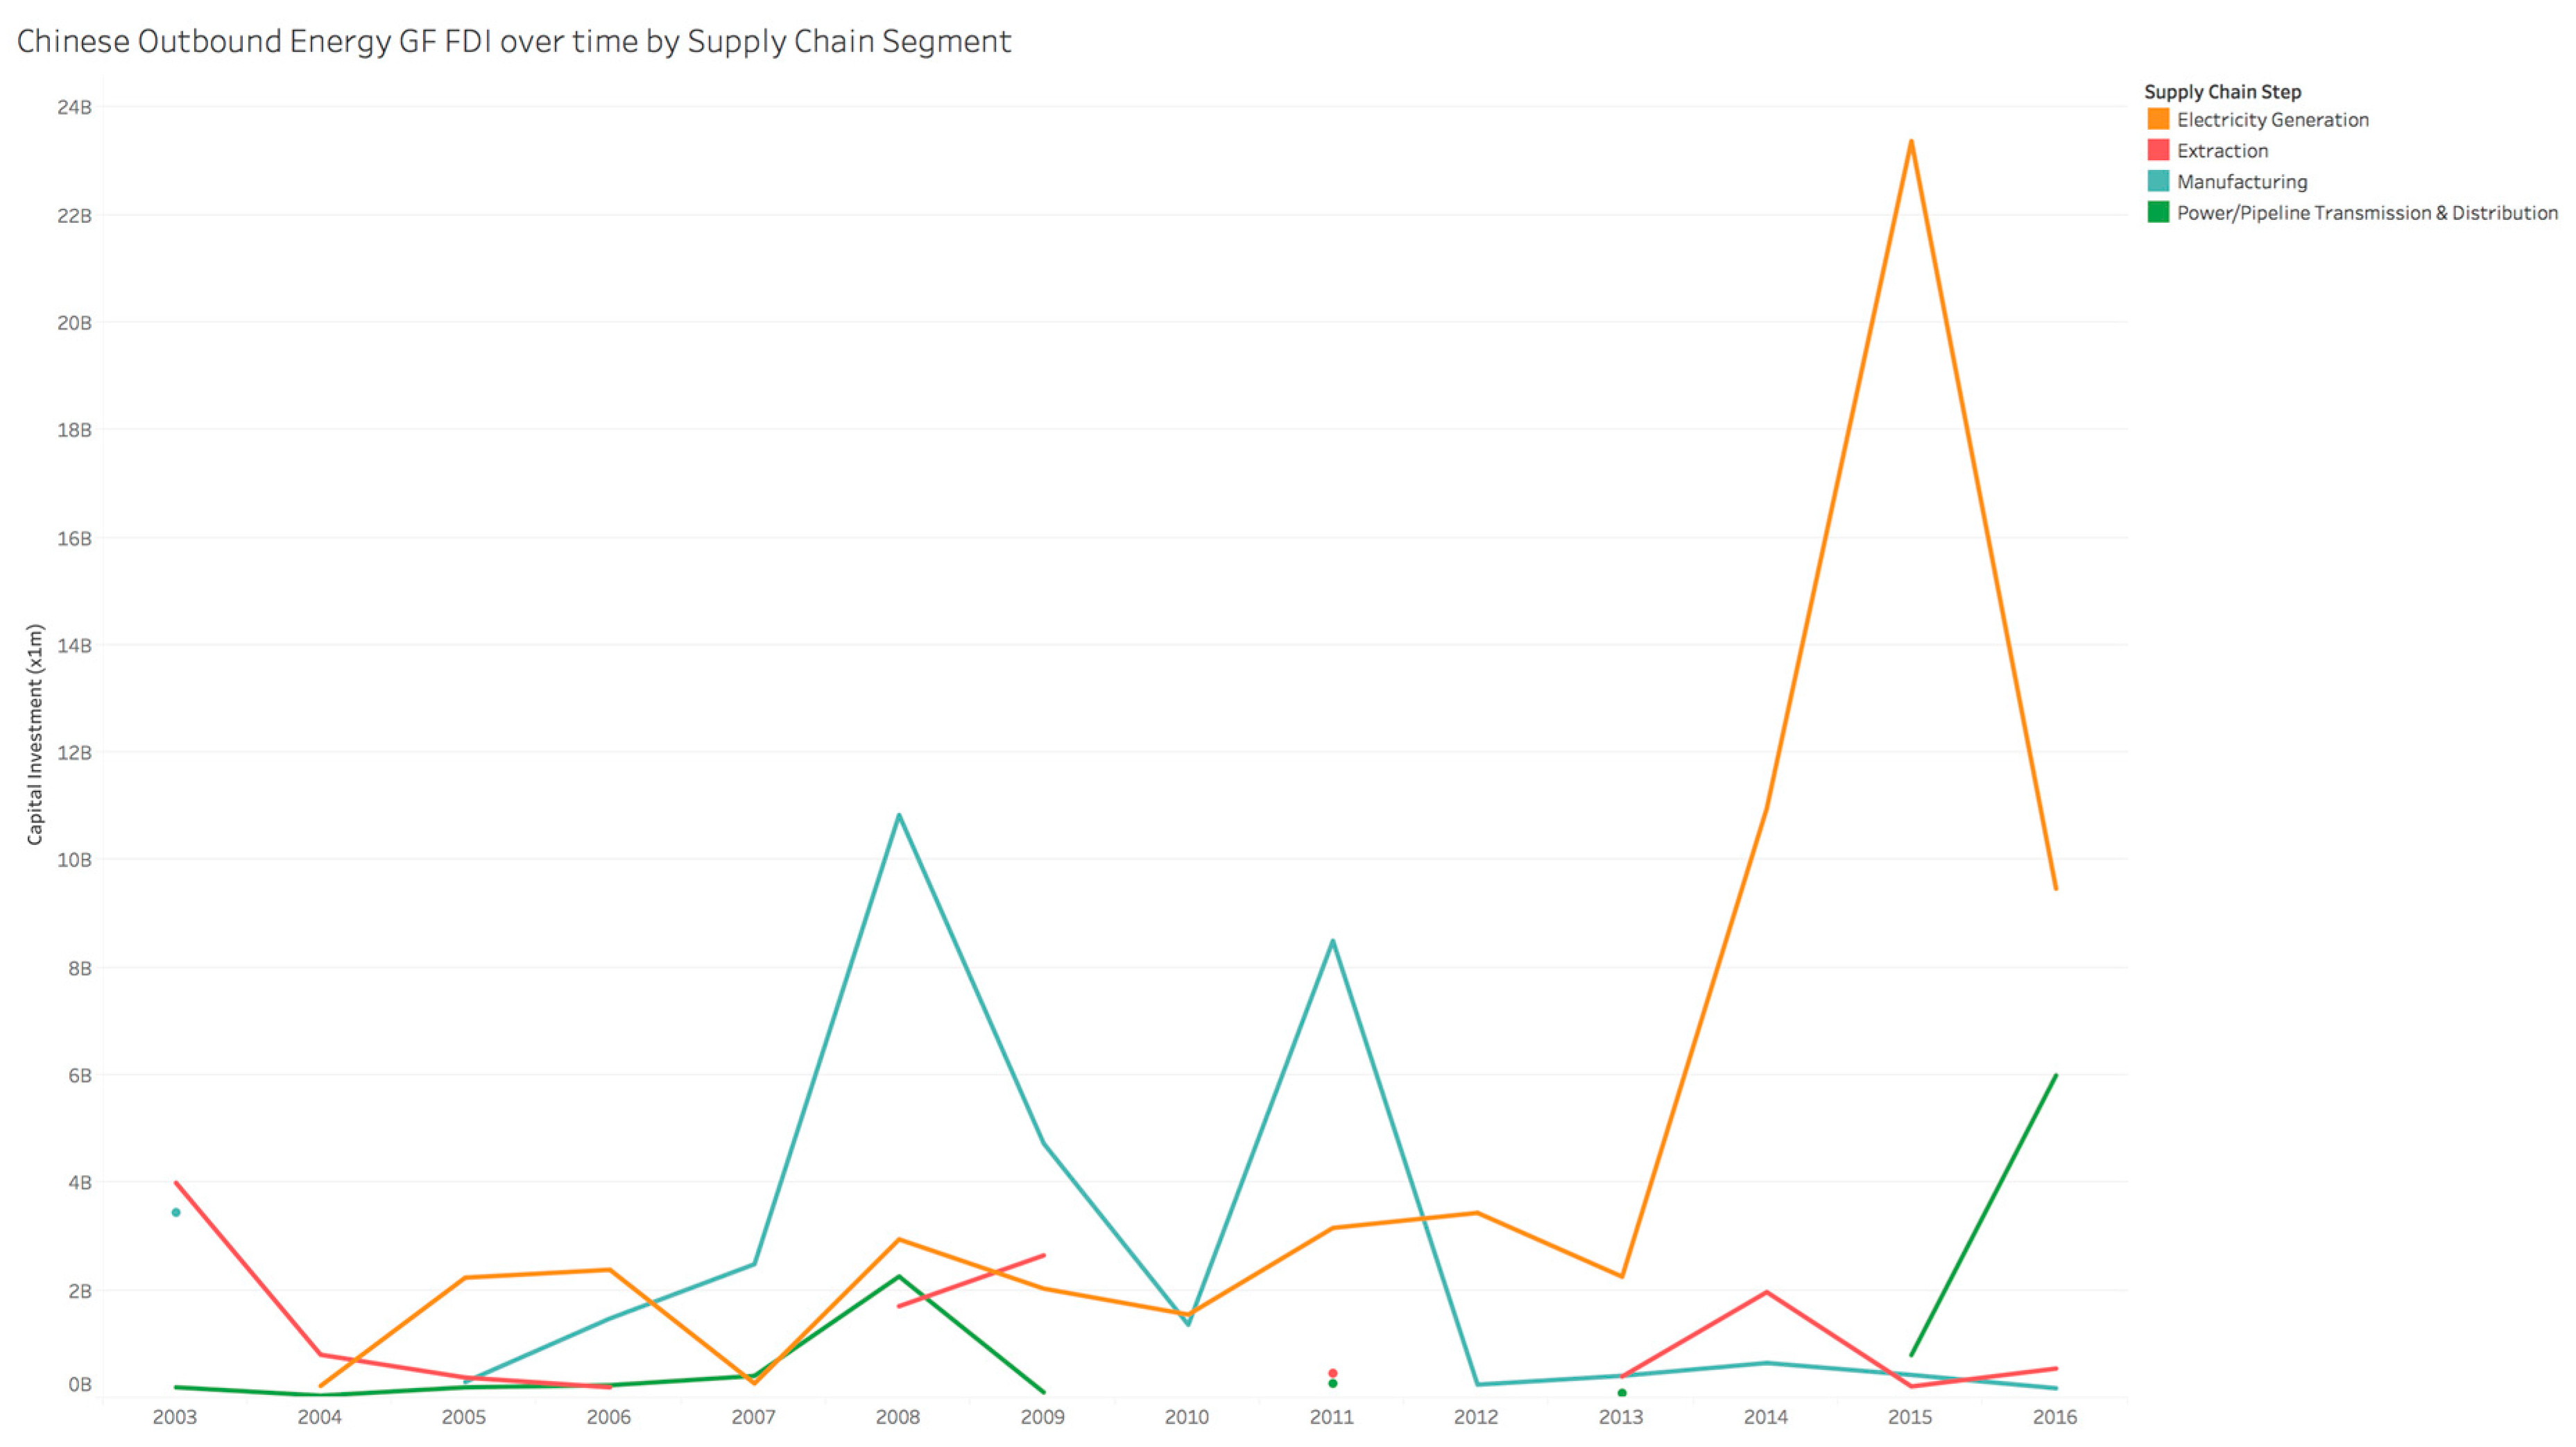
Figure 13 shows the growth of China’s outbound energy M&A investment by segments in the supply chain over this period. We find that the bulk of Chinese M&A investment is in extraction, electricity generation, and power/pipeline transmission mainly focused in Africa and South Asia. Note that the focus of this investment has shifted from extraction to electricity generation since 2014. Chinese GF FDI, shown in
Figure 14, is mainly focused on electricity generation and power/pipeline transmission. Manufacturing was dominant until 2012 in GF but was overtaken by electricity generation from 2015. Chinese M&A investment activities peaked in 2012 while FDI GF in 2016 had diminished.
3.4.1. China’s Greenfield Projects
Resource extraction is a very important sub-sector for Chinese energy investment, particularly in Africa. As early as 2003, China Petroleum and Chemical (Sinopec) invested $1.8 B in oil and gas fields, representing the most significant example of Chinese investment in the African energy sector. In the electricity generation sector, Zonergy invested $1.5 B in Pakistan for 1000 MW solar projects in 2015, which is now the most massive Greenfield project in an overseas market that China has ever invested in; 300 MW from the project has come online in 2017, and the rest is expected to be online in late 2018. For transmission and distribution, China National Petroleum recently initiated a $4 B investment in Mozambique to collectively build a gas pipeline with local oil and gas companies. The total length of the pipeline will be 1600 miles and construction is expected to start in 2018. In Southeast Asia, many Chinese solar manufacturers have started to offshore their production capacity. For instance, Comtec Solar System invested $372 M in Malaysia. The manufacturing plant started operation in 2014 with an annual capacity of 300 MW.
3.4.2. China’s M&A Projects
Chinese M&A FDI is more substantial in the amount invested but fewer in number. In the resource extraction sector, the China National Offshore Oil Corporation (CNOOC) acquired Canadian Nexen at the cost of $18.2 B. The deal, completed in 2012, represents the single most considerable Chinese overseas investment in the energy sector. In the transmission and distribution sector, the State Grid Corporation of China acquired a 35% share of a gas distribution network asset in Italy at the cost of $2.8 B in 2014. For electricity generation, China Three Gorges Corporation acquired two hydroelectric plants in Brazil, totaling 4.8 GW of generating capacity, at the cost of $3.7 B in 2015. Chinese investors now collectively own around 10% of the total power-generating assets in Brazil. In the wind manufacturing space, consolidation is a very recent trend, but Chinese turbine manufacturers are relatively less involved. The most substantial M&A deal Chinese firms have ever made is the acquisition of 70% of Vensys Energy in 2008 by Xinjiang Goldwind. The deal cost Goldwind $60 million and facilitates the export of Goldwind’s turbines to the European market.
4. Discussion
In this paper, we investigated M&A and GF FDI in the energy sector, merging two databases to put together a comprehensive analysis of global investment flows. We designed a new methodology to examine the extent to which global investment flows in the energy sector are distributed within different parts of energy value chains and characterize the spatiotemporal patterns of inflows and outflows. We divided the time of observation into pre-, peak-, and post-recession periods. We examined the level of M&A and GF investments by countries and continents in the period 2003–2016 and highlighted investment patterns in the three phases of recession. The share of energy M&As as a share of the total global M&As in the three phases of recession is around 5% while the share of energy GF as a share of total GF is around 25–26% during pre-recession and recession. While energy accounts for nearly 25% of all FDI, it only accounts for 4.82% of total M&A activity in the period 1996–2016. Thus, the proportion of global M&A and GF FDI in the energy sector is 5:1 in the period 2003–2016. Both investment types have recovered in the post-recession phase.
We highlighted the spatial pattern of inbound and outbound investments in the energy sector, explicitly comparing and contrasting China with the US. China has invested heavily in the extraction and electricity generation sectors, while the US invests in many segments of the supply chain including pipeline, transmission and distribution, and manufacturing as well as extraction and electricity generation. Outbound M&A and GF FDI in the energy sector are changing. The Northern economies are the traditional hotspots that attracted investment. Northern countries dominate outbound M&As while Northern and Southern countries both receive inbound GF. A small number of countries account for a significant share of the overall activity in all segments of the energy supply chain. The most consistent outbound investments in M&A are North-North countries. However, with the entry of China into the energy space in the recession and post-recession period, North-South outbound investments are emerging. China invests consistently more in the energy sector of European countries through M&A but has a more widespread spatial distribution of GF investments. We estimated the extent to which China is permeating global energy investment markets within different parts of the energy value chain and characterized China’s spatiotemporal patterns of investment.
China’s overseas GF investment grew by 391% between 2003 and 2016 while the US decreased its share by 76% during the same period. Similarly, China’s share of M&A activities in the global energy sector has grown from 0% to 9% in the period from 1996 to 2016. However, Chinese entities amount to only 5% of all overseas investment over the period, and the Chinese investment is more concentrated in GF rather than M&A FDI. In this paper, we also perform a supply chain analysis in the context of Chinese energy investments and find the bulk of Chinese investment is in extraction and electricity generation, primarily focused in Africa and South Asia. Electricity generation and power/pipeline transmission are the primary focus of Chinese GF FDI. Chinese M&A FDI activities peaked in 2012 while GF peaked in 2016 in the energy sector. Our origin and destination analysis reveal differences between China and the US concerning the spatial pattern of their energy investments. While China’s most significant M&A outflow is to Australia, Brazil, and Portugal, its largest recipient in GF is in Asia, Pakistan, and India. The US exhibits a different pattern; its M&A outflow is to countries in Europe and Canada. USA’s greatest GF outflow is into Canada.
Our paper provides a qualitative analysis of energy investments using two databases. Our fundamental contribution is segmenting the energy supply chain to discuss origin-destination flows integrating two databases related to M&A and GF FDI. We specifically characterized China’s investment and differentiated the pattern from that of the US investments. The next step in our research is to use spatial panel models of the data to quantitatively model energy flows and provide the rationale for such investments. Our long-term goal is to set up a framework to study China’s BRI initiative, especially related to energy sector. We want to characterize the flows of investment, as well as social, environmental, and economic impacts in the destination countries.


