Abstract
The expansion of photovoltaic solar energy in the world is significant. However, its contribution to decreases in greenhouse gases (GHG) is not an absolute guarantee. In this context, it is necessary to evaluate its benefits in advance, considering the structure of the electric energy supply matrix of the country producing the photovoltaic solar system, as well as the country where the technology will be implemented. This study evaluates the adoption of renewable sources for electric power generation in a country with a high share of renewable energy. A life-cycle assessment (LCA) of a set of multi-Si photovoltaic (PV) systems installed in the Brazilian northeast (NE), was carried out. The actual generation data of 10 plants totaling 1.1 MWp installed capacity were evaluated during two years of operation. Energy payback time (EPBT), greenhouse gas emission rate (GHGe-rate), and emission payback time were calculated. The great influence of the electric matrix characteristics of the country manufacturing PV systems was evidenced in the results. The interconnected Brazilian electrical system had a 2020 projected GHGe-rate of 63.9 g CO2/kWh, while the results of 70% of the photovoltaic solar power plants (PSPS) assessed herein exhibit higher GHGe-rates. Thus, in countries where the electric matrix comprises a high share of renewable sources, such as Brazil, the incentive to use PV systems manufactured in nations whose electric matrix registers high emission factors should be well evaluated in terms of the impacts of GHG concentrations and the promotion of sustainable development, in order to avoid indirect import of significant amounts of carbon embedded in the systems.
1. Introduction
Humanity, at the very beginning of its existence, continuously faced climatic changes, fundamentally characterized by climate variability in cyclic regimes before the rupture caused by the use of productive technological machinery marked by the industrial revolution. The consolidation of a productive process marked by the use of the steam engine and derived technologies led to intensified production processes, increasing dependence on fossil energy sources, such as petroleum, coal, and natural gas. Since then, global warming increased and intensified [].
Global warming currently represents one of the most complex problems faced by society at the global level, being the main cause and enhancer of several environmental, social, and economic problems. According to the International Panel on Climate Change (IPCC), increases in anthropogenic greenhouse gas (GHG) emissions, according to projected scenarios, are the main cause of the rise in average earth temperature from the middle of the 20th century, and thus, the main variable responsible for the current environmental imbalance [].
From 2000 to 2010, annual anthropogenic GHG emissions grew at a rate of 2.2% per year, leading to a total increase of 10 Gt CO2-eq. This increase was directly driven by energy supply (47%), industry (30%), transport (11%), and buildings (3%). Electricity and heat generation accounted for 25% of total direct emissions in 2010 [].
On a global scale, the main GHGs emitted by human activities in 2014 reached the following participations: fluorinated gases (2%), nitrous oxide (6%), methane (16%), and carbon dioxide (77%). Total carbon dioxide is the sum of forestry and other land use, reaching 11%, while fossil fuel and industrial processes contributed with 65% [].
Since the energy sector accounts for about 68% of global GHG emissions [], the challenge posed by addressing global warming and its resulting problems points to the mitigation of GHG emissions from energy conversion and use, while continuing to meet the new demands for energy associated with nation development. However, when choosing the applied energy resource and technology, it is necessary to promote an analysis that allows for the assessment of all socioeconomic and environmental impacts caused by these factors throughout their life cycle.
Concerning global heating contributions, all electricity generation technologies, at some stage of their process (exploration, transformation, distribution, use, and disposal), are GHG sources, on a greater or lesser scale. In order to compare the impact of different technologies in terms of their contribution to greenhouse gas intensification, total GHG emissions should be accounted for during all stages of the process, i.e. throughout their life cycle [,,,,].
Among the several renewable energy resources that can be competitively applied as an alternative to GHG mitigation, solar energy is abundantly available and well distributed throughout the planet. Two main technologies are used for the exploitation of this resource: (i) Solar thermal systems, and (ii) photovoltaic solar systems (PVSSs). In this sense, this study aimed to evaluate the life cycle of PVSSs.
PVSSs do not generate GHE emissions when in operation. In contrast, their manufacture and the materials used in their installation structures include transformations of certain materials that can account for significant GHG emissions, depending on the structure of the country’s energy matrix [].
Two indicators are most frequently applied to evaluate PVSS environmental performance through a life-cycle analysis (LCA), namely energy payback time (EPBT) and greenhouse gas emission rate (GHGe-rate), usually used in literature to support analyses related to the environmental sustainability of a technology application [].
The present study applies an LCA evaluation to assess PVSS development strategies in Brazil and their effective contribution to GHG emission reduction. The study began by addressing the emissions related to the energy sector, followed by a survey of previous studies that subsidized data on energy consumption in the PVSS productive process. Finally, the results and analyses of the study were presented and evaluated. The LCA study was applied to 10 solar power plants operating in different Rio Grande do Norte Federal Institute of Education, Science and Technology (IFRN) campuses, located in the state of Rio Grande do Norte, in the Brazilian northeast (NE) region, totaling 1.1 MWp of installed capacity. These plants are part of the IFSolar project, which promotes the use of renewable energy in federal public buildings in the education sector, at 2.1 MWp installed capacity at IFRN, and can reach 60 MW in the federal technology education network, through 600 systems installed nationwide. The EPBT, the carbon rate per generated kWh, and the period of carbon return, resulting from PVSS adoption, were calculated.
The contribution of photovoltaic technology to GHG decreases must be well evaluated, since this technology can present different results when installed in countries with a large share of renewables in their electrical matrix compared to implementation in fossil-based countries.
This study contributes to the literature by providing an analysis based on real electricity generation data in photovoltaic plants installed in Brazil, using the LCA methodology in relation to emission balance when adopting policies to expand the use of PV Systems in countries presenting renewable-base electric matrices, and consequently, a low carbon footprint. It is possible to reinforce that, with more reliable information on the impacts associated with the chosen technological routes, it is possible to contribute to the governance of the national electricity system, associated with the transparency of energy planning, as well as contributing to the correct signaling to companies and the society concerning externalities in the chain productive process. This issue is considered vital, since it enables society to be aware of the environmental impacts associated with the product during its life cycle, thus supporting sustainable development. However, this discussion is still incipient and is often undersized by the responsible countryߣs planning authorities.
This approach, therefore, allows us to envisage long-term strategies and assertive policies to achieve targets for the reduction of GHG emissions, both at the study area of this research and in other countries presenting similar electric matrices.
1.1. Energy and GHG Emissions
Several anthropogenic sources are credited as GHG emitters. Two of these are considered the main sources when carrying out an overall assessment, due to the daily amounts released, originating from the production and use of energy (fossil-fuel burning), namely those derived from land use, land-use change, and forests, as well as from agriculture.
Applying the International Energy Agency’s (IEA) Key World Energy Statistics 2017, it is clear that the world’s energy matrix is dominated by fossil fuels. In 2015, fossil fuels accounted for about 81% of the world energy matrix, and, of this total, oil accounted for 31.7%, representing the largest share, followed by coal at 28.1%, and natural gas at 21.6%. Renewable sources participated with 12.2%, and nuclear energy accounted for 4.9% (Figure 1) [].
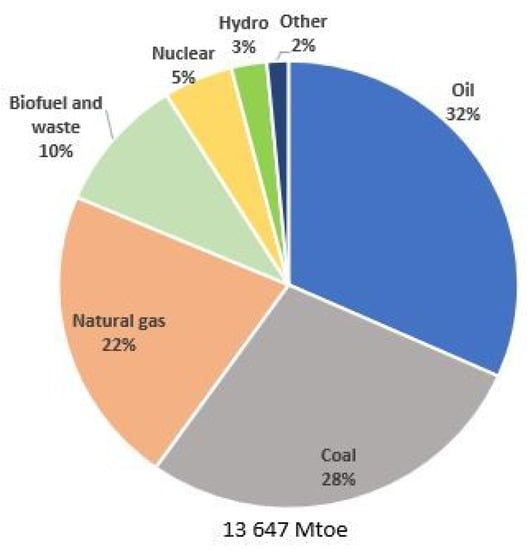
Figure 1.
World energy matrix in 2015.
In terms of electricity supply, in 2015, 68.5% of the world’s electricity generation came from fossil-fuel burning. In that same year, the electricity supply from renewable sources corresponded to about 23% of this total, with hydroelectricity being responsible for the largest amount at 16% (Figure 2) [,].
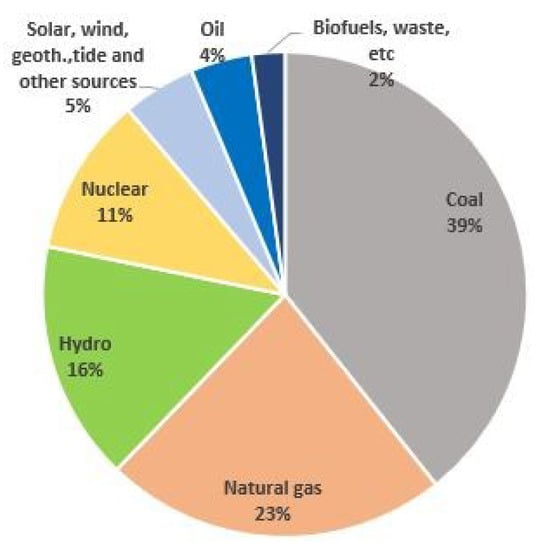
Figure 2.
World electricity matrix in 2015.
GHG emissions from electricity generation depend on the intensity of CO2/MWh linked to the technology and fuel used in the processes. Thus, as countries present different energy resource availabilities, they undergo different technological development processes and make use of different techniques and technologies, leading to considerable variations in carbon intensity variations. From a worldwide perspective, by 2016, the IEA [] presented an emission scenario of certain countries or groups of nations using 2012 data, where the variation of emission factors in each electric sector was recorded. Figure 3 displays a list of countries, economic blocs and continents and their respective emission factors concerning the electricity sector. Brazil presents a significantly lower emission factor when compared to the United States of America (USA), China, and the rest of the world. In China, fossil fuels present a high participation in the electric matrix, representing 72.8% in 2015, of which 70% was coal [].
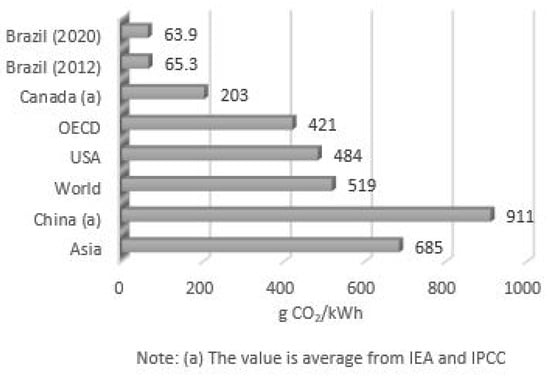
Figure 3.
Electricity emission factor. Data were sourced from References [,].
Until 2008, the largest share of estimated net CO2-eq emissions in Brazil was credited with changing land use, more specifically, forest degradation for agricultural use. However, from 2000 to 2010, with the significant reduction of emissions registered in this sector, an increase in the relative participation of the energy sector in total CO2-eq emissions was observed [].
According to Brazil’s Ministry of Science, Technology, Innovation, and Communication, (MCTIC), emissions from the energy sector increased from 187,739 Gg CO2-eq, in 1990 to 328,377 Gg CO2-eq, in 2005, representing a 44.3% increase. From 2005 to 2012, a 35.9% increase was observed, reaching 446.154 Gg CO2-eq. In the forest sector, the opposite was observed, with a 39.2% decrease between 1995 and 2005, and another, more significant reduction, of 85.1% from 2005 to 2012 [].
This new relative participation of each sector in total GHG emissions in Brazil is displayed in Figure 4, where the percentage participation of each sector in the total GHG emissions for 2005 and 2012 is presented. Total emissions decreased from 2,042,998 CO2-eq in 2005 to 1,203,424 Gg CO2-eq in 2012, a 41.10% reduction [].

Figure 4.
Comparison of the representativeness of greenhouse gas (GHG) emissions (CO2-eq) by sector in Brazil from 2005–2012. Data were sourced from Reference [].
Despite the growth of fossil fuels in the past few years, the Brazilian electricity matrix also presents a predominant participation of renewable energies, at 81.7% of the domestic supply of electricity in 2016, with wind power contributing with 4.9%, biomass with 5.7%, and hydrogeneration representing 68.1%. This significant presence of renewable sources in the Brazilian electricity matrix ensures a privileged rank among developed nations when it comes to GHG emissions from the energy sector. However, an increase in the share of non-renewable sources in electricity generation was also observed, increasing from 12.9% in 2011 to 18.3% of the total generated in 2016 [].
The characteristics of the Brazilian electrical matrix, comprising a significant share of renewable sources, should be expanded, according to the Brazilian Energy Research Company (Empresa de Pesquisa Energética, EPE) [], in its Decennial Energy Expansion Plan, from 2016 to 2026 (PDE 2026). Figure 5 compares the sources’ holdings in the installed capacity for electricity generation for 2016 and 2026.
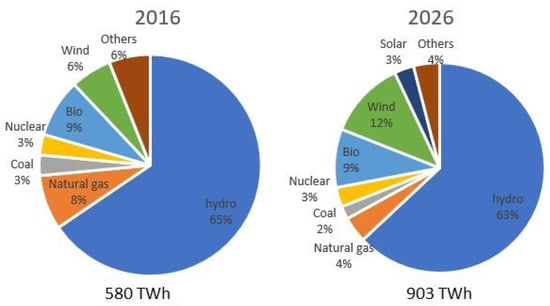
Figure 5.
Evolution of the Brazilian electrical matrix installed capacity by generation source. Data were sourced from Reference [].
According to the studies regarding the expansion of the EPE-developed systems, the PDE2026 [] and the PNE2050 [], projections indicate that the proportion of renewable sources in the electricity matrix will be maintained in the coming decades. The projection of the emission factor of the national interconnected system (SIN) for 2020 reaches 63.9 g CO2-eq/kWh, slightly lower than that of 2012 at 65.3 g CO2-eq/kWh (Figure 6) [].
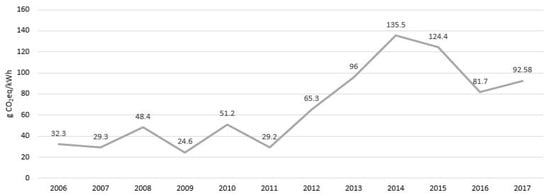
Figure 6.
Evolution of Brazilian electricity emission factors in g CO2/kWh (2006–2017). Data were sourced from Reference [].
In 2013, Dale et al. combined electricity generation LCA data with scenarios developed using the Model for Energy Supply Strategy Alternatives and their General Environmental Impact from the International Atomic Energy Agency (IAEA’s MESSAGE) to analyze the environmental impacts of future generation of electric energy in Brazil. The results of the cost-optimal baseline scenario of this study projected a SIN emission factor (CO2/MWh) for 2040 at 100% increase compared to 2010 []. Another study in 2018, developed by Barros et al., points to the reduction of carbon footprint in the generation of electric energy in the projection for 2026, the reference year of official studies carried out by the EPE []. In the present study, the data projected by official Brazilian government studies were used.
In 2014, compared to the previous year, GHG emissions in Brazil decreased 2.9% in both the SIN and in isolated systems, where emissions registered a 42% reduction. In 2015, GHG emissions from electricity generation fell by 4.7% compared to 2014 levels [].
Currently, several programs and initiatives are available in the country encouraging the use of renewable energy and conservation or energy efficiency in the pursuit of sustainable development. The main plan for the Brazilian energy sector is the 10-year energy plan (Plano Decenal de Energia, PDE), which seeks to incorporate actions that comply with the national policy on climate change, mitigating GHG emissions and seeking low carbon emissions in power generation. These initiatives study and encourage the expansion of hydroelectric and other renewable sources, such as wind-power plants, small hydropower plants, bioelectricity, and solar energy, as well as increased energy efficiency [].
These actions are in line with the Nationally Determined Contribution (NDCs) presented by Brazil under the Paris agreement, with the goal of reducing GHG emissions by 37% in 2025, and by 43% in 2030 compared to 2005, using the GWP-100 metric (IPCC AR5). In order to meet the growing demand for electricity with decreasing emissions in the sector, one goal is to expand the share of renewable energy (in addition to hydropower) to at least 23% by 2030 [].
1.2. Renewable Sources and Public Policy to Encourage Distributed Generation
The adoption of incentives to use the New and Renewable Sources for Electric Power Generation (E-FER) is one of the main actions of nations to promote the use of these sources in the world. This occurred initially in the 1970s when, due to the oil shock, some countries began expanding their investment in research and development (R&D) concerning renewable energy sources. Subsequently, in the 1990s, a greater engagement of some countries in the debate on the environmental issue was observed, encouraging the commercial introduction of these sources in the market. Several legal and fiscal initiatives boosted the use of these sources, both by reducing GHG emissions and searching for energy supply security [].
In Brazil, some programs to encourage E-FER use were created. In 2002, the Incentive Program for Alternative Energy Sources (Fontes Alternativas de Energia Elétrica, PROINFA) was launched, which sought to diversify the Brazilian energy matrix and increase domestic supply security, with the specific objective of increasing the share of electric energy from wind, biomass, and small hydroelectric power plants (SHP) in the national interconnected system (Sistema Interligado Nacional, SIN) []. PROINFA was an important initiative to foster E-FER in power generation, paving the way for specific auctions []. In 2004, auctions were implemented in the reformulation of the commercialization model of electric energy in the Brazilian electric sector [,]. (Auctions in Brazil were a successful instrument created under the regulatory framework of the new national electric sector, defined by Law 10.848/2004, which determined the guidelines for the expansion of the SIN and for the commercialization of electric energy for consumers in this regulated environment [].)
In this context, Normative Resolutions (RN) No. 482/2012 [] and RN No. 687/2015 [] are noteworthy, published by the National Electric Energy Agency (ANEEL), which regulates electricity microgeneration and minigeration. (Microgeneration refers to a generating plant connected to the distribution network, whose installed power is up to 75 kW, and which uses qualified cogeneration or renewable sources. On the other hand, minigeneration refers to power plants installed from 75 kW to less than or equal to 3 MW for water sources, or less than 5 MW for qualified cogeneration, as regulated by ANEEL, or for other renewable sources, connected to the distribution network by consumer unit facilities []).
Driven by this resolution, the number of micro- and minigenerator connections in Brazil grew approximately 31-fold between 2014 and 2016, increasing from 284 to 8842 connections. According to ANEEL, this confirms the beginning of a progressive diffusion process of distributed micro- and minigenerators, intensifying from 2016 []. Projections for 2026 cite 770,000 connections [].
1.3. Solar Energy in Distributed Generation
Among E-FERs, direct solar radiation is considered in several regions around the globe as one of the best energy source prospects. Active and passive designs are the best ways to convert solar radiation into electricity [].
Passive designs use solar radiation to reduce the need for artificial light, or heating in case of colder regions [,]. Active projects, on the other hand, use solar panels to convert solar radiation into water heating or photovoltaic cells to convert solar radiation into electricity. Regarding photovoltaic system costs, values for isolated network systems in 2004 were shown to be anti-economic and non-competitive when compared to other sources []. Solar photovoltaic energy costs between 2010 and 2015 decreased by about 75%, according to the International Renewable Energy Agency (IRENA) []. Studies carried out by EPE [], corroborated by other experts in the field [,], point out that photovoltaic solar energy will reach tariff parity in Brazil between the beginning and the end of the 2020s.
According to Kenisarin and Mahkamov [], the large-scale use of photovoltaic solar energy will only be possible if efficient storage technologies can be developed with acceptable capital and competitive costs. The possibility that grid-connected systems can use the network as substitutes for batteries, from the compensation of generated energy, is an incentive for the implementation of new distributed generation (DG) facilities.
PVSS can be designed with mono/multi crystalline-silicon modules, through the use of thin photovoltaic cell films, or other superior technology presenting higher efficiency []. Two major technology categories are defined from the type of semiconductor applied in the system: crystalline silicon in the form of tablets, or thin films of other materials. Module efficiency depends on the applied technologies and the various materials used in photovoltaic cell manufacture. The commercially available mono-crystalline silicon (Mono-Si) modules are 14% efficient, while multi-crystalline silicon modules (Multi-Si) are 13% efficient [].
To carry out the life-cycle assessment (LCA) proposed herein, it was first necessary to identify the solar irradiation conditions at the PVSS installation sites, obtain access to the technical specifications of the installed systems, evaluate plant projects regarding type of installation (rooftop or ground-mounted), identify the orientation and slope of the installed panels, and collect data concerning electric energy generation for each plant for a long period of time.
2. Life-Cycle Assessment of Photovoltaic Solar Power Plants (PSPP)
The life cycle of a product or process is defined from its first interactions with the environment, such as where raw materials are obtained from, as well as their basic processing until final product disposal []. An LCA contemplates the environmental impact arising from all the entrances and exits of a product or process, from cradle to grave [,].
2.1. LCA Methodology
Life-cycle studies are generally carried out to evaluate PVSS environmental performance. Two indicators are widely used: energy payback time (EPBT) and greenhouse gas Emission rate (GHGe-rate). These studies generally comprise four stages: goal definition and scope, inventory analysis, impact assessment, and interpretation []. This methodology considers the energy embedded in the photovoltaic modules and the energy concentrated in the balance of system (BOS) components.
The equation used to calculate the EPBT of a given photovoltaic system is [,]
where CED is the cumulative energy demand, equal the sum of primary energy entering the life cycle (Einput; MJp) and the energy required by the balance of system (EBOS; MJp), Eagen is the annual electricity generation by the PVSS (MJ), and ng is the average conversion rate of primary energy into grid electricity in the country where the panel is installed.
Einput includes the energy required for module manufacturing, transportation, installation, operation, and maintenance, and its final decommissioning or recycling. EBOS is the energy required for BOS components, including support structure, cabling, electronic and electrical components, inverters, and batteries for standard isolated systems.
The GHG emission rate is given by the following Equation []:
where GHGe-rate is the GHG emission rate per unit of electricity generated by the PVSS (g CO2-eq/kWh), GHGe-total comprises the total GHG emissions during the life cycle (g CO2-eq), and ELCA-output is the total electricity generated by the PVSS during the life cycle (kWh).
Several factors interfere with life-cycle analyses, such as module type, efficiency, fabrication technology, installation location (facade, roof, or floor), mounting pattern, matrix support structure, frame (with or without), type of connection (grid or isolated), and performance rate, including all losses [,]. For a complete analysis of the amount and quality of the generated energy, possible environmental impacts, and contributions to GHG emissions caused by the PVSS, it is necessary that all these configuration possibilities be known and analyzed. The greater accuracy of the LCA results depends significantly on the precise information of the energy consumption data.
2.2. System Boundaries
This study was carried out with the actual generation data of ten photovoltaic solar power plants (PSPPs), in operation for over one year, totaling 1.10 MWp of installed power. These plants are part of a complex of 21 PSPPs installed in NE Brazil, totaling 2.1 MWp.
The following assumptions were made in this study:
- The energy data embedded in the production of the PVSS and BOS were obtained using the average values available in the literature.
- Real energy generation data of the PSPP in operation for over one year were used.
- All stages of the PVSS production process were carried out in the country where the manufacturing plants are located, in this case, China.
The boundaries of the studied system were as follows:
- The combination of photovoltaic module manufacturing, BOS material, and photovoltaic energy production were considered for the system.
- Direct emissions from the manufacturing process of the PV modules and the emissions originated in the energy generation process required for the manufacturing were accounted for.
- Data regarding transport and the recycling process were considered, but the results of these two items were presented separately from the others.
2.3. PVSS Material and Energy Inventory
Over time, several studies were developed to evaluate PVSS manufacture energy consumption and GHG emissions. Between 1995 and 2015, the following studies were carried out in this regard: Phylipsen and Alsema [], Alsema et al. [], Battisti and Corrado [], Pacca et al. [], Alsema and Wild-Scholten [], Wild-Scholten [] and Yue et al. []. A summary of the total energy values involved in the manufacturing process of PV systems developed in the last decade is presented in Table 1.

Table 1.
Energy requirement for manufacturing of multi-crystalline silicon module (Multi-Si) photovoltaic (PV) plants.
The means of the values obtained in the literature from 2005 to 2014 were used in this study. The sources of the values used to calculate the means were 3940 [], 4322 [], 3120 [], 2699 [], and 3010 []. These values tend to reflect the technological evolution of the panel manufacturing process, which would result in values closer to the energy demanded by the PVSS. The primary energy required for the manufacture of PV systems is 3418.20 MJp/m2, which, taking into account the average electrical efficiency of the grid of the surveyed countries, resulted in an estimated electricity consumption of 310.17 kWh/m2. This value is close to the results reported by Marimuthu and Kirubakaran [] carried out in a solar power plant in India, with a value of 277.11kWh/m2, disregarding transport, material mining for Si, and the recycling process.
In addition to the energy embedded in the PV modules, the energy concentrated in BOS components, must also be considered. BOS includes inverters, controllers, junction box, and cabling and support structures, among others. Different studies carried out regarding BOS energy in different installation situations include Alsema et al. [], Frankl et al. [], Pacca and Silvaraman [], Alsema and Wild-Scholten [,], and Alsema and Nieuwlaar []. Table 2 presents the required energy for the various BOS items published in several previous studies.
Table 2.
Energy requirement of balance of system (BOS) components.
In order to convert the primary thermal energy data required for panel fabrication and installation, one must apply the electricity generation efficiency index. In the USA, efficiency was determined as 0.29 [] and 0.33 [] according to the characteristics of the fuels used in the plants. Alsema and Wild-Scholten [] obtained a result of 0.31 for the global conversion coefficient of the electric grid in the western European continent, while Raugei et al. [] estimated this at 0.32. The panels evaluated in the present study were produced in China. Thus, the electricity generation efficiency indexes applied herein were 0.22 for China [], 0.625 for Brazil [], and 0.33 as the average primary energy consumption data applied for other countries.
For the calculation of the emissions related to PV system transportation, data concerning the plants, the distances between the plant and the installation site, and the means of transport used with their respective CO2 emission rates were used. Regarding the PV system recycling process, literature data were used [] as well as the projects of the mills. However, we decided to present the transport and recycling process results separately from the other items due to the low representativeness in this LCA study of the emissions generated during the transport and recycling process in relation to total emissions (0.81% and 0.72%, respectively) and to facilitate the comparison of the results of this study with others available in the literature, covering both studies that include and those that do not include these two items. Thus, the conclusions of this study are solid and may be used in other countries presenting a high share of renewable energy sources, reducing possible distortions due to different geographical locations.
2.4. Carbon Inventory
Photovoltaic modules do not record GHG emissions during their operation. On the other hand, when considering PVSS life cycles, GHG emissions are predominantly identified in the manufacturing process of PVSS component parts. These are classified as direct emissions originating from the component manufacturing process or indirect emissions from the consumed energy associated to the PVSS production country’s electricity generation emission factor.
According to Marimuthu and Kirubakaran [], CO2 emissions during the photovoltaic panel manufacturing process are 57.19 kg CO2/m2. About 87% of these emissions originate from the aluminum production. In this study, 1.25 m2 modules were used and the Si mining process was disregarded. Array support and cabling emissions were estimated at 6.1 kg CO2-eq/m2 and inverter emissions were estimated at 125 kg CO2-eq/kWp.
Leccisi, in 2016, reported 1300 kg CO2/kWp for systems manufactured in Multi-Si in China []. In 2017, Kommalapati carried out an extensive literature review using LCA to evaluate GHGe-rates, and compared different PV systems and solar concentrators used in electric power generation. After a statistical analysis of a sample with 35 studies for Multi-Si PV, Kommalapati found a mean value of 73.68 g CO2/kWh h []. It is important to emphasize that most studies of this sample theoretically calculated the energy generation results.
Several factors may interfere with electricity consumption and GHG emissions estimates, with uncertainty regarding the available data, in addition to different assumptions applied in different studies, leading to variations in the results. Information on energy consumption for each manufacturing process stage depends on the manufacturers, while the emission factor information of the country where the system is manufactured depends on the voluntary information of each country [,].
Data from the literature were used for energy consumption, namely from the IPCC, IEA, and MCTIC. Table 3 presents the emission factors for the country where the evaluated panels were manufactured, and, for Brazil, where the panels were installed.
Table 3.
Emission factors of the countries in g CO2/kWh.
2.5. Balance of System (PVSS EPBT and GHG Emission Rate)
The methodology used for PV plant EPBT calculation was based on the following steps:
- Energy values required in PV systems and their installation structures were obtained from literature, given in MJp/m2;
- Each PSPP area was used in order to calculate the total required primary energy (MJp);
- Electricity values generated by each evaluated PV plant, in kWh, were field collected;
- Values were converted from kWh to MJ;
- EPBT was calculated using Equation (1). The efficiency factor of the electric matrix of the country where the PSPP is installed was used, in order to convert the generated electricity values to primary energy.
The following steps were carried out for the PSPP GHGe-rate calculations:
- Values were converted from primary energy to electric energy from the total required primary energy of each PSPP (MJp), expressed as MJ;
- Values were convered from MJ to kWh;
- Electrically generated GHG values embedded in the PV system manufacture and installation were calculated. The emission factor of the electric matrix of the country where the PV system was developed was used, expressed as g CO2-eq/kWh (Table 3);
- Estimated GHG values emitted directly from PVSS material procurement and manufacturing were compiled, expressed as g CO2-eq/m2;
- All direct and indirect GHG emissions (steps 3 and 4) were summed, expressed as g CO2-eq;
- GHGe-rates were calculated using Equation (2) and the electricity data generated at each PSPP. The GHGe-rate result was expressed as g CO2-eq/kWh.
Other applied parameters and indicators were calculated for greater accuracy, as explained below:
- A degradation of 0.5% per year was considered for the projection of the energy generated by the PSPP, in the years following the actual collected data [].
- The total emissions avoided during the plant lifespans were obtained by multiplying the value of the electricity generated per year (given in MWh) by the emission factor of the projected SIN (given in t CO2/MWh). We considered that the SIN emission factor after 2020 would remain stable at the official value projected for this year by the Brazilian government.
- The emissions generated by the PV systems were obtained by multiplying the electricity consumption built into the panels by the emission factor of the country where the panels were manufactured, adding direct CO2-eq/m2 emissions to this value.
- The return time of the emissions generated in the manufacturing of the systems was calculated using Equation (3).
3. Case Study: Solar Power Plant Generation in NE Brazil
Brazilian Solar Potential
Brazil, a country located mostly in the inter-tropical region, exhibits great potential for high solar energy production all year round, and areas located in NE Brazil display mean annual solar radiation values comparable to the best regions of the world in this regard [,] (Figure 7).
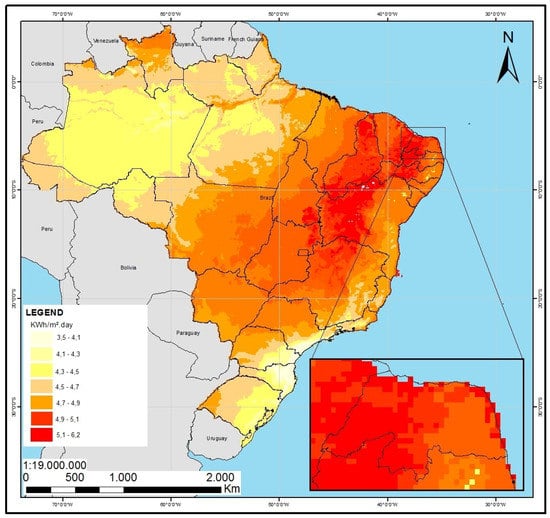
Figure 7.
Annual average daily horizontal radiation. The Datum Sirgas 2000 coordinate system was used; the data were sourced from References [,].
In a comparative analysis with other countries, Brazil presents one of the highest global solar radiation indices. Table 4 presents data from Brazil, France, Germany, and Spain []. The Brazilian NE region exhibits the best solar potential when focusing on the irradiation data for each Brazilian geographic region (Table 5) [].
Table 4.
Daily solar irradiance and area by country.
Table 5.
Monthly average of daily totals (Wh/m2) of horizontal global irradiation observed in Brazil. N, E, S, and W—north, east, south, and west.
In 2013, the Brazilian government provided funds for the financing of sustainable projects to be implemented in federal education institutions, with the purpose of encouraging the use of renewable energies. The Federal Institute of Education, Science and Technology of Rio Grande do Norte (IFRN) approved funding for the installation of 21 photovoltaic solar power plants, totaling 2.1 MWp of installed capacity, representing the largest photovoltaic generation project in a public Brazilian institution. By the end of 2017, 19 of these plants were already in operation, with an installed capacity of 1.87 MWp, and another two are currently undergoing the contracting process. The data from 10 plants in operation with an operating period of more than one year were evaluated herein.
Figure 8 displays the geographical location of the PSPP set installed in several cities in the state of Rio Grande do Norte (RN), NE Brazil, with the 10 PSPP comprising this study presented in the zoomed-in area. RN comprises an area of 52,811 km2, equivalent to countries such as Denmark and Bosnia.
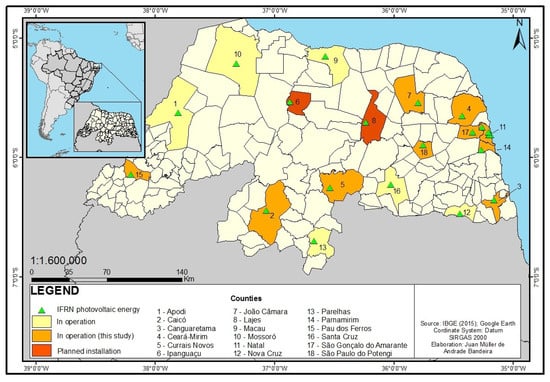
Figure 8.
Map exhibiting the geographic distribution of the evaluated power plants. The Datum Sirgas 2000 coordinate system was used; data were sourced from Reference [].
The PSPP evaluated herein used modules based on Multi-Si. The panels were installed on the ground, on roofs, and on metal structures on the roofs of parking lots. The production process of the panels by Yingli Solar (Supplier 1) and Canadian Solar (Supplier 2) was entirely conducted in China.
Table 6 details the characteristics of the PSPPs.
Table 6.
Technical specifications of the evaluated photovoltaic solar power plants (PSPP).
4. Results and Discussion
4.1. PSPP EPBT
In this study, the average annual energy generated by the 10 analyzed plants, considering the actual generation data, totaled 1675.11 MWh. On the other hand, when considering generation projections, taking into account the annual degradation of PV systems (0.5% per year []), the annual average generation is then reduced to 1578.35 MWh.
When analyzed each PSPP individually; the average annual production projected for PSPP lifespans ranged from 78.56 to 298.45 MWh, respectively, for PSPP 1 and PSPP 7.
The projected consolidated annual average generation of all PSPPs was 1427 kWh generated for each installed kWp. The plant with the best annual generation performance was PSPP 8, reaching 1546.43 kWh/kWp, while PSPP 4 recorded 1236.04 kWh/kWp, the lowest result for all PSPPs. These data are detailed in Table 6. The EPBT was calculated for the 10 plants based on the energy values required for PSPP production and installation, ranging from 2.9 to 5.16 years (Table 7).
Table 7.
Energy payback time (EPBT) for the solar PV power plants.
4.2. PSPP GHG Emission Rate
The GHGe-rate was calculated using the emission data from the energy required for the PV systems and the direct emissions related to the manufacturing process of the systems. Table 8 displays the consolidated emission values for each PSPP, as well as the emission factors of the national interconnected system (SIN) in 2016 and the SIN-projected factor for 2020, which were used to compare the obtained GHGe-rate results of the evaluated PVSSs.
Table 8.
Greenhouse gas emission rate (GHGe-rate) for the solar PV power plants. SIN—national interconnected system.
The emission payback time indicates how many PSPP years of operation will offset the emissions generated during the manufacturing and installation processes. This calculation was performed in the same way as the EPBT, using the following equation:
The emissions concerning transport and the recycling process represented an average increase of 1.53% in relation to the total emissions generated and presented in Table 9. These two items are not included in the total displayed in Table 9, with 0.81% of emissions originating from transportation and 0.72% originating from the system recycling process.
Table 9.
Comparative analysis of the results of the present study with previous research. N/A—not applicable.
4.3. Discussion
The EPBT results were, on average, 1.5 years above the average standards presented by other authors in previous studies [,,,,,,,,], as the primary energy saved by the use of PV systems is lower when installed in Brazil, a country with a grid efficiency factor of 0.625. On the other hand, in studies conducted in the USA [,] and Europe [,], the EPBT is calculated considering an average grid efficiency factor of approximately 0.327. Thus, results demonstrate that the energy demanded in the production and installation of PV systems is compensated for in a short period when compared to the 25-year shelf life, supported by the literature, since Brazil exhibits high annual average solar irradiation rates [,].
The 10 evaluated PSPPs present different annual kWh electricity generation results for each installed kWp, which interferes with their respective EPBT (Table 7). Productivity variations can be interpreted from the different adopted PVSS configurations (panel orientation and slope) in each plant, different solar irradiations, and the efficiency factor of the studied modules (Table 6). Plants using panels from the Canadian solar supplier, namely PSPP 8, PSPP 9, and PSPP 10, display a 16.6% panel efficiency factor, while the Yingli Solar supplier indicates a module efficiency of 14.4%. The plant with the lowest annual productivity (annual productivity is the relationship between kWh generated for each installed kWp) was PSPP 4 (1236.04 kWh/kWp), about 20% lower than the plant with the best result, PSPP 8 (1546.43 kWh/kWp). The highest EPBT was observed at PSPP 4, due to its lower annual productivity, added to the fact that ground-mounted panels require more energy for BOS than rooftop panels [].
The unit cost of generated kWh during the PSPP lifetime represented about 45% of the tariff currently contracted to the electricity distributor of each studied site (Table 6), indicating the possibility of significant electricity cost savings for PV technology users.
In relation to the 2016 Brazilian grid emission rate (g CO2/kWh), only PSPP 4 presented a GHGe-rate higher than that credited to the grid, due to the radiation registered at the site, about 4% below the average observed at the PSPP, as well as the orientation and improper slope in which the panels were installed. It is important to emphasize that 2016 and 2017 had an atypical behavior, with an unfavorable water regime for reservoir storage causing an increase in thermal dispatch, and consequently, an increase in grid emission rate. PSPP 4 results are still 27% higher than the rate projected for Brazil’s grid in 2020. On the other hand, the PSPP 4 GHGe-rate represents only 16% of the global average emission factor, and 40% when compared to Canada, which also features an electric grid with a large share of renewables (Figure 3).
Regarding GHGe-rate, the average emission rate calculated for the 10 PSPPs was 68.35 g CO2-eq/kWh, which, when compared to 63.9 g CO2/kWh observed for the projected emission rate of Brazil’s grid for 2020, is an important warning when adopting renewable energy sources, regarding the emission balance of these technologies. The emission rates in this study ranged from 58.38 to 81.92 g CO2-eq/kWh. Thus, it is possible to affirm that the average GHGe-rate of the installed PSPPs proved to be more of an emitting solution than when consuming the grid electricity itself.
PSPP 8 presented the lowest emission rate among the evaluated PSPP plants, at 58.38 g CO2-eq/kWh, about 9% lower than the expected SIN rate for Brazil in 2020. This plant is a rooftop type plant, situated in an area with average annual irradiation of 2039 kWh/m2.year. Thus, favorable conditions contributed significantly to these results.
In a comparative analysis with previous studies presented herein, the results obtained are in agreement with the average values reported in the studies that used similar technical parameters and installation conditions (Table 9), such as the study carried out by Yue et al. [] with panels manufactured in China and installed in Europe, which did not consider the energy required for BOS. These authors obtained a GHGe-rate of 69.2g CO2-eq/kWh for a 30-year lifespan, compared to 58.38–73.33 g CO2-eq/kWh for a 25-year lifespan, calculated herein. PSPP 4, with an emission rate of 81.92 g CO2-eq/kWh, is not included in this range, due to particularities regarding the technical conditions of its installation (panel orientation and inclination and site irradiation), and its inclusion could distort the joint analysis of the plants in this regard. The results of this study carried out concerning plants in operation are consistent with the extensive literature review developed by Kommalapati [], where the means of the 35 results found for PV Multi-Si was 68 g CO2/kWh.
The emissions from the energy required in the PSPP manufacture and installation represent, on average, 84% of the total PVSS CO2-eq emissions evaluated herein, due to the high influence of the electric matrix emission factor in China where panel manufacturing was carried out, thus establishing reflections on the importance of evaluating the energy matrix of the panel origin country. These analyses should be decisive in the decision-making process, when accounting for the import situation of the systems.
The results obtained in relation to the emissions avoided during the declared plant lifespan of supplier 01, namely PSPPs 1, 2, 3, 4, 5, 6, and 7, are not sufficient to compensate for the emissions generated during the PSPP life cycle. It should be noted that a concentration of CO2-eq emissions during the panel manufacture year is an aggravating factor when considering GHG global warming potential (GWP) in the atmosphere (Figure 9). Table 9 compares between the results of the present study with studies published in the literature.
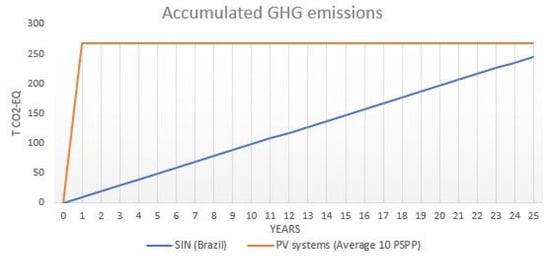
Figure 9.
Comparison of system GHG emissions.
The results reported by Yue [] presented a significant difference in GHGe-rate for systems when manufactured in China or Europe and installed in Europe, pointing to the influence of the emission factor of the electric matrix of the country where the systems were manufactured. This was confirmed in the present study conducted in Brazil.
Comparing the results reported by Breyer [] (53 g CO2/kWh) and Yue [] (69.2 g CO2/kWh) with the present study (58.38–73.33 g CO2/kWh), excluding from this range PSPP 4 for the aforementioned reasons, all with panels made in China, values point to a coherence between the studies. The best result was obtained in Turkey with an irradiation of 2100 kW/m²/year with 30 years of useful life [], with a GHGe-rate about 9% lower than the GHGe-rate found for PSPP 8 in Brazil, installed in a similarly irradiated area, of 2039 kW/m²/year, and which was calculated for a useful life of 25 years.
Over the years, studies indicated significant differences in results, which may be interpreted from several factors, such as the technological evolution of the systems, different climatic conditions, the technical parameters considered in each study, and the depth of the information available. The analysis of the differences between the studies aided in filling knowledge gaps in the subject, seeking to further understand the variables that most interfere with the results and that can be improved in future studies.
A sensitivity analysis was performed to verify the influence of the variation of the following parameters on the results: lifetime, GHGe-rate of the grid where the panels were manufactured, electricity generation, and energy required for manufacturing. The results are summarized in Table 10. This analysis is relevant due to the degree of uncertainty present in LCA studies. Yu et al. [] also explored this type of analysis in their study.
Table 10.
Sensitivity analysis for key PVSS parameters with Multi-Si modules.
The initial reference values of the simulated variables were as follows: lifetime, 25 years; GHGe-rate of the grid where the panels were manufactured, 911 CO2-eq/kWh; and electricity generation for each PSPP (Table 6), 3418.20 MJp/m2. Two additional scenarios were simulated in this sensitivity analysis, in which the PVSS would be manufactured in Brazil or Canada, countries with low emission factors.
The sensitivity analysis indicates that countries whose electric matrix has a high participation of renewable sources are attractive for the production of PVSSs, since the GHGe-rates for these systems are better than the country’s own grid, unlike when these systems come from countries with a predominantly fossil-fuel electrical matrix, such as China. In this sense, national territory promotion of the production chain is worth pointing out as a long-term strategy, allowing for the maintenance of Brazil’s low GHG emission matrix, aligned with the Paris Agreement, while also generating employment and income.
4.4. Limitations
The limitations experienced during the research depend on uncertainties in relation to the data provided by the different suppliers and obtained from the literature, especially when it comes to the primary energy demand information for the different stages of panel production and the installation process presented in Table 1 and Table 2.
The emission factors of the electrical matrix presented by the countries that supply the photovoltaic systems display a significant impact on LCA study results. These data are made available voluntarily by each nation, based on internal information concerning the mix of technologies used in their electrical matrix.
The calculation of avoided GHG emissions due to energy production from the installed photovoltaic systems considers the Brazilian emission factor projection. The values declared by the government until 2017 were considered, while, from 2018 to 2020, values were projected. From 2020, we considered that the emission factor would remain stable as a goal predicted by the Brazilian government.
A differential point of this study is the use of actual generation data for a period of two years. However, for the panel-generated energy projection during its entire useful life, the degradation rate of the system was taken into account, as reported in the literature. In addition, uncertainties regarding climate variability are also present, which will be reflected in the future generation of electric energy.
5. Conclusions
An LCA study was conducted with 10 photovoltaic solar power plants manufactured in China in operation in NE Brazil, where EPBT and GHGe-rate were calculated. From an economic viability point of view, the PSPPs presented a significantly lower generated cost of energy during their lifespan than the prices contracted to the electricity distributor, implying investment returns in a short period of time.
Regarding the PVSS energy balance, EPBT ranged from 2.91 to 5.16 years, representing, on average, only 16% of its useful life, indicating a relatively fast return of the energy required for PVSS manufacturing and installation when compared to a 25-year PVSS lifespan.
With regard to CO2-eq concentrations and their respective contributions to global warming, it is worth noting that the analyzed plants are manufactured in China, a country with a high emission factor in the electric matrix. The average GHGe-rate of the installed PVSS was higher than the emission factor projected for the Brazilian grid. This means that, in order to increase the share of renewable energy in the Brazilian electricity matrix, the importation of PVSS from fossil-based countries should be more carefully analyzed, or even rethought. It should be noted that several government incentive programs and subsidies for technology promotion exist in Brazil, opening space for the reflection of incorporating metrics of an increasing national production in the medium term as an instrument of market regulation.
On the other hand, based on two proposed scenarios simulated in the sensitivity analysis, if the PSPP were to be manufactured in Brazil or Canada, both presenting low emission factors, the emission results associated with electricity production due to the PSPP implementation in Brazil are attractive. The emission rates in both scenarios presented much lower results than the Brazilian SIN rates projected for 2020.
The strategy of some photovoltaic panel manufacturers to open manufacturing plants in nations that exhibit a low emission factor electrical matrix will only make a significant contribution to the mitigation of GHG emissions if the new energy intensive stages of the GHG process are carried out in these new units. On the other hand, if only part of the process, such as the assembly of the PVSS, is carried out in these plants, this initiative will only be characterized as a strategy to obtain tax benefits and commercial advantages, not contributing significantly to GHG emission reduction.
The Brazilian government seeks to replicate the generation model from renewable sources in most buildings in the federal education sector, representing approximately 500 new PSPPs. In this context, it is essential that studies be developed and criteria established for the selection and contracting of solutions to simultaneously meet technical, economic and environmental feasibility. In addition, the results of this research were for PSPPs installed in NE Brazil, presenting the highest irradiation average in the country. Thus, results will be more unfavorable for future PSPPs installed in other regions of the country.
In countries with a large share of renewable sources in their electrical matrix, such as Brazil, Canada, and Norway, among others, the importation of PVSSs should be analyzed carefully, in order to avoid importing systems from countries with high GHGe-rate electric matrices, as a result of a high share of fossil fuels, where, in the Chinese case, coal accounted for 70% in 2015, which can configure, in a way, coal importation embedded in renewable energy systems. Thus, in fossil-fuel-based countries, the use of photovoltaic technology has the potential to contribute to GHG reduction. On the other hand, in countries such as Brazil, where the share of renewable energy accounts for about 80% of the electricity matrix, increases in photovoltaic participation require strategic development, as its benefits or losses are strongly related to the origin of the systems in use.
Photovoltaic solar energy in Brazil can pursue the successful strategy observed in the wind segment, seeking scale gains in the promotion of distributed energy generation and in the participation of solar energy auctions, which may lead to reduced costs. However, other variables must be incorporated in the financing process subsidized by the Brazilian National Development Bank (BNDES), such as life-cycle assessments in terms of emissions and job creation in the country. This approach can leverage greater environmental sustainability, along with employment generation and national technological development.
The strategy of adopting renewable sources without careful planning and analysis considering socio-economic and environmental impacts could alter the lifetime emissions of PVSSs, leading to opposite effects when seeking to use renewable sources to decrease GHG emissions.
Author Contributions
Data curation, investigation, and methodology, G.C. Supervision, M.F. Writing—original draft, G.C. Writing—review and editing, N.F. and M.G.
Funding
This research was funded by a scholarship supported by Program CAPES/DINTER at the Federal University of Rio de Janeiro and Federal Institute of Science, Education and Technology of Rio Grande do Norte, financed by CAPES—Brazilian Federal Agency for Support and Evaluation of Graduate Education within the Ministry of Education of Brazil, grant number 023/2014.
Acknowledgments
The authors would like to thank to CAPES—Brazilian Federal Agency for Support and Evaluation of Graduate Education, within the Ministry of Education of Brazil.
Conflicts of Interest
The authors declare no conflicts of interest.
References
- IPCC. IPCC Fifth Assessment Report—Climate Change 2013; IPCC: Cambridge, UK; New York, NY, USA, 2013. [Google Scholar]
- IPCC. IPCC Fifth Assessment Report—Mitigation of Climate Change; IPCC: London, UK; New York, NY, USA, 2014. [Google Scholar]
- IPCC. IPCC Fifth Assessment Report—Synthesis Report; IPCC: New York, NY, USA, 2014. [Google Scholar]
- Marimuthu, C.; Kirubakaran, V. Carbon pay back period for solar and wind energy project installed in India: A critical review. Renew. Sustain. Energy Rev. 2013, 23, 80–90. [Google Scholar] [CrossRef]
- Stephanie, B. Carbon Footprint of Electricity Generation; Parliamentary Office of Science and Technology: London, UK, 2006. [Google Scholar]
- Peng, J.; Lu, L.; Yang, H. Review on life cycle assessment of energy payback and greenhouse gas emission of solar photovoltaic systems. Renew. Sustain. Energy Rev. 2013, 19, 255–274. [Google Scholar] [CrossRef]
- Fthenakis, V.M.; Kim, H.C. Photovoltaics: Life-cycle analyses. Sol. Energy 2011, 85, 1609–1628. [Google Scholar] [CrossRef]
- Nishimura, A.; Hayashi, Y.; Tanaka, K.; Hirota, M.; Kato, S.; Ito, M.; Araki, K.; Hu, E.J. Life cycle assessment and evaluation of energy payback time on high-concentration photovoltaic power generation system. Appl. Energy 2010, 87, 2797–2807. [Google Scholar] [CrossRef]
- Donnelly, C.R.; Carias, A.; Morgenroth, M.; Ali, M.; Bridgeman, A.; Wood, N. An Assessment of the Life Cycle Costs and GHG Emissions for Alternative Generation Technologies. In Proceedings of the 2010 International World Energy Council Conference, Montreal, QC, Canada, 12–16 September 2010; p. 23. [Google Scholar]
- International Energy Agency. IEA Key World Energy Statistics; IEA: Paris, France, 2017. [Google Scholar]
- International Energy Agency. IEA Electricity Overview Electricity Summary; IEA: Paris, France, 2017. [Google Scholar]
- International Energy Agency. IEA CO2 Emissions from Fuel Combustion 2016 Highlights; IEA: Paris, France, 2016. [Google Scholar]
- International Energy Agency. China, People’s Republic of: Electricity and Heat for 2015; IEA: Paris, France, 2015. [Google Scholar]
- EPE. Cartilha EPE—Riomais20. In Conferência para o Clima Rio+20; EPE: Rio de Janeiro, Brazil, 2012; p. 4. [Google Scholar]
- Brasil, Ministério da Ciência, Tecnologia, Inovação e Comunicação (MCTIC). 3a.Comunicação Sobre Mudanças Climáticas; MCTIC: Brasília, Brazil, 2016. [Google Scholar]
- Brasil, Ministério da Ciência, Tecnologia, Inovação e Comunicação (MCTIC). CTIC Estimativas Anuais de Emissões de Gases de Efeito Estufa No Brasil 2 A Edição; MCTIC: Brasília, Brazil, 2014. [Google Scholar]
- EPE. EPE Resenha Energética Brasileira (Exercício 2016); EPE: Brasília, Brazil, 2017. [Google Scholar]
- EPE. EPE PDE2026—Plano Decenal de Energia; EPE: Brasília, Brazil, 2017. [Google Scholar]
- EPE. EPE PNE-Plano Nacional de Energia 2050; EPE: Rio de Janeiro, Brazil, 2016. [Google Scholar]
- Dale, A.; Pereira de Lucena, A.; Marriott, J.; Borba, B.; Schaeffer, R.; Bilec, M. Modeling Future Life-Cycle Greenhouse Gas Emissions and Environmental Impacts of Electricity Supplies in Brazil. Energies 2013, 6, 3182–3208. [Google Scholar] [CrossRef]
- Barros, M.; Piekarski, C.; de Francisco, A. Carbon Footprint of Electricity Generation in Brazil: An Analysis of the 2016–2026 Period. Energies 2018, 11, 1412. [Google Scholar] [CrossRef]
- EPE. EPE 2016 Statistical Yearbook of Electricity 2015 Baseline Year; EPE: Brasília, Brazil, 2016. [Google Scholar]
- MCTIC Fatores de Emissão de CO2 do Sistema Interligado Nacional do Brasil. Available online: http://www.mctic.gov.br/mctic/opencms/ciencia/SEPED/clima/index.html (accessed on 27 March 2018).
- MMA Discussões para Implementação da NDC do Brasil. Available online: http://www.mma.gov.br/clima/ndc-do-brasil (accessed on 27 March 2018).
- Costa, C.D.V. Políticas de Promoção de Fontes novas e Renováveis para Geração de Energia Elétrica: Lições da Experiência Européia para o Caso Brasileiro. UFRJ—Universidade Federal do Rio de Janeiro, 2006. Available online: http://antigo.ppe.ufrj.br/ppe/production/tesis/costacv.pdf (accessed on 01 March 2017).
- BRASIL Lei no 10.438 de 26 de Abril de 2002. Available online: http://www.planalto.gov.br/ccivil_03/Leis/2002/L10438.htm (accessed on 27 March 2018).
- BRASIL Lei no 10.848 de 15 de Março de 2004. Available online: http://www.planalto.gov.br/ccivil_03/_Ato2004-2006/2004/Lei/L10.848.html (accessed on 25 August 2017).
- Silva, N.F. Da Energias Renováveis na Expansão do Setor Elétrico Brasileiro, 1st ed.; Synergia Editora: Rio de Janeiro, Brazil, 2015; ISBN 9788568483114. [Google Scholar]
- ANEEL. Resolução Normativa n° 482; ANEEL: Brasília, Brazil, 2012.
- ANEEL. Resolução Normativa n° 687; ANEEL: Brasília, Brazil, 2015.
- ANEEL. Nota Técnica n° 0056/2017; ANEEL: Brasília, Brazil, 2017.
- Baños, R.; Manzano-Agugliaro, F.; Montoya, F.G.; Gil, C.; Alcayde, A.; Gómez, J. Optimization methods applied to renewable and sustainable energy: A review. Renew. Sustain. Energy Rev. 2011, 15, 1753–1766. [Google Scholar] [CrossRef]
- Charron, R.; Athienitis, A. Design and Optimization of Net Zero Energy Solar Homes. Am. Soc. Heat. Refrig. Air-Cond. Eng. 2006, 112, 285–295. [Google Scholar]
- IEA Photovoltaic Power Systems Programme—International Statistics. Available online: http://www.iea-pvps.org/ (accessed on 17 April 2018).
- IRENA Data and Statistics—IRENA Resource. Available online: http://resourceirena.irena.org/gateway/dashboard/?topic=3&subTopic=32 (accessed on 27 March 2018).
- Pereira, O.S. Mecanismos de promoção de fontes renováveis. In 3o Seminário de Inserção de Fontes Renováveis no Planejamento; CBEM: Rio de Janeiro, Brazil, 2016. [Google Scholar]
- Azevedo, G. Energia Eólica, Energia Solar e Bioeletricidade: Benefícios e desafios para o Sistema Elétrico Brasileiro. In Inserção de Novas Fontes Renováveis no Planejamento Energético Brasileiro; UFRJ: Rio de Janeiro, Brazil, 2014. [Google Scholar]
- Kenisarin, M.; Mahkamov, K. Solar energy storage using phase change materials. Renew. Sustain. Energy Rev. 2007, 11, 1913–1965. [Google Scholar] [CrossRef]
- Villalva, M.G.; Gazoli, J.R. Energia Solar Fotovoltaica-Conceito e Aplicações; Edição Érica: Sâo Paulo, Brazil, 2012; ISBN 978-85-365-0416-2. [Google Scholar]
- ISO. Environmetal Management: Life Cycle Assesment: Priciples and Framework; ISO: Genebra, Switzerland, 1997. [Google Scholar]
- Mann, S.A.; de Wild-Scholten, M.J.; Fthenakis, V.M.; van Sark, W.G.J.H.M.; Sinke, W.C. The energy payback time of advanced crystalline silicon PV modules in 2020: A prospective study. Prog. Photovolt. Res. Appl. 2014, 22, 1180–1194. [Google Scholar] [CrossRef]
- Yue, D.; You, F.; Darling, S.B. Domestic and overseas manufacturing scenarios of silicon-based photovoltaics: Life cycle energy and environmental comparative analysis. Sol. Energy 2014, 105, 669–678. [Google Scholar] [CrossRef]
- Nieuwlaar, E.; Alsema, E. Envorimental aspects of PV power systems. In IEA PVPS Task 1 Workshop; IEA: Utrecht, The Netherlands, 1997; pp. 25–27. [Google Scholar]
- Phylipsen, G.J.M.; Alsema, E.A. Environmental Life-Cycle Assessment of Multicrystalline Silicon Solar Cell Modules; Utrecht University: Utrecht, The Netherlands, 1995. [Google Scholar]
- Alsema, E.A.; Frankl, P.; Kato, K. Energy Pay-Back Time of Photovoltaic Energy Systems: Present Status and Prospects; Utrecht University: Utrecht, The Netherlands, 1998; pp. 6–10. [Google Scholar]
- Battisti, R.; Corrado, A. Evaluation of technical improvements of photovoltaic systems through life cycle assessment methodology. Energy 2005, 30, 952–967. [Google Scholar] [CrossRef]
- Pacca, S.; Sivaraman, D.; Keoleian, G.A. Parameters affecting the life cycle performance of PV technologies and systems. Energy Policy 2007, 35, 3316–3326. [Google Scholar] [CrossRef]
- Alsema, E.A.; Wild-Scholten, M.J. Reduction of the Environmental Impacts in Crystalline Silicon Module Manufacturing; WIP-Renewable Energies: München, Germany, 2007. [Google Scholar]
- Wild-Scholten, M. Energy payback times of PV modules and systems. In Workshop Photovoltaic; Energy Research Centre of the Netherlands: Köln, Germany, 2009; pp. 26–27. [Google Scholar]
- Alsema, E.; de Wild, M.J. Environmental Impact of Crystalline Silicon Photovoltaic Module Production. MRS Proc. 2005, 895, 0895-G03-05. [Google Scholar] [CrossRef]
- Frankl, P.; Masini, A.; Gamberalet, M.; Toccacelift, D.; Toccacelit, D. Simplified life-cycle analysis of pv systems in buildings: Present situation and future trends. Prog. Photovolt. Res. Appl. 1997, 6, 137–146. [Google Scholar] [CrossRef]
- Alsema, E.; Nieuwlaar, E. Energy viability of photovoltaic systems. Energy Policy 2000, 28, 999–1010. [Google Scholar] [CrossRef]
- Fthenakis, V.; Kim, H.C. Energy Use and Greenhouse Gas Emissions in the Life Cycle of CdTe Photovoltaics. In Symposium G—Life-Cycle Analysis Tools for “Green” Materials and Process Selection; Cambridge University Press: Cambridge, UK, 2005; Volume 895, p. 0895-G03-06. [Google Scholar]
- EIA. Annual Energy Review 2003; EIA: Washington, DC, USA, 2003.
- Alsema, E.A.; De Wild-Scholten, M.J. Environmental Impacts of Crystalline Silicon Photovoltaic Module Production. In Proceedings of the Conference on Life Cycle Engineering, Leuven, Belguim, 31 May–2 June 2006. [Google Scholar]
- Raugei, M.; Bargigli, S.; Ulgiati, S. Life cycle assessment and energy pay-back time of advanced photovoltaic modules: CdTe and CIS compared to poly-Si. Energy 2007, 32, 1310–1318. [Google Scholar] [CrossRef]
- Rupp, R.F.; Lamberts, R. Relatório: Fatores de Conversão de Energia Elétrica e Térmica em Energia Primária e em Emissões de Dióxido de Carbono a Serem Usados na Etiquetagem de Nível de Eficiência Energética de Edificações; UFSC: Florianópolis, Brazil, 2017. [Google Scholar]
- Alsema, E. Energy requirements of thin-film solar cell modules—A review. Renew. Sustain. Energy Rev. 1998, 2, 387–415. [Google Scholar] [CrossRef]
- Leccisi, E.; Raugei, M.; Fthenakis, V. The Energy and Environmental Performance of Ground-Mounted Photovoltaic Systems—A Timely Update. Energies 2016, 9, 622. [Google Scholar] [CrossRef]
- Kommalapati, R.; Kadiyala, A.; Shahriar, M.; Huque, Z. Review of the Life Cycle Greenhouse Gas Emissions from Different Photovoltaic and Concentrating Solar Power Electricity Generation Systems. Energies 2017, 10, 350. [Google Scholar] [CrossRef]
- Ardente, F.; Beccali, G.; Cellura, M.; Lo Brano, V. Life cycle assessment of a solar thermal collector: Sensitivity analysis, energy and environmental balances. Renew. Energy 2005, 30, 109–130. [Google Scholar] [CrossRef]
- Ito, M.; Kudo, M.; Nagura, M.; Kurokawa, K. A comparative study on life cycle analysis of 20 different PV modules installed at the Hokuto mega-solar plant. Prog. Photovolt. Res. Appl. 2011, 19, 878–886. [Google Scholar] [CrossRef]
- Tiba, C. Banco de Dados Terrestres: Atlas Solarimétrico do Brasil; UFPE: Recife, Brazil, 2000. [Google Scholar]
- Pereira, E. Atlas_Brasileiro_Energia_Solar_2a_Edicao; INPE: São José dos Campos, Brazil, 2017. [Google Scholar]
- National Renewable Energy Laboratory Global Solar Atlas. Available online: http://globalsolaratlas.info/ (accessed on 4 April 2018).
- LABREN—Laboratório de Modelagem e Estudos de Recursos Renováveis de Energia. Atlas Solar. Available online: http://ftp.cptec.inpe.br/labren/publ/livros/Atlas_Brasileiro_Energia_Solar_2a_Edicao.pdf (accessed on 27 June 2018).
- LABREN—Laboratório de Modelagem e Estudos de Recursos Renováveis de Energia. Base de Dados. Available online: http://ftp.cptec.inpe.br/labren/publ/livros/atlas_2017/GLOBAL_HORIZONTAL.zip (accessed on 27 June 2018).
- Alsema, E.A. Energy pay-back time and CO2 emissions of PV systems. Prog. Photovolt. Res. Appl. 2000, 8, 17–25. [Google Scholar] [CrossRef]
- Breyer, C.; Koskinen, O.; Blechinger, P. Profitable climate change mitigation: The case of greenhouse gas emission reduction benefits enabled by solar photovoltaic systems. Renew. Sustain. Energy Rev. 2015. [Google Scholar] [CrossRef]
- Hondo, H. Life cycle GHG emission analysis of power generation systems: Japanese case. Energy 2005, 30, 2042–2056. [Google Scholar] [CrossRef]
- Fthenakis, V.; Alsema, E. Photovoltaics energy payback times, greenhouse gas emissions and external costs: 2004–early 2005 status. Prog. Photovolt. Res. Appl. 2006, 14, 275–280. [Google Scholar] [CrossRef]
- Lenzen, M. Life-Cycle Energy Balance and Greenhouse Gas Emissions of Nuclear Energy in Australia; University of Sydney: Sydney, Australia, 2008. [Google Scholar]
- Stoppato, A. Life cycle assessment of photovoltaic electricity generation. Energy 2008, 33, 224–232. [Google Scholar] [CrossRef]
- Ito, M.; Komoto, K.; Kurokawa, K. Life-cycle analyses of very-large scale PV systems using six types of PV modules. Curr. Appl. Phys. 2010, 10, S271–S273. [Google Scholar] [CrossRef]
- (Mariska) de Wild-Scholten, M.J. Energy payback time and carbon footprint of commercial photovoltaic systems. Sol. Energy Mater. Sol. Cells 2013, 119, 296–305. [Google Scholar] [CrossRef]
- Pehnt, M.; Bubenzer, A.; Räuber, A. Life Cycle Assessment of Photovoltaic Systems—Trying to Fight Deep-Seated Prejudices. In Photovoltaics Guidebook for Decision-Makers; Springer: Berlin/Heidelberg, Germany, 2003; pp. 179–213. [Google Scholar]
- Hou, G.; Sun, H.; Jiang, Z.; Pan, Z.; Wang, Y.; Zhang, X.; Zhao, Y.; Yao, Q. Life cycle assessment of grid-connected photovoltaic power generation from crystalline silicon solar modules in China. Appl. Energy 2016, 164, 882–890. [Google Scholar] [CrossRef]
- Yu, Z.; Ma, W.; Xie, K.; Lv, G.; Chen, Z.; Wu, J.; Yu, J. Life cycle assessment of grid-connected power generation from metallurgical route multi-crystalline silicon photovoltaic system in China. Appl. Energy 2017, 185, 68–81. [Google Scholar] [CrossRef]
© 2018 by the authors. Licensee MDPI, Basel, Switzerland. This article is an open access article distributed under the terms and conditions of the Creative Commons Attribution (CC BY) license (http://creativecommons.org/licenses/by/4.0/).