Article

Experimental Investigation on Microscopic Residual Oil Distribution During CO2 Huff-and-Puff Process in Tight Oil Reservoirs

1
State Key Lab of Oil and Gas Resources and Engineering, China University of Petroleum, Beijing 102249, China
2
Research Institute of Petroleum Exploration and Development, CNPC, Beijing 100083, China
*
Author to whom correspondence should be addressed.
Energies 2018, 11(10), 2843; https://doi.org/10.3390/en11102843
Submission received: 30 September 2018 / Revised: 14 October 2018 / Accepted: 18 October 2018 / Published: 21 October 2018
(This article belongs to the Special Issue CO2 EOR and CO2 Storage in Oil Reservoirs)

Abstract

:
The determination of microscopic residual oil distribution is beneficial for exploiting reservoirs to their maximum potential. In order to investigate microscopic residual oil during the carbon dioxide (CO2) huff-and-puff process in tight oil reservoirs, several CO2 huff-and-puff tests with tight sandstone cores were conducted at various conditions. Then, nuclear magnetic resonance (NMR) was used to determine the microscopic residual oil distribution of the cores. The experiments showed that the oil recovery factor increased from 27.22% to 52.56% when injection pressure increased from 5 MPa to 13 MPa. The oil recovery was unable to be substantially enhanced as the injection pressure further increased beyond the minimum miscible pressure. The lower limit of pore distribution where the oil was recoverable corresponded to relaxation times of 2.68 ms, 1.29 ms, and 0.74 ms at an injection pressure of 5 MPa, 11 MPa, and 16 MPa, respectively. Longer soaking time also increased the lower limit of the oil-recoverable pore distribution. However, more cycles had no obvious effect on expanding the interval of oil-recoverable pore distribution. Therefore, higher injection pressure and longer soaking time convert the residual oil in smaller and blind pores into recoverable oil. This investigation provides some technical ideas for oilfields in design development programs for optimizing the production parameters during the CO2 huff-and-puff process.

1. Introduction

The contribution of tight oil is becoming increasingly important for maximizing oil production around the world. [1,2,3,4]. However, due to poor water injectivity, conventional water flooding is unsuitable after natural depletion of tight oil reservoirs. It has been proven that carbon dioxide (CO2) injection is a reliable method to enhance oil recovery in tight oil reservoirs [5,6]. The CO2 injection technique can be generally categorized into CO2 huff-and-puff and CO2 flooding processes. In tight oil reservoirs, due to ultra-low permeability, it is difficult for the gas to drive oil from the injection well to the production well [7]. However, tight oil reservoirs often have natural fractures or hydraulic fractures, which result in early break-through during the CO2 flooding process, resulting in very low sweep efficiency [8,9].
The CO2 huff-and-puff process is an effective single-well enhanced oil recovery (EOR) operation in tight oil reservoirs developed through laboratory experiments [10] and now used in field application [11]. The main recovery mechanisms during the CO2 huff-and-puff process include viscosity reduction, oil swelling, interfacial tension (IFT) reduction, hydrocarbon extraction, and solution gas drive [12,13]. Among them, the oil swelling and hydrocarbon extraction effects are considered principal mechanisms for recovering crude oil from tight formations [14,15].
To explore the CO2 huff-and-puff processes, many experimental investigations have been reported. During the CO2 huff-and-puff process, once the injected CO2 contacts the crude oil, CO2 dissolves into the crude oil. Then, the oil swells and the light components of the oil components vaporize into the CO2 phase [16,17]. The oil recovery performance of the CO2 huff-and-puff operation is influenced by parameters such as injection volume of CO2, soaking time, number of cycles, and injection pressure. Abedini and Torabi [18] compared recovery performance and recognized CO2-EOR mechanisms of immiscible and miscible CO2 huff-and-puff processes as a superior method. They found that the ORF increased considerably and approached the maximum value as the injection pressure reached the minimum miscible pressure (MMP). Ma et al. [19] optimized the effects of the primary parameters of CO2 huff-and-puff for tight formations and indicated that three cycles are optimal for tight oil reservoirs, and an oil recovery factor (ORF) of more than 30% was obtained with three cycles. Pu et al. [20] found that differential production pressure (ΔP) is the dominant parameter for tight oil recovery in CO2 huff-puff processes from an investigation in 0.3 md cores. The field-scale CO2 huff-and-puff performance was evaluated through experimental and numerical techniques [21]. Song and Yang [10] revealed that 15 days was the optimal soaking time for the ORF of CO2 huff-and-puff process in Bakken tight oil formations.
The current investigations of CO2 huff-and-puff processes in tight oil reservoirs are mainly about EOR mechanisms and parameter optimization. The microscopic residual oil distribution during CO2 huff-and-puff processes in tight oil reservoirs has rarely been studied. The determined residual oil distribution is not only beneficial for determining the EOR mechanisms of the CO2 huff-and-puff tests, but also for exploiting tight reservoirs to their maximum potential.
At present, various microscopic experiments have been employed to identify the residual oil in porous media, such as the micro-displacement model built with true sandstone [21], the photoetching model [22,23], and the X-ray computed tomography (CT) scanning technique [24]. However, the residual oil distribution in micro-displacement models and photoetching models is difficult to accurately quantify. Due to the X-ray CT technique responding to fluid and rock matrix materials, the accuracy of the residual oil distribution mainly depends on the image processing technique [24]. Nuclear magnetic resonance (NMR) signals are only correlated with fluid distributed in pores, and there is a positive correlation between the pore radius and the NMR transverse relaxation time (T2) value [25]. Yang [26] and Chen [27] used NMR measurements to investigate the residual oil distribution during waterflooding processes and waterflooding huff-and-puff in tight oil formations. Gao [28] quantitatively determined the initial and residual oil distribution in medium-to-high-permeability cores with the NMR technique. Therefore, NMR is a reliable method to quantitatively determine the microscopic residual oil distribution during CO2 huff-and-puff processes.
In this paper, the microscopic residual oil distribution during CO2 huff-and-puff processes in tight oil reservoirs was experimentally investigated. The logic structure diagram of this paper is presented in Figure 1. In order to clarify the CO2-EOR mechanisms, a phase behavior study of a CO2-oil system was carried out. CO2 solubility, oil swelling factor, and the interfacial tension of the CO2-oil system during CO2 injection process were measured. Then, several CO2 huff-and-puff tests were carried out at various conditions. In each test, the stage and cumulative amount of produced oil and the viscosity of the produced oil were measured. After each huff-and-puff test, the NMR technique was used to determine the microscopic residual oil distribution. The effect of injection pressure, cycle number, and soaking time on the microscopic residual oil distribution were analyzed. The CO2-EOR mechanisms could be further interpreted through a microscopic residual oil distribution analysis. This study provides an interpretation of the CO2 huff-and-puff process from a microscopic perspective as well as suggestions for optimizing production parameters in tight formations.

2. Experimental Setup

2.1. Materials

In the experiment, the core samples were tight cores collected from Changqing Oilfield, China. It is noted that core samples with nearly the same gas permeability and pore distribution were selected from the same formation. The properties of cores are listed in Table 1.
The stock tank oil (STO) sample was collected from the Changqing Oilfield, China. The density, molecular weight (MWoil), and viscosity of the cleaned STO was measured as 833.4 kg/m3, 229.7 g/mol and 4.80 mPa·s, respectively, at atmospheric pressure and 61 °C. The gas chromatography (GC) compositional analysis of the cleaned crude oil sample at 21 °C is shown in Figure 2.
The brine was considered to be a calcium chloride water type of, which had the total dissolved solids (TDS) of 30,917.8 mg/L. The brine viscosity was measured as 0.4 mPa·s at atmospheric pressure and 61 °C. The purity of the CO2 used in this study was 99.99%, and was supplied by Beijing Huayuan Gas Chemical Co. Ltd. (Beijing, China).

2.2. CO2 Solubility and Oil Swelling Factor Measurements

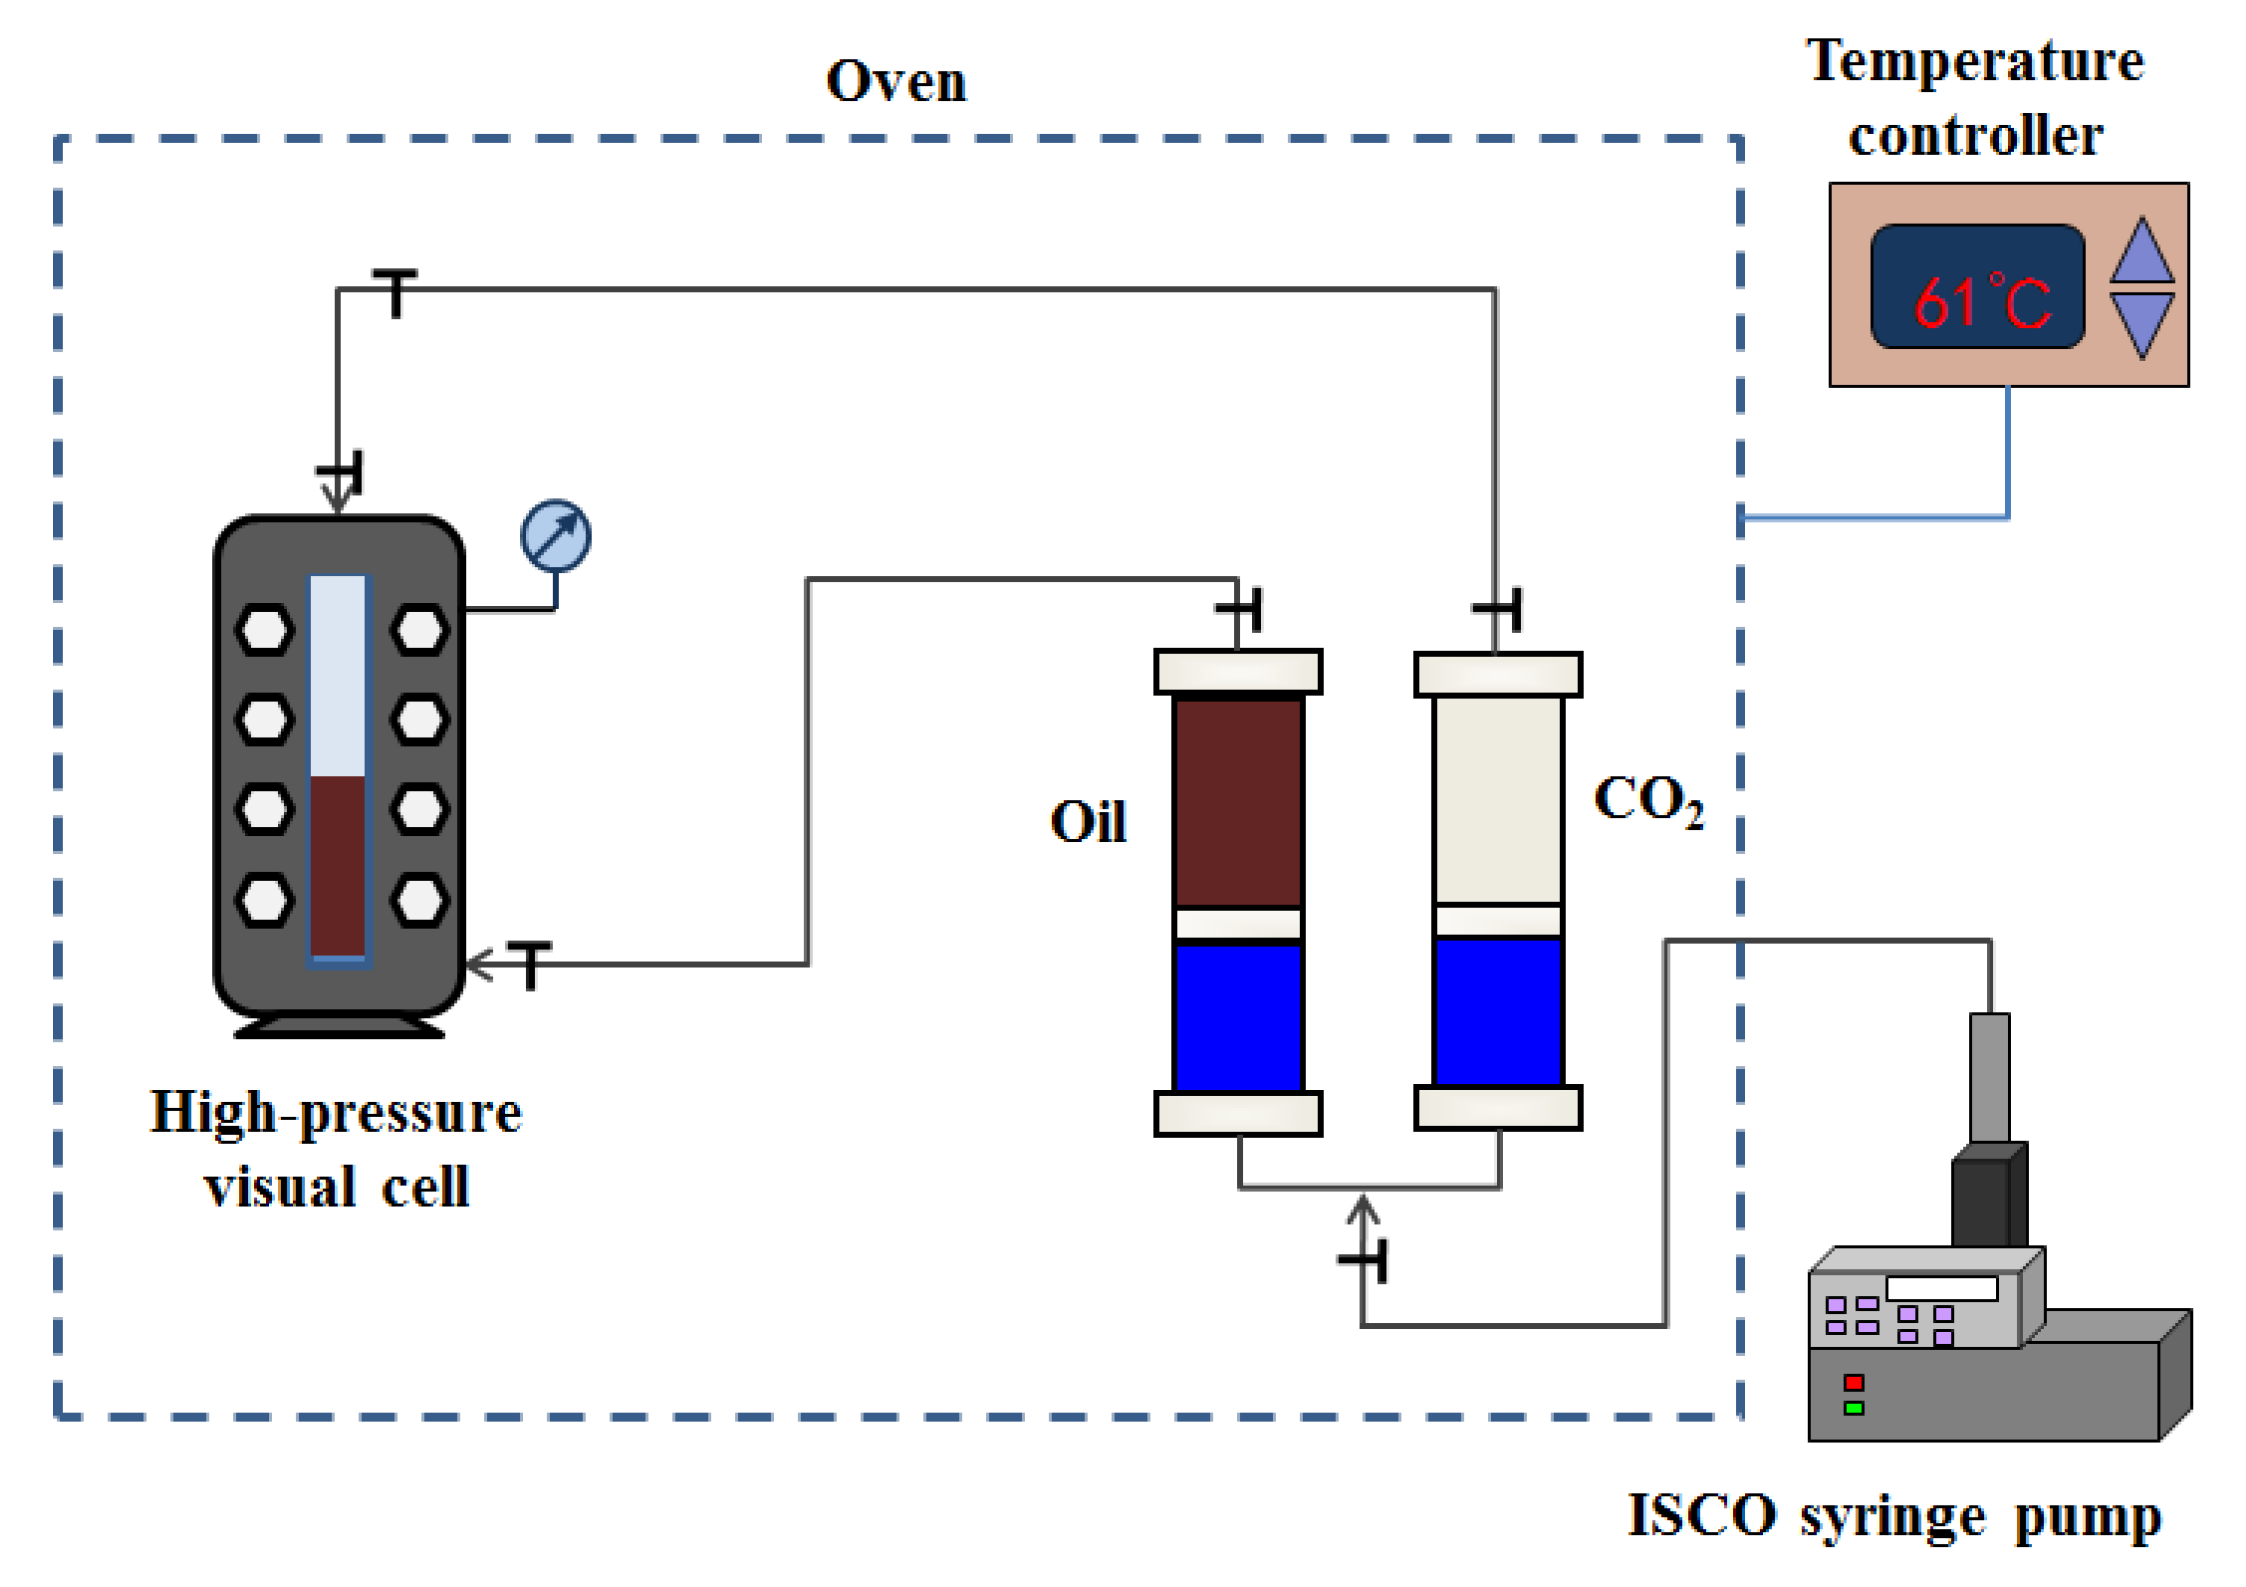
Figure 3 shows the schematic diagram of the experimental apparatus used for CO2 solubility and oil swelling factor measurements at various equilibrium pressures. The apparatus includes a high-pressure visual cell (HD-KS-02, Huada, Haian, China), a magnetic stirrer (85-2, Sile, Shanghai, China), high-pressure cylinders and a constant flow pump (260D, ISCO, Lincoln, NE, USA). A pressure transducer (HKY-06C, HKY, Beijing, China) was used to measure pressure inside the cell. The inner volume of the high-pressure cell was 80.00 cm3 and the magnetic stirrer was used to accelerate the CO2 dissolution into the oil. The crude oil sample was injected into the visual cell to a specific volume of Vo,i = 30.00 cm3.
Then, the cell was pressurized with CO2 to a prespecified pressure P i . When the pressure inside the cell reached a stable value ( P f ) and did not change, the CO2-oil system was considered to have reached equilibrium. The height of the oil sample inside the visual cell was measured using a cathetometer. In this study, the CO2 solubility ( χ CO 2 ) is defined as the total moles of dissolved CO2 in 1 L of the original crude oil sample. Mass balance equations were used to calculate the CO2 solubility, which is shown follows:
n C O 2 = n C O 2 , i n C O 2 , f   = P i V i Z i R T P f V f Z f R T = 1 R T ( P i V i Z i P f V f Z f )
where n C O 2 represents the moles of CO2 dissolved in the oil (mol); n C O 2 , i and n C O 2 , f are the moles of the CO2 of the gas phase at initial and final condition (mol), respectively; P i and P f are the initial pressure and final pressure of the system (MPa), respectively; V i and V f represent the initial and final volume of the CO2 of gas phase (cm3), respectively; R is the universal gas constant (8.314 J/(mol·k)); T is the experimental temperature (K); and Z i and Z f are the gas compressibility factor at initial and final conditions, respectively.
χ C O 2 = n C O 2 V o , i = 1 R T V o , i ( P i V i Z i P f V f Z f )
where χ C O 2 is the solubility of CO2 in the oil (mol/L) and V o , i represents initial volume of the oil (cm3).
Then, the oil swelling factor (SF) was determined by the ratio of the final volume of the oil to its initial value at the beginning of the experiment:
S F = V o , f V o , i
where SF is the oil swelling factor and V o , i represents the final volume of the oil (cm3).

2.3. CO2-oil IFT Measurements

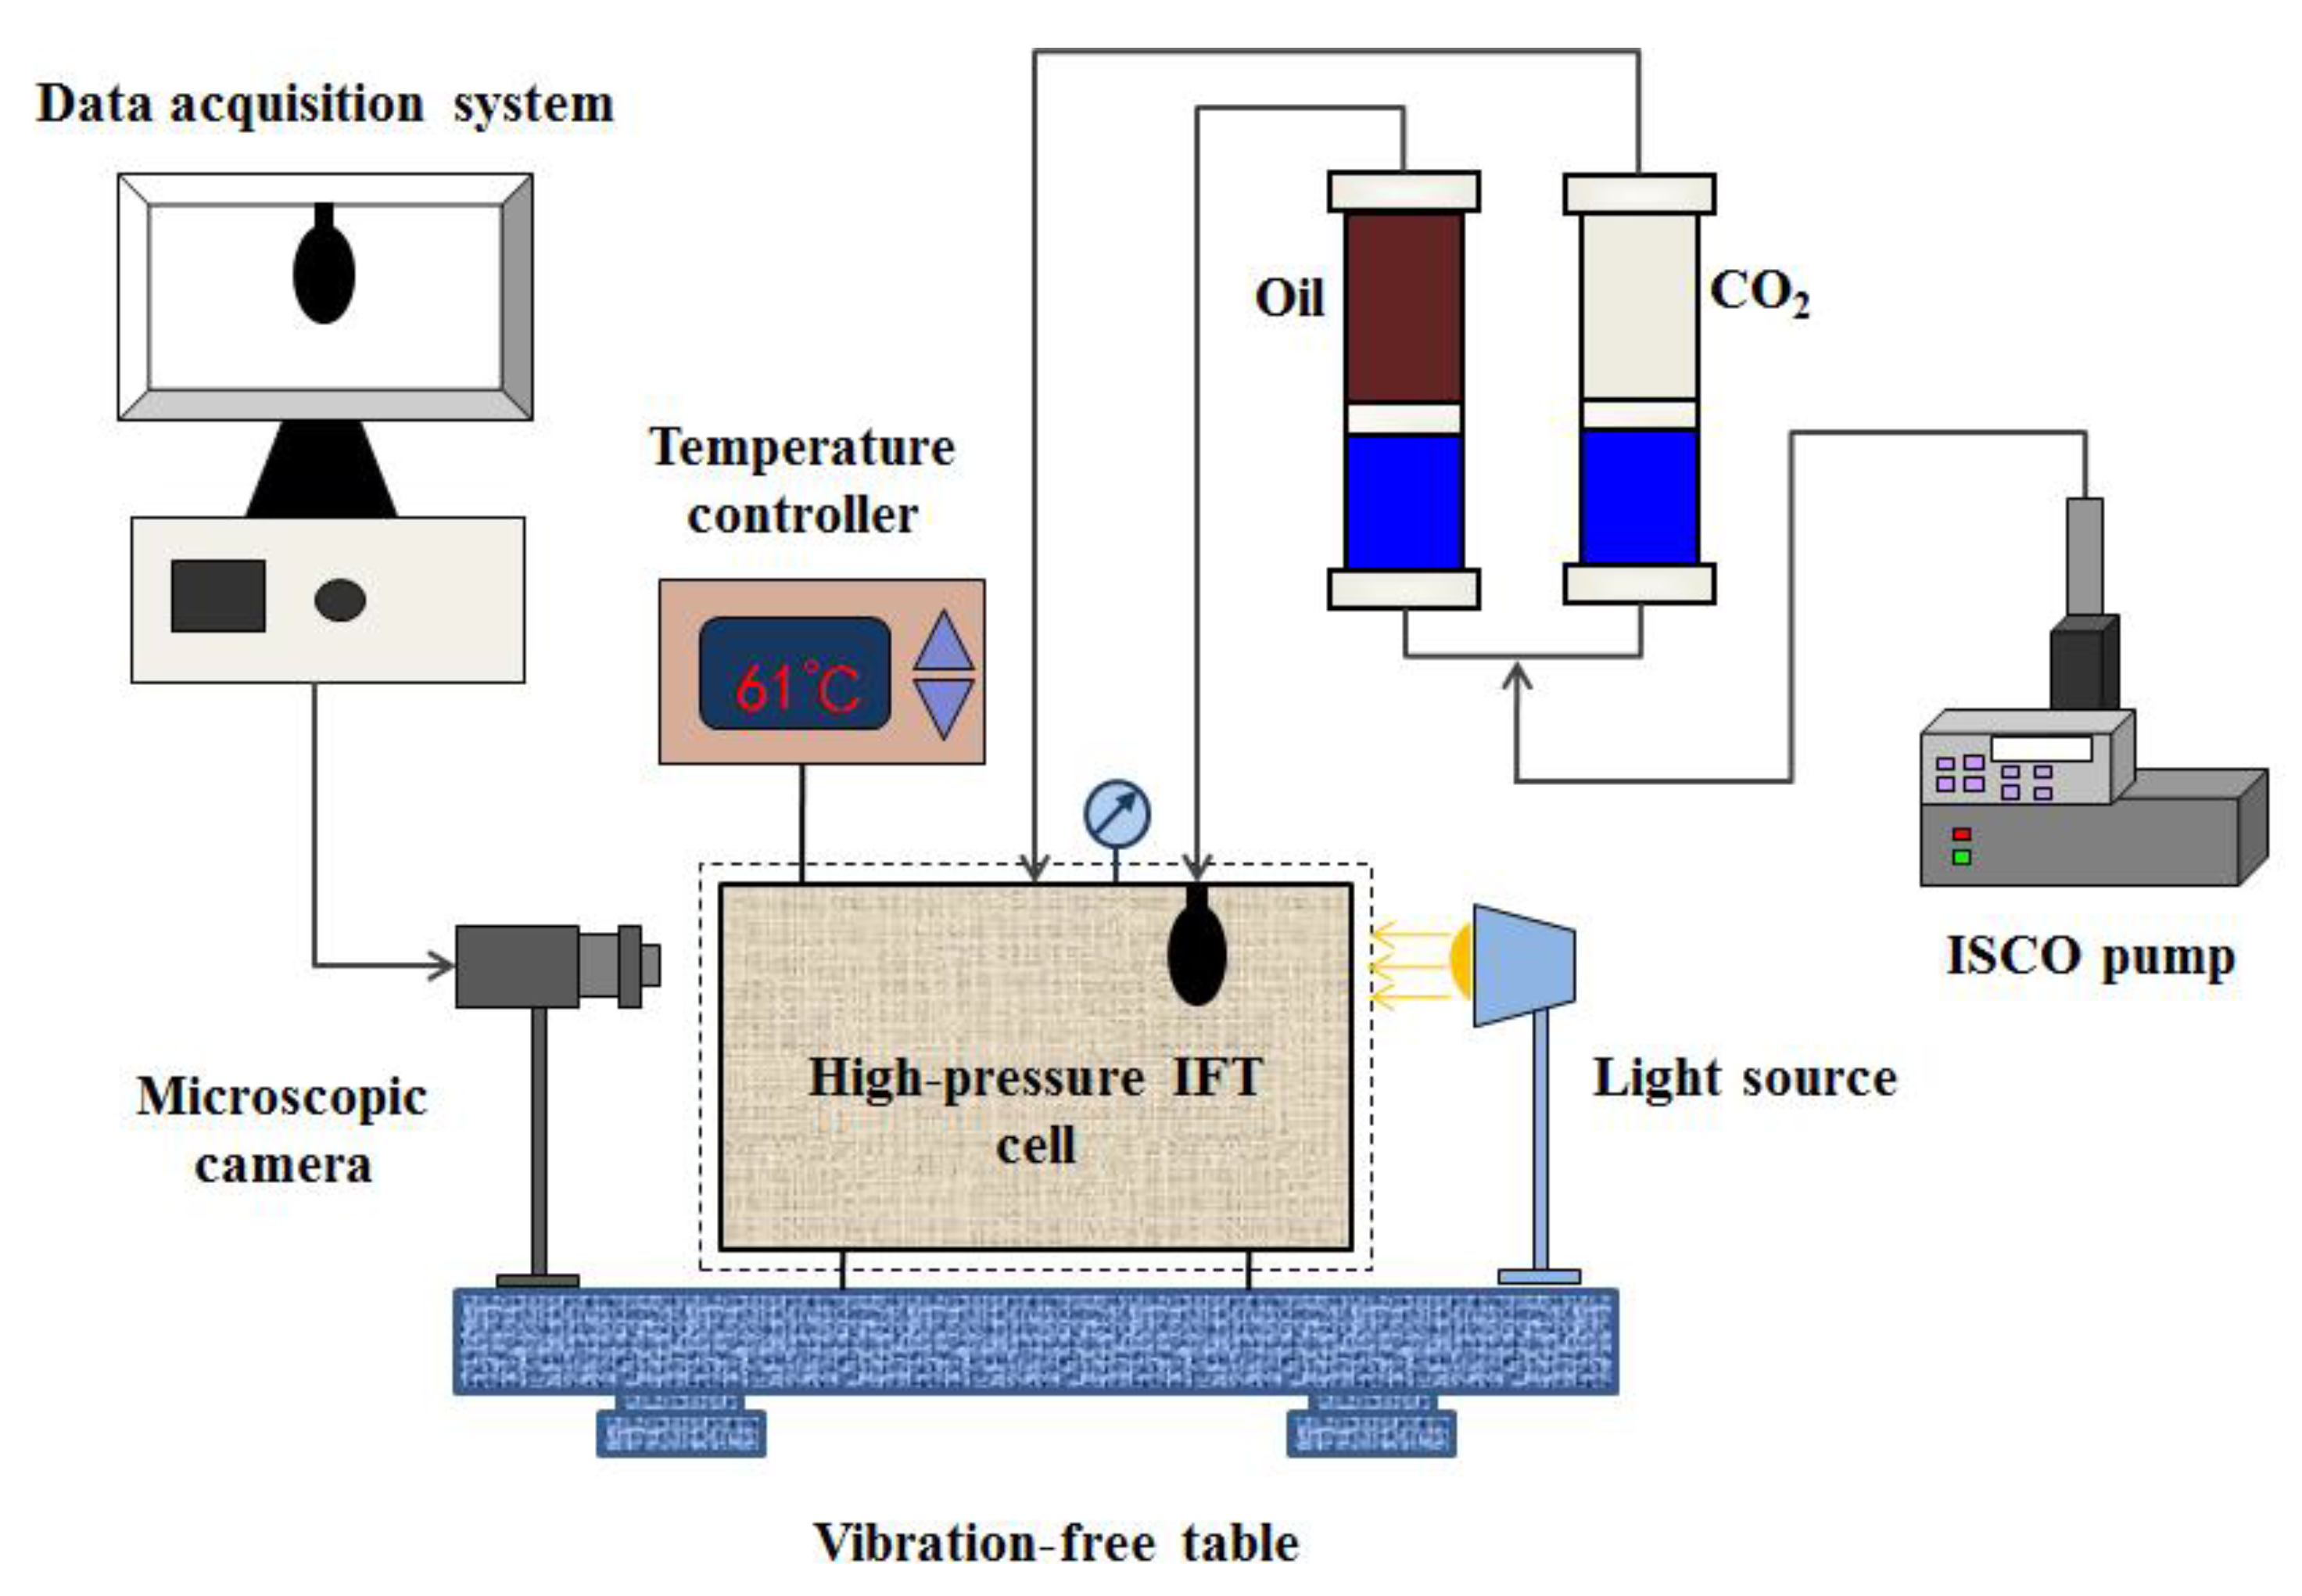
A schematic diagram of the setup to measure the dynamic IFT between CO2 and the crude oil is shown in shown in Figure 4. The core device of the set-up was the high-pressure IFT cell (IFT-10, Temco, Fremont, CA, USA) with maximum operating pressure and temperature of 69 MPa and 177 °C, respectively, and the designed volume of the IFT cell was 49.5 cm3. A pump (260D, ISCO, Lincoln, NE, USA) was used for injecting CO2 into the optical cell and another syringe pump was used for injecting the crude oil into a stainless syringe needle. A microscopic camera was used to capture the image of the pendant drop and computer installed software (FTA, First Ten Angstroms Portsmouth, VA, USA) based on axisymmetric drop shape analysis (ADSA) was utilized to analyze the digital oil drop image. A densitometer (DMA512P, Anton Paar, Graz, Austria) was used to measure the densities of the oil during different tests.
After cleaning the experimental setup and heating the setup to a reservoir temperature of 61 °C, CO2 was pumped into the optical cell to the designated pressure. A pendant drop of the oil was introduced and formed. A series of digital images of the pendant drop were captured at different times. The pendant drop remained two minutes at the tip of the syringe needle before the drop dropped off when equilibrium was achieved. The shapes of the pendant drop were analyzed by the ADSA technique to measure the dynamic IFT between the pendant oil drop and the CO2 phase. The IFT tests at different designed pressures were repeated three times and the measurement error between different tests should be less than 0.5 mJ/m2.

2.4. CO2 Huff-and-Puff Tests

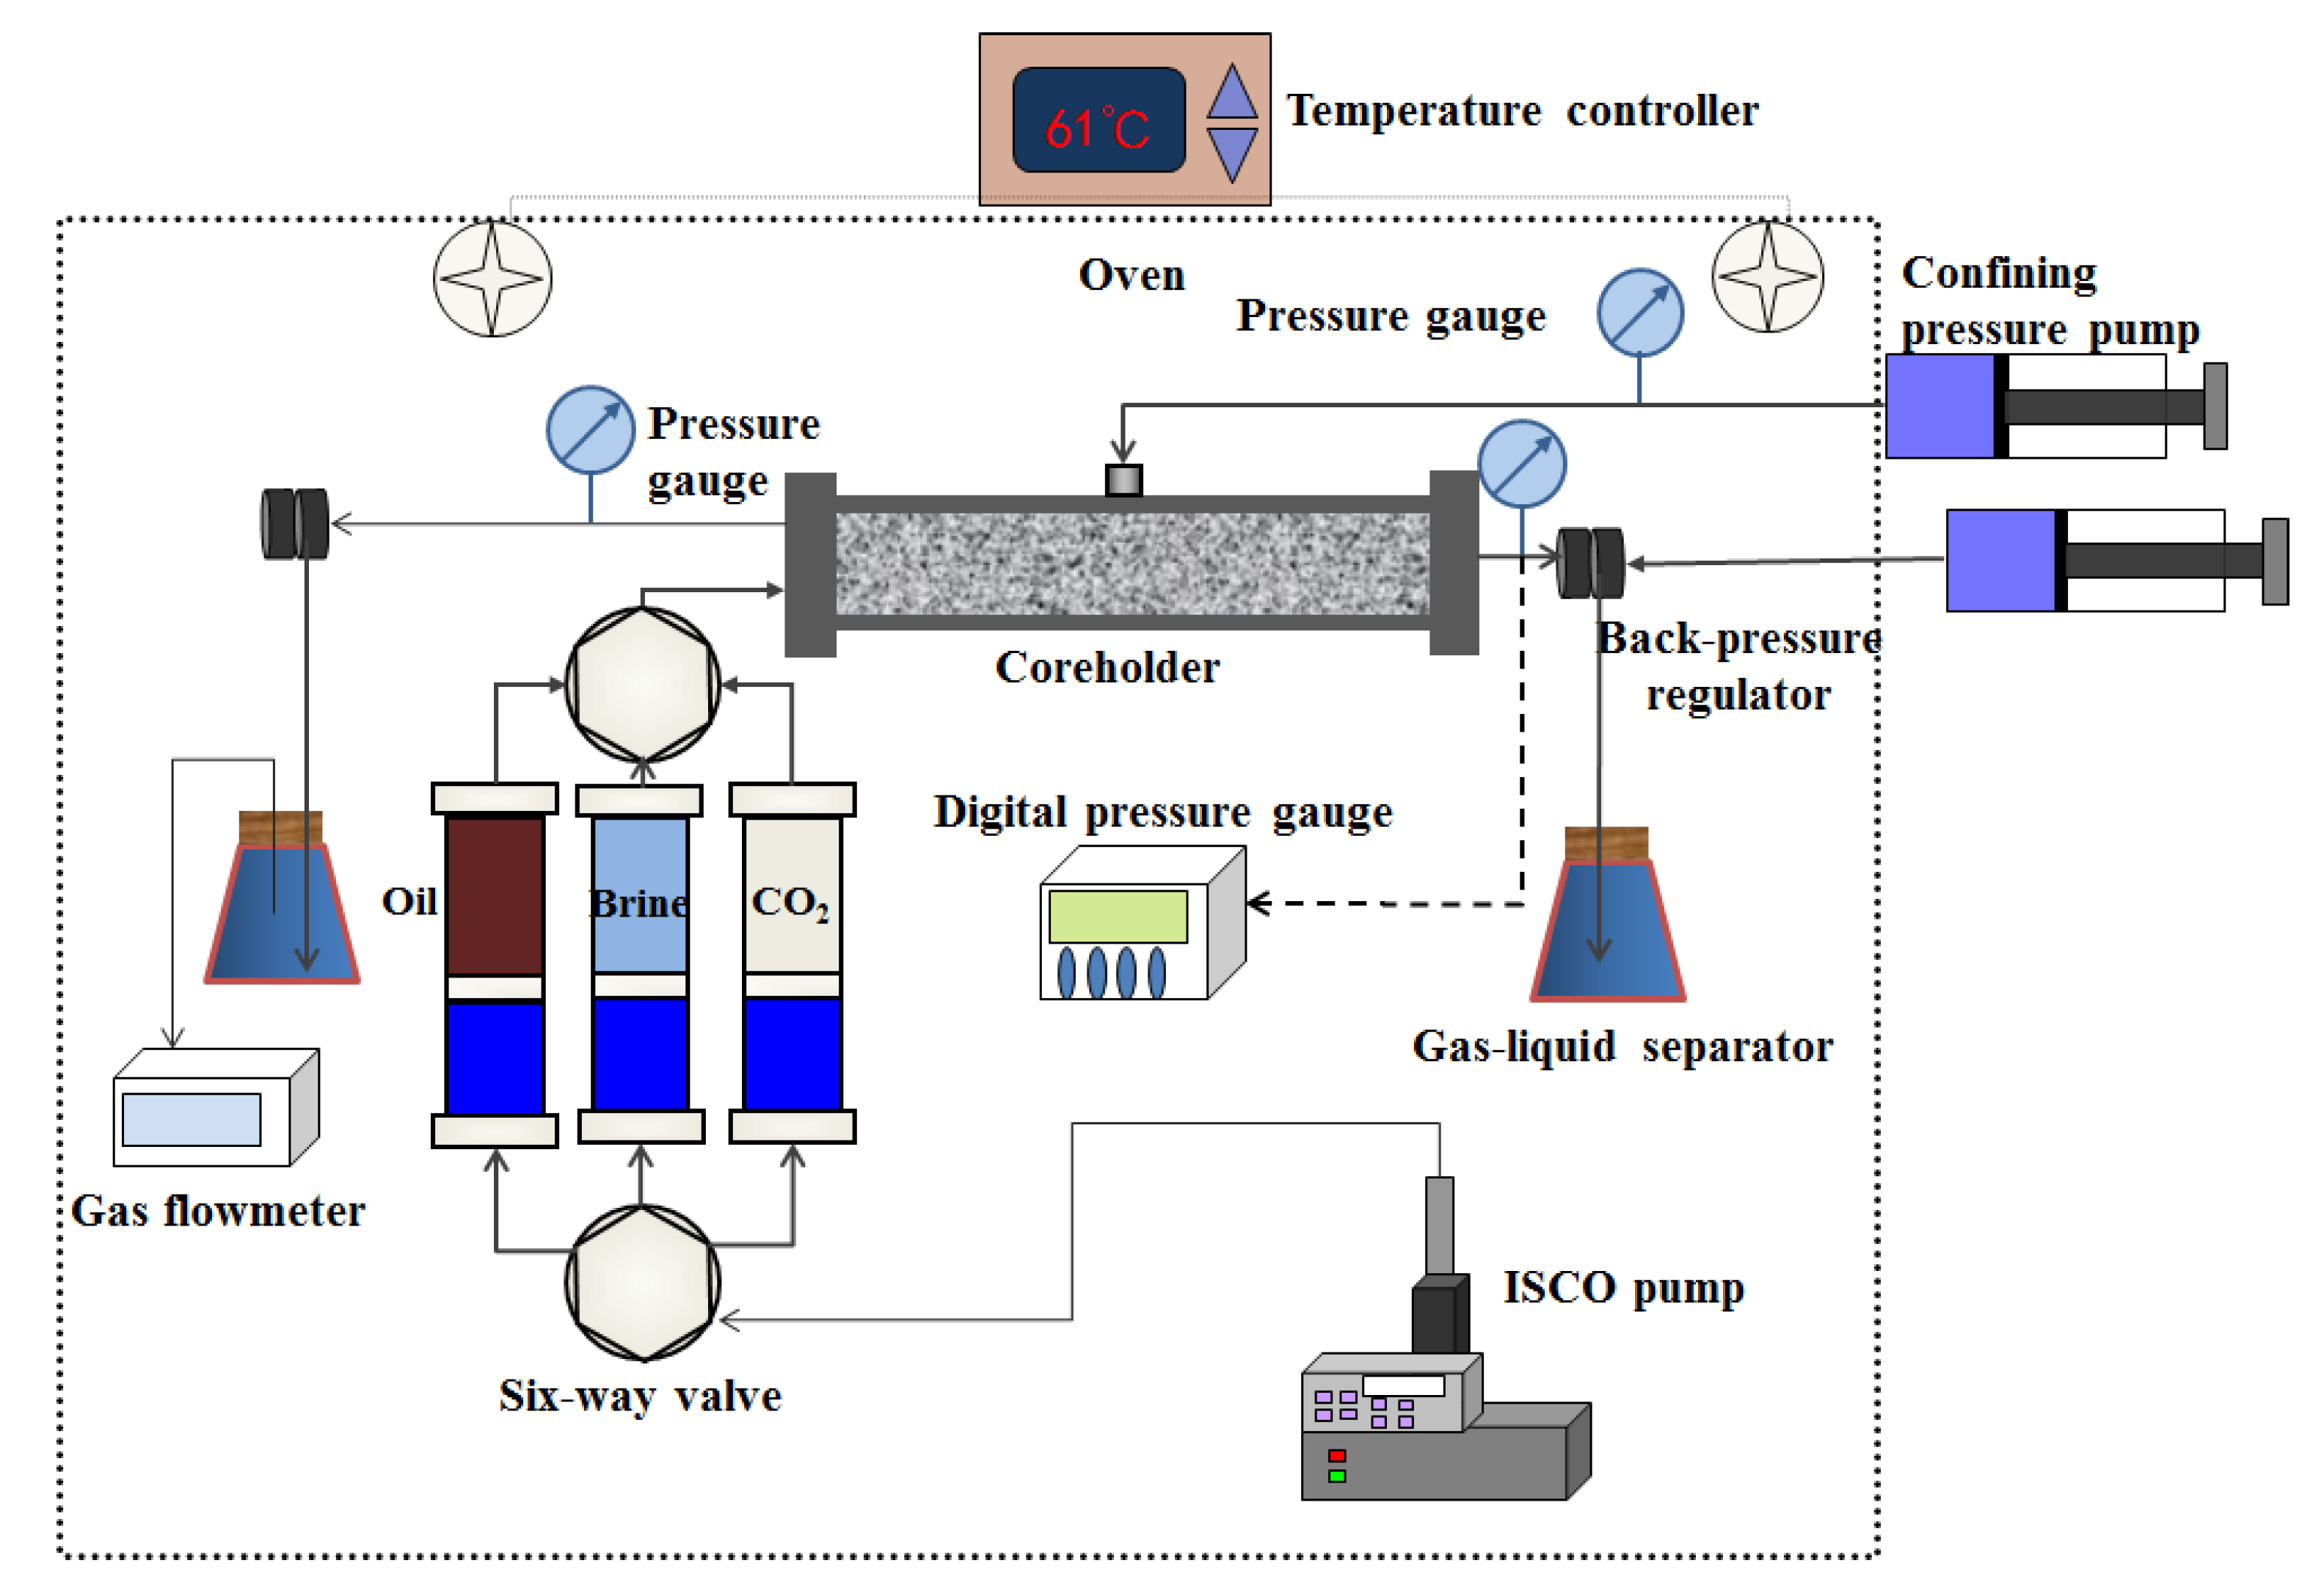
The CO2 huff-and-puff tests were carried out with the apparatus shown in Figure 5. A constant flow pump (260D, ISCO, Lincoln, NE, USA) was applied to displace the crude oil, brine, and CO2 through the core plug inside a high-pressure stainless steel coreholder (TY-4, Huada, Haian, China) with an inner and outer diameter of 25 mm and 40 mm, respectively. Three high-pressure cylinders were applied to store and deliver crude oil, brine and CO2, respectively. The confining pressure on the core plug was always maintained 2–3 MPa higher than the injection pressure with another ISCO syringe pump. An air bath that was heated by two electronic heat guns combined with a temperature controller was used to keep the system at the reservoir temperature of 61 °C. A back-pressure regulator (HDB-03, Huada, Haian, China) was used to target the desired production pressure during the coreflood test. The produced oil was collected in a burette and the volume of the produced gas was measured by a gas flow meter.
The general procedure for the CO2 coreflood tests is briefly described as follows.
(1)
Prior to each test, the core plugs were thoroughly cleaned using a Dean-Stark extractor (SXT-02, Shanghai Pingxuan Scientific Instrument Co., Ltd., Shanghai, China) for 20–30 days. After the core plugs were cleaned and dried at 100 °C. The gas permeability and porosity were measured with nitrogen (High-Pressure Gas Permeameter/Porosimeter, Temco, Tulsa, OK, USA).
(2)
The core plug was placed in a high-pressure coreholder (TY-4, Huada, Haian, China) and vacuumed for 24 hours. Then, the formation brine was injected at a flow rate of 0.2 cm3/min to saturate the core plug. After that, the NMR apparatus (Mini-NMR, Niumag, Suzhou, China) was used to measure the transverse relaxation time T2 of the core sample under the initial water-saturated condition. The magnetic intensity, gradient value control precision, and frequency range of the NMR apparatus were 0.5 T, 0.025 T/m, 0.01 MHz, and 1–30 MHz, respectively.
(3)
The core was displaced with MnCl2 solution (15,000 mg/L) of 5 PV. Then, the saturated core was scanned again by the NMR apparatus to ensure the hydrogen signal of the brine was eliminated.
(4)
After that, 3.0 PV of the crude oil was pumped through the core plugs at a constant rate of 0.1 cm3/min until no water was produced to achieve the connate water saturation (Swc) and the initial oil saturation (Soi) at a reservoir temperature of 61 °C. The T2 spectrum was measured again after the core had been saturated with crude oil.
(5)
In each test, the pressure of the CO2 in the high-pressure cylinder was increased to the prespecified injection pressure at the temperature of 61 °C. Then, the CO2 was injected into the oil saturated core at constant pressure to the desired pressure and the pump maintained the constant pressure condition for 30 min. After CO2 injection, CO2 was allowed to soak for tsoak = 6 h. Then, the oil was produced from the same end of the coreholder at atmospheric pressure. The huff-and-puff cycles continued until no considerable oil production was obtained. The injection and production pressure were continuously monitored and recorded during the entire test. A video camera was utilized to measure the cumulative produced oil volume.
(6)
After the CO2 huff-and-puff test, the T2 transverse relaxation time of the core samples was measured with the NMR apparatus.

3. Results and Discussion

3.1. Phase Behaviors of CO2-Oil System

3.1.1. CO2 Solubility and Oil Swelling Measurement

The CO2 solubility in the crude oil, which is the key parameter of the performance of the CO2 injection process, directly influences the oil swelling factor, oil viscosity, oil density, and CO2-oil IFT [29]. The swelling/extraction test of the oil sample was conducted at a reservoir temperature of 61 °C. As shown in Figure 6, CO2 solubility increased with increasing equilibrium pressure. At the same time, the oil swelling factor increased due to more dissolved CO2 in the crude oil. However, the oil swelling factor did not monotonously increase throughout the experiment. When the equilibrium pressure was higher than 9.51 MPa, the crude oil expanded by 28% and the oil swelling factor began to decrease. As the pressure continued to increase, the escaping rate of the light component molecules began to be greater than the rate of CO2 dissolved in the liquid phase [30]. When the equilibrium pressure reached 14.83 MPa, the oil swelling factor was only 0.61.
The curve of the oil swelling factor at various equilibrium pressures was divided into two sections. When the oil swelling factor increases, the dominant effect was the oil swelling effect due to CO2 dissolved in the crude oil, though some light components in the liquid phase evaporated. As the oil swelling factor started to decrease, the extraction effect played a dominant role. The minimum extraction pressure (MEP) is defined as the pressure where the oil swelling factor begins to decrease. When the equilibrium pressure was between 9.51 MPa and 12.20 MPa, the oil swelling factor decreased rapidly because the light components are easily extracted. The larger the molecular weight, the smaller the rate of molecular motion at the same temperature [31]. When the pressure was higher than 12.20 MPa, most light components were already extracted and molecules with higher weights is more difficult to be extracted by CO2. Thus, the curve of oil swelling factor with pressure decease much more slowly.

3.1.2. IFT Measurement

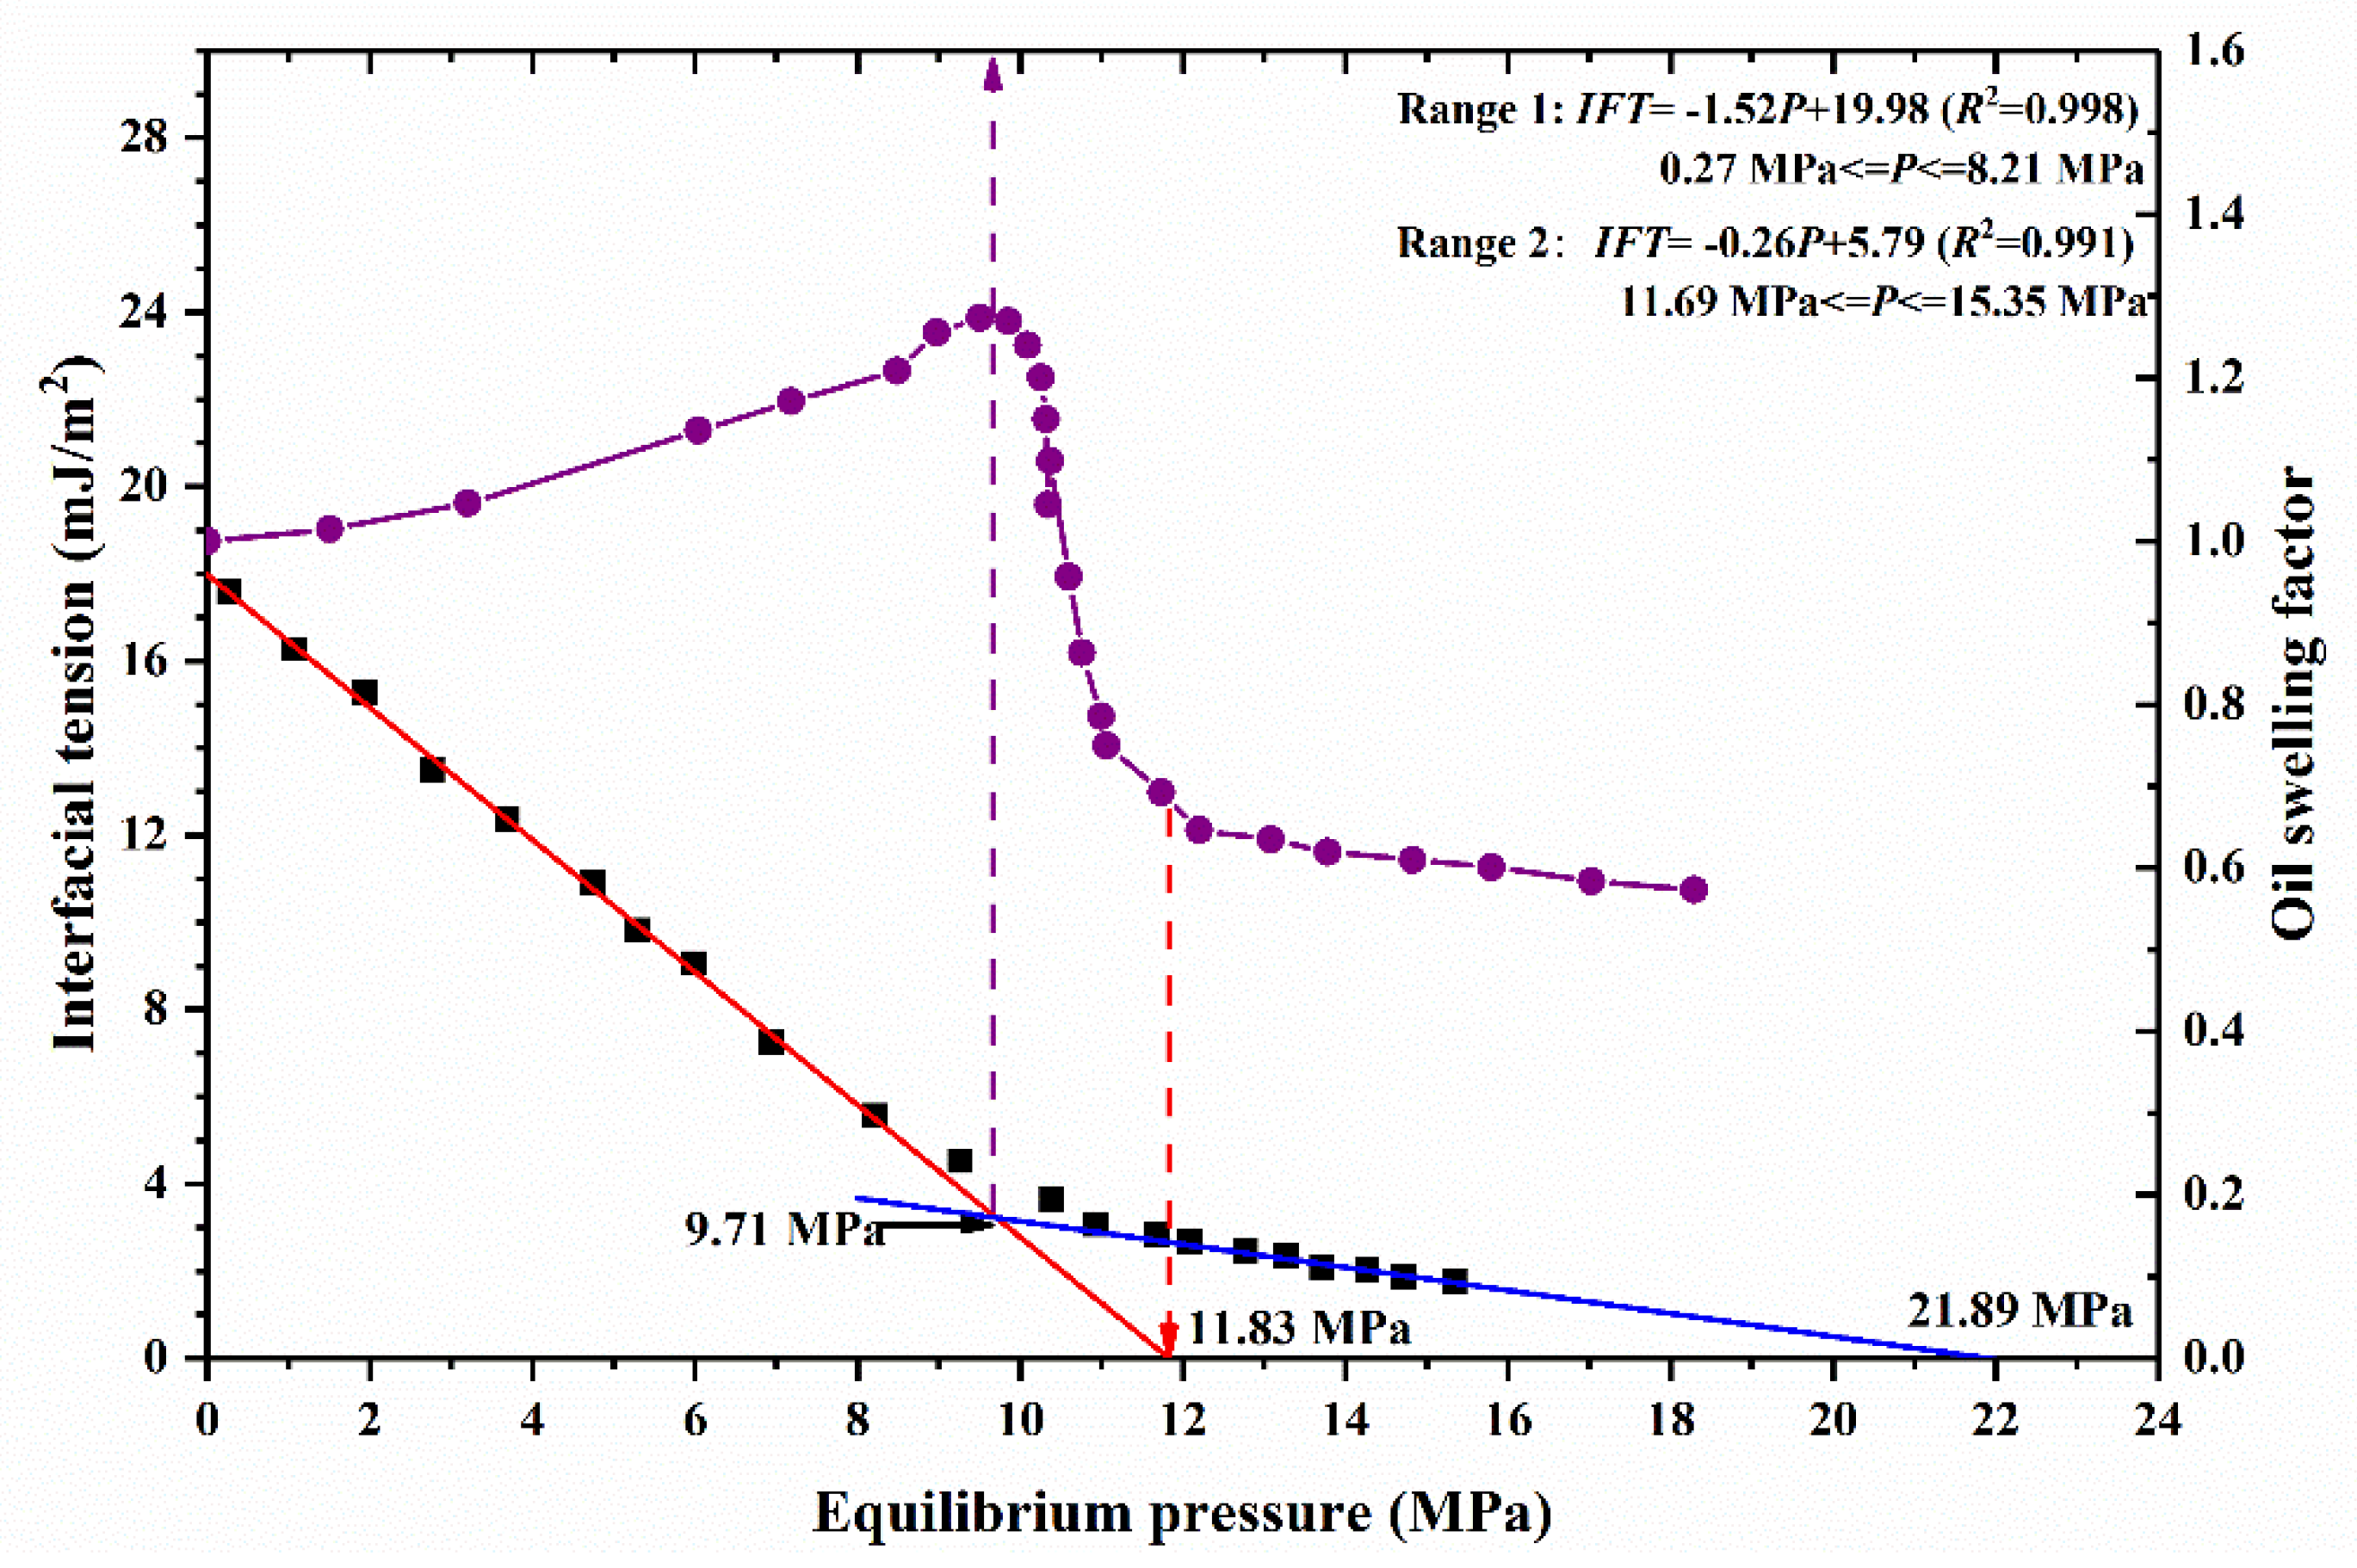
In this study, the IFT between the CO2 and crude oil was determined using the ADSA technique. Figure 7 shows the measured IFT of the CO2-crude oil system at various equilibrium pressure. The IFT of the CO2-oil system decreases with increasing pressure and the CO2-oil system was considered to be miscible when the IFT was 0 [32]. The whole curve was divided into two sections to fit and extrapolate to intersect with the X axis, respectively (Figure 7). The two fitted straight lines intersect at 9.71 MPa, which was 0.2 MPa higher than the MEP of the crude oil (9.51 MPa). Therefore, 9.71 MPa was considered to be the critical point where the CO2-ROE mechanism changed from oil swelling effect to hydrocarbon extraction effect.
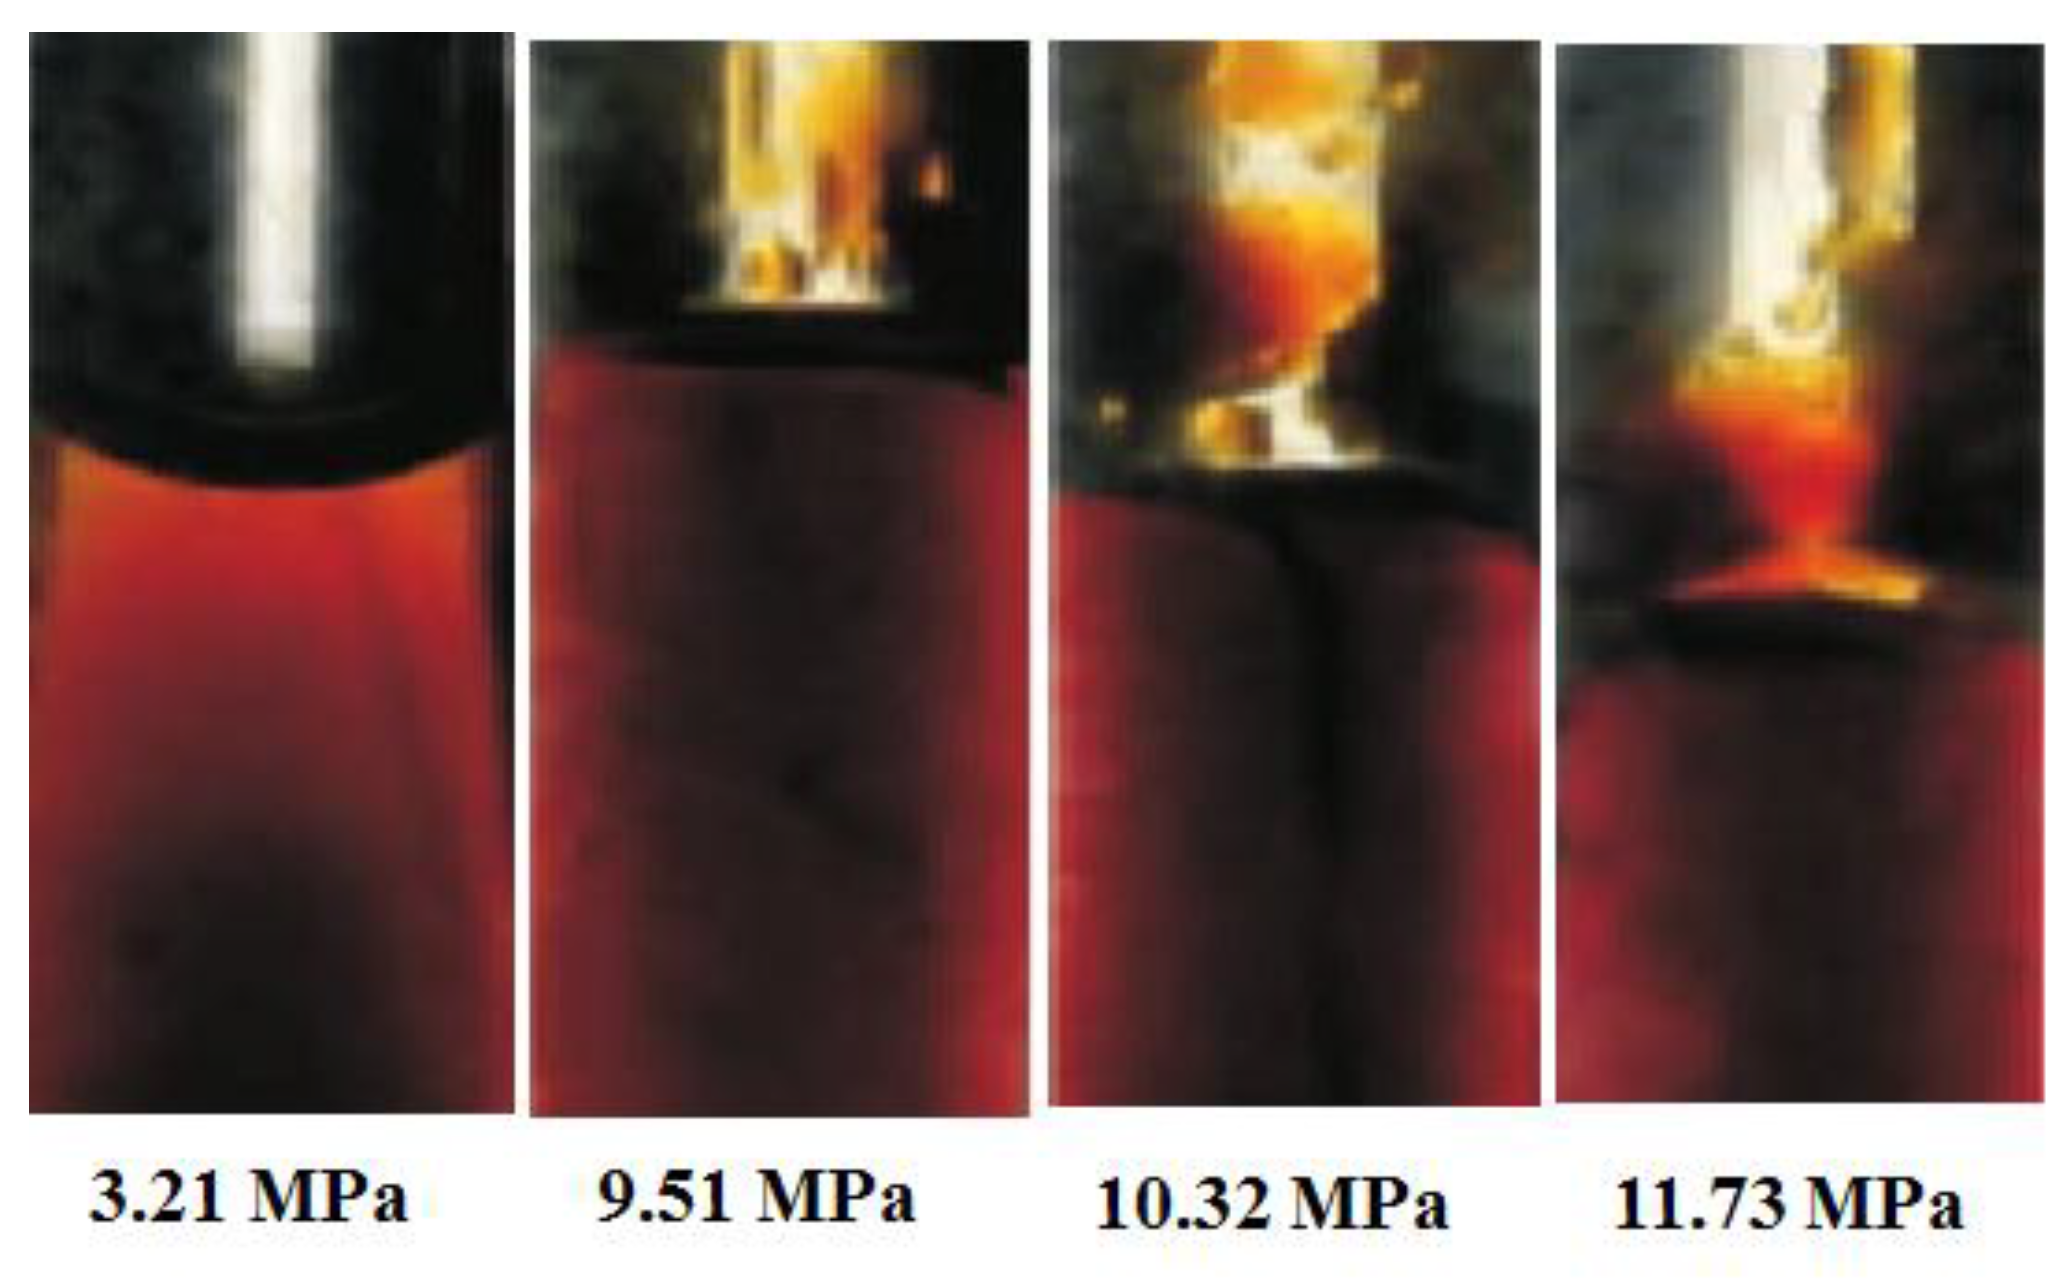
The pressure in Range 1 was defined from 0.047 MPa to 9.71 MPa and the intercept of the linear regression of points in Range 1 was 11.83 MPa (Figure 7). Corresponding to the IFT tests, the phenomenon during the swelling/extraction tests was recorded by photographs, as shown in Figure 8. When the equilibrium pressure was 3.21 MPa, which was much lower than the MEP of the crude oil, the oil in the area below the phase interface was lighter in color due to CO2 dissolution. As the pressure increased to a MEP of 9.51 MPa, light-colored droplets appeared on the glass window. The time required to reach equilibrium between the gas and liquid phase increased with increasing equilibrium pressure. When the equilibrium pressure reached 11.73 MPa, a light-colored area that was about 5–6 mm appeared above the liquid level. This area was mainly composed of light and medium components as well as dissolved CO2. Multi-phase contact between CO2 and crude oil is necessary for CO2-oil system to attain miscibility. Therefore, 11.83 MPa was the multi-phase-contact minimum miscibility pressure of the CO2-oil system. When the pressure was higher than M-MMP, the oil swelling factor changed little. The second linear regression intersected with IFT = 0 at 21.89 MPa, which was interpreted as the first-contact minimum miscibility pressure because almost all medium and heavy components were also miscible with CO2 at this pressure [33].

3.2. Microscopic Residual Oil Distribution During CO2 Huff-and-Puff Processes

3.2.1. Effect of Injection Pressure on Residual Oil

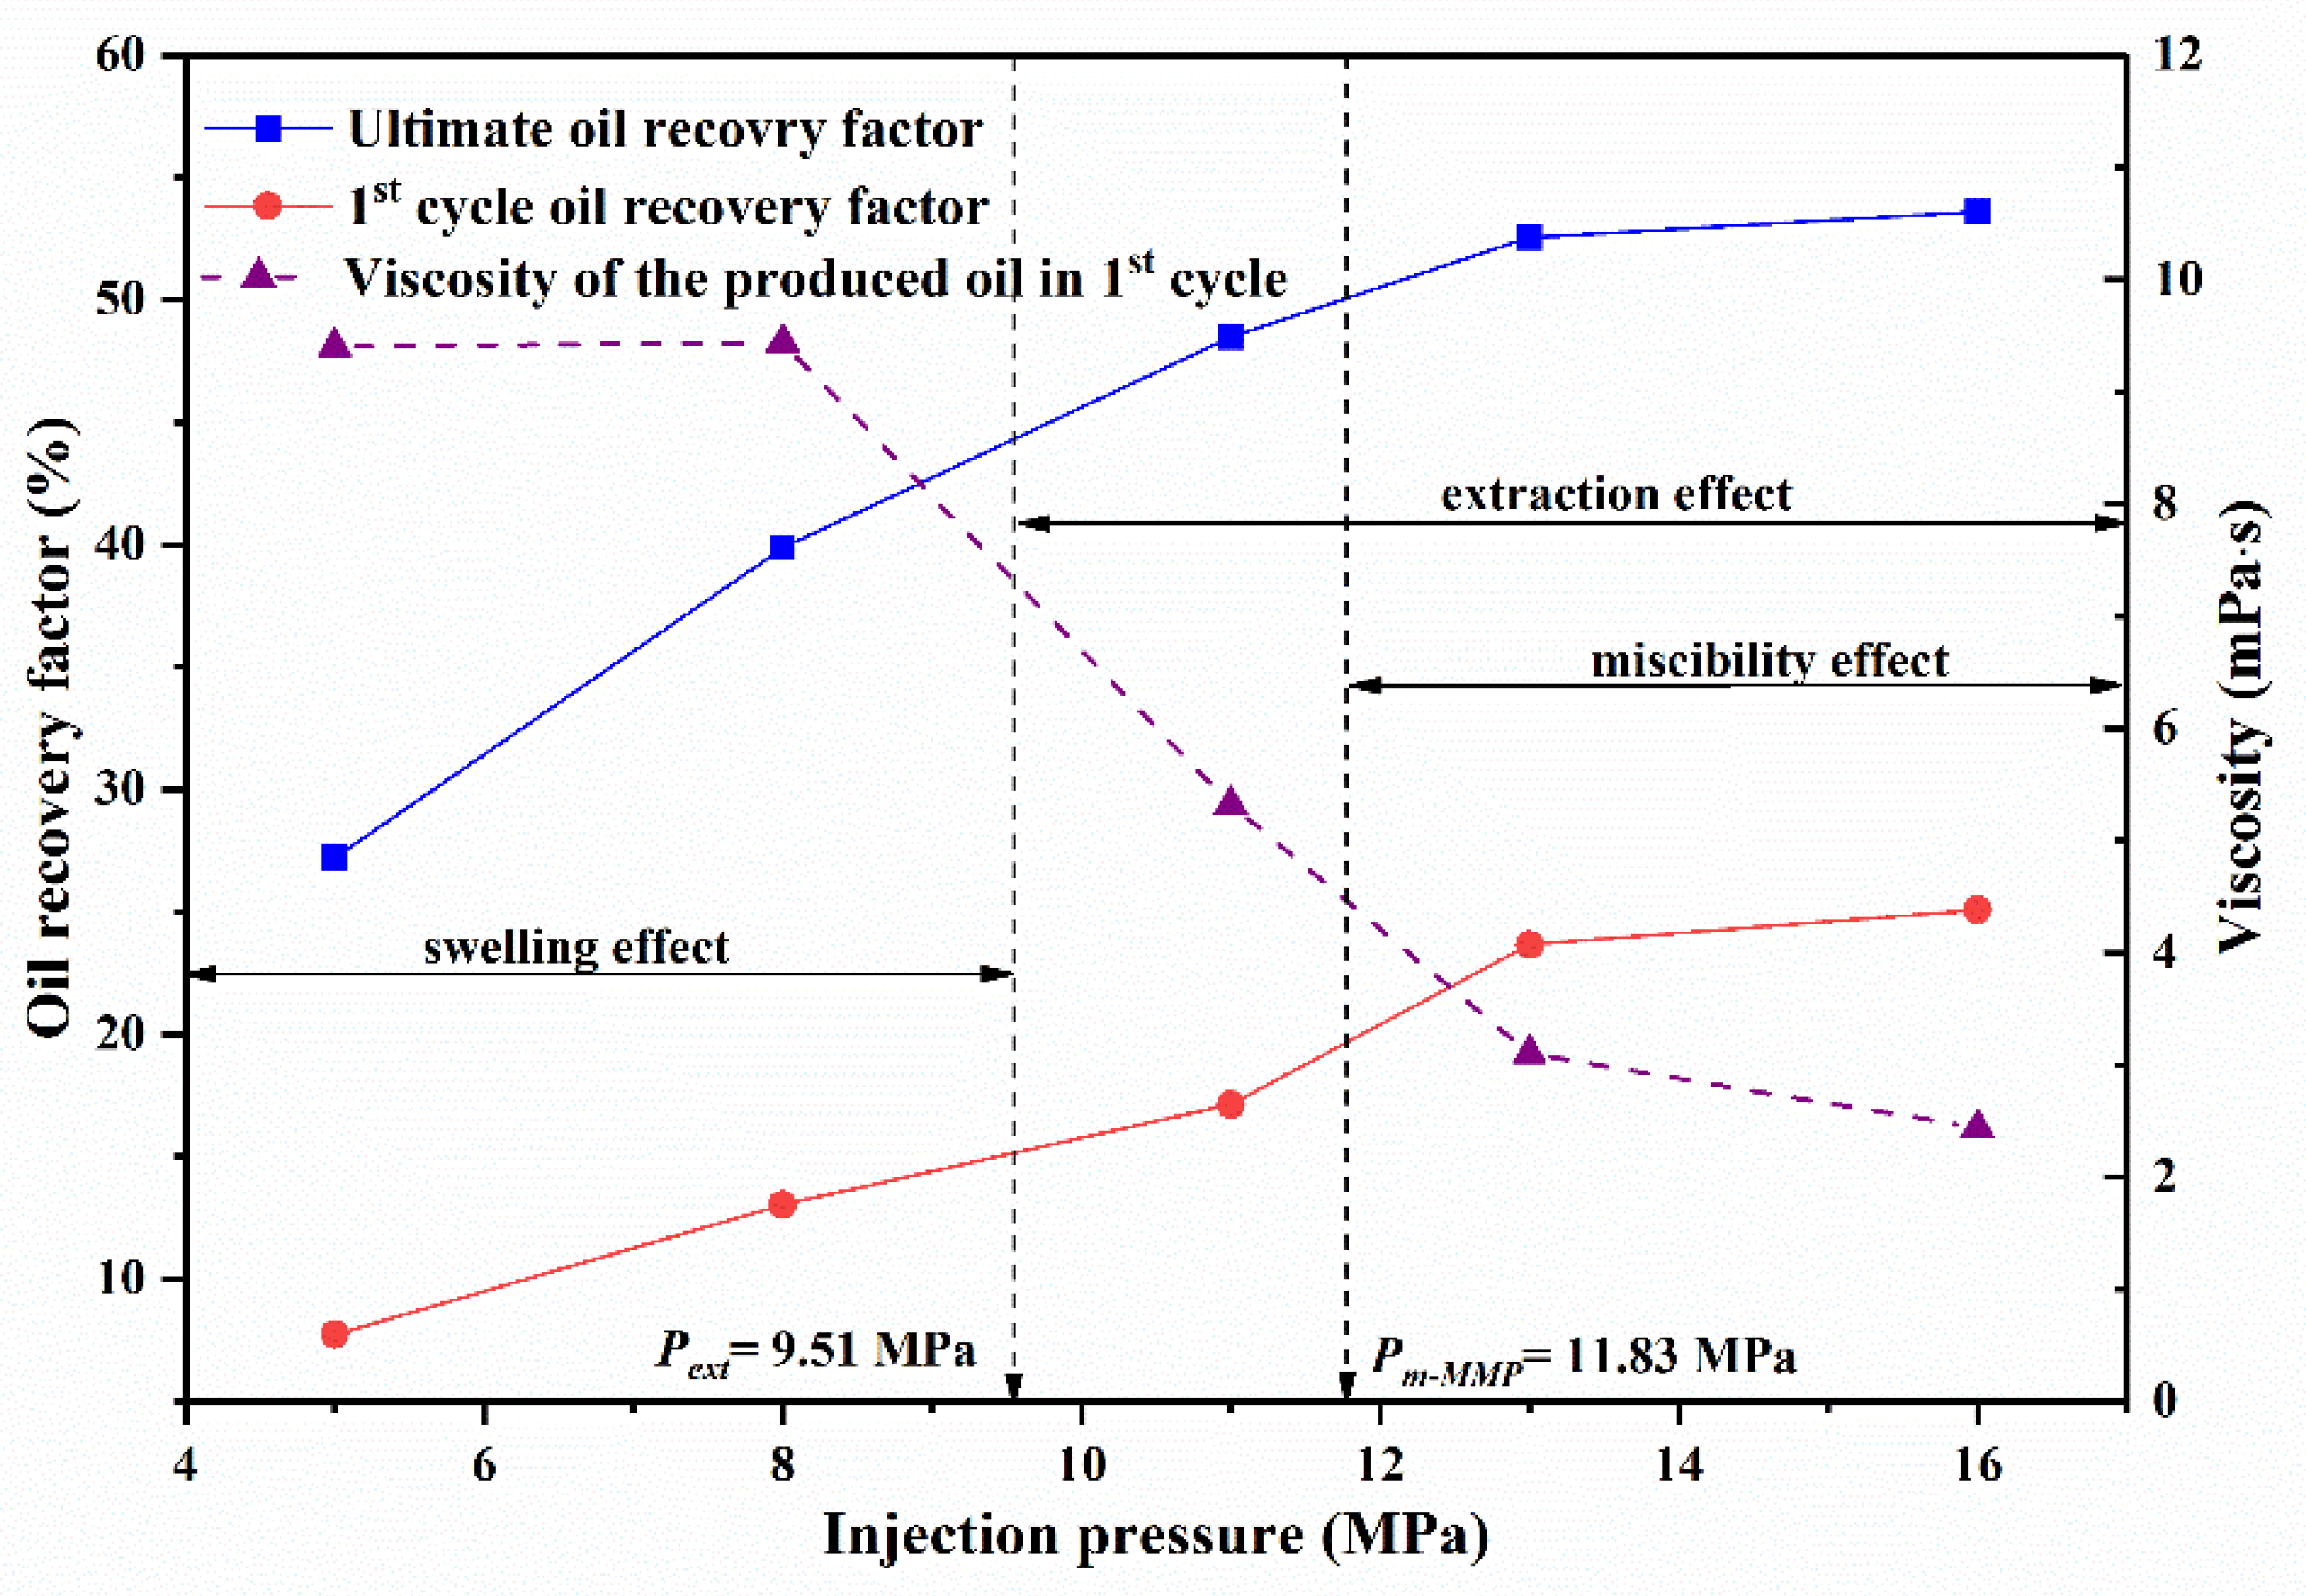
Figure 9 shows the measured ORF versus cycle number at different injection pressures. The total cycle number of each CO2 huff-and-puff test was lower at higher injection pressures. When the injection pressure was less than MEP of 9.51 MPa, seven cycles were conducted until no oil was obtained in each test. When the injection pressure was higher than the MMP of 11.83 MPa, the cyclic CO2 injection test was terminated after five cycles. The ultimate ORF increased with the injection pressure and gradually slowed down (Figure 9 and Figure 10). The ultimate ORF increased remarkably from 27.22% to 52.56% as the injection pressure increased from 5 MPa to 13 MPa. Obvious oil recovery was not obtained with further increase in the injection pressure, and the ORF only increased by 1.04% as the injection pressure increased from 13 MPa to 16 MPa.
The viscosity of the produced oil in the first cycle of the CO2 huff-and-puff tests performed at different injection pressures is shown in Figure 10. The viscosity of the produced oil decreased from 9.40 mPa·s to 2.44 mPa·s as the injection pressure increased. When the injection pressure was lower than the MEP, the interface of the CO2-oil was obvious. The oil swelling effect was determined as the dominant recovery mechanism and the extraction effect of the CO2 was weak. So, the viscosity of the produced oil and the composition of the residual oil in the formation changed little. The produced oil form each cycle was mainly recovered through the elastic energy of the reservoir. More cycles were necessary at lower injection pressures to reach the development capacity of the reservoir.
When the injection pressure was higher than the MEP, especially higher than the MMP, more light and medium components could be extracted by the injected CO2. The produced oil could be categorized into two portions: the lighter oil extracted by the injected CO2 and the oil recovered due to the elastic energy and oil swelling effect. The proportion of the lighter oil increased with injection pressure, so the viscosity of the produced oil was lower at higher injection pressure. As the huff-and-puff process progressed, the heavy components content of the residual oil increased. The solubility of the CO2 in the residual oil decreased and the CO2 played a weaker role in the later cycles. Therefore, the ORF in each cycle was higher and fewer cycles were needed at higher injection pressure during the CO2 huff-and-puff processes.
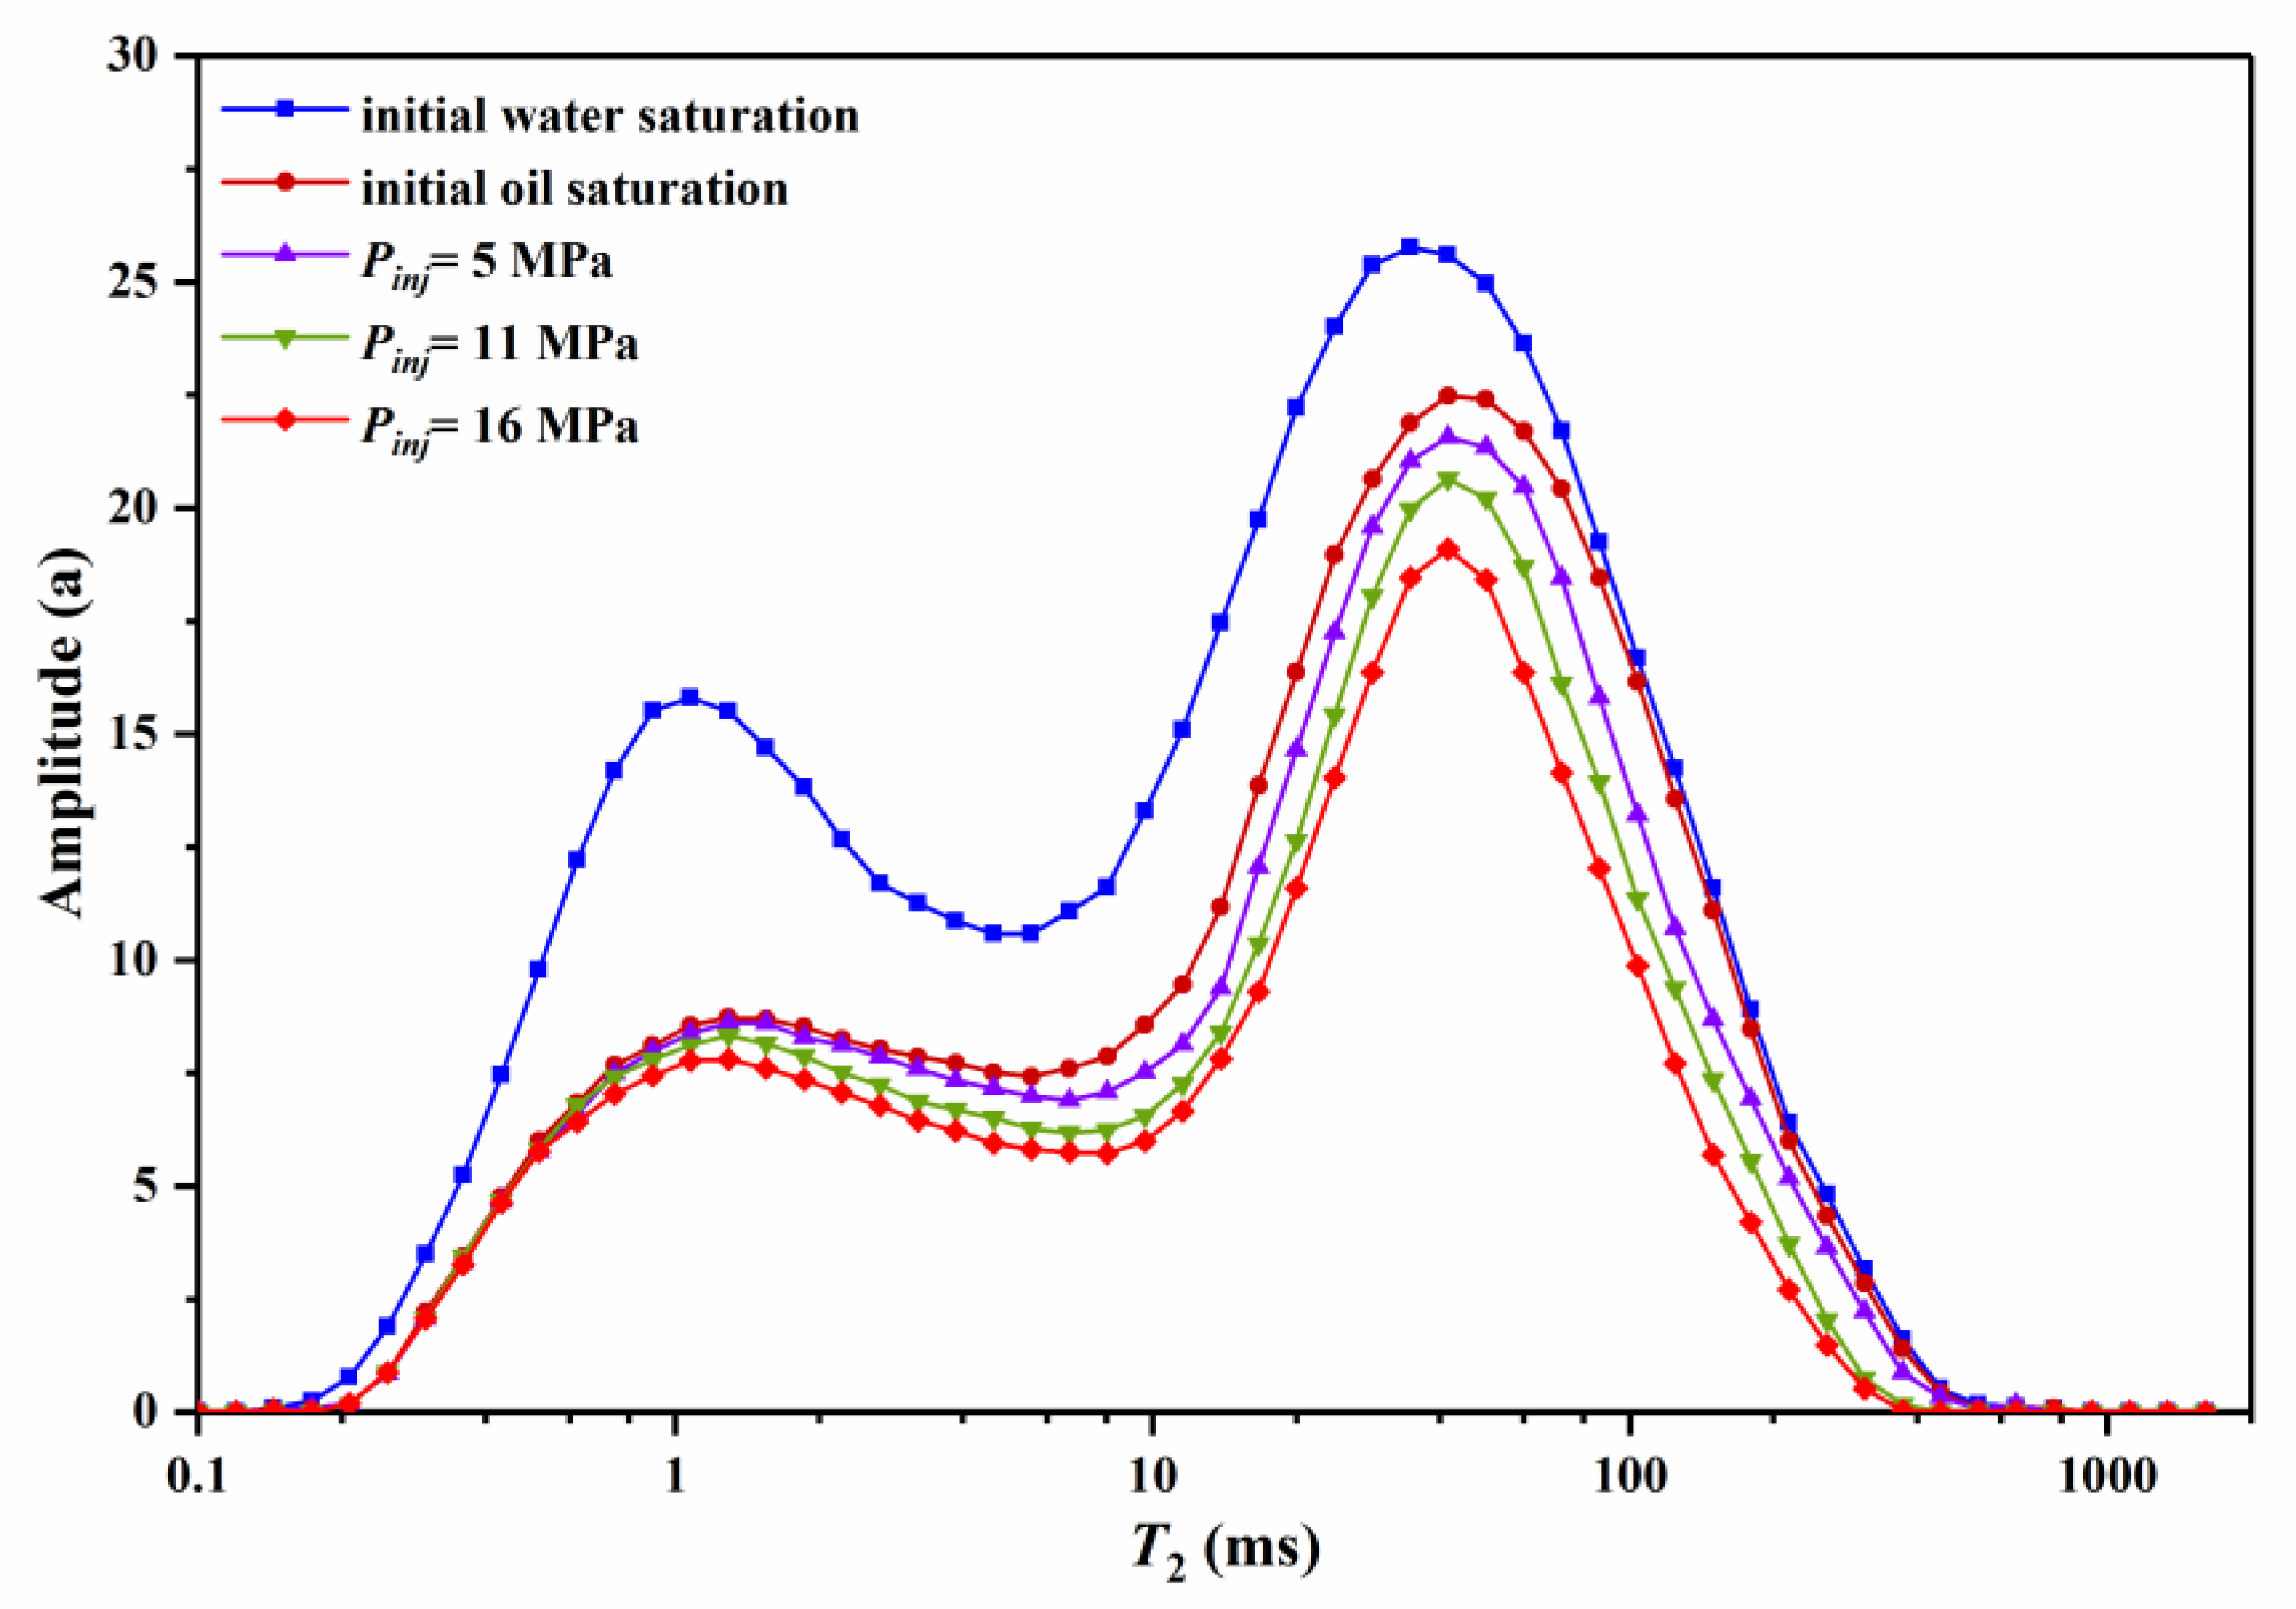
In order to investigate the effect of injection pressure on the microscopic residual oil distribution during CO2 huff-and-puff processes, the NMR technique was applied to measure core #1 after the first cycle of cyclic CO2 injection at injection pressures of 5 MPa, 11 MPa, and 16 MPa. As shown in Figure 11, the pore distribution of core #1 was bimodal with larger slanting degrees from the T2 spectrum of the core saturated with water. The T2 spectrum was artificially divided into four intervals: micro pores (0.1–1 ms), small pores (1–10 ms), medium pores (10–100 ms), and large pores (100–1000 ms). By comparing the differences between the T2 spectrum for core #1 saturated with water and that saturated with oil, the sum of the amplitude in micro, small, medium, and large pores decreased by 43.43%, 35.55%, 16.88%, and 6.14%, respectively. The irreducible water was mainly distributed in micro and small pores.
As shown in Figure 11, the amplitude of the T2 spectrum of medium and large pores (10–1000 ms) decreased homogeneously after the first cycle at different injection pressures. The ORF of the medium and large pores (10–1000 ms) was 10.85%, 21.37%, and 30.42% at the injection pressure of 5 MPa, 11 MPa, and 16 MPa, respectively, whereas the ORF of the micro and small pores (0.1–10 ms) was 4.16%, 9.56%, and 14.30%, respectively. It should be noted that the CO2 injection caused asphaltene precipitation in the pores, which influenced the T2 spectrum measured by the NMR technique [34]. In the CO2 injection process, the CO2 molecules began to occupy the larger pores due to the lower oil-gas phase. The injected CO2 interacted with the crude oil and dissolved in the oil. As soaking progressed, the CO2 gradually diffused into smaller pores. Therefore, the escape of CO2 drove the crude oil into some larger pores. At the same time, the oil in smaller pores swelled and expanded into the larger pores of the core.
Through the variation in the T2 spectrum of core #1 after the first cycle at different pressures and the T2 spectrum of core #1 saturated with oil, the interval of the pore distribution where the oil was recoverable expanded as the injection pressure increased (Figure 11). The lower limit of the pore distribution where the oil was recoverable corresponds to T2 values of 2.68 ms, 1.29 ms, and 0.74 ms at the injection pressure of 5 MPa, 11 MPa, and 16 MPa, respectively. This is because the CO2 overcomes the capillary pressure and enters smaller pores with higher injection pressure [35]. Moreover, when the injection pressure is higher than the MEP, the injected CO2 extracts the oil in the smaller and blind pores, which converts the residual oil into recoverable oil. Therefore, higher injection pressure is beneficial for recovering the oil in smaller and blind pores.

3.2.2. Effect of Cycle Number on Residual Oil

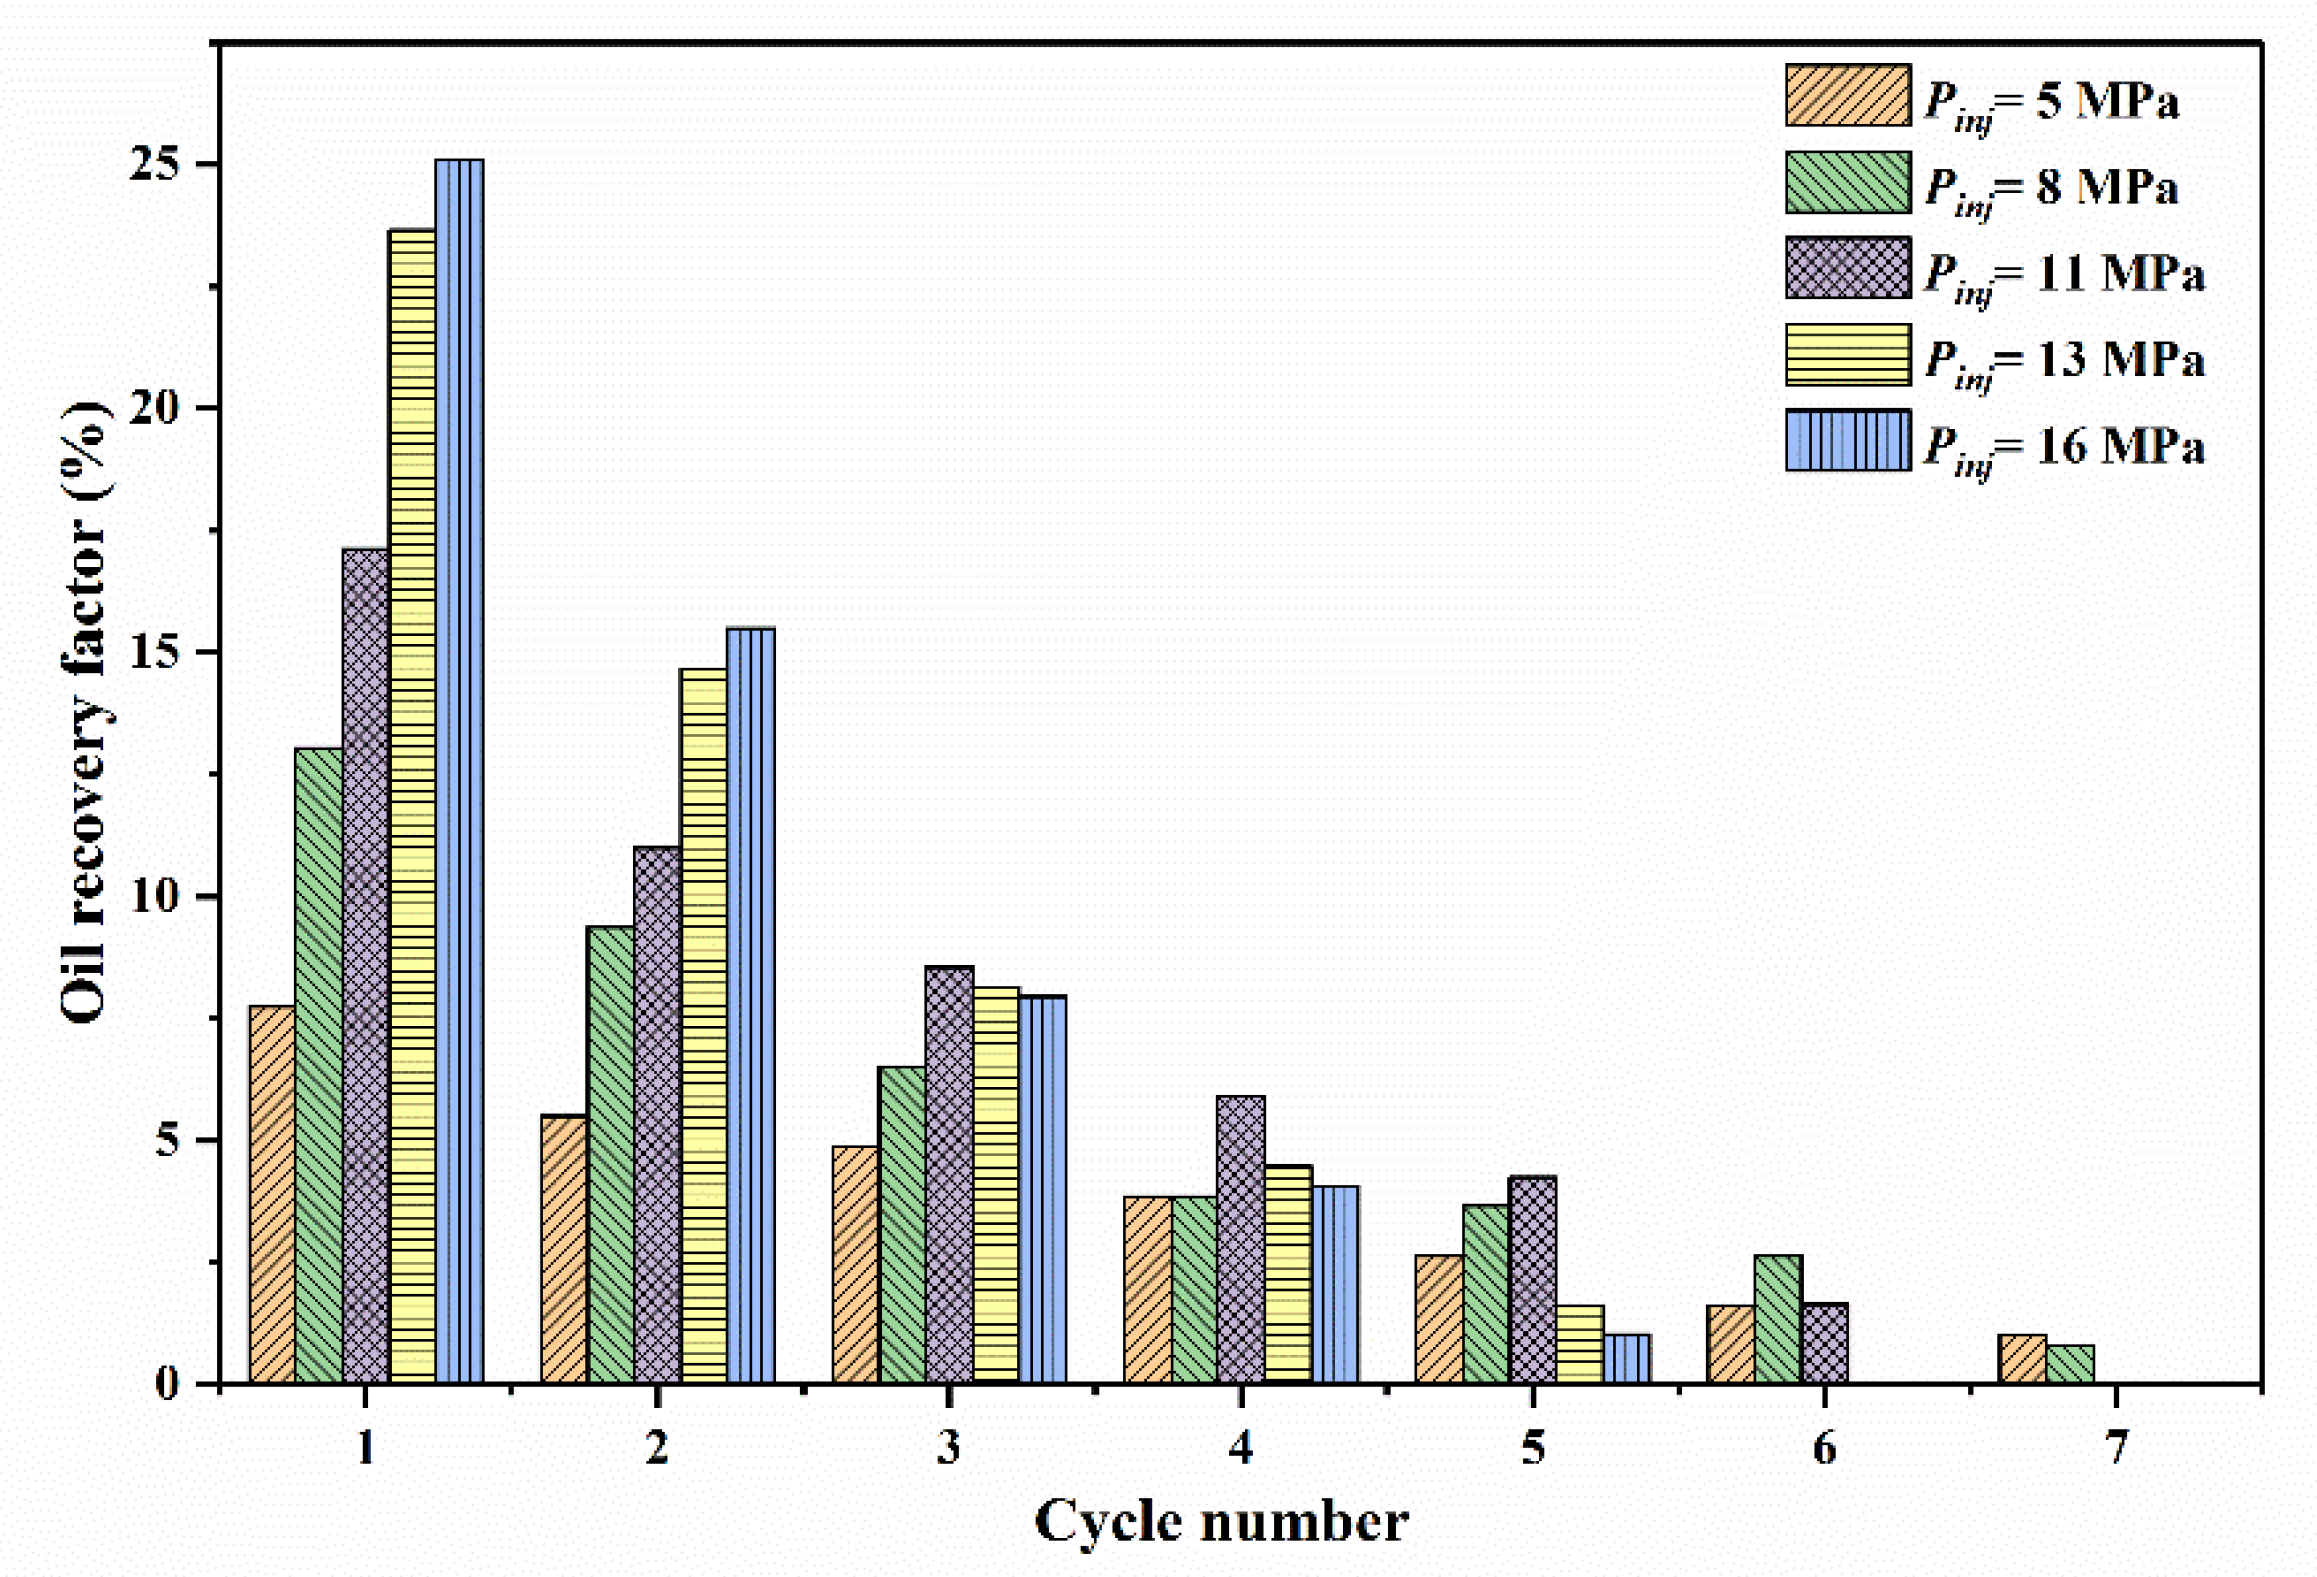
As shown in Figure 12, the ORF in each cycle of different injection pressures decreased with the increase in cycle number. When the injection pressure was higher than the MMP, only five cycles were carried out until no oil was produced. Higher injection pressure is beneficial for improving the ultimate ORF and reducing the cumulative time of the total development process due to fewer huff-and-puff cycles. As a result, a higher production rate was achieved.
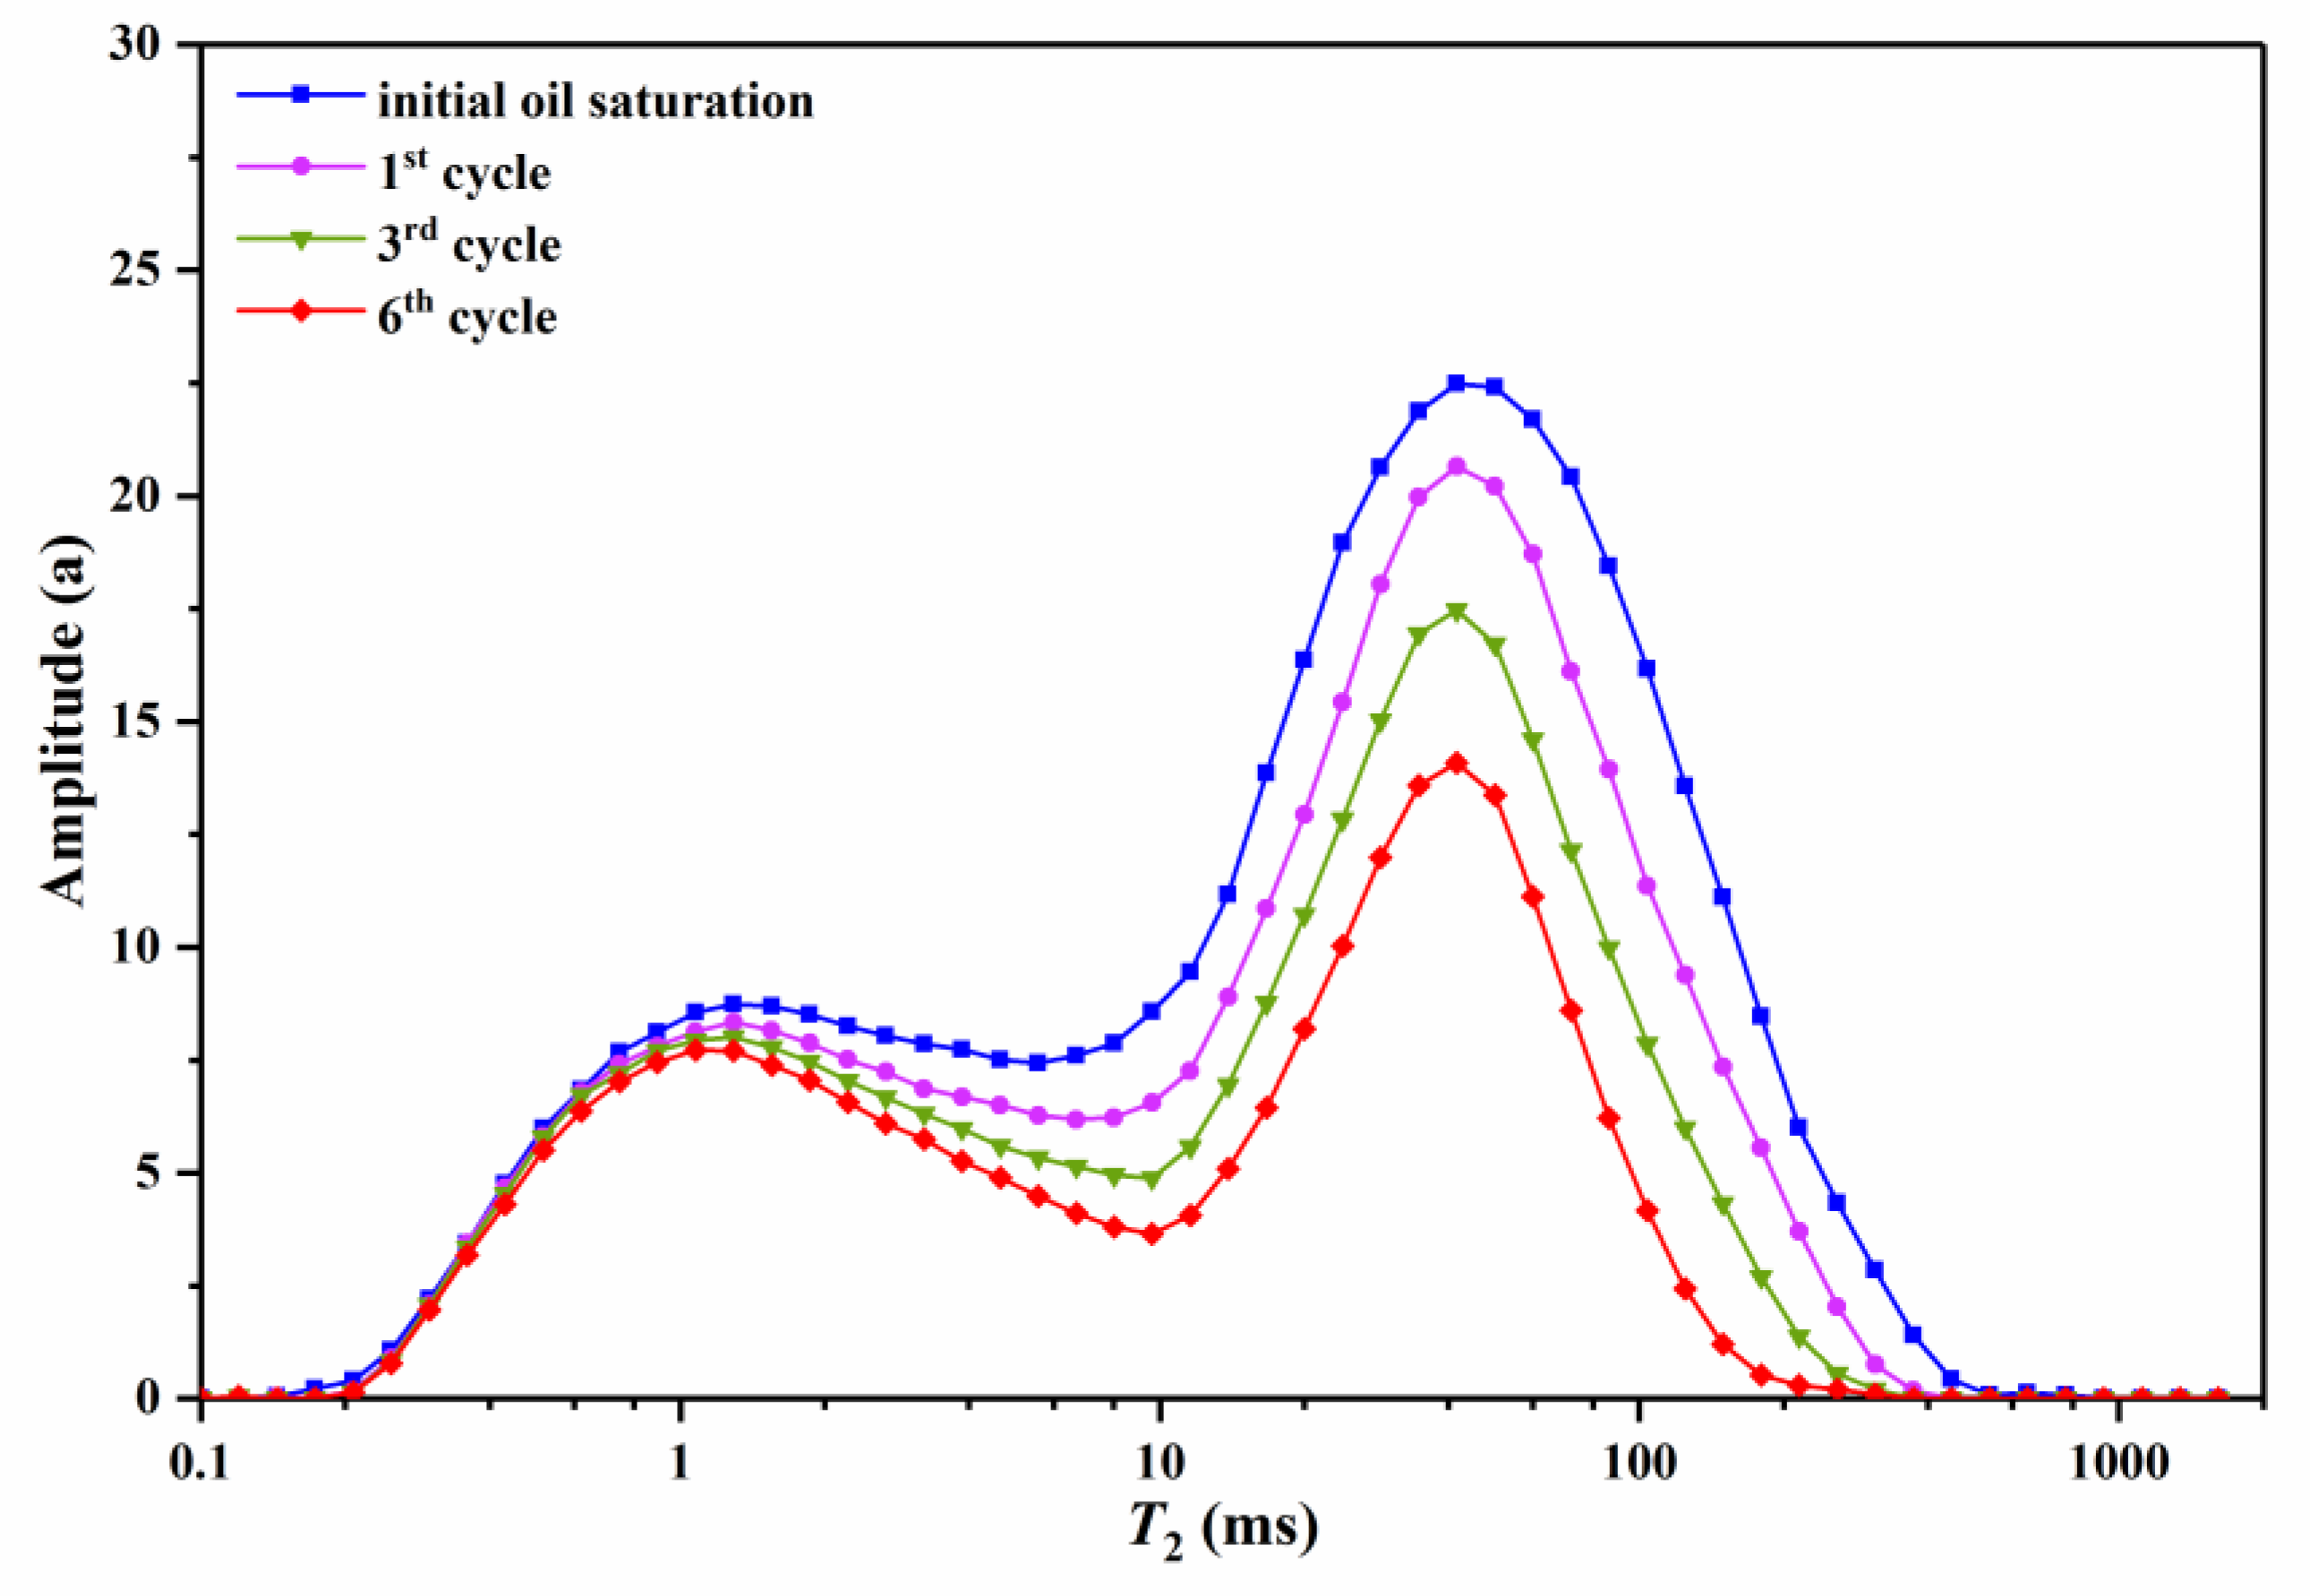
The NMR T2 spectrum for core #1 after different numbers of cycles of CO2 huff-and-puff tests at the injection pressure of 11 MPa is presented in Figure 13. The cumulative ORFs after the first, third, and sixth cycle of core #1 were 17.13%, 36.68%, and 48.48%, respectively. The initial oil saturation and the cumulative ORF contributed by different intervals of pore distribution are shown in Table 2. As the number of huff-and-puff process cycles increased, the ORF contributed by small, medium, and large pores (1–1000 ms) increased significantly, while the oil produced from micro pores (0.1–1 ms) had no obvious changes. The lower limit of the pore distribution where the oil was recoverable also did not increase with increasing cycle number. So, the oil in smaller pores cannot be recovered with increasing the number of huff-and-puff cycles. Residual oil in pores, which was distributed in the range of 1–1000 ms of the T2 spectrum, was still the main force contributing to production.

3.2.3. Effect of Soaking Time on Residual Oil

The range of soaking time in the field scale ranges from several days to tens of days, which has an significant effect on the oil recovery performance of CO2 huff-and-puff [36]. Figure 14 shows the ORF and average recovery rate of the first CO2 huff-and-puff cycle versus the soaking time at the injection pressure of 11 MPa. The extension of soaking time resulted in a noticeable ORF improvement. The average recovery rate is defined as the ORF per hour during an entire huff-and-puff process, including the injection, soaking, and production period. The ORF increased from 13.20% to 23.91% when the soaking time increased from 3 h to 18 h and the average recovery rate decreased from 3.77%/h to 1.29%/h. As the soaking time increased from 18 h to 24 h, the ORF only increased by 1.03%. The contact between CO2 and oil is a dynamic process. The CO2 phase contacts the oil phase completely and dissolves into the oil phase fully with longer soaking time, due to viscosity reduction, oil swelling, solution gas drive, and extraction effect of the injected CO2, to improve the ORF. When the soaking time was longer than 18 h, the dissolved CO2 concentration in the accessible oil tended to be saturated and the dissolution and diffusion rate slowed down. The CO2 had no significant effect on improving the ORF.
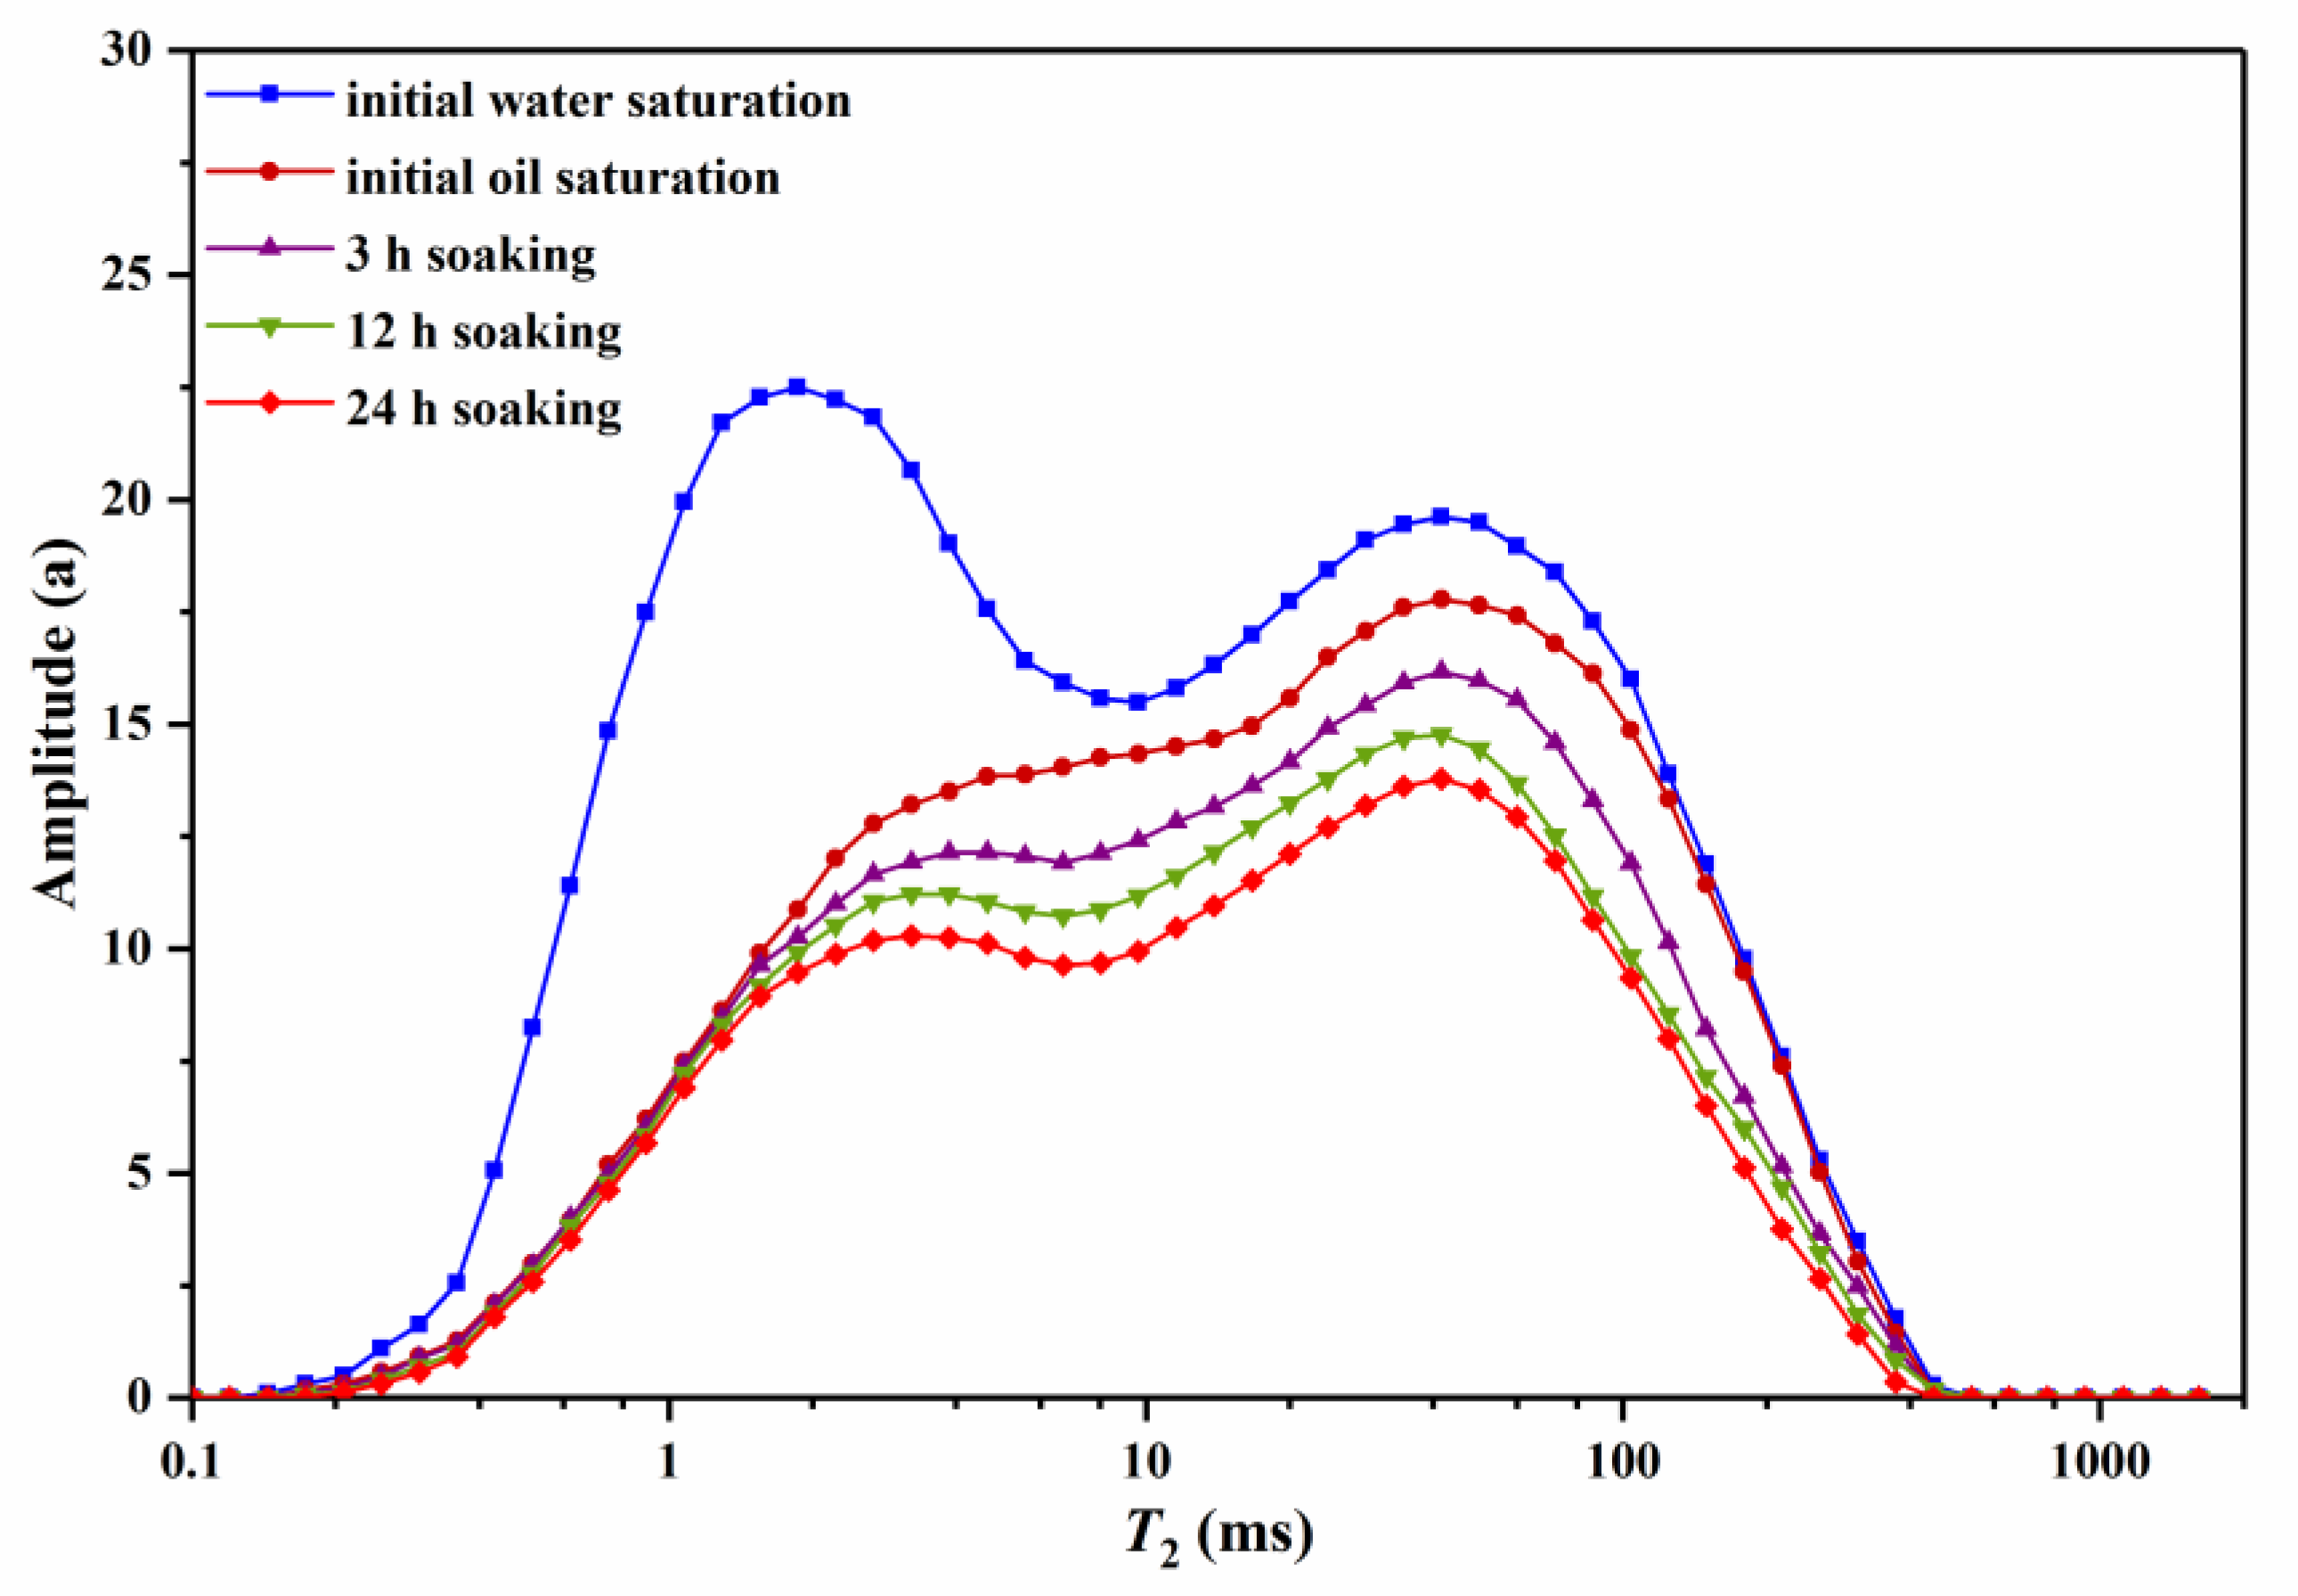
The NMR T2 spectrum for core #2 with different soaking times for the first huff-and-puff cycle at the injection pressure of 11 MPa is shown in Figure 15. The amplitude of the micro pores (0.1–1 ms) had no obvious change. The amplitude of small pores (1–10 ms) decreased by 9.84%, 16.06%, and 22.49% and the amplitude of medium and large pores (10–1000 ms) decreased by 14.38%, 23.37%, and 29.78% with soaking time of 3 h, 12 h, and 24 h, respectively. The residual oil of the interval of pore distribution where the recoverable oil homogeneously decreased with longer soaking time. The lower limit of the pore distribution where the oil was recoverable expanded as the soaking time increased, which means crude oil in smaller pores turns from residual oil to recoverable oil. This is because the injected CO2 dissolved and diffused in smaller pores with longer soaking time. Although the ORF and the recoverable oil increased, the average recovery rate decreased with longer soaking time (Figure 14). Oilfields are usually assigned production tasks with a specified time. Therefore, under the premise of being able to meet the assigned production requirements, longer soaking times can fully exploit the potential of the reservoir and reduce the residual oil in smaller pores within a certain range.

4. Conclusions

In this paper, a phase behavior study was carried out to clarify the CO2 recovery mechanisms during the CO2 injection process. Afterward, a series of CO2 huff-and-puff tests were conducted at various conditions. NMR was used to determine the microscopic residual oil distribution. From this study, the following conclusions were drawn.
The MEP was determined to be 9.51 MPa through oil swelling tests in the visual cell. When the pressure increased higher than the MEP, the hydrocarbon extraction effect played a more dominant role in the CO2-EOR process and the gas-fluid interface became increasingly blurred. In the CO2 huff-and-puff process, the ultimate ORF increased considerably as injection pressure increased, whereas the viscosity of the produced oil in the first cycle decreased from 9.40 mPa·s to 2.44 mPa·, due to the stronger hydrocarbon-extraction capacity of the injected CO2 at higher pressures. As injection pressure increased, a higher ultimate ORF was obtained with fewer cycle numbers, so that a higher production rate was achieved to reach the development capacity of the reservoir.
CO2 overcomes the capillary pressure and enters smaller pores to extract the oil in the smaller and blind pores at higher injection pressure, which converts the residual oil into recoverable oil. Longer soaking time also expands the lower limit of the pore distribution where the oil was recoverable. However, more cycles had no obvious effect on expanding the interval of pore distribution where oil was recoverable, which only homogeneously reduced the residual oil in the medium and large pores (10–1000 ms). Therefore, increasing injection pressure and extending soaking time are effective methods to recover the residual oil in smaller and blind pores within a certain range. The determination of microscopic residual oil distribution is not only beneficial for ensuring the EOR mechanisms in the microscopic pores of the CO2 huff-and-puff, but also for optimizing production parameters to exploit the tight reservoirs to their maximum potential in the shortest possible time.

Author Contributions

Conceptualization, K.Q. and S.Y.; Methodology, K.Q.; Formal Analysis, K.Q.; Investigation, Y.H. and Q.W.; Writing-Original Preparation, K.Q.; Writing-Review & Editing, L.W. and S.Y.; Funding Acquisition, S.Y. and H.D.

Funding

This research was funded by the National Science and Technology Major Project of the Ministry of Science and Technology of China (Grant 2016ZX05016-006).

Acknowledgments

We thank the State Key Lab of Oil and Gas Resources and Engineering at the China University of Petroleum-Beijing (CUPB).

Conflicts of Interest

The authors declare no conflict of interest.

References

  1. Jin, Z.; Firoozabadi, A. Phase behavior and flow in shale nanopores from molecular simulations. Fluid Phase Equilibr. 2016, 430, 156–168. [Google Scholar] [CrossRef]
  2. Zhao, H.; Lai, Z.; Firoozabadi, A. Sorption hysteresis of light hydrocarbons and carbon dioxide in shale and kerogen. Sci. Rep. 2017, 7, 16209. [Google Scholar] [CrossRef] [PubMed]
  3. Dejam, M.; Hassanzadeh, H.; Chen, Z. Pre-Darcy Flow in Porous Media. Water Resour. 2017, 53, 8187–8210. [Google Scholar] [CrossRef]
  4. Dejam, M. Advective-diffusive-reactive solute transport due to non-Newtonian fluid flows in a fracture surrounded by a tight porous medium. Int. J. Heat Mass Transf. 2019, 128, 1307–1321. [Google Scholar] [CrossRef]
  5. Mashayekhizadeh, V.; Kord, S.; Dejam, M. EOR potential within Iran. Spec. Top. Rev. Porous Med. Int. J. 2014, 5. [Google Scholar] [CrossRef]
  6. Ren, B.; Ren, S.; Zhang, L.; Chen, G.; Zhang, H. Monitoring on CO2 migration in a tight oil reservoir during CCS-EOR in Jilin Oilfield China. Energy 2016, 98, 108–121. [Google Scholar] [CrossRef]
  7. Sheng, J.J. Critical review of field EOR projects in shale and tight reservoirs. J. Pet. Sci. Eng. 2017, 159, 654–665. [Google Scholar] [CrossRef]
  8. Sheng, J.J.; Chen, K. Evaluation of the EOR potential of gas and water injection in shale oil reservoirs. J. Unconv. Oil Gas Resour. 2014, 5, 1–9. [Google Scholar] [CrossRef]
  9. Zuloaga, P.; Yu, W.; Miao, J.; Sepehrnoori, K. Performance evaluation of CO2 Huff-n-Puff and continuous CO2 injection in tight oil reservoirs. Energy 2017, 134, 181–192. [Google Scholar] [CrossRef]
  10. Song, C.; Yang, D. Experimental and numerical evaluation of CO2 huff-n-puff processes in Bakken formation. Fuel 2017, 190, 145–162. [Google Scholar] [CrossRef]
  11. Todd, H.B.; Evans, J.G. Improved oil recovery IOR pilot projects in the Bakken formation. In Proceedings of the SPE Low Perm Symposium, Denver, CO, USA, 5–6 May 2016. [Google Scholar] [CrossRef]
  12. Rudyk, S.; Spirov, P.; Sogaard, E. Application of GC–MS chromatography for the analysis of the oil fractions extracted by supercritical CO2 at high pressure. Fuel 2013, 106, 139–146. [Google Scholar] [CrossRef]
  13. Ghedan, S. Global laboratory experience of CO2-EOR flooding. In Proceedings of the SPE/EAGE reservoir Characterization & Simulation Conference, Abu Dhabi, UAE, 19–21 October 2009. [Google Scholar] [CrossRef]
  14. Abedini, A.; Torabi, F. Parametric study of the cyclic CO2 injection process in light oil systems. Ind. Eng. Chem. Res. 2013, 52, 15211–15223. [Google Scholar] [CrossRef]
  15. Cao, M.; Gu, Y. Physicochemical characterization of produced oils and gases in immiscible and miscible CO2 flooding processes. Energy Fuels 2012, 27, 440–453. [Google Scholar] [CrossRef]
  16. Li, H.; Zheng, S.; Yang, D.T. Enhanced swelling effect and viscosity reduction of solvent (s)/CO2/heavy-oil systems. SPE J. 2013, 18, 695–707. [Google Scholar] [CrossRef]
  17. Habibi, A.; Yassin, M.R.; Dehghanpour, H.; Bryan, D. Experimental investigation of CO2-oil interactions in tight rocks: A Montney case study. Fuel 2017, 203, 853–867. [Google Scholar] [CrossRef]
  18. Abedini, A.; Torabi, F. Oil recovery performance of immiscible and miscible CO2 huff-and-puff processes. Energy Fuels 2014, 28, 774–784. [Google Scholar] [CrossRef]
  19. Ma, J.; Wang, X.; Gao, R.; Zeng, F.; Huang, C.; Tontiwachwuthikul, P.; Liang, Z. Enhanced light oil recovery from tight formations through CO2 huff ‘n’puff processes. Fuel 2015, 154, 35–44. [Google Scholar] [CrossRef]
  20. Pu, W.; Wei, B.; Jin, F.; Li, Y.; Jia, H.; Liu, P.; Tang, Z. Experimental investigation of CO2 huff-n-puff process for enhancing oil recovery in tight reservoirs. Chem. Eng. Res. Des. 2016, 111, 269–276. [Google Scholar] [CrossRef]
  21. McLendon, W.J.; Koronaios, P.; Enick, R.M.; Biesmans, G.; Salazar, L.; Miller, A.; Soong, Y.; McLendon, T.; Romanov, V.; Crandall, D. Assessment of CO2-soluble non-ionic surfactants for mobility reduction using mobility measurements and CT imaging. J. Pet. Sci. Eng. 2014, 119, 196–209. [Google Scholar] [CrossRef]
  22. Cui, M.; Wang, R.; Lv, C.; Tang, Y. Research on microscopic oil displacement mechanism of CO2 EOR in extra-high water cut reservoirs. J. Pet. Sci. Eng. 2017, 154, 315–321. [Google Scholar] [CrossRef]
  23. Song, Z.; Zhu, W.; Wang, X.; Guo, S. 2-D Pore-scale experimental investigations of asphaltene deposition and heavy oil recovery by CO2 flooding. Energy Fuels 2018, 32, 3194–3201. [Google Scholar] [CrossRef]
  24. Tiwari, P.; Deo, M.; Lin, C.L.; Miller, J.D. Characterization of oil shale pore structure before and after pyrolysis by using X-ray micro CT. Fuel 2013, 107, 547–554. [Google Scholar] [CrossRef]
  25. Eslami, M.; Kadkhodaie-Ilkhchi, A.; Sharghi, Y.; Golsanami, N. Construction of synthetic capillary pressure curves from the joint use of NMR log data and conventional well logs. J. Pet. Sci. Eng. 2013, 111, 50–58. [Google Scholar] [CrossRef]
  26. Yang, P.; Guo, H.; Yang, D. Determination of residual oil distribution during waterflooding in tight oil formations with NMR relaxometry measurements. Energy Fuels 2013, 27, 5750–5756. [Google Scholar] [CrossRef]
  27. Chen, T.; Yang, Z.; Ding, Y.; Luo, Y.; Qi, D.; Lin, W.; Zhao, X. Waterflooding Huff-n-puff in Tight Oil Cores Using Online Nuclear Magnetic Resonance. Energies 2018, 11, 1524. [Google Scholar] [CrossRef]
  28. Gao, H.; Liu, Y.; Zhang, Z.; Niu, B.; Li, H. Impact of secondary and tertiary floods on microscopic residual oil distribution in medium-to-high permeability cores with NMR technique. Energy Fuels 2015, 29, 4721–4729. [Google Scholar] [CrossRef]
  29. Yang, C.; Gu, Y. Diffusion coefficients and oil swelling factors of carbon dioxide, methane, ethane, propane, and their mixtures in heavy oil. Fluid Phase Equilibr. 2006, 243, 64–73. [Google Scholar] [CrossRef]
  30. Siagian, U.W.R.; Grigg, R.B. The extraction of hydrocarbons from crude oil by high pressure CO2. In Proceedings of the SPE/DOE Improved Oil Recovery Symposium, Tulsa, OK, USA, 19–22 April 1998. [Google Scholar] [CrossRef]
  31. Hoover, W.G. Molecular dynamics. In Molecular Dynamics; Springer: Berlin/Heidelberg, Germany, 1986; Volume 258. [Google Scholar]
  32. Rao, D.N. A new technique of vanishing interfacial tension for miscibility determination. Fluid Phase Equilibr. 1997, 139, 311–324. [Google Scholar] [CrossRef]
  33. Abedini, A.; Torabi, F. On the CO2 storage potential of cyclic CO2 injection process for enhanced oil recovery. Fuel. 2014, 124, 14–27. [Google Scholar] [CrossRef]
  34. Wang, C.; Li, T.; Gao, H.; Zhao, J.; Li, H.A. Effect of asphaltene precipitation on CO2-flooding performance in low-permeability sandstones: A nuclear magnetic resonance study. RSC Adv. 2017, 7, 38367–38376. [Google Scholar] [CrossRef]
  35. Jamaloei, B.Y.; Kharrat, R.; Asghari, K. Pore-scale events in drainage process through porous media under high-and low-interfacial tension flow conditions. J. Pet. Sci. Eng. 2010, 75, 223–233. [Google Scholar] [CrossRef]
  36. Simpson, M.R. The CO2 huff’n’puff process in a bottomwater-drive reservoir. J. Pet. Technol. 1988, 40, 887–893. [Google Scholar] [CrossRef]
Figure 1. Logic structure diagram of this paper.
Energies 11 02843 g001
Figure 2. Gas chromatography (GC) compositional analysis of the crude oil sample.
Energies 11 02843 g002
Figure 3. Schematic diagram of the experimental apparatus used for carbon dioxide (CO2) solubility and oil swelling factor measurements.
Energies 11 02843 g003
Figure 4. Schematic diagram of the experimental setup used for measuring the equilibrium interfacial tension (IFT) between CO2 and crude oil by applying the axisymmetric drop shape analysis (ADSA) technique for the pendant drop.
Energies 11 02843 g004
Figure 5. Schematic diagram of the experimental setup used for CO2 huff-and-puff tests.
Energies 11 02843 g005
Figure 6. CO2 solubility and oil swelling factor at various equilibrium pressures under the reservoir temperature of 61 °C.
Energies 11 02843 g006
Figure 7. The IFT of the CO2-crude oil system at different equilibrium pressures under the temperature of 61 °C.
Energies 11 02843 g007
Figure 8. Images of the CO2-oil interface at different equilibrium pressure during swelling/extraction tests in the visual cell.
Energies 11 02843 g008
Figure 9. Cumulative oil recovery factor (ORF) versus cycle number at different injection pressures (core #1).
Energies 11 02843 g009
Figure 10. Ultimate ORFs, ORFSs of the first cycle and the viscosity of the produced oil in the first cycle of CO2 huff-and-puff tests performed at different injection pressures (core #1).
Energies 11 02843 g010
Figure 11. Nuclear magnetic resonance (NMR) T2 spectrum for core #1 after the first cycle at different injection pressures during CO2 huff-and-puff tests.
Energies 11 02843 g011
Figure 12. ORFs of each cycle number of the CO2 huff-and-puff tests at different injection pressures.
Energies 11 02843 g012
Figure 13. NMR T2 spectrum for core #1 after different cycle numbers of CO2 huff-and-puff tests at the injection pressure of 11 MPa.
Energies 11 02843 g013
Figure 14. The ORFs and average recovery rate of first CO2 huff-and-puff cycle versus the soaking time at an operating pressure of 11 MPa (core #2).
Energies 11 02843 g014
Figure 15. NMR T2 spectrum for core #2 with different soaking times for the first huff-and-puff cycle at the injection pressure of 11 MPa.
Energies 11 02843 g015
Table 1. Basic properties of tight core plug samples.
No.Length (cm)Diameter (cm)Permeability (mD)Porosity (%)Connate Water Saturation (%)
16.6522.5060.8113.3424.49
26.1382.5060.3612.2026.01
Table 2. Initial oil saturation and cumulative ORFs after different huff-and-puff cycles.
Experimental ConditionCumulative ORFs in Different-Sized Pores (%)
Micro
(0.1–1 ms)
Small
(1–10 ms)
Medium
(10–100 ms)
Large
(100–1000 ms)
Sum
Soi57.4564.4582.2594.5875.51
1st cycle4.0212.1615.9637.5917.13
3rd cycle5.8421.1132.1764.4136.68
6th cycle9.7929.2948.2386.1848.48