Coupling Analysis and Performance Study of Commercial 18650 Lithium-Ion Batteries under Conditions of Temperature and Vibration


National Center for Materials Service Safety, University of Science and Technology Beijing, Beijing 100083, China
*
Author to whom correspondence should be addressed.
Energies 2018, 11(10), 2856; https://doi.org/10.3390/en11102856
Submission received: 26 September 2018
/
Revised: 13 October 2018
/
Accepted: 18 October 2018
/
Published: 22 October 2018
(This article belongs to the Special Issue Battery Storage Technology for a Sustainable Future)
Abstract
:At present, a variety of standardized 18650 commercial cylindrical lithium-ion batteries are widely used in new energy automotive industries. In this paper, the Panasonic NCR18650PF cylindrical lithium-ion batteries were studied. The NEWWARE BTS4000 battery test platform is used to test the electrical performances under temperature, vibration and temperature-vibration coupling conditions. Under the temperature conditions, the discharge capacity of the same battery at the low temperature was only 85.9% of that at the high temperature. Under the vibration condition, mathematical statistics methods (the Wilcoxon Rank-Sum test and the Kruskal-Wallis test) were used to analyze changes of the battery capacity and the internal resistance. Changes at a confidence level of 95% in the capacity and the internal resistance were considered to be significantly different between the vibration conditions at 5 Hz, 10 Hz, 20 Hz and 30 Hz versus the non-vibration condition. The internal resistance of the battery under the Y-direction vibration was the largest, and the difference was significant. Under the temperature-vibration coupling conditions, the orthogonal table L9 (34) was designed. It was found out that three factors were arranged in order of temperature, vibration frequency and vibration direction. Among them, the temperature factor is the main influencing factor affecting the performance of lithium-ion batteries.
1. Introduction
At present, the global negative climate changes and international crude oil shortages are promoting the development of electric vehicles (EVs), and it is expected that the predictable continuous cost optimization of the battery pack will give a boost to global EVs market by 2030 [1]. The automotive industry is undergoing a major change. In order to gradually replace fossil fuel, pure electric vehicles (PEVs) and hybrid electric vehicles (HEVs) use fuel cells or power batteries to drive engines, and the manufacturers are developing comprehensive and mature battery management systems (BMSs) [2]. Lithium-ion batteries have the advantages of high specific energy, high energy density, low specific self-discharge rate, etc. Mass production of standardized 18650 lithium-ion batteries in large quantities would further reduce the costs of the cars, thus they are expected to become the main power source of EVs. The Tesla Model 3 uses the 18650 cylindrical batteries manufactured by Panasonic [3], with thousands of batteries connected in series and parallel to form a battery system; indeed, the 85 kWh battery system of the Tesla Model S uses nearly 7000 Panasonic NCR18650PF (3.1 Ah) batteries [4]. The performance of these batteries is affected by the actual environmental conditions (such as high temperatures, low temperatures and road vibrations), which will determine the mileage and the life expectancy of the EVs [5,6]. In fact, this will be reflected in several batteries performance metrics, such as the maximum capacity, the resistance, the rate capability and the degradation mechanism [7]. Therefore, it is necessary to study the battery performance by considering factors such as temperature and vibration conditions under the actual working conditions of EVs.
The discharge performance of batteries will be greatly affected under the high temperature and the low temperature conditions when EVs are driven in different regions (such as the Northeast China or the South China), and different cold or hot seasons (such as the winter or the summer). It was reviewed in [8] that the effects of cold temperatures on the capacity of lithium-ion battery indicate poor battery performance in low temperature conditions. It was shown in [9,10,11] that the temperature of the battery surface is different from the ambient temperature during the normal operation, and the electrical characteristics of batteries are affected. The thermal generation behavior of 18650 ternary LiNi0.5Co0.2Mn0.3O2 batteries in a working environment at 30 °C and 50 °C indicates that the temperature difference of the surface of the battery is high, resulting from an increase in internal resistance [9]. The instantaneous internal temperature detected in a commercial 18650 LiCoO2 lithium-ion battery can reach 95 °C in the event of a failure [10]. In [11], the temperature rise of battery packs of PEV was studied, and the maximum temperature of the battery packs can reach 61.7 °C while the ambient temperature is 40 °C when the EV runs for 1 hour at a speed of 89 km/h, and the minimum temperature of the battery packs can reach 8.8 °C while the ambient temperature at −20 °C. In low temperature environments, the discharge performance of batteries is even worse, affecting the mileage of the EVs. In [12], the discharge behavior of the 18650 battery over a temperature range from 230 K to 320 K was observed, and abrupt graphite phase transformation was noted. In [13], the charge-discharge test of lithium-ion batteries under low temperature conditions was carried out, and the discharge capacity was reduced by 12.5% and the voltage platform was reduced by 0.53 V when the ambient temperature was −20 °C. However, the battery heat generation at a low temperature causes the surface temperature of the battery to rise which makes the actual temperature to be higher than the ambient temperature. Therefore, the superposed effects of temperature rises resulting from battery heat generation should be considered.
In recent years, the influence of vibration factors on batteries, battery packs, and battery modules has gradually gained attention, and relevant scholars have carried out experimental studies and road condition measurements. When EVs are driving on highways, urban roads and mountain trails, the discharge performance of the battery will be affected by vibration conditions such as the body vibrations of vehicles caused by the bumpy road and the chassis vibrations caused by the motor.
An increase of the ohmic internal resistance of the cylindrical Nickel Manganese Cobalt Oxide (NMC) 18650 lithium-ion batteries after vibration tests was reported in [14], therefore car manufacturers should pay much attention to vibration factors. In [15], cylindrical Nickel Cobalt Aluminum Oxide (NCA) 18650 lithium-ion batteries were degraded after road vibrations, and their electrical and mechanical properties were affected. In [16], the performance of the energy storage systems of EVs was examined by comparing the shock response and fatigue damage spectra of vibration test standards. The vibration durability of commercial 18650 lithium-ion batteries was studied in [17], and the battery degradation was evaluated by testing the battery’s discharge capacity, the battery internal resistance and the natural frequency. The vibration test standard methods and analysis feature results are different, therefore pouch and cylindrical cells are stressed with vibrational and shock profiles according to the UN 38.3 standard in [18]. In [19], the lead-acid battery subjected to vibration conditions was simulated, and the vibration shock signal was loaded at both ends of the battery, and the battery charge and discharge current was observed to evaluate the battery performance. In [20], the vibration characteristics of EVs were measured during the driving process and the existing vibration standard methods were compared, and it is pointed out that the vibration tests should be carried out in three directions. In [21], an aluminum-laminated cell packaging of HEVs was tested for mechanical and electrical durability according to three different types of vibration methods and the results met the durability standards need for vehicle applications. Vibration tests of battery modules used for EVs were researched in [22], and the results showed that the AC internal resistance of the lithium-ion battery module showed no obvious changes before and after the vibration, however, an increase in the DC internal resistance and a decrease in the charge capacity of the battery module were discovered. Studies simulating the impact of the actual road vibration conditions under laboratory environmental conditions have been successfully carried out. The effects of random vibration tests on cylindrical NCR18650BE lithium-ion batteries were studied in [23], whereby the batteries were loaded with vibration conditions for a period of time, then the characteristics of batteries were measured, and it was reported that the DC internal resistance of the battery increases, the discharge capacity decreases, and the vibration deteriorates the battery performance.
The above research literatures focus on the influence of a single factor (temperature or vibration). If the ambient temperature factor is not controlled during a vibration test, it is likely to create differences in the battery results due to the temperature factor. Therefore, the effects of temperature and vibration coupling factors on the battery should be considered. In the actual conditions of EVs, batteries are discharging under the complex influence of temperature factors in different regions and vibration factors in different road conditions, so the safety, the durability, and the uniformity of batteries in complex conditions were studied and reviewed in [24] for optimizing the battery management system (BMS).
Some scholars have studied the influence of temperature and vibration environmental factors on battery performance in complex conditions. In [25], data from a commercial EV battery system was collected data in normal operation mode, and a battery operation model focusing on the three key factors of vibration, temperature and current was established. In [26], a battery pack model with thermal consideration was studied. To determine the state-of-charge and temperature of the LiFePO4 battery working in a real environment, the proposed model provided a coupled equivalent circuit and convective thermal model. In [27], a power battery was placed in an EV and subjected to long-term road vibrations, and then a structural analysis to evaluate the mechanical integrity of the battery pack was performed. In a study on the capacity degradation of LiMn2O4/graphite batteries in [28], it was found that the battery capacity is more easily degraded under the alternating temperature and vibration conditions than under constant temperature single working conditions, and the alternating internal resistance increases more rapidly.
In the field of drone equipment battery applications, researchers have also considered complex environmental conditions. In the cases of a household appliance loaded with a fuel cell and a drone loaded with lithium-ion battery in [29], it was found that the vibration caused the internal temperature of the battery to rise, and the authors believed that the sudden change of vibration and ambient temperature could cause the battery to overheat which can lead to an explosion. In a reliable test for a GE sodium-nickel chloride battery (E4810) in [30], the mechanical shock and the vibration testing of batteries and the life testing in thermal environments were studied. In [31], the performance of a battery power system and its accuracy estimation was the focus and a model that considered ambient temperature and cell temperature was proposed.
In experiment tests of the influence of temperature and vibration factors on lithium-ion batteries, it is necessary to comprehensively combine different temperatures and different vibration factors, and the tests are usually repeated several times to reach a conclusion, thereby facing disadvantages such as a large amount of test materials and time costs, so the orthogonal test method can generally be used for studying the effects of multiple factors.
In recent years, orthogonal tests of the performance of lithium-ion batteries have been reported. Researchers have applied orthogonal tables to investigate the effects of multiple factors on the thermal performance of batteries, focusing on the thermal management of battery packs [32,33,34]. The forced air cooling system was optimized in [32], and the influences of three factors (the air-inlet angle, the air-outlet angle and the width of the air flow channel) were considered. Then these three structure parameters were optimized by single factor analysis and orthogonal test methods. In the design of structural parameter of the model in [33], researchers considered four parameters, namely the width of the cooling channel (L), the height (H), the velocity of coolant (V) and the number of channels (M), therefore a L16 (44) orthogonal array was selected to design sixteen models to study and quantify the optimal combination model. In [34], an orthogonal table with four factors and three levels was selected to optimize the maximum temperature of the liquid cooling heat dissipation structure of the battery pack. Some research scholars have applied orthogonal experiments to study the performance of fuel cells in [35,36]. In [35] orthogonal test methods were used to study the effects of complex environmental conditions on fuel cell performance, and four factors were arranged: the air flow, the air pressure, the hydrogen pressure and the working temperature. The authors in [36] used orthogonal test methods to rank five factors: the air humidity, the hydrogen humidity, the air equivalent, the hydrogen equivalent and the operating temperature, and the test results showed that the air equivalence ratio was the main factor affecting the performance of the fuel cell. Some authors have applied orthogonal experiments to study the performance of lithium-ion batteries. The key stress factors responsible for the capacity loss of commercial LiCoO2/MCMB lithium batteries were studied in [37], and the authors ranked four factors: the temperature, the discharge rate, the platform voltage and the discharge depth.
Through reviewing the large volume of literature above, it is apparent that our knowledge of the factors that affect the performance of lithium-ion batteries is still insufficient. When the tests focus on the single temperature factor, the vibration factor can be better controlled; and when they focus on the single vibration factor, the temperature factor should also be controlled, so the temperature and vibration factors should also be considered comprehensively in the actual use of lithium-ion batteries. Therefore, the temperature conditions should consider the effects of high temperature, normal temperature and low temperature conditions, and the vibration conditions should be considered to study the influence of different vibration frequencies and different vibration directions. In this paper, the effects of battery performance under temperature or vibration environment factors were studied. Section 2 introduces the test equipment and test methods. Section 3 focuses on the performance of the lithium-ion batteries under the temperature conditions. Section 4 focuses on the performance of the lithium-ion batteries under the vibration conditions. The battery performance under the temperature-vibration coupling conditions is studied in Section 5, and some conclusion are drawn in Section 6.
2. Experiment and Methods
2.1. Experimental Equipments
2.1.1. The Test Incubator for Controlling Temperature
When EVs are running in different regions and seasons, the changes of temperature of lithium-ion batteries will have a great impact. Especially under extremely low-temperature conditions, the lithium-ion batteries may not discharge completely, which leads to a decline of the EV’s performance. Under laboratory conditions, an Indelb-T12R test incubator (Indelb, Zhongshan, China) can provide high and low temperature environmental conditions in a thermostatic experiment. The test incubator has a high temperature range of 25 °C to 55 °C by heating and a low temperature range of 10 °C to −18 °C by cooling. In order to accurately measure the battery surface temperature and the ambient temperature, a high precision HT-9815 industrial digital display thermocouple thermometer (XINTEST, Beijing, China) was used in the experiments. More detailed equipment parameters can be found in the Supplementary Material of this paper.
2.1.2. The Vibration Test Bench
When an EV travels in a bad and harsh road environment, lithium-ion batteries are affected by the vibrations caused by the road surface undulation. Under the laboratory conditions, a ZD/LX-XTP-VT700 test bench (Huayi Technology, Shanghai, China) which features fully automatic six-degree and electromagnetic suction, was applied to apply the different test conditions of different frequencies and different directions, such as the sinusoidal vibration, the random vibration, the fixed-frequency vibration, the sweeping vibration, etc. More detailed equipment parameters can be found in the Supplementary Material of this paper. In the experiments, in order to rigidly fix the lithium-ion batteries, a battery test special fixture was used on the test bench of vibration to perform battery charge and discharge tests.
2.1.3. The Temperature-Vibration Coupling Bench
In the real world EVs are running under different temperature and different vibration conditions, so in the laboratory environment, temperature and vibration coupling conditions should be considered comprehensively. In the laboratory environment, in order to achieve the rigid assembly of the test bench of vibration and the thermostatic test incubator, a transition shaft and a coupling shaft are designed to realize the coupled condition loading of the temperature and vibration environment. The test platform is shown in Figure 1.
2.1.4. The Battery Test System Platform
In this paper, a NEWWARE BTS4000 battery test system platform (NEWARE, Shenzhen, China) was used. The BTS4000 platform has eight independent 10 V/±6 A channels. By configuring an intermediate router and a computer equipped with the control software, it can complete charge and discharge tests in complex conditions.
2.2. Methods
The batteries in the experiment were cylindrical Panasonic NCR18650PF (Panasonic, Osaka, Japan), with a NCA cathode and a graphite anode with a rated capacity of 2.9 Ah. The discharge characteristics of the battery are significantly different in the different high and low rate. In generally, the low-rate is at 1/3 C-rate and below, the high-rate is at 1/3 to 3 C-rate. Eight NCR18650PF batteries were discharged at room temperature at constant current 0.1, 0.2, 1/3, 0.5, 1, 1.5 and 2 C-rates, and their discharge capacity is shown in the Table 1. As can be seen from Table 1, the discharge capacity decreases in turn as the discharge rate is increasing at 0.1, 0.2, 1/3 C-rate, however, the discharge capacity increases in turn as the discharge rate is increasing at 0.5, 1, 1.5, 2 C-rate. The BTS4000 channels limit the large discharge current value, and the discharge requires more discharge time at the low-rate. Therefore, batteries discharge tests were carried out at a constant 1 C-current rate.
The electrical performance of the lithium-ion batteries is a key factor in determining the performance of an electric vehicle (such as mileage, acceleration, etc.), and environmental factors (such as temperature or vibration conditions) have a significant impact on the electrical performance of the lithium-ion batteries. In the experiments, the initial performances of the same batch of batteries were tested. The capacity at 1 C-rate was used. The goal was to study how battery performance is affected by environmental conditions. Therefore, testing new batteries is necessary. Then, the batteries were grouped into the temperature working condition, the vibration working condition and the temperature-vibration coupling working condition factors to test the influence of the battery performance under various working conditions. The specific test method is shown in Figure 2.
3. Performances of Batteries under Temperature Conditions
EVs are running on the actual road under different temperature conditions, and their performance features such as state of charge (SOC) and EV mileage are affected. Referring to the Beijing area in China, the ambient temperature will fluctuate up and down throughout the year, the low temperature in winter can reach −10 °C, the high temperature in summer can reach 35 °C, and the temperature on the asphalt road surface will reach 50 °C. Therefore, in order to study the performances of the battery under temperature conditions, it is decided to divide the temperature conditions into five temperature gradients for experimental research, that is, five temperature gradients from low to high, such as −15 °C, 0 °C, 15 °C, 30 °C, and 45 °C. During the test, the battery generates heat under charging and discharging conditions, resulting in an increase of the surface temperature of the batteries. Therefore, the battery is tested with a temperature control factor equal to the temperature at which the ambient temperature and the heat rise temperature are equalized.
3.1. Discharge Curve and Battery Resistance Performance under High and Low Temperature Conditions
The batteries were put in the test incubator, and the ambient temperature was controlled at a low temperature of −15 °C. The batteries are discharged with a constant current discharge (CC_Dchg) and fully charged with a constant current constant voltage charge (CC-CV_Chg), according to the specific parameters and test procedures shown in Table 2. All the batteries in the test are fully charged at the same capacity using the CC-CV_Chg process. The efficiency of the battery can be evaluated by its Coulombic efficiency (CE), which is defined as the ratio of the capacity that can be taken from the battery during discharge to the capacity that can be taken from the battery during charging. That is, CE = (Discharge capacity/Charge capacity) × 100%. Using the data in Table 2, the CE value can be calculated as 98.04%.
The 100% SOC batteries were allowed to stand for 30 min in order to achieve a full and uniform thermal equilibrium between the battery surface temperature and the ambient temperature. The battery was subjected to constant current discharge with a current of 1 C, and the cutoff voltage was 2.5 V. The constant current discharge above steps was repeatedly loaded under conditions of temperature gradients of 0 °C, 15 °C, 30 °C and 45 °C. The discharge curves of batteries under different temperature gradients are shown in Figure 3.
The basic performances of the batteries can be reflected in the discharge curve and can be divided into three stages in a complete discharge. The first stage is the phase in which the terminal voltage drops rapidly. It can be seen from Figure 3 that the initial discharge voltages are 4.09 V, 4.05 V, 3.98 V, 3.93 V and 3.73 V under the five temperature gradient conditions of 45 °C, 30 °C, 15 °C, 0 °C and −15 °C respectively. Therefore, the lower the battery ambient temperature, the lower the initial discharge voltage.
The second stage is the phase of discharge platform formation. When the temperature is between 15 °C and 50 °C, the battery can stably discharge and the discharge voltage is stable for a long time, so the discharge platform has obvious characteristics; when the temperature is between −15 °C and 0 °C, the discharge voltage drops rapidly and the battery discharge state ends quickly, and the discharge platform is not obvious. Therefore, the voltage drops slowly during a period of time to form a discharge platform, as the power is continuously discharged.
At the same time, under the temperature conditions of 0 °C and −15 °C, there is a small jump in the initial stage of the discharge platform. The reason is that the discharge heat generation of the battery at a low temperature causes the internal temperature of the battery to rise, and the electrochemical reaction inside the battery is active, thereby exhibiting a phenomenon that the discharge voltage rises. Further research, the temperature increase of the battery in the tests was studied. The cell 5 and cell 6 batteries were placed in a low temperature environment of −15 °C. The surface temperature of the batteries was measured by the HT-9815 thermocouple thermometer in real time, and the temperature increase in Figure 4 was observed. It can be seen that the surface temperature of the battery at the end stage of the constant current discharge reached its maximum value. The surface temperature of the battery cell 6 increased from −9.4 °C to a maximum of 10.0 °C, and the surface temperature of the battery cell 5 increased from −10.9 °C to a maximum of 8.1 °C. The result of the superposition of ambient temperature and battery heat generation temperature is the temperature of the battery surface. The temperature value in the paper is the surface temperature of the battery.
The third stage is the end of discharge phase. It can be seen from Figure 3 that in the high temperature environment, the battery discharge time is longer, and this stage is pushed back and lasts longer; however, in the low temperature environment, the battery discharge time is relatively short, and the cutoff voltage falls rapidly. Therefore, at this stage, the amount of discharged capacity can be reduced, and the discharge voltage drops sharply. After the specified cutoff voltage is reached, the discharge should be stopped to avoid the danger of overdischarging the battery.
Therefore, different environmental temperature conditions have obvious effects on the discharge voltage, discharge duration, discharge platform and state characteristics of the batteries under various stages of discharge.
The internal resistance is an important parameter to evaluate the performance of a battery. The accurate measurement of internal resistance is vital. The step method was applied in tests. According to the Freedom CAR power battery test manual, the hybrid pulse power characteristic test (HPPC) can be used to test the internal resistance [38]. When the current has a sudden change, the voltage drop caused by Ohmic polarization changes instantaneously completes the transient process with the approximation exponential until the voltage returns to a steady-state voltage value. Assuming that the initial voltage before the current changes is U0 and the voltage after the moment the current changes is U1, the current is I, Equation (1) for calculating the ohmic resistance is as follows:
The Ohmic internal resistance is the contact resistance formed by internal parts such as the electrode material, the electrolyte and the separator, and the polarization internal resistance is the resistance caused by the polarization phenomenon in the electrochemical reaction of the battery. Figure 5 shows the Ohmic internal resistance and polarization internal resistance of the battery at different ambient temperatures.
It can be seen from Figure 5 that when the ambient temperature is between 45 °C and 15 °C, the Ohmic internal resistance and the polarization internal resistance of the battery increase slightly with little change, and the values are concentrated in the range of 0 to 50 mΩ; when the ambient temperature is between 15 °C and −15 °C, the Ohmic internal resistance and the polarization internal resistance of the battery rise sharply, and the values are concentrated in the range of 50 to 200 mi. Therefore, as the ambient temperature decreases, the resistance of the battery continues to rise, and the resistance of the battery in a low temperature environment is about three times that of the battery in a high temperature environment.
Therefore, as a whole view, at the stage of the discharge platform, when the ambient temperature decreases, the internal resistance of the battery is gradually increased. At the same time, as the ambient temperature decreases, the discharge voltage of the battery is gradually lowered. The reason is that the internal resistance of the battery is sharply increased, resulting in an increase of voltage drop on the internal resistance, and thus the discharge voltage is lowered.
3.2. Discharge Capacity of Batteries under High and Low Temperature Conditions
The discharge capacity of the battery is an important feature to characterize the electrical performances of the battery. As shown in the histograms in Figure 6, the discharge capacity obtained by discharging the battery at a constant current of 1 C under different temperature conditions was analyzed by the comparisons. As the temperature decreases, the discharge capacity tends to decrease linearly.
In the high temperature environment of 45 °C, the electrochemical reaction is active, and the discharge capacity is 2.849 Ah when the battery is completely discharged. However, the battery discharge in the low temperature environment of −15 °C is incomplete, so the discharge capacity is 2.448 Ah, or 85.9% of the former. Therefore, the lower the temperature, the less the discharge capacity of batteries. Especially when the temperature is lower than −10 °C, the discharge capacity decreases and the phenomenon is particularly noticeable.
The performances of batteries in a low temperature environment are drastically deteriorated, that is, the discharge capacity is significantly lowered, and the internal resistance rises sharply. It can be considered that the increase in internal resistance causes a decrease in discharge capacity.
The discharge performance of the batteries at a low temperature has a great influence, therefore, a comparative study on the low temperature performance is particularly conducted. The tests were paid more attention to the impact of low temperature conditions on battery performance, and summarized the effects from the evaluation characteristic of battery capacity. As shown in Figure 7, battery temperature conditions were monitored in five steps which are charge, rest, discharge, rest and discharge, respectively.
- The batteries were fully charged at room temperature.
- The batteries were rested for one hour.
- Then the battery cell 9–14 in a low temperature environment (−15 ± 2 °C), and the battery cell 15/16 are at room temperature (18 ± 2 °C) discharged at 1C rate constant current.
- All eight batteries were again rested for one hour at room temperature in order to maintain the electrochemical state balance.
- Then all eight batteries continued to discharge at room temperature in order to obtain the remaining discharge capacity (also called pro-discharge capacity).
Table 3 shows the discharge capacity of four batteries in a low temperature environment and two batteries in a room temperature environment obtained under a constant current discharge at a 1 C rate. From the data analysis, the discharge capacity of the batteries in a low temperature environment is significantly lower than that in a room temperature, the former being about 88%–90% of the latter. This is consistent with the previous conclusions in Section 3.1 about the reduction in discharge capacity at low temperatures and is verified again.
The discharge capacity (the blue bar) and pro-discharge capacity (the red bar) of batteries were drawn in stacked histograms in Figure 8. It can be seen from the graph that there are a lot of pro-discharge capacity of batteries in the low temperature environment of −15 °C, while there are almost no pro-discharge capacity of batteries in the room temperature environment of 18 °C. When the batteries were discharged in a low temperature environment, the electrochemical activity of the battery is not active, resulting in a decrease in the discharge capacity. Then, after being placed in a normal temperature environment, the battery performances are improved, and the battery can continue to work and release more pro-discharge capacity. However, after the batteries are discharged in a normal temperature environment, there is almost no pro-discharge capacity.
Therefore, the discharge capacity of batteries in a low temperature environment is lowered, but after the ambient temperature rises, the batteries can discharge the remaining discharge capacity. The remaining discharge capacities in low temperature are 0.1371 Ah, 0.1081 Ah, 0.1073 Ah, 0.1254 Ah, 0.1205 Ah, and 0.1185 Ah, respectively.
The two values of discharge capacity of the batteries are added to obtain the total discharge capacity, and the ratio of the total discharge capacity to the initial discharge capacity is the depth of discharge (DOD). Figure 9 shows the DOD of four batteries in a low temperature environment and two batteries in a normal temperature environment. As can be seen from the figure, the DOD of the batteries in a low temperature environment is about 94%, and the DOD of the batteries in a normal temperature environment is about 99%. The remaining discharge capacity of the batteries can be released after the temperature is improved. From the test data and Figure 9, the total discharge capacity of the batteries in the low temperature environment is still small.
Therefore, the temperature gradient in different environments has a significant impact on the discharge capacity of power batteries. When EVs are used in low temperature environments, the battery discharge capacity is reduced and the mileage is significantly shortened. When EVs are running in a low temperature environment, the thermal management system should be heated to ensure that the battery is discharged at a suitable temperature.
4. Effects of Vibration Conditions on Battery Capacity and Resistance Performance
The batteries, modules and packs in EVs are subject to vibration conditions from the outside environment, caused by the harsh road surface and the interior of the car body. The vibration excitation mainly involves the excitation of the harsh road surface and the excitation of the vehicle body caused by the motor operation. The excitation frequency of the vehicle chassis and battery pack is generally around 20 Hz. The excitation frequency of a good smooth road surface is only about 5 Hz. When the speed of an EV is 40 km/h in an urban area, the explosion frequency of the engine is about 40 Hz. Therefore, the vibration frequency range in the test is set to 5 Hz–50 Hz [39,40].
In order to study the effects of vibration on the electrical performance of the battery under laboratory conditions, vibration tests were carried out by reasonably simulating actual vibration conditions. The same batch of batteries was selected, and the test data of electrical performance before and after vibration were recorded as the control sample and the test sample, respectively.
In this section, the focus is on trying to answer and solve whether the vibration conditions have an impact on battery performance and give a conclusion explaining the good or bad results.
4.1. Wilcoxon Rank-Sum Test on Battery Discharge Capacity under Vibration Conditions
The batteries were charged with a constant current of 1 C to 4.2 V on the BTS4000 battery tester, and were kept on the full state. The batteries were then discharged with a constant current of 1-C under vibration conditions with a vibration frequency of 5 Hz, applied in the Z-direction. The test was carried out under constant environmental conditions of 18 ± 3 °C. After the vibration test was finished, the batteries were allowed to stand for a while, and then the batteries were fully charged. The batteries were discharged under vibration conditions with vibration frequencies of 10 Hz/20 Hz/30 Hz/40 Hz/50 Hz,
In the test, the batteries were arranged into two groups, where the first group of batteries were tested under the low frequency region conditions with vibration frequencies of 5 Hz/10 Hz/20 Hz, and the second group of batteries were tested under high frequency region conditions with vibration frequencies of 30 Hz/40 Hz/50 Hz. The two group of batteries subjected to vibration working conditions in the tests were manufacturer-qualified new batteries to avoid the influence of additional factors. The discharge capacity samples under different vibration frequency conditions are shown in Table 4.
From the analysis of the data in Table 4, it can be seen that the discharge capacity comparison curve under the vibration frequency F = 5 Hz is as shown in Figure 10. The discharge capacity of the batteries after vibration is significantly reduced. The discharge curve of the Cell 1 is shown in Figure 11. The discharge voltage of the battery under the vibration conditions is lowered, and the discharge time is shortened.
As shown in Table 4, the discharge capacity of the battery after the F = 5 Hz vibration was reduced by 0.2–0.3 Ah. From the analysis of the single battery, it is known that the batteries have a lower discharge capacity and a shorter discharge time under vibration conditions. The changed values of some battery cells are larger, others changed values are smaller. Therefore, the measurement data must be repeated, and data samples from the overall position analyzed. However, for a variety of batteries under different vibration frequency conditions, it is uncertain whether the discharge capacity is significantly reduced, so a mathematical statistical hypothesis test method can be adopted.
A reasonable inference is made based on the test sample data on whether the variable is subject to a particular distribution or whether the parameter takes a particular value or not. This process is a hypothesis test. The purpose of the hypothesis test is to infer whether the test indicators after loading conditions are significant, or to infer whether there are differences in the test indicators after two different operating conditions are applied.
In this test, four batteries under no vibration conditions were used as control samples, and four batteries under different vibration frequency conditions were used as test samples. The four batteries of the control samples and the test samples were the same. That is, the sample was homogenous, and thus sample data were two paired sample data. The two paired of sample tests are to compare the test indicators before and after the loading conditions of the same research object, or to find differences in the test indicators when two different working conditions are loaded.
When the population distribution is unknown, the non-parametric hypothesis test is performed using the order of magnitude between sample values without relying on the population distribution. The Wilcoxon Rank-Sum statistics test [41] (also called the Mann–Whitney U test) is effective for small paired sample data (not normally distributed data) and can be used to test whether two independent samples come from the same population distribution [42].
The data of the discharge capacity indicators recorded by control samples under no vibration are named sample X, and under the vibration frequency F = 5 Hz, the data of the discharge capacity indicators recorded by test samples are named sample Y. The distributions of the two samples are unknown. The distribution functions are supposed as F1(x), F2(x), where x is a function parameter. It can be denoted that: X ~ F1(x), Y ~ F2(x).
In the statistics hypothesis test, the hypothesis proposition is clarified firstly, and is called the null hypothesis H0, whereas the opposite hypothesis proposition is called the alternative hypothesis H1. In this test samples, the null hypothesis is that there is no significant difference in battery discharge capacity between the sample without vibration and the sample with vibration conditions, namely H0: F1(x) = F2(x); whereas the alternative hypothesis is that there is a significant difference, namely H1: F1(x) ≠ F2(x).
The steps of the hypothesis test are as follows:
(1) The test sample and test sample are combined and sorted in ascending order, and then a new sample is obtained, namely .
(2) In the new sample Z, if Xk = Zi (or Yk = Zj), then namely r(Xk) = i (or r(Yk) = j), it denotes the sequential position in the new sample, and it is called a rank of Xk (or Yk).
The rank sum of sample X and sample Y are denoted by and , respectively. If n1 ≤ n2, the test statistic T is denoted as follows:
Therefore, the test samples can be processed in accordance with the test standard steps and the samples are sorted in ascending order in Table 5.
From the rank values in Table 5, the test statistic T is calculated as follows: .
(4) The rejection region in the hypothesis can be calculated as follows: If there is no significant difference between the two samples from the same population, that is the null hypothesis H0, the value of the statistic T should not be too large or too small, otherwise there is reason to reject H0.
Therefore, at the significance level (α), the limit values at the left side T1 and right side T2 are obtained by looking up the rank-sum table. When T < T1 or T > T2 there is a reason to reject H0. In the test in this paper, the parameter values are as follows: n1 = 4, n2 = 4, α = 0.05. Therefore, the limit values T1 and T2 are obtained as follows: T1 = 12, T2 = 24.
(5) The p-value is calculated as follows: The p-value is the probability obtained by finding the minimum significance level in the rejection region. Then the p-value and the chosen significance level are compared. The alternative hypothesis H1 is accepted only if the p-value is smaller than the chosen significance level. The p-value can be calculated by the function [p, h] = ranksum ( ) in the MATLAB software. In this hypothesis test, the p-value is calculated by the function: p = 0.0286.
In summary, because the equation T1 = 26 > T2 = 24 is true, so the null hypothesis H0 is rejected and the alternative hypothesis H1 is accepted. The p-value is satisfied with the equation as follows: p = 0.0286 < α = 0.05, so it has statistical significance.
Therefore, the Wilcoxon Rank-Sum test is used for the sample X without vibration and the sample Y with the vibration frequency F = 5 Hz. The result rejects H0 and accepts H1. That is to say, there is a significant difference in battery discharge capacity between batteries without vibration and batteries with vibration conditions.
Data for the control samples without vibration and test samples under the vibration conditions of different frequencies 10 Hz/20 Hz/30 Hz/40 Hz and 50 Hz are shown in Table 4. Six paired samples are formed and are subjected to a Wilcoxon Rank-Sum statistics in accordance with the above method. The specific details are the same and are therefore not repeated. The results of the non-parametric hypothesis test are shown in Table 6.
The results of test samples under the vibration conditions of different frequencies F = 10 Hz/20 Hz/30 Hz are that the null hypothesis H0 is rejected and the alternative hypothesis H1 is accepted. Under the vibration conditions of different frequencies F = 40 Hz/50 Hz, however, the results are the opposite.
All in all, from the above analysis it can be concluded that there is a significant difference in discharge capacity between batteries without vibration and batteries under vibration conditions of different frequencies F = 5 Hz/10 Hz/20 Hz/30 Hz, and the discharge performance of the battery is deteriorated.
4.2. Difference in Resistance of Batteries under Different Vibration Frequency Conditions
In these experiments, the control samples are batteries without no vibration F = 0, and the test samples are batteries under vibration conditions with vibration frequencies of 5 Hz/10 Hz/20 Hz/30 Hz/40 Hz/50 Hz. The resistance of batteries is obtained by HPPC. Samples of resistances are as shown in Table 7. The power spectral density (PSD) for random vibration tests [23] shows that the PSD values is small in the higher-frequency vibration. The vibration intensity with higher-frequency above 40 Hz is weaker, so batteries are affected little; the vibration intensity with lower-frequency ranging from 5 Hz to 30 Hz is stronger, which leads to poor battery performance.
Box plots are non-parametric: they displays the variation in samples of a statistical population without making any assumptions about the underlying statistical distribution. In the boxes, the maximum, minimum, median, and upper and lower quartiles of a set of data can be shown. The box chart of samples is drawn in Figure 12. The blue box means an unknown distribution, the red line is the median value, and dashed black lines are used to separate pictures at different frequencies.
From Table 7 and Figure 12, it can be seen that there is a significant difference in the internal resistance distribution between the batteries without no vibration and batteries with different frequency vibration conditions.
From the viewpoint of a single battery, the resistance of most batteries under vibration conditions increased. From the overall analysis of the batteries samples, compared to the batteries without vibration conditions, the sample mean of the batteries under vibration with the vibration frequency F = 5 Hz/10 Hz/20 Hz/30 Hz increased and its distribution is more scattered.
Therefore, it can be concluded that there is a significant increase in the resistance of batteries under vibration with the vibration frequency F = 5 Hz/10 Hz/20 Hz/30 Hz. Due to the increase in resistance, it is also obtained that the discharge performance of the battery is deteriorated.
4.3. Kruskal-Wallis Test on Resistance of Batteries under Three Direction Vibration Conditions
The batteries were tested under the vibration conditions with vibration frequency of 10 Hz, applied in the Z-direction, Y-direction and X-direction, respectively. Control samples are the resistances of batteries without no vibration, and test samples are the resistances of batteries under vibration conditions. Samples of resistance are as listed in Table 8.
As shown in Table 8, the discharge internal resistance of the battery was increased after the application of a Y-direction vibration to 7 milliohms. The increase values of some battery cells are larger, while for others the increase values are smaller. Therefore, the data samples need to be analyzed from the overall position, based on a mathematical statistics method. In the analysis process, the non-parameter hypothesis test method was adopted. From the samples of resistance applied in three different directions under loading vibration conditions, it is determined by a hypothesis test whether there is a significant difference in the samples.
In this test, the population distribution is not subject to the assumption of a normal distribution, so it can be obtained by the nonparametric hypothesis Kruskal-Wallis test [43]. The comparison and significant differences of s(s ≥ 3) methods applying to N individuals are obtained by the Kruskal-Wallis test. The null hypothesis H0 is that there is no significant difference in different methods; correspondingly the alternative hypothesis H1 is that there is a significant difference in different methods. The steps are as follows:
(1) Specifically N individuals are randomly divided into S groups, so that ni trials in the i (i = 1, 2, …, s) group are carried out by the i methods. Obviously, the equation is established. After trials, N individuals are sorted in ascending order according to the significance of the methods effect, and the rank order is obtained as follows: , where, denotes the rank of the ni individuals in the i group. In the trials, N = 24 batteries are randomly divided into s = 3 groups and subjected to vibration conditions applied in ithe Z-, Y- and X-direction, respectively. The samples of resistance are obtained, and the rank order of samples shown in Table 9 is obtained.
(2) The test statistic is calculated as follows:
In Table 9, the eight sample values in Z-direction, Y-direction and X-direction correspond to the ranks (ni = 8, i = 1, 2, 3), respectively. The corresponding rank sum is denoted by R1*/R2*/R3*. Obviously, the rank sum in each direction can be calculated as follows: R1* = R11 + R12 +…+ R18 = 79, R2* = R21 + R22 +…+ R28 = 75, R3* = R31 + R32 +…+ R38 = 146.
Therefore, the statistical observation value K0 is calculated by Equation (3) as follows: K0 = 7.955.
(3) The rejection region is denoted as follows: K ≥ c, where the c values are calculated by the equation ; specifically it is obtained by the limit value: .
If the equation is established, then H0 is rejected and H1 is accepted.
When α = 0.05, the c values are obtained by distribution table as follows: .
In summary, because , H0 is rejected and H1 is accepted. The p-value is calculated by the corresponding function in MATLAB and satisfies the equation as follows: p = 0.0187 < α = 0.05, so it has statistical significance. Therefore, there is a significant difference between different methods.
The multiple comparison test between the samples in the three different-directions is calculated by the function [c, m, h] = multcompare ( ) in MATLAB.
Between the two samples of Z/X, Z/Y and X/Y, the confidence interval, the rank mean difference and the p-value can be obtained, as shown in Table 10.
At the α = 0.05 confidence level, the multiple comparison test between the two samples of Z/X is performed and the confidence interval is (−7.7862, 8.7862), and the p-value is 0.989. Because the confidence interval contains zero and the p-value is satisfied where p = 0.9890 > 0.05, there is no difference between two samples of Z/X. However, in the multiple comparison test between the two samples of Z/Y, the confidence interval (−16.6612, −0.0887) does not contain zero and the p-value is satisfied with p = 0.0469 < 0.05, there is a significant difference between two samples of Z/Y. Similarly, there is a significant difference between two samples of X/Y. In summary, the rank mean value in the Y-direction is the largest, so the battery resistance in the Y-direction is the largest, and there is a significant difference between two samples of Z/Y and X/Y.
5. Orthogonal Analysis of Discharge Performance under Temperature-Vibration Coupling Conditions
In previous sections, the effects of temperature conditions and vibration conditions on the lithium-ion batteries were studied. In actual working conditions, EVs are always exposed to coupled vibration conditions and temperature conditions. For example, EVs are running in extremely cold regions in the Northeast China, which is a case of coupled working conditions, therefore, it is of practical significance to study the discharge of lithium-ion batteries under temperature and vibration coupling conditions in actual working conditions. The main influencing factors that affect the discharge capacity performance of the batteries can be obtained by a coupling load of temperature and vibration factors.
In this section, nine sets of temperature and vibration coupling tests were carried out through orthogonal design experiments. The cycle tests of the battery can degrade battery performance. After a long cycle test, it is difficult to tell whether the impact on battery performance is due to changes in environmental factors. Therefore, the new batteries are measured under coupling conditions.
5.1. Orthogonal Design and Test
The temperature and vibration conditions were considered in this paper. In the analyses of the previous sections, under five different ambient temperature gradients, the discharge capacity and discharge internal resistance of the lithium-ion batteries changed greatly. The changes in the discharge capacity and the internal resistance of the battery are particularly obvious in low, normal and high temperature environments. Therefore, taking into account the requirements of the orthogonal table, temperature factors are to set at three levels: −15 °C, 15 °C and 45 °C. The discharge capacity and the discharge internal resistance of the lithium-ion batteries also changed greatly with different vibration frequencies and vibration directions. Therefore, taking into account the requirements of the orthogonal table, the vibration frequency is set to three levels: 10 Hz, 20 Hz and 30 Hz, and the vibration direction is set to three levels, horizontal X-direction, longitudinal Y-direction, and vertical Z-direction. Thus, the test factor levels shown in Table 11 are obtained.
After analysis, without considering the interaction between the factors, and the orthogonal table L9 (34) was selected in the three-factor and three-level tests. In the orthogonal test head design, three factors are randomly arranged in the corresponding column position of the orthogonal table. There will be a column left in this experiment without any factors, as a blank column. And the blank columns are analyzed as error columns in analysis of variance. Thus, the orthogonal table shown in Table 12 is obtained.
In the table, the test plan A1B1C1 in test No. 1 denotes the test factors, which were the coupling load of temperature −15 °C, vibration frequency 10 Hz, and vibration X-direction. The remaining eight test plans in the table were analogous. The tests were carried out in accordance with the orthogonal test table described above. In the experiments, batteries were subjected to nine tests, and the test sequence of each batch was randomly determined. The tests were completed to obtain the discharge capacity shown in Table 13.
5.2. Range Analysis
The nine sets of tests for the Cell 17 in Table 13 are analyzed below. The mean value ki is the arithmetic mean value of the test result index, that is discharge capacity, obtained by the test plans corresponding to any level of any factor i (i = 1, 2, 3). For example, the three sets of test plans correspond to the level 1 (−15 °C) of temperature factors in the columns A, and the arithmetic mean of the experimental results can be obtained by the equation k1 = (2.3329 + 2.4207 + 2.3569)/3. In the same way, all other mean values can be calculated.
This purpose of orthogonal design is to determine the main factors affecting the test results, and obtain the best plans by combining the various levels of each factor. In the actual driving conditions, the performance should be taken into consideration and the discharge capacity of the lithium-ion batteries should be as large as possible. Therefore, the level of the larger discharge capacity was finally selected. The selected level corresponds to the maximum value of the mean values ki. The trend chart between the levels of factors and the mean values was drawn as seen in Figure 13.
Obviously, the results of the relationship are apparently and may be summarized as follows: The factor column A: k3 > k2 > k1; the factor column B: k3 > k2 > k1; the factor column D: k2 > k1 > k3.
Therefore, the optimal level scheme for each factor is A3B3D2. It denotes that, the temperature is 45 °C, the vibration frequency is 30 Hz, and the vibration is carried out in Y-direction. Under the temperature and vibration coupling conditions of the optimal level, the maximum discharge capacity is obtained under the test range.
The range R is the difference between the maximum value and the minimum value of the arithmetic mean ki under any one of the factors, that is R = max{k1, k2, k3}−min{k1, k2, k3}. Thus, the range of the three factors is obtained. The range value indicates the degree of influence of the change of each factor on the discharge capacity. The larger the range, the greater the change in the level of the corresponding column factor within the test range, and also the greater the change in the discharge capacity of the test results. Therefore, the largest factor of the range is the factor that has the greatest impact on the discharge capacity. This factor is called the main factor. The results of the range analysis are shown in Table 14.
Each column range is obtained by orthogonal test analysis. Therefore, the three factors that influence the discharge capacity are ranked in order of A (temperature), B (vibration frequency) and D (vibration direction). According to the above orthogonal analysis method, the discharge capacities corresponding to the Cells 18/19/20 in Table 13 are respectively arranged in the evaluation index column. The range analysis result is obtained and is as shown in Table 15.
From the data in Table 15, obviously, the results of the Cells 17/18/19/20 meet the equation RA > RB > RD, respectively. From the above, it can be concluded that the conclusion is consistent. That is, for discharge under temperature and vibration coupling conditions, the three factors are ranked in order of A (temperature), B (vibration frequency) and D (vibration direction).
5.3. Analysis of Variance
In order to estimate the magnitude of the error and accurately estimate the importance of the impact of the discharge capacity of the test results on each factor, the analysis of variance should also be analyzed.
The multivariate analysis of variance in the orthogonal table Ln(rm) is mainly carried out by the F-test and the significant influence of the factors is obtained. In the F-test, all the parameters, that are the sum of squared deviation (SSD) of the factors and the error, the degree of freedom (DOF), the mean squared deviation (MSD), and the F-value, are calculated respectively as follows:
(1) The SSD calculation.
The degree of deviation of each value yi from the mean value in a set of data is denoted by the SSD ST of the all factors. The larger the square of the dispersion, the greater the difference between the test results. The SSD ST is calculated as follows:
where, .
If the factor A is arranged in column j (j = 1, 2, …, m) of the orthogonal table, then the SSD SAj of the factors A is extracted in the column j and is calculated as follows. The SSD Se of the error is the difference between them and is calculated as follows:
From the test data of the Cell 17 in Table 13, the parameters values are calculated by Equations (4)–(6), respectively, namely, Q = 56.507, P = 56.375, ST = Q − P = 0.132, SAj = 0.091, SBj = 0.023, SDj = 0.017, Se = 0.001.
(2) The DOF calculation.
Corresponding to ST, SAj, Se, the DOFs are denoted as fT, fj, fe, respectively and are calculated as follows:
Therefore, the parameters values are calculated respectively by Equations (7)–(9), namely, fT = 8, fA = fB = fD = fe = 2.
(3) The MSD calculation.
Similarly, corresponding to SAj, Se, the MSDs are denoted as MSA, MSe, respectively, and are calculated as follows:
Therefore, the parameters are calculated respectively by Equations (10) and (11), namely, MSA = 0.046, MSB = 0.011, MSD = 0.008, MSe = 0.001.
(4) F-values calculation and F-test.
The ratio of MSA to MSe is denoted as the F-value. Taking factor A as an example, the F-value of factor A is calculated as follows:
Therefore, the parameters values are calculated respectively by Equation (12), namely, FA = 62.605, FB = 15596, FD = 11.391. Based on all the parameters above, the analysis of variance table is displayed in Table 16.
In Table 16, the limit values can be obtained by requiring the regulations F0.1(2,2) = 9, F0.5(2,2) = 19, F0.01(2,2) = 99. According to the hypothetical principle, given a significant level α = 0.05, factor A has a significant effect on the discharge capacity of the test results and is marked with the two asterisks. Factors B and D have an effect on the discharge capacity of the test results and are marked with the one asterisk, respectively.
6. Discussion
Electric vehicle batteries are applied under actual working conditions, and it is necessary to evaluate the battery performance considering factors such as temperature and vibration. In this paper, experimental research was carried out under temperature conditions, vibration conditions and temperature-vibration conditions.
The hypothesis that the difference in battery performance under high temperature and low temperature conditions has a great influence was confirmed. The innovation in the experiment of this paper is to more accurately describe the temperature influence on the battery performance. The temperature value during the test refers to the ambient temperature and the temperature caused by the discharge heat generation of the battery, instead of simply controlling the temperature according to the ambient temperature.
The influence of vibration factors on battery packs has been gradually recognized by researchers. Therefore, scholars have carried out relevant research [15,16,17] in the past two years, but the authors of the test also raised the objection that the test results of a few battery cells are both positive and negative, so it is necessary to have multiple batteries. In this work batteries were tested, and the obtained data were taken as a sample, and analyzed by mathematical statistics. In this paper, there is a significant difference in the discharge capacity between batteries without vibration and batteries under vibration conditions.
Experimental studies on the effects of random vibration on the performance of batteries have been described in the literature [23]. However, in the tests, the vibration direction was not considered, and the tests were carried out only in a single vibration direction, ignoring the other two directions. In fact, three vibration directions are comprehensively considered in this paper, so that the test results are more comprehensive. The impact of vibration frequency on battery performance is considered. Therefore, this article provides a better complement to the earlier research in this laboratory.
It is necessary to comprehensively investigate the combination of different temperature and different vibration factors to carry out the tests. It is helpful to present the results of the multi-case coupling complex factors affecting the battery performance, and find the main influencing factors affecting the discharge capacity performance of the battery. In this paper, the introduction of orthogonal experimental design and orthogonal analysis methods can effectively avoid repeating tests, avoiding the need for a lot of materials (batteries) and time spent on repeated tests. In this paper, the orthogonal analysis results show that the three factors that influence are, in order, the temperature, vibration frequency and vibration direction. The temperature factor is the main influencing factor of the performance of the power battery. The vibration also has an impact on the battery performance.
In this paper, the biggest breakthrough contribution is to focus on the coupling of the temperature and vibration conditions, to test them by an orthogonal test method, and to analyze the impact on battery performance.
However, the paper still has limitations. The research in this paper emphasizes the data samples obtained from the test of multiple batteries. However, due to the limitation of the test equipment BTS4000 and the space size limit of the temperature-controlling test incubator, the sample size of the test was small. Therefore, a non-parametric hypothesis test based on the rank sum is selected in the hypothesis testing process. The next step is to conduct vibration and temperature tests. A greater number of battery samples should be considered for those tests.
7. Conclusions
In this paper, Panasonic NCR18650PF cylindrical lithium-ion batteries were tested. On actual roads EVs face complex conditions such as ambient temperature and road vibration variations. In the experiments, the temperature conditions, the vibration conditions and the temperature-vibration coupling conditions were respectively applied, and electrical performances of batteries were tested by the BTS4000 battery testing platform. Through the tests, the following conclusions could be obtained:
- (1)
- The temperature conditions in different environments have a significant impact on the discharge capacity and the resistance of power batteries. The discharge capacity of the same battery cell in a low temperature environment is only 85.9% of that in a high temperature environment. The DOD in a low temperature environment is about 94%, while the DOD in a normal temperature environment is about 99%. The low temperature environment has a bad effect on the battery, and the total discharge capacity of the batteries in the low temperature environment is still small. As the temperature decreases, the resistance of the battery continues to rise. The resistance of the battery in a low temperature environment is about three times that of the battery in a high temperature environment. As the internal resistance of the battery increases, according to Ohm’s law, the discharge voltage is reduced, and the cut-off voltage is advanced to shorten the discharge time, and the discharge capacity is reduced.
- (2)
- The test samples of the discharge capacity of batteries under the vibration conditions were obtained, and were analyzed by the Wilcoxon Rank-Sum test. At the significance level α = 0.05, it is concluded that there is a significant difference in discharge capacity between batteries without vibration and batteries with vibration conditions of different frequencies at 5, 10, 20 and 30 Hz, and the discharge performance of the battery is deteriorated. The battery samples’ resistance can be drawn in box charts, which show there is a significant increase in the resistance of batteries under vibration with the vibration frequency. The test samples of the resistance of batteries under the Z/Y/X-directions vibration conditions were analyzed by the Kruskal-Wallis test. At the significance level α = 0.05, it is concluded that there is a significant difference between two samples of Z/Y and X/Y and the battery resistance in the Y-direction is the largest.
- (3)
- The discharge performances under temperature-vibration coupling conditions were studied by the orthogonal analysis. In the orthogonal design and test, the three factors were considered by the orthogonal table L9 (34) and are ranked in order of A (temperature), B (vibration frequency) and D (vibration direction). Given a significance level α = 0.05, the factor A has a significant effect on the discharge capacity of the test results, and factors B and D have an effect on the discharge capacity of the test results.
Supplementary Materials
The following are available online at https://www.mdpi.com/1996-1073/11/10/2856/s1, Figure S1: Indelb T12R test incubator, Figure S2: The five temperature gradient, Figure S3: The vibration test bench, Table S1: The specifications of the Indelb T12R, Table S2: The specifications of the vibration test bench, Table S3: The test schedule of vibration.
Author Contributions
Conceptualization, L.Z. and Z.M.; Data curation, Z.M. and X.G.; Investigation, X.G.; Methodology, Z.M.; Supervision, L.Z.; Validation, X.G.; Writing—original draft, L.Z. and Z.M.; Writing—review & editing, L.Z. and X.G.
Funding
This research was funded by the National Key Research and Development Program of China (No. 2016YFF0203800), the Fundamental Research Funds for Central Universities of China (No. FRF-BD-18-001A) and the National Natural Science Foundation of China (No. 51775037).
Acknowledgments
The authors would like to thank Zachary Bosire Omariba for his English editing.
Conflicts of Interest
The authors declare no conflict of interest.
References
- Berckmans, G.; Messagie, M.; Smekens, J.; Omar, N.; Vanhaverbeke, L.; Mierlo, J.V. Cost Projection of State of the Art Lithium-Ion Batteries for Electric Vehicles Up to 2030. Energies 2017, 10, 1314. [Google Scholar] [CrossRef]
- Xing, Y.; Ma, E.; Tsui, K.; Pecht, M. Battery Management Systems in Electric and Hybrid Vehicles. Energies 2011, 4, 1840–1857. [Google Scholar] [CrossRef] [Green Version]
- Uitz, M.; Sternad, M.; Breuer, S.; Täubert, C.; Traußnig, T.; Hennige, V.; Hanzu, I.; Wilkening, M. Aging of tesla’s 18650 lithium-ion cells: Correlating solid-electrolyte-interphase evolution with fading in capacity and power. J. Electrochem. Soc. 2017, 164, A3503–A3510. [Google Scholar] [CrossRef]
- Tesla Forums 18650 Batteries. Available online: https://forums.tesla.com/forum/forums/18650-batteries (accessed on 28 July 2018).
- Sanfélix, J.; Messagie, M.; Omar, N.; Mierlo, J.V.; Hennige, V. Environmental performance of advanced hybrid energy storage systems for electric vehicle applications. Appl. Energy 2015, 137, 925–930. [Google Scholar] [CrossRef]
- Yuksel, T.; Litster, S.; Viswanathan, V.; Michalek, J.J. Plug-in hybrid electric vehicle LiFePO4, battery life implications of thermal management, driving conditions, and regional climate. J. Power Sources 2017, 338, 49–64. [Google Scholar] [CrossRef]
- Devie, A.; Baure, G.; Dubarry, M. Intrinsic Variability in the Degradation of a Batch of Commercial 18650 Lithium-Ion Cells. Energies 2018, 11, 1031. [Google Scholar] [CrossRef]
- Jaguemont, J.; Boulon, L.; Dubé, Y. A comprehensive review of lithium-ion batteries used in hybrid and electric vehicles at cold temperatures. Appl. Energy 2016, 164, 99–114. [Google Scholar] [CrossRef]
- Situ, W.; Yang, X.; Li, X.; Zhang, G.; Rao, M.; Wei, C.; Huang, Z. Effect of high temperature environment on the performance of LiNi0.5Co0.2Mn0.3O2, battery. Int. J. Heat Mass Transf. 2017, 104, 743–748. [Google Scholar] [CrossRef]
- Spinner, N.; Love, C.; Rose-Pehrsson, S.; Tuttle, S.G. Expanding the operational limits of the single-point impedance diagnostic for internal temperature monitoring of lithium-ion batteries. Electrochim. Acta 2015, 174, 488–493. [Google Scholar] [CrossRef]
- Li, Z.; Li, Y.; Zhou, K.; Pan, C.; He, Z. Temperature study of pure electric vehicles battery pack at different driving conditions. J. Mech. Eng. 2014, 50, 180–185. [Google Scholar] [CrossRef]
- Senyshyn, A.; Mühlbauer, M.; Dolotko, O.; Ehrenberg, H. Low-temperature performance of Li-ion batteries: The behavior of lithiated graphite. J. Power Sources 2015, 282, 235–240. [Google Scholar] [CrossRef]
- Zhang, C.; Lei, Z.; Dong, Y. Method for heating low-temperature lithium battery in electric vehicle. Trans. Beijing Inst. Technol. 2012, 9, 921–925. [Google Scholar]
- Bruen, T.; Hooper, J.; Marco, J.; Chouchelamane, G. Analysis of a Battery Management System (BMS) control strategy for vibration aged Nickel Manganese Cobalt Oxide (NMC) lithium-ion 18650 battery cells. Energies 2016, 9, 255. [Google Scholar] [CrossRef]
- Hooper, J.; Marco, J.; Chouchelamane, G.; Lyness, C.; Taylor, J. Vibration durability testing of Nickel Cobalt Aluminum Oxide (NCA) lithium-ion 18650 battery cells. Energies 2016, 9, 281. [Google Scholar] [CrossRef] [Green Version]
- Hooper, J.; Marco, J. Defining a representative vibration durability test for electric vehicle (EV) rechargeable energy storage systems (RESS). World Electr. Veh. J. 2016, 8, 327. [Google Scholar] [CrossRef]
- Hooper, J.; Marco, J.; Chouchelamane, G.; Lyness, C. Vibration durability testing of Nickel Manganese Cobalt Oxide (NMC) lithium-ion 18,650 battery cells. Energies 2016, 9, 52. [Google Scholar] [CrossRef]
- Brand, M.; Schuster, S.; Bach, T.; Fleder, E.; Stelz, M.; Gläser, S.; Müller, J.; Sextl, G.; Jossen, A. Effects of vibrations and shocks on lithium-ion cells. J. Power Sources 2015, 288, 62–69. [Google Scholar] [CrossRef]
- He, B.; Wang, H.; He, X. Vibration test methods and their experimental research on the performance of the lead-acid battery. J. Power Sources 2014, 268, 326–330. [Google Scholar] [CrossRef]
- Lang, J.; Kjell, G. Comparing vibration measurements in an electric vehicle with standard vibration requirements for Li-ion batteries using power spectral density analysis. Int. J. Electr. Hybrid Veh. 2015, 7, 272–286. [Google Scholar] [CrossRef]
- Lee, J.; Yeo, J.; Jang, M.; Yoon, J.; Kang, D.M. Mechanical durability and electrical durability of an aluminium-laminated lithium-ion polymer battery pack for a hybrid electric vehicle. Proc. Inst. Mech. Eng. Part D J. Automob. Eng. 2010, 224, 765–773. [Google Scholar] [CrossRef]
- Wang, H.; Tao, Z.; Fu, Y. Analysis on vibration of li-ion battery module used for electric vehicle. In Proceedings of the 3rd International Conference on Materials Science and Mechanical Engineering (ICMSME), Windsor, UK, 29–30 September 2016; pp. 28–30. [Google Scholar]
- Zhang, L.; Ning, Z.; Peng, H.; Sun, C. Effects of vibration on the electrical performance of lithium-ion cells based on mathematical statistics. Appl. Sci. 2017, 7, 802. [Google Scholar] [CrossRef]
- Zachary, B.; Zhang, L.; Sun, D. Review on health management system for lithium-ion batteries of electric vehicles. Electronics 2018, 7, 72. [Google Scholar]
- Yang, D.; Xu, J.; Jing, X.; Wu, N.; Tian, W. Design of a high power battery based on an analysis of data captured from a commercial hybrid electric vehicle running at operating-mode conditions. Int. J. Electrochem. 2015, 10, 1940–1952. [Google Scholar]
- Chin, C.S.; Gao, Z.; Chiew, J.H.K.; Zhang, C. Nonlinear Temperature-Dependent State Model of Cylindrical LiFePO4 Battery for Open-Circuit Voltage. Energies 2018, 11, 2467. [Google Scholar] [CrossRef]
- Deng, C.; Yao, Z.; Yu, X.; Yuan, C.; Li, Z.; Su, L. Design and simulation of thermal management structure for a HEV Li-ion battery pack. In Proceedings of the 2014 IEEE Conference and Expo Transportation Electrification Asia-Pacific (ITEC Asia-Pacific), Beijing, China, 31 August–3 September 2014; pp. 1–4. [Google Scholar]
- Wu, N.; Yang, D.; Liu, J.; Tian, W. Study on accelerated capacity fade of LiMn2O4/graphite batteries under operating-mode cycling conditions. Electrochim. Acta 2012, 62, 91–96. [Google Scholar] [CrossRef]
- Swornowski, P.J. Destruction mechanism of the internal structure in Lithium-ion batteries used in aviation industry. Energy 2017, 122, 779–786. [Google Scholar] [CrossRef]
- Frutschy, K.; Chatwin, T.; Mao, L.; Bull, R. Sodium nickel chloride battery design and testing. In Proceedings of the ASME 2012 International Mechanical Engineering Congress and Exposition, Houston, TX, USA, 9–15 November 2012; pp. 429–438. [Google Scholar]
- Gao, Z.; Chin, C.S.; Woo, W.L.; Jia, J. Integrated equivalent circuit and thermal model for simulation of temperature-dependent LiFePO4 battery in actual embedded application. Energies 2017, 10, 85. [Google Scholar] [CrossRef]
- Xie, J.; Ge, Z.; Zang, M.; Wang, S. Structural optimization of lithium-ion battery pack with forced air cooling system. Appl. Therm. Eng. 2017, 126, 583–593. [Google Scholar] [CrossRef]
- Jiaqiang, E.; Han, D.; Qiu, A.; Zhu, H.; Deng, Y.; Chen, J.; Zhao, X.; Zuo, W.; Wang, H.; Chen, J.; et al. Orthogonal experimental design of liquid-cooling structure on the cooling effect of a liquid-cooled battery thermal management system. Appl. Therm. Eng. 2018, 132, 508–520. [Google Scholar]
- Xie, J.; Zang, M.; Wang, S.; Ge, Z. Optimization investigation on the liquid cooling heat dissipation structure for the lithium-ion battery package in electric vehicles. Proc. Inst. Mech. Eng. Part D J. Automob. Eng. 2017, 231, 1735–1750. [Google Scholar] [CrossRef]
- Chang, G.; Ni, H.; Xu, S.; Li, Y.; Lin, F.; Ning, K. Study on high pressure PEM fuel cell orthogonal test. J. Mech. Eng. 2009, 45, 204–209. [Google Scholar] [CrossRef]
- Chang, G.; Ni, H.; Xu, S. Studies on low pressure PEM fuel cell with orthogonal test. J. Tongji Univ. 2010, 38, 1807–1812. [Google Scholar]
- Cui, Y.; Du, C.; Yin, G.; Gao, Y.; Zhang, L.; Guan, T.; Yang, L.; Wang, F. Multi-stress factor model for cycle lifetime prediction of lithium ion batteries with shallow-depth discharge. J. Power Sources 2015, 279, 123–132. [Google Scholar] [CrossRef]
- Schweiger, H.; Obeidi, O.; Komesker, O.; Raschke, A.; Schiemann, M.; Zehner, C.; Gehnen, M.; Keller, M.; Brike, P. Comparison of several methods for determining the internal resistance of lithium ion cells. Sensors 2010, 10, 5604–5625. [Google Scholar] [CrossRef] [PubMed]
- Corno, M.; Bottelli, S.; Panzani, G.; Spelta, C.; Tanelli, M.; Savaresi, S.M. Performance assessment of active aerodynamic surfaces for comfort and handling optimization in sport cars. IEEE Trans. Control Syst. Technol. 2015, 24, 189–199. [Google Scholar] [CrossRef]
- Shashank, A.; Weixiang, S.; Ajay, K. Review of mechanical design and strategic placement technique of a robust battery pack for electric vehicles. Renew. Sustain. Energy Rev. 2016, 60, 1319–1331. [Google Scholar]
- Wilcoxon, F. Individual comparisons by ranking methods. Biometr. Bull. 1945, 1, 80–83. [Google Scholar] [CrossRef]
- Dexter, F. Wilcoxon-Mann-Whitney test used for data that are not normally distributed. Anesth. Analg. 2013, 117, 537–538. [Google Scholar] [CrossRef] [PubMed]
- Theodorssonnorheim, E. Kruskal-Wallis test: BASIC computer program to perform nonparametric one-way analysis of variance and multiple comparisons on ranks of several independent samples. Comput. Methods Programs Biomed. 1986, 23, 57–62. [Google Scholar] [CrossRef]
Figure 1.
The test platform of the temperature-vibration coupling conditions.

Figure 2.
The method in the experiment. HPPC: hybrid pulse power characteristic.

Figure 3.
The discharge curves of batteries under temperature conditions.

Figure 4.
The temperature increase of the battery in the test.

Figure 5.
The Ohmic resistance and polarization resistance of batteries.

Figure 6.
The discharge capacity of batteries under five temperature conditions.

Figure 7.
The five temperature conditions loaded at five steps.

Figure 8.
The comparison of discharge capacity and pro-discharge capacity.

Figure 9.
The depth of discharge (DOD) of batteries under the low temperature and room temperature conditions.
Figure 9.
The depth of discharge (DOD) of batteries under the low temperature and room temperature conditions.

Figure 10.
The discharge capacity comparison of batteries under pre-vibration and pro-vibration conditions.
Figure 10.
The discharge capacity comparison of batteries under pre-vibration and pro-vibration conditions.

Figure 11.
The discharge curves of batteries under pre-vibration and pro-vibration conditions.

Figure 12.
The box charts of batteries samples under vibration conditions with vibration frequency of 10 Hz/20 Hz/30 Hz/40 Hz/50 Hz.
Figure 12.
The box charts of batteries samples under vibration conditions with vibration frequency of 10 Hz/20 Hz/30 Hz/40 Hz/50 Hz.

Figure 13.
The trend chart between the levels of factors and the mean values.


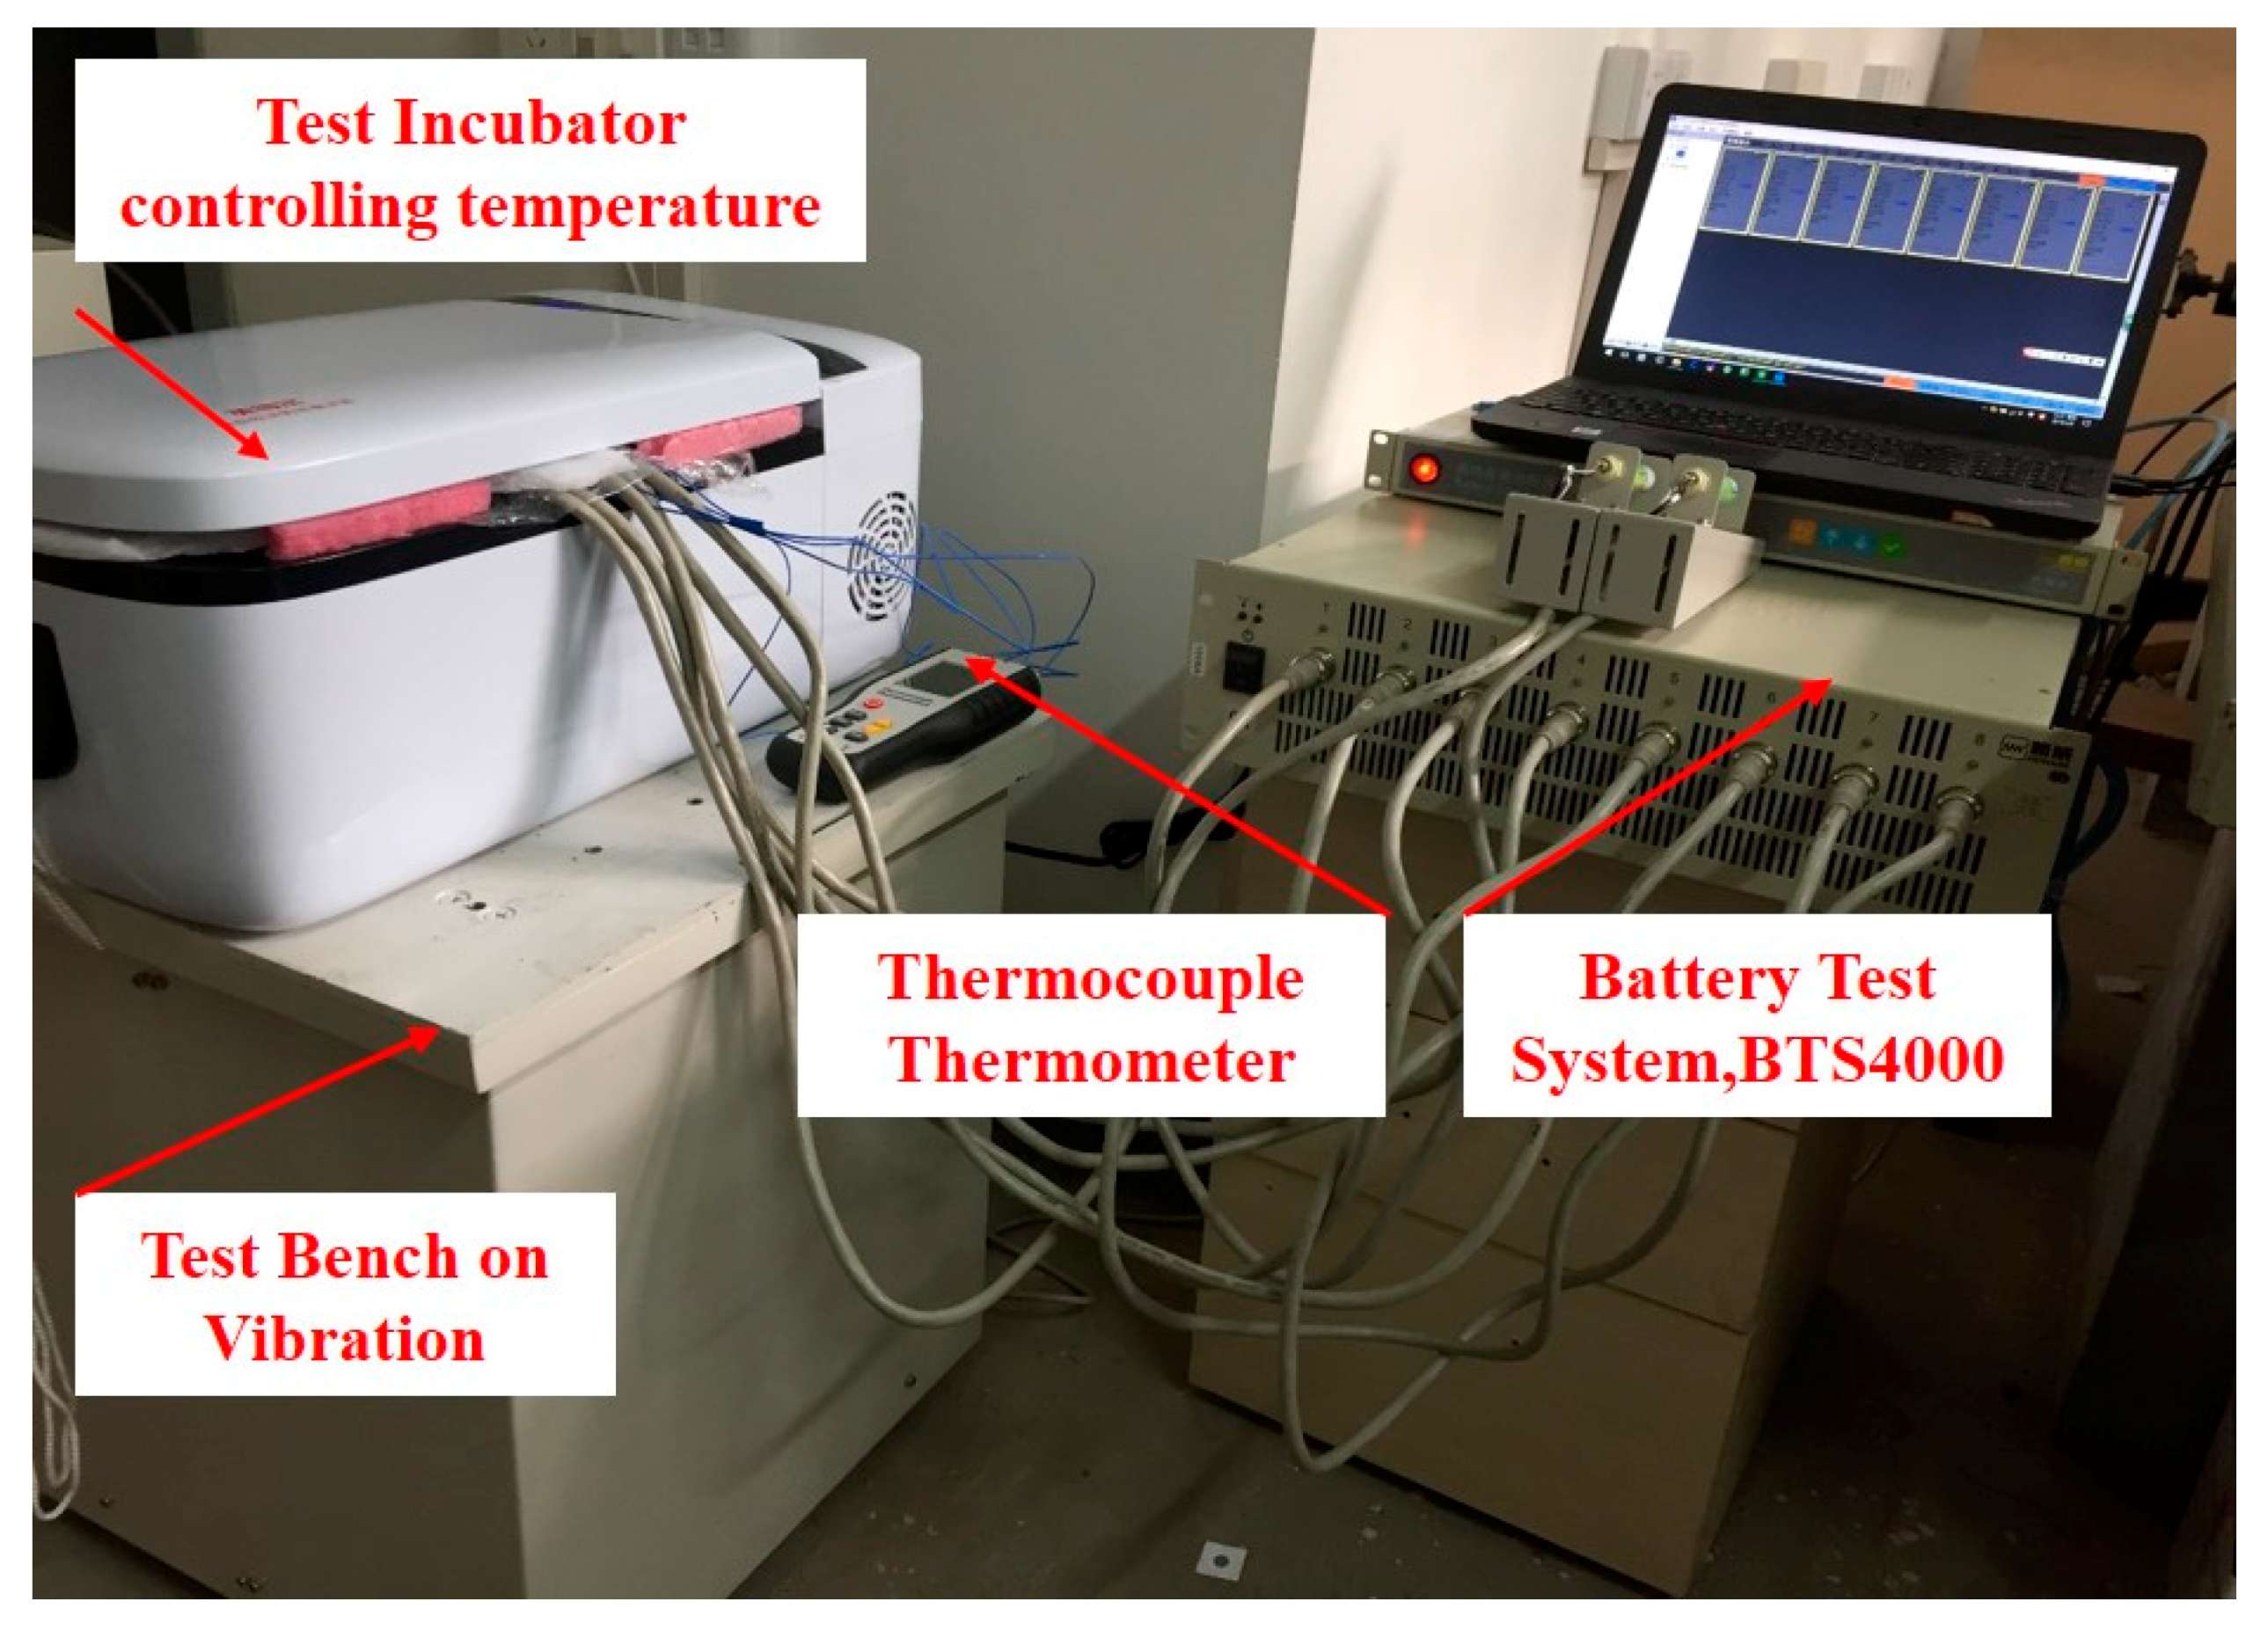
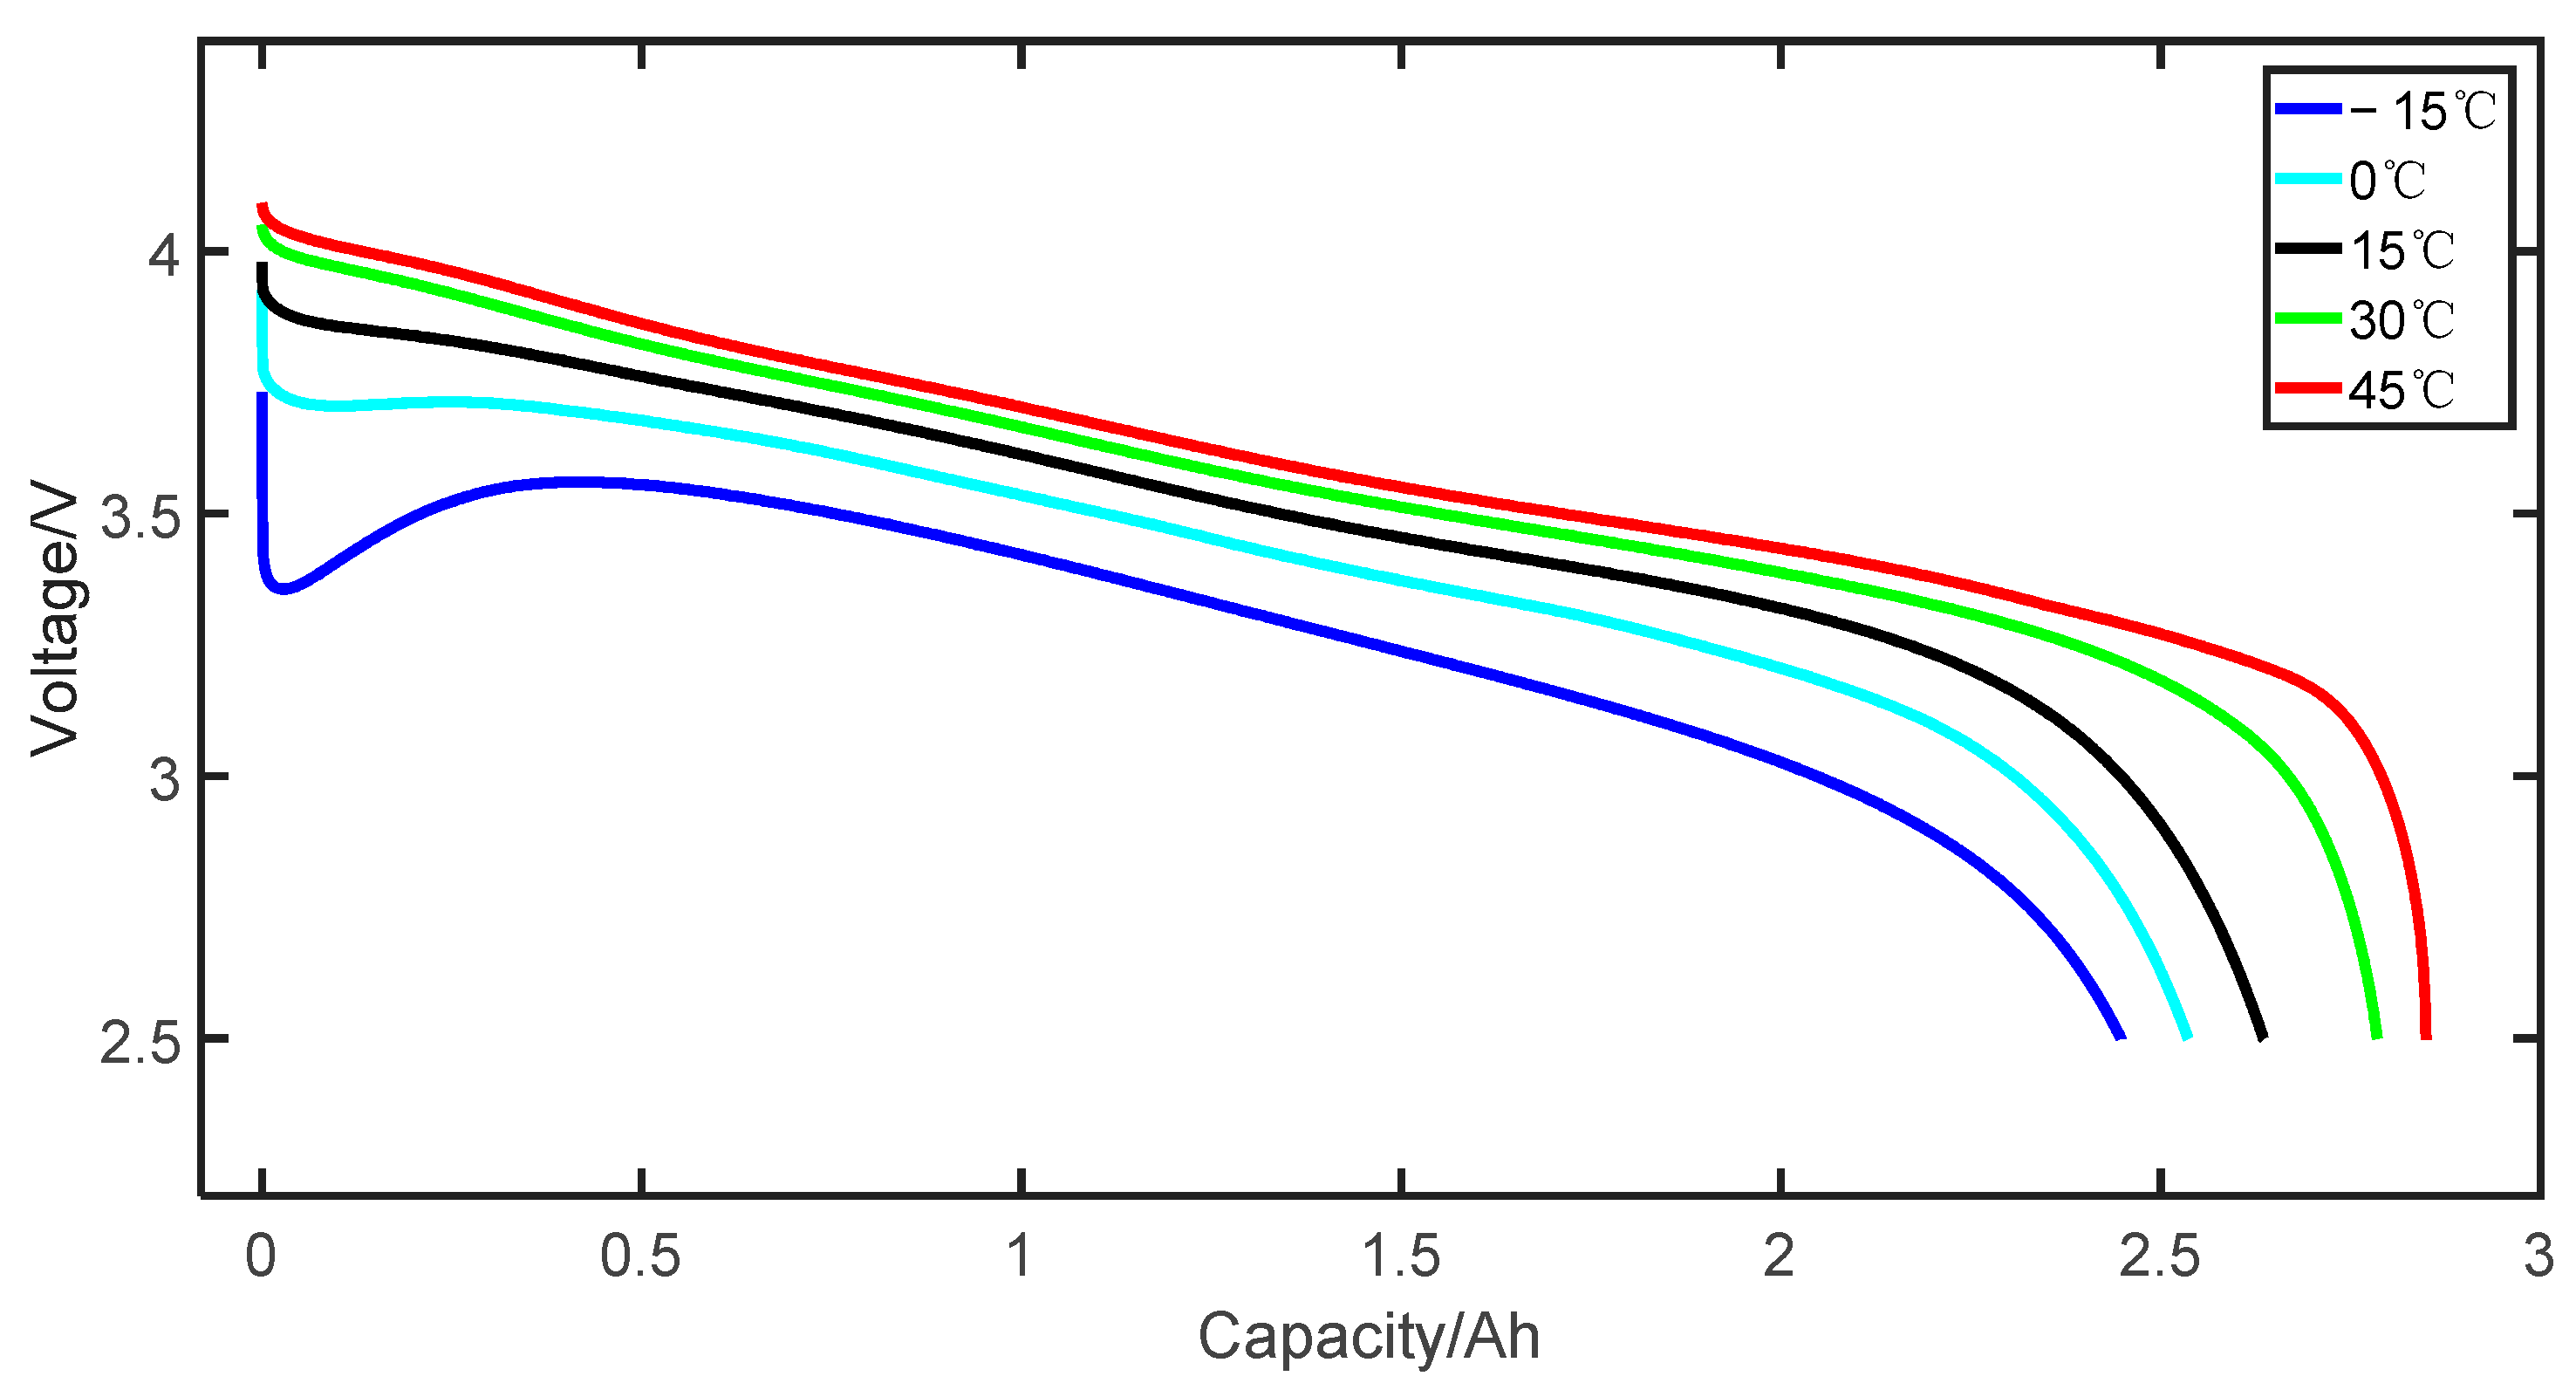
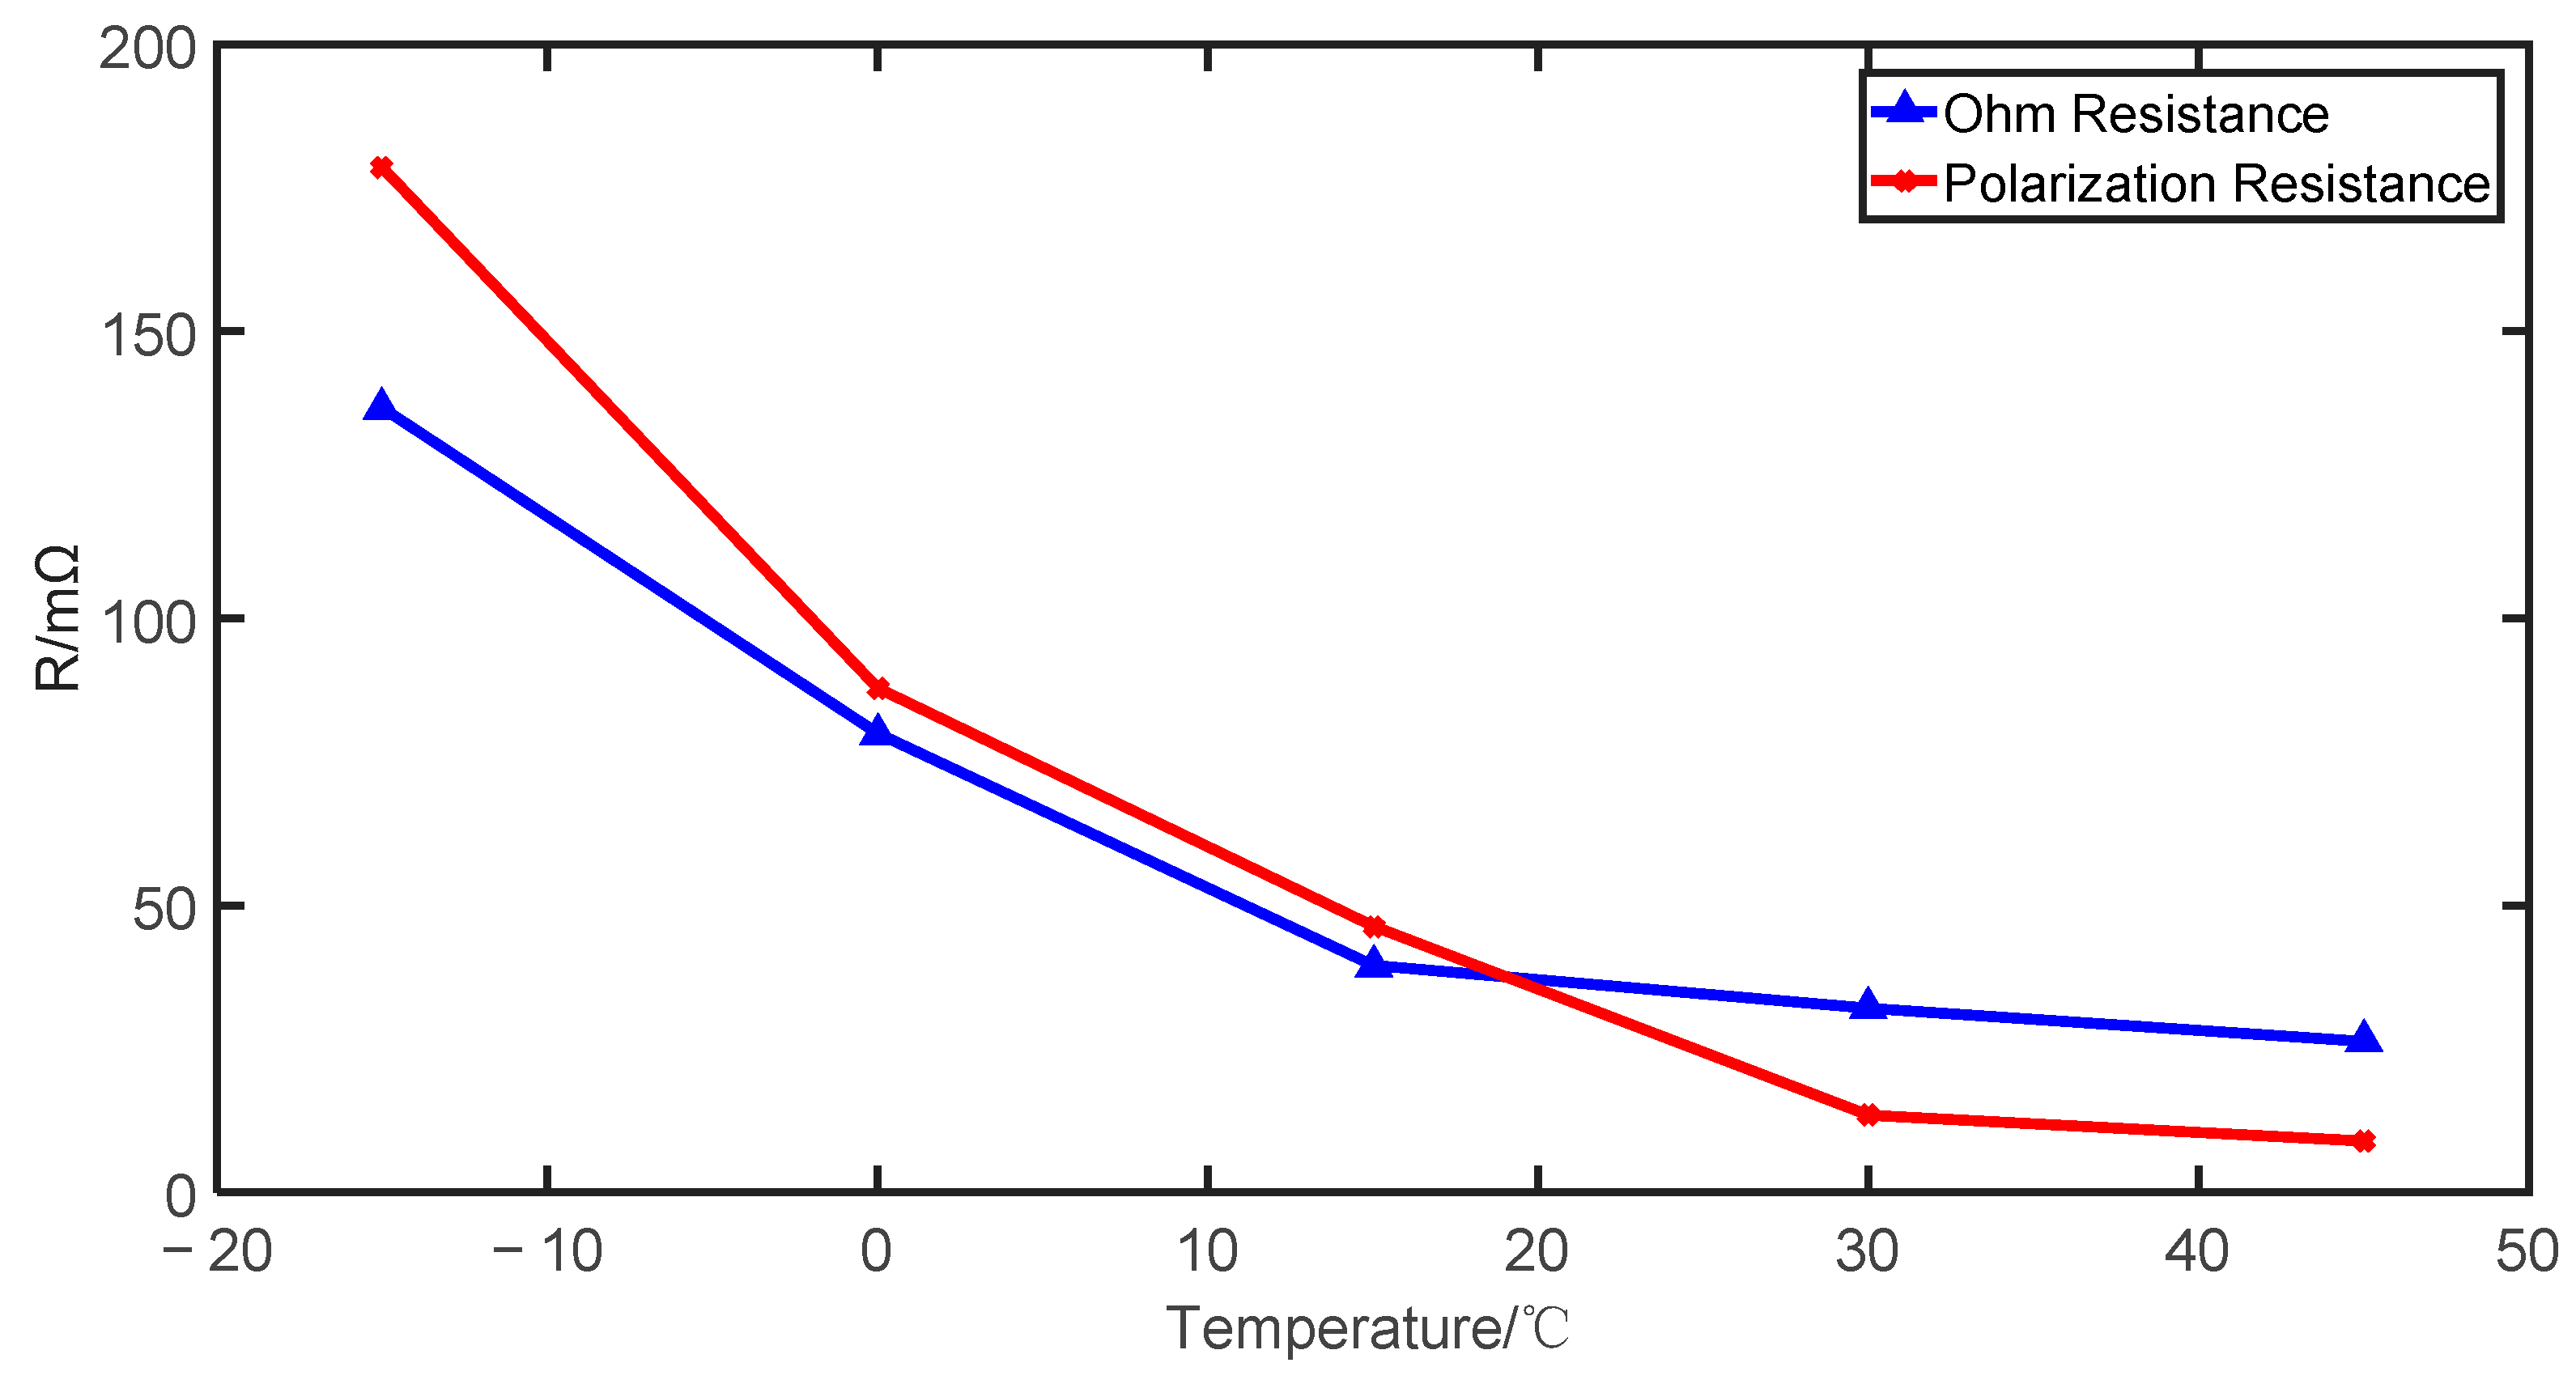
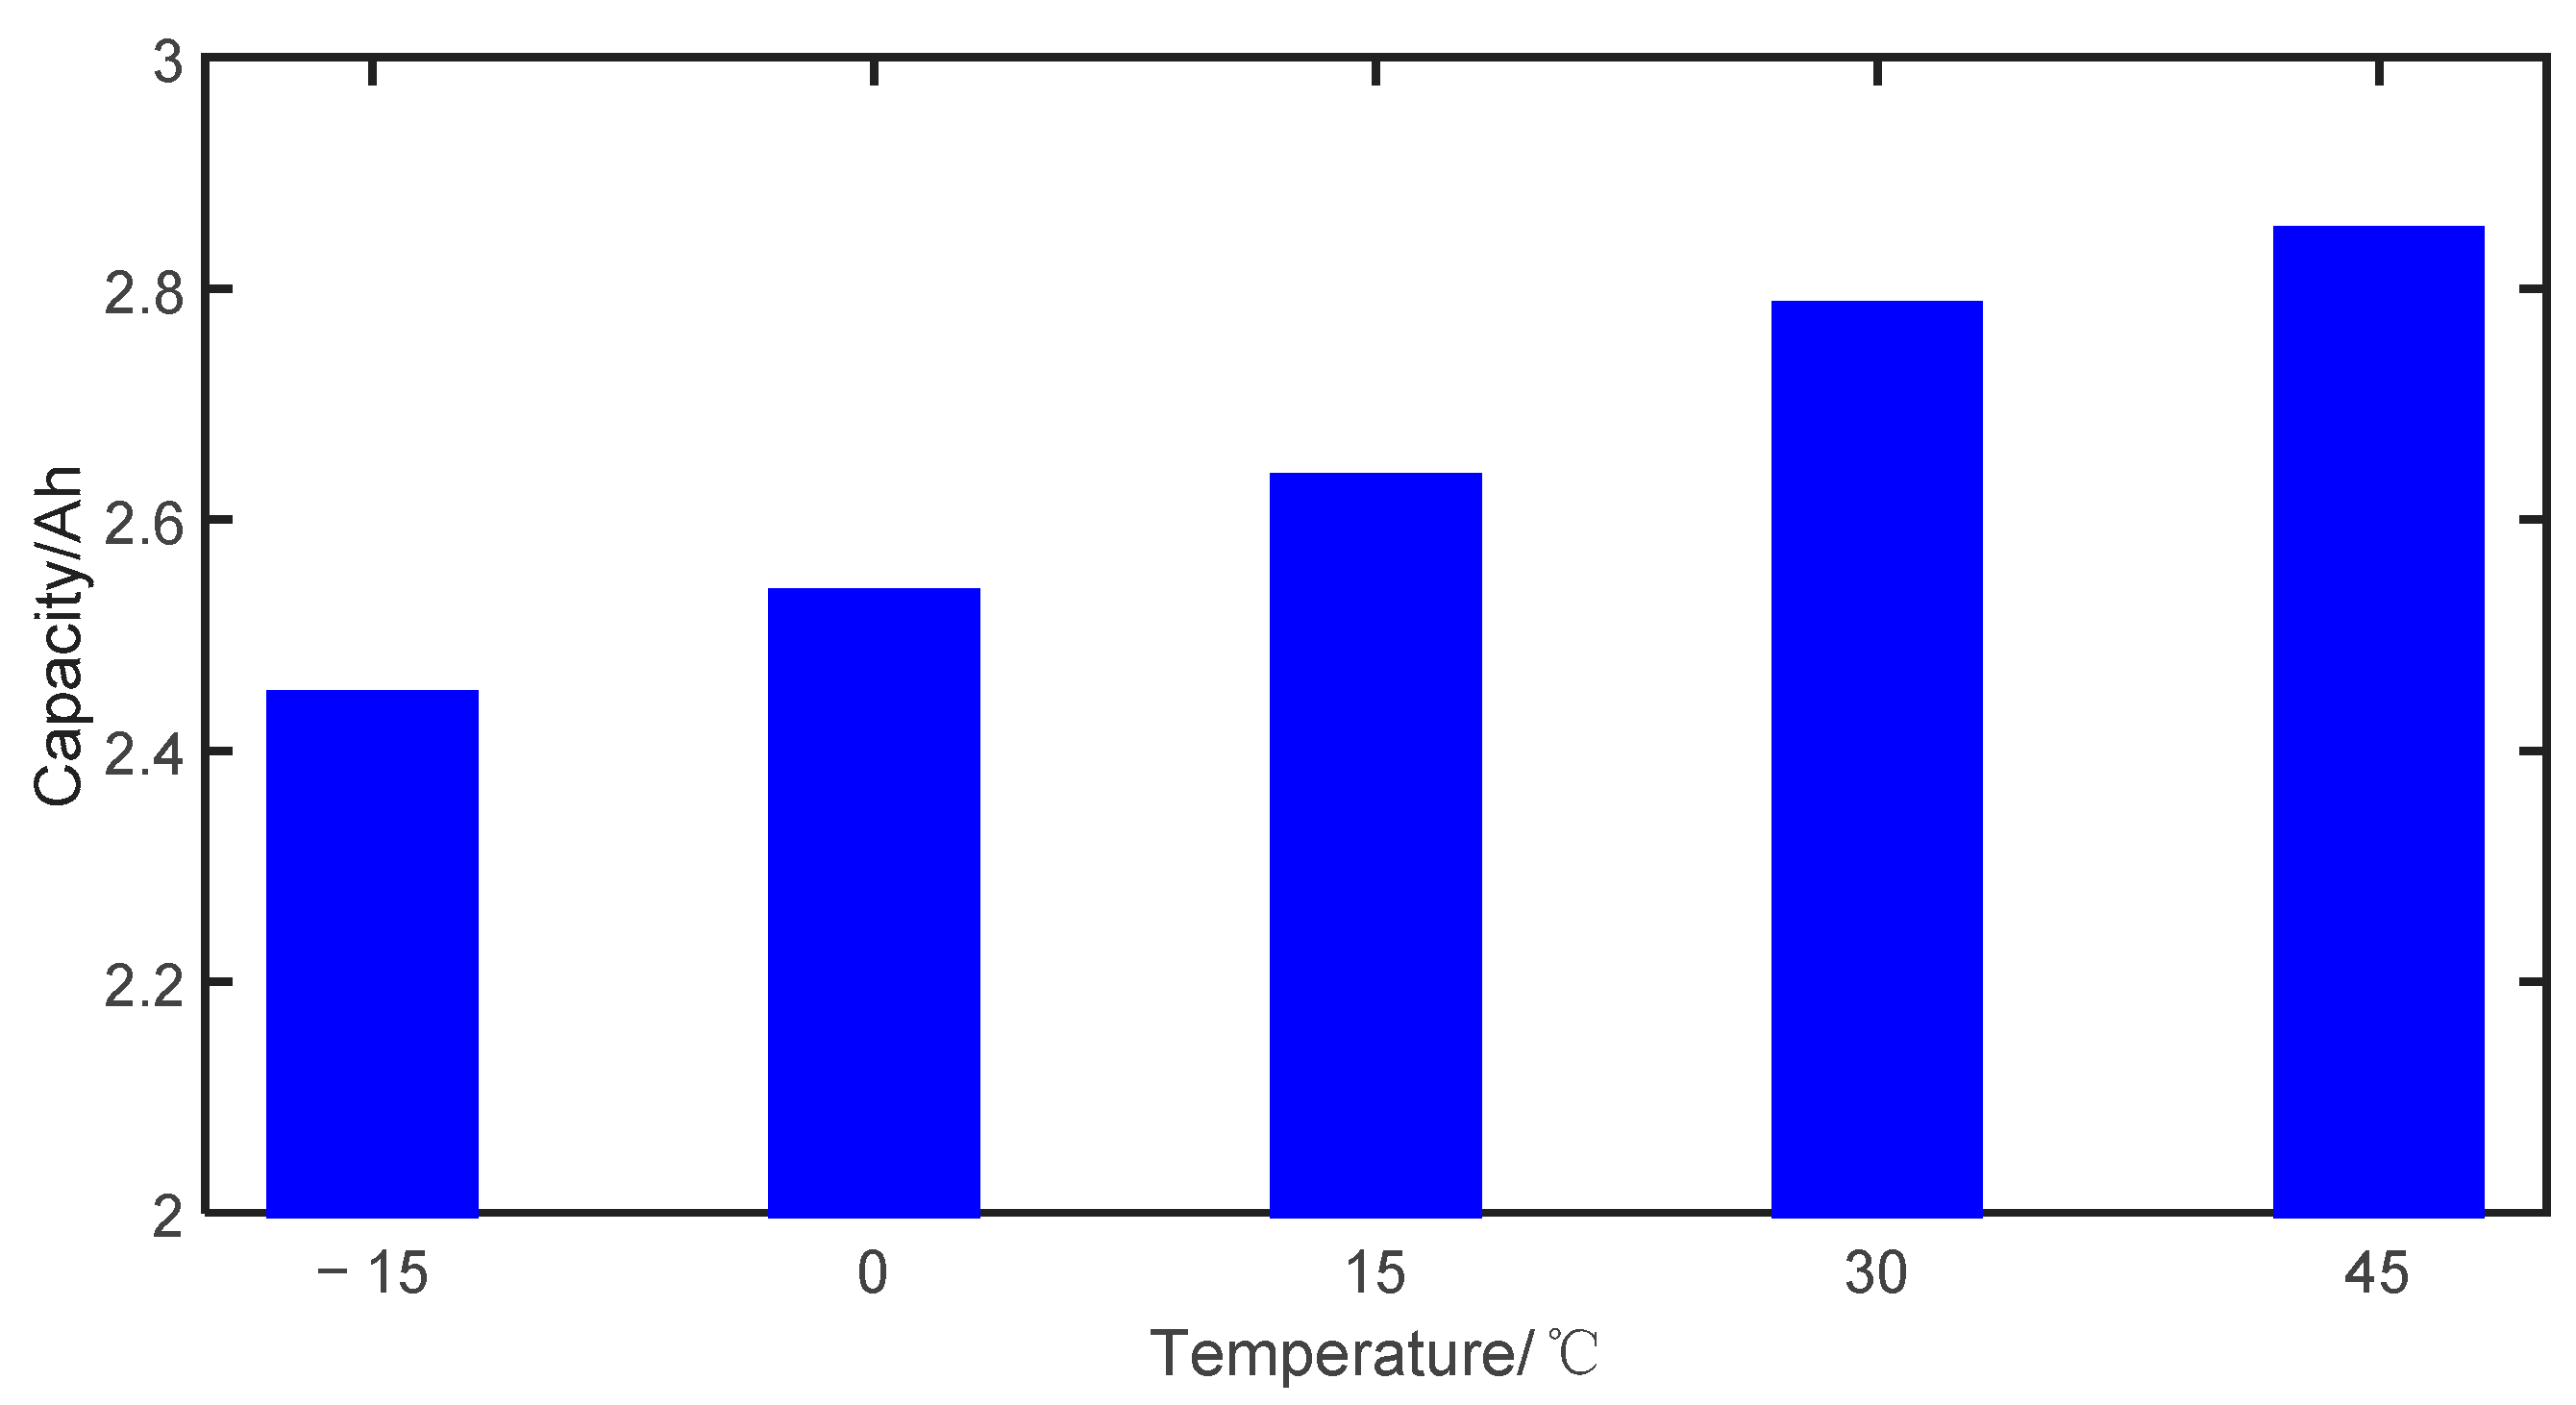
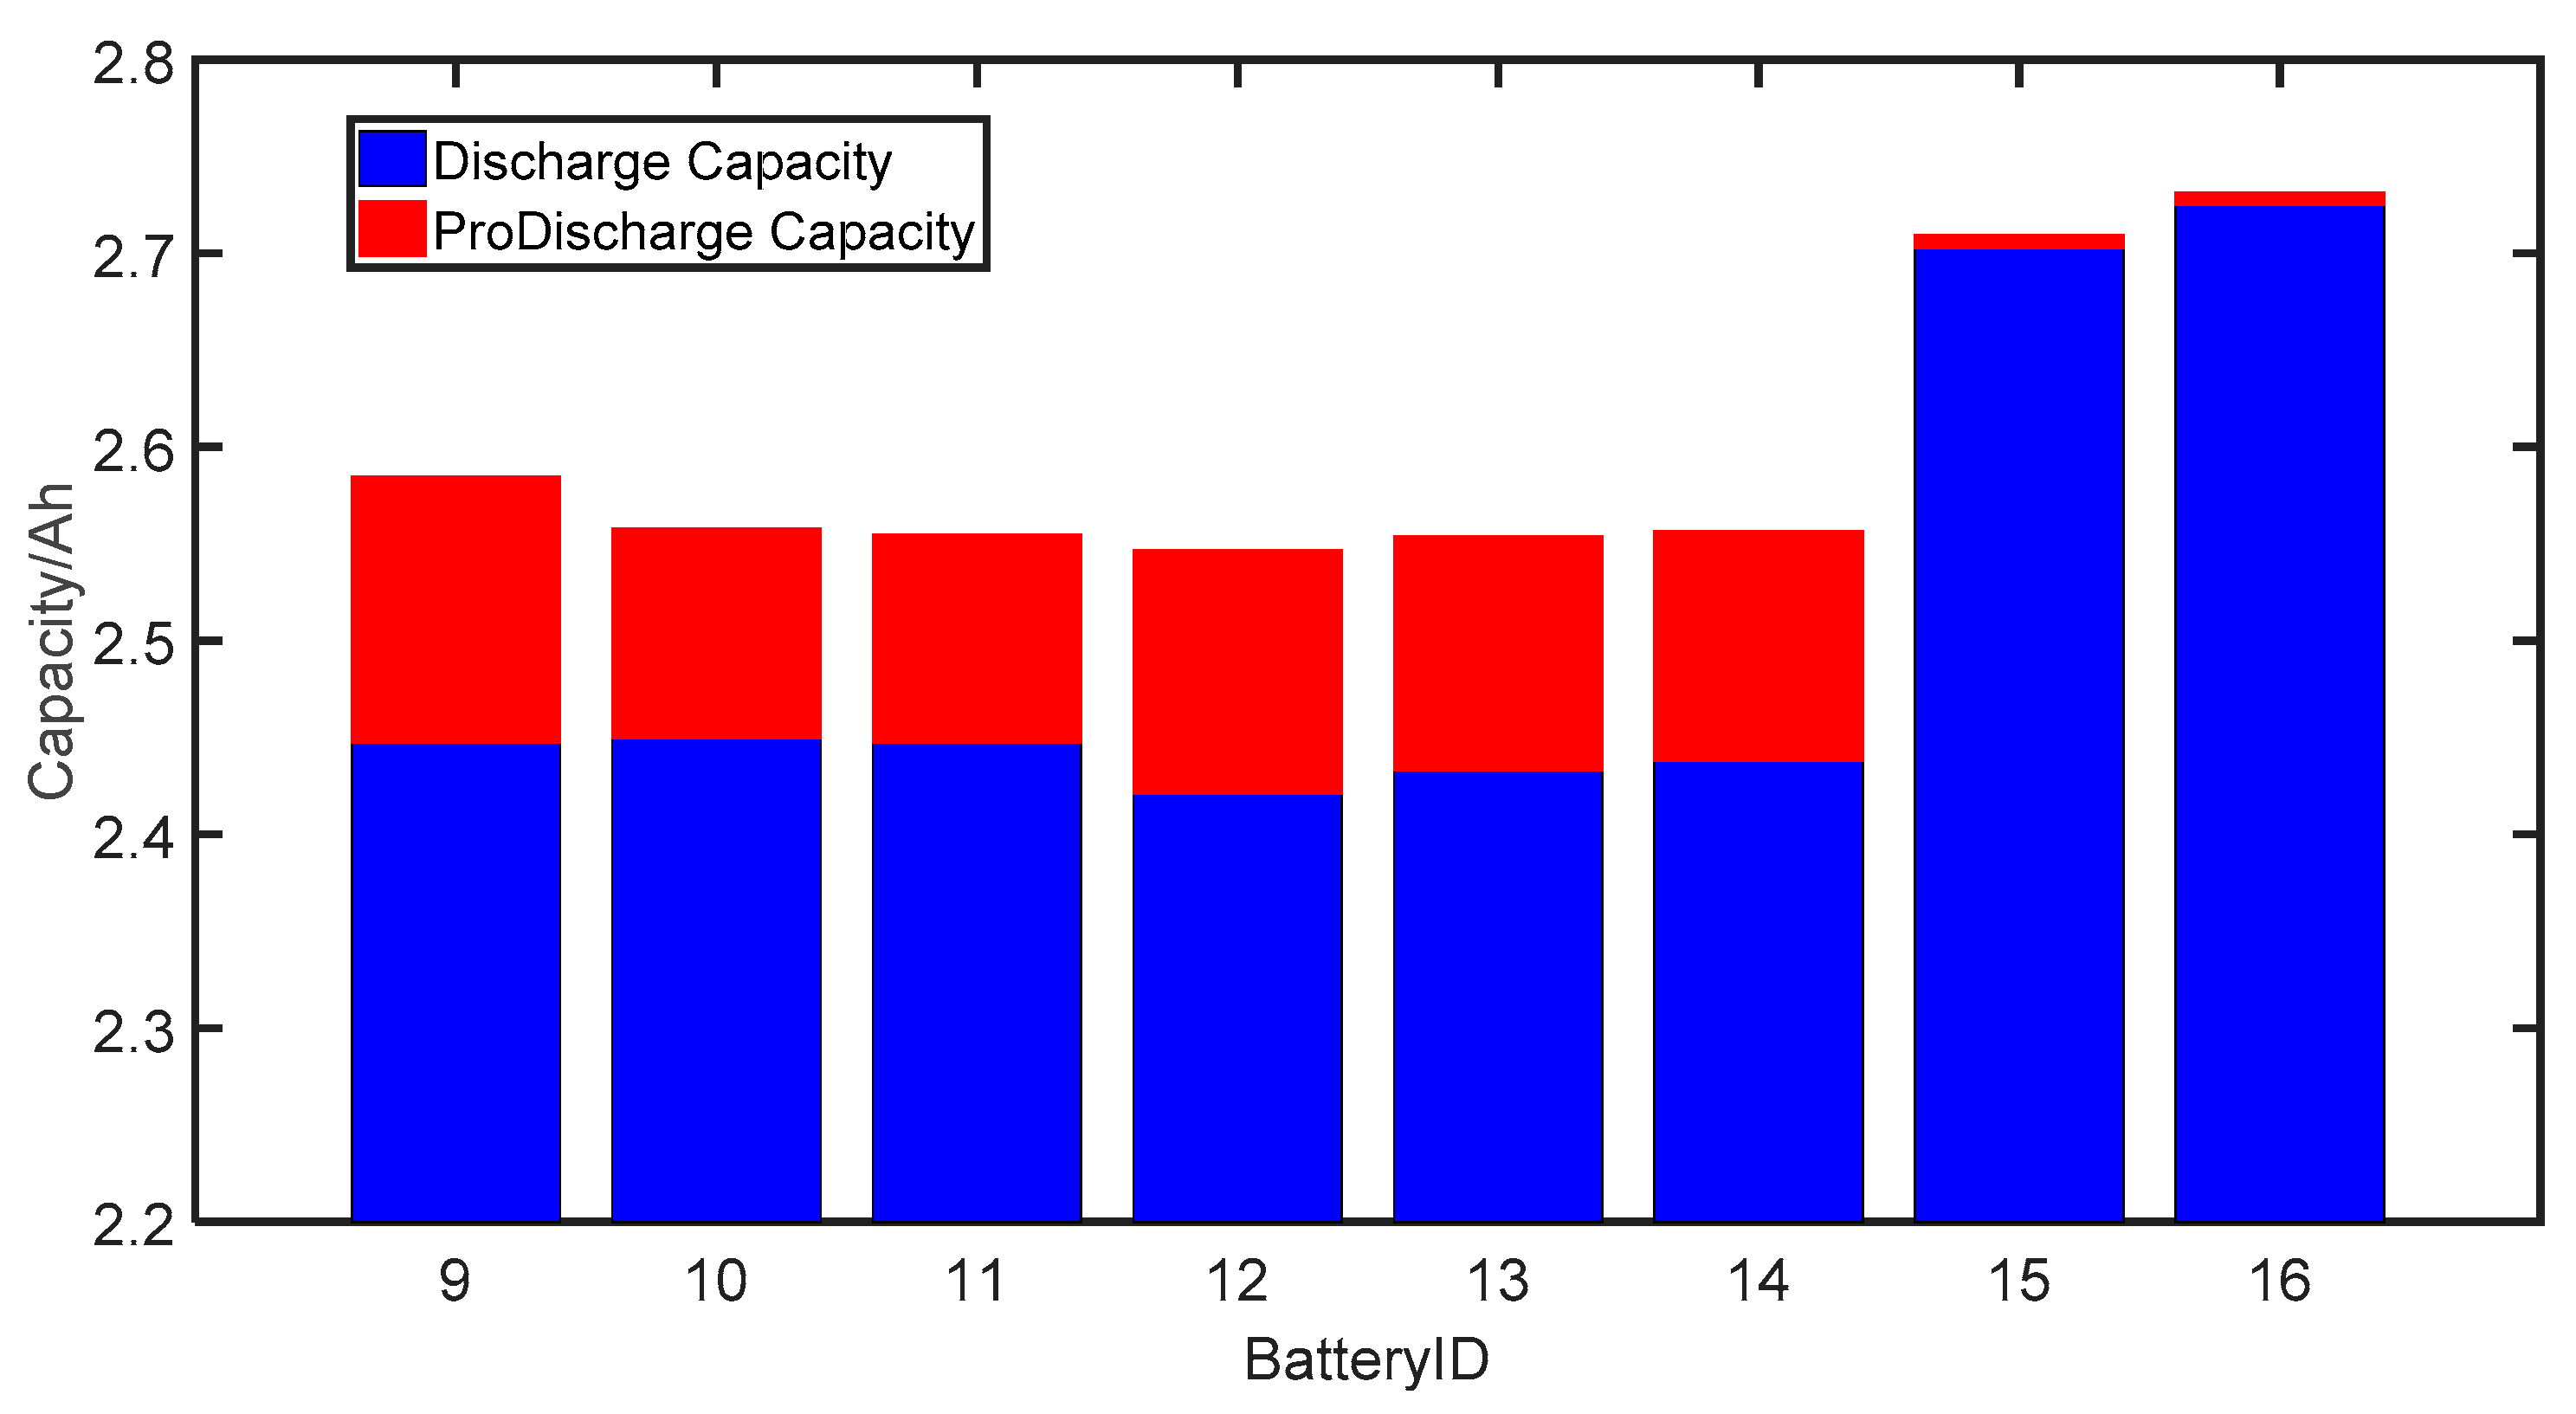
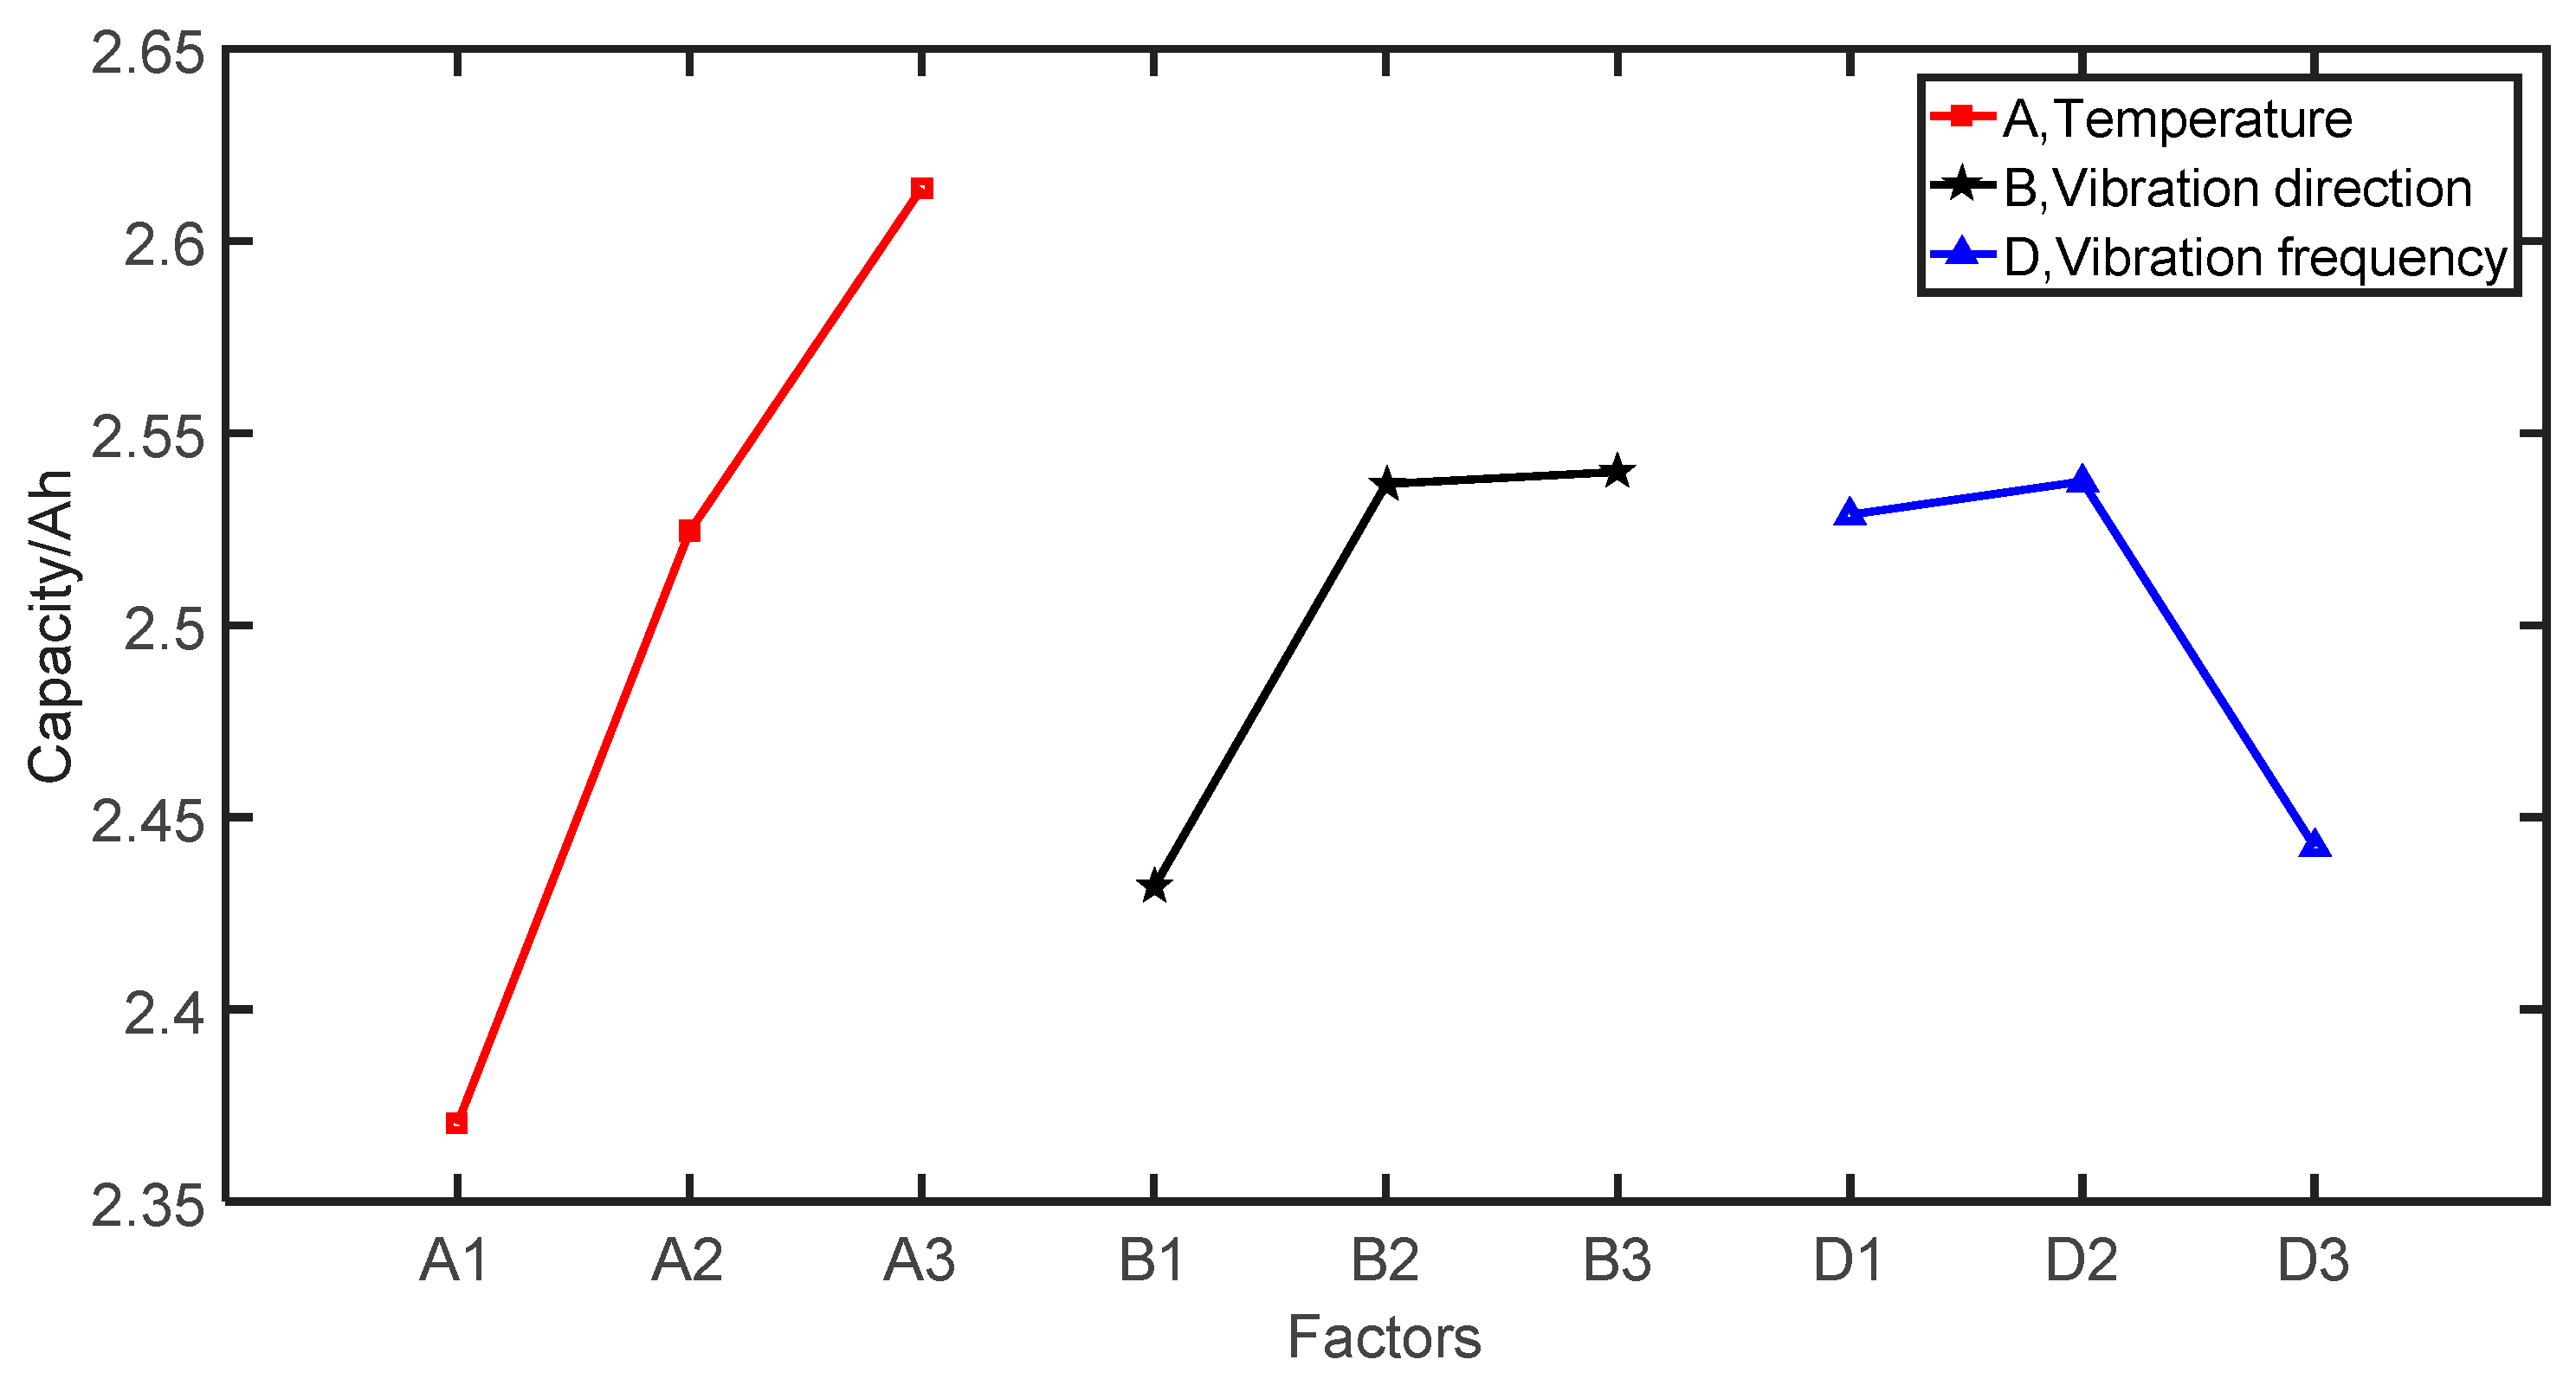
Table 1.
The discharge capacity at different C-rates.
| Battery ID | Capacity (Ah) at Low-Rate | Capacity (Ah) at High-Rate | |||||
|---|---|---|---|---|---|---|---|
| 0.1C | 0.2C | 1/3C | 0.5C | 1C | 3/2C | 2C | |
| Cell 01 | 2.8509 | 2.8083 | 2.7500 | 2.7102 | 2.7293 | 2.7536 | 2.7752 |
| Cell 02 | 2.7637 | 2.7797 | 2.7421 | 2.7181 | 2.7075 | 2.7301 | 2.7486 |
| Cell 03 | 2.7986 | 2.8111 | 2.7781 | 2.7533 | 2.7501 | 2.7696 | 2.7818 |
| Cell 04 | 2.8197 | 2.7882 | 2.7280 | 2.6892 | 2.7084 | 2.7265 | 2.7445 |
| Cell 05 | 2.7575 | 2.7776 | 2.7504 | 2.7250 | 2.7210 | 2.7386 | 2.7514 |
| Cell 06 | 2.8260 | 2.7933 | 2.7620 | 2.7503 | 2.7359 | 2.7544 | 2.7666 |
| Cell 07 | 2.7943 | 2.8055 | 2.7694 | 2.7431 | 2.7391 | 2.7635 | 2.7823 |
| Cell 08 | 2.7902 | 2.8098 | 2.7769 | 2.7542 | 2.7520 | 2.7764 | 2.7895 |
Table 2.
Charging and discharging steps of NCR18650PF LIBs.
| Battery Test Procedures | Start Voltage (V) | End Voltage (V) | Start Current (A) | End Current (A) | Capacity (Ah) | Duration Time (h:min:s.ms) |
|---|---|---|---|---|---|---|
| CC_Dchg | 4.0240 | 2.5000 | −2.8965 | −2.8999 | 2.6519 | 0:54:52.400 |
| Rest | 2.5930 | 3.3339 | 0.0000 | 0.0000 | 0.0000 | 1:00:00.000 |
| CC-CV_Chg | 3.4449 | 4.2013 | 2.8976 | 0.0580 | 2.7048 | 1:50:32.200 |
| Rest | 4.1796 | 4.1617 | 0.0000 | 0.0000 | 0.0000 | 1:00:00.000 |
Table 3.
The discharge capacity and pro-discharge capacity of batteries.
| Battery Cell ID | Cell 9 | Cell 10 | Cell 11 | Cell 12 | Cell 13 | Cell 14 | Cell 15 | Cell 16 |
|---|---|---|---|---|---|---|---|---|
| discharge capacity | 2.4476 | 2.4497 | 2.4474 | 2.4211 | 2.4333 | 2.4382 | 2.7026 | 2.725 |
| pro-discharge capacity | 0.1371 | 0.1081 | 0.1073 | 0.1254 | 0.1205 | 0.1185 | 0.0067 | 0.0064 |
| total discharge capacity | 2.5847 | 2.5578 | 2.5547 | 2.5465 | 2.5538 | 2.5567 | 2.7093 | 2.7314 |
Table 4.
The discharge capacity samples under different vibration frequency conditions.
| Battery Cell ID | No Vibration | F = 5 Hz | F = 10 Hz | F = 20 Hz | Battery Cell ID | No Vibration | F = 30 Hz | F = 40 Hz | F = 50 Hz |
|---|---|---|---|---|---|---|---|---|---|
| Cell 1 | 2.611 | 2.427 | 2.500 | 2.509 | Cell 5 | 2.612 | 2.582 | 2.615 | 2.611 |
| Cell 2 | 2.584 | 2.375 | 2.406 | 2.493 | Cell 6 | 2.618 | 2.590 | 2.617 | 2.612 |
| Cell 3 | 2.617 | 2.397 | 2.408 | 2.506 | Cell 7 | 2.620 | 2.573 | 2.618 | 2.611 |
| Cell 4 | 2.614 | 2.373 | 2.415 | 2.500 | Cell 8 | 2.618 | 2.555 | 2.618 | 2.616 |
Table 5.
The rank of sample.
| Battery Cell ID | Cell 4 | Cell 2 | Cell 3 | Cell 1 | Cell 2 | Cell 1 | Cell 4 | Cell 3 |
|---|---|---|---|---|---|---|---|---|
| Sample Z | Z1 | Z2 | Z3 | Z4 | Z5 | Z6 | Z7 | Z8 |
| Sample Y | 2.373 | 2.375 | 2.397 | 2.427 | ||||
| Sample X | 2.584 | 2.611 | 2.614 | 2.617 | ||||
| Rank r = i | 1 | 2 | 3 | 4 | 5 | 6 | 7 | 8 |
Table 6.
Wilcoxon Rank-Sum results.
| Frequency | Rank Sum T | n1 = 4, n2 = 4, α = 0.05 | p-Value | Results | |
|---|---|---|---|---|---|
| T1 = 12 | T2 = 24 | ||||
| F = 5 Hz | 10 (26) | T < T1 OR T > T2 | 0.0286 < α | Accept H1 | |
| F = 10 Hz | 10 (26) | T < T1 OR T > T2 | 0.0286 < α | Accept H1 | |
| F = 20 Hz | 10 (26) | T < T1 OR T > T2 | 0.0286 < α | Accept H1 | |
| F = 30 Hz | 10 (26) | T < T1 OR T > T2 | 0.0286 < α | Accept H1 | |
| F = 40 Hz | 16 (20) | T1 ≤ T ≤ T2 | 0.6571 > α | Accept H0 | |
| F = 50 Hz | 12 (24) | T1 ≤ T ≤ T2 | 0.0857 > α | Accept H0 | |
Table 7.
The resistance of batteries under no vibration and vibration conditions with different vibration frequency of 5 Hz/10 Hz/20 Hz/30 Hz/40 Hz/50 Hz.
Table 7.
The resistance of batteries under no vibration and vibration conditions with different vibration frequency of 5 Hz/10 Hz/20 Hz/30 Hz/40 Hz/50 Hz.
| Vibration Conditions | Battery Cell ID | F = 5 Hz | F = 10 Hz | F = 20 Hz | F = 30 Hz | F = 40 Hz | F = 50 Hz |
|---|---|---|---|---|---|---|---|
| Before F = 0 | Cell 1 | 35.691 | 34.618 | 35.518 | 34.618 | 39.549 | 42.553 |
| Cell 2 | 40.622 | 38.243 | 40.174 | 38.243 | 39.538 | 42.139 | |
| Cell 3 | 38.874 | 34.394 | 35.014 | 34.394 | 38.061 | 39.981 | |
| Cell 4 | 38.253 | 41.020 | 44.261 | 41.020 | 34.661 | 40.183 | |
| After F = 5, 10, 20 30, 40, 50 | Cell 1 | 44.266 | 44.680 | 36.144 | 38.898 | 39.794 | 42.139 |
| Cell 2 | 41.299 | 38.909 | 41.283 | 42.155 | 41.082 | 41.506 | |
| Cell 3 | 37.194 | 33.777 | 37.603 | 37.603 | 38.051 | 52.383 | |
| Cell 4 | 45.502 | 42.290 | 46.156 | 47.018 | 39.115 | 39.981 |
Table 8.
The resistance of batteries under the non-vibration and the vibration conditions applied in the Z/X/Y-directions.
Table 8.
The resistance of batteries under the non-vibration and the vibration conditions applied in the Z/X/Y-directions.
| Battery Cell ID | Non-Vibration | Z-Direction | X-Direction | Y-Direction |
|---|---|---|---|---|
| Cell 1 | 35.6958 | 38.4894 | 38.9324 | 40.2138 |
| Cell 2 | 40.8403 | 43.6448 | 44.669 | 43.4378 |
| Cell 3 | 35.0484 | 40.8079 | 41.4685 | 40.6011 |
| Cell 4 | 38.0161 | 37.6025 | 38.219 | 45.3292 |
| Cell 5 | 37.4151 | 34.6528 | 34.2045 | 42.3463 |
| Cell 6 | 41.6868 | 38.8939 | 38.4748 | 46.4106 |
| Cell 7 | 44.0598 | 39.1298 | 38.2679 | 43.6117 |
| Cell 8 | 48.3504 | 41.7184 | 40.8748 | 49.2131 |
Table 9.
The resistance samples of batteries and corresponding ranks in order under the vibration conditions applied in Z/X/Y-directions.
Table 9.
The resistance samples of batteries and corresponding ranks in order under the vibration conditions applied in Z/X/Y-directions.
| Directions and Ranks | Resistance of Batteries and Corresponding Ranks | |||||||
|---|---|---|---|---|---|---|---|---|
| Z-direction | 38.4894 | 43.6448 | 40.8079 | 37.6025 | 34.6528 | 38.8939 | 39.1298 | 41.7184 |
| Rank | 7 | 20 | 13 | 3 | 2 | 8 | 10 | 16 |
| X-direction | 38.9324 | 44.6690 | 41.4685 | 38.2190 | 34.2045 | 38.4748 | 38.2679 | 40.8748 |
| 9 | 21 | 15 | 4 | 1 | 6 | 5 | 14 | |
| Y-direction | 40.2138 | 43.4378 | 40.6011 | 45.3292 | 42.3463 | 46.4106 | 43.6117 | 49.2131 |
| 11 | 18 | 12 | 22 | 17 | 23 | 19 | 24 | |
Table 10.
The results of the multiple comparison test.
| Two Samples | Left Limit of Confidence Interval | Rank Mean Difference | Right Limit of Confidence Interval | p-Value |
|---|---|---|---|---|
| Z/X | −7.7862 | 0.5 | 8.7862 | 0.9890 |
| Z/Y | −16.6612 | −8.375 | −0.0887 | 0.0469 |
| X/Y | −17.1612 | −8.875 | −0.5887 | 0.0323 |
Table 11.
The levels of all factors.
| Factor Level | Temperature (°C) | Vibration Frequency (Hz) | Vibration Direction |
|---|---|---|---|
| 1 | −15 | 10 | X |
| 2 | 15 | 20 | Y |
| 3 | 45 | 30 | Z |
Table 12.
The orthogonal table plans.
| Test No. | A Temperature (°C) | B Vibration Frequency (Hz) | C Blank Column | D Vibration Direction |
|---|---|---|---|---|
| 1 | 1 (−15) | 1 (10) | 1 | 1 (X) |
| 2 | 1 | 2 (20) | 2 | 2 (Y) |
| 3 | 1 | 3 (30) | 3 | 3 (Z) |
| 4 | 2 (15) | 1 | 2 | 3 |
| 5 | 2 | 2 | 3 | 1 |
| 6 | 2 | 3 | 1 | 2 |
| 7 | 3 (45) | 1 | 3 | 2 |
| 8 | 3 | 2 | 1 | 3 |
| 9 | 3 | 3 | 2 | 1 |
Table 13.
The discharge capacity of nine sets of test.
| Test No. | Cell 17 | Cell 18 | Cell 19 | Cell 20 |
|---|---|---|---|---|
| 1 | 2.3329 | 2.3497 | 2.3533 | 2.3317 |
| 2 | 2.4207 | 2.4347 | 2.4153 | 2.4105 |
| 3 | 2.3569 | 2.3921 | 2.3784 | 2.3638 |
| 4 | 2.3749 | 2.4091 | 2.3946 | 2.3505 |
| 5 | 2.5942 | 2.6229 | 2.6210 | 2.5926 |
| 6 | 2.6039 | 2.6454 | 2.6467 | 2.6181 |
| 7 | 2.5876 | 2.6302 | 2.6240 | 2.5981 |
| 8 | 2.5951 | 2.6073 | 2.6046 | 2.5710 |
| 9 | 2.6589 | 2.6992 | 2.6884 | 2.6534 |
Table 14.
The range analysis of the discharge capacity of the Cell 17.
| Test No. | A Temperature (°C) | B Vibration Frequency (Hz) | C Blank Column | D Vibration Direction | Evaluation Index |
|---|---|---|---|---|---|
| 1 | −15 | 10 | 1 | X | 2.3329 |
| 2 | −15 | 20 | 2 | Y | 2.4207 |
| 3 | −15 | 30 | 3 | Z | 2.3569 |
| 4 | 15 | 10 | 2 | Z | 2.3749 |
| 5 | 15 | 20 | 3 | X | 2.5942 |
| 6 | 15 | 30 | 1 | Y | 2.6039 |
| 7 | 45 | 10 | 3 | Y | 2.5876 |
| 8 | 45 | 20 | 1 | Z | 2.5951 |
| 9 | 45 | 30 | 2 | X | 2.6589 |
| k1 | 2.3702 | 2.4318 | 2.5106 | 2.5287 | |
| k2 | 2.5243 | 2.5367 | 2.4848 | 2.5374 | |
| k3 | 2.6139 | 2.5399 | 2.5129 | 2.4423 | |
| R | 0.2437 | 0.1082 | 0.0280 | 0.0951 | |
| Range size | RA = 0.2437 > RB = 0.1082 > RD = 0.0951 | ||||
Table 15.
The range analysis of the discharge capacity of the cells 17/18/19/20.
| Test No. | A Temperature (°C) | B Vibration Frequency (Hz) | C Blank Column | D Vibration Direction |
|---|---|---|---|---|
| Cell 17 | 0.2437 | 0.1082 | 0.0280 | 0.0951 |
| Cell 18 | 0.2534 | 0.1159 | 0.0341 | 0.1006 |
| Cell 19 | 0.2567 | 0.1139 | 0.0417 | 0.1028 |
| Cell 20 | 0.2388 | 0.1183 | 0.0467 | 0.1138 |
| RA > RB > RD | ||||
Table 16.
The analysis of variance.
| Factor | SSD | DOF | MSD | F-Value | Limit Value | Significance |
|---|---|---|---|---|---|---|
| A | 0.091 | 2.000 | 0.046 | 62.605 | F0.1(2, 2) = 9 | ** |
| B | 0.023 | 2.000 | 0.011 | 15.596 | F0.05(2, 2) = 19; | * |
| D | 0.017 | 2.000 | 0.008 | 11.391 | F0.01(2, 2) = 99 | * |
| C(Se) | 0.001 | 2.000 | 0.001 | |||
© 2018 by the authors. Licensee MDPI, Basel, Switzerland. This article is an open access article distributed under the terms and conditions of the Creative Commons Attribution (CC BY) license (http://creativecommons.org/licenses/by/4.0/).
Share and Cite
MDPI and ACS Style
Zhang, L.; Mu, Z.; Gao, X. Coupling Analysis and Performance Study of Commercial 18650 Lithium-Ion Batteries under Conditions of Temperature and Vibration. Energies 2018, 11, 2856. https://doi.org/10.3390/en11102856
AMA Style
Zhang L, Mu Z, Gao X. Coupling Analysis and Performance Study of Commercial 18650 Lithium-Ion Batteries under Conditions of Temperature and Vibration. Energies. 2018; 11(10):2856. https://doi.org/10.3390/en11102856
Chicago/Turabian StyleZhang, Lijun, Zhongqiang Mu, and Xiangyu Gao. 2018. "Coupling Analysis and Performance Study of Commercial 18650 Lithium-Ion Batteries under Conditions of Temperature and Vibration" Energies 11, no. 10: 2856. https://doi.org/10.3390/en11102856
Note that from the first issue of 2016, this journal uses article numbers instead of page numbers. See further details here.