Marine Current Energy Converters to Power a Reverse Osmosis Desalination Plant


Division of Electricity, Uppsala University, 751 05 Uppsala, Sweden
*
Author to whom correspondence should be addressed.
Energies 2018, 11(11), 2880; https://doi.org/10.3390/en11112880
Submission received: 5 October 2018
/
Revised: 16 October 2018
/
Accepted: 22 October 2018
/
Published: 24 October 2018
(This article belongs to the Special Issue Renewable Energy for Water Desalination)
Abstract
:Some countries are facing issues on freshwater and electricity production, which can be addressed with the use of renewable energy powered desalination systems. In the following study, a reverse osmosis desalination plant powered by marine current energy converters is suggested. The marine current energy converters are designed at Uppsala University in Sweden, specifically for utilizing low water speeds (1–2 m/s). Estimations on freshwater production for such a system, in South Africa, facing the Indian Ocean was presented and discussed. It is concluded that the desalination plant cannot by itself supply freshwater for a population all the time, due to periods of too low water speeds (<1 m/s), but for 75% of the time. By using ten marine current energy converters, each with a nominal power rating of 7.5 kW, combined with a reverse osmosis desalination plant and water storage capacity of 2800 m3, it is possible to cover the basic freshwater demand of 5000 people. More studies on the hydrokinetic resource of the Western Indian Ocean, system cost, technology development, environmental and social aspects are necessary for more accurate results.
1. Introduction
In recent years, there has been an evident need to include more renewable energy sources (RES) in the electricity production globally. Different parts of the world, e.g., Sub-Saharan Africa, face combined problems with lack of electricity, freshwater and food (water-energy-food nexus [1]), and there are incitements to solve these problems simultaneously, in a collaborative and holistic way. Desalination systems are today used to remove the salt from salty water (most commonly seawater [2]). The produced freshwater can be used for e.g., agriculture, industry or in a household. However, desalination consumes a lot of energy, which is sometimes supplied by fossil fuel based power [3]. The negative sustainability aspects of this has enhanced research and commercialization of desalination plants powered by RES [4]. So far, a lot of the focus has been drawn towards desalination powered by solar [5] or wind, but other different RES has been studied [6]. Considering these huge correlated issues regarding water, energy and food, and including the fact that 70% of our globe consists of water: the option to use ocean energy to power a desalination process of seawater is interesting [7,8,9]. The topic of this paper is utilization of marine current energy converters (hydro-kinetic energy) for powering desalination plants [10].
One of the drawbacks with RES for electricity production is the intermittency or unpredictability of the source. However, tides (generated by forces between the moon, sun and earth) are very predictable, and not too dependent on local weather conditions, and many ocean- or river currents are continuously flowing, i.e., have a relatively low variability in comparison to for example solar and wind. The development of tidal energy converters (TECs) and marine current energy converters (MCCs) are still at an early stage, but the opportunities of utilizing tides or marine currents have gained interest. For example, one recent review paper discusses the economic aspects of TECs [11] and another presents the challenges with increased tidal energy using a PESTEL (political, economic, social, technological, environmental and legal) analysis [12]. Other more general reviews on the marine current or tidal energy converters are given in e.g., [13,14].
The aim of this paper is to initiate the work with marine current powered desalination, investigating production of freshwater and/or electricity locally, using marine current energy converters. Specifically, a brief case study for the western Indian Ocean (WIO) is presented for a location outside eastern South Africa, focusing on the marine current energy technology developed at Uppsala University in Sweden, in combination with a reverse osmosis (RO) desalination plant. This type of off-grid system, including MCCs connected to an RO desalination plant, may also be applicable in the event of natural disasters, where there is an urgent need to set up the basic societal structures with electricity for medical devices, freshwater supply etc.
1.1. Uppsala Marine Current Energy Converter
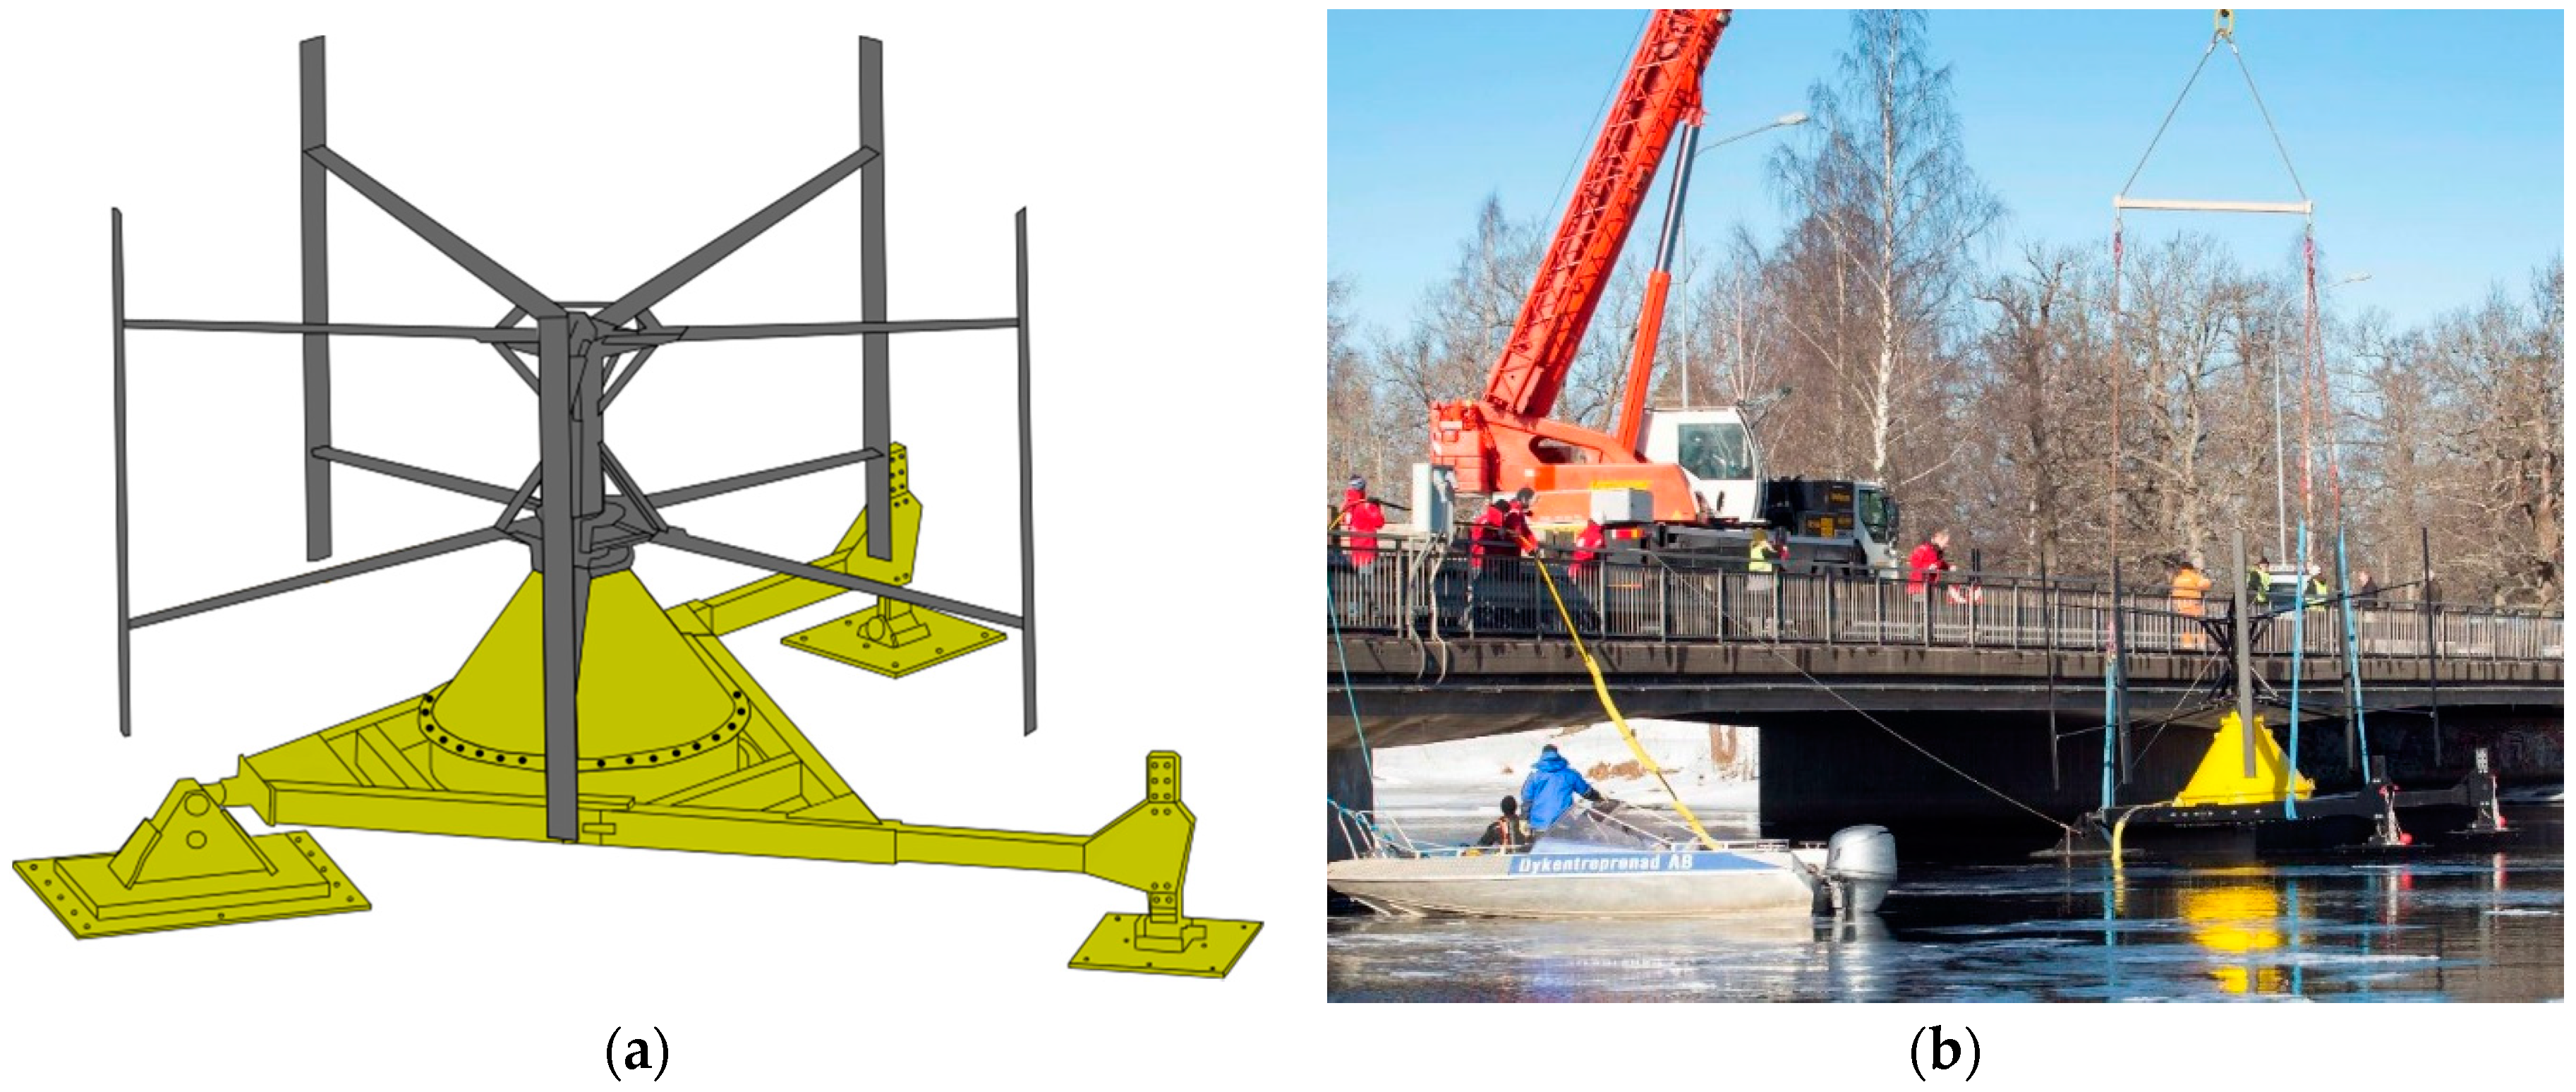
The MCC at Uppsala University produces power from the motion of streaming water (i.e., from a hydro-kinetic energy source) using a vertical axis fixed-pitch turbine directly connected to a permanent magnet generator, with similarities to wind energy converters. The Nd2Fe14B magnet based synchronous generator has been developed at the Division of Electricity (http://www.teknik.uu.se/electricity/research-areas/marine-currents/ (accessed on 31 July 2018)) at Uppsala University, and used in offshore experiments. A sketch of the device is shown in Figure 1a. The marine current device has five 3.5 m long vertical blades and a radius of 3 m, to give a total cross-sectional area of 21 m2. The MCC was first deployed at the experimental site in Söderfors in the river Dal (Dalälven, depth: 7 m), Sweden, in 2013 [15] and the same device is still used for experiments at the site. The device is installed downstream of a hydropower plant, so the water flow is regulated. Figure 1b shows a photo of the deployment from [15]. The nominal speed and power output of the generator is 15 rpm and 7.5 kW, respectively. It is beyond the scope of this paper to study the magnetic circuit of the MCC, but the rare-earth magnets could be changed to i.e., ferrite permanent magnets in order to improve the sustainability of the system, as discussed for wave power in [16]. The added extra weight of using ferrite magnets instead of Nd2Fe14B magnets is not an issue for the converter as it is placed on the bottom of the river or sea, but may introduce difficulties related to the deployment.
The large Uppsala MCC generator with many magnetic poles (here almost 2 m in diameter [17] and 112 poles [18]) generates power from lower water flow velocities than most TECs and MCCs. In fact, in contrast to many other hydro-kinetic energy converters, this device is built to be efficient at water speeds lower than those regarded to low by most other marine current technologies, 2 m/s, with a rated water velocity of 1.4 m/s [18]. Vertical axis turbines (VATs) are not as common as horizontal axis TECs. However, the VAT enables power generation from streaming water from all incoming directions (omnidirectional). Moreover, the simplicity of a direct driven system is an advantage due to reduced need of maintenance related to the pitch of the blades, yawing system and gearbox that for wind power turbines consisted of up to 42% of the down time according to [19]. The Uppsala marine current energy converter can produce power in water speeds ranging from about 1 m/s up to almost 2 m/s. The power coefficient curve of the turbine has been experimentally derived in [20] to have a peak efficiency of 0.26 when run at optimal tip-speed-ratio (TSR), i.e., the ratio between water speed and speed of the blades. If the water speed is lower than 1.0 m/s, the turbine cannot produce a net positive hydrodynamic torque, and if the water speed is higher than 2 m/s, the loads on the struts and blades may be too high, for the specific design. At higher water speeds than 2 m/s, the turbine can be operated at a point where the power capture and rotational speed is lower, to ensure the safety of the device.
To measure the flow of the water in the river and how it is affected by the marine current turbine, Acoustic Doppler Current Profilers (ADCPs) are used. The MCC system can be controlled in order to improve its average power output, although aspects of more complicated or costly electrical systems, increasing maintenance demands, can be considered [21]. The visibility of the marine current device is rather low, only leading to vorticities on the water surface. Marine current energy converters lead to an environmental impact, and environmental concerns for the specific location should be addressed before installation. Coastal communities often rely on fishery etc., but the marine current device proposed is put on the seabed, a couple of meters below the sea surface, allowing for ships to pass over the energy converters while generating electricity.
Power from a Vertical Axis Turbine
The power available in streaming water, [W], depends on the velocity of the streaming water, according to the equation:
where [m2] is the projected cross section of the vertical axis turbine rotor, [kg/m3] is the density of water and [m/s] is the water velocity [m/s]. The hydrodynamic efficiency of the turbine is described by the power coefficient, , which is the relation between the power absorbed by the turbine and the power available in the undisturbed water flow, written as
for the power output, [W], from the turbine. The power absorbed by the turbine depends on the ratio of the speed of the tip of the blade to the water speed, the TSR, calculated as
for a turbine angular velocity, [rad/s], and a radius of the turbine, [m]. For the MCC used in Söderfors, Sweden, as stated earlier, the maximum power coefficient is 0.26, generated at a tip speed ratio of 3.1.
1.2. Reverse Osmosis Desalination
Seawater has typically total dissolved solids (TDS) of at least 35,000 mg/L. In contrast, good drinkable water is about 600 mg/L [22]. The daily basic human freshwater need for drinking and hygiene is at least 20 L per person [23]. The energy consumption of desalination varies with chosen desalination process, salinity and temperature of inlet water, requirements on product water etc. Today, membrane desalination techniques (such as RO) are more common than thermal desalination. RO is the most common desalination technology, with a total cumulative contracted capacity in the world of about 99.8 million m3/day [2]. Seawater reverse osmosis (SWRO) for production of drinkable water requires about 2.5–4 kWh/m3 [3,24]. Currently, the cost of SWRO desalinated water varies with different parameters, such as location [25], and desalination plants can be of different sizes and for different purposes. In [5], solar powered desalination for three different sizes of freshwater (and electricity) demands was investigated: small demand of less than 100 m3/day, intermediate demand of 100 to 25,000 m3/day, and high demand of 25,000 m3/day and 10 MW. However, very large desalination plants produce hundred thousand m3 freshwater each day (e.g., the contracted SWRO-plant Shoaiba 4 in Saudi Arabia, 400,000 m3/day) [2]. Considering reverse osmosis desalination, the intermittency of RES may decrease the lifetime of the RO membranes and have negative effects on the overall performance of the desalination system [26]. Safe storage and distribution of freshwater is an important question, but out of the scope of this paper. As several regions rely to a large extent on desalinated water or other water related systems, the event of accidents involving a shutdown of desalination plants or damage of parts of the water system, or possible natural catastrophes disrupting the water access etc., highlights the necessity of e.g., water storage [27,28]. Water storage systems can also be beneficial for desalination systems during periods where the water production is lower, due to e.g., RES intermittency, or to balance up periods of higher water demands from the consumers.
1.3. Freshwater Demand and Marine Currents by the WIO
Some of the countries facing the WIO have very limited access to safely managed drinking water and sanitation services. According to [29], the percentage of the population with access to at least a basic freshwater source in 2015 was 40% in Somalia, 58% in Kenya, 50% in Tanzania, 47% in Mozambique and 51% in Madagascar; in contrast, 85% of the South African population had access to a basic freshwater source. The freshwater situation for parts of Kenya, Comors Islands and Tanzania, facing the WIO, is reflected in [30], discussing e.g., that there may be a disparity of access to drinkable water within the same region and that many households in the studied areas used very little water with respect to the basic human needs. Few studies have discussed the potential of using marine renewable energy sources in the WIO, especially by the coastline of some of the poorest African countries, and there are not many published research articles on the hydro-kinetic energy resource there. The ocean waves in the WIO outside the Kenyan region Kilifi was analyzed in [31] for wave powered desalination purposes. The tidal- and marine current resource for parts of the WIO was briefly analyzed in [32], including investigations of parts of Kenya, Tanzania, Mozambique and Madagascar facing the WIO. It was concluded e.g., that tidal currents from 1.5 m/s to 4.5 m/s were determined at some meters depth for the different sites, and that marine currents occurred differently during two monsoon seasons, with a mean speed of 0.5 m/s to 1.2 m/s for the different regions, and a maximum water speed of 1.9 m/s [32]. In [33,34], the speed of the Agulhas Current, as it passes some coastal regions in eastern South Africa (Cape Morgan, north and south East London, Fish River and Port Edward), was determined using ADCPs, and the potential of power generation from the current was discussed.
2. Case Study: Western Indian Ocean
The following case study discusses a marine current powered RO desalination plant in South Africa, facing the WIO. The study aims to provide rough a step-by-step method to estimate the capability of a certain site to supply a population with freshwater. The method will not include any cost considerations since the technology used for the study is not commercially launched yet. An investigation will be made of the resource, turbine placement, array configuration and a proposed electrical system for desalination purposes. In the following, the data on current speed etc. presented in [33,34] will be used for a case study on marine current powered desalination by East London in South Africa, shown in Figure 2.
2.1. Estimating Water Speed and Determining Turbine Placement
The ADCP data from [34], acquired during one year from August 2009 in the north part of East London in South Africa, gives average water speed values at the depths of about 30 to 50 m at the site; this is shown in Figure 3. The red and yellow dashed lines correspond to the lowest and highest limits of water speed the turbine can convert to electrical energy. If the water speed would exceed the highest limit for the turbine (not applicable for this site), a control system can be implemented in a similar way that is currently done for wind power, to reduce the power captured by the turbine by changing the operating point of the turbine.
Furthermore, Reference [34] investigates how the vertical water speed profile varies with distance from shore and water depth, and their estimated results are shown in Table 1, with a base value of 1.0; no values are given where it is an assumed seabed. As can be seen in Table 1, the water speed decreases closer to the shore and also the deeper it gets; this can be used to determine the most suitable place for the energy converter depending on its rating and desired output. Here, we assume that we can utilize the water speeds described in with the speed profile in Table 1: 0–50 m deep and 51–100 m from the coastline, and that this corresponds to the water speed profile in Figure 3. However, to utilize the free flowing water at a water depth higher up from the bottom, the MCC may have to be put on a structure or to include a tower between the generator and the turbine. One could also consider using one device with a taller turbine, instead of several smaller turbines, that would reach the desired water depth. Since the focus of this study is the possibilities of supplying freshwater using the marine current resource, and not the costs relating to installation, an exact design choice of the converter turbine is outside the scope of the paper.
To increase the total power output, one can install multiple marine current converters. Each turbine will produce a wake that interacts with the other turbines and their wakes, meaning that if the devices are placed close to each other, they will operate at different power capture points. The incident water angle will affect the power capture for each turbine. Numerical simulations of the effect of spacing (distance between turbine centers) between turbines and incident water angle are presented in [35]. The range of incident angles present for the specific site chosen should be investigated, to determine what device spacing is appropriate. Figure 4 shows the incident angles of the streaming water presented in [34] for the South African site, but here plotted in relation to the starting position angle. For most part of the year, the angles vary between −40 and +40 degrees, and for a few short durations during the year, the angles reach −80 degrees. According to Figure 2 in [35], the average power coefficient reduces maximum 2% with a spacing of 6 turbine diameters and an incident angle of 80%.
2.2. Suggested System of Marine Current Driven Desalination
In the following, it is assumed that a small coastal community or facility (e.g., school or hospital) is in need of freshwater. A SWRO plant, with the assumed energy demand of 4 kWh/ m3 [3,24], will be driven off-grid by an array of ten MCCs to produce drinkable water. In this rough estimation, the marine current resource measured for East London, South Africa, will be used, as presented in [34]. The structure of the analysis made in this paper is similar to previous analysis regarding wave powered desalination outside Kenya, presented in [31,36]. The design and parameters of the low-speed generator at the marine current power group at Uppsala University will be used in the case study. The turbine is connected to a permanent magnet synchronous generator (PMSG). The design of the generator makes it efficient at the low rotational speeds [18]. The efficiency of the generator is in the experiments in [18] found to be at least 80% for all rotational speeds and gives an output line-to-line voltage of 150 VRMS at nominal operation. Since the generator is a variable-speed machine, the electrical frequency and the output voltage the generator produces needs to be converted to fit the requirement of the desalination plant.
The proposed topology for the electrical system can be seen in Figure 5. The final system will however include ten MCCs and water storage system. The output of each MCC, 3-phase AC, is connected to one joint DC bus link using rectifiers. Then the DC voltage is boosted for the transmission cable, and finally, an inverter is included before the RO plant. It is assumed that the energy converters are located with a distance of five turbine diameters from each other, as to not affect each other significantly, about 1 km out from the shore.
The electrical output of the MCC will be simplified to depend on the power in the undisturbed water, described in Equation (1), multiplied by the number of MCCs, , and constants that represent the efficiency of the system, assuming that the turbine operates at optimal tip-speed-ratio. Experimental results of the MCC coupled to a passive rectifier are presented in [21], concluding the efficiency of the system was 19%. The boost converter and inverter are assumed to have a total efficiency of 90%. The losses in the transmission line will depend on the chosen voltage level and the resistance of the cable. Power losses of about 3% are expected for a 1 km cable delivering 50 kW at 400 VDC. The difference in incoming water direction results in reduced power by about 2% (as described in Section 2.2). The full simplified expression for the power [W] delivered from the chosen MCC to the RO plant is:
There are several assumptions made to estimate how many people the MCC powered RO plant can sustain per week. The power reaching the RO plant is calculated using Equation (4) and multiplied with 168 h/week to receive the energy from the system in Wh/week. The operation of ten converter units is assumed. Also, it is assumed that the desalination plant needs 4 kWh/m3 and a basic daily personal freshwater need of 20 L/day, resulting in 0.14 m3/week and person. An expression for the estimated amount of people that will be supplied with freshwater each week [people/week] as a function of water speed and number of MCCs is:
To limit the effect of variable freshwater production that is a result of the varying water speeds, water storage tanks are considered. The purpose of the tanks is to guarantee a certain population size freshwater availability throughout the entire year. It is assumed that the water storage units fulfills requirements to store drinkable freshwater for at least one year.
3. Results
Figure 6 presents the total power delivered by the ten MCCs to the desalination plant and the people supplied with freshwater (assuming a very basic daily demand of 20 L/person) for the different weeks at the South African site (north East London), without a water storage system. The RO plant can produce freshwater 75% of the time, and it is shown that the power output fluctuations range from 0 kW to a maximum of 82 kW, equivalent to nearly 25 thousand people. At the lowest operating point of the MCC, 1 m/s, the RO plant can deliver freshwater for 5000 people.
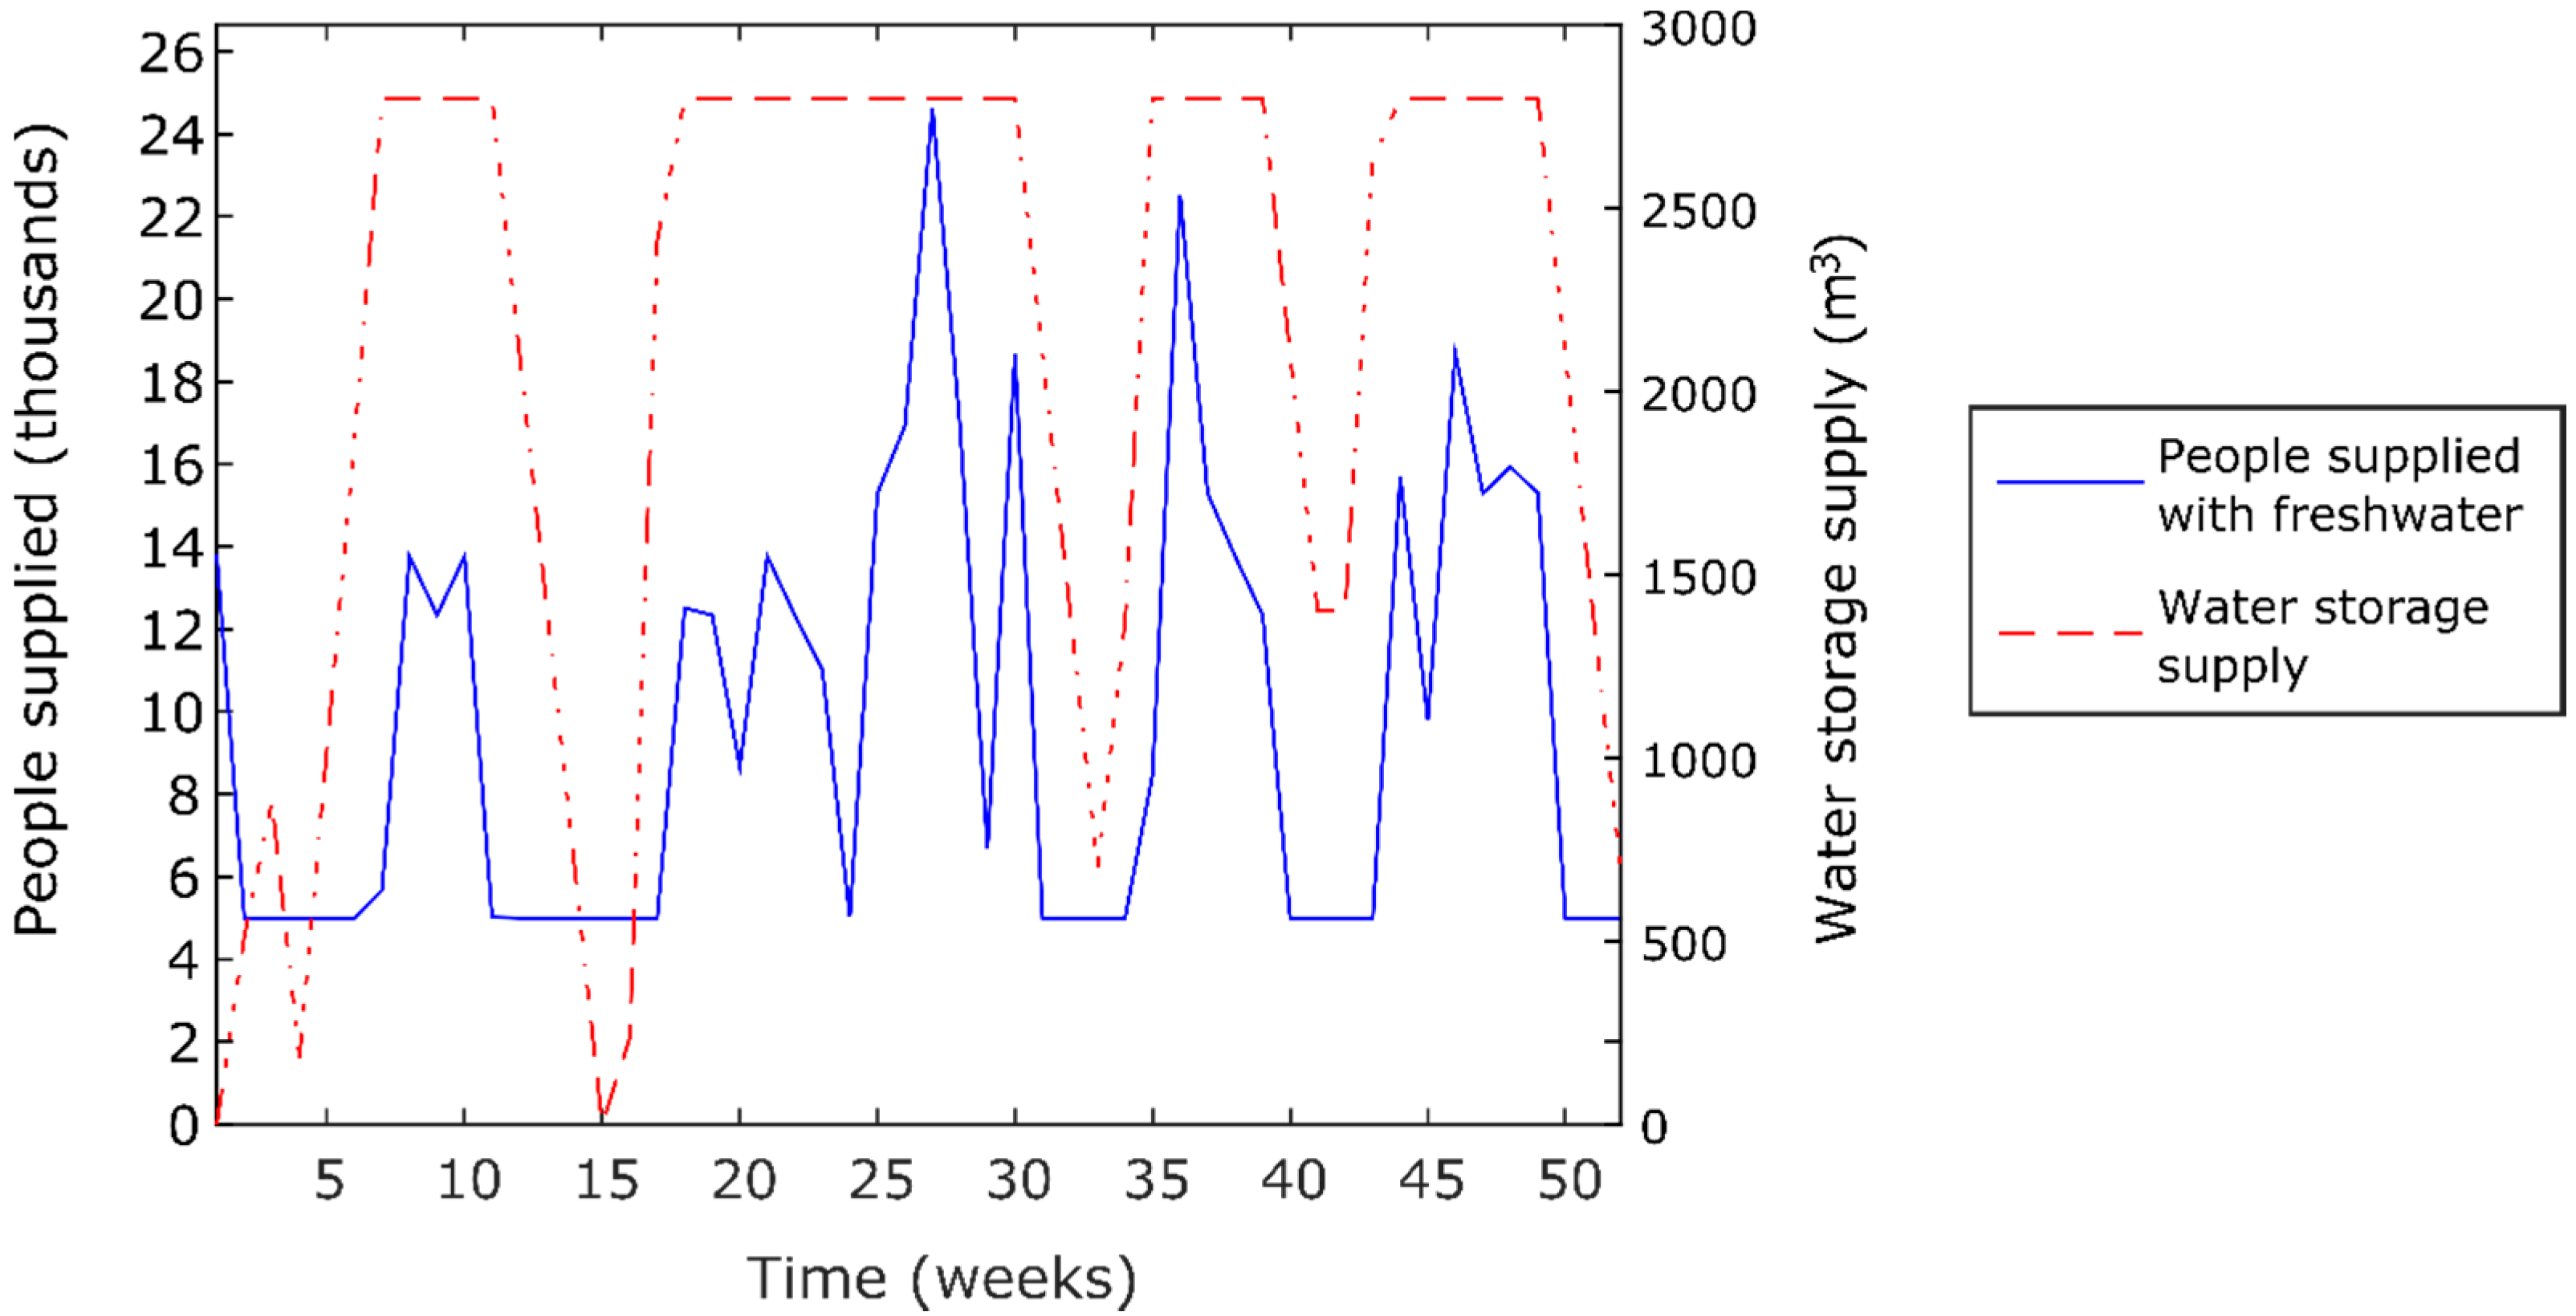
To increase the number of people supplied by the plant, water storage capacity is included. The goal is to reach an intermediate level of supply, about 100 m3/day, to supply 5000 people each week with very basic water demand. The priority of the system is to (1) supply a minimum amount of people with water, and to (2) fill up the tank. If the water speed is equal to, or above, the lowest speed limit, it will supply the freshwater needed and the rest is stored in the tank until the water storage is full. When the storage is full, all the freshwater produced will be supplied to the population. The water storage will only be used to supply the population when the water speed is too low. The water storage is assumed to be empty when the system is connected. Figure 7 shows that an intermediate level of supply, 5000 people/week, can be achieved using the proposed MCC powered RO system including a storage capacity (one or several tanks) of 2800 m3.
To give a broader view of how big a population a certain water storage size can guarantee, the fraction of time a certain tank size can supply a population is plotted in Figure 8. The relationship between tank size and fraction of time the population is supplied is close to linear all the way until it reaches 100%. Naturally, the slope of the curve depends on the population size and the size of the tank, the bigger the tank is in relation, the more it affects the capability to supply freshwater.
Since the population size the system can supply is directly dependent on the size of the water storage, it is interesting to look at the tank size versus population size it can supply, which is summarized in Figure 9. The biggest population size it can supply is 5430 people using at tank capacity of 3100 m3. At this point, all the available freshwater produced during the year is used. It can also be seen in Figure 6 that at the time of connection of the system, around 10,000 people can be supplied with freshwater.
4. Discussion
As can be seen in Figure 6, no power will be produced from the marine current energy system during some weeks yearly at this site, due to too low marine currents. It produces power 75% of the time. The analysis was based on data with variations over weeks, but for full understanding of how to implement such a system, the daily (hourly) variation of the marine current resource should be considered. That at least 5000 people could benefit each week from the proposed system is a very hopeful initial result, shown in Figure 7, suggesting that it may be interesting to continue the research on marine current powered desalination. To include water storage tanks, one large or several smaller, as shown in Figure 7 and Figure 8, is preferable to maintain a reliable freshwater source. The analyzed system is scalable and can be adapted for the specific site.
As the RO desalination process relies on a steady power level, to not lower the performance of the RO membranes or change the freshwater production from a variation in applied pressure, and due to the same location of the salty water and the energy source, the use of almost constantly streaming water to power the desalination system may in this case be better suited for RO than other RES. Moreover, the need and cost of energy storage may decrease when using a less intermittent source, but may still be necessary. Figure 6 and Figure 7 show variations in power and water production. The issue of short term electric power fluctuations could be addressed using energy storage, such as batteries, capacitors or flywheels. The lack of electricity production during longer periods of too low (or too high) water current speeds, can be complemented using other RES, such as wind, solar or wave power, in a hybrid system. For a more in-depth analysis, the weather at the site, highlighting periods of drought or rain, as well as other water sources available and their local importance could be analyzed and used to adapt the system in size.
As noted in Section 1.3, the investigated site, East London in South Africa, is not the location with the most severe need of freshwater and electricity of the regions facing the WIO. But this location was chosen due to the available data and its proximity to coastal regions with a higher need of freshwater supply. Societies with a strong economy may be more likely to have an investigated coastline than societies with weak economy. If we are serious in the attempt of helping countries with unreliable electric grids or low availability of freshwater sources to develop water and renewable energy systems, more attention on the resource estimation of these locations are needed. There is a gap in the resource analysis of the marine currents (as well as tidal currents and ocean waves etc.) outside the coast of some of the poor countries facing the WIO, such as Somalia, Kenya and Mozambique, in need of freshwater and electricity. This complicates the estimation of opportunities to produce electricity or freshwater with the use of marine renewable energy sources here. Therefore, more research on the marine resources, especially presented in publications easily understood for the designers of energy conversion systems, will be of great interest.
In the following, we have only considered the WIO, but there may also be e.g., rivers suitable for hydro-kinetic energy conversion. Some of the largest rivers in Sub-Saharan Africa are already used for hydropower. Possibly, marine current energy converters could be installed downstream in rivers already utilizing hydropower, as was done for the Uppsala University Söderfors project, taking advantage of the water discharge from the hydropower plant. Also, as the Uppsala marine current energy converter is designed and rated for relatively low water flow velocities, there are several regions, perhaps previously neglected in the discussion on marine current- or tidal energy conversion due to low water speeds, that may be suitable for marine current powered desalination.
The development of tidal or marine current energy devices is at an early stage, and more research is needed before deployment and implementation of full systems, especially for remote regions and for desalination purposes. The cost of the discussed system and produced water, as well as installation and maintenance, is still not known. Also, there is a necessity of investigating the ecological aspects of the project before continuing. For example, the desalination process creates a salty solute, the concentrate, which has to be managed to not damage the local marine area. Other areas to investigate are the social aspects of the system, distribution of the water and its specific usage etc. In short, building up new collaborative projects between the water and energy sectors with a sustainability focus necessarily includes several aspects, possibly enhancing the complexity, but also the profits, from the final system.
5. Conclusions
The following work included an initial rough description of marine current energy converter systems as drivers of desalination processes. A method of how to estimate and analyze the key components of a MCC powered RO plant and storage system was presented. The method was applied to a case study of a South African coastal region by the western Indian Ocean. It is evident that without a water storage tank, the plant cannot continuously supply a population with freshwater since the speed of the water currents will be too low, during several weeks of the year, for the MCC to extract electrical power. Without a tank, the plant consisting of ten MCCs can supply between 0 and 25 thousand people per week.
To mitigate the intermittency, a water storage tank was considered. With a capacity of 2800 m3, the tank could improve the system to be able to provide basic freshwater continuously for 5000 people per week, an intermediate level of supply in this context. The impact of water storage size to supply a certain population size has been presented. With a water storage capacity of 2800 m3 connected to the system, at least 5000 people could provide basic freshwater.
However, this study is not enough for preparing deployment and installation of such a system and there are many future research questions regarding e.g., system sustainability before producing freshwater (and electricity) using marine currents in remote coastal regions. The conclusion of this study is that more research on the local marine current resource by the WIO, as well as the energy conversion- and desalination system, and more collaboration over research areas would be beneficial for enhancing RES powered water systems globally.
Author Contributions
All authors have collaboratively contributed to the manuscript. Most of the work regarding paper writing and calculation was conducted by J.L. and J.F. while C.B. and K.T. supervised the work.
Funding
This project was financially supported by the Swedish Research Council, grant number 2015-03126, STandUP for Energy and J. Gust. Richert foundation.
Acknowledgments
In this section you can acknowledge any support given which is not covered by the author contribution or funding sections. This may include administrative and technical support, or donations in kind (e.g., materials used for experiments).
Conflicts of Interest
The authors declare no conflict of interest.
References
- Shannak, S.; Mabrey, D.; Vittorio, M. Moving from theory to practice in the water–energy–food nexus: An evaluation of existing models and frameworks. Water-Energy Nexus 2018, 1, 17–25. [Google Scholar] [CrossRef]
- Virgili, F.; Brown, H.; Pankratz, T. IDA Desalination Yearbook 2017–2018; Media Analytics Ltd.: Oxford, UK, 2017. [Google Scholar]
- Ghaffour, N.; Bundschuh, J.; Mahmoudi, H.; Goosen, M.F.A. Renewable energy-driven desalination technologies: A comprehensive review on challenges and potential applications of integrated systems. Desalination 2015, 356, 94–114. [Google Scholar] [CrossRef] [Green Version]
- Abdelkareem, M.A.; Assad, M.E.; Sayed, E.T.; Soudan, B. Recent progress in the use of renewable energy sources to power water desalination plants. Desalination 2018, 435, 97–113. [Google Scholar] [CrossRef]
- Pouyfaucon, A.B.; García-Rodríguez, L. Solar thermal-powered desalination: A viable solution for a potential market. Desalination 2018, 435, 60–69. [Google Scholar] [CrossRef]
- Kershman, S.A.; Rheinlander, J.; Gabler, H. Seawater reverse osmosis powered by reneawable energy sources—Hybrid wind/photovoltaic power/grid power supply for small-scale desalination in Libya. Desalination 2002, 153, 17–23. [Google Scholar] [CrossRef]
- Li, Z.; Siddiqi, A.; Anadon, L.D.; Narayanamurti, V. Towards sustainability in water-energy nexus: Ocean energy for seawater desalination. Renew. Sustain. Energy Rev. 2018, 82, 3833–3847. [Google Scholar] [CrossRef]
- Leijon, J.; Boström, C. Freshwater production from the motion of ocean waves—A review. Desalination 2018, 435, 161–171. [Google Scholar] [CrossRef]
- Davies, P.A. Wave-powered desalination: resource assessment and review of technology. Desalination 2005, 186, 97–109. [Google Scholar] [CrossRef]
- Zhao, K.; Liu, Y. Theoretical study on multi-effect solar distillation system driven by tidal energy. Desalination 2009, 249, 566–570. [Google Scholar] [CrossRef]
- Segura, E.; Morales, R.; Somolinos, J.A.; López, A. Techno-economic challenges of tidal energy conversion systems: Current status and trends. Renew. Sustain. Energy Rev. 2017, 77, 536–550. [Google Scholar] [CrossRef]
- Segura, E.; Morales, R.; Somolinos, J.A. A strategic analysis of tidal current energy conversion systems in the European Union. Appl. Energy 2018, 212, 527–551. [Google Scholar] [CrossRef]
- Zhou, Z.; Benbouzid, M.; Charpentier, J.F.; Scuiller, F.; Tang, T. Developments in large marine current turbine technologies—A review. Renew. Sustain. Energy Rev. 2017, 71, 852–858. [Google Scholar] [CrossRef]
- Ng, K.W.; Lam, W.H.; Ng, K.C. 2002–2012: 10 Years of Research Progress in Horizontal-Axis Marine Current Turbines. Energies 2013, 6, 1497–1526. [Google Scholar] [CrossRef] [Green Version]
- Lundin, S.; Forslund, J.; Carpman, N.; Grabbe, M.; Yuen, K.; Apelfröjd, S.; Goude, A.; Leijon, M. The Söderfors Project: Experimental Hydrokinetic Power Station Deployment and First Results. In Proceedings of the 10th European Wave and Tidal Energy Conference (EWTEC), Aalborg, Denmark, 2–5 September 2013. [Google Scholar]
- Ekergård, B. Full Scale Applications of Permanent Magnet Electromagnetic Energy Converters—From Nd2Fe14B to Ferrite. Ph.D. Thesis, Uppsala University, Uppsala, Sweden, 2013. [Google Scholar]
- Yuen, K.; Lundin, S.; Grabbe, M.; Lalander, E.; Goude, A.; Leijon, M. The Söderfors Project: Construction of an Experimental Hydrokinetic Power Station. In Proceedings of the 9th European Wave and Tidal Energy Conference, Southampton, UK, 5–9 September 2011. [Google Scholar]
- Grabbe, M.; Yuen, K.; Apelfröjd, S.; Leijon, M. Efficiency of a directly driven generator for hydrokinetic energy conversion. Adv. Mech. Eng. 2013, 5. [Google Scholar] [CrossRef]
- Ribrant, J.; Bertling, L.M. Survey of failures in wind power systems with focus on Swedish wind power plants during 1997–2005. IEEE Trans. Energy Convers. 2007, 22, 167–173. [Google Scholar] [CrossRef]
- Lundin, S.; Forslund, J.; Goude, A.; Grabbe, M.; Yuen, K.; Leijon, M. Experimental demonstration of performance of a vertical axis marine current turbine in a river. J. Renew. Sustain. Energy 2016, 8, 1–6. [Google Scholar] [CrossRef]
- Forslund, J.; Lundin, S.; Thomas, K.; Leijon, M. Experimental results of a DC bus voltage level control for a load-controlled marine current energy converter. Energies 2015, 8, 4572–4586. [Google Scholar] [CrossRef]
- World Health Organization. WHO Guidelines for Drinking-Water Quality; WHO: Geneva, Switzerland, 2011. [Google Scholar]
- UN-Water. Water for a Sustainable World, The United Nations World Water Development Report 2015; UN-Water: Geneva, Switzerland, 2015. [Google Scholar]
- Voutchkov, N. Energy use for membrane seawater desalination—Current status and trends. Desalination 2018, 431, 2–14. [Google Scholar] [CrossRef]
- Shemer, H.; Semiat, R. Sustainable RO desalination—Energy demand and environmental impact. Desalination 2017, 424, 10–16. [Google Scholar] [CrossRef]
- Lai, W.; Ma, Q.; Lu, H.; Weng, S.; Fan, J.; Fang, H. Effects of wind intermittence and fluctuation on reverse osmosis desalination process and solution strategies. Desalination 2016, 395, 17–27. [Google Scholar] [CrossRef]
- Missimer, T.M.; Sinha, S.; Ghaffour, N. Strategic Aquifer Storage and Recovery of Desalinated Water to Achieve Water Security in the GCC/MENA Region. Int. J. Environ. Sustain. 2012, 1, 87–99. [Google Scholar] [CrossRef]
- Loutatidou, S.; Liosis, N.; Pohl, R.; Ouarda, T.B.M.J.; Arafat, H.A. Wind-powered desalination for strategic water storage: Techno-economic assessment of concept. Desalination 2017, 408, 36–51. [Google Scholar] [CrossRef]
- WHO/UNICEF JMP. 2018. Available online: https://washdata.org/data (accessed on 6 August 2018).
- Comte, J.C.; Cassidy, R.; Obando, J.; Robins, N.; Ibrahim, K.; Melchioly, S.; Mjemah, I.; Shauri, H.; Bourhane, A.; Mohamed, I.; et al. Challenges in groundwater resource management in coastal aquifers of East Africa: Investigations and lessons learnt in the Comoros Islands, Kenya and Tanzania. J. Hydrol. Reg. Stud. 2016, 5, 179–199. [Google Scholar] [CrossRef]
- Francisco, F.; Leijon, J.; Boström, C.; Engström, J.; Sundberg, J. Wave Power as Solution for Off-Grid Water Desalination Systems: Resource Characterization for Kilifi-Kenya. Energies 2018, 11, 1004. [Google Scholar] [CrossRef]
- Hammar, L.; Ehnberg, J.; Mavume, A.; Cuamba, B.C.; Molander, S. Renewable ocean energy in the Western Indian Ocean. Renew. Sustain. Energy Rev. 2012, 16, 4938–4950. [Google Scholar] [CrossRef]
- Williams, A.; Nthontho, M.; Chowdhury, S.; Chowdhury, S.P. Modelling South African Agulhas marine Current Profile data for electricity generation. In Proceedings of the 2012 IEEE International Conference on Power System Technology (POWERCON), Auckland, New Zealand, 30 October–2 November 2012; pp. 1–7. [Google Scholar]
- Marais, E.; Chowdhury, S.; Chowdhury, S.P. Theoretical resource assessment of marine current energy in the Agulhas Current along South Africa’s East coast. In Proceedings of the 2011 IEEE Power and Energy Society General Meeting, Detroit, MI, USA, 24–28 July 2011; pp. 1–8. [Google Scholar]
- Dyachuk, E.; Goude, A.; Lalander, E.; Bernhoff, H. Influence of Incoming Flow Direction on Spacing between Vertical Axis Marine Current Turbines Placed in a Row. In Proceedings of the ASME 2012 31st International Conference on Ocean, Offshore and Arctic Engineering, Rio de Janeiro, Brazil, 1–6 July 2012; pp. 1–7. [Google Scholar]
- Leijon, J.; Engström, J.; Dolguntseva, I.; Boström, C. Investigation of wave powered desalination for sustaianble freshwater production. In Proceedings of the International Desalination Association World Congress, São Paulo, Brazil, 15–20 October 2017. [Google Scholar]
Figure 1.
(a) The marine current energy converter developed at Uppsala University in Sweden; (b) Deployment of the device in Söderfors, Sweden, 7 March 2013 (Figure 4 in [15]).
Figure 1.
(a) The marine current energy converter developed at Uppsala University in Sweden; (b) Deployment of the device in Söderfors, Sweden, 7 March 2013 (Figure 4 in [15]).

Figure 2.
East London in South Africa, map from Google Maps (www.google.com/maps (accessed on 21 August 2018)).
Figure 2.
East London in South Africa, map from Google Maps (www.google.com/maps (accessed on 21 August 2018)).

Figure 3.
One year of data (starting from August) on the marine current water speeds [m/s] for north East London, South Africa, is shown, divided in weeks, presented previously in [34]. The maximum and minimum values for the Uppsala marine current converter are highlighted, showing a velocity band where power can be produced.

Figure 4.
Incident angles of the streaming water over the measured weeks, at north East London, South Africa, presented in [34].
Figure 4.
Incident angles of the streaming water over the measured weeks, at north East London, South Africa, presented in [34].

Figure 5.
Rough overview of the proposed MCC, with the exception that the final proposed system includes 10 MCCs and water storage, powered desalination system.
Figure 5.
Rough overview of the proposed MCC, with the exception that the final proposed system includes 10 MCCs and water storage, powered desalination system.

Figure 6.
The estimated power output of the MCC and the number of people that each week that could fulfill their basic freshwater demand from a RO plant powered by five MCCs, without water storage, in the WIO.
Figure 6.
The estimated power output of the MCC and the number of people that each week that could fulfill their basic freshwater demand from a RO plant powered by five MCCs, without water storage, in the WIO.

Figure 7.
Number of people supplied with freshwater over one year using a water storage tank of 2800 m3.
Figure 7.
Number of people supplied with freshwater over one year using a water storage tank of 2800 m3.

Figure 8.
The fraction of time, in percent, when 1000–10,000 people could be supplied with freshwater depending on water storage size in m3.
Figure 8.
The fraction of time, in percent, when 1000–10,000 people could be supplied with freshwater depending on water storage size in m3.

Figure 9.
Population size the system can supply as a function of water storage size.


Table 1.
The vertical water speed profile, presented in [34].
Table 1.
The vertical water speed profile, presented in [34].
| 0–50 m from Coastline | 51–100 m from Coastline | 101–200 m from Coastline | |
|---|---|---|---|
| 0–50 m depth | 0.9 | 2.0 | 3.2 |
| 50–100 m depth | - | 1.0 | 1.6 |
| 100–200 m depth | - | - | 0.8 |
© 2018 by the authors. Licensee MDPI, Basel, Switzerland. This article is an open access article distributed under the terms and conditions of the Creative Commons Attribution (CC BY) license (http://creativecommons.org/licenses/by/4.0/).
Share and Cite
MDPI and ACS Style
Leijon, J.; Forslund, J.; Thomas, K.; Boström, C. Marine Current Energy Converters to Power a Reverse Osmosis Desalination Plant. Energies 2018, 11, 2880. https://doi.org/10.3390/en11112880
AMA Style
Leijon J, Forslund J, Thomas K, Boström C. Marine Current Energy Converters to Power a Reverse Osmosis Desalination Plant. Energies. 2018; 11(11):2880. https://doi.org/10.3390/en11112880
Chicago/Turabian StyleLeijon, Jennifer, Johan Forslund, Karin Thomas, and Cecilia Boström. 2018. "Marine Current Energy Converters to Power a Reverse Osmosis Desalination Plant" Energies 11, no. 11: 2880. https://doi.org/10.3390/en11112880
Note that from the first issue of 2016, this journal uses article numbers instead of page numbers. See further details here.