Integrated Energy System Configuration Optimization for Multi-Zone Heat-Supply Network Interaction

1
School of Electric Power Engineering, Shanghai University of Electric Power, Shanghai 200090, China
2
China Coal Technology & Engineering Group Shanghai Research Institute, Shanghai 200030, China
*
Author to whom correspondence should be addressed.
Energies 2018, 11(11), 3052; https://doi.org/10.3390/en11113052
Submission received: 20 September 2018
/
Revised: 23 October 2018
/
Accepted: 2 November 2018
/
Published: 6 November 2018
(This article belongs to the Special Issue Communications in Microgrids)
Abstract
:The integrated energy system effectively improves the comprehensive utilization of energy through cascade utilization and coordinated scheduling of various types of energy. Based on the independent integrated energy system, the thermal network interaction between different load characteristic regions is introduced, requiring a minimum thermal grid construction cost, CCHP investment operation cost and carbon emission tax as the comprehensive optimization targets, and making overall optimization to the configuration and operation of the multi-region integrated energy systems. This paper focuses on the planning of equipment capacity of multi-region integrated energy system based on a CCHP system and heat network. Combined with the above comprehensive target and heat network model, a mixed integer linear programming model for a multi-region CCHP system capacity collaborative optimization configuration is established. The integrated energy system, just a numerical model solved with the LINGO software, is presented. Taking a typical urban area in Shanghai as an example, the simulation results show that the integrated energy system with multi-zone heat-suply network interaction compared to the single area CCHP model improved the clean energy utilization of the system, rationally allocates equipment capacity, promotes the local consumption of distributed energy, and provides better overall system benefits.
1. Introduction
A regional integrated energy system (RIES) is a comprehensive regional energy supply network formed by the coupling of single energy systems such as electricity, gas and thermal (cold). It is a clean, economic, efficient and environmentally friendly energy supply system at the present stage [1,2]. The multi-energy complementarity, synergistic optimization and energy cascade utilization of the integrated energy system have improved the comprehensive energy efficiency and reduced the emissions of air pollutants. At the same time, the integrated energy link among multiple regions balances the difference of energy use between regions, cuts peak loads and fills valleys, and improves energy supply reliability [3,4]. However, the complex structure of comprehensive energy system, the coupling of various energy sources, and the matching of installed capacity directly affect the economy of the system operation and the adjustment strategy of unit operations, which is of great theoretical significance and application value for the allocation of multiple energy resources and the optimization of operation strategies in the comprehensive energy system [5,6,7,8,9].
Reference [10] comprehensively coordinated multi-energy forms on the supply side and demand side, and carried out coordinated planning by adopting the grid method to achieve multi-energy complementarity and energy cascade utilization. Reference [11] fully considered the uncertainty of renewable energy output and terminal loads in the integrated energy system, and studied the scheduling optimization of integrated energy systems based on interval linear programming. In [12,13], under different operating modes and different load structures, the optimal configuration and comprehensive operation efficiency of the CCHP system combined with energy storage devices are studied. References [14,15] consider the coordinated planning and operation of the multi-area CCHP system of the heat-supply network model, which improves the gas turbine utilization rate, reduces the gas boiler configuration capacity and the thermal energy transmission loss, and significantly reduces the operating cost. In [16], the energy storage device concept is introduced into the distributed coordination system to optimize the configuration of the mixed integer linear programming model to realize the synchronization optimization of the system structure and operation, and the simultaneous optimization of each device and the energy storage device. References [17,18,19,20] combine solar energy with CCHP systems to optimize the number of units and gas turbine capacity of the optimal joint supply system under different operational control strategies, and achieves the maximum comprehensive benefit of the multi-target joint supply system. Reference [21] proposed a multi-objective optimization model for urban integrated electrical power, thermal and gas grids, which is used for control optimization of modified PRS integrated with thermal users, and thermally integrates the entire system with the district heating network, the effectiveness of the model in terms of economic and environmental performance is quantified by software. With the advancement of the carbon emission trading mechanism, references [22,23,24] comprehensively consider the impact of carbon emissions on the CCHP system, and establish a low-carbon scheduling multi-objective optimization model for carbon trading costs, fuel costs and environmental costs. Reference [25] integrates renewable energy (RE) into an autonomous CCHP system to simultaneously achieve zero environmental emissions and higher power generation and energy efficiency advantages, using an evolutionary particle swarm optimization algorithm to optimize the different configuration size of the autonomous RE-CCHP system. Reference [26] uses the Analytic Hierarchy Process (AHP) to optimize the configuration of hybrid CCHP systems considering three objective functions: annual operating cost ratio (AOCR), primary energy saving ratio (PESR) and carbon emission reduction rate (CERR). Coupling of cold, heat and electric power loads between multi-region CCHP systems, coordinated planning and optimized operation of multi-zone systems, higher utilization of equipment than single CCHP systems, reduced configuration capacity, and significantly reduced operating costs, enabling multiple systems “Multiple horizontal complementarity, vertical source network charge and storage coordination”. However, at present, there are few studies on multi-energy networks such as inter-area multi-energy flow access to grids, heat networks, gas networks, etc., in terms of mixed power flow and optimal scheduling among different energy networks [27,28,29,30].
The above references mostly optimize the operation scheduling of integrated energy systems under the condition of known equipment capacity, and research on the collaborative planning of equipment capacity between various energy sources and between multiple regions is lacking. In this paper, a heat network is ingeniously introduced to regions of different load characteristics, In the references, the heating network construction of a single area is generally carried out. Based on the thermal energy-flow constraint, a simplified heat network model is established, which implements thermal energy coupling between different regions. The CCHP system takes into account the combination of devices with different characteristics, establishes an objective function which is considered operating cost, unit investment cost and carbon emission tax. The thermal energy interaction and pipeline flow changes of CCHP systems in various regions are analyzed with examples. The collaborative configuration optimizes regions with different load characteristics. The capacity allocation and network structure of various energy facilities are optimized separately to minimize the total energy supply cost of the system. In the aspect of configuration planning optimization, the redundancy of similar equipment between regions is reduced, and the centralized energy supply characteristics of high-efficiency equipment are reflected. The cost of inter-regional collaborative optimization operation is lower than that of the original independent system operation, the carbon emission tax is reduced, and the clean energy consumption is increased. To a certain extent, the overcapacity or shortage of individual regions is eliminated, and the complementary characteristics of supply and demand between regions are visually reflected.
2. Materials and Methods
2.1. Integrated Energy System Structure
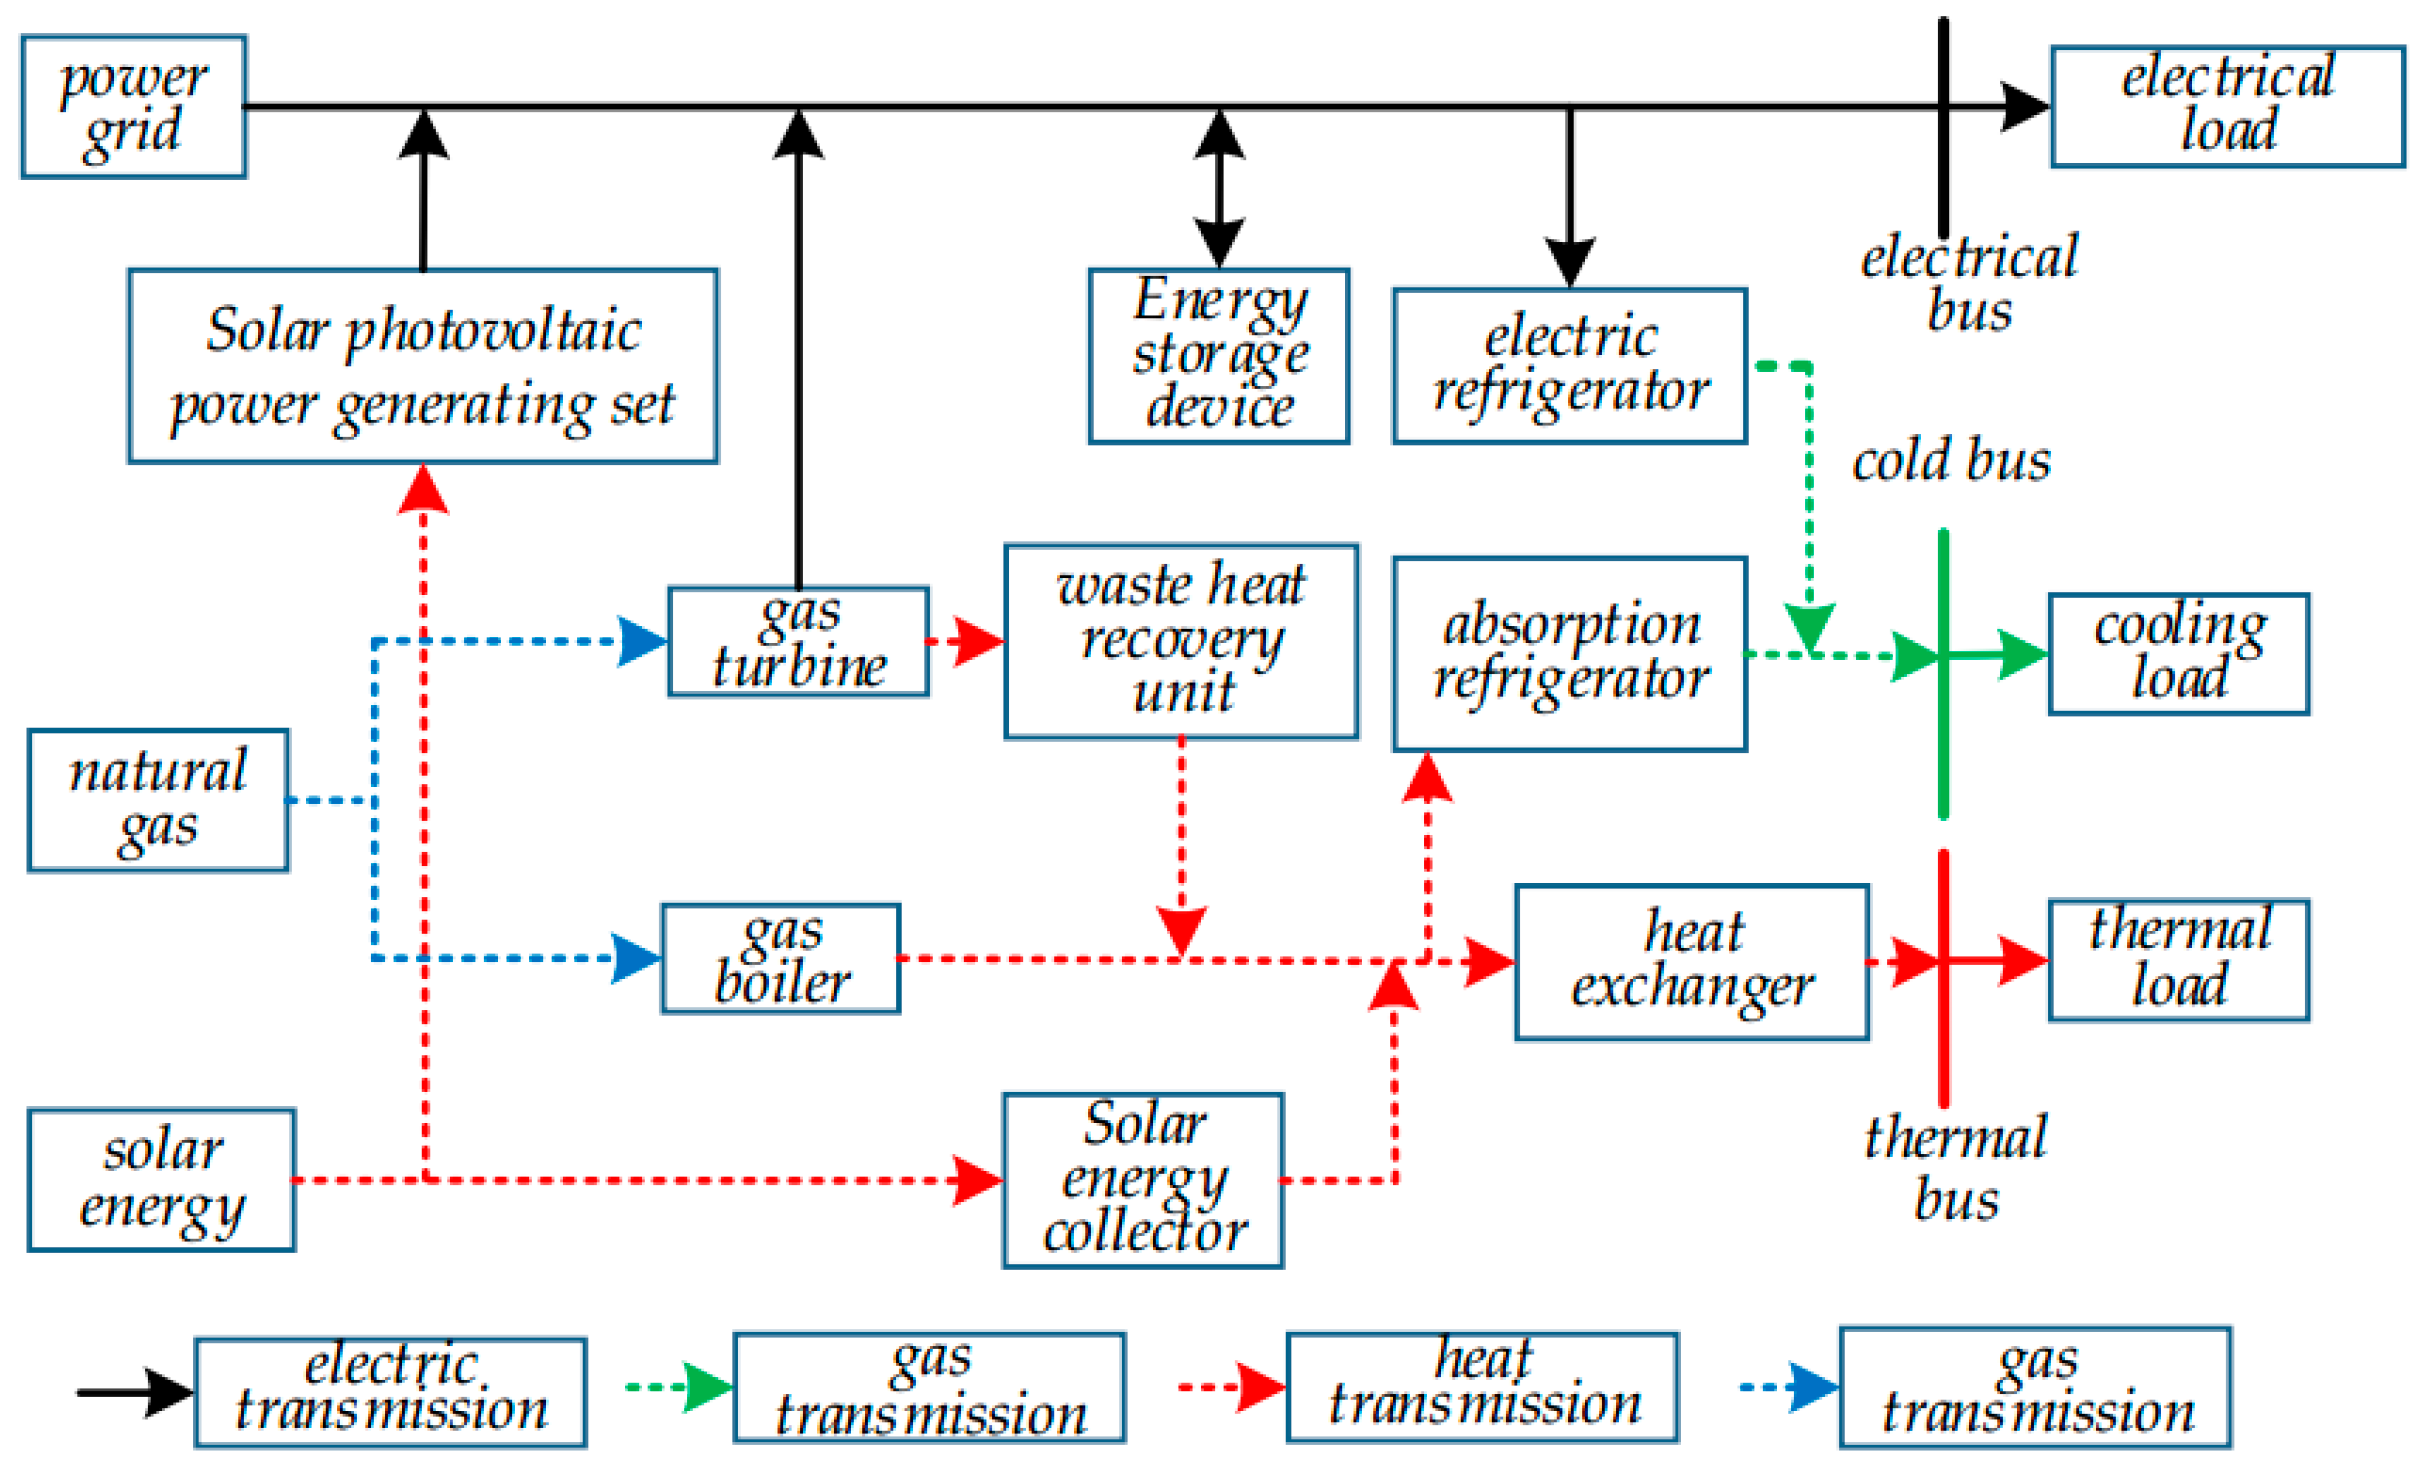
In the integrated energy system, the three types of loads, including electricity, cold and thermal, are mainly provided by electric power grids, gas turbines (GT), and gas boilers (GB). The photovoltaic generator set and solar collector are added to the system plan to form a comprehensive solar energy utilization and supply system (PVCU CCHP). Multi-energy can be supplied to the cold, thermal and electrical load through different energy transfer mediums “Electrical, Thermal, and Cold Bus” [13]. The multi-energy flow structure of the integrated energy system is shown in Figure 1.
2.2. Heat-Supply Network Structure
The heat-supply network is used as the link to connect the thermal load between the CCHP systems. The heat-supply network is laid along the road and arranged in a ring according to the geographical location. When any pipe in annular network is damaged, a gate valve can separate it from other pipelines for maintenance, so it has higher safety reliability. The thermal network in this paper is a simple model, which is established by referring to the network node interactive power model. Figure 2 shows the thermal flow distribution in the heat-supply network pipe. The thermal loss existing in the thermal flow through the pipe is defined as . and represent the thermal energy at both ends of the pipe at time .
2.3. Heat-Supply Network Model
This model is based on the basic principle of heat transfer and pipe networks, with the interacting power () between each area and heat-supply network, the flow of heat , the node flow as the main factors. The optimization variables are based on the energy conservation law (flow balance) constraint, and the following simplified linearized hot water network model is established. In the short-distance region, assuming that the temperature field of the hot network is a steady-state field, the interaction node has no heat loss, and the heat energy loss is only related to the flow distance of the heat flow in the pipeline, and the feed water temperature and the return water temperature are constant. The time horizon and operating cost model applied are based on 24 h a day use.
2.3.1. Basic Theory of Heat-Supply Network
(1) Thermal energy—flow constraint:
where is the specific heat capacity, taking 4187 J/(). Equation (2) is the thermal energy balance equation of pipeline node.
(2) Thermal energy loss equation:
where is the heat loss of the pipeline, and indicate the mutual thermal energy at two ends of the pipeline at time . is the thermal energy loss rate of pipeline for unit length, taking 0.1. represents thermal flow from node i to node , and represents thermal flow from node to node . Equation (4) means that the sum of interactive power and pipeline thermal loss is 0.
2.3.2. Operation Cost of Heat-Supply Network Investment
(1) Investment cost of the pipeline:
where is the cost of laying pipeline and is model cost of pipeline. is the length of pipe from to in heat-supply network.
(2) Electric charge for pump operation:
where m is the number of CCHP co-supply systems. is the unit price of power purchase at time for the region . is the ratio of electricity consumption to transferred thermal quantity, which means the amount of electricity consumed in the transmission of unit of thermal, taking 0.0059. is the time interval, take = 1 h. is the number of running time periods.
2.4. CCHP Mathematical Model
The lowest total cost is just the solution of the objective function. The proposal doesn’t refer to a multi-objective method. In the process of programming and solving, available energy, various types of load and the cost of unit power are input variables. The total cost of output, various types of interactive power, the rated capacity of each unit and the output power of the unit at each moment are output variables.
2.4.1. Objective Function
(1) Unit investment cost:
where K is the unit capacity price of equipment. and are and alternative model sets, respectively. , , , , , , are respectively gas turbine sets, gas boilers, electric refrigerator, absorption refrigerator, photovoltaic generating sets, photovoltaic collector, electrical storage device capacity. , , , , , , respectively represent the corresponding model equipment state of each equipment, taking values of 0 and 1.
(2) Operating cost:
where is the total operating cost of the CCHP system. is the electricity purchase price of the electric grid. is the ratio coefficient of operation and maintenance cost, taking 0.03. is the annual maintenance cost of the system. is the interactive electric power between the system and the electric grid. is the output power of the gas turbine, and is the heat energy output of the gas boiler. and are the conversion efficiency of gas turbine and gas boiler, respectively. is the price of natural gas, taking 2.37 . is the calorific value of natural gas, taking 9.78 is the electrical storage device running loss cost, taking 0.02 . is the charge and discharge power of the electrical storage device.
(3) emission tax model:
where and are electricity emission factor and use gas emission factor, respectively, taking 0.8 and 0.19 . is the emission tax, taking 0.2 .
This paper will combine the above optimization objectives, investment cost, operating cost and environmental cost, as the total objective function, as shown in the following expression:
where is the integrated cost, and the lowest objective function value is the highest benefit. The model does not involve a separate optimization discussion of each sub-objective functions in the comprehensive target, and does not discuss the weighting of the sub-functions in the total objective function.
2.4.2. Constraints
(1) Power balance constraint.
The electric balance, thermal balance and cold balance constraints at each time slot of each load area are:
where , , are the user’s demand for electricity, thermal and cold loads in area at time . is the electric power consumed by electric refrigeration; is the output power of photovoltaic generator set. is the power of residual heat by gas turbine. is the recycling efficiency of the thermal collector, taking 0.75. is the efficiency of thermal exchanger, taking 0.9. is the heat energy power consumed by absorption refrigeration; is the output power of solar collector. and are respectively the refrigeration efficiency of electric refrigerator and absorption refrigerator for corresponding models in area i.
(2) Interactive power constraint:
where and are respectively the lower limit and upper limit for the electric power of the tie line. and are the lower and upper bound value of heat-supply network circulating power, respectively.
(3) Upper and lower bound for unit output:
where and are the upper and lower bound of type r GT output, respectively. and are upper and lower bound of type r GB output, respectively. , and , are upper and lower bound of EC and AC output, respectively.
(4) Electrical storage device constraint:
where is the storage state of the electrical storage device. is the charging and discharging electric power at the corresponding time. In order to guarantee the service life and efficiency of the electrical storage device, the lower limit of the storage capacity of the electrical storage device is 0.15 of the total capacity, and the upper limit is 0.9 of the total capacity. Charging and discharging electric power shall not exceed 30% of the total capacity. At the same time, it is guaranteed that the storage state of the initial and ending time is the same.
(5) Photovoltaic output constraint:
where is the available solar energy for each load area and is the efficiency of photovoltaic power generation. is the collector conversion efficiency. The upper limit of and are the rated power of the equipment. In conclusion, all models are integer linear models, so Lingo software is used for calculation optimization [16]. The parameters involved in this paper are shown in the Appendix A.
3. Results
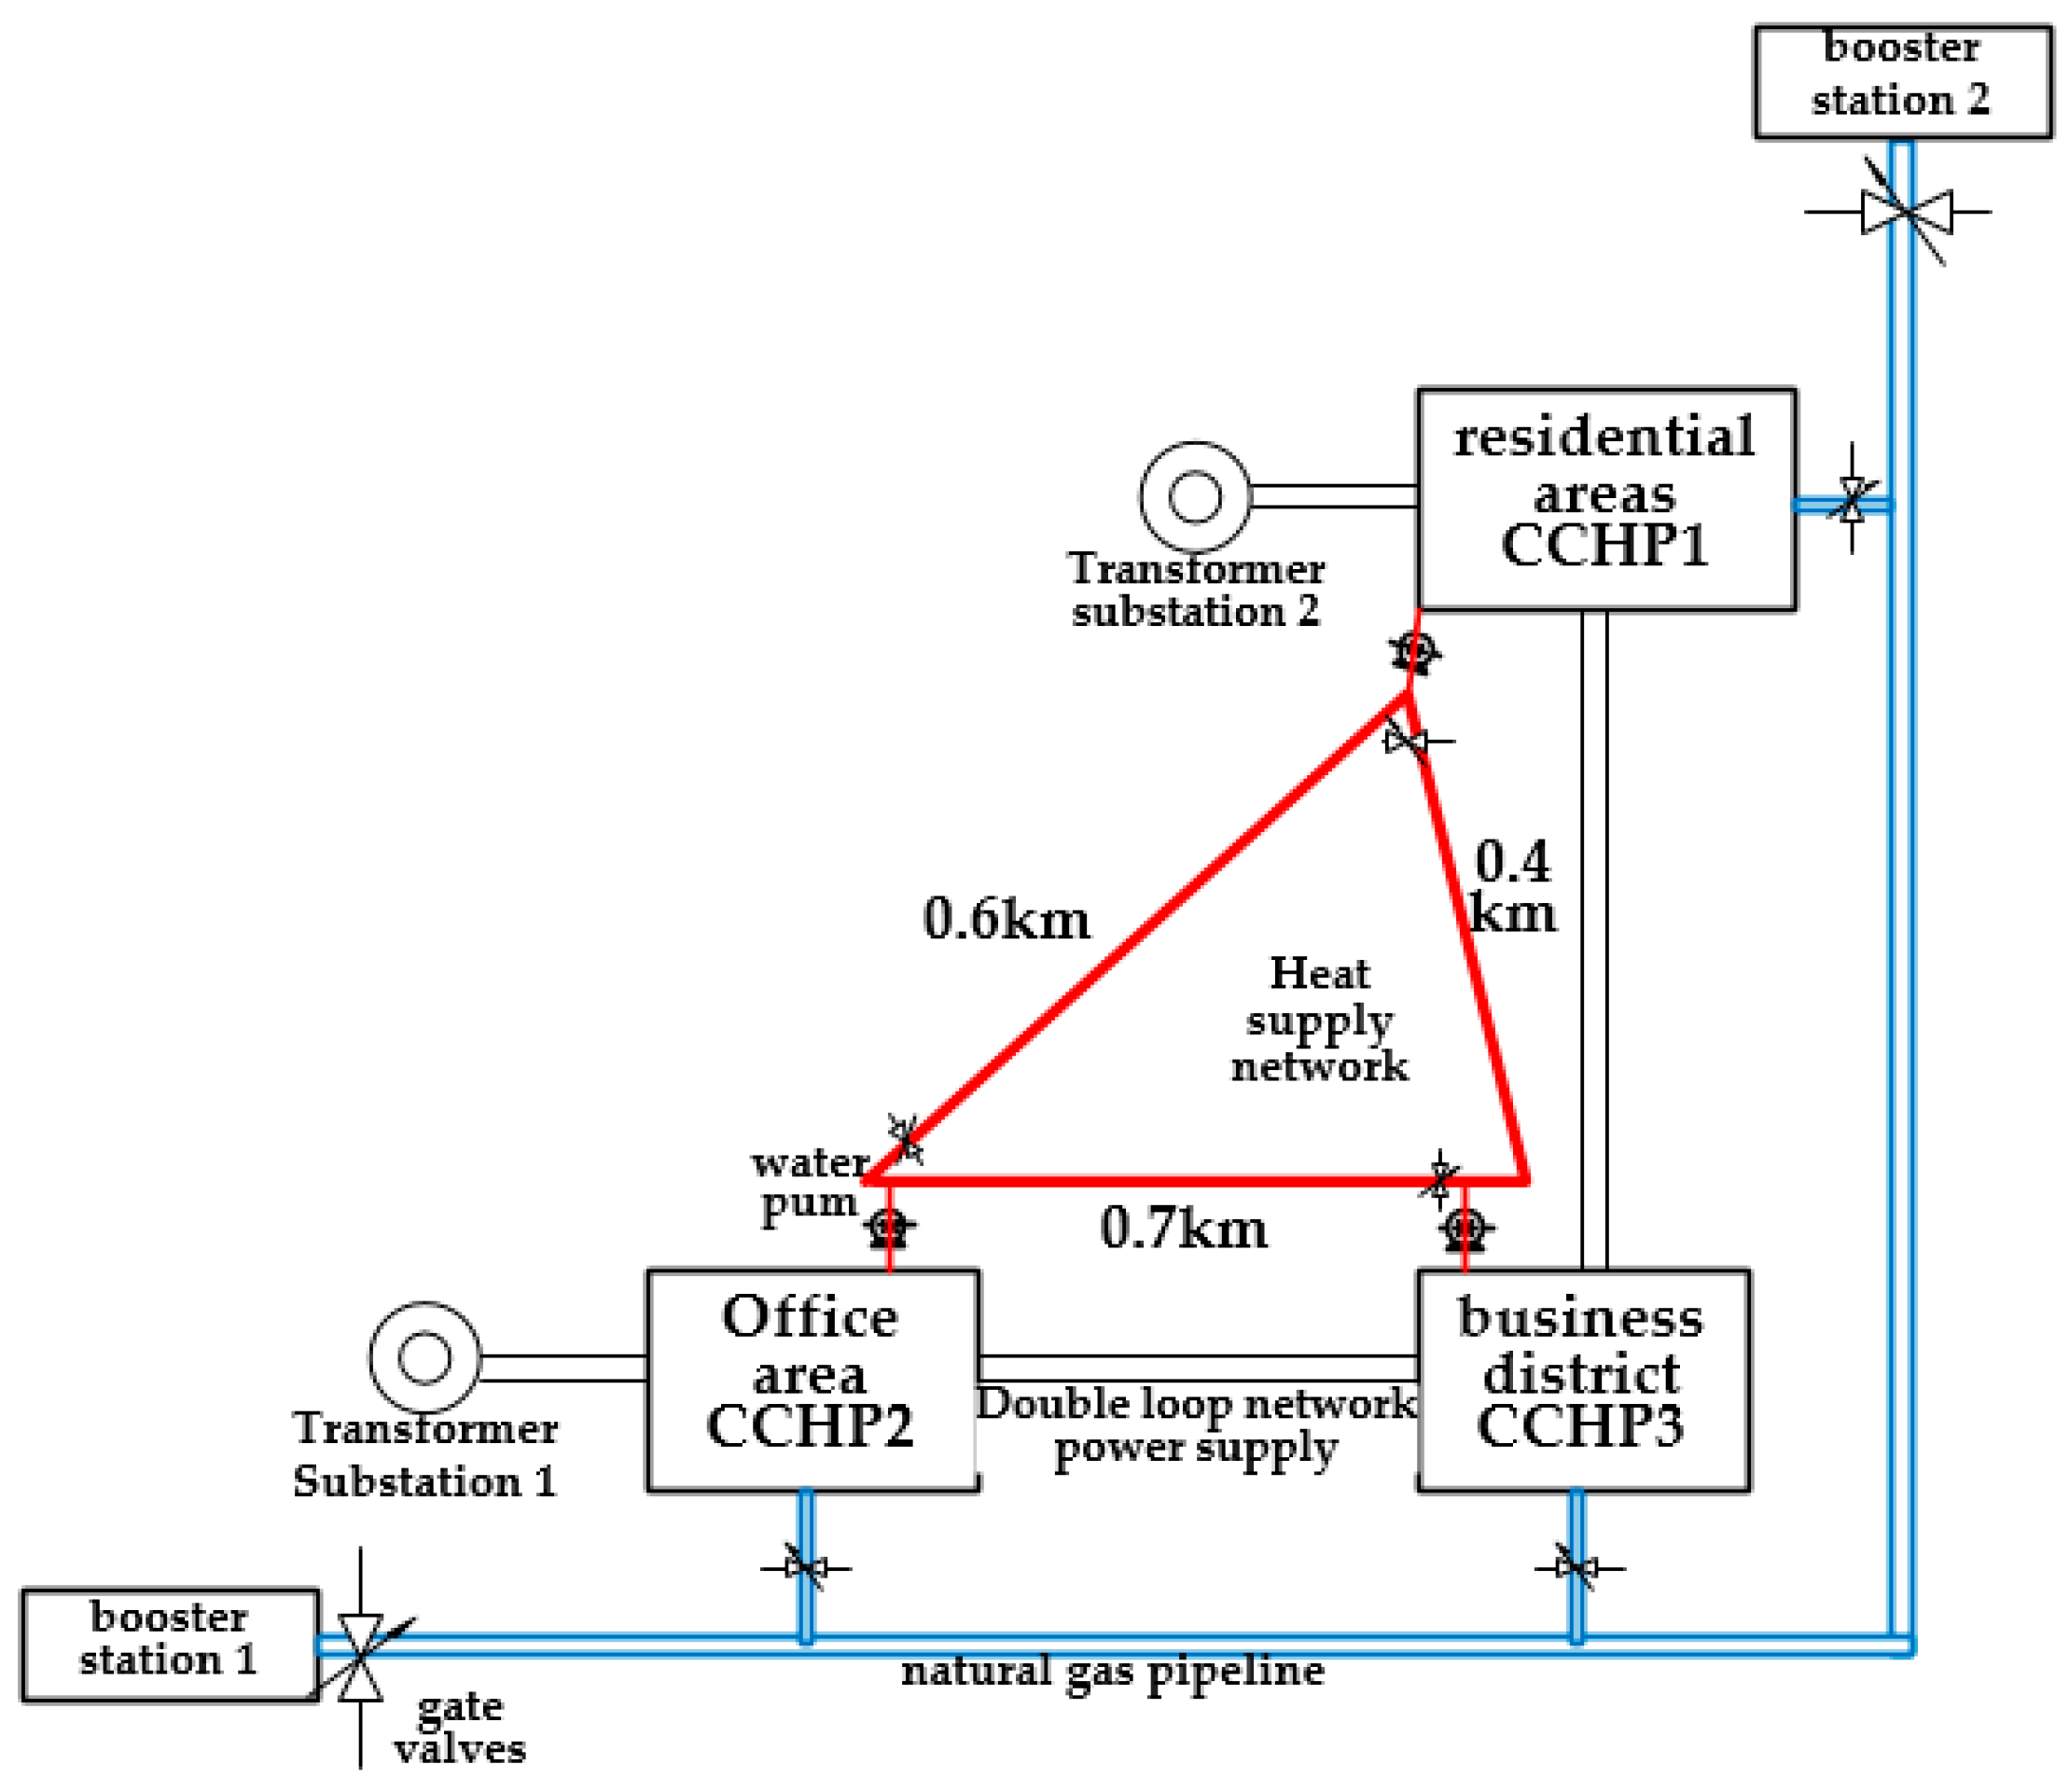
This paper takes the integrated energy planning of a typical urban area in Shanghai (Caoxi area) as an example, and divides it into three load areas, including commercial area, office area and residential area according to local industrial and load characteristics, as shown in Figure 2. And all kinds of time-of-use electricity prices in Shanghai are shown in Appendix A Table A2. Caoxi region is determined by grid division of the Shanghai urban electric power network. The region is an independent electric power supply ring network unit. On this basis, thermal and cold energy supply are divided into blocks and centralized scheduling, photovoltaic power generating set and photovoltaic collector are arranged on the sunny surface of each region. Among them, the residential area has relatively high heat-to-electric ratio, which is between 1.3 and 3. The heat-to-electric ratio in the office area tends to 1 and the heat-to-electric ratio in the commercial area is around 0.5. The equipment parameters are shown in Appendix A Table A1, Various load values are shown in Appendix A Table A4.
3.1. Equipment Capacity Planning
The CCHP system without thermal network interaction is set as mode 1, and the CCHP system with thermal network interaction is set as mode 2. In the planning, considering the actual load and operation characteristics, the equipment with high utilization rate or high economic efficiency and meeting the load requirements is selected according to the optimization results, the multi-energy flow structure of the integrated energy system is redesigned. The optimized configuration and one-time investment cost contrast are shown in Table 1.
It can be seen from Table 1, after considering the heat-supply network, the configuration capacity of gas turbine of users (commercial) with low heat-to-electric ratio increases significantly, while users (residents) with high heat-to-electric ratio do not allocate gas turbine and gas boiler. When considering the heat-supply network, the users with relatively low heat-to-electric ratio can increase the output of the gas turbine to meet their own demand and reduce the electric power purchase, while the surplus thermal energy can be used to subsidize other users with relatively high heat-to-electric ratio through the heat-supply network. Therefore, the gas turbine capacity configuration in the commercial area under mode 2 increases. At the same time, for the residents with high heat-to-electric ratio in mode 1, the insufficient thermal energy can only be reignited through the gas boiler. While combined with the heat-supply network, the thermal energy can be supplied by offices and business districts, so as to reduce the output of gas boilers and reduce the configuration of gas boilers. On the other hand, the users with low heat-to-electric ratio are given priority to deploy gas turbines, and the users with high heat-to-electric ratio are given priority to deploy gas boiler. With the increase of heating network, the overall thermal power ratio of the original high thermal power ratio area will be reduced, and gas turbines will be selected for economy. Photovoltaic output and load characteristics are highly coupled, so the number of photovoltaic generating units has been greatly increased to promote the consumption of clean energy. After connecting to the heating network, the non-gas boiler configuration in residential areas increases the capacity of the photovoltaic collector to supplement the increase of daytime heat load; the gas turbine output in office and commercial areas is increased and the thermal energy supply is sufficient. Under the economic target, the two areas omit the photovoltaic collector configuration.
When planning the pipeline layout, the heat-supply network fluid flow is obtained using Equation (1). Then, the cross sectional area of the pipeline (to limit the fluid flow velocity in the pipeline) can be calculated from . The temperature of feed water is taken as 100 , the backwater is 70 , and the peak velocity is 0.6 . The planning results are shown in Table 2.
By comparing the investment costs of the two modes, it can be seen that mode 2 saves capacity allocation of gas turbine and gas boiler, and mainly increases the cost of setting photovoltaic generating and laying heat-supply network pipelines. The total investment cost of mode 2 is 6859 million yuan, which is lower than that of mode 1 about 6969.7 million yuan.
3.2. Operation Optimization
Through the above optimized configuration, the capacity of each regional equipment in different cases is determined. Based on the previous research, the operating output of each unit is analyzed as follows.
(1) Thermal network interaction energy and flow direction
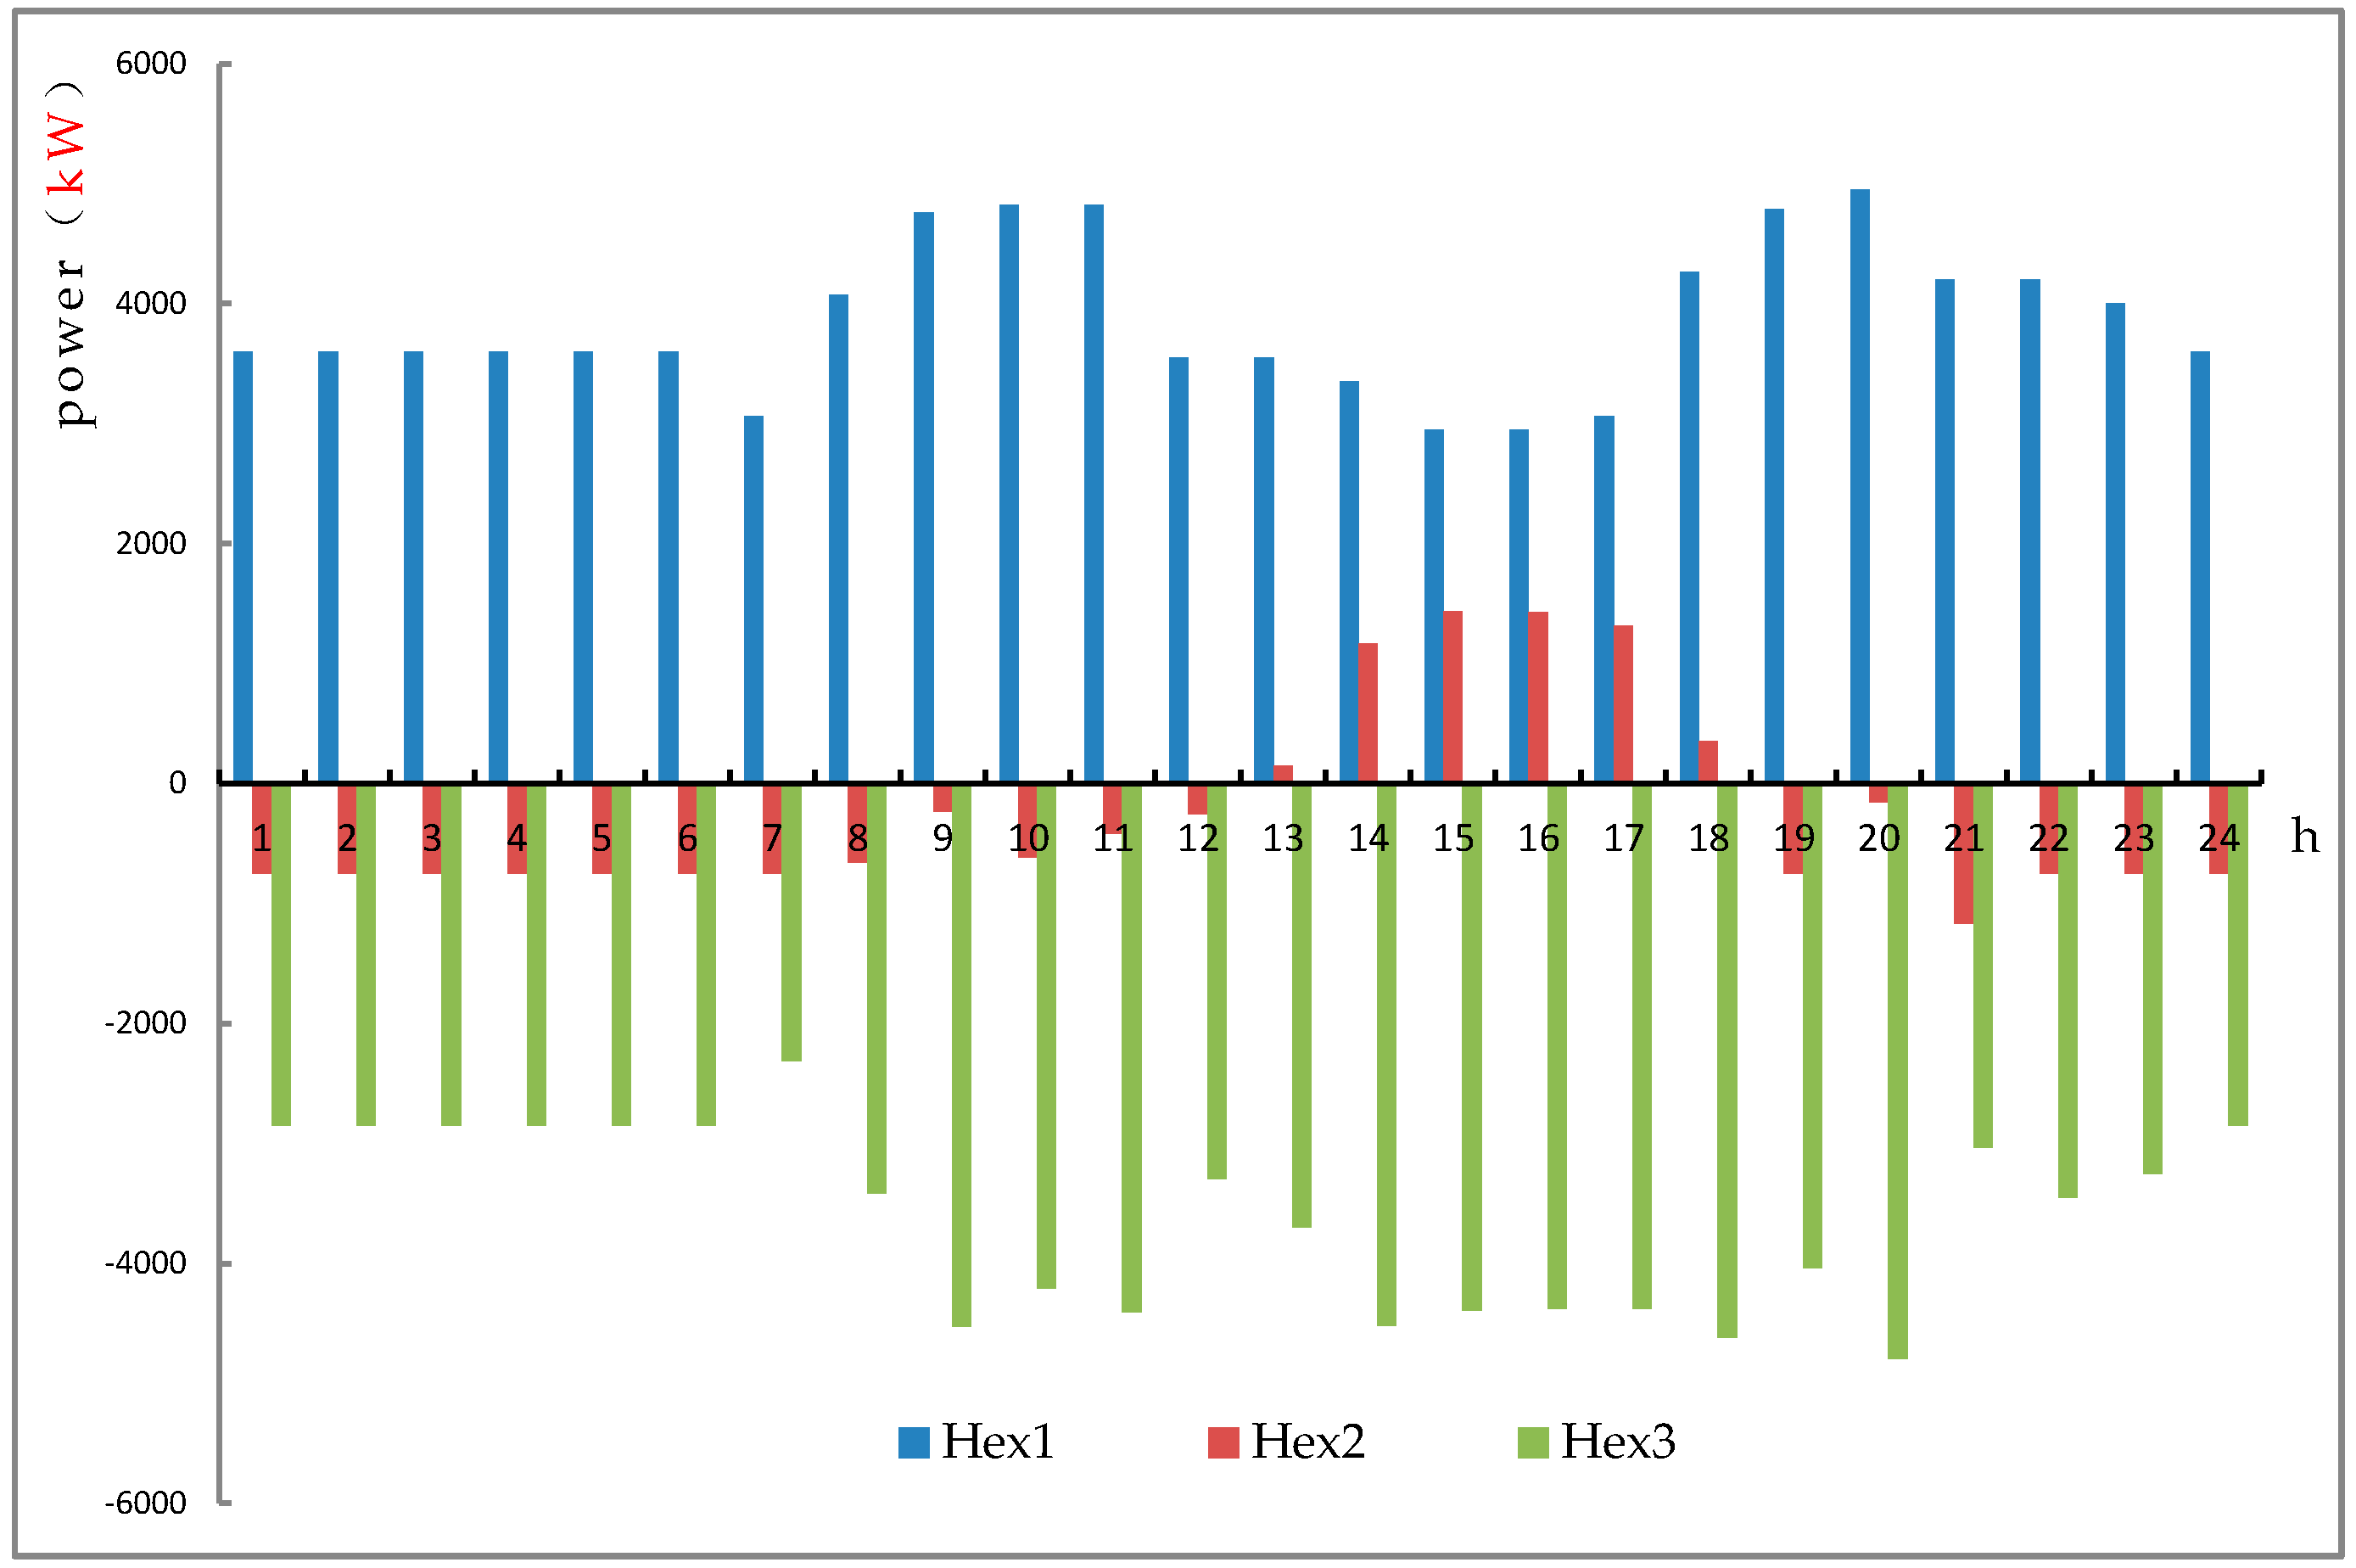
As shown in Figure 3, after adding the heat-supply network, the commercial area with low heat-to-electric ratio generates a large amount of excess thermal energy to supply thermal to the heat-supply network while ensuring enough power supply for local area. The resident users with higher heat-to-electric ratio absorb thermal energy from the heat-supply network. The office area is close to the gas turbine heat-to-electric ratio at 9:00–13:00, and the thermal energy surplus is less and there is no thermal load during the 20:00–8:00 period. The gas turbine keeps running due to the electrical load, and supplies thermal to the heat-supply network. At 14:00–17:00, the office area absorbs thermal from the heat-supply network. The interaction between CCHP system and the heat supply network accurately reflects the configuration and operation of the energy supply equipment.
It is stipulated that the flow direction of commercial and office districts to residential areas should be positive, and the flow direction of commercial districts to office areas should be positive. In the heat-supply network planning, about 30% allowance of pipeline radius is left. It can be seen from Figure 4a that the flow direction is positive in each time period, that is, the pipeline flows from commercial area to residential area in 24 h. The flow rate of the pipeline is 0 during the period 13:00–18:00 with no thermal flow, and the other times are positive. The thermal energy is transported to residential areas from the office area during this period. The pipeline is only positive at time period 13:00–18:00, and the thermal energy flows from commercial area to office area, and there is no thermal interaction at other time. Combined with the energy flow interaction analysis at each time period in Figure 3, the thermal transfer capacity of commercial and residential pipelines is much higher than that of other pipelines. However, by planning the radius of thermal network pipelines, the velocity of each pipeline is maintained at a reasonable value. This laying method reduces the inert effects and thermal loss of thermal transfer, while improving the efficiency of pipeline utilization and investment economy.
It can be seen from above that the utilization rate of commercial-office heat-supply network pipe is low, and the pipe laying is far away and the cost is high. Therefore, considering that only the commercial-residential-office pipe should be laid, the pipeline velocity is shown in Figure 4b. After omitting the pipe , the radius of pipe increases from 5 to 6, the radius of pipe remains unchanged, the pipe utilization rate increases, and the laying cost decreases.
(2) Comparison of interaction with electric power grid
Figure 5 shows that when the residential area is in the time period 0:00–9:00 electrical load valley section in mode 1, the gas turbine operation meets the regional electric power demand. In mode 2, the electric energy is provided by the electric power grid and photovoltaic unit. During the period of 12:00–15:00, due to the increase in PV configuration capacity and the increase in photovoltaic power generation, the purchase of electricity is slightly reduced.
While the office area with relatively low heat-to-electric ratio is supplied to the thermal energy of the region, except for the period 14:00–17:00 office area gas turbine decline in output, it has increased the purchase of electricity to the electric grid. During the period from 23:00–8:00, the residential area has less electricity and high thermal load. While the commercial area has a certain electrical load and the thermal load tends to zero. At this time, the gas turbine output increases and complements the energy characteristics of the residential area. Therefore, the utilization rate of the gas turbine is increased, and it is more economical to use the distributed power source preferentially, and the difference in energy consumption is supplemented by the electric power grid.
(3) Electric power output distribution
In Figure 6a, residential area system power load is mainly supplied by the electric grid, and makes full use of photovoltaic power generation during the period 8:00–16:00, while the electricity price in the valley section 21:00–7:00, 12:00–17: 00 charges the electrical storage device. During the peak period of 8:00–11:00 and 18:00–20:00, the absorption refrigeration unit replaces the electric refrigeration unit, and the residential area absorbs more thermal from the heat-supply network. At the same time, the charged electrical storage device discharges during this period to reduce the purchase of electricity from the electric power grid and effectively reduce the peak-filling effect.
In Figure 6b, the difference between day and night electrical load of the office system is obvious. The output of the gas turbine is almost the same as that of the electric power grid. The waste thermal is recovered and supplied to the thermal load or the thermal load is supplied to the residential area through the heat-supply network. Only absorption refrigeration units and no electric refrigeration units are installed in the planning, and the output of absorption refrigeration units is maintained at a higher level during the operation. We fully utilize photovoltaic power generation from 7:00–17:00, and charge the electrical storage device at 23:00–5:00 and 13:00–18:00. During the period 8:00–12:00 and 19:00–21:00, the electrical storage device is discharged during the peak period of electricity price.
Similarly, in the commercial area with high heat-to-electric ratio in Figure 6c, the system electric power load is mainly satisfied by the purchase of electricity from the gas turbine and electric power grid. The gas turbine assumes the main power supply task. The electrical storage device charge and discharge and photovoltaic power generation operation conditions in this area are similar to the above two regions. The refrigeration unit operates at 23:00–5:00 during the electricity price period of the valley section, and the cooling load is independently satisfied by the absorption refrigeration unit during other periods. The load characteristics of residential and commercial areas and the analysis of the operating conditions of the equipment after planning show that the load characteristics of the two areas have strong complementary correlation characteristics. Compared with the operation of the original independent CCHP system, the joint regional planning for joining the heat-supply network reduces the repeatability of the equipment in each area while enhancing the multi-energy complementarity. The division of energy between the areas with load characteristics is clearer and reflects the operation characteristics, including the centralized energy supply, large-scale equipment and high utilization.
(4) Sensitivity of natural gas price
Figure 7 shows that as the price of natural gas rising, the operating costs of various regions also increases. The operating costs of commercial areas with increased gas turbine capacity after adding heat-supply networks increased obviously. In the later period of rising natural gas prices, the cost-saving curve is flat and the savings are decreasing which means the increase in natural gas prices has weakened the advantages of the heat-supply network. Due to the lack of electric heat-supply equipment in the system, even if the price of natural gas rises, the gas turbine must operate to maintain the energy demand of the thermal load. Therefore, when the gas turbines of each system maintain low-line operation, the utilization efficiency of the equipment is low, and the effect of increasing the comprehensive benefit of the heat-supply network to the system is limited.
(5) Operating expenses
It can be seen from Table 3, in the planned residential areas, gas turbines and gas boilers were abandoned, the photovoltaic capacity allocation was increased, and the carbon emission tax was greatly reduced. In the office area, the difference in equipment capacity is small under mode 1 and mode 2, and the output of the equipment is similar. The carbon emission tax fluctuations in different modes are extremely small. After adding the thermal network, the gas turbine capacity in the commercial area increased, the output of the equipment increased greatly during operation, and reduced the electricity purchase from the electric grid. Compared with the large increase in output, the carbon emission tax increased slightly which indicates the cleanliness of the gas turbine operation. The capacity allocation of photovoltaic generator sets and photovoltaic collectors have a certain impact on the comprehensive benefits of the carbon emission tax. However, the two projects have a large investment cost and the unit output has uncertainty. After the addition of the heat-supply network, the total operating costs of the three regions were reduced by 8.2% compared with the independent operating costs and the carbon emission tax was reduced by 3.32%.
4. Discussion
According to the operating characteristics, it can be seen that the gas equipment in the independent area maintains low-load operation, and the economic dispatching is limited. The joint planning of joining the heating network reduces the repeatability of equipment in each area, and the division of energy between the areas with load characteristics is more clear. It embodies the operating characteristics of centralized energy supply and high utilization of equipment.
The multi-region comprehensive energy system based on thermal network interaction not only saves the one-time investment cost, but also improves the overall operation efficiency while promoting photovoltaic absorption. Of course, the application of the heat network has its limitations. If the load characteristics between the regions are similar, the effect of increasing the heat network is not obvious, the heat storage device can be considered. And the distance between the regions should not be too long to reduce the heat energy transmission loss. In cold places, it can be used as a supplement to the distributed thermal energy system as a thermal power plant system, and the benefits brought by the construction of the heat network in the different load characteristics areas are particularly obvious.
This paper does not discuss the impact of surplus electric power inputted to electric grid and prospective annual load change on the comprehensive energy capacity allocation plan, and it is also simple to model the thermal network. The evaluation of the operation state of the comprehensive energy system, such as the primary energy utilization efficiency and environmental benefits, can be taken as the research direction of the next stage.
5. Conclusions
In this paper, the integrated energy system of typical urban residential, office and commercial mixed areas in the city is connected through the heat-supply network for joint planning, and compared with the original independent regional integrated energy system planning and operation, the following conclusions are drawn:
(1) When natural gas prices fluctuate greatly, it is not recommended to configure large-capacity gas equipment, and the appropriate capacity can be configured to meet the minimum load requirements. The load characteristics of residential and commercial areas and the analysis of the operating conditions of the equipment after planning show that the two areas are highly complementary. For areas with low heat-to-electric ratio, the combination of gas turbine and absorption chiller is prioritized to meet the cold and hot load. For areas with high heat-to-electric ratio, the output of gas turbine and gas boiler should be balanced to achieve optimal working coordination. Inter-regional heat energy interacts through the heat network, enabling multi-energy flow to achieve cross-regional distribution, coordinated planning of multi-regional systems, Although the cost of heat network pipe laying has increased about 2.44 million yuan, The total investment cost of mode 2 is lower than that of mode 1 about 1.1 million yuan, reduce proportion is 1.6%, especially the investment cost of gas turbine has been reduced about 7.3 million yuan, reduce proportion is 13.3%. Significantly reduced the configuration and investment of gas turbine and gas boiler, resulting in lower equipment costs.
(2) The primary investment cost of the electrical storage device is expensive, and the lower economic benefit brought by the electrical storage device in the area to adjust the output of the gas turbine. Therefore, the electrical storage device is mainly used to interact with the power grid, and the peak value is filled with the price response. The integration of energy storage and heat network into multi-regional joint planning can achieve multi-energy scheduling in time and space between regions. In the modeling process, a carbon emission model was added. The investment cost of photovoltaic generating set has been added about 4.4 million yuan, increased by 66.7%, it means the power of PV output increased and promotes renewable energy consumption. After the addition of the heat-supply network, the total operating costs of the three regions were reduced by 8.2% compared with the independent operating costs and the carbon emission tax was reduced by 3.32%. The simulation showed that the input of the heating network reduced the overall energy consumption of the system, promoted the use of clean energy, and improved the local consumption capacity of distributed energy.
Author Contributions
Supervision, X.Y.; investigation, resources, X.X.; software, data curation, writing—original draft preparation, G.G.; conceptualization, formal analysis, methodology, writing—review and editing, B.T.
Funding
Fund Project: Shanghai Municipal Science and Technology Commission Local Capacity Building Plan (16020500900).
Conflicts of Interest
The authors declare no conflicts of interest.
Appendix A

Table A1.
Equipment parameters.
| Type | Unit Investment Cost (RMB /kW) | Single Rated Power | Conversion Efficiency |
|---|---|---|---|
| Pthemalovoltaic generator set | 10,000 | -- | 0.175 |
| Pthemalovoltaic collector | 8210 | -- | 0.56 |
| Electrical storage device | 1500 | -- | 90 |
| Absorption chiller | 1240 | -- | 1.26 |
| Electric refrigerator | 820 | -- | 4.13 |
| 1#gas turbine | 7216.3 | 1210 | 0.243 |
| 2# gas turbine | 5749.9 | 3515 | 0.279 |
| 3# gas turbine | 5429.45 | 4600 | 0.293 |
| 4# gas turbine | 5289.7 | 5740 | 0.32 |
| 1# gas boiler | 86.84 | 1300 | 0.85 |
| 2# gas boiler | 75.14 | 1950 | 0.86 |
| 3# gas boiler | 73.26 | 4560 | 0.9 |
| 4# gas boiler | 71.83 | 5200 | 0.9 |
Table A2.
Electricity purchase price.
| Area Type | Purchase Price/RMB | ||
|---|---|---|---|
| Peak Period | Flat Period | Valley Period | |
| 8:00–11:00 18:00–20:00 | 6:00–7:00 12:00–17:00 21:00–22:00 | 23:00–5:00 | |
| Residential | 0.677 | 0.377 | 0.377 |
| Office, commercial | 1.159 | 0.708 | 0.351 |
Table A3.
Other parameters of integrated energy system.
| Other Parameters | Resident | Commercial | Office |
|---|---|---|---|
| Installable area | 32,000 | 23,000 | 15,000 |
| Average sunshine intensity (kw/(M2·d)) | 0.669 | 0.669 | 0.669 |
| Average annual sunshine hours | 1970 | 1970 | 1970 |
Table A4.
Cold and themal load and solar power available in each region (unit: kW).
| Period of Time | Residential Areas | Office Area | Commercial Area | |||||||||
|---|---|---|---|---|---|---|---|---|---|---|---|---|
| Electrical Load | Themal Load | Cold Load | Solar Energy | Electrical Load | Themal Load | Cold Load | Solar Energy | Electrical Load | Themal Load | Cold Load | Solar Energy | |
| 00.00–01.00 | 1180 | 3580 | 90 | 0 | 796 | 0 | 20 | 0 | 2194 | 0 | 224 | 0 |
| 01.00–02.00 | 1194 | 3577 | 89 | 0 | 794 | 0 | 20 | 0 | 2187 | 0 | 221 | 0 |
| 02.00–03.00 | 1192 | 3589 | 101 | 0 | 795 | 0 | 20 | 0 | 2201 | 0 | 229 | 0 |
| 03.00–04.00 | 1205 | 3549 | 96 | 0 | 801 | 0 | 20 | 0 | 2195 | 0 | 231 | 0 |
| 04.00–05.00 | 1210 | 3596 | 99 | 0 | 798 | 0 | 20 | 0 | 2197 | 0 | 236 | 0 |
| 05.00–06.00 | 1211 | 3602 | 108 | 0 | 806 | 0 | 20 | 0 | 2203 | 0 | 233 | 0 |
| 06.00–07.00 | 1198 | 3607 | 191 | 960 | 802 | 0 | 20 | 450 | 2194 | 0 | 397 | 690 |
| 07.00–08.00 | 1600 | 3615 | 195 | 1280 | 813 | 0 | 30 | 600 | 2211 | 0 | 401 | 920 |
| 08.00–09.00 | 1193 | 3994 | 204 | 1600 | 1994 | 2394 | 30 | 750 | 6397 | 1794 | 410 | 1150 |
| 09.00–10.00 | 2398 | 4197 | 197 | 1920 | 4367 | 4197 | 30 | 900 | 7204 | 2798 | 408 | 1380 |
| 10.00–11.00 | 2801 | 4198 | 201 | 2240 | 4389 | 4403 | 30 | 1050 | 7581 | 3609 | 410 | 1610 |
| 11.00–12.00 | 2423 | 4200 | 200 | 2560 | 4394 | 4195 | 30 | 1200 | 7597 | 3960 | 407 | 1840 |
| 12.00–13.00 | 2418 | 4204 | 205 | 2800 | 4402 | 4011 | 30 | 1350 | 7611 | 4397 | 417 | 2070 |
| 13.00–14.00 | 2391 | 3994 | 198 | 2800 | 4396 | 4004 | 30 | 1350 | 7799 | 4001 | 410 | 2070 |
| 14.00–15.00 | 2404 | 3611 | 192 | 2240 | 4387 | 3994 | 30 | 1050 | 8001 | 4013 | 410 | 1610 |
| 15.00–16.00 | 2790 | 3603 | 103 | 1600 | 4405 | 4005 | 30 | 750 | 7994 | 3998 | 411 | 1150 |
| 16.00–17.00 | 2797 | 3598 | 105 | 960 | 4394 | 4001 | 30 | 450 | 7598 | 4005 | 407 | 690 |
| 17.00–18.00 | 2805 | 3594 | 97 | 0 | 4385 | 3997 | 30 | 0 | 7203 | 4193 | 405 | 0 |
| 18.00–19.00 | 2800 | 4003 | 100 | 0 | 2011 | 2003 | 20 | 0 | 6414 | 4197 | 230 | 0 |
| 19.00–20.00 | 2790 | 4200 | 94 | 0 | 1206 | 1000 | 20 | 0 | 6399 | 4005 | 224 | 0 |
| 20.00–21.00 | 2414 | 4189 | 96 | 0 | 8017 | 500 | 20 | 0 | 6387 | 3607 | 223 | 0 |
| 21.00–22.00 | 2006 | 4176 | 99 | 0 | 806 | 0 | 20 | 0 | 5180 | 2809 | 219 | 0 |
| 22.00–23.00 | 1600 | 4000 | 100 | 0 | 800 | 0 | 20 | 0 | 2200 | 0 | 230 | 0 |
| 23.00–24.00 | 1200 | 3600 | 100 | 0 | 800 | 0 | 20 | 0 | 2200 | 0 | 230 | 0 |
References
- Bie, C.; Wang, X.; Hu, Y. Review and prospect of energy Internet planning. Proc. CSEE 2017, 37, 6445–6462. [Google Scholar]
- Yin, S.; Ai, Q.; Zeng, S.; Wu, Q.; Hao, R.; Jiang, D. Challenges and Prospects of Energy Internet Multi-energy Distributed Optimization Research. Power Syst. Technol. 2018, 42, 1359–1369. [Google Scholar]
- Wang, W.; Wang, D.; Jia, H.; Chen, Z.; Guo, B.; Zhou, H.; Fan, M. A Summary of Steady-State Analysis of Typical Regional Integrated Energy Systems in the Background of Energy Internet. Proc. CSEE 2016, 36, 3292–3306. [Google Scholar]
- Chen, B.; Liao, Q.; Liu, D.; Wang, W.; Wang, Z.; Chen, S. A comprehensive evaluation index and method for regional integrated energy system. Autom. Electr. Power Syst. 2018, 42, 174–182. [Google Scholar]
- Moeini-Aghtaie, M.; Abbaspour, A.; Fotuhi-Firuzabad, M.; Hajipour, E. A decomposed solution to multiple-energy carriers optimal power flow. IEEE Trans. Power Syst. 2014, 29, 707–716. [Google Scholar] [CrossRef]
- Rastegar, M.; Fotuhi-Firuzabad, M.; Lehtonen, M. Home load management in a residential energy hub. Electr. Power Syst. Res. 2015, 119, 322–328. [Google Scholar] [CrossRef]
- Herrando, M.; Markides, C.N.; Hellgardt, K.A. UK-based assessment of hybrid PV and solar-thermal systems for domestic heat-supply and power: System performance. Appl. Energy 2014, 122, 288–309. [Google Scholar] [CrossRef]
- Li, Y.; Wu, M.; Zhou, H.; Wang, W.; Wang, D.; Ge, L. Discussion on several problems of regional multi-energy system based on all-energy flow model. Power Syst. Technol. 2015, 39, 2230–2237. [Google Scholar]
- Kuosa, M.; Kontu, K.; Mäkilä, T.; Lampinen, M.; Lahdelma, R. Static study of traditional and ring networks and the use of mass flow control in district themaling applications. Appl. Ther. Eng. 2013, 54, 450–459. [Google Scholar] [CrossRef]
- Li, Y.; Xun, J.; Cao, H.; Gao, C.; Zhang, X.; Zhang, J.C.W. Distribution Network Planning Strategy Based on Integrated Energy Collaborative Optimization. Power Syst. Technol. 2018, 42, 1393–1400. [Google Scholar]
- Bai, M.; Wang, Y.; Tang, W.; Wu, C.; Zhang, B. Day-time optimization scheduling of interval integrated energy system based on interval linear programming. Power Syst. Technol. 2017, 41, 3963–3970. [Google Scholar]
- Hu, R.; Ma, J.; Li, Z.; Lu, Q.; Zhang, D.; Qian, X. Optimal Configuration and Applicability Analysis of Distributed Cogeneration System. Power Syst. Technol. 2017, 41, 418–425. [Google Scholar]
- Liu, D.; Ma, H.; Wang, B.; Gao, W.; Wang, J.; Yan, B. Operational optimization of regional integrated energy system with combined themal and power supply and energy storage. Autom. Electr. Power Syst. 2018, 42, 113–120. [Google Scholar]
- Gu, W.; Lu, S.; Wang, J.; Yin, X.; Zhang, C.; Wang, Z. Multi-regional integrated energy system heat-supply network modeling and system operation optimization. Proc. CSEE 2017, 37, 1035–1046. [Google Scholar]
- Wang, J.; Gu, W.; Lu, S.; Zhang, C.; Wang, Z.; Tang, Y. Collaborative Planning of Multi-region Integrated Energy System Based on Heat-supply network Model. Autom. Electr. Power Syst. 2016, 40, 17–24. [Google Scholar]
- Xiao, X.; Kan, W.; Yang, Y.; Zhang, S.; Xiao, Y. Superstructure optimization configuration of combined energy storage system. Proc. CSEE 2012, 32, 8–15. [Google Scholar]
- Wu, H.; Wang, D.; Liu, X. Strategy Evaluation and Optimization Configuration of Solar Cooling, Cogeneration System. Power Syst. Autom. 2015, 39, 46–51. [Google Scholar]
- Gu, W.; Wu, Z.; Bo, R.; Liu, W.; Zhou, G.; Chen, W.; Wu, Z. Modeling, planning and optimal energy management of combined cooling, themaling, and power microgrid: A review. Int. J. Electr. Power Energy Syst. 2014, 54, 26–37. [Google Scholar] [CrossRef]
- Fumo, N.; Chamra, L.M. Analysis of combined cooling, themaling, and power systems based on source primary energy consumption. Appl. Energy 2010, 33, 96–100. [Google Scholar]
- Jing, Y.; Bai, H.; Zhang, J. Multi-objective optimization design and operation strategy analysis of solar cooling, themaling and power supply system. Proc. CSEE 2012, 32, 82–87. [Google Scholar]
- Lo, C.E.; Borelli, D.; Devia, F.; Schenone, C. Future distributed generation: An operational multi-objective optimization model for integrated small scale urban electrical, thermal and gas grids. Energy Convers. Manag. 2017, 143, 348–359. [Google Scholar] [CrossRef]
- Zhou, R.; Li, S.; Chen, R.; Li, H.; Yang, Y.; Chen, Y. Multi-objective Scheduling of Carbon Emissions Trading in Themal and Cold Electricity Using Fuzzy Self-Correction Particle Swarm Optimization Algorithm. Proc. CSEE 2014, 34, 6119–6126. [Google Scholar]
- Qiu, J.; Dong, Z.; Zhao, J.; Meng, K.; Zheng, Y.; Hill, D.J. Low carbon oriented expansion planning of integrated gas and power systems. IEEE Trans. Power Syst. 2015, 30, 1035–1046. [Google Scholar] [CrossRef]
- Wang, Z.; Liu, Y.; Tang, Y.; Gu, W.; Wu, X. Capacity allocation of CO2 emissions considering CO2 emissions. Proc. CSU-EPSA 2017, 29, 104–110. [Google Scholar]
- Lorestani, A.; Ardehali, M.M. Optimal integration of renewable energy sources for autonomous tri-generation combined cooling, heating and power system based on evolutionary particle swarm optimization algorithm. Energy 2018, 145, 839–855. [Google Scholar] [CrossRef]
- Yousefi, H.; Ghodusinejad, M.H.; Noorollahi, Y. GA/AHP-based optimal design of a hybrid CCHP system considering economy, energy and emission. Energy Build. 2017, 138, 309–317. [Google Scholar] [CrossRef]
- Dong, X.; Quan, C.; Jiang, T. Optimal Planning of Integrated Energy Systems Based on Coupled CCHP. Energies 2018, 11, 2621. [Google Scholar] [CrossRef]
- Ma, H.; Wang, B.; Gao, W.; Liu, D.; Sun, Y.; Liu, Z. Optimal Scheduling of an Regional Integrated Energy System with Energy Storage Systems for Service Regulation. Energies 2018, 11, 195. [Google Scholar] [CrossRef]
- Wang, Y.; Yu, H.; Yong, M.; Huang, Y.; Zhang, F.; Wang, X. Optimal Scheduling of Integrated Energy Systems with Combined Heat and Power Generation, Photovoltaic and Energy Storage Considering Battery Lifetime Loss. Energies 2018, 11, 1676. [Google Scholar] [CrossRef]
- Yang, L.; Zhao, X.; Li, X.; Yan, W. Probabilistic Steady-State Operation and Interaction Analysis of Integrated Electricity, Gas and Heating Systems. Energies 2018, 11, 917. [Google Scholar] [CrossRef]
Figure 1.
Integrated energy system multi-energy flow structure.

Figure 2.
Area division and heat-supply network structure.

Figure 3.
Interaction diagram between each CCHP system and thermal network thermal energy.

Figure 4.
Flow chart of heat-supply network pipelines between regions. (a) Flow chart of heat-supply network pipelines of office residential, commercial residential, commercial office; (b) Flow chart of heat-supply network pipelines of commercial residential office.
Figure 4.
Flow chart of heat-supply network pipelines between regions. (a) Flow chart of heat-supply network pipelines of office residential, commercial residential, commercial office; (b) Flow chart of heat-supply network pipelines of commercial residential office.

Figure 5.
Electric interaction with electric power grid. (a) Electric interaction with electric power grid of residential area; (b) Electric interaction with electric power grid of office area; (c) Electric interaction with electric power grid of commercial area.
Figure 5.
Electric interaction with electric power grid. (a) Electric interaction with electric power grid of residential area; (b) Electric interaction with electric power grid of office area; (c) Electric interaction with electric power grid of commercial area.
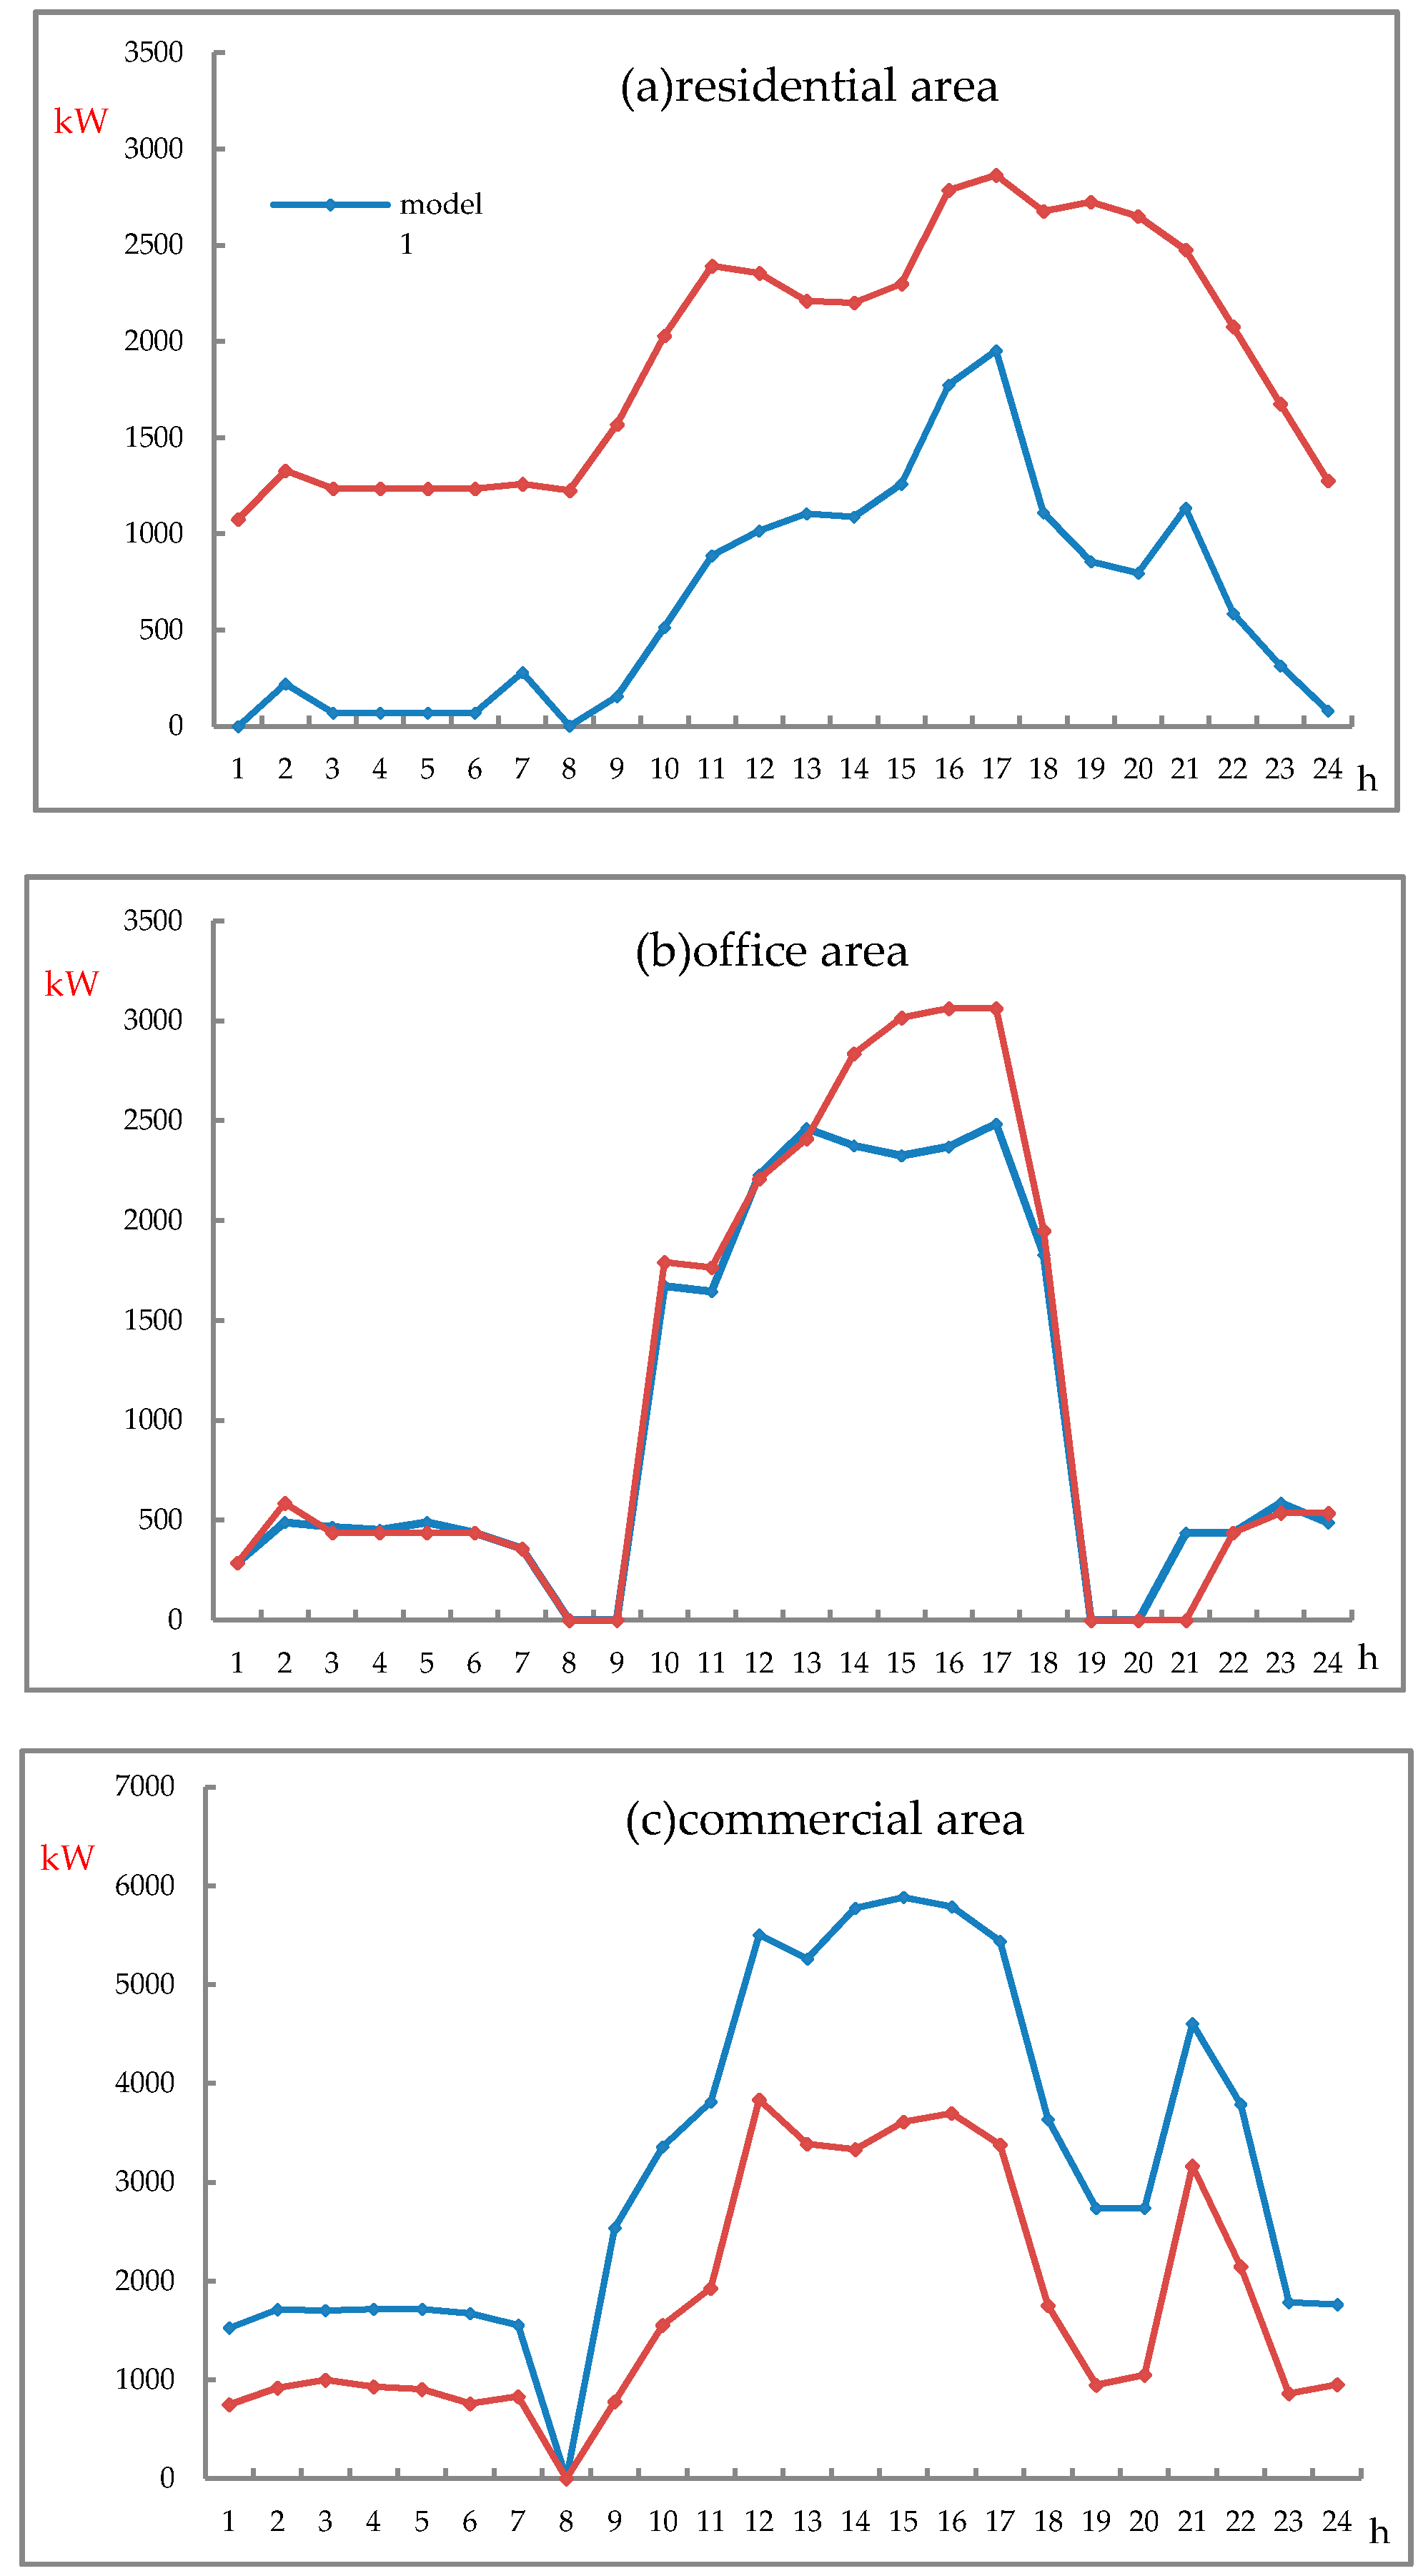
Figure 6.
CCHP power output structure diagram. (a) CCHP power output structure diagram of residential area; (b) CCHP power output structure diagram of office area; (c) CCHP power output structure diagram of commercial area.
Figure 6.
CCHP power output structure diagram. (a) CCHP power output structure diagram of residential area; (b) CCHP power output structure diagram of office area; (c) CCHP power output structure diagram of commercial area.

Figure 7.
Operating costs of each CCHP system under different natural gas prices. (a) CCHP system operation costs of different areas; (b) the operation cost-saving of CCHP systems between two modes.
Figure 7.
Operating costs of each CCHP system under different natural gas prices. (a) CCHP system operation costs of different areas; (b) the operation cost-saving of CCHP systems between two modes.

Table 1.
Comparison of CCHP system optimization configuration and one-time investment cost.
| Equipment | Residential Area | Office Area | Commercial Area | One-Time Investment Cost | ||||
|---|---|---|---|---|---|---|---|---|
| Mode1 | Mode2 | Mode1 | Mode2 | Mode1 | Mode2 | Mode1 | Mode2 | |
| Gas turbine/kw | 1210 × 2 | 0 | 1210 × 2 | 1210 × 2 | 3515 | 5740 | 5513.5 | 4782.6 |
| Gas boiler/kw | 1300 | 0 | 0 | 0 | 0 | 0 | 11.3 | 0 |
| Electric refrigerator/kw | 50 | 50 | 0 | 0 | 0 | 50 | 4.1 | 8.2 |
| Absorption refrigerator/kw | 0 | 200 | 30 | 30 | 400 | 400 | 53.3 | 78.1 |
| Photovoltaic generating set/kw | 260 | 400 | 200 | 300 | 200 | 400 | 660 | 1100 |
| Electrical storage device/kw | 300 | 400 | 400 | 400 | 450 | 400 | 172.5 | 180 |
| Photovoltaic collector/kw | 450 | 650 | 150 | 0 | 150 | 0 | 615 | 533.6 |
| Total investment cost/10,000 RMB | 2413.7 | 1000 | 2118.2 | 2087.5 | 2437.8 | 3527.5 | 6969.7 | 6615 |
Table 2.
Thermal network planning.
| Pipeline | Residential—Office | Residential—Commercial | Office—Commercial |
|---|---|---|---|
| Maximum flow | 0.011 | ||
| Pipe radius | 5 | 9 | 6 |
| Running cost of water pump | 369 | 109 | 511 |
| Cost of pipe laying (10,000 RMB) | 84.7 | 59.5 | 99.8 |
Table 3.
CCHP system operating costs and carbon tax.
| Categories | Mode 1 (RMB) | Mode 2 (RMB) | Reduction Proportion (%) | ||||
|---|---|---|---|---|---|---|---|
| Residential Area | Office Area | Commercial Area | Residential Area | Office Area | Commercial Area | - | |
| Carbon tax | 8621 | 8483 | 19,183 | 7372 | 8464 | 19,245 | 3.32 |
| Operating cost | 51,672 | 50,999 | 107,974 | 193,368 (total) | 8.2 | ||
© 2018 by the authors. Licensee MDPI, Basel, Switzerland. This article is an open access article distributed under the terms and conditions of the Creative Commons Attribution (CC BY) license (http://creativecommons.org/licenses/by/4.0/).
Share and Cite
MDPI and ACS Style
Tang, B.; Gao, G.; Xia, X.; Yang, X. Integrated Energy System Configuration Optimization for Multi-Zone Heat-Supply Network Interaction. Energies 2018, 11, 3052. https://doi.org/10.3390/en11113052
AMA Style
Tang B, Gao G, Xia X, Yang X. Integrated Energy System Configuration Optimization for Multi-Zone Heat-Supply Network Interaction. Energies. 2018; 11(11):3052. https://doi.org/10.3390/en11113052
Chicago/Turabian StyleTang, Bo, Gangfeng Gao, Xiangwu Xia, and Xiu Yang. 2018. "Integrated Energy System Configuration Optimization for Multi-Zone Heat-Supply Network Interaction" Energies 11, no. 11: 3052. https://doi.org/10.3390/en11113052
Note that from the first issue of 2016, this journal uses article numbers instead of page numbers. See further details here.