Nuclear Magnetic Resonance Measurement of Oil and Water Distributions in Spontaneous Imbibition Process in Tight Oil Reservoirs

1
College of Petroleum Engineering, Xi’an Shiyou University, Xi’an 710065, China
2
Shaanxi Key Laboratory of Well Stability and Fluid & Rock Mechanics in Oil and Gas Reservoirs, Xi’an Shiyou University, Xi’an 710065, China
*
Author to whom correspondence should be addressed.
Energies 2018, 11(11), 3114; https://doi.org/10.3390/en11113114
Submission received: 15 October 2018
/
Revised: 1 November 2018
/
Accepted: 6 November 2018
/
Published: 10 November 2018
(This article belongs to the Special Issue Latest Research Progress for Nanotech for Oil and Gas)
Abstract
:Spontaneous imbibition of water into tight oil reservoirs is considered an effective way to improve tight oil recovery. We have combined testing techniques such as nuclear magnetic resonance, mercury injection capillary pressure, and magnetic resonance imaging to reveal the distribution characteristics of oil and water during the spontaneous imbibition process of tight sandstone reservoir. The experimental results were used to describe the dynamic process of oil–water distribution at the microscopic scale. The water phase is absorbed into the core sample by micropores and mesopores under capillary forces that dry away the original oil phase into the hydraulically connected macropores. The oil phase entering the macropores will drive away the oil in place and expel the original oil from the macropores. The results of magnetic resonance imaging clearly show that the remaining oil accumulates in the central region of the core because a large amount of water is absorbed in the late stage of spontaneous imbibition, and the water in the pores gradually connects to form a “water shield” that blocks the flow of the oil phase. We propose the spontaneous imbibition pathway, which can effectively explain the internal mechanisms controlling the spontaneous imbibition rate. The surface of the core tends to form many spontaneous imbibition pathways, so the rate of spontaneous imbibition is fast. The deep core does not easily form many spontaneous imbibition pathways, so the rate of spontaneous imbibition is slow. This paper reveals the pore characteristics and distribution of oil and water during the spontaneous imbibition process, which is of significance for the efficient development of tight oil.
1. Introduction
In recent years, tight oil has become a hot research topic in the petroleum industry [1,2,3,4]. Horizontal drilling and multi-stage hydraulic fracturing are the key technologies for exploiting the tight oil to enable economic production [5,6,7]. However, the production of tight oil is rapidly decreasing, and the elasticity recovery efficiency is low [8]. Spontaneous imbibition (SI) of water into a tight oil reservoir is considered an effective way to improve tight oil recovery [9,10,11]. Thus, it is necessary to conduct in-depth research on SI.
The SI mechanisms involve a complex interaction between capillary [12], gravity [13], viscous forces [14], and wettability [15]. Many experimental studies on SI have been reported in the literature. Brownscombe and Dyes [16] found that water can enter the matrix of rocks to displace the oil because of capillary force. Aronofsky and Jenkins [17] established an empirical model of oil displacement efficiency and SI time. Dehghanpour et al. [18] reported that water adsorption by clay minerals is an additional driving force for water SI. Makhanov et al. [19] demonstrated that the SI rate in a tight oil reservoir would depend on fluid and shale properties, fracture-matrix interface, and soaking time. Yildiz et al. [20] investigated the effects of shape factor, characteristic length, and boundary conditions on the rate of SI. Because of the invisible nature of the core, previous studies on SI measured macroscopic parameters such as oil saturation, oil output, and electrical resistivity to speculate the microscopic process of imbibition. The distribution, interaction, and variation of oil and water in tight rock are the key mechanisms that improve the recovery of tight oil by SI. The true distribution of fluid in the core and mechanism of SI cannot be understood by using typical methods; therefore, visualization of the fluid distribution inside the core has become an important direction for SI research.
Nuclear magnetic resonance (NMR) has potential applications for non-destructively detecting fluid distribution in the core sample. At present, NMR technology has been widely used in medical diagnosis, petroleum exploration and development, agriculture, food, and other fields, with non-destructive testing, sample reusability, and fast detection speed [21,22,23]. NMR technology is an advanced method for the analysis and detection of porous media, including porosity [24,25], pore-size distribution [26], permeability [27], oil–water saturation [28], wettability [29], and degree of isotropy [30]. NMR has been used for many experimental studies, involving crack identification [31], pore distribution [32], and internal rock structure [33]. Recently, NMR technology has been used to study the SI mechanisms. In that research, the ranges for pore classification into micro, meso, and macro based on the guidelines proposed by the International Union of Pure and Applied Chemistry (IUPAC), which defines the radius ranges of macropores, mesopores, and micropores as >50 nm, 2–50 nm, and <2 nm, respectively [34]. Zhou et al. [35] studied the influencing factors of SI, including rock size, rock properties, fluid properties, wettability, initial oil saturation, and boundary condition, by combining NMR and conventional SI experiments. Lai et al. [36] demonstrated that the water is first imbibed into micropores and small mesopores, and variations in the T2 spectrum are principally reflected in the T2 stage when the relaxation time is ≥10 ms. Wang et al. [37] reported oil contribution from micropores up to 53.34%, and that permeability of 0.1 mD is a critical point at which the oil contribution of mesopores surpasses that of micropores.
Previous studies indicate an important mechanism of SI that can be expressed as water absorbed into micropores and mesopores and oil expelled in macropores, however, the dynamic distribution characteristics of oil and water in the whole SI process have not been described. Previous studies also did not visually characterize the distribution of oil and water in the SI process. Moreover, previous studies show that the SI rate can be divided into two stages, but the internal mechanism is not well revealed.
Therefore, the main aim of this study is to investigate the characteristics of oil and water distributions in the SI process for tight oil reservoirs at the pore-scale level, as shown in Figure 1. We conducted imbibition experiments with NMR testing to achieve this end. First, we combine the NMR and mercury injection capillary pressure (MICP) to investigate the characteristics of oil and water distributions in the SI process for tight oil reservoirs at the pore-scale level. Then, we use magnetic resonance imaging (MRI) technology and pseudo-color maps to visualize the distribution and evolution characteristics of oil and water in the SI process. At last, we try to propose a new concept termed “spontaneous imbibition pathway” to reveal the essential cause of the rate of SI.
2. Experiments
2.1. Materials
Materials used in the SI experiments include core samples, simulated oil, and simulated formation water. The core samples were collected from the Yu Zuizi area of Yanchang oil field of the Triassic, Ordos Basin, China. Cores were drilled with a core-milling machine (QT5625, Huaxing Petroleum Instrument Co., Ltd., Nantong, China) to generate long cores with a diameter of 2.521 cm. Then, the core samples were cleaned in an automatic oil washing instrument (HXY-IV, Beijing Lytd Technology Co., Ltd., Beijing, China) for 10 days with a 3:1 volume ration of toluene–ethanol solution. After cleaning, the core samples were dried in an oven (YSL-DHS-225, Haian Petroleum Instrument Co., Ltd., Haian, China) at 100 °C for 48 h followed by a 24-h period of cooling to room temperature (26 °C). Finally, the petrophysical properties including diameter, length, porosity, and permeability were measured. We chose four cores with similar petrophysical properties, displayed in Table 1, for experimental research.
The simulated oil is a 1:4 volume ration mixture of degassed crude oil from the Yu Zuizi area and kerosene. At room temperature (26 °C), the viscosity is 2.13 mPa·s and density is 0.81 g/cm3. The simulated formation water was prepared in the laboratory to emulate water that was co-produced from the well where cores were collected. The properties of simulated formation water are indicated in Table 2. The prepared simulated formation water was divided into two parts. One of them was added with MnCl2 to a concentration of 40% to shield the hydrogen signal from the simulated formation water. Before experiments, the simulated formation water is filtered through a membrane filter with 0.45 μm pore sizes.
2.2. Experimental Setup
The major experimental setups include Amott cells, NMR spectrometer, and an improved imbibition cell based on weighing method. Amott cells (Ambient temperature amott cell, Vindum Engineering Inc., Sandpoint, AK, USA) are used for one of the imbibition tests. The NMR spectrometer is produced by Shanghai Niumag Analytical Instrument Co., Ltd. The magnetic field strength is 0.52 ± 0.05 T, and the resonance frequency of the hydrogen proton is 21.3 MHz. Because tight rocks have low imbibition rates and experimental results can easily influence ambient conditions, an improved imbibition cell is developed by China University of Petroleum (Beijing) [38] that fully considers the characteristics of long imbibition time and high measurement accuracy for SI tests of tight core. The other devices used in this study include a core milling machine, core cleaner, oven, core measurement system, analytical electronic balance, Vernier caliper, and glassware.
2.3. Experimental Procedures
The experimental procedures are as follows:
- (1)
- Prepare short core samples, I01, I02, I03, and I04, with a length of 2.521 cm for SI experiments.
- (2)
- Clean, dry, and measure the petrophysical properties, shown in Table 1, of the short core samples.
- (3)
- Evacuate the four cores in a sealed container and saturate them with simulated oil. Then, place the core in the core holder and inject 20 pore volumes of simulated oil into the core at a constant injection rate of 0.005 mL/min to ensure these cores are fully saturated with simulated oil.
- (4)
- Remove core from the core holder and age in simulated oil for 48 h to restore the native wettability.
- (5)
- Remove cores from the simulated oil, carefully wipe the simulated oil from the core surface. Conduct SI tests using cores I02, I03, and I04 using the improved imbibition cell and simulated formation water without MnCl2.
- (6)
- Place core I01 in the NMR apparatus for testing its transverse relaxation time (T2) spectrum in the state of saturated oil. Put the core I01 into Amott cell so that it is immersed in simulated formation water with MnCl2. Because it is inconvenient to frequently remove core I01 for NMR tests, the Amott cell is used in this test instead of the improved imbibition cell.
- (7)
- Measure the T2 spectrum (core I01) at different time intervals, such as 1 h, 4 h and 10 h, using NMR. Collect MRI of the core at the same times.
- (8)
- Clean and dry the core I01 after the SI experiment is completed. Perform MICP to obtain the pore size.
3. Experimental Analysis Fundamental Theory
3.1. NMR Theory
In the NMR test, T2 is used to characterize the relaxation characteristics of fluids in rock pores. T2 can be expressed by the following equation [39]:
where T2 is the fluid transverse relaxation time (ms), T2B is the volume relaxation time (ms), T2S is the surface relaxation time (ms), and T2D is the diffusion relaxation time (ms). The volume relaxation and surface relaxation of fluids with longer intrinsic relaxation times (such as water and light oil) can be neglected, and the fluid is dominated by diffusion relaxation in the pores. Therefore, Equation (1) can be simplified as [40]:
where ρ2 is the relaxation rate (µm/ms), depending on pore surface properties, mineral composition, and fluid properties, and S/V is the pore-specific surface (1/µm).
3.2. Relationship Between T2 Spectrum and Pore Throat Radius
The relationship between the pore specific surface (S/V) and the pore radius (r) can be expressed as:
where r is the pore radius, in microns, and Fs is the dimensionless pore shape factor.
Combining Equations (2) and (3) shows that:
where C is the coefficient, which is defined as
For a core, both the relaxation rate and the pore shape factor can be considered constant, so C is also a constant. Therefore, the pore–radius distribution can be calculated from the T2 spectrum and MICP results by determining C. Detailed radius calculation steps were previously described in the literature [41].
4. Results and Discussions
4.1. Pore Radius Distribution
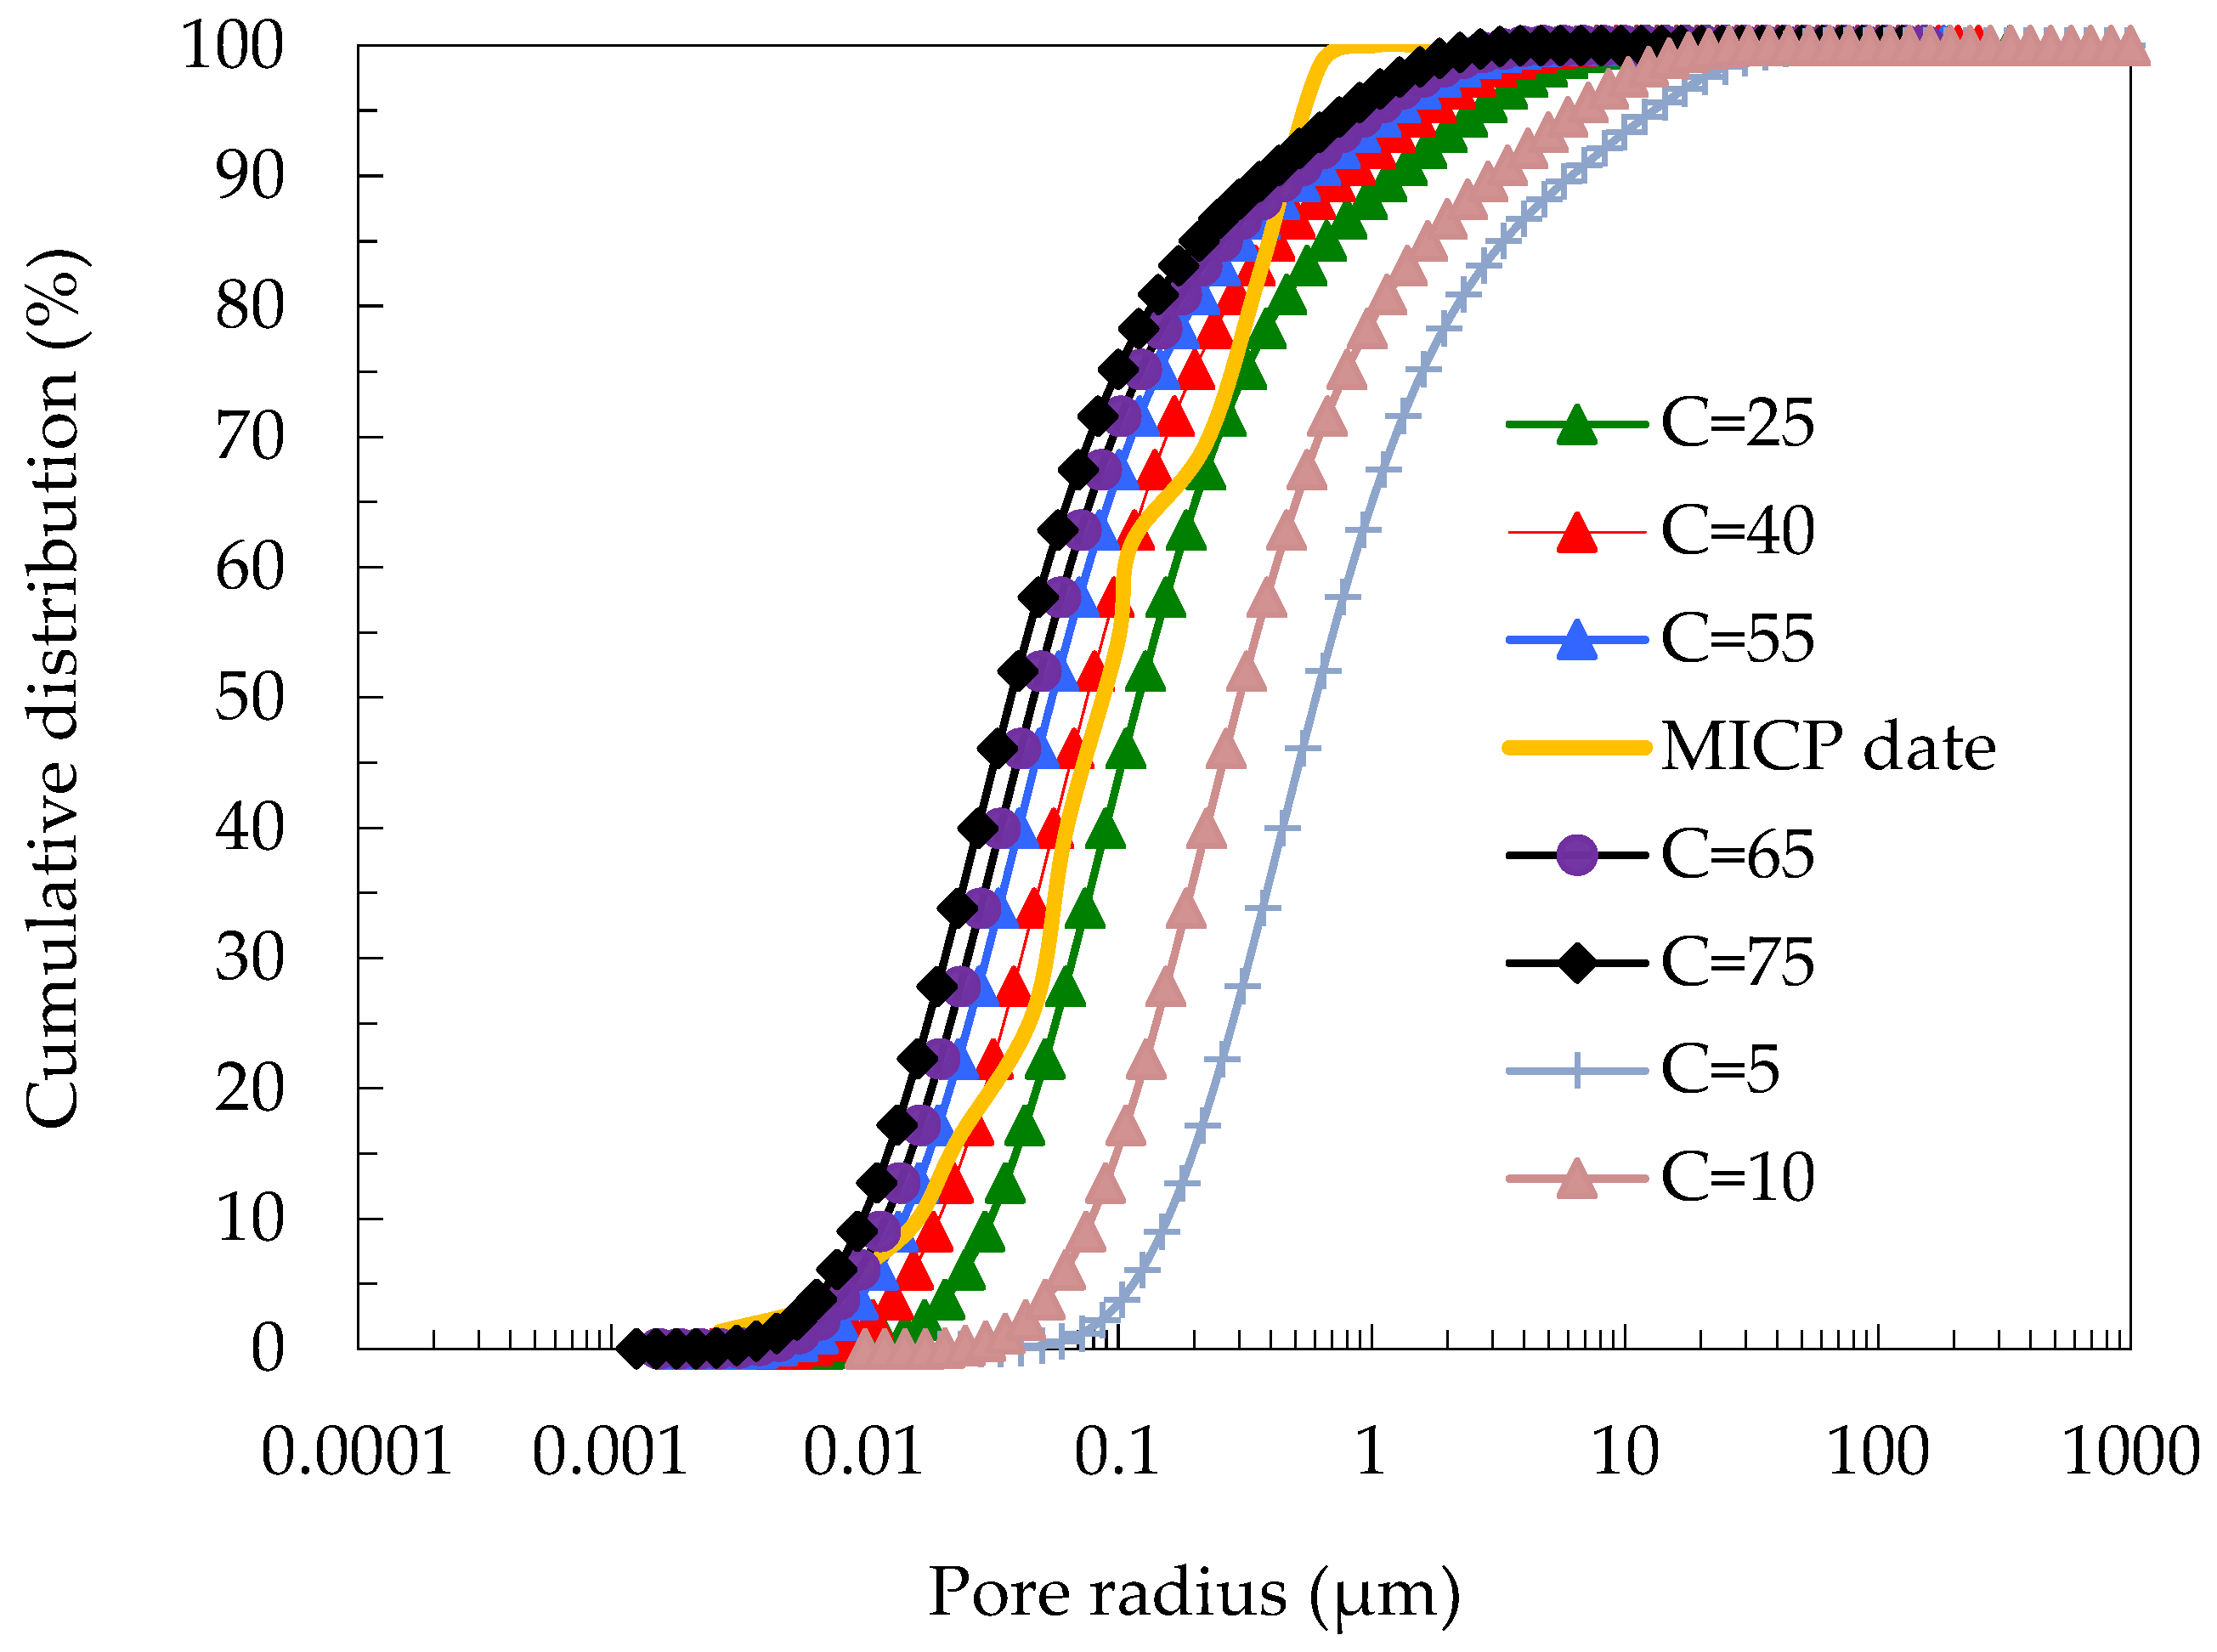
Equation (4) shows that C is a key parameter for establishing the relationship between the transverse relaxation time (T2) and pore radius (r). According to the method mentioned in the literature [31], C can be obtained by fitting MICP data (Core I01). As shown in Figure 2, when C = 40, a best fit is obtained. Combining C and T2 spectrum, the pore–radius distribution, shown in Figure 3, is obtained. The relationship between T2, pore radius, and pore type is shown in Table 3 following the methods of Lai et al. [36] and Liu et al. [42].
4.2. NMR Results
The T2 spectrums were performed at different time intervals throughout the SI process and are illustrated in Figure 4. The T2 spectrum shows the change of the oil phase content in the core at different times of SI because the hydrogen signal of the water phase is shielded by MnCl2. Oil phase saturation in the core, Figure 4, is lower as higher SI time.
We used the ration of the envelope area of the T2 spectrum to quantitatively characterize the dynamic change of oil and water in pores during the SI process [43]. The T2 spectrum at 20 h of SI and the T2 spectrum at the initial time are shown in Figure 5 as examples. The red section reflects the remaining oil distribution in pores, and the blue section reflects the water distribution in pores. The oil saturation (SO) and water saturation (Sw) in different pore types are calculated based on the red section area (Ared) and blue section area (Ablue) with the following equation:
The oil saturation and water saturation of the three pore types (macropores, mesopores, and micropores) were calculated using Equations (6) and (7), and the results are shown in Figure 6. The oil saturation in the micropores was reduced by 30.42%, the oil saturation in the mesopores was reduced by 32.82%, and the oil saturation in the macropores was only reduced by 13.49%. These results indicate that oil in the mesopores and micropores substantially decreases, and the oil in the macropores slightly decreases. The water saturation in the micropores was increased by 18.9%, the oil saturation in the mesopores was increased by 8.88%, and the oil saturation in the macropores was increased by 1.46%. The results indicate that the water saturation in the mesopores and micropores gradually increases, and the water saturation slightly increases in the macropores.
The mechanism of oil and water saturation change in various pore types are illustrated in Figure 7. Before the SI test, the three pore types were saturated with oil. Water can be absorbed into the micropores and mesopores by capillary forces. The water will drive away its original saturated oil, which will enter large pores that are hydraulically connected. The oil from micropores and mesopores will drive away the oil in the macropores, causing the original saturated oil in the macropores to escape the core. Apparently, the macropores continuously drain oil, and the micropores and mesopores continuously compensate by absorbing oil lost from the macropores.
4.3. MRI Results
MRI and image reconstruction of the NMR signals were used to image the SI process of the core, as seen in Figure 8.
Figure 9 shows a series of images at representative times that can be used to visualize the oil and water distribution inside the core during the SI process. The color scale changes from blue to red, indicating that the oil saturation gradually increases. The first image (t = 0 h) shows the initial oil distribution, fully saturated, in the core sample before SI. However, there are some pores that are not fully saturated with oil because of the boundary layer in micro- and nano-throats of tight sandstone oil reservoirs [44]. At later SI times, more water is absorbed into the core sample, resulting in a gradual decrease in oil saturation and an imbibition front (IF), shown in Figure 9. At later SI times, the IF moves deeper into the core. An IF in the A direction has advantages because counter-current imbibition does not easily occur in the B direction. As shown in Figure 10, the B direction is the bottom end of the core during the infiltration experiment. For counter-current imbibition, the capillary pressure (P1) produced by interfaces in the pore space is the driving force, and the buoyancy (Fb) caused by the oil and water density difference is the resistance force. The buoyancy is the resistance of counter-current imbibition for the bottom surface of the core (B direction), so the bottom surface of the core is not prone to counter-current imbibition. The last image (t = 80 h) shows that the remaining oil is concentrated in the middle of the core at the end of the SI test. This is because more water was absorbed into the core sample, and the water-bearing pores are gradually connected to form a “water shield”. This phenomenon results in extra viscous resistance and reduced cross-sectional area for flow of each fluid. As the imbibition progresses, the water shield becomes thicker, so that the connected throats are blocked by the water shield, and the remaining oil cannot flow through these blocked throats because of the capillary pressure. Then the remaining oil was trapped in the center of the core.
4.4. Spontaneous Imbibition Pathway
Figure 11 shows the relationship between oil recovery and SI time for core samples I02, I03, and I04. Oil recovery curves are divided into two stages with the first stage being called “fast SI”. SI rates maintain a high value in the first 800 min of the fast SI. SI rates slow down after 800 min in the second “slow SI” stage.
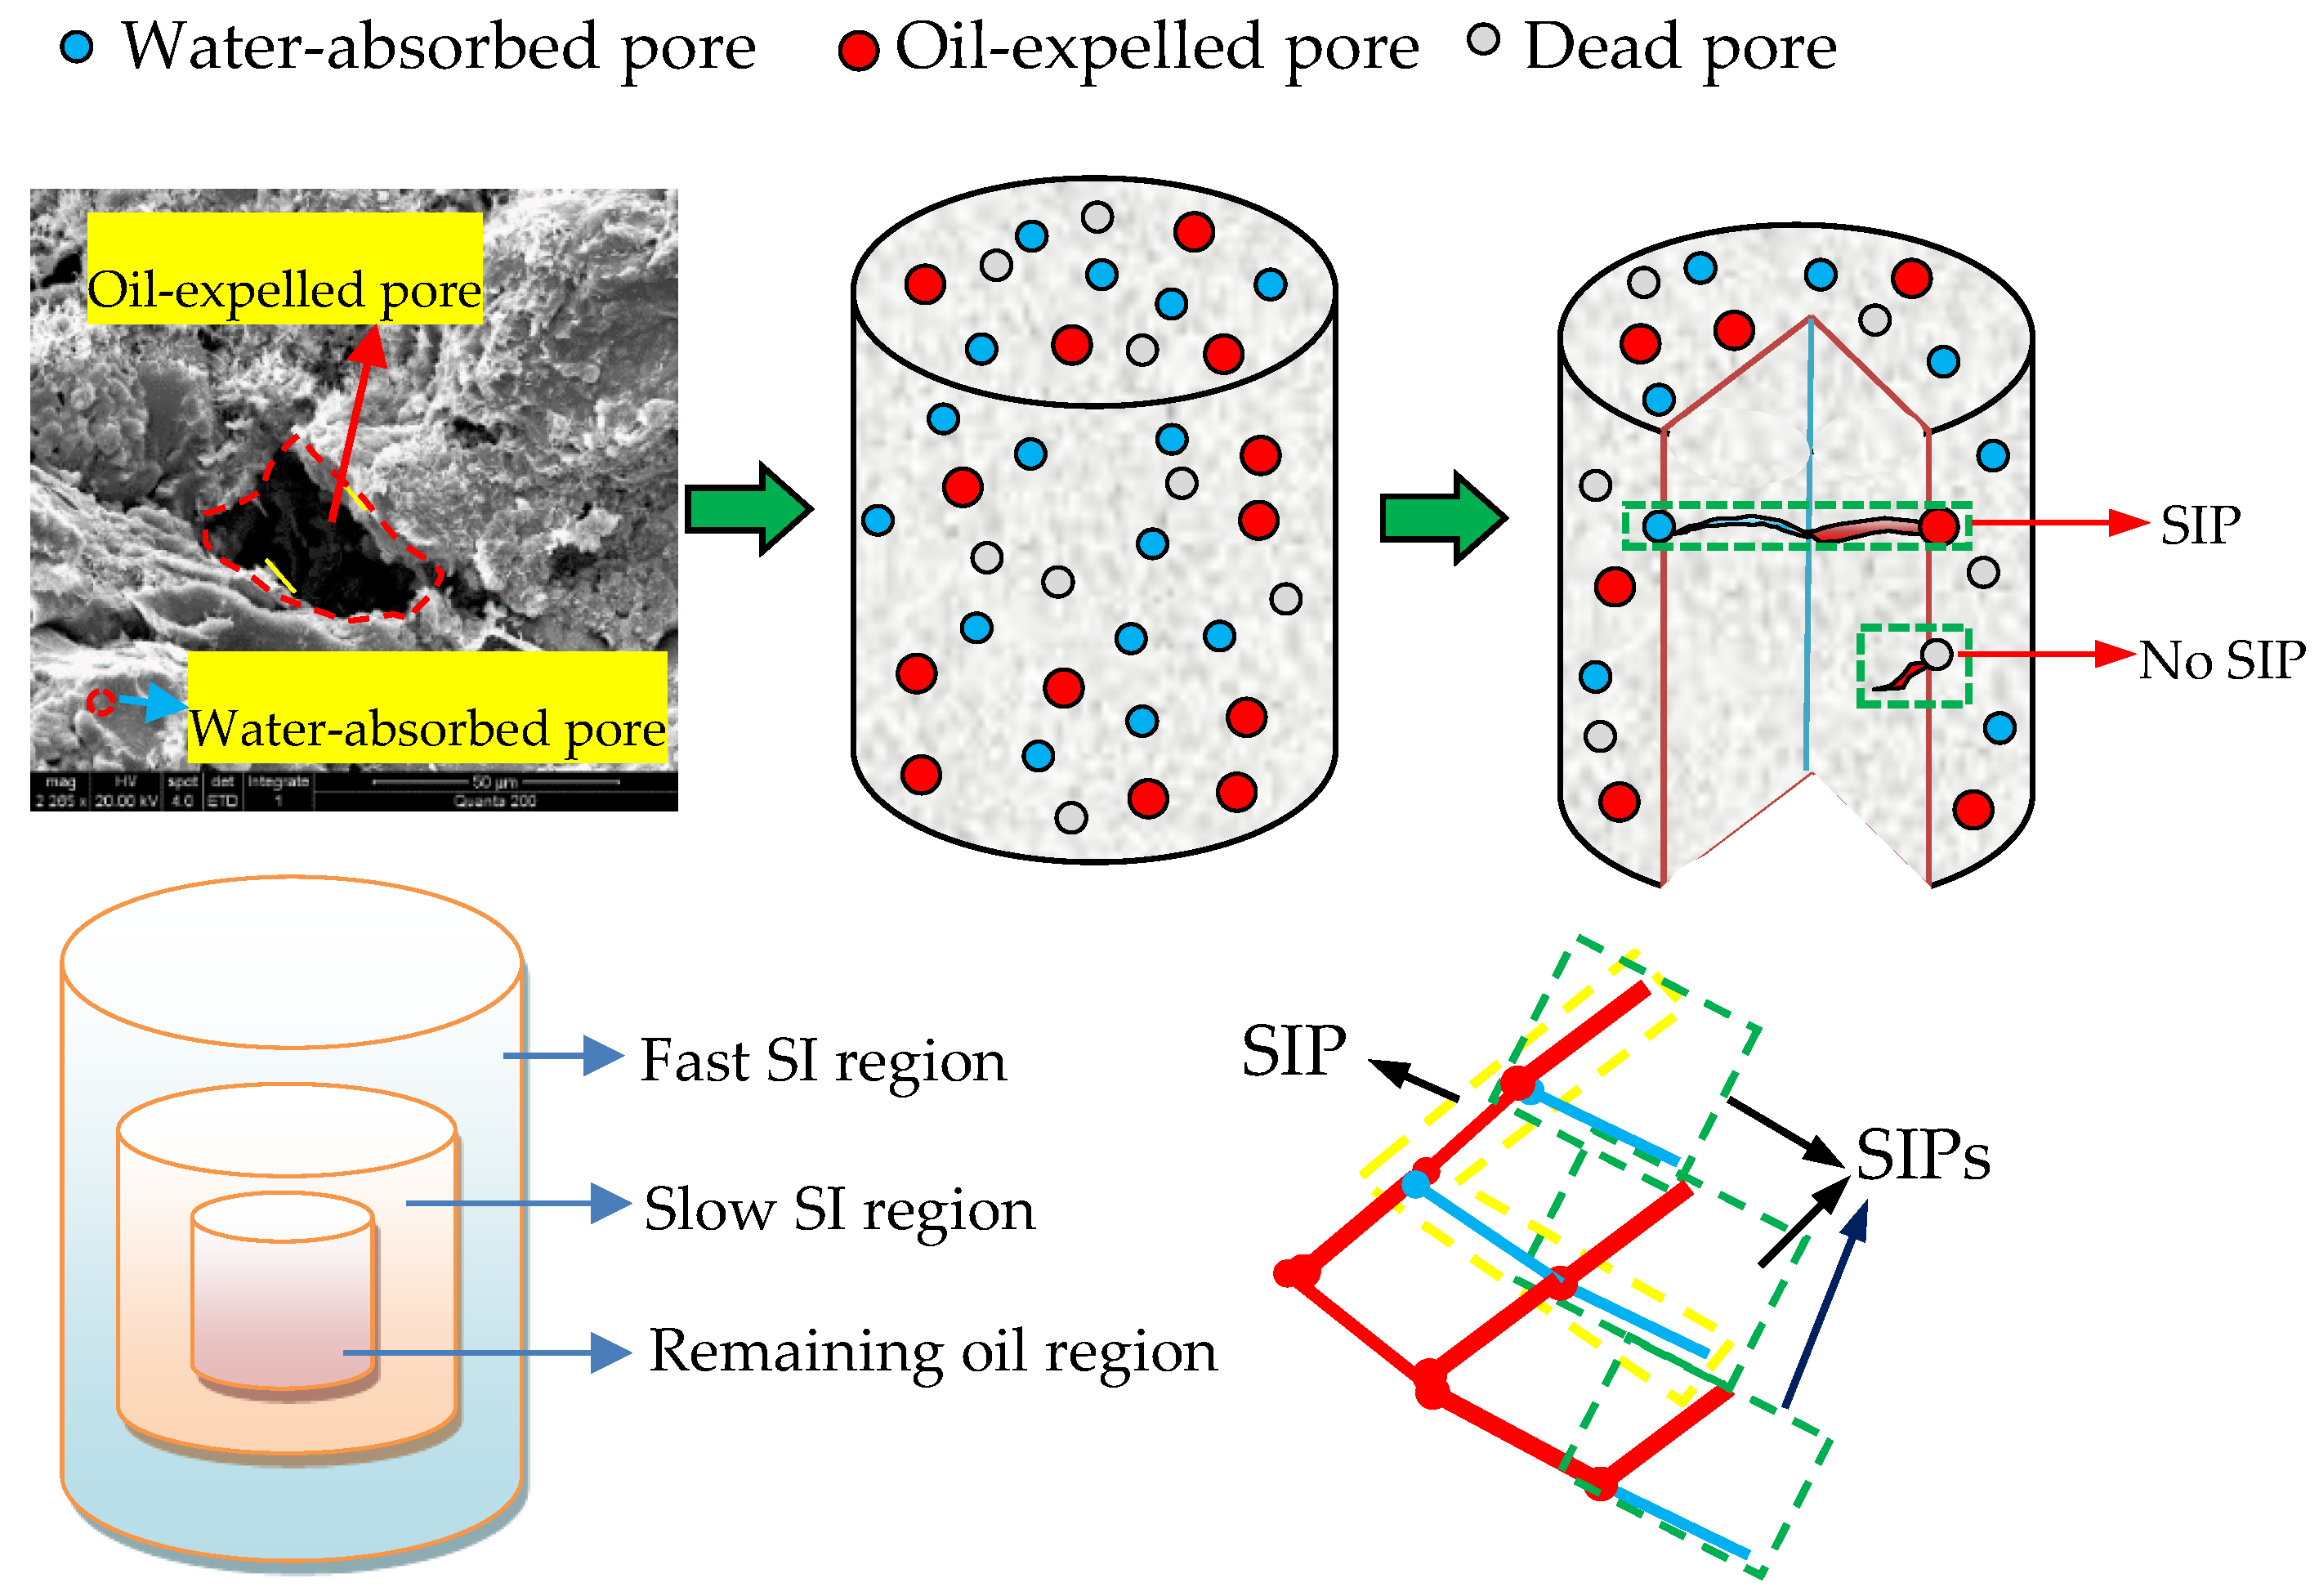
We propose a concept of spontaneous imbibition pathway (SIP) to explain this phenomenon. Figure 12 shows the mechanism of the SIP controlling the SI process. Pores on the surface of the core can be divided into three types, including water-absorbed pore, oil-expelled pore, and dead pore. The water-absorbed pores provide a channel for water entering the core. The oil-expelled pores provide a passage for oil drained out from the core. The dead pores are the pores that do not participate in SI. We define the pore space connecting the water-absorbed pores and oil-expelled pore as the SIP. If there is a macropore on the surface of the core, but this pore is not connected with a micro or mesopore, the oil in the macropore cannot be expelled by SI. In other words, the premise that SI can occur is the presence of a SIP. In general, short-path SIPs are easily formed; therefore, the surface layer of the core forms many SIPs in the initial stage of the SI and leads to a rapid SI rate. If the oil in the deep core is to be expelled by SI, it is necessary to form a long-path SIP. Because of the complexity of the core pore structure and oil–water distribution, long-path SIP do not readily form, resulting in a decrease in the rate of SI. As the SI time is extended, the remaining oil is concentrated in the center of the core. This is because of a large amount of water being absorbed into the core, creating the water shield effect. The water shield affects the formation of the SIP. If the SIP cannot be formed, then the oil in the central region of the core cannot be expelled by SI.
5. Conclusions
Spontaneous imbibition experiments and NMR measurements were performed. The following conclusions are made:
- The water absorbed into the micropores and mesopores will drive away their original saturated oil, which will enter the large pores hydraulic communication and cause the original saturated oil in the macro pores to escape the core.
- MRI results can effectively demonstrate the distribution of oil and water during the SI process. The development of the SI front can be seen by performing NMI on different stages of SI. MRI results clearly show that the remaining oil accumulates in the central region of the core because a large amount of water is absorbed in the late stage of SI, and the water in the pores gradually connects to form a water shield that blocks the flow of the oil phase.
- We propose a new concept termed spontaneous imbibition pathway, which is the essential cause of the rate of SI. The surface of the core tends to form many SIPs, so the rate of SI is fast. The deep core does not easily form many SIPs, so the rate of SI is slow. Although the SIP theory we proposed can explain the reason for the rate of SI. However, the formation mechanism and quantitative calculation of the SIP have not been studied, which is the focus of our next research.
- The advantage of NMR technology is that it can be visualized for SI. However, it needs to combine the Amott cell. The whole research process needs to take out and put the core sample from the Amott cell multiple times, so that will cause experimental errors. How to combine the Amott cell and NMR to form an integrated device is the next development direction.
Author Contributions
Drafting of manuscript: X.N.; acquisition of data: X.N. and J.C.; performance of the experiments: X.N.; and planning and supervision of the research: J.C.
Funding
This research was funded by National Natural Science Foundation of China (51674197), Science and Technology Research Development plan project of Shaanxi Province (2016GY-162), Scientific Research Program Funded by Shaanxi Provincial Education Department (18JK0628), and Natural Science Basic Research Plan in Shaanxi Province of China (2018JQ4033).
Conflicts of Interest
The authors declare no conflict of interest.
References
- Wang, H.; Ma, F.; Tong, X.; Liu, Z.; Zhang, X.; Wu, Z.; Li, D.; Wang, B.; Xie, Y.; Yang, L. Assessment of global unconventional oil and gas resources. Pet. Explor. Dev. 2016, 43, 925–940. [Google Scholar] [CrossRef]
- Zhao, H.; Lai, Z.; Firoozabadi, A. Sorption hysteresis of light hydrocarbons and carbon dioxide in shale and kerogen. Sci. Rep. 2017, 7, 16209. [Google Scholar] [CrossRef] [PubMed]
- Jin, Z.; Firoozabadi, A. Phase behavior and flow in shale nanopores from molecular simulations. Fluid Phase Equilib. 2016, 430, 156–168. [Google Scholar] [CrossRef]
- Dejam, M.; Hassanzadeh, H.; Chen, Z. Pre-Darcy flow in porous media. Water Res. Resour. 2017, 53, 8187–8210. [Google Scholar] [CrossRef]
- Zhang, L.; Kou, Z.; Wang, H.; Zhao, Y.; Dejam, M.; Guo, J.; Du, J. Performance analysis for a model of a multi-wing hydraulically fractured vertical well in a coalbed methane gas reservoir. J. Pet. Sci. Eng. 2018, 166, 104–120. [Google Scholar] [CrossRef]
- Dejam, M.; Hassanzadeh, H.; Chen, Z. Semi-analytical solution for pressure transient analysis of a hydraulically fractured vertical well in a bounded dual-porosity reservoir. J. Hydrol. 2018, 565, 289–301. [Google Scholar] [CrossRef]
- Yao, S.; Zeng, F.; Liu, H.; Zhao, G. A semi-analytical model for multi-stage fractured horizontal wells. J. Hydrol. 2013, 507, 201–212. [Google Scholar] [CrossRef]
- Wang, H.; Liao, X.; Lu, N.; Cai, Z.; Liao, C.; Dou, X. A study on development effect of horizontal well with SRV in unconventional tight oil reservoir. J. Energy Inst. 2014, 87, 114–120. [Google Scholar] [CrossRef]
- Shariatpanahi, S.F.; Strand, S.; Austad, T. Evaluation of water-based enhanced oil recovery (EOR) by wettability alteration in a low-permeable fractured limestone oil reservoir. Energy Fuels 2010, 24, 5997–6008. [Google Scholar] [CrossRef]
- Kathel, P.; Mohanty, K.K. Wettability alteration in a tight oil reservoir. Energy Fuels 2013, 27, 6460–6468. [Google Scholar] [CrossRef]
- Li, J.; Yu, W.; Guerra, D.; Wu, K. Modeling wettability alteration effect on well performance in Permian basin with complex fracture networks. Fuel 2018, 224, 740–751. [Google Scholar] [CrossRef]
- Akin, S.; Schembre, J.M.; Bhat, S.K.; Kovscek, A.R. Spontaneous imbibition characteristics of diatomite. J. Pet. Sci. Eng. 2000, 25, 149–165. [Google Scholar] [CrossRef]
- Schechter, D.S.; Zhou, D.; Orr, F.M., Jr. Low IFT drainage and imbibition. J. Pet. Sci. Eng. 1994, 11, 283–300. [Google Scholar] [CrossRef]
- Li, K.; Horne, R. An analytical scaling method for spontaneous imbibition in gas/water/rock systems. SPE J. 2004, 9, 322–329. [Google Scholar] [CrossRef]
- Ghosh, P.; Kishore, K.M. Novel application of cationic surfactants for foams with wettability alteration in oil-wet low-permeability carbonate rocks. SPE J. 2018, 2, 1126–1139. [Google Scholar] [CrossRef]
- Brownscombe, E.R.; Dyes, A.B. Water-imbibition displacement can it release reluctant spraberry oil? Oil Gas. J. 1952, 11, 64–265. [Google Scholar]
- Aronofsky, J.S.; Jenkins, R. A simplified analysis of unsteady radial gas flow. J. Pet. Technol. 1954, 6, 23–28. [Google Scholar] [CrossRef]
- Dehghanpour, H.; Lan, Q.; Saeed, Y.; Fei, H.; Qi, Z. Spontaneous imbibition of brine and oil in gas shales: Effect of water adsorption and resulting microfractures. Energy Fuels 2013, 27, 3039–3049. [Google Scholar] [CrossRef]
- Makhanov, K.; Habibi, A.; Dehghanpour, H.; Kuru, E. Liquid uptake of gas shales: A workflow to estimate water loss during shut-in periods after fracturing operations. J. Unconv. Oil Gas. Res. 2014, 7, 22–32. [Google Scholar] [CrossRef]
- Yildiz, H.O.; Gokmen, M.; Cesur, Y. Effect of shape factor, characteristic length, and boundary conditions on spontaneous imbibition. J. Pet. Sci. Eng. 2006, 53, 158–170. [Google Scholar] [CrossRef]
- Tinni, A.; Odusina, E.; Sulucarnain, I.; Sondergeld, C.H.; Rai, C.S. Nuclear-Magnetic-Resonance Response of Brine, Oil, and Methane in Organic-Rich Shales. SPE Res. Eval. Eng. 2015, 18, 400–406. [Google Scholar] [CrossRef]
- Meng, M.; Ge, H.; Ji, W.; Wang, X. Research on the auto-removal mechanism of shale aqueous phase trapping using low field nuclear magnetic resonance technique. J. Pet. Sci. Eng. 2016, 137, 63–73. [Google Scholar] [CrossRef]
- Glantz, R.; Hilpert, M. Tight dual models of pore spaces. Adv. Water Resour. 2008, 31, 787–806. [Google Scholar] [CrossRef]
- Chen, S.; Kim, K.H.; Qin, F.; Watson, A.T. Quantitative NMR imaging of multiphase flow in porous media. Magn. Reson. Imaging 1992, 10, 815–826. [Google Scholar] [CrossRef]
- Borgia, G.C.; Fantazzini, P. Nonmobile water quantified in fully saturated porous materials by magnetic resonance relaxation and electrical resistivity measurements. J. Appl. Phys. 1994, 75, 7562–7564. [Google Scholar] [CrossRef]
- Straley, C.; Matteson, A.; Feng, S.; Schwartz, L.M.; Kenyon, W.E.; Banavar, J.R. Magnetic resonance, digital image analysis, and permeability of porous media. Appl. Phys. Lett. 1998, 51, 1146–1148. [Google Scholar] [CrossRef]
- Williams, J.L.A.; Taylor, D.G. Measurements of viscosity and permeability of two phase miscible fluid flow in rock cores. Magn. Reson. Imaging 1994, 12, 317–318. [Google Scholar] [CrossRef]
- Borgia, G.C.; Bortolotti, V.; Brancolini, A.; Brown, R.J.S.; Fantazzini, P. Developments in core analysis by NMR measurements. Magn. Reson. Imaging 1996, 14, 751–760. [Google Scholar] [CrossRef]
- Toumelin, E.; Torres-Verdín, C.; Sun, B.; Dunn, K. Limits of 2D NMR interpretation techniques to quantify pore size, wettability, and fluid type: A numerical sensitivity study. SPE J. 2006, 11, 354–363. [Google Scholar] [CrossRef]
- Halperin, W.P.; Bhattacharja, S.; D’Orazio, F. Relaxation and dynamical properties of water in partially filled porous materials using NMR techniques. Magn. Reson. Imaging 1991, 9, 733–737. [Google Scholar] [CrossRef]
- Wang, W.; Guo, H.; Ye, Z. The evaluation of development potential in low permeability oilfield by the aid of NMR movable fluid detecting technology. Acta Pet. Sin. 2001, 22, 40–44. [Google Scholar]
- Li, J.; Zhou, K.; Zhang, Y.; Xu, Y. Experimental study of rock porous structure damage characteristics under condition of freezing-thawing cycles based on nuclear magnetic resonance technique. Chin. J. Rock Mech. Eng. 2012, 31, 1208–1214. [Google Scholar]
- Guan, Z.; Xie, C.; Dong, H.; Luo, G. 3D Imaging and Visualization Technology of Micro Pore Structure in Porous Media. Geol. Sci. Technol. Inform. 2009, 28, 115–121. [Google Scholar]
- Rouquerol, J.; Everett, A.D.H.; Fairbridge, C.; Haynes, M.; Pernicone, N.; Ramsay, J.D.F.; Sing, K.S.W.; Unger, K.K. Guidelines for the characterization of porous solids. Stud. Surf. Sci. Catal. 1994, 87, 1–9. [Google Scholar]
- Zhu, W.; Ju, Y.; Zhao, M.; Chen, Q.; Yang, Z. Spontaneous imbibition mechanism of flow through porous media and water flooding in low-permeability fractured sandstone reservoir. Acta Pet. Sin. 2002, 23, 56–59. [Google Scholar]
- Lai, F.; Li, Z.; Wei, Q.; Zhang, T.; Zhao, Q. Experimental investigation of spontaneous imbibition in tight reservoir with nuclear magnetic resonance testing. Energy Fuels 2016, 30, 8932–8940. [Google Scholar] [CrossRef]
- Wang, X.; Peng, X.; Zhang, S.; Du, Z.; Zeng, F. Characteristics of oil distributions in forced and spontaneous imbibition of tight oil reservoir. Fuel 2018, 224, 280–288. [Google Scholar] [CrossRef]
- Wu, R.; Yang, S.; Wang, M.; Lv, D.; Kou, G. Experimental study on static imbibition of tight sandstone. J. Liaoning Shihua Univ. 2017, 37, 24–29. [Google Scholar]
- Purcell, E.M.; Torrey, H.C.; Pound, R.V. Resonance absorption by nuclear magnetic moments in a solid. Phys. Rev. 1946, 69, 37–38. [Google Scholar] [CrossRef]
- Lyu, C.; Ning, Z.; Wang, Q.; Chen, M. Application of NMR T2 to pore size distribution and movable fluid distribution in tight sandstones. Energy Fuels 2018, 32, 1395–1405. [Google Scholar] [CrossRef]
- Li, H.; Zhu, J.; Guo, H. Methods for calculating pore radius distribution in rock from NMR T2 spectra. Chin. J. Magn. Reson. 2008, 25, 273–280. [Google Scholar]
- Liu, Z.; Li, Y.; Cui, M.; Wang, F.; Prasiddhianti, A.G. Pore-scale investigation of residual oil displacement in surfactant–polymer flooding using nuclear magnetic resonance experiments. Pet. Sci. 2016, 13, 91–99. [Google Scholar] [CrossRef] [Green Version]
- Xiao, P.; Leng, X.; Xiao, H.; Sun, L.; Zhang, H.; Mei, S.; Zhang, H. Investigation effect of wettability and heterogeneity in water flooding and on microscopic residual oil distribution in tight sandstone cores with NMR technique. Open Phys. 2017, 15, 544–550. [Google Scholar] [CrossRef] [Green Version]
- Tian, X.; Cheng, L.; Cao, R.; An, N.; Zhang, M.; Wang, Y. Characteristics of boundary layer in micro and nano throats of tight sandstone oil reservoirs. Chin. J. Comput. Phys. 2016, 33, 717–725. [Google Scholar]
Figure 1.
The sketch of oil and water distribution in SI process.

Figure 2.
Coefficient C fitting curve.

Figure 3.
Pore radius distribution.

Figure 4.
Measured NMR response at different imbibition times for core sample I01.
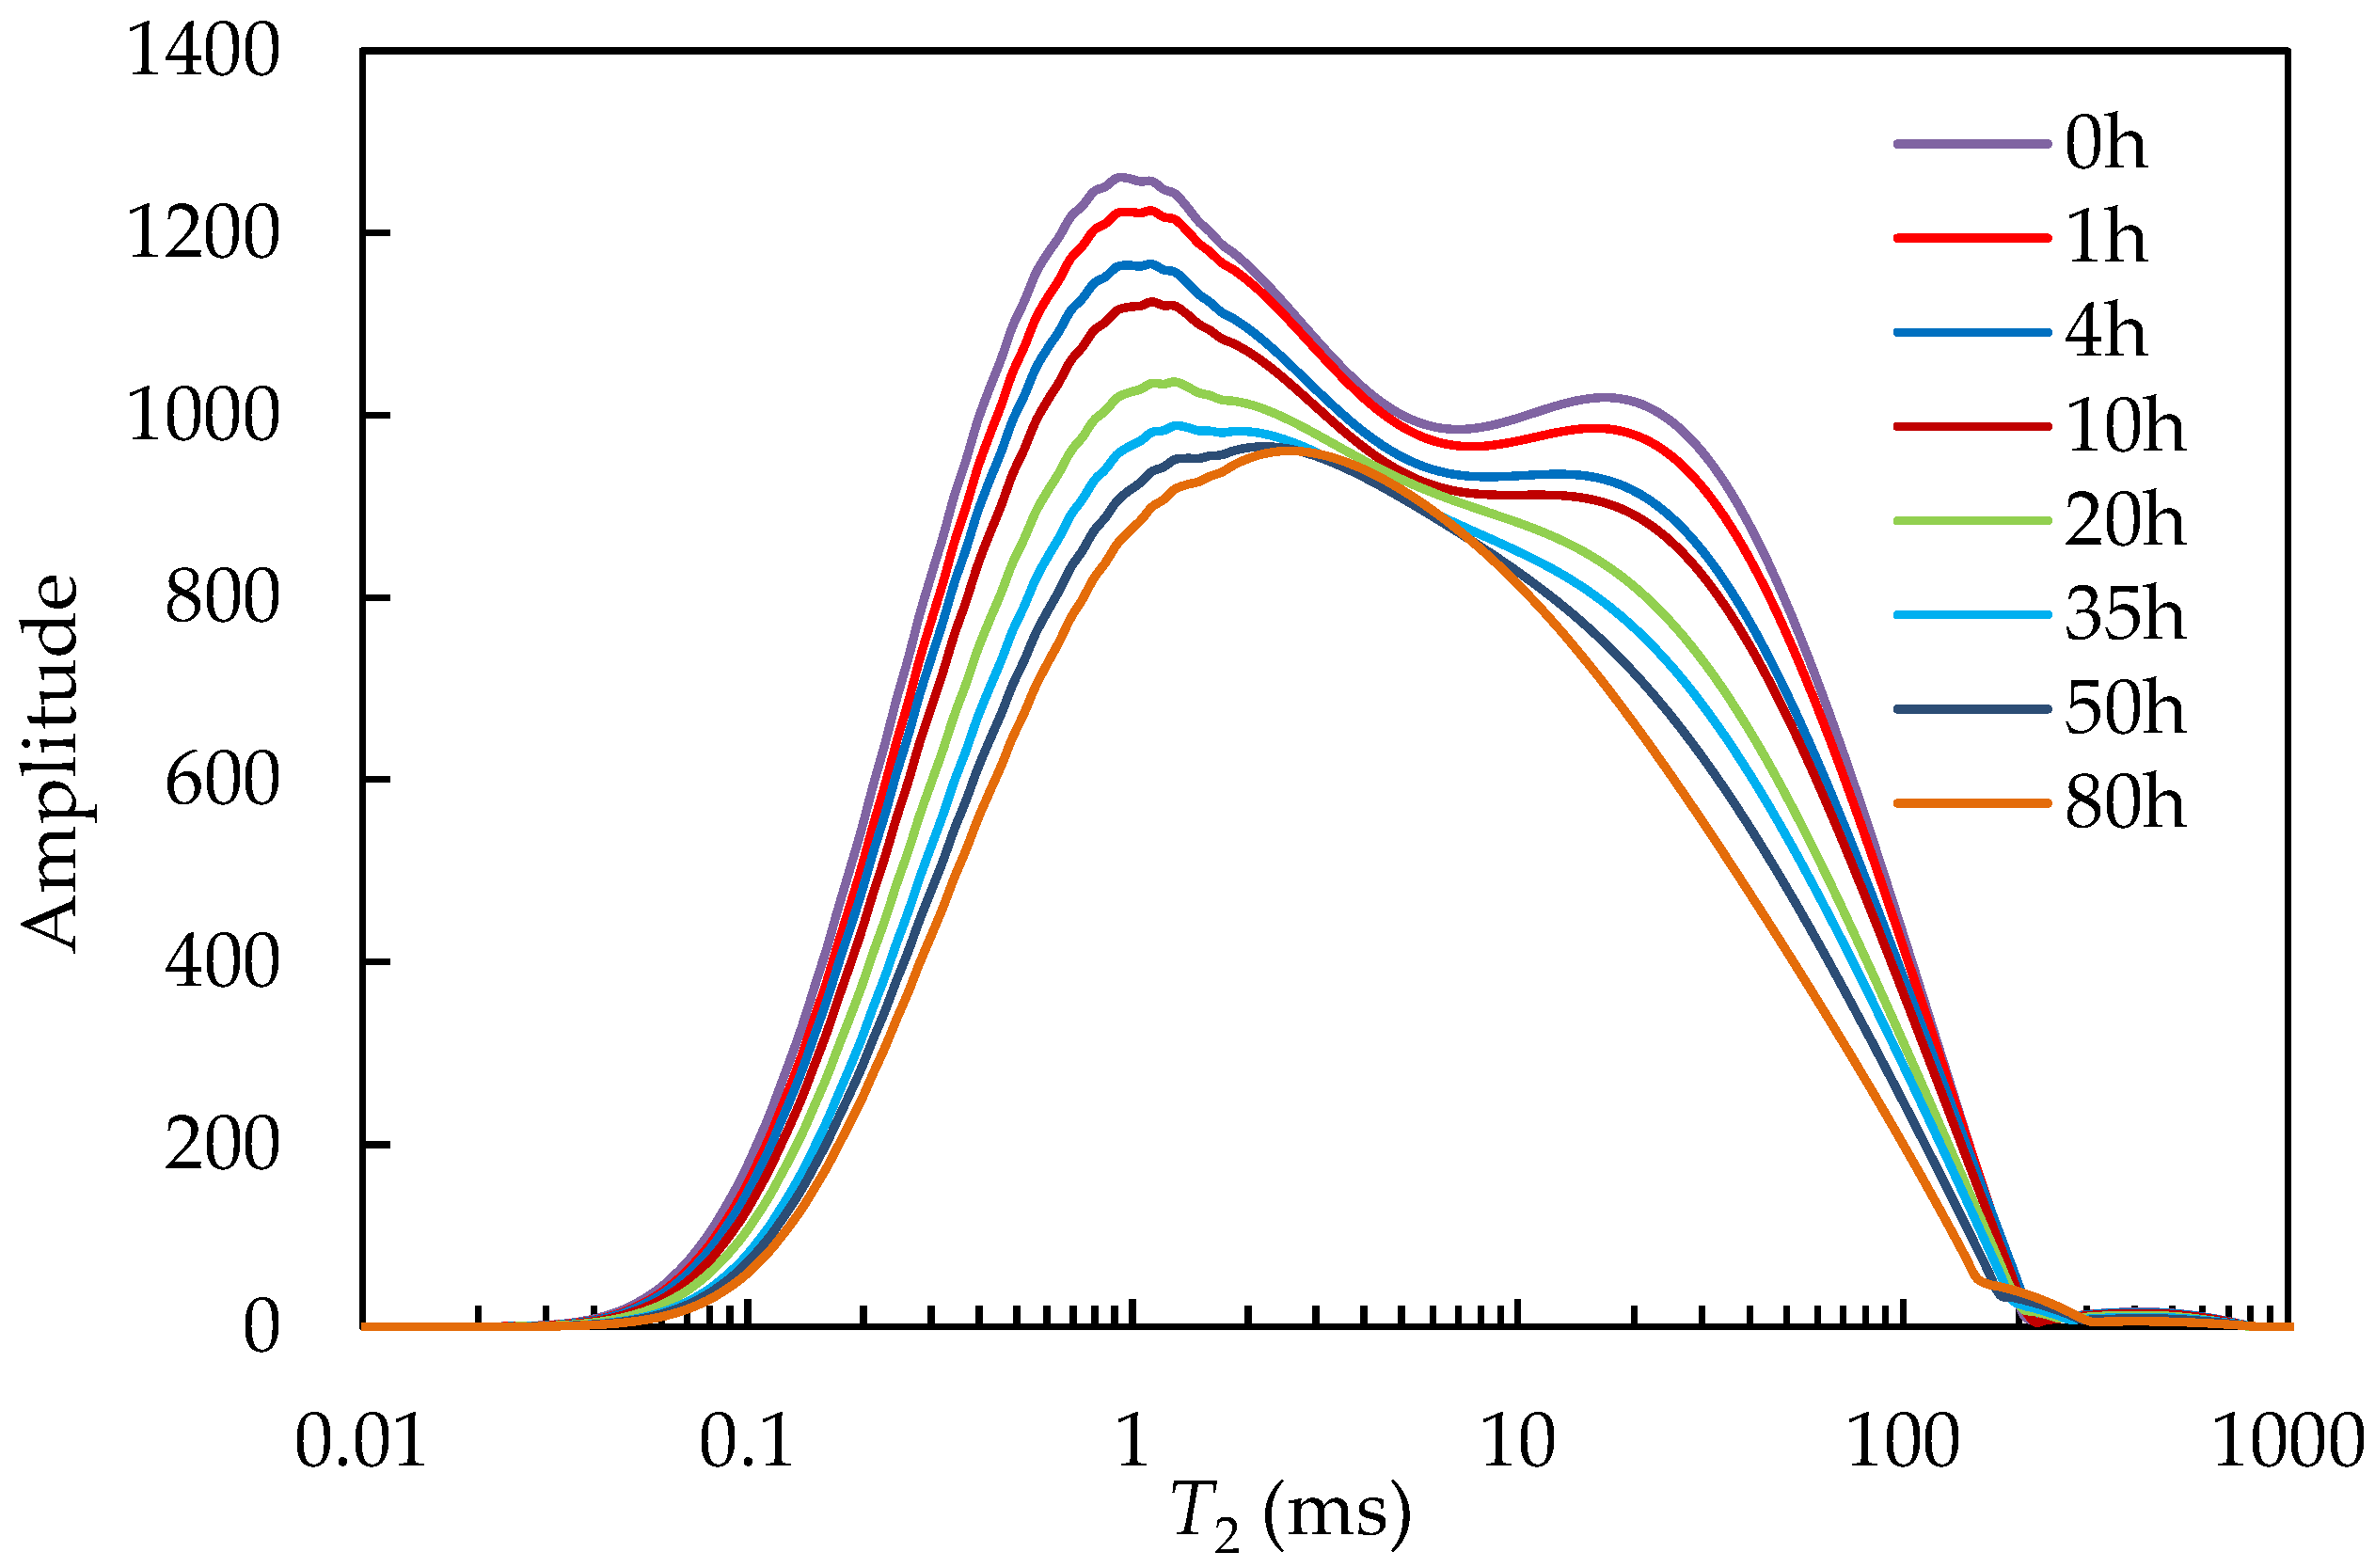
Figure 5.
Schematic diagram for analyzing the oil and water distributions in pores.
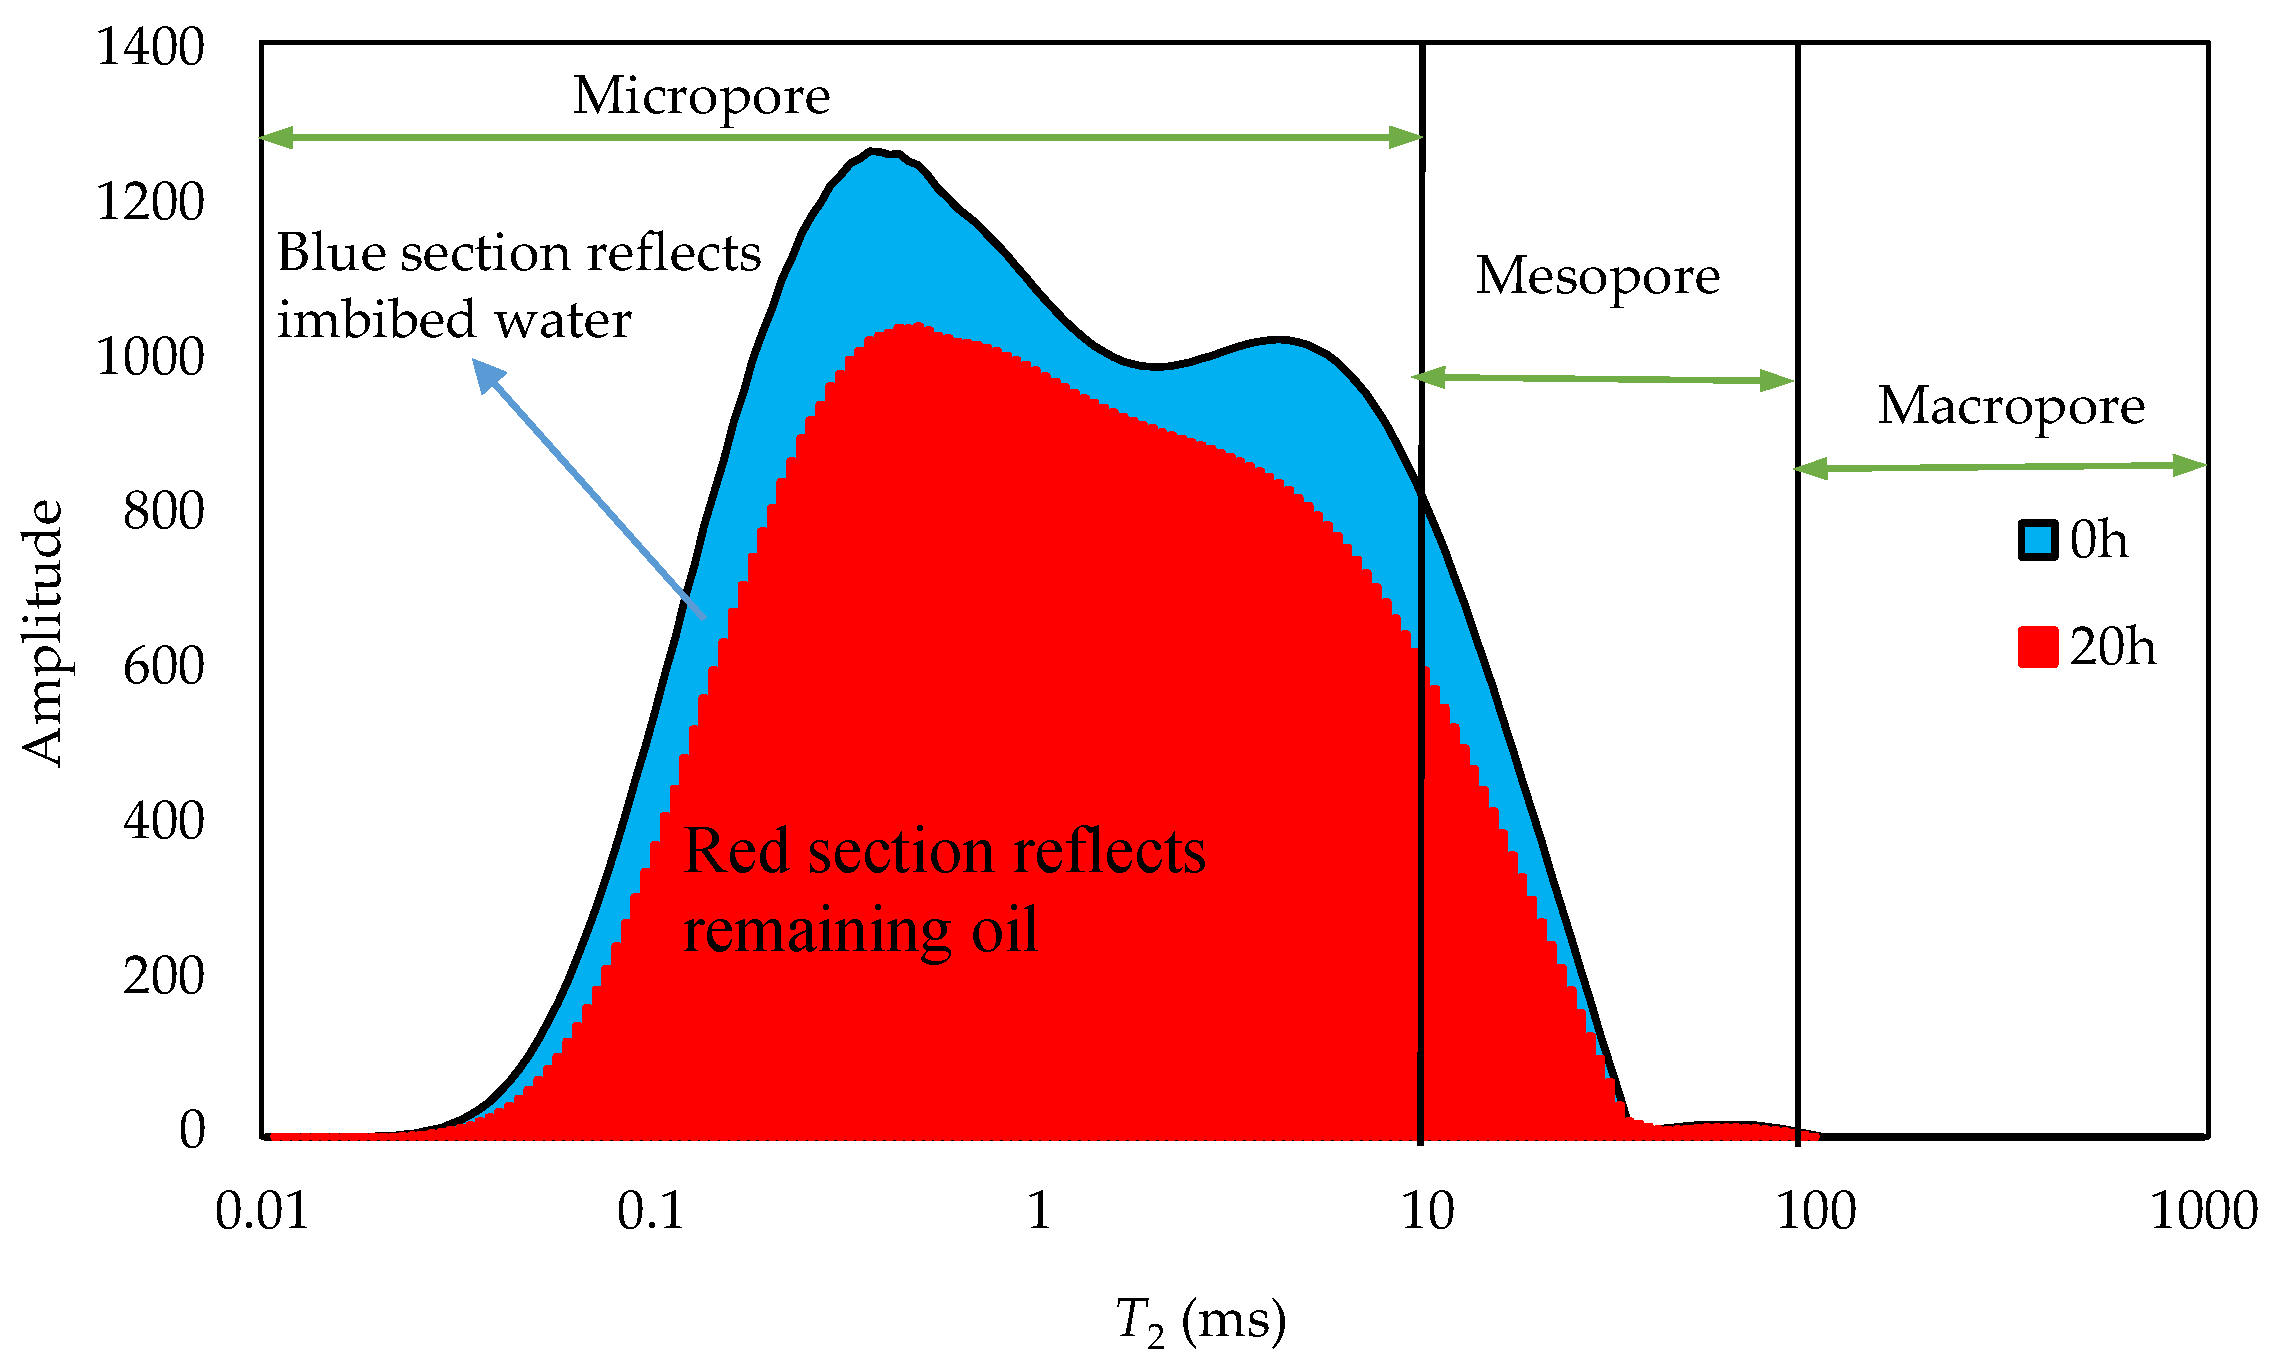
Figure 6.
Oil and water saturation in various pore types over an 80-h experimental period: (a) oil saturation; (b) water saturation.
Figure 6.
Oil and water saturation in various pore types over an 80-h experimental period: (a) oil saturation; (b) water saturation.
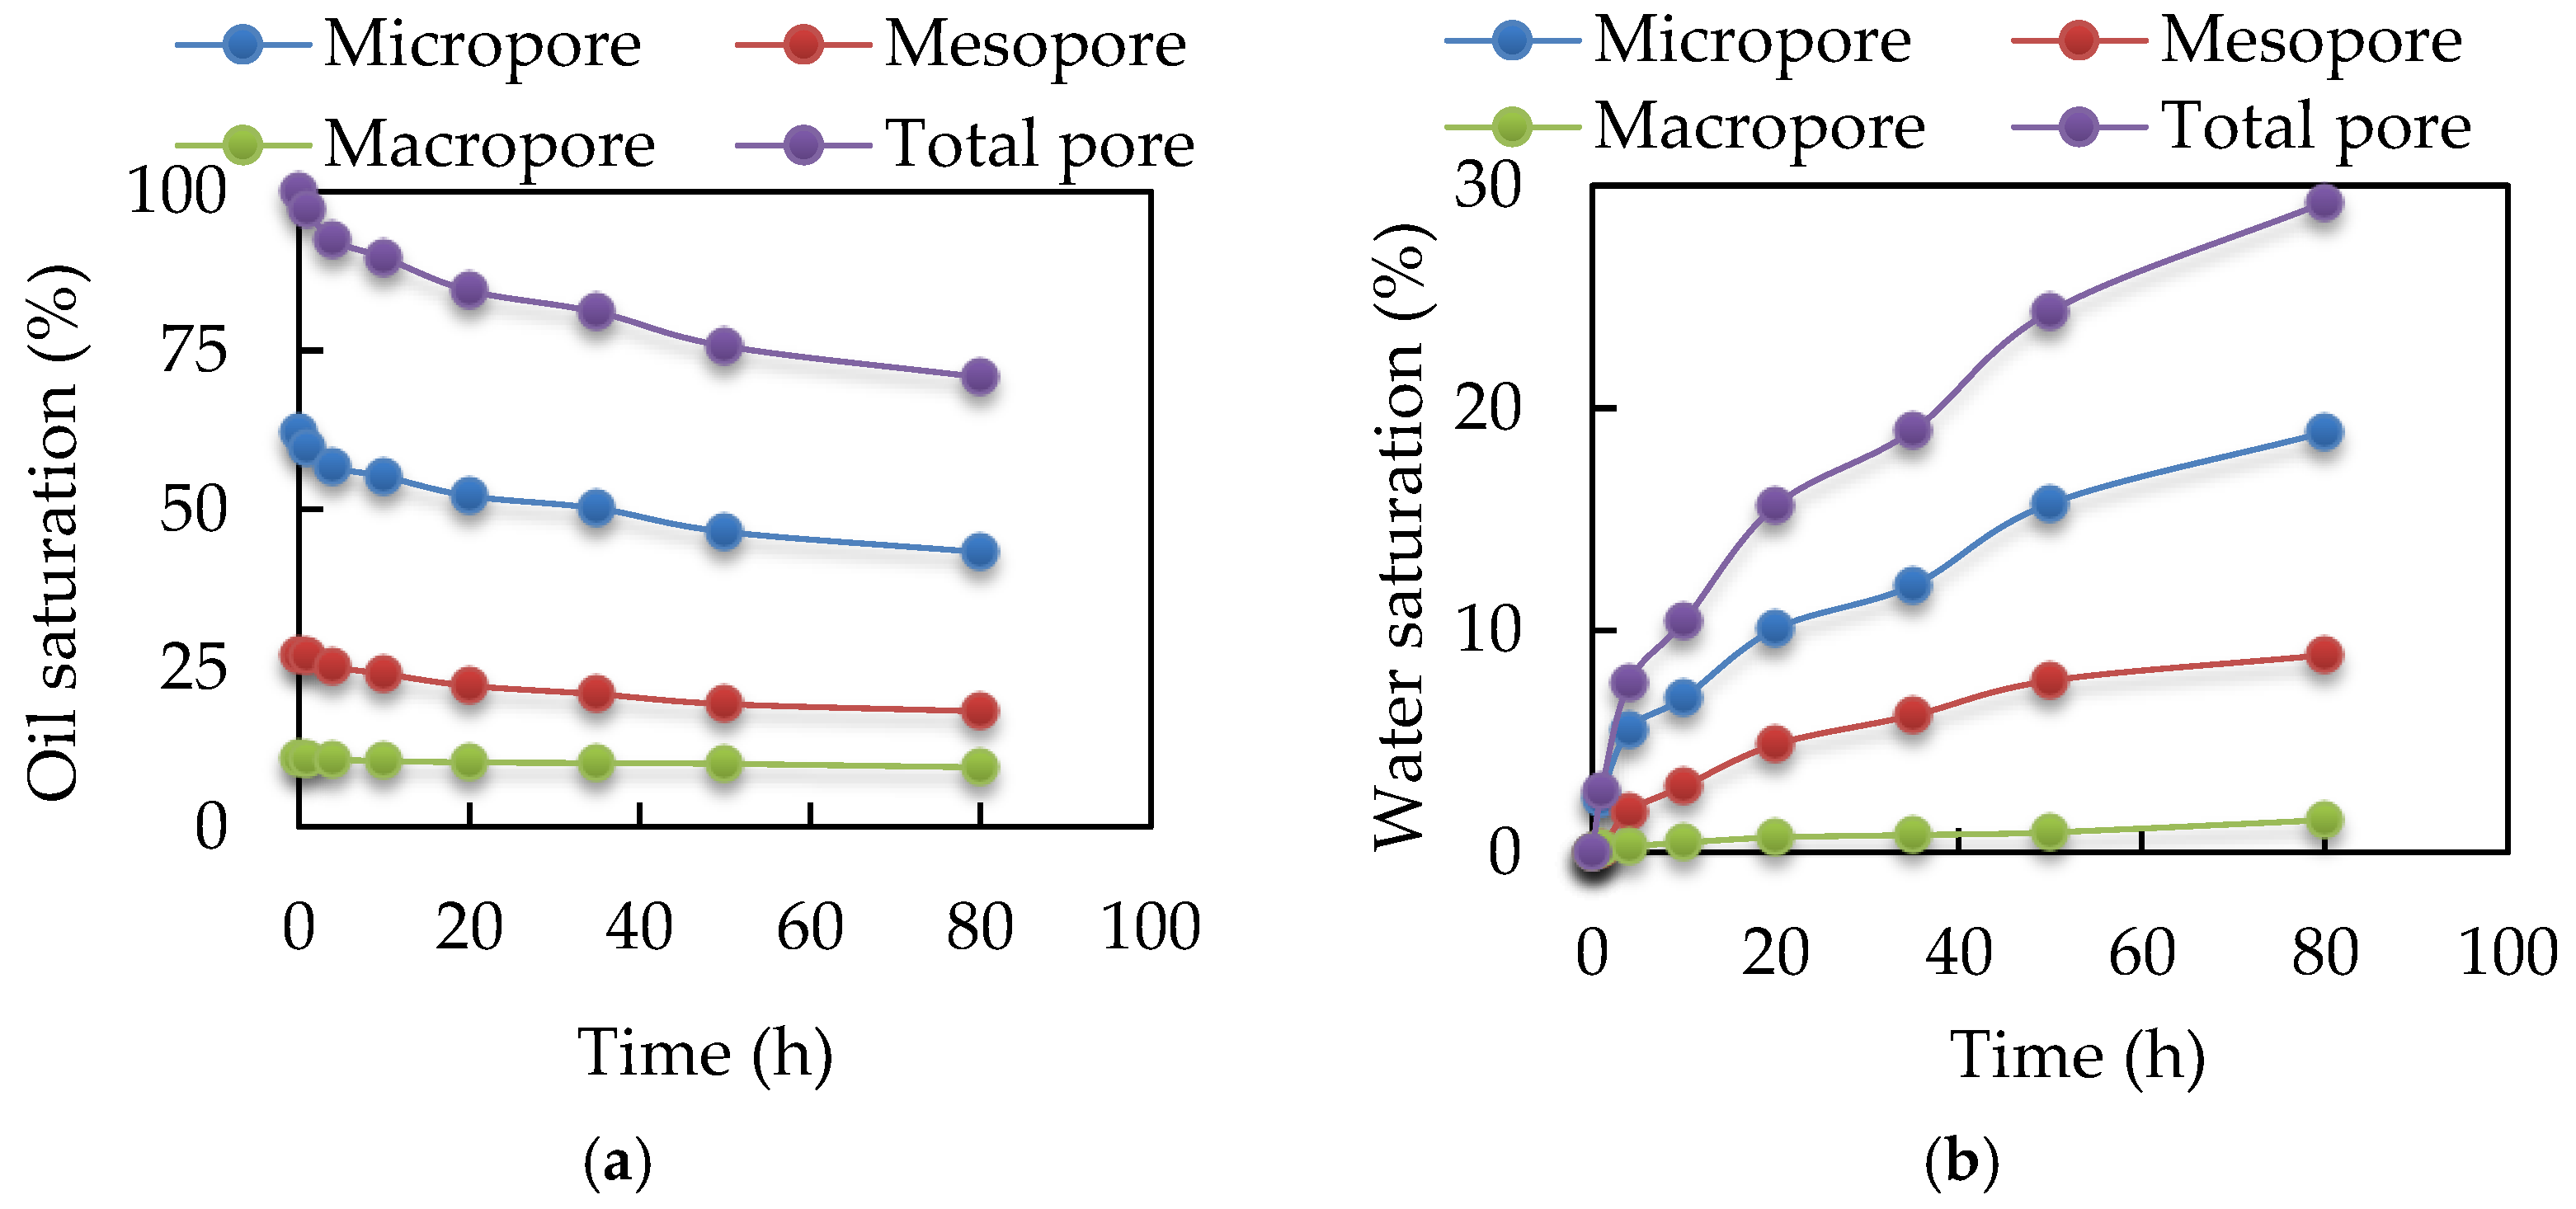
Figure 7.
Schematic diagram for oil and water migration in pores.

Figure 8.
MRI process.
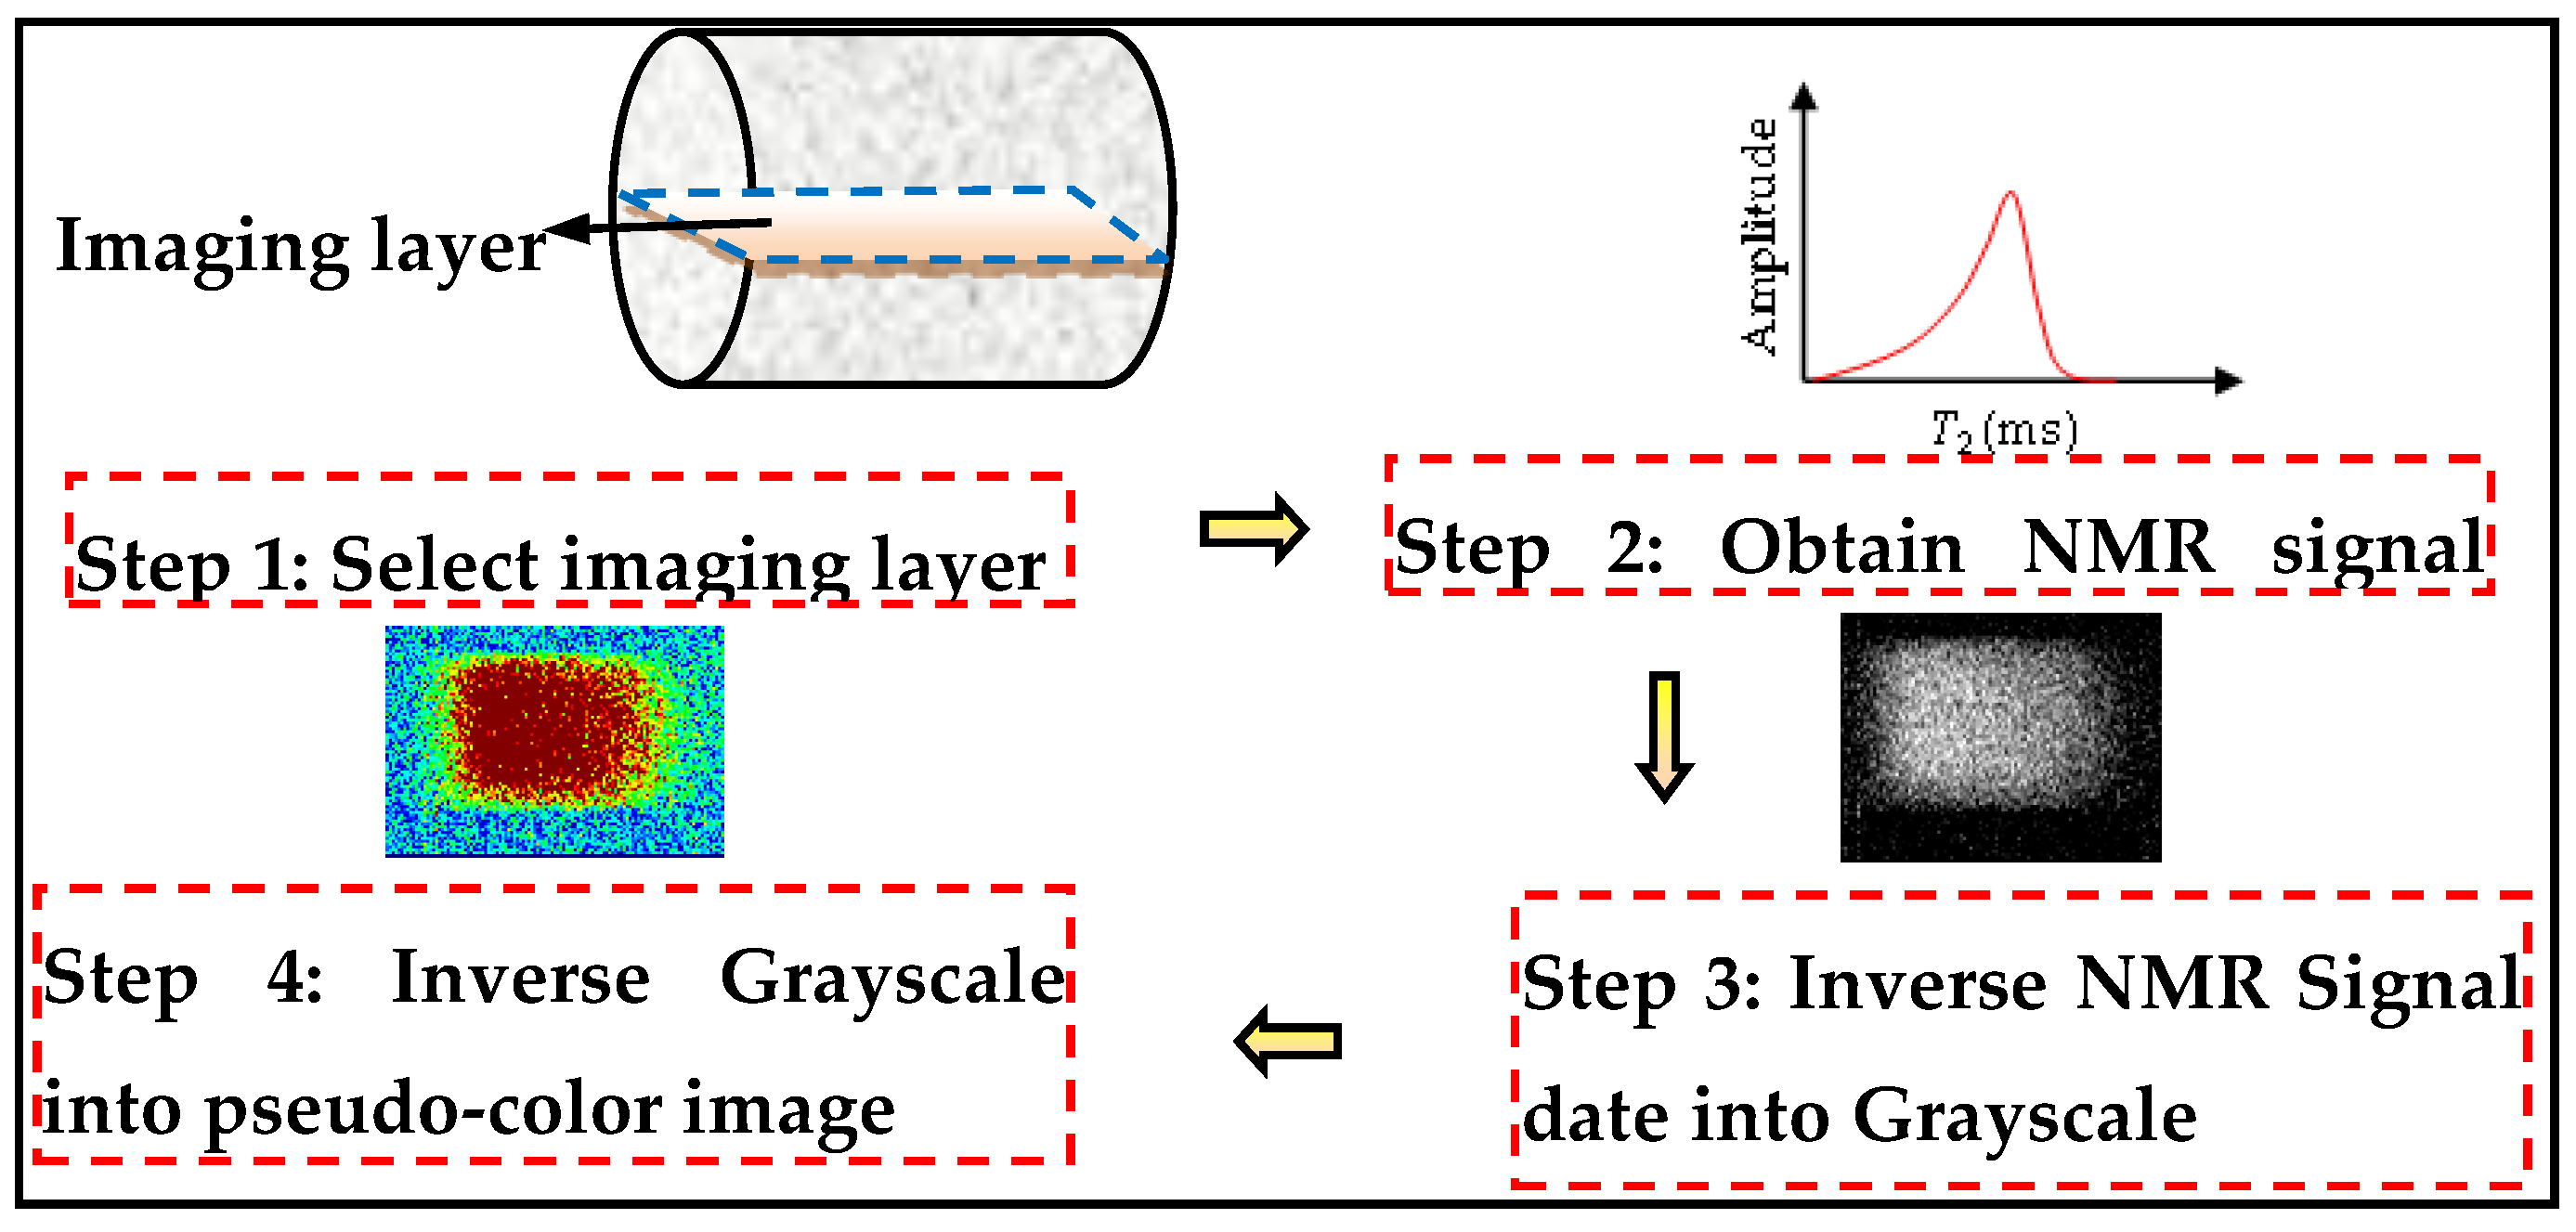
Figure 9.
MRI of core for SI tests.

Figure 10.
Counter-current imbibition and co-current imbibition mechanism map.
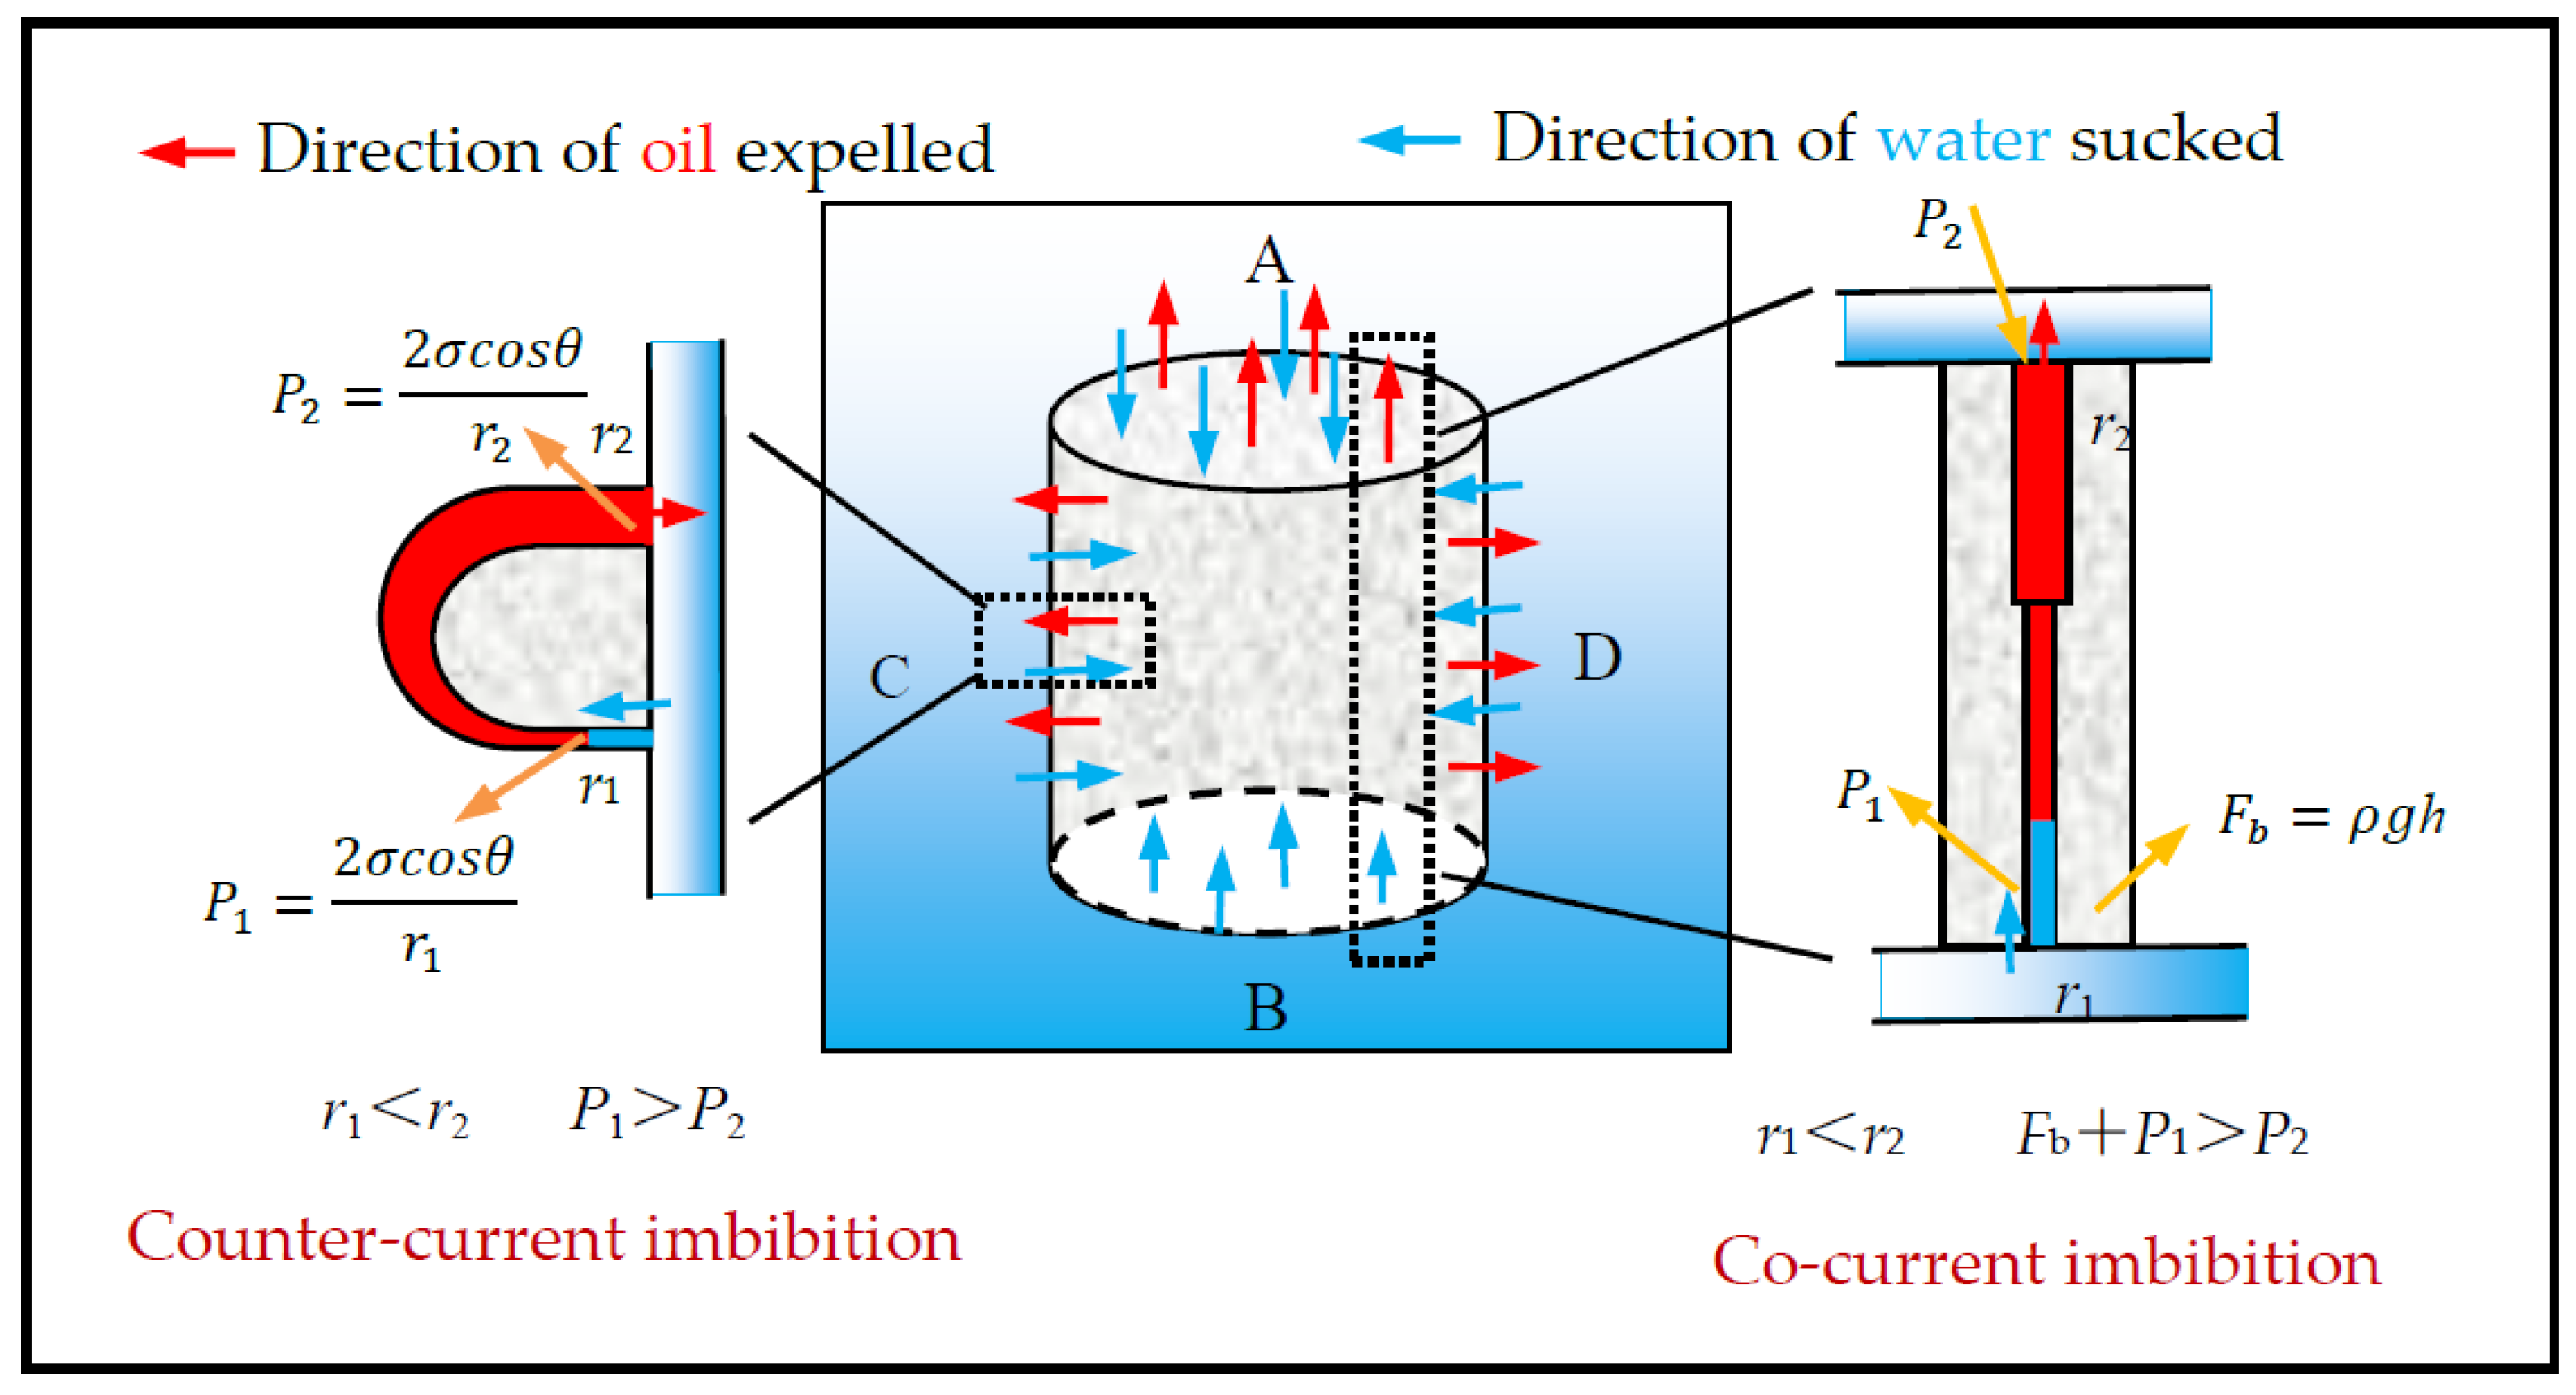
Figure 11.
Oil recovery from spontaneous imbibition.
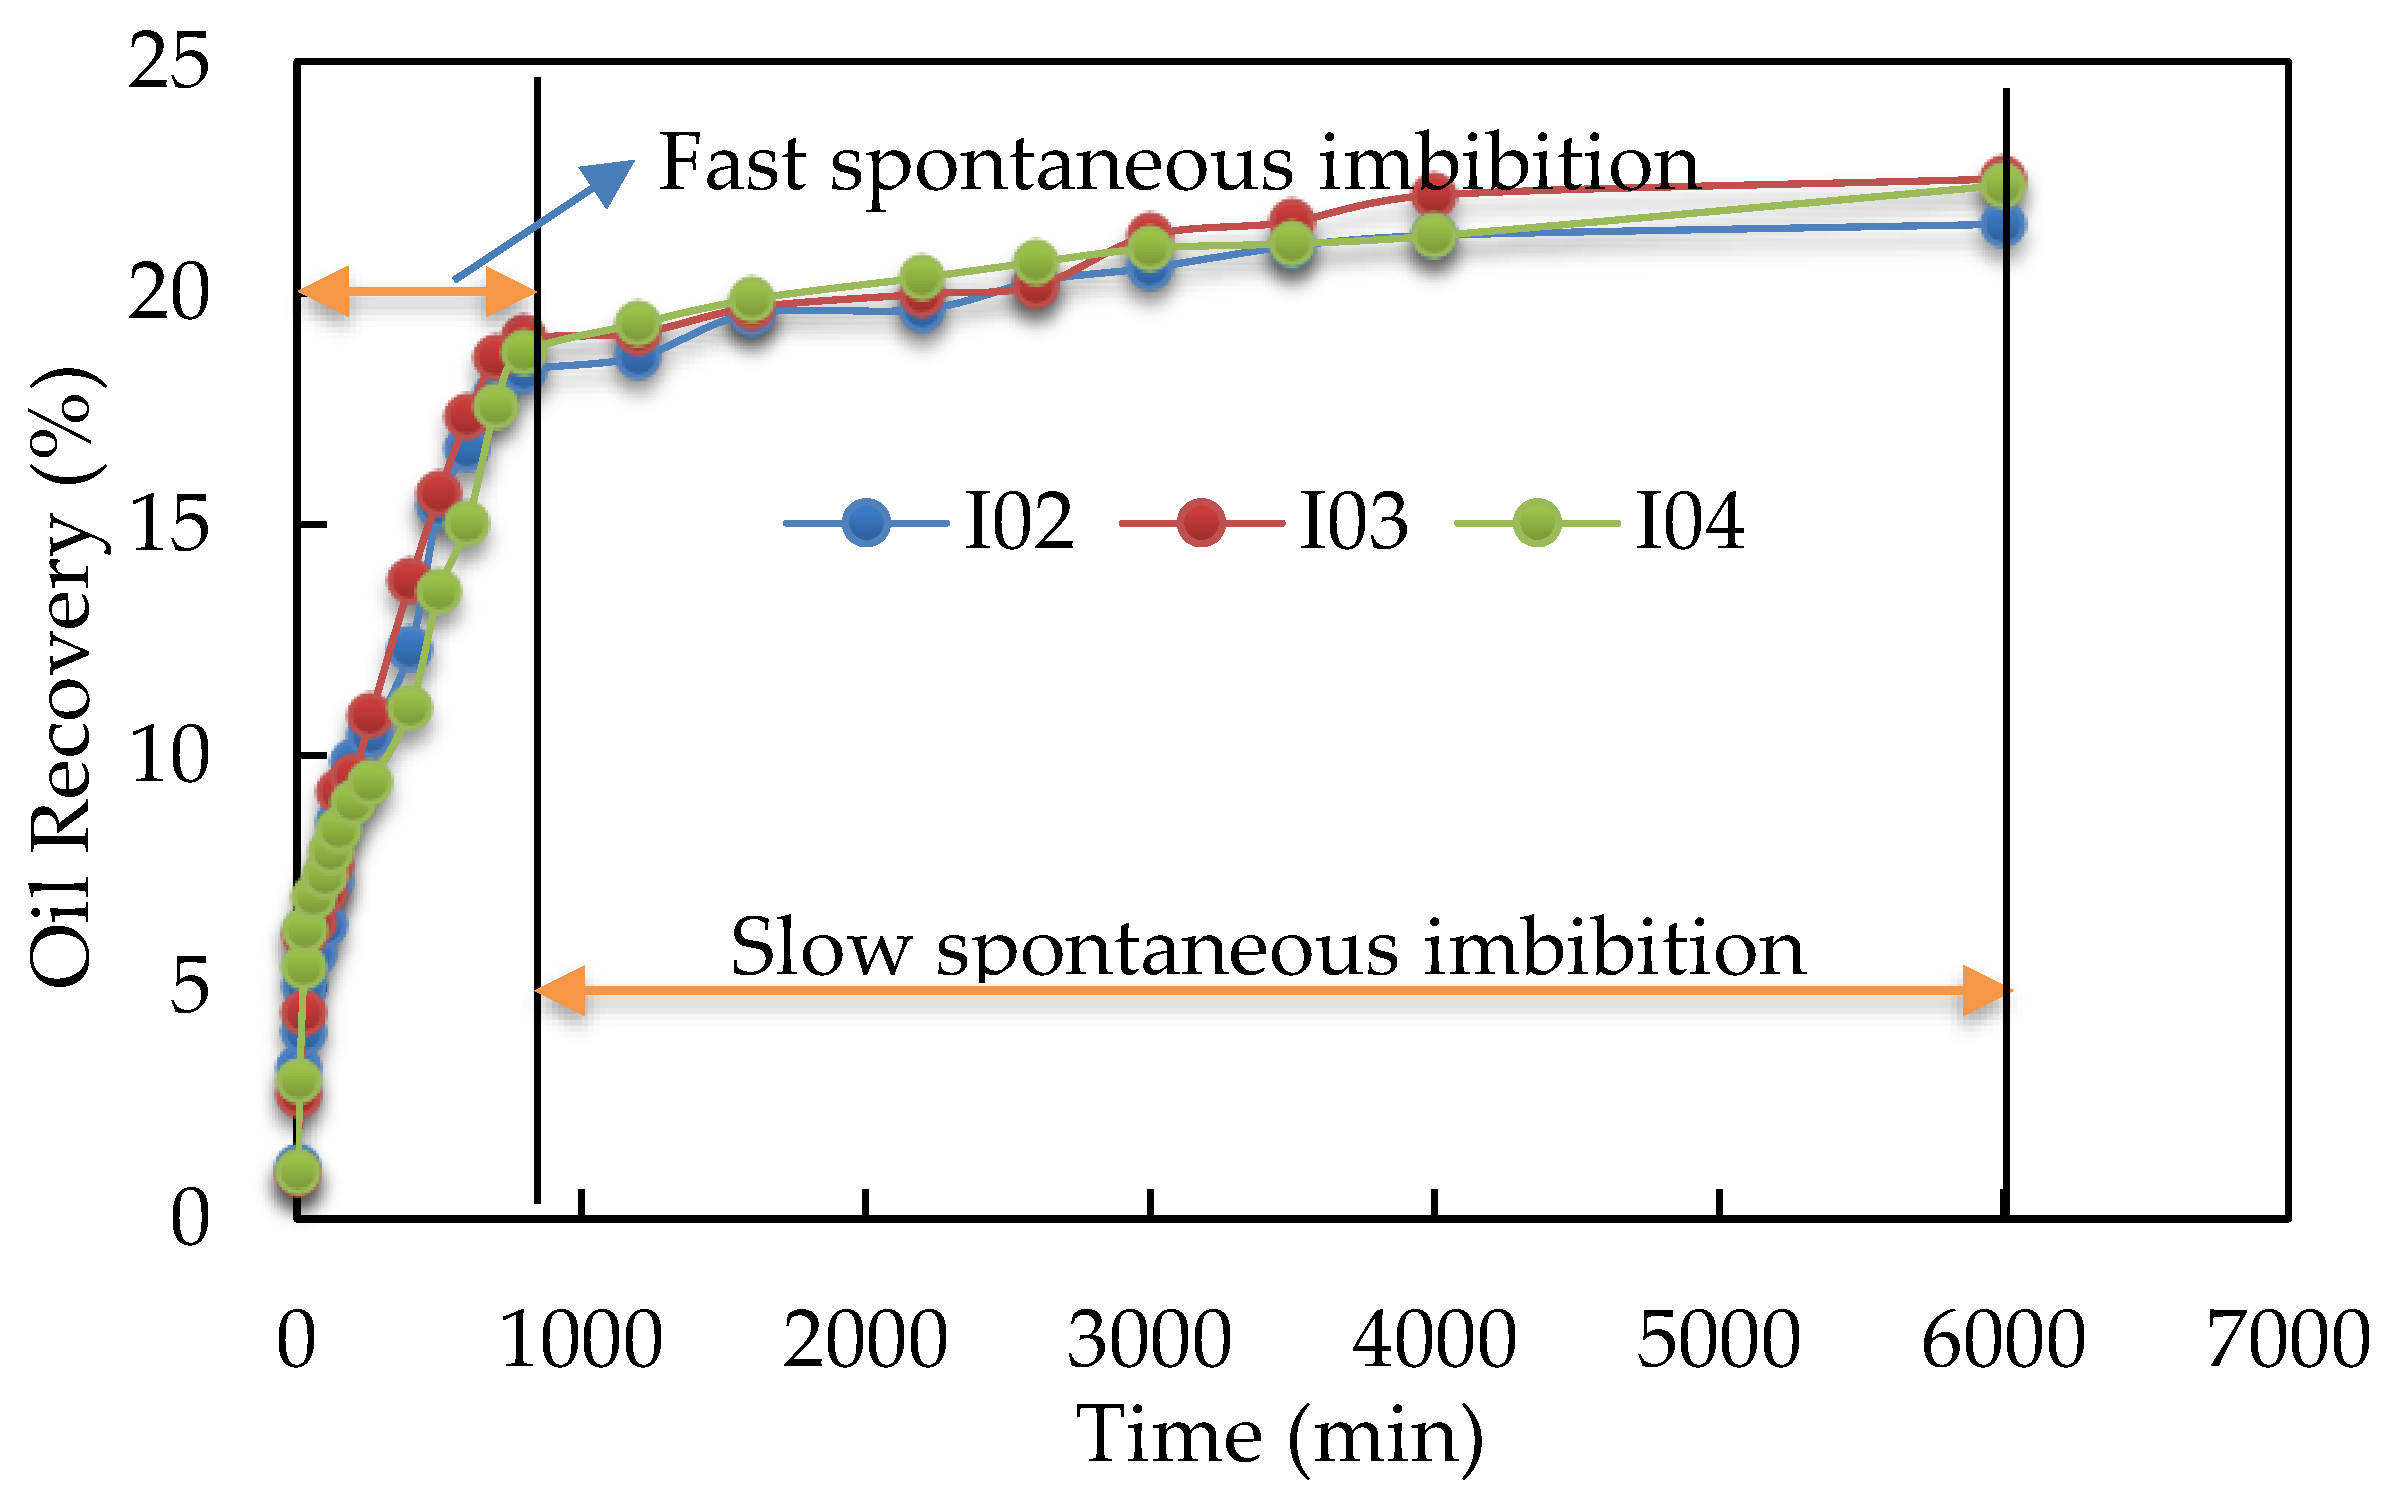
Figure 12.
Schematic diagram of SIP control SI mechanism.

Table 1.
Petrophysical properties of core samples.
| Sample No. | Length (cm) | Diameter (cm) | Porosity (%) | Permeability (10−3μm2) | Pore Volume (cm3) |
|---|---|---|---|---|---|
| I01 | 5.353 | 2.521 | 9.94 | 0.0761 | 2.655 |
| I02 | 5.441 | 2.521 | 8.81 | 0.0644 | 2.391 |
| I03 | 5.454 | 2.521 | 7.56 | 0.0621 | 2.057 |
| I04 | 5.278 | 2.521 | 8.42 | 0.0682 | 2.217 |
Table 2.
Properties of simulated formation water.
| pH | Cation (mg/L) | Anion (mg/L) | Total Salinity (mg/L) | Water Type | ||||||
|---|---|---|---|---|---|---|---|---|---|---|
| K+ | Na+ | Ca2+ | Mg2+ | Ba2+ | Sr2+ | HCO3− | Cl− | |||
| 7.31 | 2643 | 2711 | 241 | 42 | 55 | 61 | 313 | 8641 | 14,707 | CaCl2 |
Table 3.
Relationship between T2, pore radius, and pore type.
| T2 Relaxation Time, ms | Pore Radius, μm | Pore Type |
|---|---|---|
| T2 ≤ 10 | Pore radius ≤ 0.26 | Micropore |
| 10 < T2 ≤ 100 | 0.26 < Pore radius ≤ 2.56 | Mesopore |
| T2 > 100 | Pore radius > 2.56 | Macropore |
© 2018 by the authors. Licensee MDPI, Basel, Switzerland. This article is an open access article distributed under the terms and conditions of the Creative Commons Attribution (CC BY) license (http://creativecommons.org/licenses/by/4.0/).
Share and Cite
MDPI and ACS Style
Nie, X.; Chen, J. Nuclear Magnetic Resonance Measurement of Oil and Water Distributions in Spontaneous Imbibition Process in Tight Oil Reservoirs. Energies 2018, 11, 3114. https://doi.org/10.3390/en11113114
AMA Style
Nie X, Chen J. Nuclear Magnetic Resonance Measurement of Oil and Water Distributions in Spontaneous Imbibition Process in Tight Oil Reservoirs. Energies. 2018; 11(11):3114. https://doi.org/10.3390/en11113114
Chicago/Turabian StyleNie, Xiangrong, and Junbin Chen. 2018. "Nuclear Magnetic Resonance Measurement of Oil and Water Distributions in Spontaneous Imbibition Process in Tight Oil Reservoirs" Energies 11, no. 11: 3114. https://doi.org/10.3390/en11113114
Note that from the first issue of 2016, this journal uses article numbers instead of page numbers. See further details here.