Article

Mild Hydrothermal Liquefaction of High Water Content Agricultural Residue for Bio-Crude Oil Production: A Parametric Study

1
School of Chemical Engineering and Energy, Zhengzhou University, 100 Science Avenue, Zhengzhou 450001, China
2
School of Engineering, University of Guelph, Guelph, ON N1G 2W1, Canada
3
Institute for Chemicals and Fuels from Alternative Resources (ICFAR), Department of Chemical and Biochemical Engineering, Western University, London, ON N6G 5B9, Canada
*
Authors to whom correspondence should be addressed.
Energies 2018, 11(11), 3129; https://doi.org/10.3390/en11113129
Submission received: 18 September 2018 / Revised: 6 November 2018 / Accepted: 6 November 2018 / Published: 12 November 2018
(This article belongs to the Special Issue Thermochemical Biorefining)

Abstract

:
Depleting petroleum reserves together with the associated environmental concerns have intensified the exploration of alternatives to petroleum. Wet food processing wastes present promising bioresources for liquid fuel production via hydrothermal liquefaction (HTL) followed by additional upgrading. In this study, tomato plant waste (TPW) was utilized as a feedstock for the production of bio-crude oils via HTL at medium-temperature (220–280 °C) in water or a water–ethanol (17/3, v/v) medium in a 600 mL autoclave reactor. Effects of various operating parameters, such as catalysts (H2SO4 or KOH), reaction time (15–60 min) and reaction temperature (220–280 °C) on product yields were investigated. This study showed that a high yield (45.1 wt%) of bio-crude oil was achieved from HTL of TPW in water–ethanol medium at 250 °C in the presence of acid catalyst H2SO4. The oil, gas and solid residue (SR) products were analyzed for their chemical and structural properties.

1. Introduction

Since its discovery, petroleum has been the dominating source of liquid transportation fuels and chemicals [1]. However, the fast depletion of petroleum reserves, the environmental challenges such as greenhouse gas emission, and the concerns over energy security, have intensified the efforts in searching for alternatives [2]. Due to their immense supply, cost-effectiveness and cleanliness, bio-renewable resources (i.e., bioresources) are believed to be promising candidates to replace petroleum. The use of organic residues for bioresource production present the additional benefit of eliminating a waste stream, while at the same time producing a valuable product [3]. These organic residues include agricultural residues and food-processing wastes (e.g., crop residues, energy plants, wet greenhouse wastes, etc.), forestry residues (e.g., sawdust, bark, lignin, etc.), and municipal wastes (e.g., municipal solid wastes, wastewater sludge, etc.). In the past decades, many research efforts have been made in the conversion of bioresources to liquid fuels and chemicals via biological, thermal, thermochemical or catalytic technologies. The conversion of biomass into energy and chemicals can be achieved in two broad pathways: Biological (fermentation and anaerobic digestion) and thermo-chemical processes (combustion, gasification, and liquefaction/pyrolysis) [4]. Among all different biomass conversion technologies, hydrothermal liquefaction (HTL) has attracted a considerable amount of attention since the process can efficiently convert inedible biomass into bio-oils (or bio-crude oils) [5]. At temperature ranges between 250 and 370 °C, the hydrothermal process is defined as hydrothermal liquefaction, resulting in the production of a liquid fuel known as biocrude oil [6]. The bio-oil products can be utilized directly as a source for chemicals (such as bio-phenols and bio-polyols) or can be upgraded into drop-in bio-fuels (such as green gasoline and biodiesel) through catalytic cracking and hydro-treatment. Agricultural and forestry residues are immense, inexpensive and clean. For Canada alone, the amount of potential agricultural residues has been estimated at 29.3 Mt oven dried (OD) biomass per year, among which 17.8 Mt OD biomass/year may be available for energy and chemical production [7].
Besides its high yield, HTL is particularly suitable for biomass with high moisture content since HTL uses hot-compressed water as the medium, and the wet feedstock has received a lot of attention in the research field [8,9]. One example is wet greenhouse wastes such as tomato residues, as HTL eliminates the need of costly de-watering process that is otherwise required in other thermal/thermo-chemical processes. Approximately 9310 tons tomato plant wastes (TPW) per year are generated from 921 acres of tomato greenhouses within Ontario, Canada, based on personal estimation by the Ontario Ministry of Agriculture and Food (OMAFRA). Currently the harvested tomato plants are disposed of as waste, which has negative impacts on the environment. Meanwhile very little attention has been directed towards biofuel production from TPW.
Direct hydrothermal liquefaction can effectively convert wet biomass into bio-crude oils in sub-critical water conditions. The bio-crude oil produced from an organic solvent-water mixture proved to be advantageous with respect to oil yield and quality [10]. However, not much work has been reported on hydrothermal liquefaction of TPW, particularly under mild conditions saving energy input. Thus, the main objectives of this work are to produce bio-crude oil from agricultural residues with an emphasis on TPW through hydrothermal liquefaction. Moreover, most of the data in HTL literature was obtained at either alkaline or neutral conditions while limited data was available for acidic conditions. Furthermore, it has been demonstrated that pH plays an important role in HTL formation [11,12]. The reaction pathways of HTL change with acidic, neutral and alkaline conditions [13]. These reaction pathways were dependent on each other. Under weak alkaline conditions, the reaction pathway can change gradually from an alkaline pathway to an acidic one [14]. Since HTL bio-oils are extracted from the corresponding aqueous products, the influence of acidic, neutral and alkaline conditions on HTL reaction pathways and liquid products are expected to change HTL bio-oil yields and compositions.
The present work aims to develop innovative technologies (hydrothermal liquefaction) for valorization of agricultural residues into bio-fuels and bio-chemicals; and to optimize the conditions via investigating the effects of temperatures, catalysts, and residence time on oil yield and solid residue yield. The characteristics of bio-crude oil will be analyzed in terms of chemical structure, elemental composition, and structural composition. This work would provide an approach to convert wet agricultural wastes into bio-crude oil under mild conditions, without creating waste to threaten human health and the environmental balance.

2. Materials and Methods

2.1. Materials

Tomato plant wastes (TPW) were collected in a timely manner from a local greenhouse in Guelph, Ontario, cut into pieces and slurry, and stored in fridge for 2 weeks. Reagent grade sulfuric acid (95–98 wt%) were obtained from ACROS, New Jersey, USA. Potassium hydroxide, denatured alcohol and acetone were all purchased from Fisher Scientific. All reagents were used without further purification.

2.2. Hydrothermal Liquefaction of Tomato Plant Wastes

Pre-screening of the agricultural residues for the liquid fuels was conducted to determine tomato plant wastes (TPW) as the feedstock for this work. All HTL tests were carried out in a 600 mL autoclave reactor (Parr Instruments Co. Moline, PA, USA), which was made of stainless steel. The typical experiment was performed as per the following procedure: 10 g of TPW on dry basis with 200 mL solvents (mixture of water–ethanol either 17/3 v/v, or water only, including the moisture content within the TPW feedstock) and 1 g of catalyst (i.e., 10 wt% with respect to dry feedstock) were adequately premixed in a beaker. Then the feed was transferred into a glass liner to fit in the 600 mL autoclave reactor, equipped with a mechanical agitation system (Figure 1). After loading the feed and sealing the reactor, the air in the reactor was removed by purging the reactor with N2, followed by pressurizing the reactor with N2 at 1 MPa. The reactor was then heated (for about 0.5 h) to a preset temperature of 220–280 °C, under the maximum pressure of 6.5 MPa, and remained at the temperature for a certain period. After the specified time elapsed, the reactor was quenched to room temperature using an ice-water bath. The slurry collected and rinsed from the autoclave was filtered followed by filter paper rinsed with acetone. The solid residues (SR) on the filter paper were dried at 105 °C for 12 h. The filtrate was evaporated in a rotary evaporator under reduced pressure at up to 70 °C to remove the water (including the pyrolytic water produced from the feedstock in the HTL process) and ethanol solvents (if any). The remaining oily liquid is the bio-crude oil product, or simply bio-oil. The yield of SR and bio-oil was defined as their weight percentage in relation to TPW loaded in the test on dry basis. For simplicity, the yield of gas products mainly consisting of CO2 (confirmed by GC analysis) was not quantified separately, as the yield is normally lower than 5 wt% under such low temperature applied in this study. Instead, the lumped yield of gaseous products plus the pyrolytic water produced in the HTL process, designated as yield of Water + Gas, was obtained by mass balance. Each run was repeated for three times and average value was taken.
The co-solvents (200 g, including moisture within TPW) and catalyst (1 g) were selected as the medium and the acidic mediums were prepared using sulfuric acid, when pH value was around 2.6. The basic mixtures were prepared using potassium hydroxide and pHi (initial pH value) appeared to be around 8–9.
The separation procedure of liquefied products is shown in Figure 2. Upon desiccation, the liquid products were fractionated into a water-soluble fraction and an acetone-soluble fraction. The other main streams were gaseous products and solid residue.

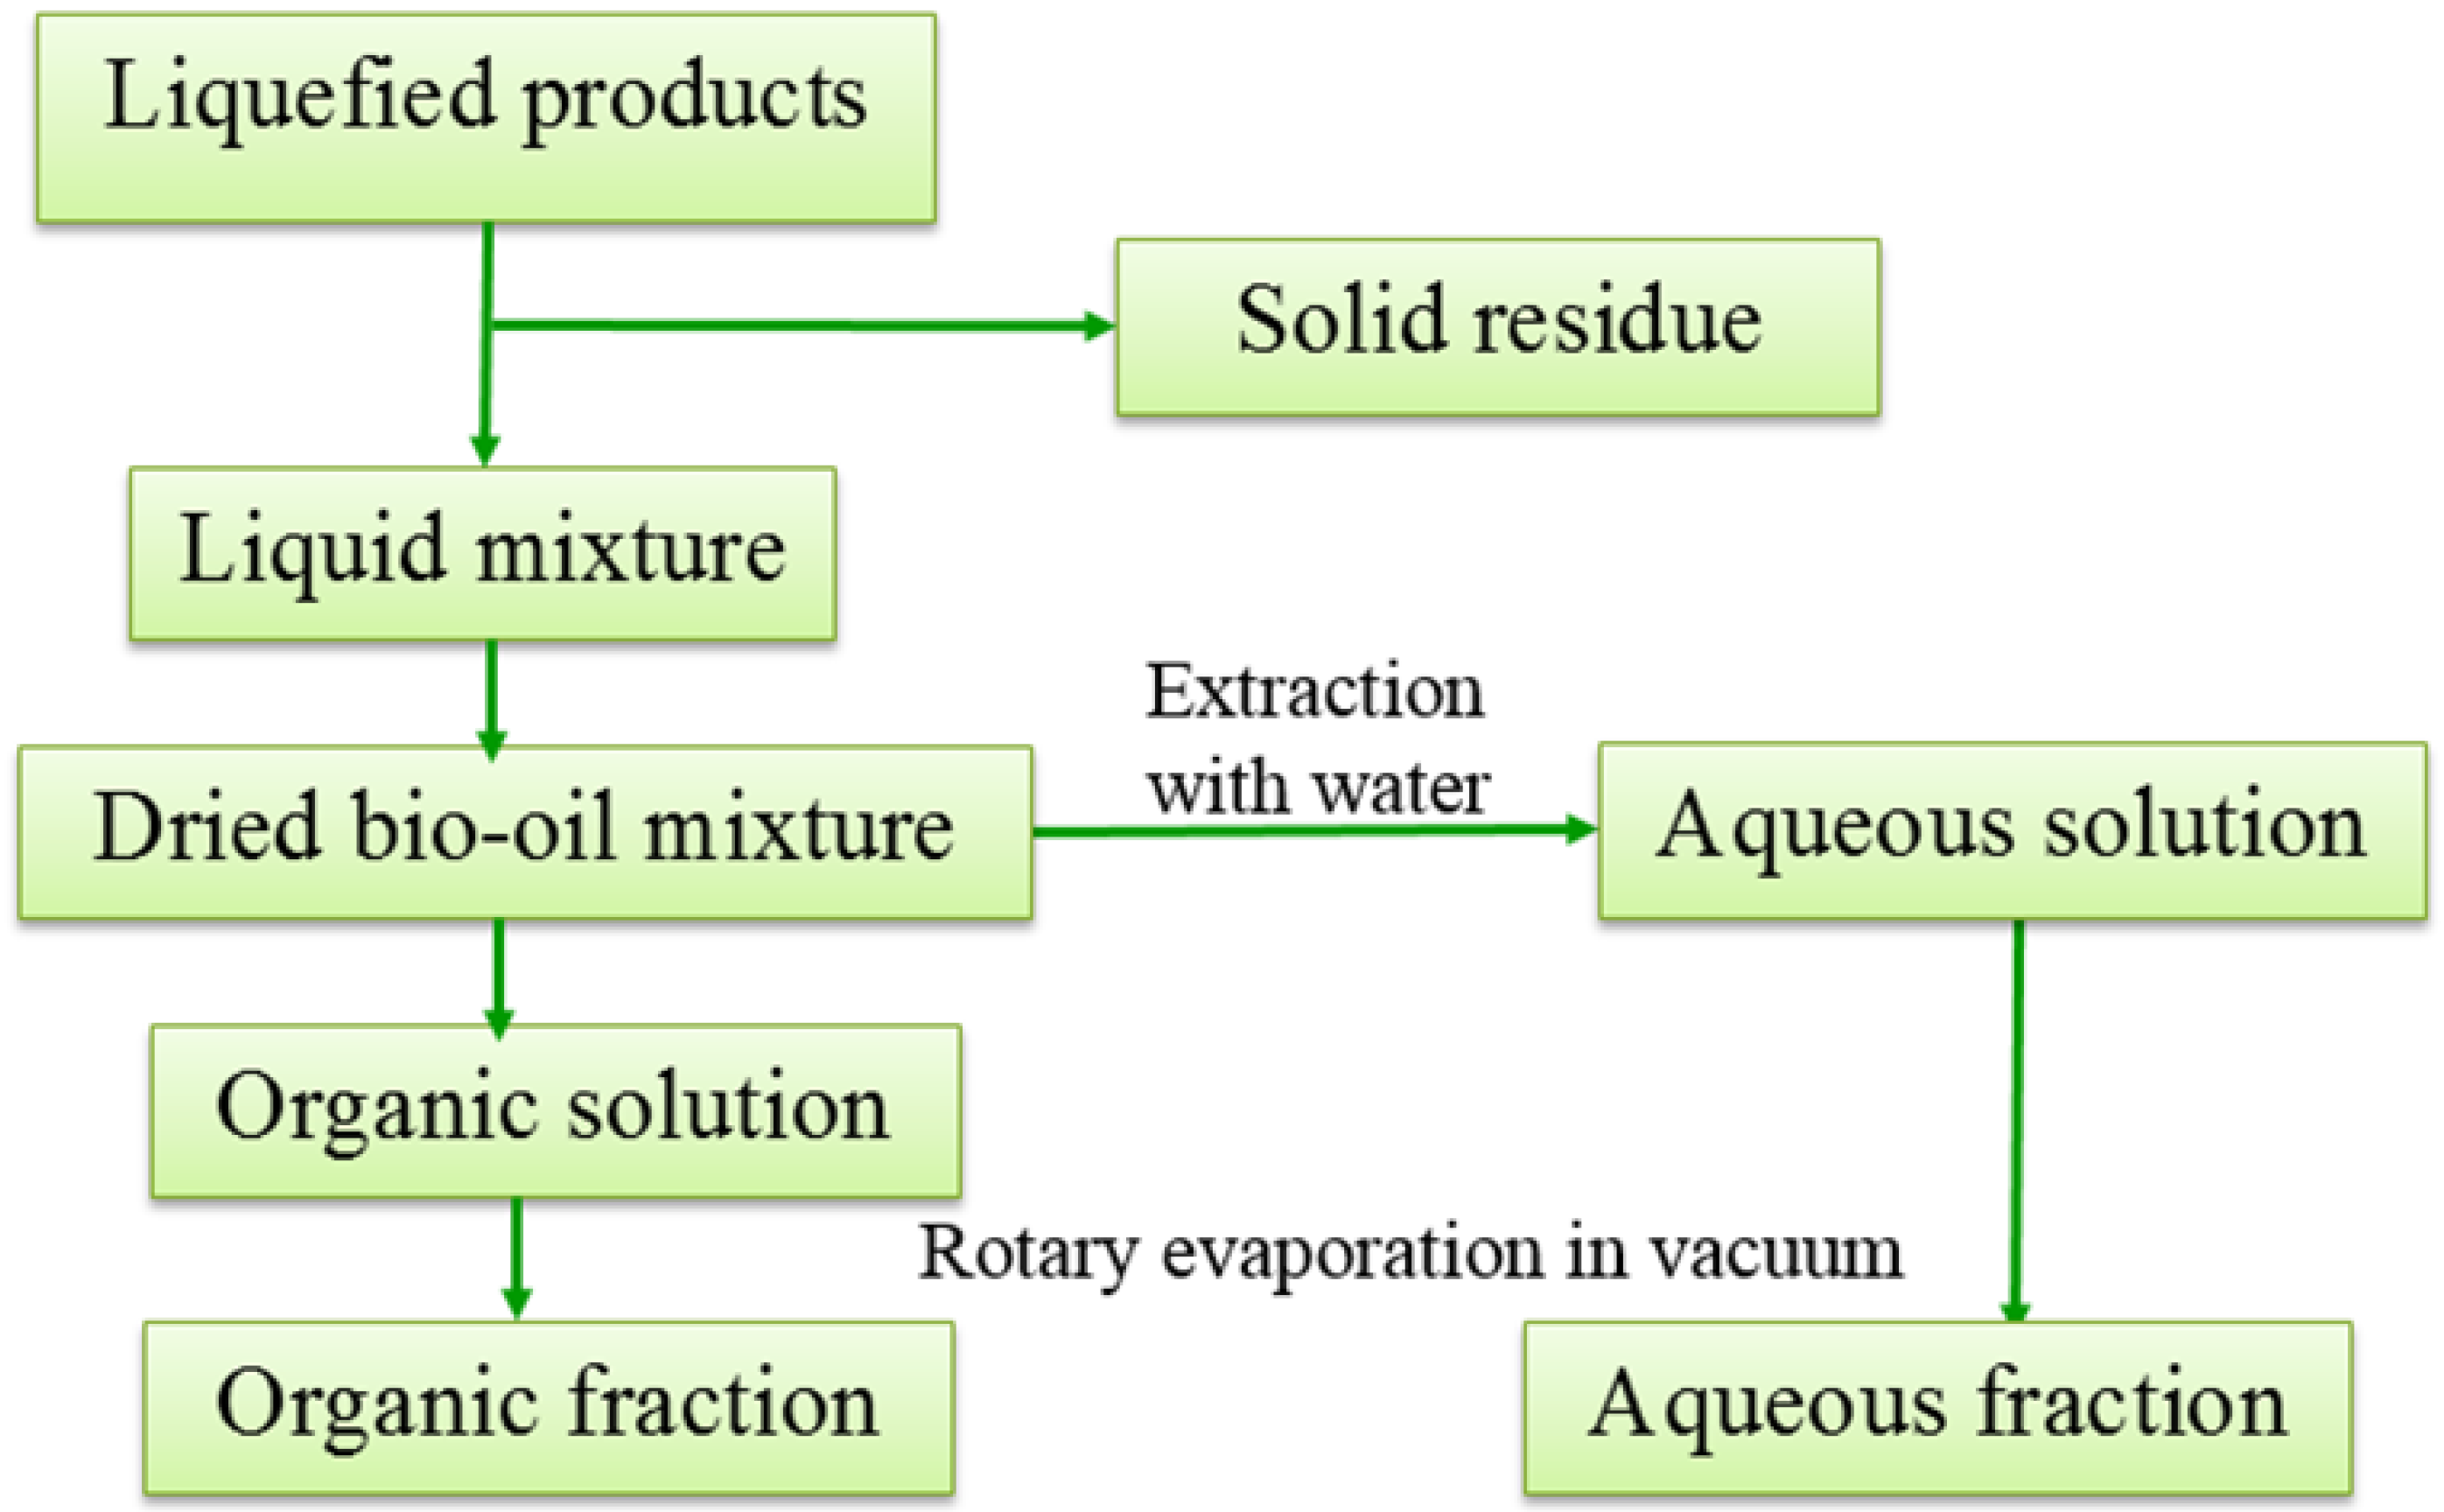
2.3. Characterization

The proximate analysis (ash, volatile matter and fixed carbon) of the TPW was carried out as per ASTM standards. The sample was placed in the muffle furnace (Thermo Scientific F48055-60, Waltham, MA, USA) at 105 °C for at least 16 h before being moved to desiccator for cooling. The TPW was then re-weighed and the change between initial and final weight was expressed as moisture content by percentage (ASTM-E871). The dried solid samples were then ignited at 575 °C for 5 h in a muffle furnace to determine the ash content (ASTM-E1755). The volatile matter (VM) was measured by firing the sample at 950 °C for 7 min (ASTM-E872). The remaining weight after subtracting the contents of volatile matter, moisture, and ash was reported as the fixed carbon (FC) content.
The pH values of liquid samples were acquired using a digital pH meter (Thermo Orion, Nanjing, China, model 210A). The C, H, N, S contents of dry TPW and bio-oil samples were determined by an elemental analyzer (Thermo Fisher Flash EA 1112, Waltham, MA, USA). Oxygen content was estimated based on an assumption that the samples only contain the elements of C, H, N, O and ash. The higher heating value (HHV) of each product/fraction was determined based on the ultimate analysis using the Dulong formula:
HHV (MJ/kg) = 0.3383ZC + 1.422 (ZH − ZO/8)
where ZC, ZH and ZO are the weight percentages of carbon, hydrogen and oxygen, respectively.
The chemical compositions and properties of the HTL products were analyzed using a Fourier transfer infrared spectra (FTIR), gas chromatography (GC), gas chromatography-mass spectrometry (GC-MS), and thermogravimetric analysis (TGA). IR spectra of bio-crude oils were directly collected by a Perkin-Elmer FTIR spectrometer (Waltham, MA, USA). The liquefied products were qualitatively analyzed using GC-MS. The bio-oils soluble in mixture of water and acetone were diluted in ethanol. The structures of bio-oil fractions were probed by an Agilent 7890B GC coupled with a 5977A MSD, using a 30 m × 0.5 mm × 0.25 μm DB-5 column with temperature programing as follows: 1 min hold at an initial temperature of 50 °C, followed by a 15 °C/min ramp to a final temperature of 280 °C with a 5 min hold. An MSD capillary column (apolar) was also used with a temperature program from 60 to 300 °C at a rate of 15 °C/min. The gaseous products were analyzed by a gas chromatograph (SRI 8610C-GC) to determine the concentration of individual gas. Columns on the GC included a silica gel packed column. Compounds were detected and quantified with thermal conductivity detectors that were calibrated using a refinery gas calibration mix (Agilent, Santa Clara, CA, USA, part #5184-3543) after column separation. Helium at 0.55 ± 0.01 MPa pressure was used as the carrier gas for the analysis. The thermal stability and decomposition of bio-oil were investigated by thermogravimetric analysis (TGA) using an SDT Q600 thermal analysis system (TA Instrument, New Castle, DE, USA). The bio-oil samples (5–10 mg) were measured in nitrogen or air atmosphere at a flow rate of 50 mL/min, ramping from 50 to 900 °C at 10 °C/min.

3. Results and Discussion

3.1. Feedstock Characterization and Experimental Design

The TPW was first subjected to proximate and ultimate analysis as shown in Table 1. The design parameters and corresponding yield of the experiments are displayed in Table 2. Three duplicates were conducted for each reaction condition to ensure acceptable reproducibility of the experimental results.

3.2. Effect of Operating Conditions on HTL and Process Optimization

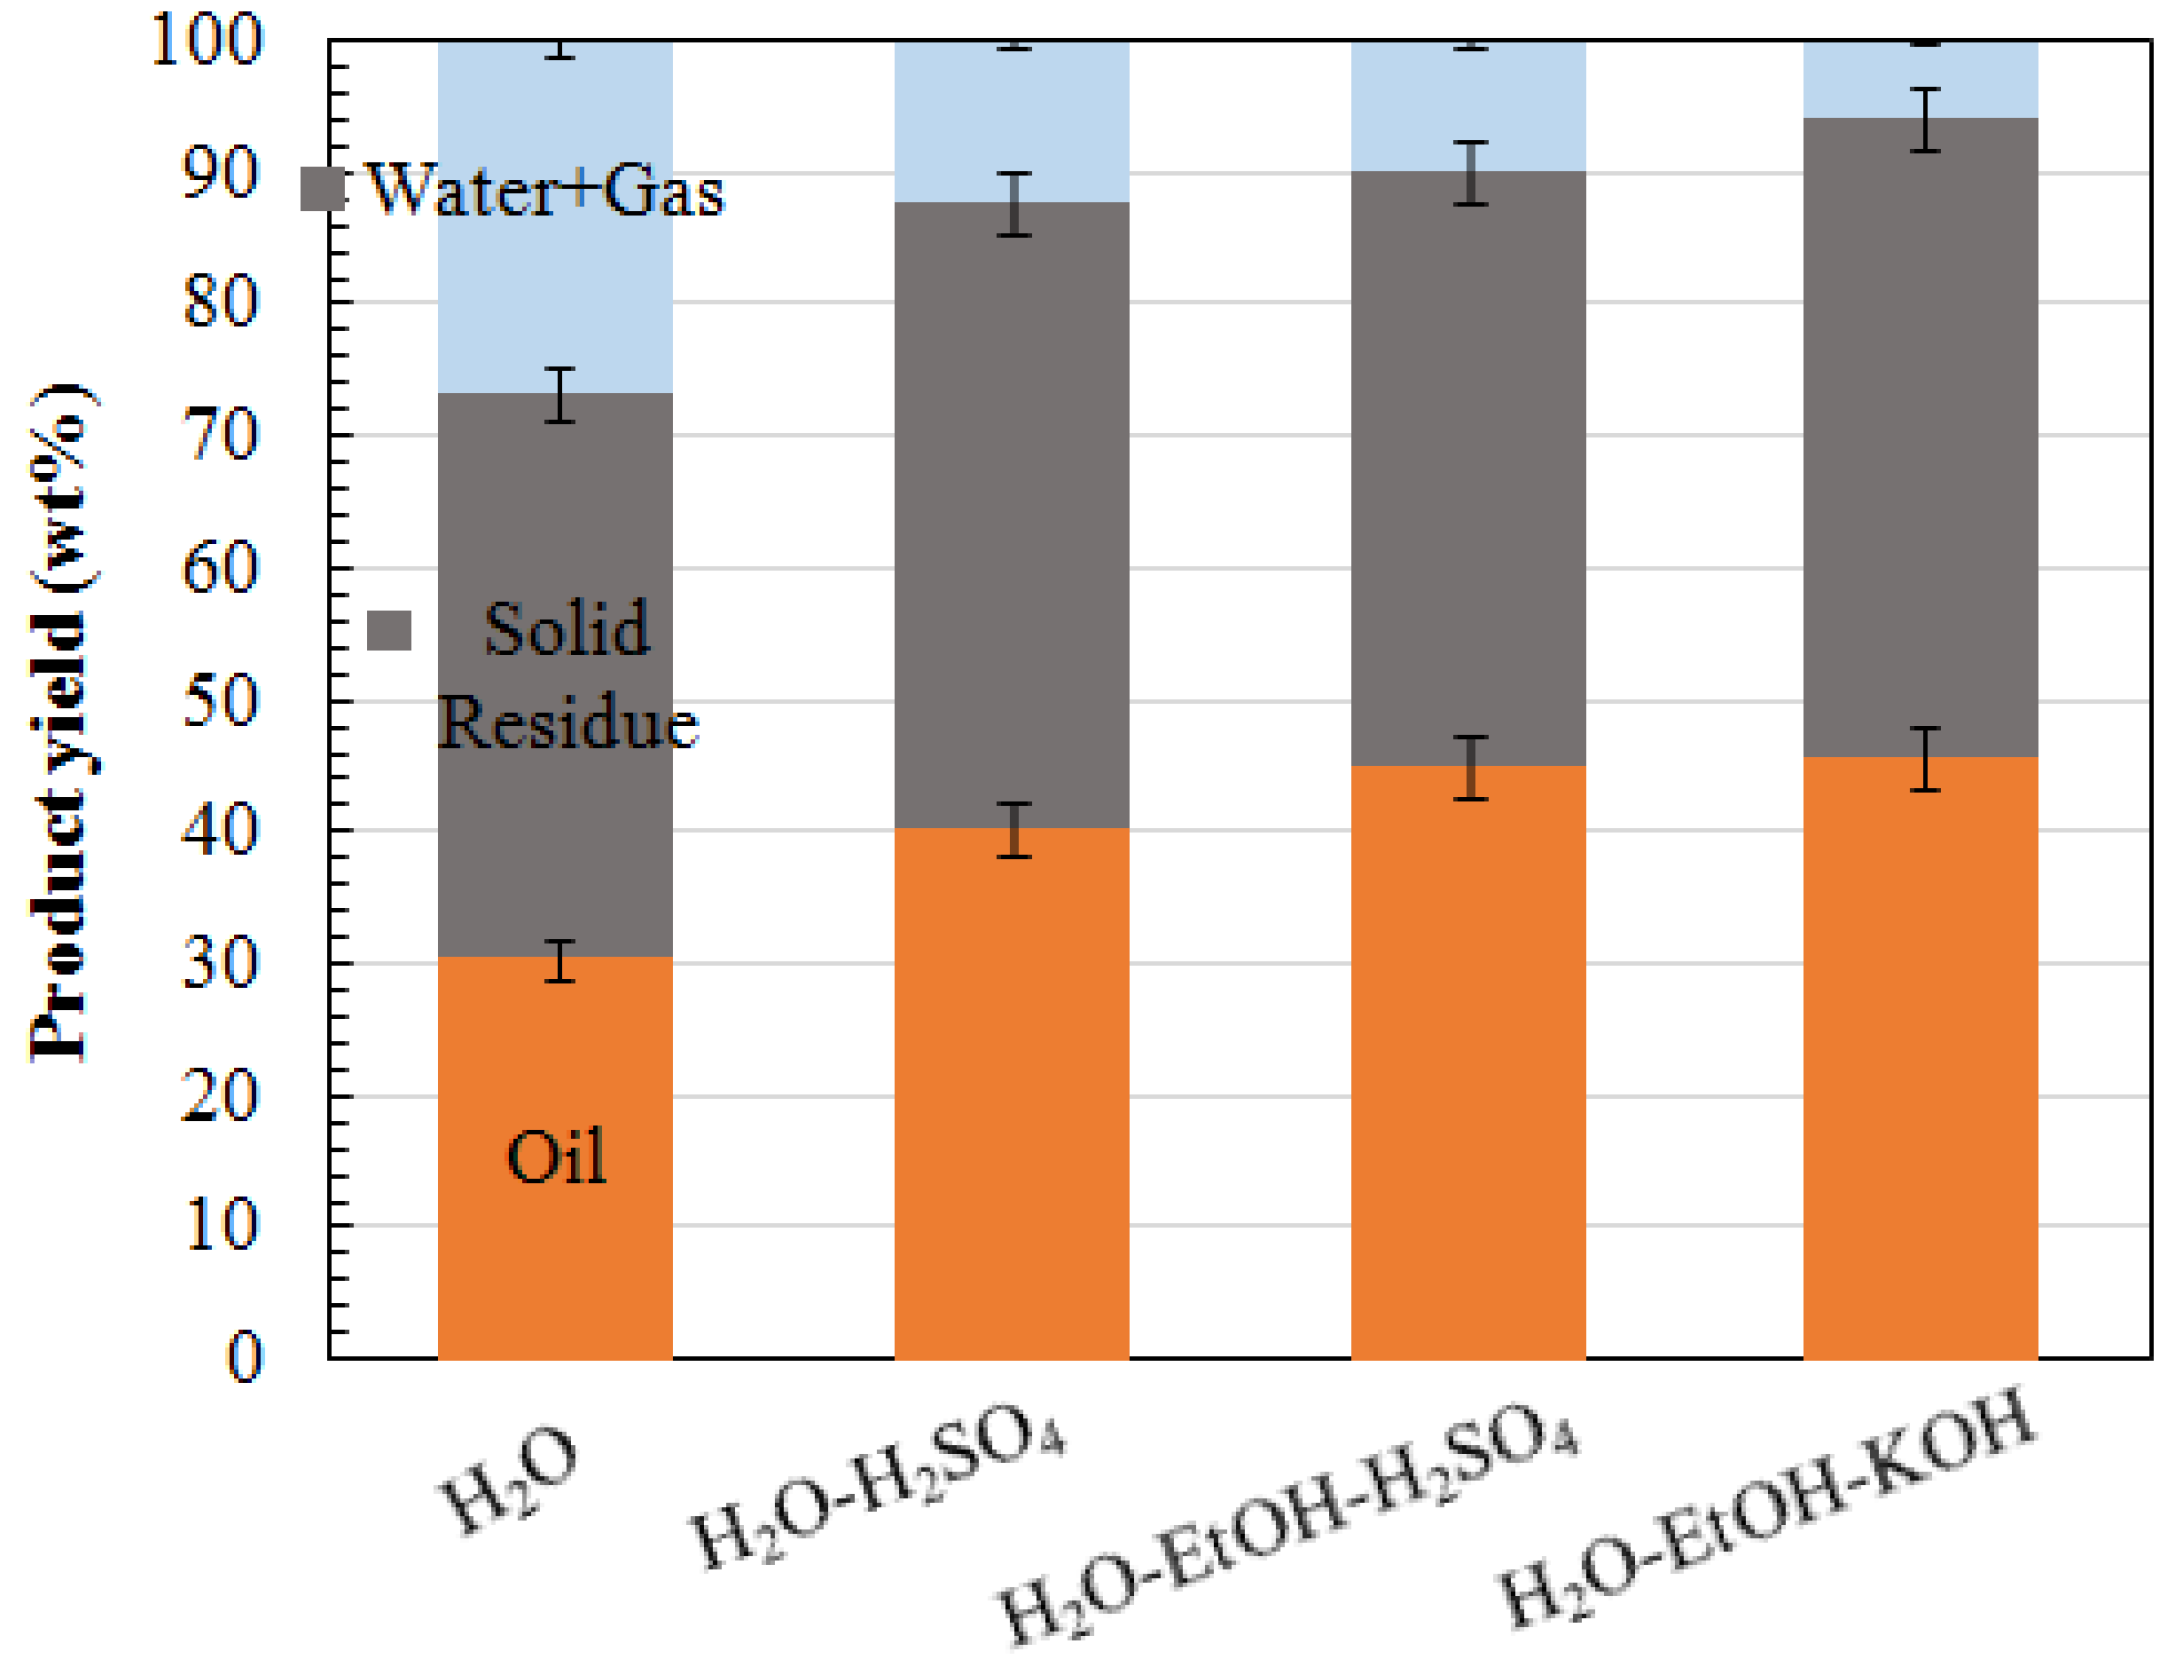
3.2.1. Effect of Reaction Medium and Catalyst

The effects of catalyst and solvent were firstly investigated. The H2SO4 as acid catalyst enhanced the oil yield from 30.5 wt% to 40.4 wt%, at 250 °C in water for 30 min (Figure 3). If the mixture of water–ethanol (16/3, v/v) was used as the reaction medium in the presence of H2SO4 under the same other conditions, the oil yield (OL) increased further to 45 wt%. This indicated that the presence of an acid catalyst and ethanol as a co-solvent in the reaction medium favored the HTL of TPW into bio-oil product. In the same co-solvent under the same conditions, the addition of KOH as base catalyst brought a similarly yield of bio-oil (~46 wt%) as that of the test with the acid catalyst. However, a higher SR yield (~49 wt%) with KOH catalyst, compared with approximate 45 wt% SR with the acid catalyst. This is reasonable because base catalysts are more effective in converting biomass with high lignin content while acid catalysts are effective for feedstocks with high cellulose and hemicellulose content such as TPW. Therefore, more water soluble and low-boiling point components are generated among biocrude using acidic catalyst. These low-boiling point components could easily vaporize and lose during desiccation, appearing lower yield. Therefore, H2SO4 is believed to be more effective than KOH as a catalyst for the low-temperature HTL of TPW for bio-crude oil production under the present conditions [13].

3.2.2. Effects of Reaction Temperature

We then performed the tests at various temperatures: 220, 250, and 280 °C, respectively, while keeping the other conditions the same (i.e., H2O-EtOH medium, 30 min, H2SO4 as catalyst). The dependence of product yields on temperatures are illustrated in Figure 4. As the temperature increased from 220 to 250 °C, the bio-oil yield increased by approx. 3%, accompanied by a decrease in SR yield by 10 wt%. Thus, a higher temperature facilitated an increase in bio-crude oil generation and biomass conversion (lowering the SR yield). A further increase in the operating temperature to 280 °C resulted in a continued decrease in SR yield, suggesting further enhanced biomass conversion, as expected. However, bio-oil yield dropped from ~45 wt% at 250 °C to ~38 wt% at 280 °C. Thus, 250 °C seems to be the optimal temperature under the present conditions for bio-oil production, mainly because of the lignocellulosic content of TPW. Another clear trend observed from Figure 4 is that a higher temperature leads to a higher yield of Water + Gas due to enhanced pyrolysis and liquefaction reactions, which is consistent with the published results in other literature [15].

3.2.3. Effects of Holding Time

Effects of holding time were examined by performing the HTL tests for various lengths of time (15, 30, 45 and 60 min) under the same other conditions (i.e., H2O-EtOH medium, 250 °C, H2SO4 catalyst). The obtained product yields vs. reaction time are presented in Figure 5. Generally, a longer reaction time or temperature leads to an incensement of biomass conversion (reducing SR yield) and larger formation of water and gases compounds. However, bio-oil yield appeared to peak at approx. 45 wt% for 30–45 min. 45 min also seems to be a proper time for biomass conversion, resulting in the lowest SR yield. A holding time longer than 45 min slightly increased the SR yield, likely due to the formation of char or solid residues by condensation/repolymerization reactions of the liquid products, as reported often in the literature [16].
Based on the above preliminary studies on reaction parameter screening for bio-crude oil production from TPW via low-temperature HTL, the optimal conditions appear to be: H2O-EtOH medium, 250 °C reaction temperature, H2SO4 catalyst, and 30 min reaction time. As a continued work of this study, the optimal reaction conditions will be investigated further by experimental design via response surface methodology.

3.3. Structural Analyses of Bio-Crude Oils

To examine the chemical compositions/structures of bio-crude oils, some representative bio-crude oil samples were analyzed by GC-MS, FTIR, and TGA. Table 3 presents GC-MS results of the bio-crude oil obtained from HTL of TPW in water–ethanol medium at 250 °C for 30 min catalyzed by H2SO4. The main compounds identified in the TPW-derived bio-oil are nitrogen-containing compounds such as N,N-Dimethylacetamide (~37 area%) and 4-Pyridinal (~10 area%), which are believed to be derived from the protein component of the feedstock, as evidenced by the high N content (4 wt%) of TPW (Table 1). The oil is also rich in acetic acid (19 area%), likely derived from degradation of carbohydrates/holocellulose in the feedstock. Other compounds such as ketones, esters and aromatics were also detected, as commonly reported in the literature [17,18,19]. However, it shall be noted that limited by the GC-MS technique, only volatile fractions (with boiling points <280 °C) of the bio-crude oils (normally less than 20 wt% of the total oils, determined by TGA of the oils) were identified.
The GC-MS results indicated the presence of a significant number of N-containing compounds and carboxylic acid (acetic acid). Figure 6 allows for a comprehensive understanding of the functional group characteristics with spectral band assignments and interpretation based on previous publications [20]. The holding time or catalyst didn’t distinct the oily products and we further assigned the major absorbance [21].
The GC-MS chromatograms of an aqueous fraction of liquefied products with lower boiling points and lower molecular weights are summarized in Table 4. The major components in the AF are fatty acids, pyridinol compounds and thiosemicarbazides. According to Biller et al. [22], the AF from HTL processes contained several orders of magnitude higher of all nutrients required for algae growth. Further works are expected to investigate the suitability of this aqueous phase for algae cultivation [23]. GC-MS results of the bio-crude oil obtained from HTL of TPW with KOH catalyst are presented in Table 5. About 41% of the acidic compounds, suggesting that the TPW decomposed under the alkaline condition. As the carboxylic acids produced from TPW under alkaline conditions, the initial alkaline hydrothermal condition can gradually become acidic [14]. The carboxylic acids produced under initial alkaline conditions could neutralize the input alkalis and the aqueous reaction media could then become acidic, thus activating the acidic pathway.
The bands between 3505 and 3065 cm−1 could be assigned to either N-H or O-H stretching bonds representing amine or hydroxyl groups. The absorption bands of asymmetrical/symmetrical C-H stretching (3000–2850 cm−1) and CH3 bending (1390 cm−1) vibrations are related to aliphatic methylene groups, indicating the presence of alkane groups. Significant heteroatom functionality (1700–1050 cm−1) was also observed as expected from the GC-MS characterization (Table 3 and Table 4). The GC-MS results were found to be consistent with FTIR characterization, indicating the presence of a significant number of N-containing compounds and carboxylic acid (acetic acid). The stretching bands of C=O groups (1730−1630 cm−1) correspond to the fatty acids and ester groups in the crude bio-oil. Consistent with nitrogenous compounds identified by GC-MS, small peaks representing amine groups were reflected by the weak N–H bending vibrations (1650–1530 cm−1). Bands at 1445 are assigned to C=C stretching vibrations in aromatic groups. The strong absorbance near 1400 cm−1 is assigned to mononuclear aromatic compounds or the scissoring band in methylene groups. Bio-crudes obtained at different temperatures have FTIR of quite similarity (data not shown).

3.4. Elemental Distribution of Oily Products

TPW, the bio-oil, the organic fraction (OF), aqueous fraction (AF) and solid residue from optimal conditions were subjected to an element analyzer for their C, H, N, S, and O contents (Table 6). The C and O contents of the bio-oil are close to those of TPW, showing negligible difference. The HHV of the residue was higher than that of TPW, but close to that of OF, because the undissolved lignin and ash were the main components in the residue. Moreover, the C content and HHV of the OF increased considerably, while the O content was much lower than that of TPW and solid residue because of the deoxygenation resulting from dehydration and condensation reactions catalyzed by sulfuric acid. As-produced bio-oil revealed about 35% improvement in HHV has taken place with the HTL. Due to the mild liquefaction conditions, the HHV of OF (18.5 MJ/kg) was lower than that of heavy oil (~27 MJ/kg) [24] and the upgraded oil (~36 MJ/kg) [25] produced by the liquefaction under high pressures and high temperatures. It shall be noted that the obvious increment of the HHV and decrement of the ash content in the OF implies its potential upon biofuel upgrading.

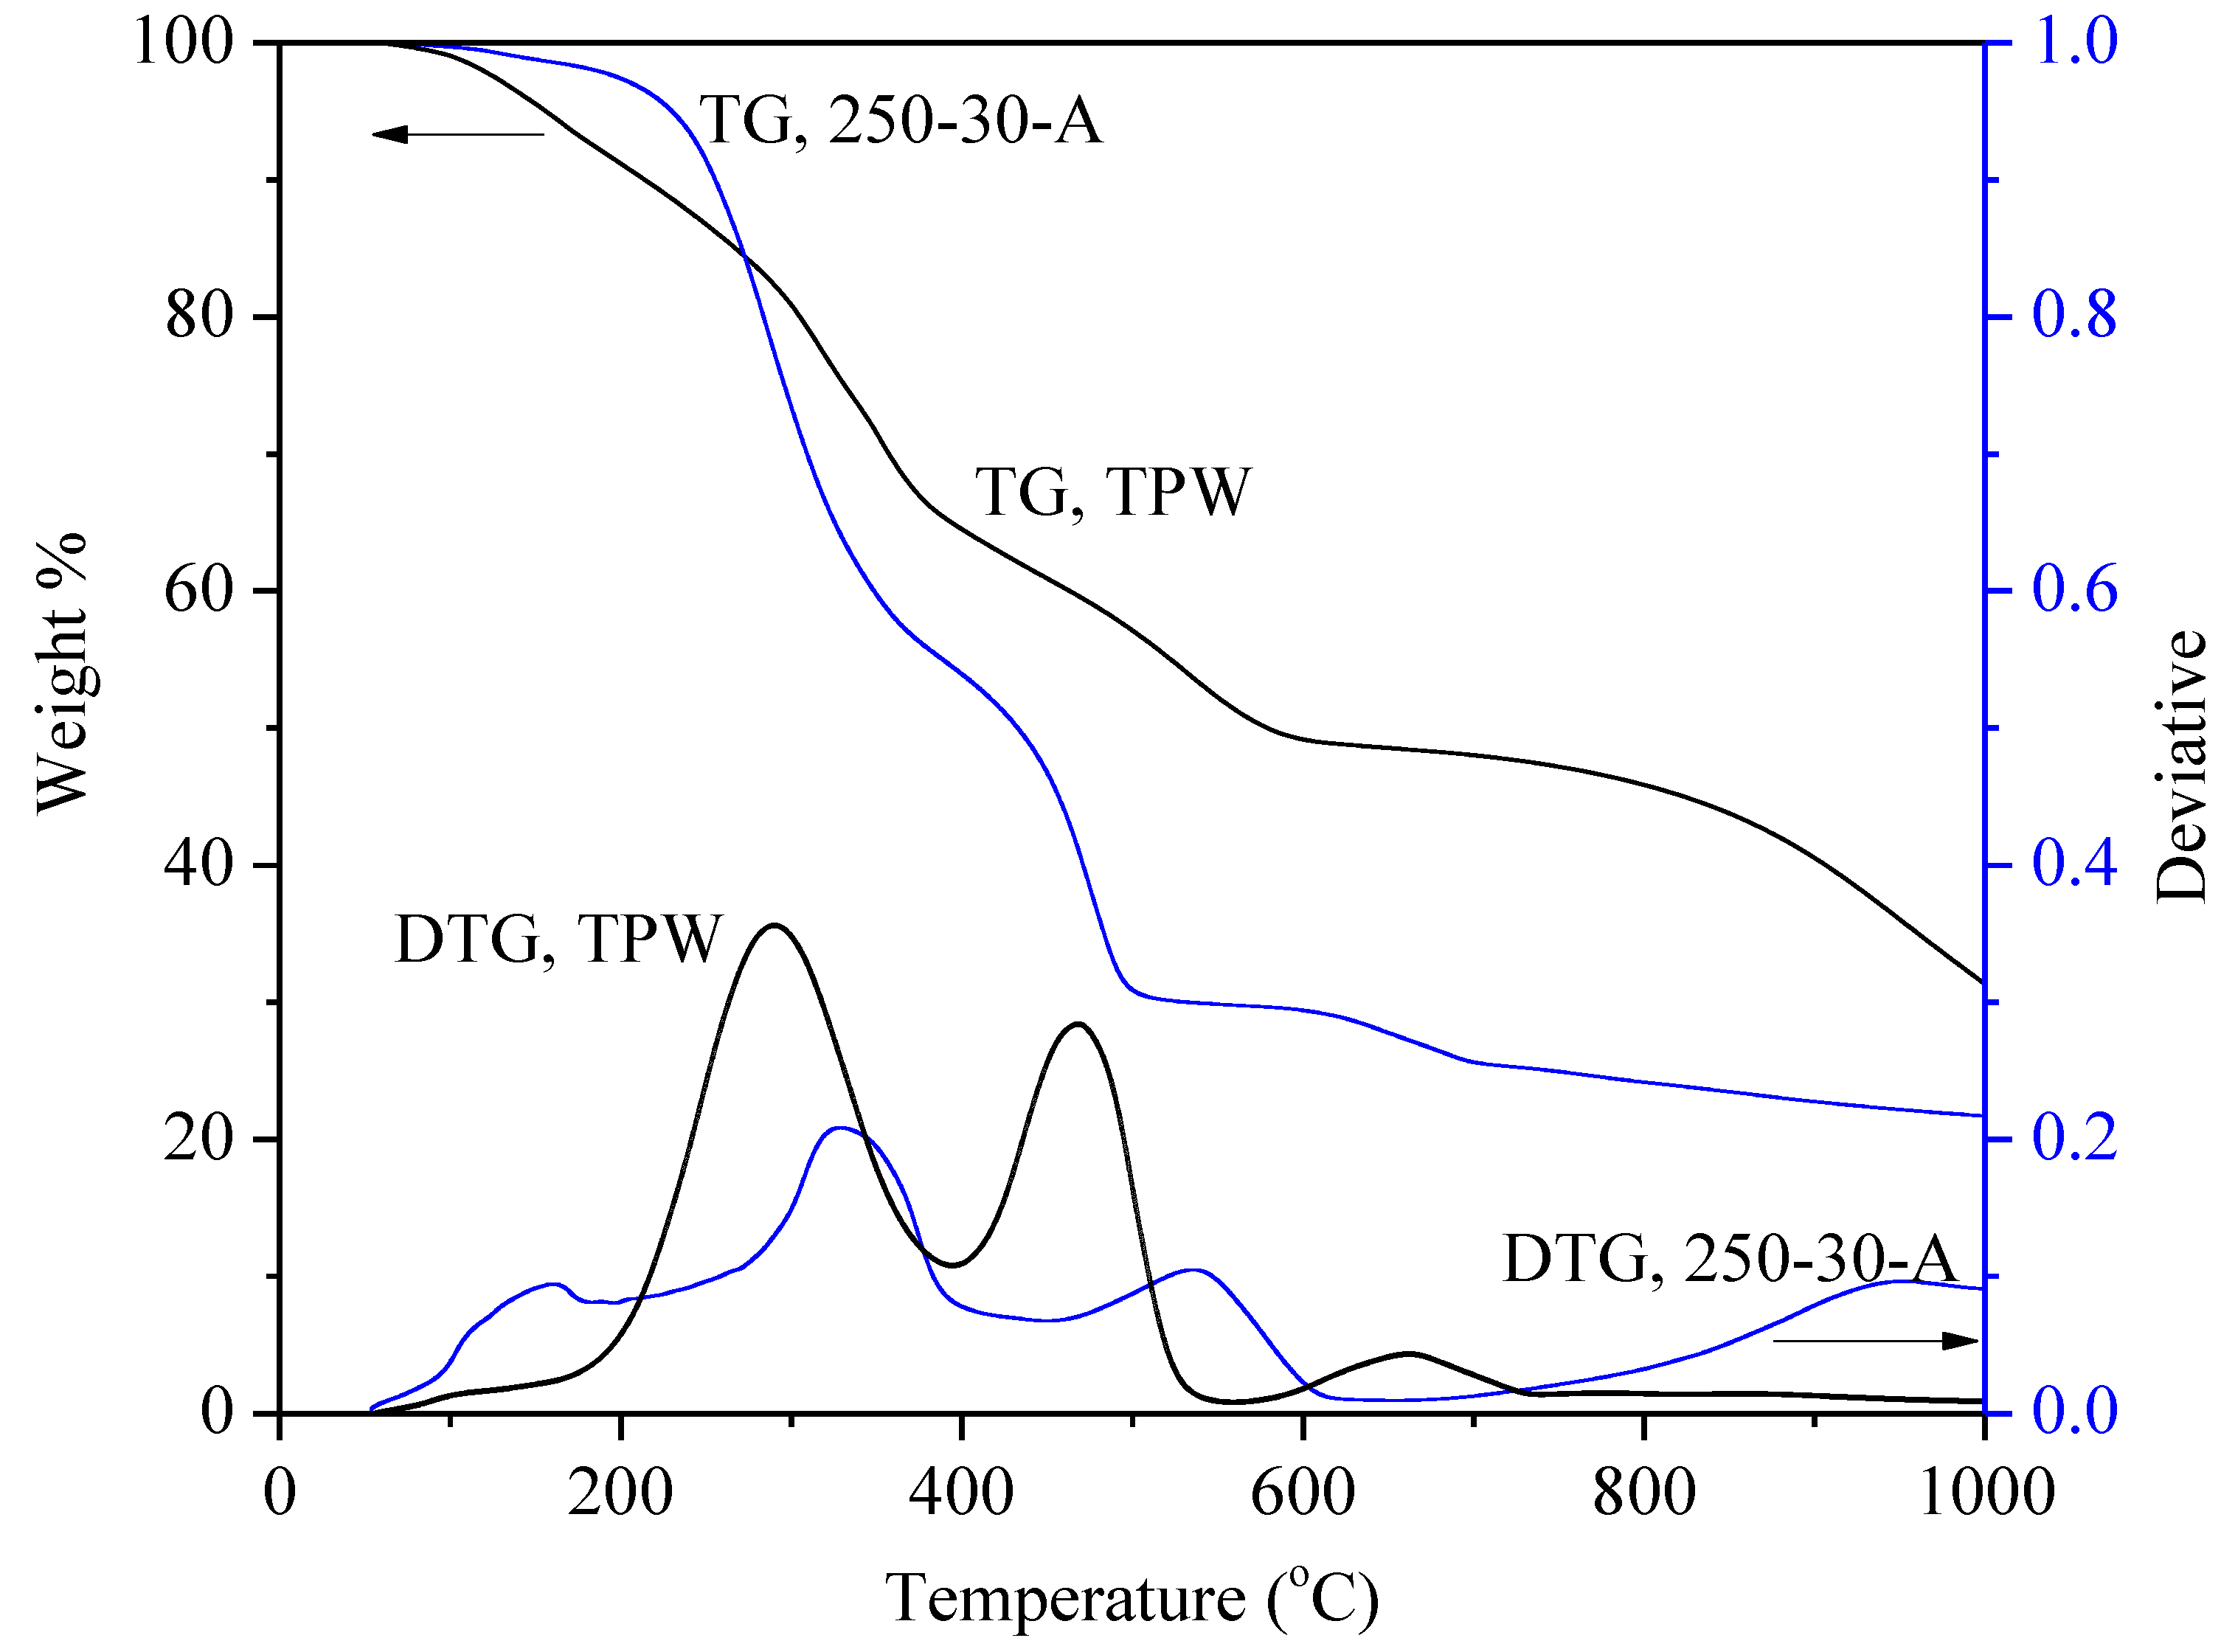
3.5. Thermal Stability, Volatile Matter upon Decomposition and Proximate Analysis of Bio-Crude Oil

Thermal gravimetric analysis (TGA) measures the weight losses of the sample as the temperature increases. Figure 7 shows the weight percentage (TG) and weight loss derivative curves (DTG) of TPW and bio-crude oil (250-30-A) in air. The decomposition of the oils started at 227 °C, peaked at 333 °C, and ended at 730 °C. According to Figure 7, about 20% of the bio-crude oils had a boiling point less than 300 °C, indicating that only a small fraction of bio-crude oil with lower molecular weights was detectable by GC-MS. The obtained bio-crude oils need upgrading for application as biofuel, comparing to the petroleum crude oil of which 45 wt% can be vaporized at 250 °C [26]. The TPW lose weight easily under 400 °C but slowly after 500 °C, mainly because of the high ash content within TPW feedstock.

3.6. Analysis of Gaseous Products

GC analysis of gaseous products showed the presence of N2, CH4, CO and CO2. The resulting gases contain 79–89% of N2 as the HTL runs were conducted under the protection of N2. The relative concentration of gases to N2 is presented in Table 7. Being the major product, CO2 constitutes 6–15% among all gases. The CO2 and CO can be formed by hydrothermal reactions such as decarboxylation, water gas shift reaction, and gasification of solid residues (char), as well as being favored by reactive hot compressed water while H2 might be consumed by the reverse-water gas shift reaction.
Decarboxylation: R ↔ R1 + CO2
Gasification: C + H2O ↔ H2 + CO
Water gas shift reaction: H2O + CO ↔ H2 + CO2
Under basic conditions, the contents of CO and CO2 were less than those under acidic conditions. Higher concentration of CO2 was observed at 250 °C under acidic conditions as a result of enhanced decarboxylation and water gas shift reactions. The holding time enhances the concentrations of CO and CO2 accordingly up to 45 min, while the holding time of 60 min resulted in lower concentration, suggesting that a longer holding time favored reverse decarboxylation and gasification.

4. Conclusions

Hydrothermal liquefaction (HTL) presents a viable route for converting agricultural waste with high moisture content into liquid fuel, with low energy input comparing to other thermo chemical technologies. We extracted HTL bio-oils from the TPW under mild conditions, focusing on the influence of acidic and alkaline conditions on HTL liquid products. This study primarily investigates the effects of hydrothermal reaction parameters on the yield and structure of bio-crude oil products from tomato plant wastes. It has shown that up to 45.08% yield of bio-crude oil could be produced from TPW, ranging between 30% and 45% under different conditions. Acid catalyst, alcohol co-solvent, and appropriate temperature favored bio-crude oil yield. The holding time did not affect the oil yield significantly. The optimal HTL condition appears to be at 250 °C, acidic water–ethanol co-solvent medium, for 30 min with the initial N2 pressure of 1 MPa. The bio-crude oils are rich in fatty acids, aromatic compounds, fatty esters and carbohydrate derivatives, which are consistent with the identification by GC-MS and FTIR. The produced bio-oil has potential energy applications for biodiesel production and as a feedstock of fermentation.

Author Contributions

Conceptualization, Y.Z. and A.D.; Methodology, Y.Z.; Validation, Y.Z. and J.M.; Data curation, J.M.; Formal Analysis, Z.Y.; Investigation, Y.Z.; Resources, C.(C.)X.; Writing-Original Draft Preparation, Y.Z.; Writing-Review & Editing, J.M.; Supervision, A.D. and C.(C.)X.; Funding Acquisition, A.D. and C.(C.)X.

Funding

This research was funded by BioFuelNet Canada, Ontario Ministry of Research & Innovation, Henan Provincial Key Research and Development Program grant number 182102410071, Henan Outstanding Foreign Scientists’ Workroom grant number GZS2018004, and University Key Research Project of Henan Province grant number 18A530005.

Conflicts of Interest

The authors declare no conflict of interest.

References

  1. Demirbas, A. Biofuels sources, biofuel policy, biofuel economy and global biofuel projections. Energy Convers. Manag. 2008, 49, 2106–2116. [Google Scholar] [CrossRef]
  2. Fernando, S.; Adhikari, S.; Chandrapal, C.; Murali, N. Biorefineries: Current status, challenges, and future direction. Energy Fuels 2006, 20, 1727–1737. [Google Scholar] [CrossRef]
  3. Tuck, C.O.; Pérez, E.; Horváth, I.T.; Sheldon, R.A.; Poliakoff, M. Valorization of biomass: Deriving more value from waste. Science 2012, 337, 695–699. [Google Scholar] [CrossRef] [PubMed]
  4. Demirbas, M.F. Biorefineries for biofuel upgrading: A critical review. Appl. Energy 2009, 86, S151–S161. [Google Scholar] [CrossRef]
  5. Barreiro, D.L.; Prins, W.; Ronsse, F.; Brilman, W. Hydrothermal liquefaction (HTL) of microalgae for biofuel production: State of the art review and future prospects. Biomass Bioenergy 2013, 53, 113–127. [Google Scholar] [CrossRef]
  6. Elliott, D.C.; Biller, P.; Ross, A.B.; Schmidt, A.J.; Jones, S.B. Hydrothermal liquefaction of biomass: Developments from batch to continuous process. Bioresour. Technol. 2015, 178, 147–156. [Google Scholar] [CrossRef] [PubMed]
  7. Wood, S.M.; Layzell, D.B. A Canadian biomass inventory: Feedstocks for a bio-based economy. BIOCAP Can. Found. 2003, 18–24. [Google Scholar]
  8. Reddy, H.K.; Muppaneni, T.; Ponnusamy, S.; Sudasinghe, N.; Pegallapati, A.; Selvaratnam, T.; Seger, M.; Dungan, B.; Nirmalakhandan, N.; Schaub, T.; et al. Temperature effect on hydrothermal liquefaction of Nannochloropsis gaditana and Chlorella sp. Appl. Energy 2016, 165, 943–951. [Google Scholar] [CrossRef]
  9. Zhu, Y.; Biddy, M.J.; Jones, S.B.; Elliott, D.S.; Schmidt, A.J. Techno-economic analysis of liquid fuel production from woody biomass via hydrothermal liquefaction (HTL) and upgrading. Appl. Energy 2014, 129, 384–394. [Google Scholar] [CrossRef]
  10. Xu, C.; Etcheverry, T. Hydro-liquefaction of woody biomass in sub-and super-critical ethanol with iron-based catalysts. Fuel 2008, 87, 335–345. [Google Scholar] [CrossRef]
  11. Taner, F.; Eratik, A.; Ardic, I. Identification of the compounds in the aqueous phases from liquefaction of lignocellulosics. Fuel Process. Technol. 2005, 86, 407–418. [Google Scholar] [CrossRef]
  12. Takeuchi, Y.; Jin, F.; Tohji, K.; Enomoto, H. Acid catalytic hydrothermal conversion of carbohydrate biomass into useful substances. J. Mater. Sci. 2008, 43, 2472–2475. [Google Scholar] [CrossRef]
  13. Yin, S.; Pan, Y.; Tan, Z. Hydrothermal conversion of cellulose to 5-hydroxymethyl furfural. Int. J. Green Energy 2011, 8, 234–247. [Google Scholar] [CrossRef]
  14. Yin, S.; Mehrotra, A.K.; Tan, Z. Alkaline hydrothermal conversion of cellulose to bio-oil: Influence of alkalinity on reaction pathway change. Bioresour. Technol. 2011, 102, 6605–6610. [Google Scholar] [CrossRef] [PubMed]
  15. Peterson, A.A.; Vogel, F.; Lachance, R.P.; Fröling, M.; Antal, M.J., Jr.; Tester, J.W. Thermochemical biofuel production in hydrothermal media: A review of sub-and supercritical water technologies. Energy Environ. Sci. 2008, 1, 32–65. [Google Scholar] [CrossRef]
  16. Toor, S.S.; Rosendahl, L.; Rudolf, A. Hydrothermal liquefaction of biomass: A review of subcritical water technologies. Energy 2011, 36, 2328–2342. [Google Scholar] [CrossRef]
  17. Zhou, D.; Zhang, L.; Zhang, S.; Fu, H.; Chen, J. Hydrothermal Liquefaction of Macroalgae Enteromorpha prolifera to Bio-oil. Energy Fuels 2010, 24, 4054–4061. [Google Scholar] [CrossRef]
  18. Shuping, Z.; Yulong, W.; Mingde, Y.; Kaleem, I.; Chun, L.; Tong, J. Production and characterization of bio-oil from hydrothermal liquefaction of microalgae Dunaliella tertiolecta cake. Energy 2010, 35, 5406–5411. [Google Scholar] [CrossRef]
  19. Jena, U.; Das, K.C. Comparative Evaluation of Thermochemical Liquefaction and Pyrolysis for Bio-Oil Production from Microalgae. Energy Fuels 2011, 25, 5472–5482. [Google Scholar] [CrossRef]
  20. Duan, P.; Savage, P.E. Hydrothermal Liquefaction of a Microalga with Heterogeneous Catalysts. Ind. Eng. Chem. Res. 2011, 50, 52–61. [Google Scholar] [CrossRef]
  21. Vardon, D.R.; Sharma, B.K.; Scott, J.; Yu, G.; Wang, Z.; Schideman, L.; Zhang, Y.; Strathmann, T.J. Chemical properties of biocrude oil from the hydrothermal liquefaction of Spirulina algae, swine manure, and digested anaerobic sludge. Bioresour. Technol. 2011, 102, 8295–8303. [Google Scholar] [CrossRef] [PubMed]
  22. Biller, P.; Ross, A.B.; Skill, S.C.; Lea-Langton, A.; Balasundaram, B.; Hall, C.; Riley, R.; Llewellyn, C.A. Nutrient recycling of aqueous phase for microalgae cultivation from the hydrothermal liquefaction process. Algal Res. 2012, 1, 70–76. [Google Scholar] [CrossRef]
  23. Toor, S.S.; Reddy, H.; Deng, S.; Hoffmann, J.; Spangsmark, D.; Madsen, L.B.; Holm-Nielsen, J.B.; Rosendahl, L.A. Hydrothermal liquefaction of Spirulina and Nannochloropsis salina under subcritical and supercritical water conditions. Bioresour. Technol. 2013, 131, 413–419. [Google Scholar] [CrossRef] [PubMed]
  24. Qu, Y.; Wei, X.; Zhong, C. Experimental study on the direct liquefaction of Cunninghamia lanceolata in water. Energy 2003, 28, 597–606. [Google Scholar] [CrossRef]
  25. Rezzoug, S.-A.; Capart, R. Liquefaction of wood in two successive steps: Solvolysis in ethylene-glycol and catalytic hydrotreatment. Appl. Energy 2002, 72, 631–644. [Google Scholar] [CrossRef]
  26. Anastasakis, K.; Ross, A.B. Hydrothermal liquefaction of the brown macro-alga Laminaria Saccharina: Effect of reaction conditions on product distribution and composition. Bioresour. Technol. 2011, 102, 4876–4883. [Google Scholar] [CrossRef] [PubMed]
Figure 1. Schematic diagram of the batch reactor.
Energies 11 03129 g001
Figure 2. Separation of bio-crude, including aqueous fraction and organic fraction, and solid residues from hydrothermal liquefaction (HTL) product mixture.
Energies 11 03129 g002
Figure 3. Effects of reaction mediums and catalysts on product yields (250 °C, 30 min).
Energies 11 03129 g003
Figure 4. Effects of reaction temperature on product yields (H2O-EtOH medium, 30 min, H2SO4 catalyst).
Energies 11 03129 g004
Figure 5. Effects of holding time on products yield (H2O-EtOH medium, 250 °C, H2SO4 catalyst, heating time for 0.5 h).
Energies 11 03129 g005
Figure 6. FTIR spectrum of the bio-crude oils derived from TPW, representing 250-30-A (a), 250-45-A (b), 250-60-A (c), and 250-30-B (d).
Energies 11 03129 g006
Figure 7. Thermal gravimetric analysis (TGA) and weight loss derivative curves (DTG) profiles of the bio-crude oils and TPW.
Energies 11 03129 g007
Table 1. Proximate and ultimate analysis of tomato plant wastes (TPW) (wt% on Dry Basis).
Moisture Content92.2 ± 0.03
Volatile matter62 ± 0.52
Ash32 ± 0.08
Fixed carbon6 ± 0.06
Elemental composition (%)
C34.8 ± 0.22
H5.0 ± 0.11
O a23.4 ± 0.16
N4.0 ± 0.08
S0.3 ± 0.02
HHV (MJ/kg)12.4 b
a Calculated by difference (100%-C%-H%-N%-S%-Ash%). b Higher Heating Value (HHV) calculated by Dulong formula, i.e., HHV (MJ/kg) = 0.3383C + 1.422(H − O/8).
Table 2. Experimental design *.
EntryNameTemperature (°C)Holding Time (min)SolventCatalystOil Yield (%)Solid Residue (%)
1250-30-N-H2O25030H2ON/A30.4642.79
2250-30-A-H2O25030H2OH2SO440.4247.37
3250-30-A25030H2O and EtOHH2SO444.9545.08
4250-30-B25030H2O and EtOHKOH45.6048.54
5220-30-A22030H2O and EtOHH2SO442.3555.16
6250-30-A25030H2O and EtOHH2SO444.9545.08
7280-30-A28030H2O and EtOHH2SO440.7041.03
8250-15-A25015H2O and EtOHH2SO439.7150.58
9250-30-A25030H2O and EtOHH2SO444.9545.08
10250-45-A25045H2O and EtOHH2SO441.1941.58
11250-60-A25060H2O and EtOHH2SO445.8839.86
* Each run was repeated for three times and average value was obtained, with the maximum deviation of ±3%.
Table 3. Gas chromatography–mass spectrometry (GC-MS) results of the bio-crude oil obtained from HTL of TPW in water–ethanol medium at 250 °C, 30 min with H2SO4 catalyst.
PKRT aArea Pct bLibrary/IDCASQual c
12.6819.35Acetic acid000064-19-790
23.22.22Thiophene000110-02-138
33.672.772-Hexanol, 3-methyl-002313-65-759
43.893.751H-Imidazole, 2-ethenyl-043129-93-735
54.272.512-Pentanone, 4-hydroxy-4-methyl-000123-42-238
64.891.69Pyrimidine, 4,6-dimethyl-001558-17-452
75.0136.75N,N-Dimethylacetamide000127-19-594
88.59.874-Pyridinol000626-64-283
910.250.473-Oxabicyclo[3.3.0]oct-7-en-2-one, 7-methoxy-1000155-61-449
1012.630.566-Isopropenyl-4,8a-dimethyl-4a,5,6,7,8,8a-hexahydro-1H-naphthalen-2-one086917-79-591
1113.330.47d-Ribitol, 1-deoxy-1-heptylamino-1000158-66-643
1213.731.27Hexadecanoic acid, ethyl ester000628-97-760
1313.973.01Benzene, 1-chloro-4-ethoxy-000622-61-738
1414.342.05Isonipecotic acid, N-(3-cyclopentylpropionyl)-, ethyl ester1000361-08-338
1514.582.49Benzyl alcohol, 4-methoxy-6-fluoro-000405-09-435
1614.944.772,5-Piperazinedione, 3,6-bis(2-methylpropyl)-001436-27-749
1715.261.43Benzene, 1-methoxy-3-(methylthio)-002388-74-160
1815.462.66Phenol, 3,5-dimethoxy-000500-99-246
1915.730.63Pyrrolidine, 1-(7-nitrodibenzofuran-2-sulfonyl)-1000302-59-946
2016.690.77Carbamate, N-(2-naphthyl)-, 3-pentynyl ester1000197-96-041
2118.10.52Benzoic acid, 3-methoxy-, 2-(2-nitrophenyl-2-oxo)ethyl ester331277-43-138
Total 100
a Room temperature, b Area percentage, c Quality.
Table 4. GC-MS results of the aqueous fraction of bio-crude oil obtained from HTL of TPW in water–ethanol medium at 250 °C, 30 min with H2SO4 catalyst.
PKRTArea PctLibrary/IDCASQual
13.6919.93Acetic acid000064-19-791
23.990.96Propanoic acid000079-09-437
35.2950.57Propanoic acid000127-19-591
47.190.672-Pyrrolidinone, 1-methyl-000872-50-481
57.582.402-Propanone, dimethylhydrazone013483-31-340
67.97.20Pentanoic acid, 4-oxo-000123-76-280
78.183.642-Furancarboxylic acid, 4-pentadecyl ester1000280-64-038
88.584.604-Pyridinol000626-64-291
98.751.613-Pyridinol000109-00-283
1015.920.672-Methyl aminomethyl-1,3-dioxolane057366-77-530
1116.291.31Pyrimidine-2,4,6(1H,3H,5H)-trione, 1,3-diethyl-5-[(1,3-diethyl-2,4,6-trioxoperhydro-5-pyrimidinyl)methylene]-128644-14-425
1216.812.90Thiosemicarbazide, 4-(1-adamantylcarbonyl)-300799-69-335
1317.031.09Thiosemicarbazide, 4-(1-adamantylcarbonyl)-300799-69-330
1417.301.861H-Pyrrole-2,4-dicarboxylic acid, 5-formyl-3-methyl-, diethyl ester002199-60-238
1517.610.59N-(5-Chloro-2-methoxy-phenyl)-2-(5-methoxy-1H-benzoimidazol-2-ylsulfanyl)-acetamide1000295-83-815
Total 100
Table 5. GC-MS results of the bio-crude oil obtained from HTL of TPW in water–ethanol medium at 250 °C, 30 min with KOH catalyst.
PKRTArea PctLibrary/IDCASQual
12.89850.8511Cyclopropane, ethenylmethylene-019995-92-737
23.159334.6287Acetic acid000064-19-790
33.42656.442Acetic acid, hydrazide001068-57-19
43.95469.6236Propylene Glycol000057-55-672
54.10093.3592-hydroxy-2-methyl-4-heptanone054862-91-843
64.34275.6599Acetamide, N-(aminoiminomethyl)-005699-40-150
74.46994.60552-Pentanone, 4-hydroxy-004161-60-864
84.62891.6247n-Capric acid isopropyl ester002311-59-327
94.90252.1625Pyrazine, 2,5-dimethyl-000123-32-053
105.07431.53472-Cyclopenten-1-one, 2-methyl-001120-73-630
115.144317.7941N,N-Dimethylacetamide000127-19-591
126.67120.9744Pyrazine, 2-ethyl-3,5-dimethyl-013925-07-038
137.24380.5655Ethanone, 1-(1-cyclohexen-1-yl)-000932-66-143
147.61910.43866-Methyl-2,3-dihydropyran-2,4-dione000541-98-049
1514.01932.1553-(Ethyl-hydrazono)-butan-2-one1000194-94-035
1614.39470.96342-Methylcyclohexylamine007003-32-927
1714.93551.9235Cyclohexane, 1,2,3-trimethyl-001678-97-325
1815.29811.7533Cyclohexa-2,4-dienecarboxylic acid, 4-hydroxy-1-methyl-6-oxo-, ethyl ester1000304-34-045
1915.47632.9403l-Proline, N-valeryl-, hexyl ester1000345-48-353
Total 100
Table 6. Elemental composition, ash and HHV of HTL feedstock and products.
SampleN/%C/%H/%S/%O/%Ash/%HHV/MJ/kg
TPW4.034.85.00.323.432.512.4
250-30-A5.531.84.11.930.925.812.3
Residue1.330.94.13.70.159.916.3
250-30-A-OF4.648.65.40.831.59.118.5
250-30-A-AF7.720.23.40.039.828.94.6
Table 7. Concentration of gaseous products (relative to N2 upon GC analysis) under various conditions.
EntryNameCH4COCO2N2
1250-30-A01.1712.9381.80
2250-30-B0.010.376.8688.99
3220-30-A0.010.7310.8886.43
4250-30-A01.1712.9381.80
5280-30-A0.022.458.2079.96
6250-15-A0.001.196.6883.02
7250-30-A01.1712.9381.80
8250-45-A0.012.1113.9682.66
9250-60-A0.011.2710.4085.72

