Article

Experimental and Computational Demonstration of a Low-Temperature Waste to By-Product Conversion of U.S. Oil Shale Semi-Coke to a Flue Gas Sorbent

1
Department of Mechanical Engineering, Boston University, 110 Cummington Mall, Boston, MA 02215, USA
2
Division of Materials Science & Engineering, Boston University, 15 Saint Mary’s St., Brookline, MA 02446, USA
3
Department of Biological and Environmental Engineering, Cornell University, 226 Riley-Robb Hall, Ithaca, NY 14853, USA
*
Author to whom correspondence should be addressed.
Energies 2018, 11(11), 3195; https://doi.org/10.3390/en11113195
Submission received: 28 September 2018 / Revised: 3 November 2018 / Accepted: 13 November 2018 / Published: 17 November 2018
(This article belongs to the Special Issue Computational Fluid Dynamics (CFD) 2018)

Abstract

:
The volatility of crude oil prices incentivizes the use of domestic alternative fossil fuel sources such as oil shale. For ex situ oil shale retorting to be economically and environmentally viable, we must convert the copious amounts of semi-coke waste to an environmentally benign, useable by-product. Using acid and acid + base treatments, we increased the surface area of the semi-coke samples from 15 m2/g (pyrolyzed semi-coke) to upwards of 150 m2/g for hydrochloric acid washed semi-coke. This enhancement in porosity and surface area is accomplished without high temperature treatment, which lowers the overall energy required for such a conversion. XRD analysis confirms that chemical treatments removed the majority of dolomite while retaining other carbonate minerals and maintaining carbon contents of approximately 10%, which is greater than many fly ashes that are commonly used as sorbent materials. SO2 gas adsorption isotherm analysis determined that a double HCl treatment of semi-coke produces sorbents for flue gas treatment with higher SO2 capacities than commonly used fly ash adsorbents. Computational fluid dynamics modeling indicates that the sorbent material could be used in a fixed bed reactor to efficiently remove SO2 from the gas stream.

1. Introduction

Over the past several decades, significant fluctuations in oil prices have motivated the search for alternative energy sources including both fossil and renewable fuels. One such alternative fossil fuel is oil shale, which is a sedimentary rock containing proportionally large amounts of kerogen or organic matter. Pyrolysis (heating in an oxygen-free environment) allows for the extraction of the confined kerogen from oil shale, which leaves compacted solid rock as a waste product. The separated organics are further converted to crude oil for various energy applications. The U.S. Geological Survey reports that overall U.S. oil shale reserves comprise about 2.6 trillion barrels of oil from which 1 trillion barrels are recoverable [1].
The waste rock left after kerogen recovery is known as semi-coke, which is a semi-carbonaceous char that poses an environmental threat [2]. Heavy metals, polycyclic aromatic hydrocarbons, and phenols present in the semi-coke can leach into groundwater and contaminate the surrounding areas. Semi-coke mountains created after oil shale extraction present a physical environmental danger [3,4,5,6,7,8]. Mountains of semi-coke dot the Estonian landscape where oil shale is used to generate a majority of the country’s electricity. This makes identifying alternatives to open disposal environmentally necessary to address past use and economically necessary to enable future use in ex situ retorts. Transforming the solid waste remaining after oil extraction could improve the environmental—and fiscal—outlook for this alternative fossil fuel.
Prior research demonstrates the ability to convert the by-products of oil shale use—both ash and semi-coke—to sorbent systems. For example, the ash resulting from complete oil shale oxidation has shown promising adsorption abilities to remove pesticides from liquids [9]. Al-Asheh and co-workers were able to activate semi-coke with CO2, ZnCl2, and OH to remove phenols from liquid phases [10]. Yet, high amounts of heavy metals and polycyclic hydrocarbons present make the industrial use of semi-coke in aqueous solutions without further treatment questionable [11,12]. However, there is the possibility to utilize semi-coke for flue gas treatment if its surface area can be increased [1]. Specifically, it has been proposed that semi-coke could be used for industrial scale removal of SO2, NOx, and NH3 from flue gas streams [13]. As suggested by Kaljuvee et al., the presence of carbonaceous materials in semi-coke makes it possible to adsorb large quantities of SO2 without the addition of CaO or limestone, which is usually used for sulfur emission control [14]. According to Yan et al., semi-coke activation with HCl and KOH allows SO2 gas to be adsorbed onto the surface of the semi-coke [15]. However, prior work details two difficulties in converting semi-coke to sorbents. These include dealing with the minerals naturally present in oil shale and costly processing steps—including additional heat inputs—to develop porosity and adsorption surface area to produce high-capacity flue gas sorbents [2].
This work examines the possibility of converting semi-coke waste from a U.S. domestic oil shale to a sorbent material for sulfur dioxide gas treatment via a low temperature activation (less than 100 °C) process rather than the high temperature physical and chemical mechanisms that prevail in the literature (500 °C to 900 °C) [10,13,16,17,18], which saves on energy costs. In the present work, hydrochloric acid (HCl) and potassium hydroxide (KOH) are used as chemical treatments. Prior work shows that using HCl and KOH (and other acids and bases) in combination with high temperature treatment produces high surface area adsorbents at high energy penalties while developing hot caustic gases [6,9,10]. The present work is the first to demonstrate the potential to use low-temperature chemical activation of oil shale semi-coke to produce sorbent materials with adsorption capacities for SO2 higher than commonly used coal fly ashes. Using experimental data for SO2 adsorption to the oil shale sorbent, a computational fluid dynamics (CFD) model of a fixed bed reactor was developed to demonstrate the potential of the material for commercial scale up. This work demonstrates a novel, less energy intensive waste to by-product conversion technology for solid waste management that eliminates the need for current open air storage of semi-coke and that could enable domestic oil shale to generate its own materials for flue gas capture, which increases the economic and environmental viability of oil shale as an alternative fossil fuel.

2. Materials and Methods

Oil shale rocks were obtained from the Piceance Basin, Colorado, USA, part of the Uinta formation with an average Fisher Assay oil yield of 20–40 GPT [19]. A random sampling of heterogeneous rocks were crushed by using a hydraulic press into small (<1 cm) particles. These particles were further ground by using a planetary ball mill (Across International) and stainless steel milling balls for 1 h at 1200 rpm. The resulting powder was separated using ASTM brass sieves on a sieve shaker. Particles between 150 and 250 µm were used in this study to (1) limit heat and mass transfer limitations during the simulated retorting [20], (2) to enable eventual production of a powdered activated sorbent material, and, (3) since it represented over 50 vol% of the ground particles, to yield sufficient experimental quantities. The raw sample was labeled “Oil Shale” (OS).
To extract oil from the oil shale (mimicking ex situ retorting via slow pyrolysis under laboratory controlled, reproducible processes as commonly done in the literature [8,11,21]), it was heated in a porcelain boat in a 2-inch horizontal tube furnace (MTI Corporation GSL-100X) under an inert high purity nitrogen atmosphere flowing at 100 mL/min. Samples were heated to 110 °C and held for 30 min to remove residual moisture, and then heated to 600 °C at 10 °C/min and held for one hour to extract kerogen. The resultant solid semi-carbonaceous “waste” particles were labeled “semi-coke” (SC).

2.1. Chemical Activation

Chemical activation of semi-coke with HCl and KOH, which is usually followed by a heat treatment, is known to open pores and remove minerals, which would facilitate SO2 gas capture [4]. The oil shale semi-coke samples were subjected to three different chemical treatments: single HCl, double HCl, and HCl + KOH. First, semi-coke was washed with 2M HCl (trace metal grade) for 2 h at 60 °C; 6 mL of HCl was used for every 1 g of semi-coke to completely submerge the samples. After soaking, they were vacuum filtered and dried overnight in a laboratory oven at 80 °C. This sample was labeled “SC-HCl”. For double HCl activation, 6 mL of 2M HCl was added to each gram of the SC-HCl sample, soaked at 60 °C for 2 h, and dried. This sample was named “SC-HCl-HCl”.
In the case of KOH activation, a similar technique to Yan et al. was used [15] to determine the necessity of using a base treatment in addition to the acid treatment. In this case, samples treated once with HCl were immersed in 3M KOH solution for 2 h at 6 °C. For every 1 g of a sample, 9 mL of KOH solution was used. Samples were then filtered and transferred into 1M HCl solution (1 g: 17 mL) for 1 h at 80 °C to wash and remove residual potassium ions (K+). This sample was named “SC-HCl-KOH”.

2.2. Characterization of Activated Semi-Coke Samples

The impact of the chemical treatments on the resulting activated semi-cokes was probed using a suite of characterization techniques. The BET surface areas were measured using an Autosorb-iQ (Quantachrome Instruments), according to established methods [6,11]. Additionally, 0.1–0.2 g of powder were outgassed at 180 °C overnight with the sample mass measured post-degas on a Sartorius semi-microbalance to the ±0.1 mg. Nitrogen adsorption isotherms (77 K) were used to determine the surface area using a multi-point BET method. A total of 11 points were measured over a partial pressure range of P/P0 = 0.05–0.30.
Thermal stability and proximate analysis were measured by thermo-gravimetric analysis (TGA) differential scanning calorimetry (DSC) (Mettler-Toledo TGA-DSC-1). Between 5 and 15 mg of the sample were placed in 70 μL alumina crucibles to measure the weight change as a function of temperature. The experiment was performed under a constant temperature ramp rate of 10 °C/min. Samples were first heated to 110 °C under a nitrogen atmosphere (50 mL/min flow with a 20 mL/min N2 balance protective gas flow) and held at this temperature for 30 min to start with a dry baseline. After that, they were heated to 900 °C and held for 1 h under a nitrogen atmosphere. Mass loss at this temperature was attributed to volatile matter. The temperature was increased to 950 °C and air was introduced into the system to oxidize the samples for 10 min. The oxidized mass loss is considered to be fixed carbon (entrained in mineral matter (e.g., CaCO3). The remaining mass is attributed to inorganic content, which is loosely called “ash”.
Scanning Electron Microscopy (Zeiss Supra 55VP) was utilized to qualitatively observe the effects of acid-base activation treatments. Powder samples were placed on double-sided copper tape to insure conductivity and grounding. The change of mineral composition was determined by vertical powder CuKα X-Ray diffraction at 40 kV and 40 mA with a step size of 0.05° and dwell time of 0.5 s (Bruker D8 Discover). Since the instrument operates vertically, the powder was affixed to the sample holder using Kapton tape. A diffraction pattern of pure Kapton tape was subtracted from the sample results.

2.3. Application of Activated Semi-Coke to Flue Gas Treatment

To determine the effectiveness of the proposed by-product conversion pathway, TGA was used to measure the rate and quantity of SO2 gas removed from a gas stream at various temperatures. A gas tank consisting of 2.026 mol% SO2 (±0.02%) and balance ultra-high purity N2 (Airgas) was used as the inlet gas to the TGA at a flow rate of 50 mL/min. Carbonaceous (and semi-carbonaceous) materials are promising adsorbents at flue gas precipitator temperatures of 60–150 °C [22]. To ensure a constant baseline for all samples, moisture was removed by heating and holding samples at 110 °C under a nitrogen atmosphere for 30 min, which was followed by heating/cooling of the sorbent sample to the desired temperature under N2. Upon reaching the desired temperature, the SO2 gas mixture was introduced into the TGA. The experiment was performed at 40 °C, 60 °C, 80 °C, 110 °C, and 150 °C and held at these temperatures for 1 h to determine the amount of gas adsorbed to each material.
The kinetics of isothermal adsorption were fit to a second order equation.
d q d t = k ( q e q ) 2  
The linearized form of Equation (1) is shown below.
  t q t = 1 k q e 2 + 1 q e t  
where qe and qt are the mass of SO2 adsorbed per gram of carbon (mg/g) at equilibrium and time t (seconds), respectively, and k (s−1(mg/g)−1) is the rate constant. To determine the enthalpy and entropy of the adsorption, we use a linearized Arrhenius Equation.
  ln ( k ) = ln ( k 0 ) E a R 1 T  
where Ea is the activation energy (kJ/mol), R is the universal gas constant (8.314 J/mol/K), k0 is an independent temperature factor (s−1(mg/g)−1), and T is the absolute temperature (K).

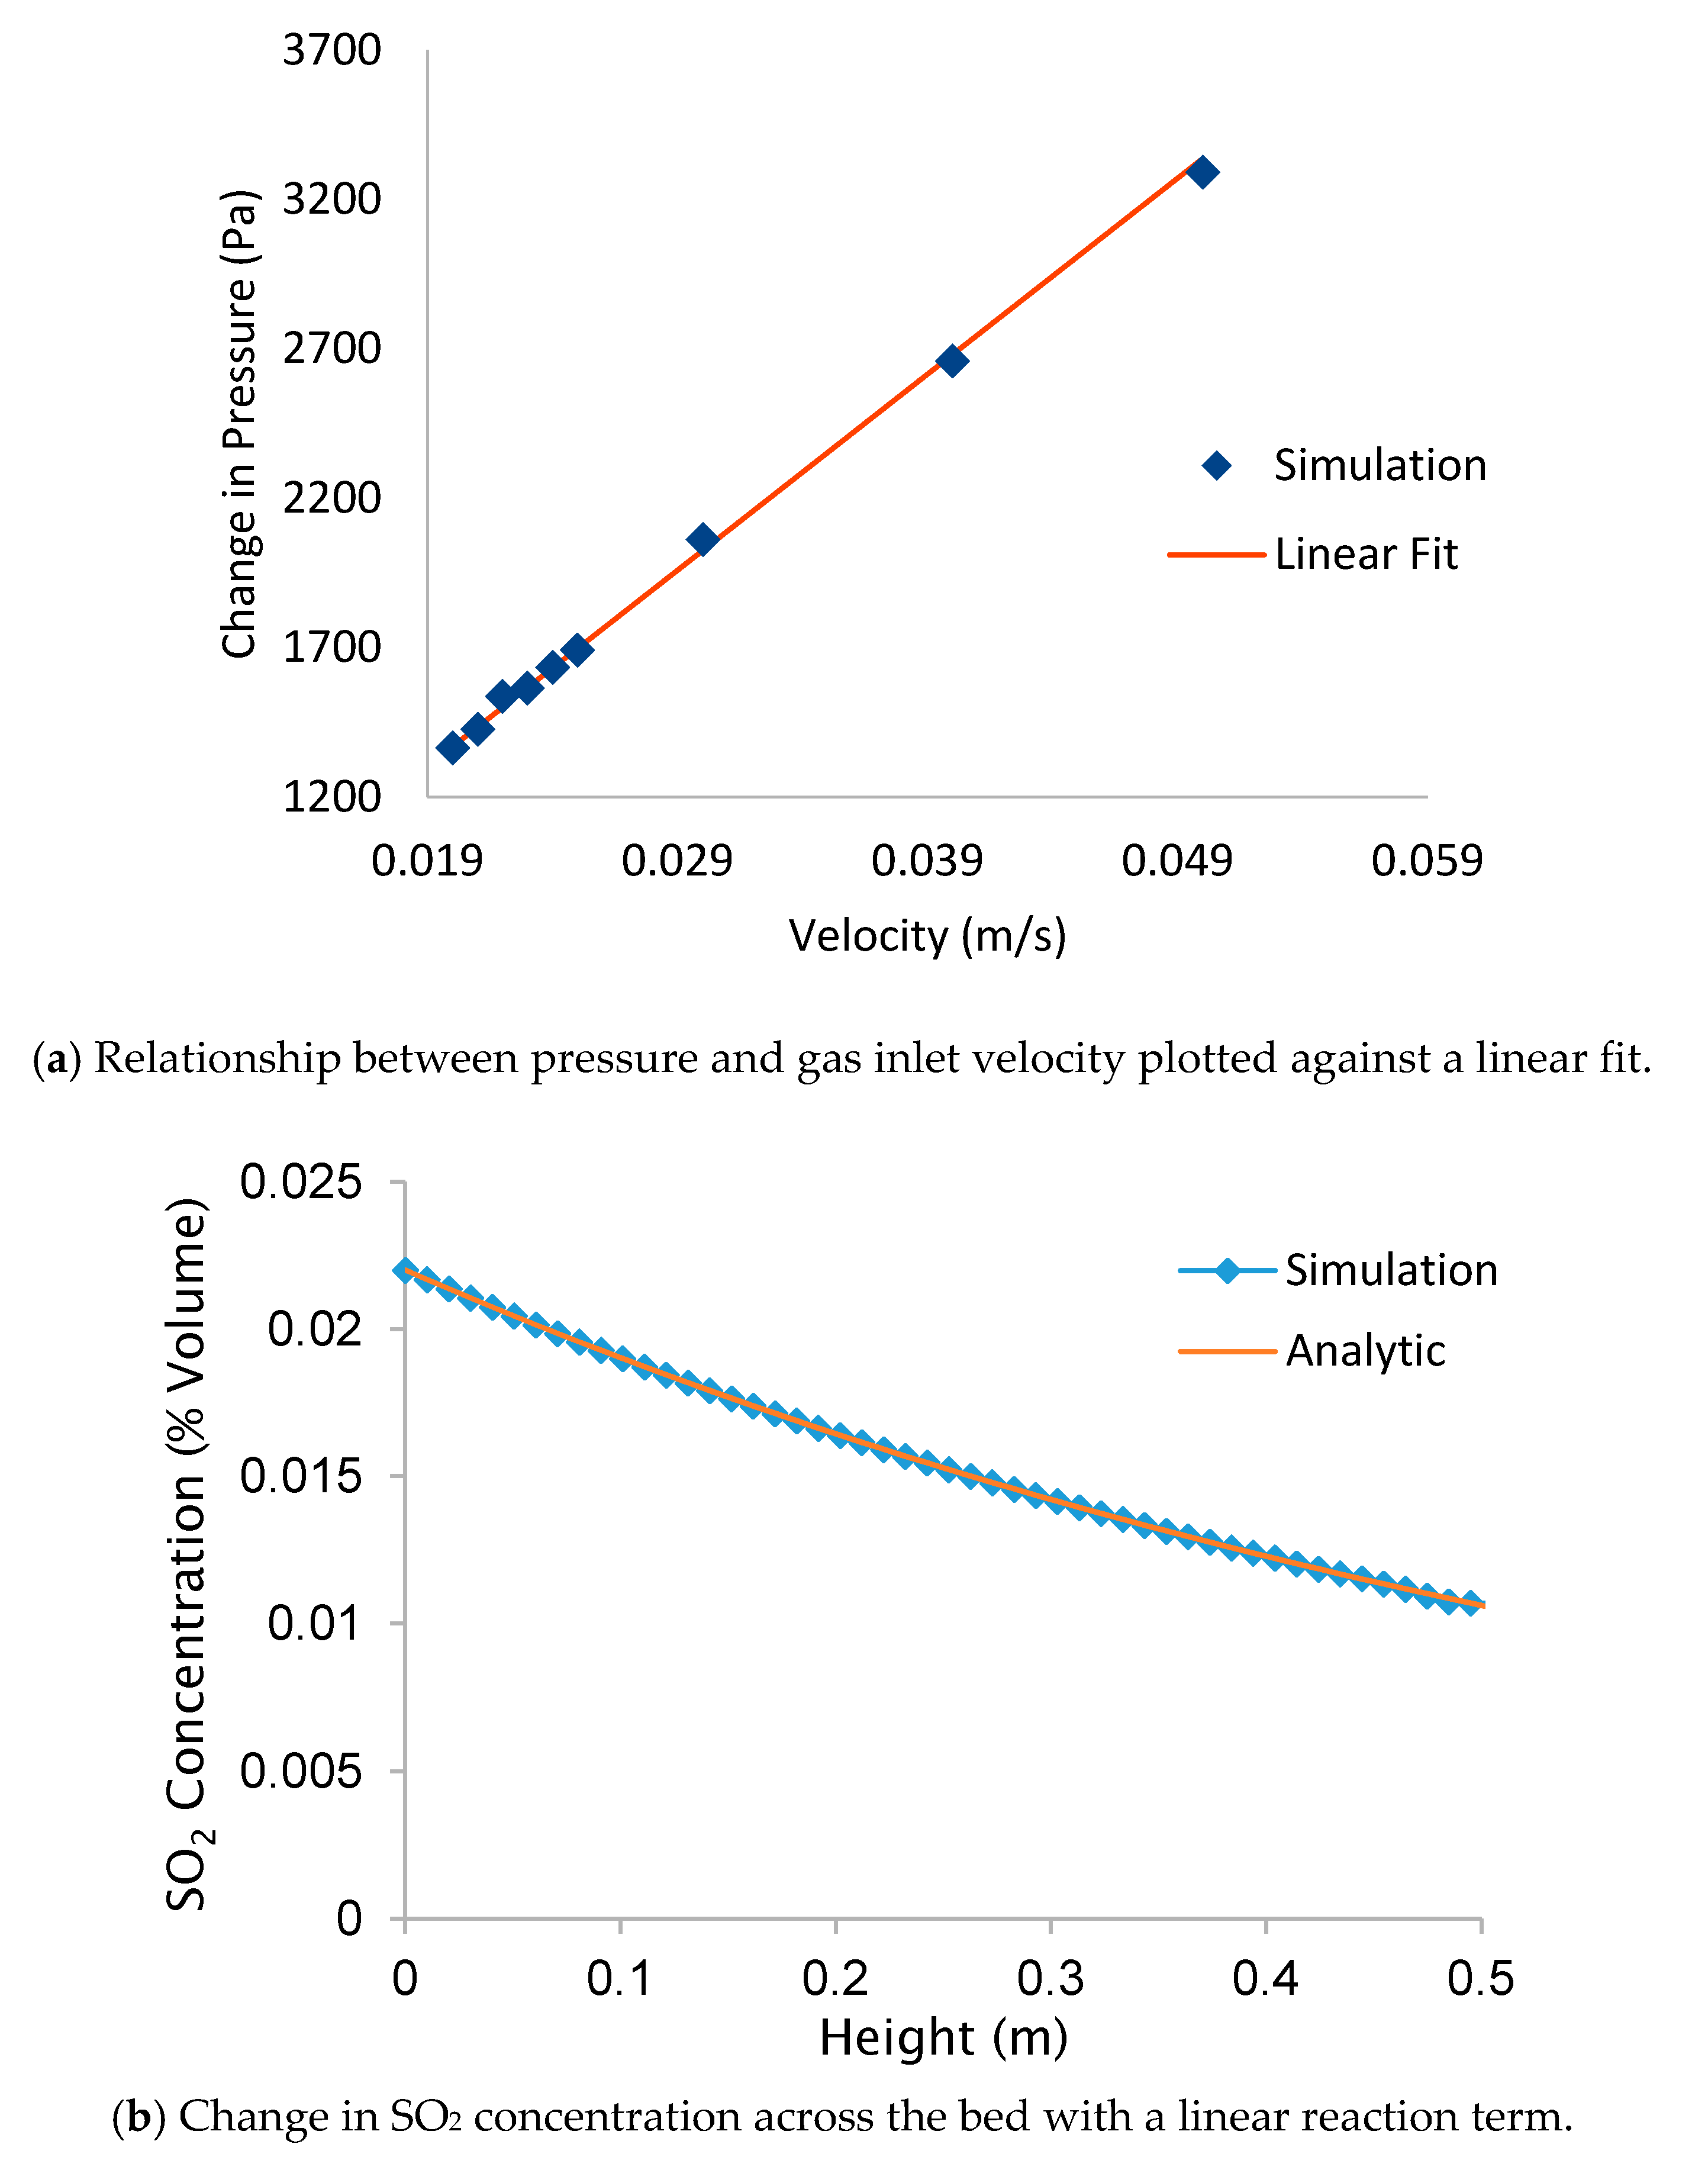
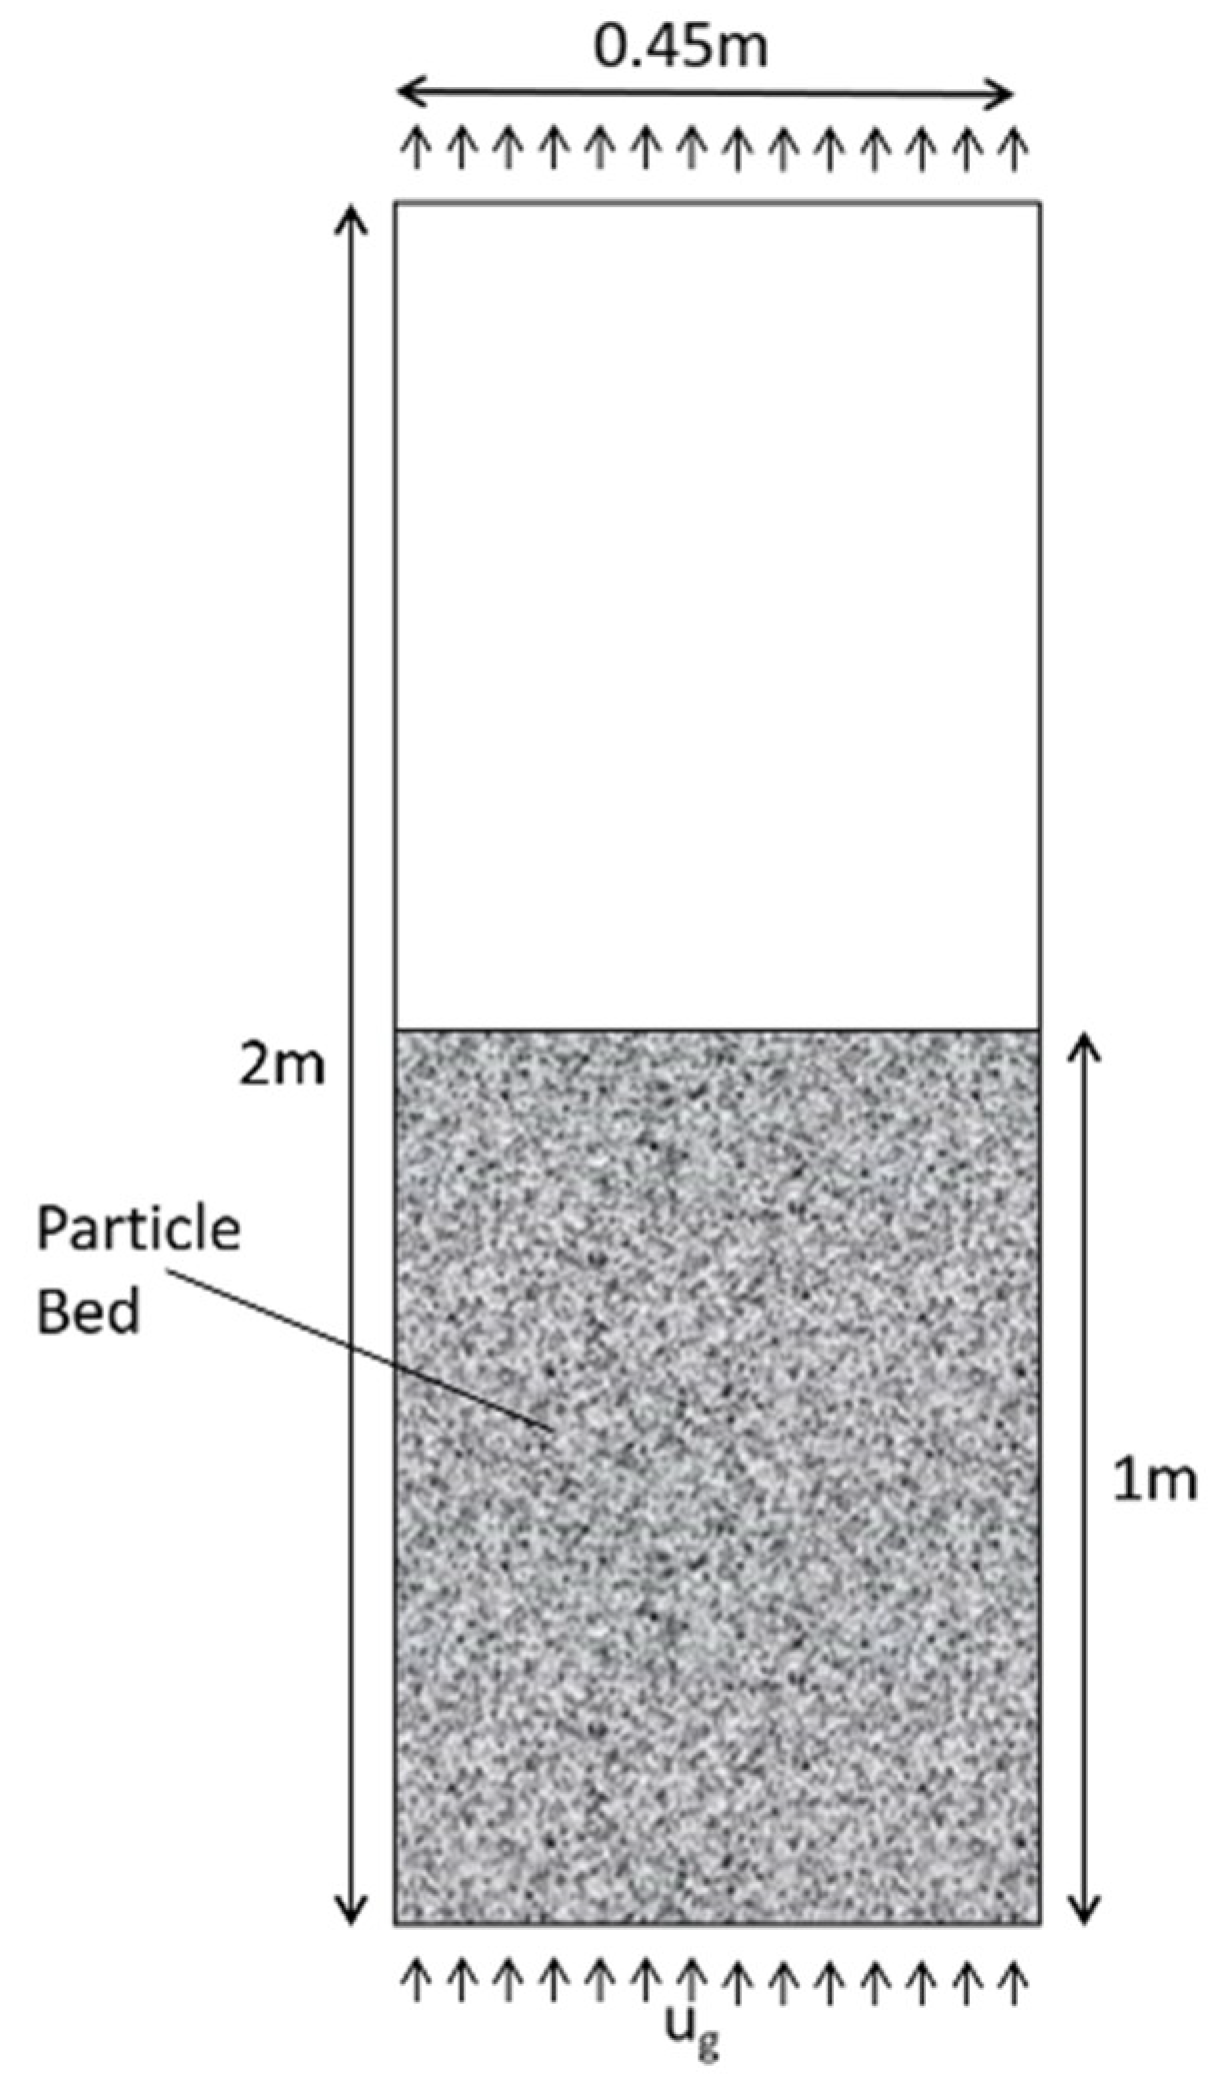
2.4. Computational Modeling of SO2 Adsorption at a Pilot Scale

To demonstrate the applicability of these semi-coke sorbents to remove SO2 from simulated flue gas streams at a pilot scale, we turn to computational fluid dynamics (CFD) modeling. The modeling was completed using OpenFOAM version 4.1, which is an open source CFD solver [23]. A two fluid model (TFM) was used to simulate a fixed bed reactor with the sorbent particles being one phase and the flue gas being the other. The TFM is a common method of modeling fluidized and fixed beds due to the similarities between fluid motion and particle interactions [24,25] In the TFM, the governing equations are solved for each phase and the phases are coupled through constitutive relations such as the granular temperature and drag models. Detailed descriptions of the method and its validity for modeling fixed and fluidized beds can be found in the literature [26,27,28]. Other methods of solving multiphase systems such as the volume of the fluid (VOF) method use one set of governing equations with averaged properties from all the phases. Although VOF methods are popular in other applications, the TFM method is more effective for gas-particle systems because of the large differences in gas and particle motion within the system.
Before implementing the SO2 adsorption model in the OpenFOAM TFM code, the hydrodynamics and reactions implemented in the CFD model were verified by using two test cases. The first verifies the relationship between gas velocity and change in pressure across the bed, which, in a fixed bed, should be linear (as shown in Figure 1a, velocity and pressure were found to vary linearly over a range of velocities with an average error of 0.9% and a maximum error of 1.8%). The second verification case considers the implementation of the reaction term. A reaction term with a simplified linear dependence on SO2 concentration was tested at low gas flows and steady state conditions. For this case, an analytical solution can be derived from the mass transfer equation.
( α ρ ) t +   u · ( α ρ ) =   2 ρ + R
where R = Qα and takes the form shown below.
  α ( y ) =   α 0 e Q u ρ y  
where Q is a constant reaction coefficient, u is the velocity, α is the volumetric concentration of SO2 in the gas, ρ is density, y is the position in the bed, and α0 is the SO2 concentration at the inlet. As seen in Figure 1b, the CFD simulation predicts the SO2 concentration over the bed with almost no deviation from the analytical solution.
Based on these two cases, we verified that the TFM model can simulate the hydrodynamics of a fixed bed with the implementation of the multiphase reaction term. For the sorbent materials fabricated and characterized in this paper, the CFD model is used to demonstrate their use on a pilot scale system. The CFD model implements the reactions outlined in Section 2.3 for the source term R from Equations (4) and (5), which is shown below.
( α ρ ) t +   u · ( α ρ ) =   2 ρ +   k q e 2 t 1 + k q e t  
To investigate the ability of semi-coke to adsorb SO2 on a larger scale, the double HCl semi-coke was simulated at varying temperatures and velocities and the SO2 breakthrough curves are compared for each condition. The reactions were modeled to represent the semi-coke performance after the initial start-up was completed. The simulations were brought to steady flow conditions prior to the addition of any reaction terms to best represent the conditions in the physical experiments.

3. Results and Discussion

While most techniques to “activate” semi-carbonaceous materials in the literature use high temperatures to increase surface area and capacity, the present investigation probes the feasibility of using low-temperature activation to convert a U.S. oil shale semi-coke to a sorbent material for the removal of SO2 from flue gases. This byproduct conversion could potentially reduce the environmental burden and increase the economic feasibility of this alternative fossil fuel.

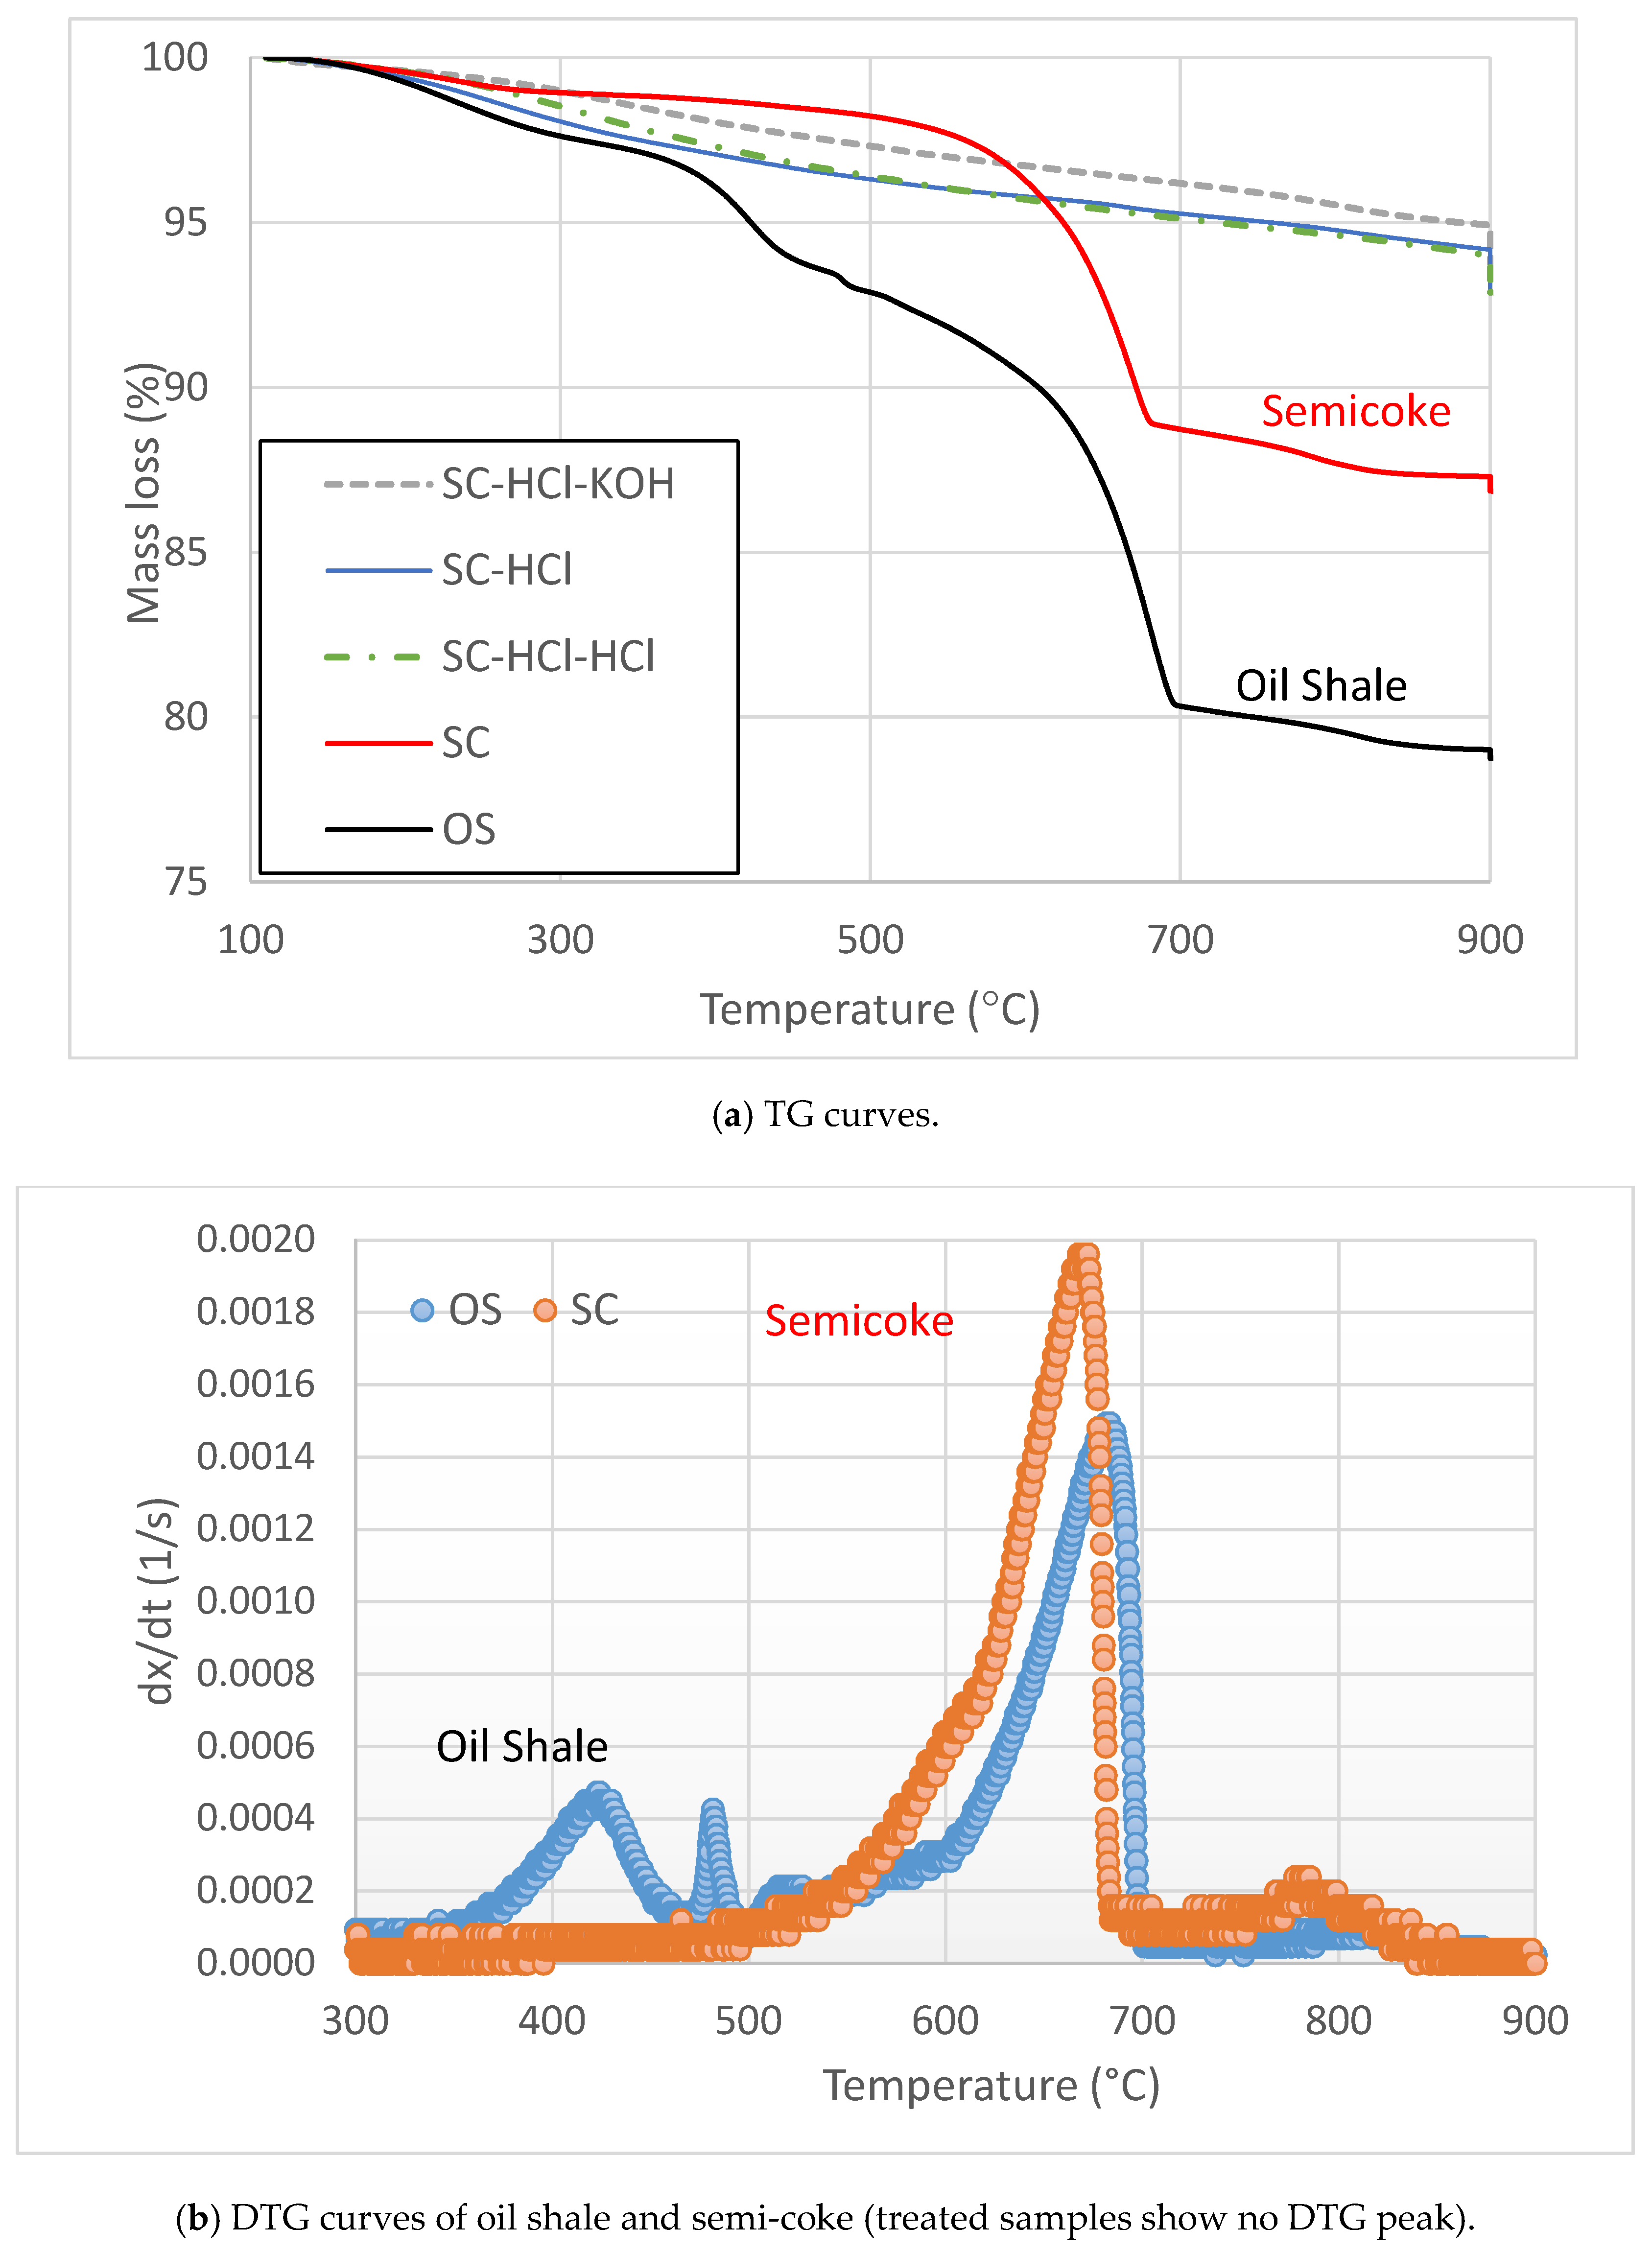
3.1. Impact of Activation on Semi-Coke

As shown in Table 1, the surface area of oil shale semi-coke increases with progressive low-temperature treatments. The starting surface area of the raw shale is relatively low but doubles upon pyrolysis. When kerogen is removed during extraction, the pores of the remaining semi-carbonaceous solid open [1]. Treatment with HCl increases the surface area six-fold while decreasing the volatile carbon content (as compared to semi-coke). The decrease in the amount of volatile matter is likely due to the acid etching a portion of the carbon present and the increase in surface area likely due to dissolution of the carbonate materials opening pore spaces [1]. BET surface areas increase with further chemical treatments from 89 m2/g for single HCl treatment to a high of 159 m2/g for the double HCl activation method. This is likely due to the partial reduction of mineral content. We probe this proposed explanation using TGA and XRD to describe the materials’ composition.
The results of the thermogravimetric analysis under pyrolysis conditions are presented in Figure 2 to provide a comparison of thermal stability [29,30]. At temperatures above 200 °C, organic matter is lost. We see a sharp decrease in mass up to 700 °C with a peak temperature of about 680 °C for OS and SC samples, which is shown in the derivative thermogravimetric (DTG) curves. As seen in Figure 2a, only the raw and pyrolyzed samples show significant mass loss while activated ones do not have intense changes in mass. This suggests that the chemical treatments removed some volatile compounds from the samples. DTG curves show no peak (therefore, we present only DTG curves for oil shale and semi-coke). Since the raw sample contains minerals and organic matter in a heterogeneous matrix, there are three peaks in mass loss rate at 420 °C, 480 °C, and 680 °C. For the pyrolyzed sample, we only see a peak at 670 °C. Since this sample was already heated to 600 °C, the majority of the volatiles are driven out of the sample and, thus, we would only expect to see a peak above the pyrolysis temperature. The largest peaks for the semi-coke may indicate the presence of minerals, which are subsequently removed with chemical activation since the DTG curves show no peaks.
Scanning Electron Microscopy images are shown in Figure 3. Qualitatively, we see an amorphous structure with large particles for the oil shale, which gives low surface area and high volatile carbon content as discussed. Overall, the chemically activated samples show similar morphology with porous void spaces and moderately less amorphous character than the raw oil shale, which is supported by the increase in surface area.
Figure 4 shows the crystallographic structures present in powdered samples and the relative impact of the activation treatments on demineralization of the semi-coke samples. We note that the signals for some minor peaks are not identifiable given the heterogeneity and small concentrations in the samples. This analysis is to understand the overarching crystallinity changes in the samples. The oil shale diffraction pattern contains strong peaks for dolomite and calcite compounds, which indicates elevated concentrations of these minerals in the oil shale rock. When the shale is pyrolyzed, some of the minerals are removed by heat treatment, which was also noted by prior research in the field [1]. The acid-base activation increases the relative quartz concentration in the samples. Since no silicon compounds were added during activation, the increase in quartz concentration is relative with respect to the decrease in other minerals’ concentration. The XRD analysis software identified some peaks in the raw sample as pollucite (shown in Figure 4 as x). Given that pollucite is a zeolite material that is not normally naturally occurring, we suspect it may be an isomer such as analcime with Na rather than Cs [31].

3.2. Ability of Semi-Coke Sorbents to Adsorb SO2

The results of the thermogravimetric analysis for SO2 gas adsorbed at five temperatures are shown in Figure 5. As noted in the literature, carbonaceous materials are predominantly responsible for SO2 gas adsorption [14]. Therefore, we normalize milligrams of gas adsorbed per gram of carbon (fixed carbon + volatile matter) present. The isotherms can be divided into two regions with fast adsorption in the beginning and slow adsorption thereafter. The initial rates for fast adsorption are presented in Table 2. The transition between regions was considered to be the change in slope of the adsorption data away from the near vertical, which is shown in Figure 5a. The cut-off for this transition can be seen in Figure 5a and estimated from Table 2. For example, the initial rate for SC-HCl, 60 °C adsorption is 30 mg/gC/min, and the amount adsorbed over this first rate is 30 mg/gC, which makes this first adsorption step 1 minute long. The initial adsorption rates are quite close for all samples at a given temperature (e.g., at 40°, the uptake rate is 27, 28, and 34 mg/gC/min for the SC-HCl, SC-HCl-HCl, and SC-HCl-KOH samples, respectively). The SO2 uptake rate during this initial stage increased for all three samples from 40 °C to 60 °C adsorption conditions but then decreased as the temperature increased. As seen in Figure 5b, the highest adsorption capacities were at the lowest temperature for all samples and they decreased as the temperature increased. It is well established that lower temperatures are more conducive to adsorption [13,30,32,33,34].
After this initial fast adsorption period, the maximum amount of SO2 adsorbed was achieved after about 15 min for all samples (at which point, the mass remained constant for all samples for the next ~40 min). The total amount of SO2 adsorbed depends on the activation treatment, which is shown in Table 3, with SC-HCl-HCl having the highest adsorption capacity at each temperature. This second, slow isotherm region persists for a much longer period than the fast absorption region and, as such, is considered the normal operating region for the sorbent material in a pilot or commercial scale reactor (and is, therefore, used in the CFD models).
A pseudo-second order kinetic model describes the adsorption isotherms quite well in the second adsorption region. A plot of t/qt versus time results in a straight line fit with a regression coefficient of at least 0.999 for all data (with the exception of 150 °C). The theoretical qe (maximum adsorption), experimental qe, and corresponding second order rate constants for the slower adsorption region are presented in Table 3. Only the values for isotherms conducted between 40 and 110 °C are reported since there is negligible adsorption capacity at 150 °C, which leads to a poor fit of the kinetic model. Additionally, activation energies are calculated based on the second order rate constants by plotting ln(k) versus 1/T where the slope gives an estimate of the activation energy presented in Table 3. Anecdotally, the desorption of SO2 was monitored via TGA since every sample was ramped down to 25 °C under a high flow of N2 (100 mL/min) at the completion of every experiment. All samples lost at least 97% of the SO2 within five minutes of the temperature reaching 30 °C (the high flow rate of SO2-free gas shifting the equilibrium to draw SO2 to the gas phase), which suggests a strong possibility for reuse and regeneration via simple temperature or pressure swing desorption. This will be explored further in future work.
The SC-HCl-HCl semi-coke shows the highest adsorption capacity among the three chemically treated samples. We note that surface area might be the reason for the enhanced adsorption since we see the same trend for the BET surface area and maximum amount of SO2 adsorbed (SC-HCl-HCl > SC-HCl-KOH > SC-HCl). Kisiela et al. compared the adsorption abilities of activated lignite fly ash and industrially available sorbents at 100 °C with a maximum of 4.5 mg SO2 per g of sample on activated coke [35], which is used industrially in hazardous waste plants [36]. Martyniuk et al. note an adsorption capacity of up to 30 mg/g of SO2 at 20 °C and 20 mg/g of SO2 at 100 °C onto a char produced from ortho-coking coal at 600 °C [32]. As such, the semi-coke sorbents produced here at low temperature demonstrate higher adsorption capacities than many previously demonstrated waste-to-sorbent converted materials. We turn to CFD models to probe the applicability of these semi-coke samples to industrially relevant flue gas treatment.

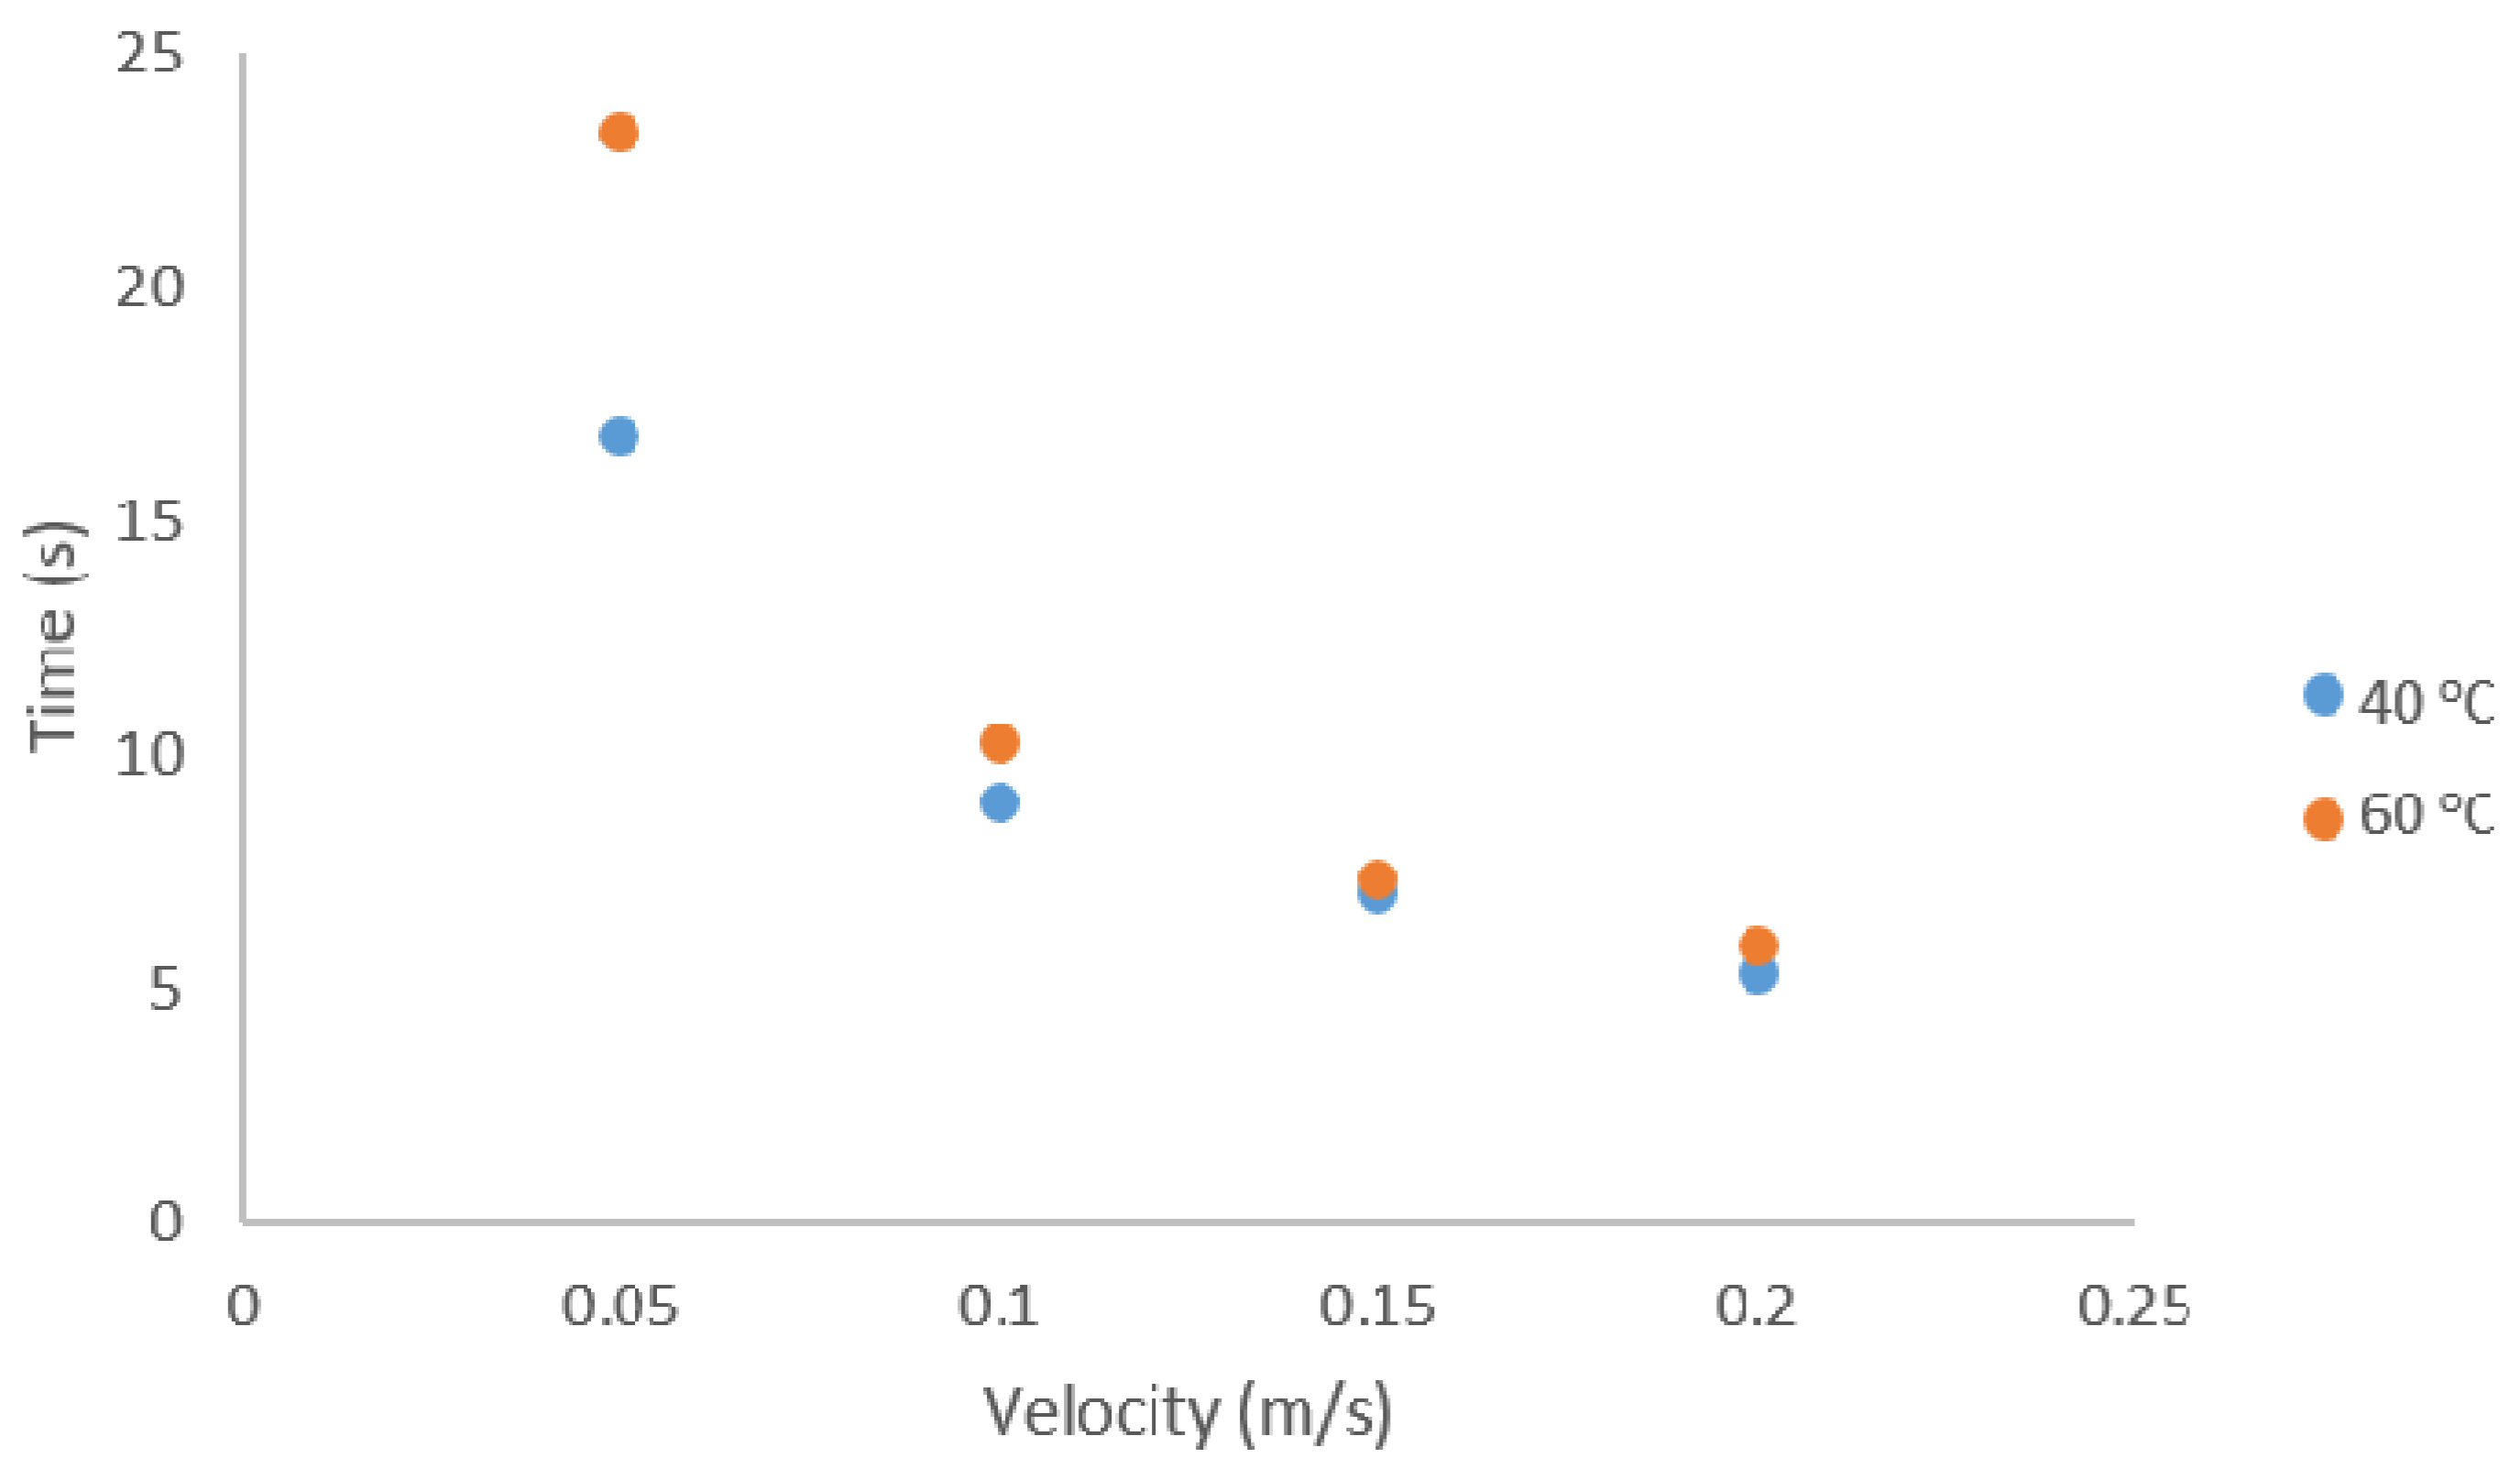
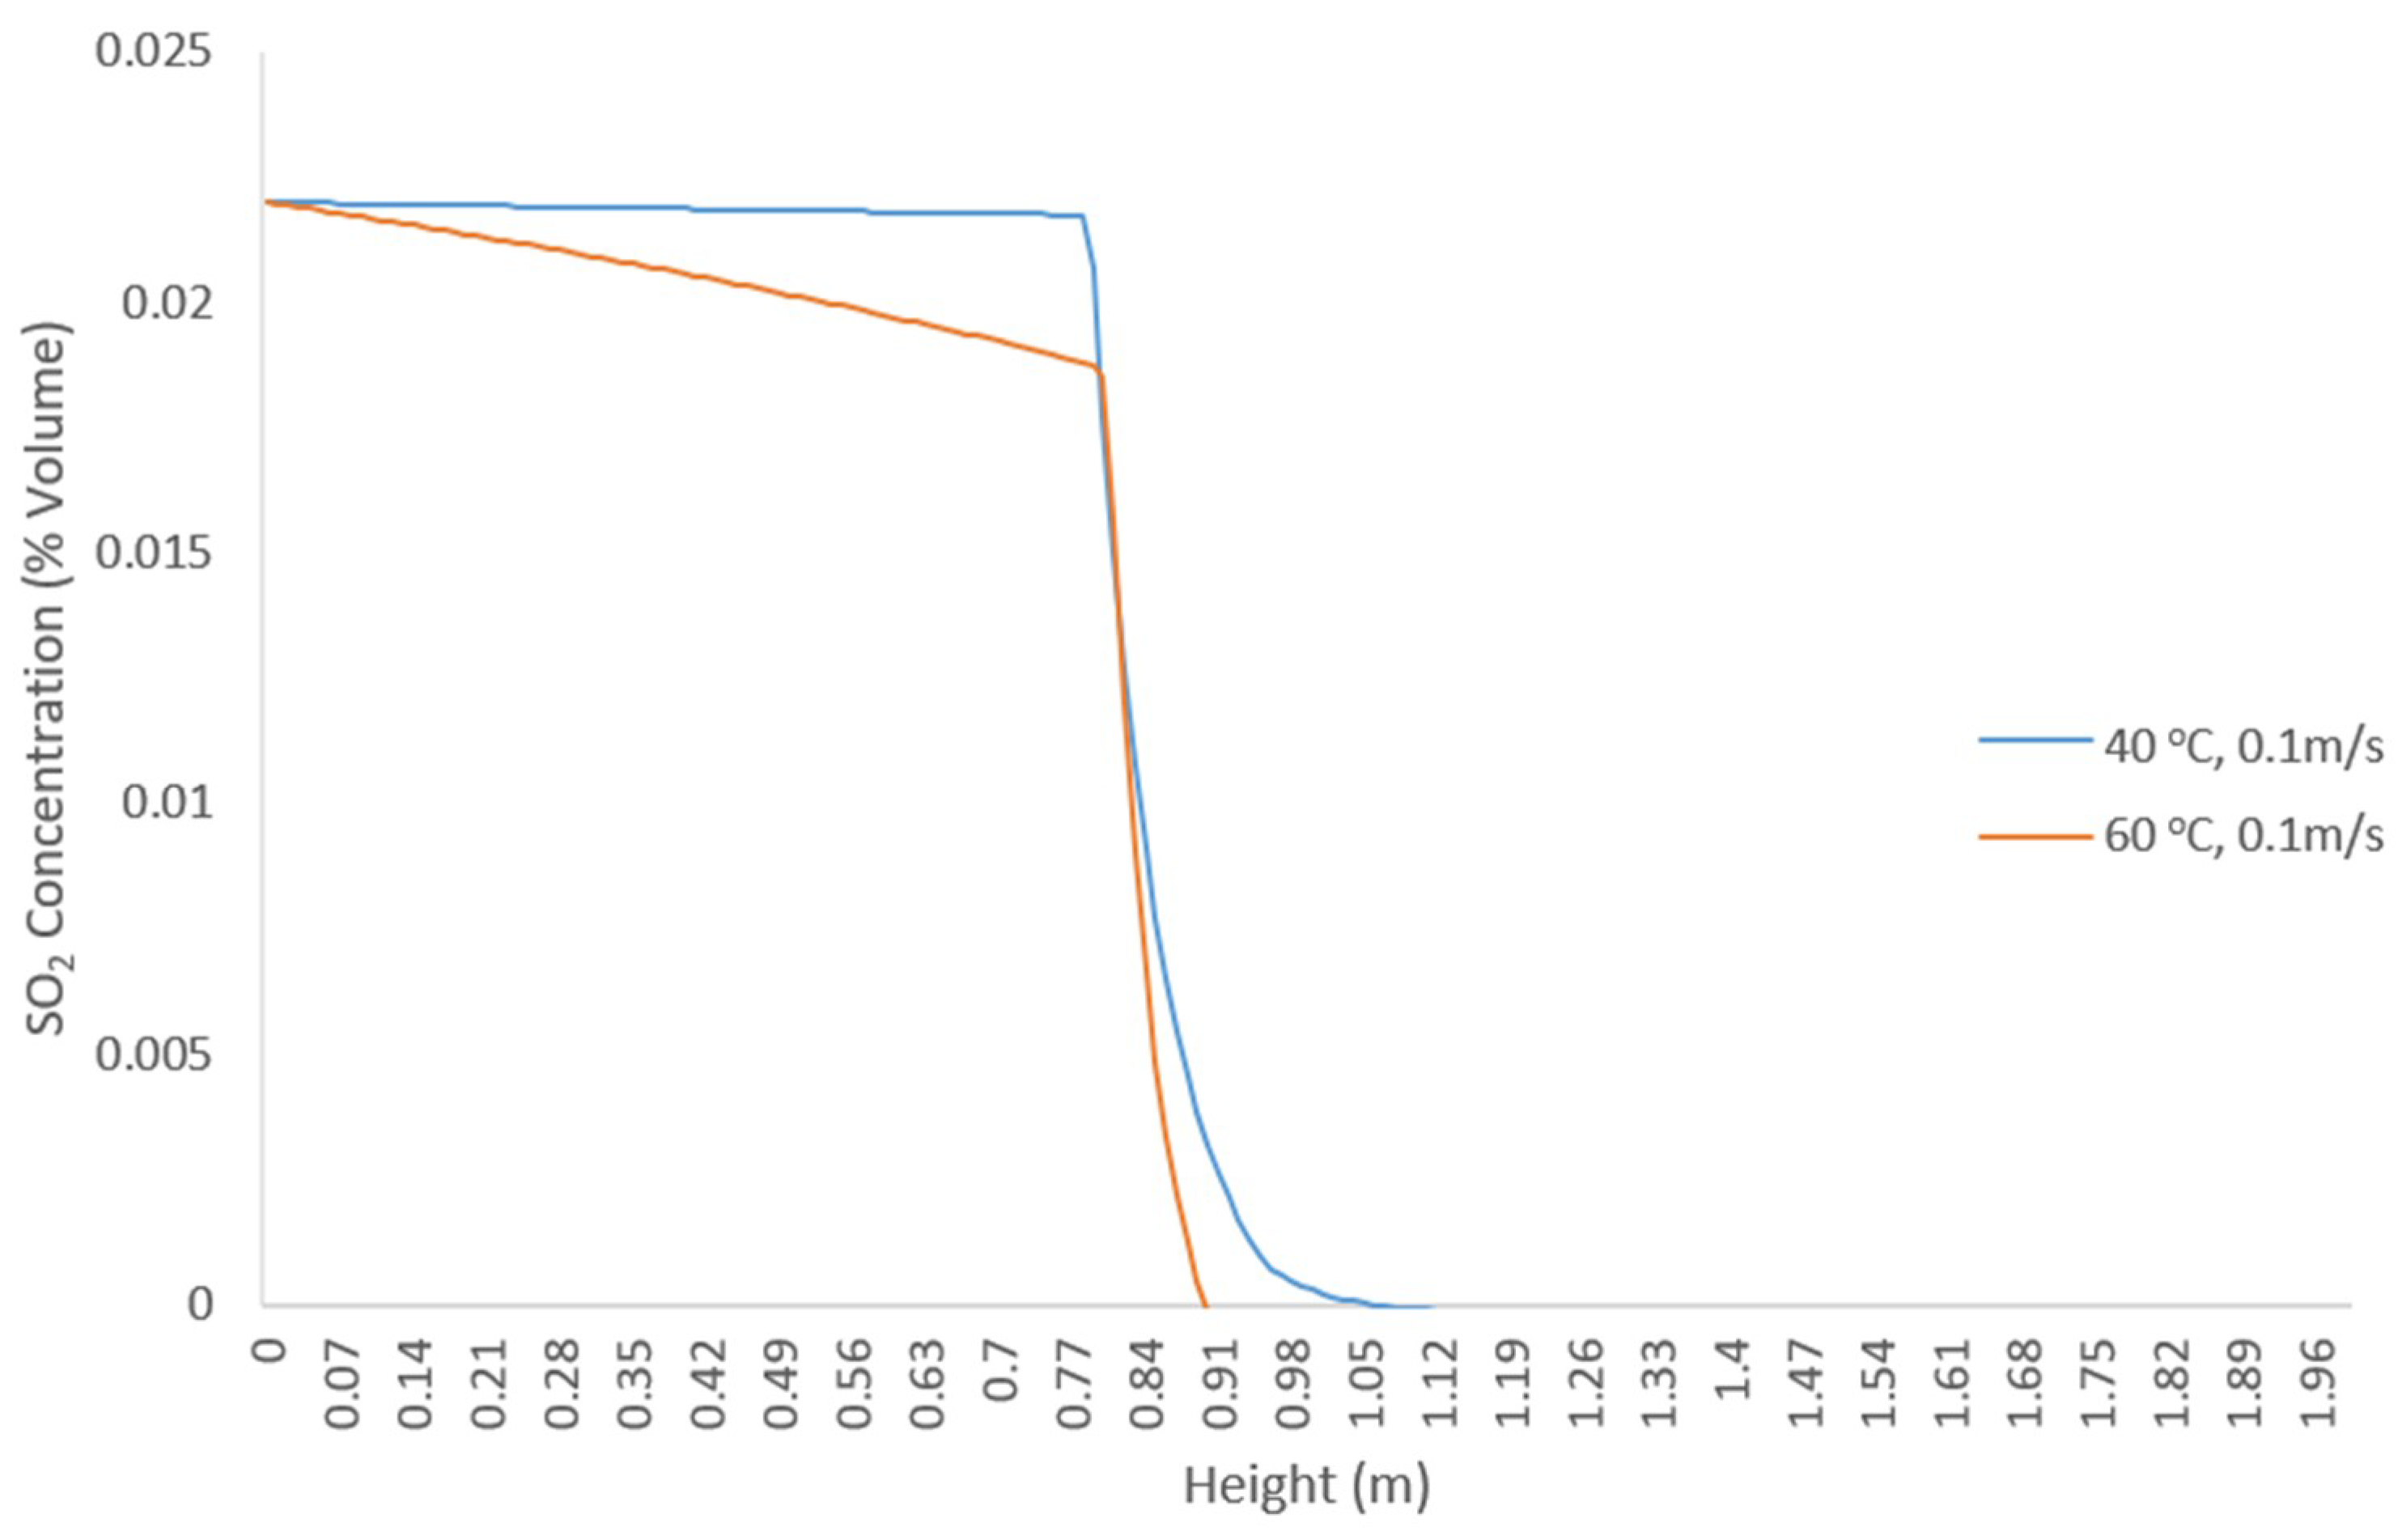
3.3. Simulated Pilot Scale Removal of SO2 Using Semi-Coke Sorbents

The CFD simulation described in Section 2.4 is used to simulate a pilot scale system and demonstrate the ability of the semi-coke sorbents to effectively remove SO2 from a representative flue gas stream. A pilot scale fixed bed reactor was simulated. The reactor is 0.45 m by 2 m and is initiated with a particle bed 1 m deep and 0.2 mm particle size, which is shown in Figure 6. The simulation was initialized without SO2 until steady state flow conditions were reached at which point, a mixture of nitrogen and 2.026% (by volume) SO2 was introduced at the inlet and run until about 50% of the SO2 escaped the bed. As described in Section 3.2, the reaction is based on the experimental pseudo-second order kinetic model and uses the parameters from Table 3 for the reaction rates and adsorption capacity.
Figure 7 shows the distribution of SO2 throughout the bed at several snapshots in time. At t = 0, SO2 is introduced to the bed and, by roughly 12 s, the bed reaches a breakthrough point where approximately 10% of the SO2 is leaving the bed. This is due to the saturation of sorbent particles in the bed. At lower velocities, the residence time of SO2 in the bed is longer, which allows even more SO2 to be adsorbed by the sorbent particles and breakthrough to be reached even sooner.
The simulations also show that lower temperatures show a higher adsorption capability and a slower reaction rate. In the experimental data, it is shown that the equilibrium SO2 adsorption is much higher at 40 °C than at 60 °C. This indicates that the sorbent has a higher SO2 capacity at 40 °C than at 60 °C. However, when the adsorption rate (k) is considered, which increases with a rising temperature, we find that the time needed for adsorption increases. Thus, while the lower temperatures can adsorb more SO2, the higher temperatures successfully adsorb more SO2 in a shorter period. This can be seen in Figure 8 where the concentration across the bed at a specific time is shown for 40 °C and 60 °C.
In Figure 9, the time taken for 10% of the SO2 to escape the particle bed is plotted against the inlet velocity of the gas. Time in the figure begins at the end of the start-up period when the SO2 started flowing through the bed. As seen in Figure 9, it takes longer for the SO2 to break the top of the bed at 60 °C than it does at 40 °C. At high velocities, for both temperatures, the time taken for the SO2 to break the bed surface is approximately the same as the time it would take the SO2 to reach the top of an empty bed without adsorption. This indicates that a slower velocity is needed to ensure SO2 capture. In the design of the pilot system, the CFD model can be used to optimize a bed design based on temperature and flow rate. As seen in these preliminary CFD simulations, there are tradeoffs between the capacity and the flow rate.

4. Conclusions

The present work demonstrates the potential to use a low-temperature treatment method to convert oil shale semi-coke—an environmentally hazardous waste—to a flue gas adsorbent at considerably less harsh conditions than current conditions proposed in the literature. The activation treatments lead to a large increase in surface area, which range from 6 to 11 times higher than the raw semi-coke. Flue gas adsorption experiments conducted via TGA demonstrate the possible use of the chemically activated samples for SO2 gas adsorption. Approximately 120 mg of SO2 gas per gram of carbon present in the sorbent can be adsorbed at 40 °C. Among the three different activation procedures, a double HCl treatment shows the greatest adsorption capacity, which is considerably higher than many coal-based materials currently used for flue gas treatment.
The CFD simulations demonstrate the ability of the sorbent materials to remove SO2 from a flue gas mixture in a fixed bed. The simulations show that the choice of operating temperature and velocity is a tradeoff between overall capacity and residence time. Future work will explore the scalability of the proposed byproduct conversion pathway by using expanded CFD simulations and adsorption-desorption experiments. Continuing experimental work on the process design for byproduct conversion should consider the composition and potential for recycling the HCl stream, the optimization of HCl concentration and temperature, and desorption studies for regeneration and reuse of the sorbent.

Author Contributions

The following contributions were made by each author. K.D.: Responsible for computational model, validation of model with experimental data, computational figures. E.M.R.: Supervisor for K.D., re-drafted computational results and discussion, and validated computational models. A.S.: Performed experimental work and data analysis, drafted portions of introduction, and made experimental figures. J.L.G.: Supervisor for A.S., drafted introduction and experimental results and discussion, validated experimental work, and ran statistical analyses.

Funding

Partial funding for this research was provided by a Clare Boothe Luce Foundation Graduate Fellowship.

Conflicts of Interest

The authors declare no conflict of interest.

References

  1. Vyas, A.; Xue, J.; Goldfarb, J.L. Improving the Environmental and Economic Viability of U.S. Oil Shale via Waste-to-Byproduct Conversion of Semicoke to Sorbents. Energy Fuels 2016, 30, 188–195. [Google Scholar] [CrossRef]
  2. Brendow, K. Global Oil Shale Issues and Perspectives. In Proceedings of the Synthesis of the Symposium on Oil Shale, Tallinn, Estonia, 18–19 November 2002. [Google Scholar]
  3. Datangel, B.; Goldfarb, J.J.L. Heavy Metals in Colorado and Chinese Oil Shale Semicoke: Disposal Issues, Impediments to Byproduct Conversion. Energy Fuels 2011, 25, 3522–3529. [Google Scholar] [CrossRef]
  4. Han, X.X.; Jiang, X.M.; Cui, Z.G. Study of the Combustion Mechanism of Oil Shale Semicoke in a Thermogravimetric Analyzer. J. Therm. Anal. Calorim. 2008, 92, 595–600. [Google Scholar] [CrossRef]
  5. Kahru, A.; Põllumaa, L. Environmental Hazard of the Waste Streams of Estonian Oil Shale Industry: An Excotoxicological Review. Oil Shale 2006, 23, 53–93. [Google Scholar]
  6. Trikkel, A.; Kuusik, R.; Martins, A.; Pihu, T.; Stencel, J.M. Utilization of Estonian Oil Shale Semicoke. Fuel Process. Technol. 2008, 89, 756–763. [Google Scholar] [CrossRef]
  7. Wang, Q.; Sun, B.; Wu, X.; Bai, J.; Sun, J. Influence of Retorting Temperature on Combustion Characteristics and Kinetic Parameters of Oil Shale Semicoke. Oil Shale 2006, 23, 328–339. [Google Scholar]
  8. Goldfarb, J.L.; D’Amico, A.; Culin, C.; Suuberg, E.M.; Külaots, I. Oxidation Kinetics of Oil Shale Semicokes: Reactivity as a Function of Pyrolysis Temperature and Shale Origin. Energy Fuels 2013, 27, 666–672. [Google Scholar] [CrossRef]
  9. Al-Qodah, Z.; Shawaqfeh, A.T.; Lafi, W.K. Adsorption of Pesticides from Aqueous Solutions Using Oil Shale Ash. Desalination 2007, 208, 294–305. [Google Scholar] [CrossRef]
  10. Al-Asheh, S.; Banat, F.; Masad, A. Physical and Chemical Activation of Pyrolyzed Oil Shale Residue for the Adsorption of Phenol from Aqueous Solutions. Environ. Geol. 2003, 44, 333–342. [Google Scholar] [CrossRef]
  11. Külaots, I.; Goldfarb, J.L.; Suuberg, E.M. Characterization of Chinese, American and Estonian Oil Shale Semicokes and Their Sorptive Potential. Fuel 2010, 89, 3300–3306. [Google Scholar] [CrossRef]
  12. Nicolini, J.; Pereira, B.F.; Pillon, C.N.; Machado, V.G.; Lopes, W.A.; de Andrade, J.B.; Mangrich, A.S. Characterization of Brazilian Oil Shale Byproducts Planned for Use as Soil Conditioners for Food and Agro-Energy Production. J. Anal. Appl. Pyrolysis. 2011, 90, 112–117. [Google Scholar] [CrossRef]
  13. Liu, Q.; Li, C.; Li, Y. SO2 Removal from Flue Gas by Activated Semi-Cokes: 1. The Preparation of Catalysts and Determination of Operating Conditions. Carbon 2003, 41, 2217–2223. [Google Scholar] [CrossRef]
  14. Kaljuvee, T.; Kuusik, R.; Trikkel, A. SO2 Binding into the Solid Phase during Thermooxidation of Blendsestonian Oil Shale Semicoke. J. Therm. Anal. Calorim. 2003, 72, 393–404. [Google Scholar] [CrossRef]
  15. Yan, Z.; Liu, L.; Zhang, Y.; Liang, J.; Wang, J.; Zhang, Z.; Wang, X. Activated Semi-Coke in SO2 removal from Flue Gas: Selection of Activation Methodology and Desulfurization Mechanism Study. Energy Fuels 2013, 27, 3080–3089. [Google Scholar] [CrossRef]
  16. Li, J.; Kobayashi, N.; Hu, Y. The Activated Coke Preparation for SO2 Adsorption by Using Flue Gas from Coal Power Plant. Chem. Eng. Process. Process Intensif. 2008, 47, 118–127. [Google Scholar] [CrossRef]
  17. Liu, Q.; Guan, J.S.; Li, J.; Li, C. SO2 Removal from Flue Gas by Activated Semi-Cokes: 2. Effects of Physical Structures and Chemical Properties on SO2 Removal Activity. Carbon 2003, 41, 2225–2230. [Google Scholar] [CrossRef]
  18. Shangguan, J.; Li, C.H.; Miao, M.Q.; Yang, Z. Surface Characterization and SO2 Removal Activity of Activated Semi-Coke with Heat Treatment. New Carbon Mater. 2008, 23, 37–43. [Google Scholar] [CrossRef]
  19. Self, J.G.; Brownfield, M.E.; Johnson, R.C.; Mercier, T.J. Fischer Assay Histograms of Oil Shale Drill Cores and Cuttings from the Uinta Basin, Utah and Colorado. Available online: https://www.google.com.tw/url?sa=t&rct=j&q=&esrc=s&source=web&cd=1&cad=rja&uact=8&ved=2ahUKEwiworSMu9DeAhWKgrwKHfiDBXYQ7gEwAHoECAkQCA&url=https%3A%2F%2Ftranslate.google.com.tw%2Ftranslate%3Fhl%3Dzh-TW%26sl%3Den%26u%3Dhttps%3A%2F%2Fpubs.usgs.gov%2Fdds%2Fdds-069%2Fdds-069-bb%2FREPORTS%2F69_BB_CH_5.pdf%26prev%3Dsearch&usg=AOvVaw2zVMPts0VZ6mIlrN8UHXT1 (accessed on 27 September 2018).
  20. Patnaik, A.S.; Goldfarb, J.L. Continuous Activation Energy Representation of the Arrhenius Equation for the Pyrolysis of Cellulosic Materials: Feed Corn Stover and Cocoa Shell Biomass. Cellul. Chem. Technol. 2016, 50, 311–320. [Google Scholar]
  21. Williams, P.T.; Ahmad, N. Influence of Process Conditions on the Pyrolysis of Pakistani Oil Shales. Fuel 1999, 78, 653–662. [Google Scholar] [CrossRef]
  22. Richter, E. Carbon Catalysts for Pollution Control. Catal. Today 1990, 7, 93–112. [Google Scholar] [CrossRef]
  23. Weller, H.; Greenshields, C.; de Rouvray, C. OpenFOAM v.4.1. 2016. Available online: https://openfoam.org/version/4-1/ (accessed on 27 September 2018).
  24. Hoomans, B.P.B.; Kuipers, J.A.M.; Briels, W.J.; van Swaaij, W.P.M. Discrete Particle Simulation of Bubble and Slug Formation in a Tow-Dimensional Gas-Fluidised Bed: A Hard Sphere Approach. Chem. Eng. Sci. 1996, 51, 99–118. [Google Scholar] [CrossRef]
  25. van der Hoef, M.A.; van Sint Annaland, M.; Kuipers, J.A.M. Computational Fluid Dynamics for Dense Gas–Solid Fluidized Beds: A Multi-Scale Modeling Strategy. Chem. Eng. Sci. 2004, 59, 5157–5165. [Google Scholar] [CrossRef]
  26. Ergun, S. Fluid Flow through Packed Columns. Chem. Eng. Progr. 1952, 48, 89–94. [Google Scholar]
  27. Gidaspow, D. Multiphase Flow and Fluidization: Continuum and Kinetic Theory Descriptions; Academic Press: San Diego, CA, USA, 1994. [Google Scholar]
  28. Wen, C.Y.; Yu, Y.H. A Generalized Method for Predicting the Minimum Fluidization Velocity. AIChE J. 1966, 610–612. [Google Scholar] [CrossRef]
  29. Miao, Z.; Wu, G.; Li, P.; Zhao, N.; Wang, P.; Meng, X. Combustion Characteristics of Daqing Oil Shale and Oil Shale Semi-Cokes. Min. Sci. Technol. 2009, 19, 380–384. [Google Scholar] [CrossRef]
  30. Sun, B.Z.; Wang, Q.; Shen, P.Y.; Qin, H.; Li, S.H. Kinetic Analysis of Co-Combustion of Oil Shale Semi-Coke with Bituminous Coal. Oil Shale 2012, 29, 63–75. [Google Scholar] [CrossRef]
  31. Jing, Z.; Cai, K.; Li, Y.; Fan, J.; Zhang, Y.; Miao, J.; Chen, Y.; Jin, F. Hydrothermal Synthesis of Pollucite, Analcime and Their Solid Solutions and Analysis of Their Properties. J. Nucl. Mater. 2017, 488, 63–69. [Google Scholar] [CrossRef]
  32. Martyniuk, H.; Wieckowska, J. The Effect of Coal Rank and Carbonization Temperature on SO2 Adsorption Properties of Coal Chars. Fuel 1997, 76, 563–565. [Google Scholar] [CrossRef]
  33. Davini, P. Adsorption of Sulphur Dioxide on Thermally Treated Active Carbon. Fuel 1989, 68, 145–148. [Google Scholar] [CrossRef]
  34. Lisovskii, A.; Shter, G.; Semiat, R.; Aharoni, C. Adsorption of Sulfur Dioxide by Active Carbon Treated by Nitric Acid: II. Effect of Preheating on the Adsorption Properties. Carbon 1997, 35, 1645–1648. [Google Scholar] [CrossRef]
  35. Kisiela, A.M.; Czajka, K.M.; Moroń, W.; Rybak, W.; Andryjowicz, C. Unburned Carbon from Lignite Fly Ash as an Adsorbent for SO2 Removal. Energy 2016, 116, 1454–1463. [Google Scholar] [CrossRef]
  36. Jastrząb, K. Properties of Activated Cokes Used for Flue Gas Treatment in Industrial Waste Incineration Plants. Fuel Process. Technol. 2012, 101, 16–22. [Google Scholar] [CrossRef]
Figure 1. Verification of the computational model for fluidized bed hydrodynamics and a reaction term.
Energies 11 03195 g001
Figure 2. Thermogravimetric analysis of raw, pyrolyzed, and demineralized samples for pyrolysis of samples at 10 °C/min under high purity nitrogen.
Energies 11 03195 g002
Figure 3. SEM images of oil shale samples at 10,000 magnification to illustrate increasing chemical treatment on development of porosity and loss of crystalline “structured” components (scale bar indicates 1 µm).
Energies 11 03195 g003
Figure 4. Cu-Kα X-ray diffraction pattern of raw, semi-coke, and demineralized samples. Q, D, and C indicate Quartz, Dolomite, and Calcite, respectively. x was suggested by analysis software as pollucite, which is unlikely given its zeolite structure and non-natural occurrence.
Energies 11 03195 g004
Figure 5. Isothermal adsorption of SO2 to activated semi-coke samples.
Energies 11 03195 g005
Figure 6. Schematic of initial setup for pilot scale simulation. The gray shaded area represents the region in which sorbent particles are originally placed.
Energies 11 03195 g006
Figure 7. Time progression of SO2 at 60 °C with a velocity of 0.1m/s. The dark line indicates the top of the particle bed.
Energies 11 03195 g007
Figure 8. Comparison of SO2 concentration across the bed between 40 °C and 60 °C at a velocity of 0.1 m/s.
Energies 11 03195 g008
Figure 9. Time taken for 10% of the SO2 to break through the top of the bed.
Energies 11 03195 g009
Table 1. Surface area and carbon contents of raw, semi-coke and demineralized samples (± 1 standard deviation).
SampleBET Surface Area
m2/g
Volatile Carbon
wt%
Fixed Carbon
wt%
Ash
wt%
OS8.2 ± 0.321.24 ± 0.400.28 ± 0.0178.48 ± 1.49
SC15.4 ± 1.313.50 ± 0.260.36 ± 0.0386.14 ± 1.64
SC-HCl89.0 ± 1.59.37 ± 0.170.30 ± 0.0190.33 ± 1.11
SC-HCl-HCl159.2 ± 3.29.77 ± 0.881.12 ± 0.0389.11 ± 8.50
SC-HCl-KOH123.7 ± 4.17.34 ± 0.491.03 ± 0.0791.63 ± 6.12
Table 2. Initial fast adsorption rates for SO2 capture on activated semi-cokes (± 1 standard deviation).
Adsorption Temperature °CSC-HClSC-HCl-HClSC-HCl-KOH
Adsorption Uptake Rate
mg/(gC)/min
SO2 Adsorbed
mg/(gC)
Adsorption Uptake Rate
mg/(gC)/min
SO2 Adsorbed
mg/(gC)
Adsorption Uptake Rate
mg/(gC)/min
SO2 Adsorbed
mg/(gC)
4027 ± 0.353 ± 1.06428 ± 0.271 ± 0.934 ± 0.168 ± 0.488
6030 ± 0.730 ± 1.10630 ± 0.760 ± 2.364 ± 1.345 ± 1.543
8010 ± 0.528 ± 2.4417 ± 0.242 ± 0.913 ± 0.638 ± 2.862
1109.2 ± 0.513 ± 1.15911 ± 0.719 ± 2.29.1 ± 0.419 ± 1.494
1502.1 ± 0.15.3 ± 0.4962.3 ± 0.25.7 ± 0.92.9 ± 0.16.2 ± 0.409
Table 3. Rate constants and activation energies for pseudo-second-order kinetics of adsorption of SO2 onto demineralized samples (experimental values ± 1 standard deviation) (used in computational modeling to represent pilot scale operating conditions).
Adsorption Temperature °Cqe, Exp
mg/(gC)
qe, Model
mg/(gC)
k
(gC)/mg/min
SC-HCl
4076 ± 2791.3 × 10−2 ± 1.1 × 10⁻³
6060 ± 3639.9 × 10−3 ± 2.4 × 10⁻³
8036 ± 4366.3 × 10−2 ± 7.3 × 10⁻⁴
11021 ± 2226.7 × 10−2 ± 1.8 × 10⁻³
Ea28.9 ± 0.7 kJ/mol
SC-HCl-HCl
40115 ± 31223.9 × 10−3 ± 9.1 × 10⁻⁴
6084 ± 1861.4 × 10−2 ± 1.2 × 10⁻³
8056 ± 2572.6 × 10−2 ± 4.4 × 10⁻⁴
11028 ± 1264.0 × 10−2 ± 7.1 × 10⁻⁴
Ea32.5±1.3 kJ/mol
SC-HCl-KOH
4088 ± 1911.6 × 10−2 ± 5.2 × 10⁻⁴
6070 ± 3721.2 × 10−2 ± 7.3 × 10⁻⁴
8045 ± 2464.4 × 10−2 ± 8.3 × 10⁻⁴
11025 ± 2274.2 × 10−2 ± 1.0 × 10⁻³
Ea17.3 ± 1.1 kJ/mol

