Article

An Experimental and Theoretical Study of the Gasification of Miscanthus Briquettes in a Double-Stage Downdraft Gasifier: Syngas, Tar, and Biochar Characterization

by
Tejasvi Sharma
1,*,
Diego M. Yepes Maya
2,
Francisco Regis M. Nascimento
2,
Yunye Shi
3,
Albert Ratner
1,
Electo E. Silva Lora
2,
Lourival Jorge Mendes Neto
2,
Jose Carlos Escobar Palacios
2 and
Rubenildo Vieira Andrade
2
1
Department of Mechanical Engineering, University of Iowa, Iowa, IA 52246, USA
2
Mechanical Engineering Institute, Federal University of Itajubá (UNIFEI), Itajuba, MG 37500-103, Brazil
3
Department of Engineering and Physics, St. Ambrose University, Davenport, IA 52803, USA
*
Author to whom correspondence should be addressed.
Energies 2018, 11(11), 3225; https://doi.org/10.3390/en11113225
Submission received: 16 October 2018 / Revised: 13 November 2018 / Accepted: 15 November 2018 / Published: 21 November 2018
(This article belongs to the Collection Bioenergy and Biofuel)

Abstract

:
The goal of this work is to understand the gasification process for Miscanthus briquettes in a double-stage downdraft gasifier, and the impact of different Equivalence Ratios (ER) on syngas, biochar, and tar characteristics. The optimal ER was found to be 0.35, which yielded a syngas maximum heating value of 5.5 MJ/Nm3 with a syngas composition of 20.29% CO, 18.68% H2, and 0.86% CH4. To better understand the observed behavior, an equilibrium reaction model was created and validated using the experimental data. The model showed that the heating value decreased with increasing ER, and that hydrogen production peaked at ER = 0.37, while methane (CH4) became negligible above ER = 0.42. Tar and particle content in the gas produced at a certain temperature can now be predicted. To assess the biochar characteristics, surface structure image analysis and a surface area porosity analysis were carried out. Employing images from a scanning electron microscope (SEM), the biochar cell bonds and pore structures were examined and analyzed. By using the Brunauer-Emmett-Teller (BET) analysis of the surface porosity, the surface area to be 186.06 m2/g and the micro pore volume was calculated to be 0.07 m3/g. The final aspect of the analysis involved an evaluation of tar production. Combining current and prior data showed a logarithmic relationship between the amount of tar produced and the gasifier bed temperature, where the amount of tar produced decreased with increasing bed temperature. This results in very low tar levels, which is one of the known advantages for a double-stage downdraft gasifier over a single-stage system.

1. Introduction

Today, 85% of the world’s energy demand is reached using conventional fossil fuel, which releases 56.6% of anthropogenic greenhouse gas emissions [1]. The development of renewable energy has been the focus of attention for several decades, because of its promise of energy independence and sustainability. A forecast in global demand predicts a 40% increase in energy demand around the world by 2030, as average standards of living rise. This is especially true for areas such as Sub-Saharan Africa, where currently only 290 million of 915 million inhabitants have access to electricity [2]. It is clear that different sustainable technologies have to be developed to achieve clean energy production. Biomass gasification is one of the possible routes through which carbon-neutral energy can be produced.
Gasification is a process that converts organic carbonaceous materials at high temperatures into a fuel gas containing carbon monoxide (CO), hydrogen (H2), methane (CH4), and carbon dioxide (CO2) [3]. Produced gases, with high concentrations of CO and H2 from the gasifier, can be fed into internal combustion engines for power production [4,5]. The syngas from the gasifier could be used for different purposes, such as producing chemical products, especially when it contains a high percentage of CO2 and CH4 [6]. The calorific value of the gas is dependent on the gasifying agent. The calorific value of the gas using air ranges between 4–7 MJ Nm−3, while when gasifying with pure oxygen, the heating value of the gas ranges between 12–28 MJ Nm−3 [4]. There are many useful products of biomass gasification, including syngas, heat, power, biofuels, fertilizer, and biochar [4].
The application of gasification can be found in several projects around the world, ranging from large industrial-scale projects (energy output in MW) to small-scale projects (in kW). Some examples of large-scale projects are the Harboøre and Güssing plants in Denmark and Austria respectively [7]. Examples of small-scale downdraft gasifier commercial manufacturers include ALL Power Labs, Entrade (both located in California), and Ankur gasifiers (based in India). According to the International Energy Agency (IEA), there are a total of 141 gasification plants (114 operational, 14 on hold and 13 under construction). Out of the 141 plants which produce syngas as their end product, 106 of the 141 are used for power production (about 356 MW electric power and 185 MW thermal power), 24 are for liquid fuel production, seven are used for gaseous fuel, and eight for chemical production as end product [8].
There are three types of gasifiers: fixed bed, fluidized bed, and entrained flow gasifiers. Fixed bed gasifier plants can produce up to 10 MW, and are classified as updraft (fuel enters from top, gasifying agent from the bottom) and downdraft gasifiers (both fuel and a gasifying agent from the bottom) [4]. A tremendous advantage of using a downdraft gasifier is its ability to produce minimal amounts of tar. Tar is one of the byproducts of gasification that is present in the gas, and it exits the gasifier in the form of vapor. The presence of these tars (organic impurities) in the fuel gas is one of the main technical barriers in biomass gasification [9,10,11]. With time, if not filtered, high amounts of tar may clog the fuel supply system of an internal combustion engine. These tars can condense into a complex structure in exit pipes and heat exchangers, which can lead to choking and attrition. This can lead to a decrease in efficiency and a potential increase in cost process [10]. The amount of tar coming out from a gasifier can be controlled through internal and external methods. The internal methods consist of limiting tar production within a gasifier by using a catalyst (such as Fe2O3 and Al2O3) [12], or by improving the gasifier operation [10]. The external methods consist of filtering the gas exiting the gasifier to reduce tar [13]. This does not interfere with the process in the reactor, and as such, the quality of the product gas is not affected. A combination of both internal and external methods can significantly reduce tar production.
Previous studies by Bui et al. [14] suggest that double-stage downdraft gasifiers could produce up to forty times less tar than a single-stage downdraft gasifier. Other studies done by Galindo et al. [15] show that the low amount of tar in a double-stage downdraft gasifier is linked to the increase in temperature in the pyrolysis and combustion zones.
Biochar (or charcoal) is a product of pyrolysis. Biochar has numerous benefits: it increases net carbon sequestration, reduces N2O emissions from the soil, and increases soil fertilizer intake [16]. The surface area of the biochar is an important component, as it traps spores and bacteria [17], which can allow increases in nutrient absorption by plants. One study found the surface areas of biochar vary from 7–50 m2/g in a fluidized bed gasifier [18], while another found surface areas of up to 64 m2/g in a downdraft gasifier [19]. Studies conducted by Qian et al. [20] show that the surface area increases with an increase in Equivalence ratio.
The double-stage downdraft gasifier at the Federal University of Itajubá (UNIFEI) which was used in this experiment has an open top through which fuel can be fed. It has two air inlets through the sides: one that is near the top (primary inlet), and the other at the oxidation zone (secondary inlet). The main biomass tested here was Miscanthus, a perennial grass that can grow up to 3.5 m, and which has a useful life of 15–20 years. It can grow on different types of soils, and is considered a potential source of biofuel due to its high biomass yield [21]. The initial interest in testing Miscanthus briquettes came from personnel at the University of Iowa (UI) power plant. By 2020, the goal of the UI power plant is to replace 40% of the current coal usage with biomass. Although some papers discuss the gasification of Miscanthus, both in fluidized-bed reactors that require biomass in powder form [22,23,24,25,26,27,28], as well as in one-stage fixed-bed gasifiers [29,30,31], there is little work done regarding the gasification of this biomass, just briquettes, in a downdraft gasifier with two air inlets.
Mathematical models such as Aspen plus, Kinetic rate models, Neural Network, and Equilibrium models have been developed to give a good representation of the chemical and physical phenomena occurring inside the reactor of a gasifier. In this paper, experimental gasification results were compared with the ones of a chemical equilibrium model. In this model, results are independent of gasifier design, and may be more suitable for process studies on the influence of the most important fuel process parameters. At chemical equilibrium, a reacting system is at its most stable composition, a condition achieved when the entropy of the system is maximized while its Gibbs free energy is minimized [32,33,34].
While previous work by some of the current authors and other researchers have shown some general trends for many biomasses of interest, this specific paper focuses on quantifying those trends. This paper primarily explores the gasification of Miscanthus briquettes in a downdraft double-stage reactor at equivalence ratios of 0.2, 0.35, and 0.4, and chemical modeling for equivalence ratios varying from 0.2 to 0.4. This results in findings that, while not being directly broadly generalizable, provide both insight and direction for how the key output quantities react to system variation. This provides an important step in the quantification of syngas quality, biochar quality, and tar concentration.

2. Materials and Methods
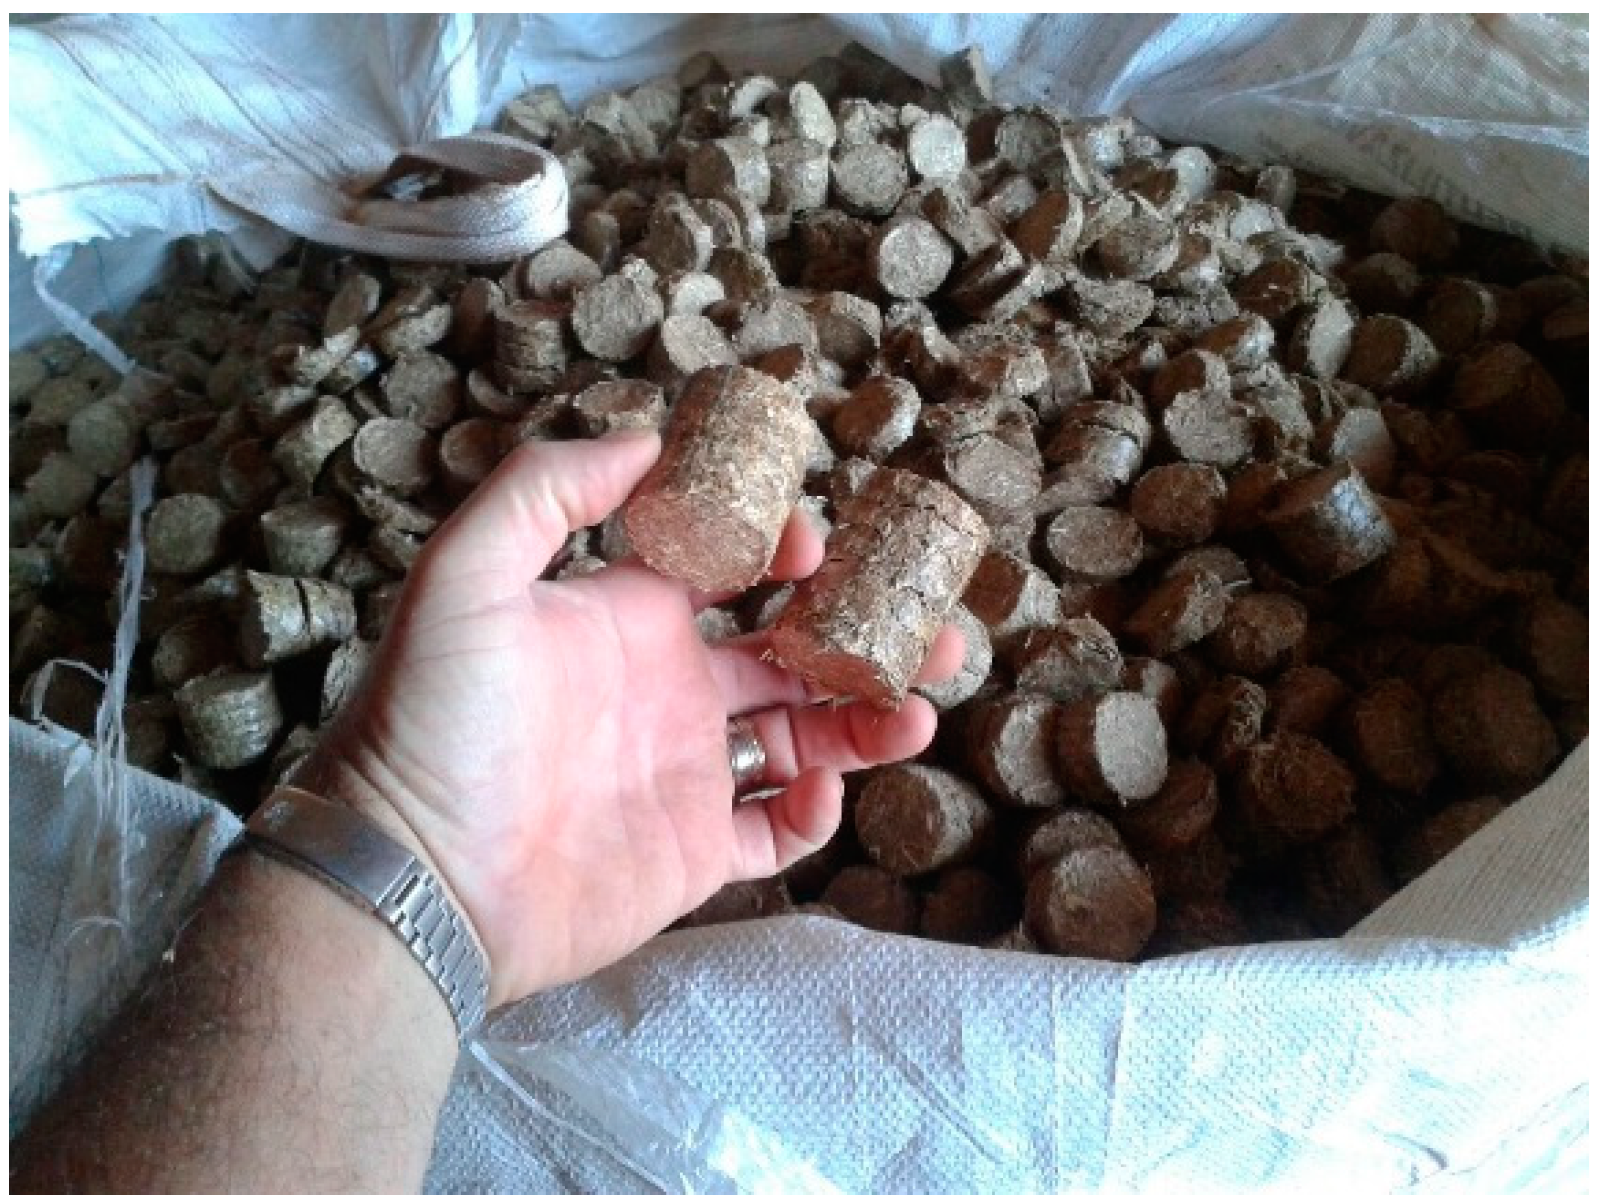
2.1. Biomass

In recent years, the University of Iowa has been testing different types of biomasses to produce electricity, and has been particularly interested in using Miscanthus as a potential fuel source. According to the studies done by Wildom et al., high yielding Miscanthus could require 87% less land to produce the same amount of yield as other low input biomasses [35]. This biomass has low water and nutritional requirements, and can grow on barren land with little fertilization needed [36]. It has also been shown that Miscanthus has a higher yield of up to 40 Mg/ha compared to other similar grasses, such as Panicum Virgatum (switchgrass), which was found to produce 20 Mg/ha [37].
For this experiment, Miscanthus briquettes were obtained from Bripell, a local biomass supplier located in Ipassu City, Brazil. The biomass briquettes, shown in Figure 1, had a diameter of 2 cm and a length of 3 cm. These were tested in the downdraft double-stage gasifier. The biomass moisture and heating values were measured in the Excellence group in Thermal power and distributed generation (NEST), Itajuba, Brazil laboratory using a calorimeter pump IKA, (series C2000 which operated at 25 °C for seven minutes. The proximate and ultimate analyses of Miscanthus were determined using a CHNSO analyzer from Perkin Elmer, series II 2400 (using the ASTM D5373-08 standard) and a Themogravimetric analysis (TGA) from LECO Systems, ref LECO 701 (using the ASTM D 317x standard). The results of the proximate and ultimate analyses can be seen in Table 1.

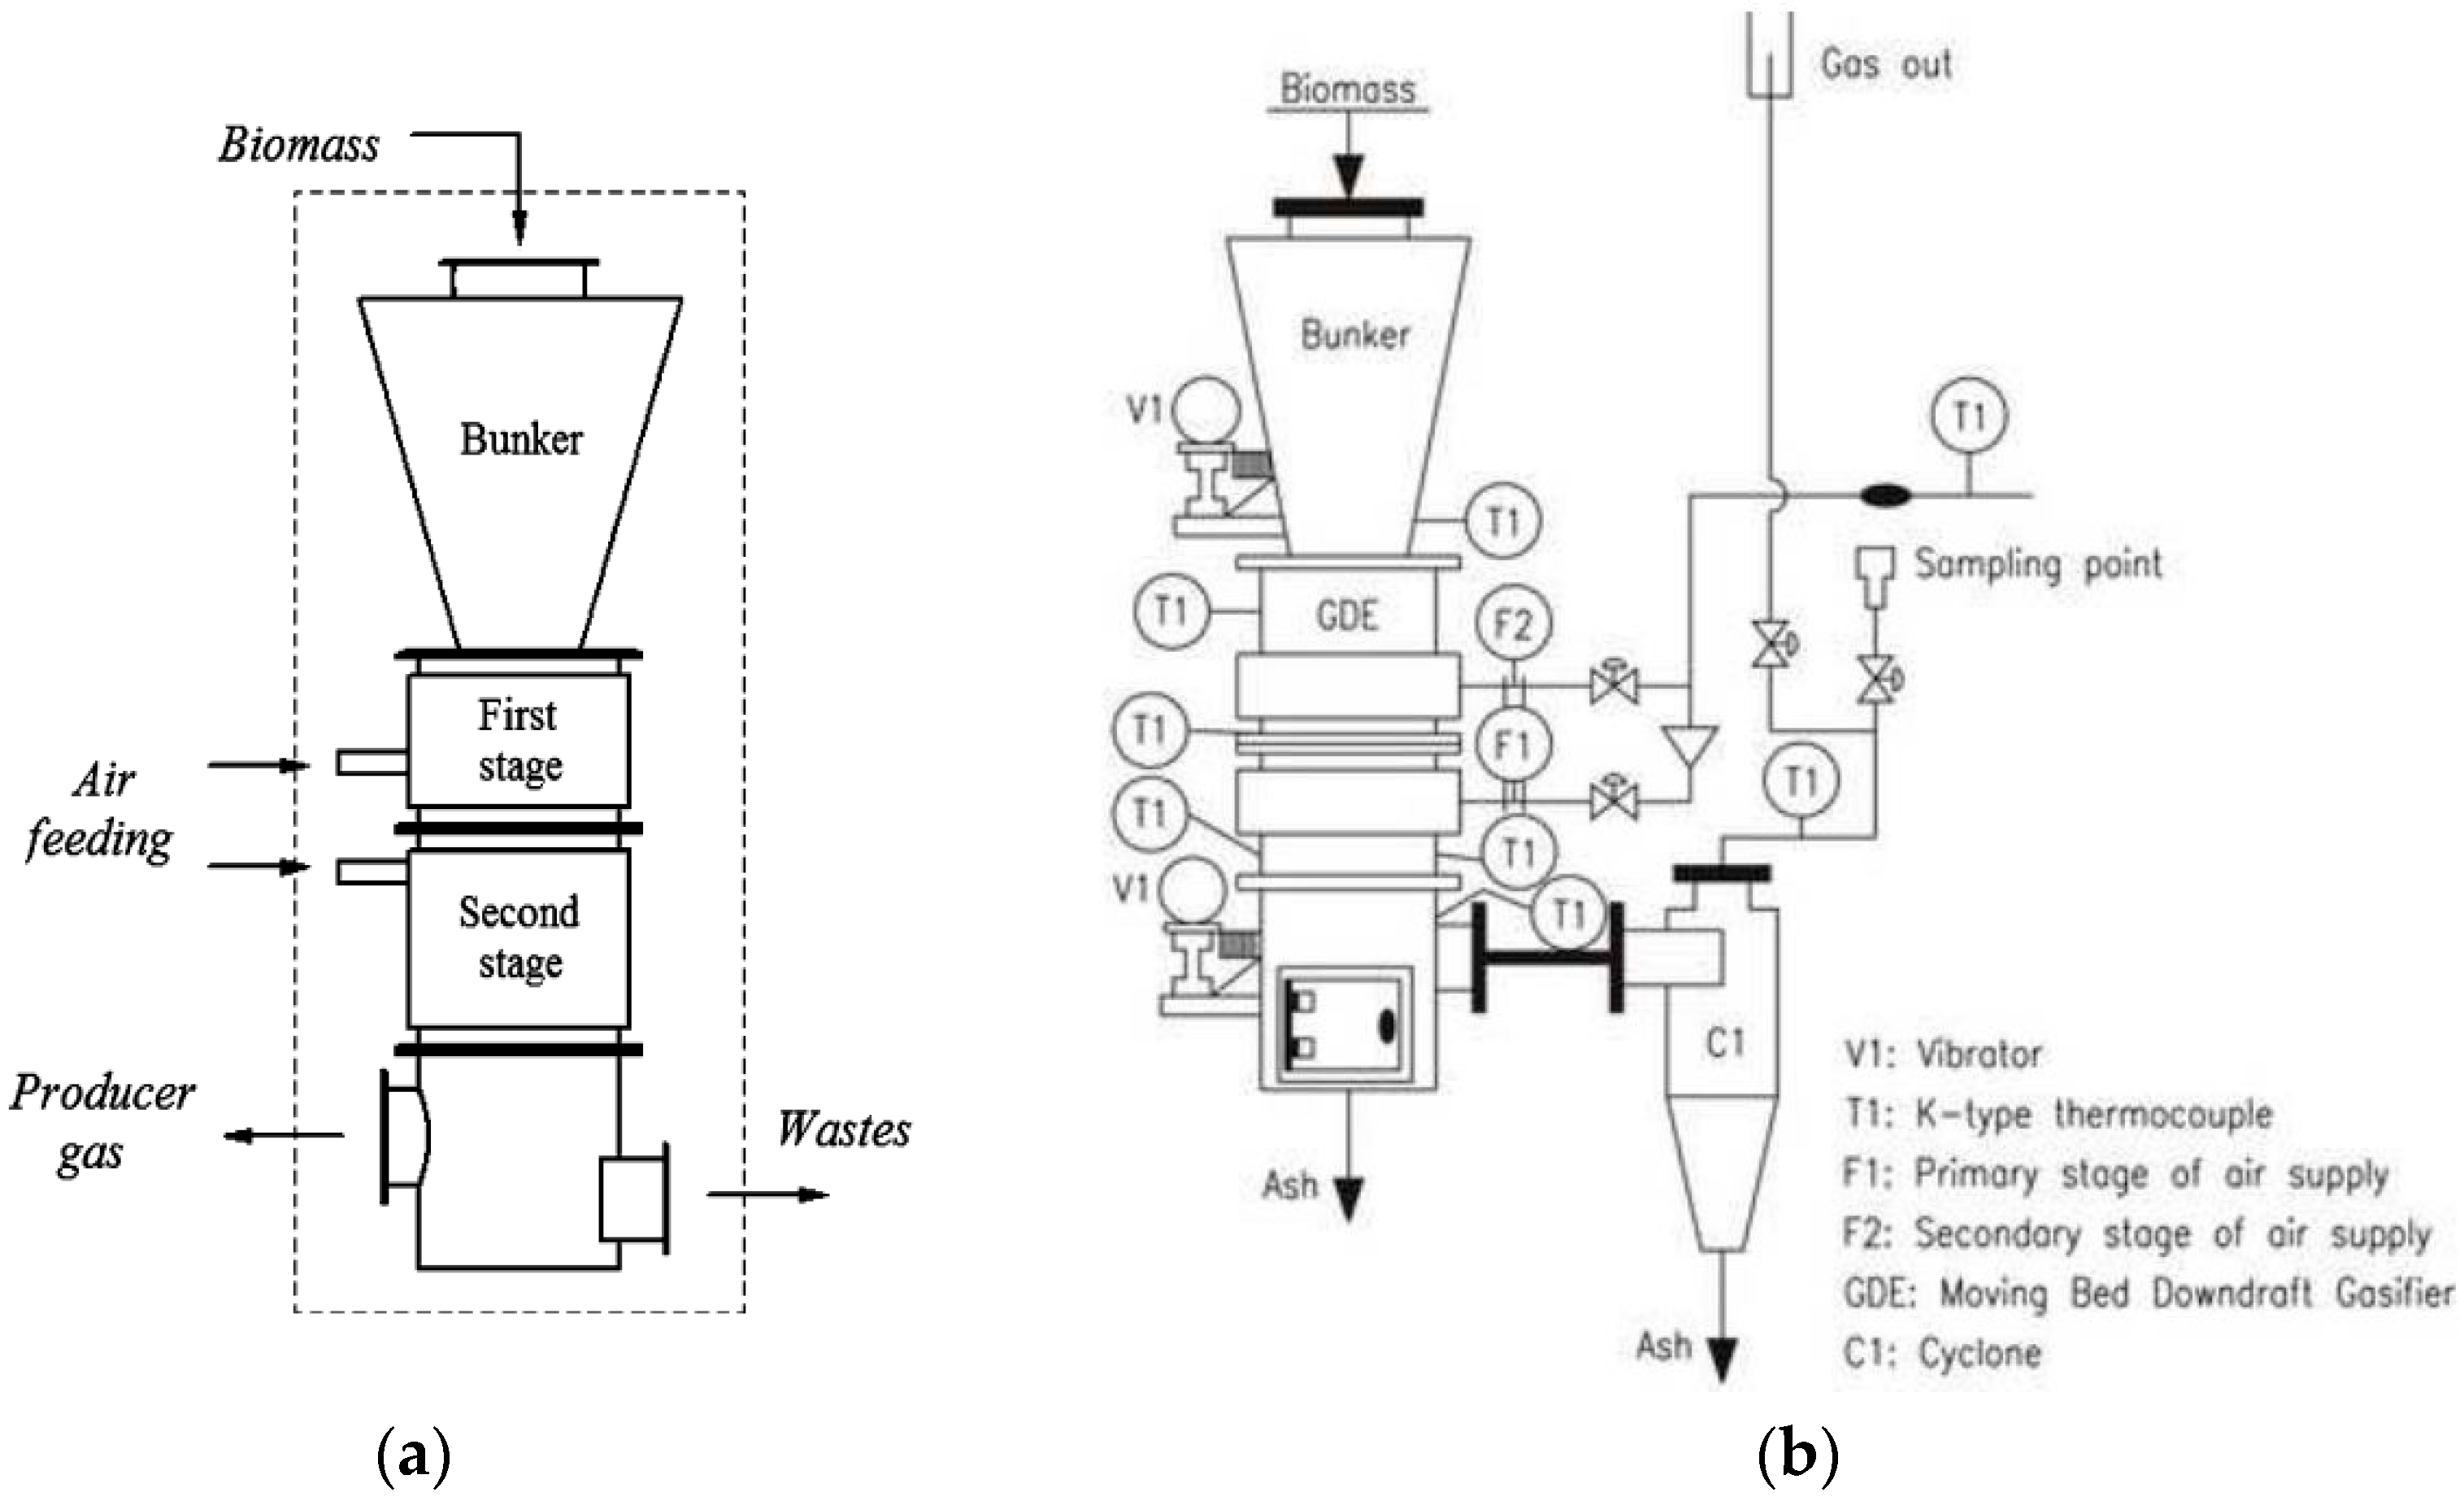
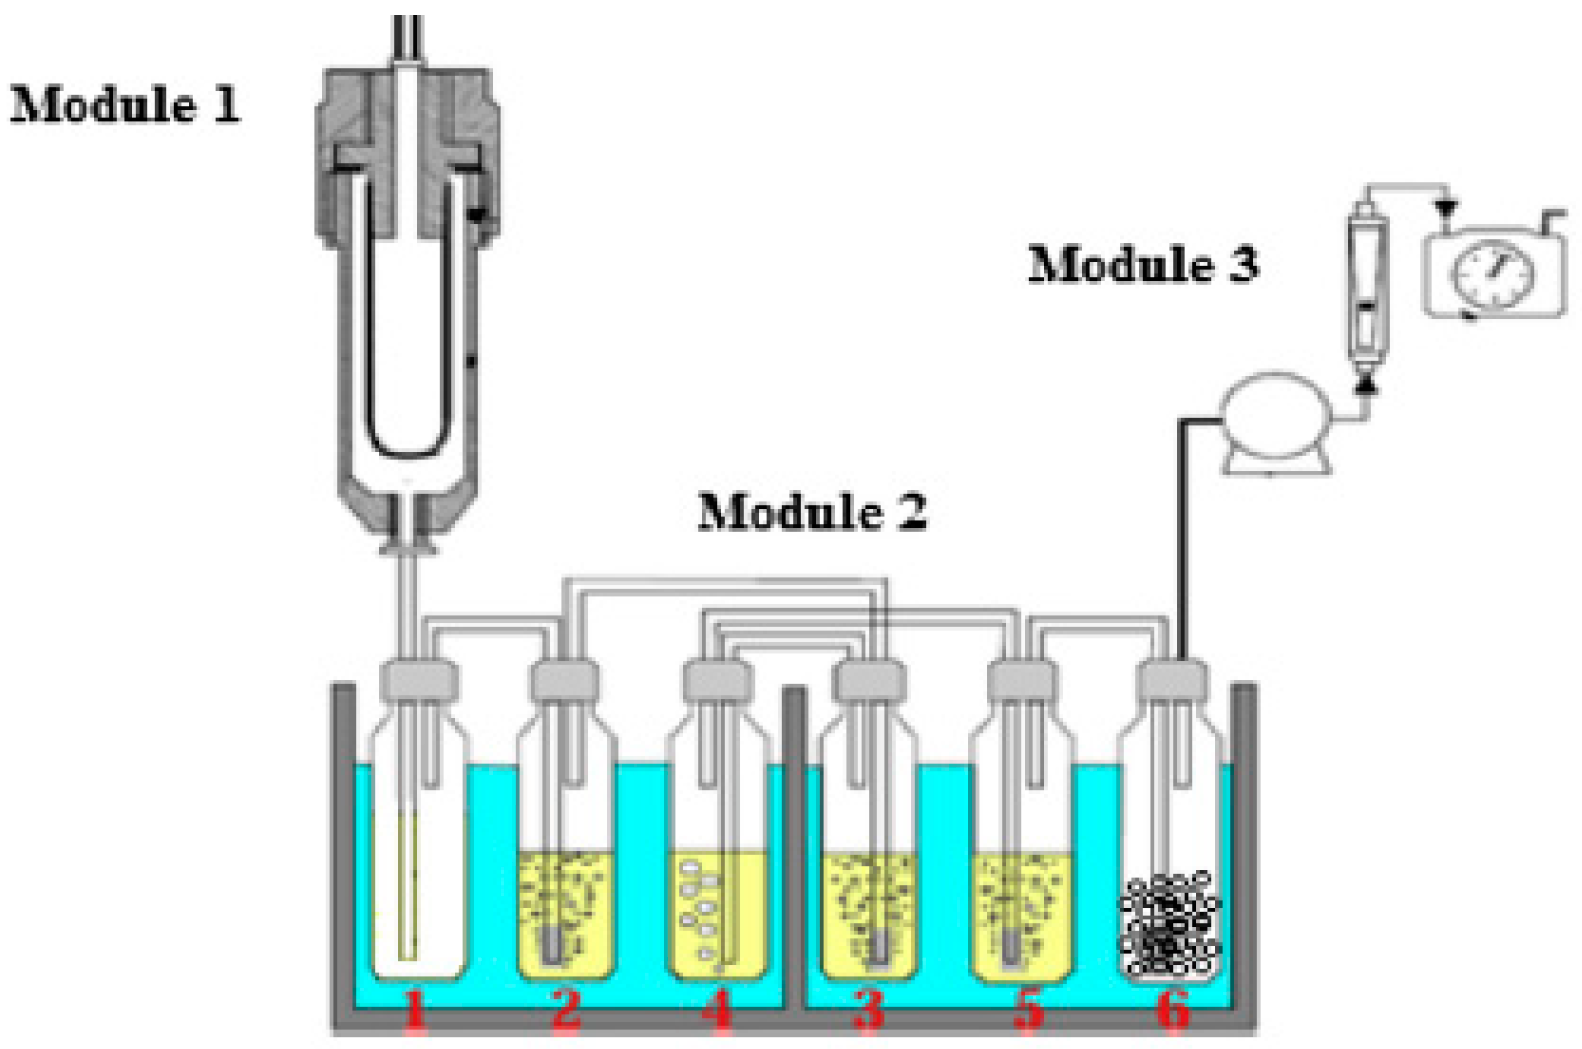
2.2. Double Air Stage Downdraft Gasifier

The downdraft gasifier used in this experiment (seen in Figure 2) was designed and manufactured by Termoquip Renewable Energy, based in Campinas, São Paulo, Brazil. The gasifier is made of carbon steel material, and has a height of 1.06 m and an inner diameter of 0.3 m. This gasifier was primarily built to test wood and other carbonaceous materials to produce tar amounts of less than 35 mg/Nm3, and to limit particulate matter to less than 10 mg/Nm3 [7,38,39].
There are 6 K-type thermocouples placed on the inner wall of the gasifier. The approximate sensitivity of the thermocouples is 41 μV/°C. These thermocouples have been strategically placed on the inner wall of the reactor to avoid any interference with the flow of the biomass.
Two vibration devices were installed: one at the top of the gasifier and the other at the bottom. This was done to ensure a homogenous distribution of the biomass within the system. The vibration device located at the bottom of the gasifier helps to discharge the ash produced. The cleaning system attached to the gasifier is comprised of a cyclone, a heat exchanger, and a bag that contains filters. A floating-drum gas storage recipient which absorbs the pressure variation in the producer gas is installed to maintain pressure throughout the gasifier [7].

2.3. Operational Procedures

Biomass gasification starts with preheating the bed by using an external burner. The reactor is heated up to 250 °C (temperature at the combustion zone in the inner wall of the reactor). Once this temperature is attained, air is fed into the gasifier. Quasi-stoichiometric combustion conditions (around 4 Nm3/kg) are adjusted, reaching a bed temperature (in the combustion zone) of around 800–850 °C. Airflow values are obtained through flow measurement by an orifice plate and a control valve for each stage. The total desired air flow was obtained using a combination of air entering in both the first stage and second stage. The average total air flow was 24 Nm3 h−1. Once a steady state is attained, the operating conditions and outputs are recorded. The resulting biochar and tar are then collected.

2.4. Experimental Planning

The total air flow and the air ratio (AR) between the primary and secondary stages were controlled in this experiment. The following variables were measured:
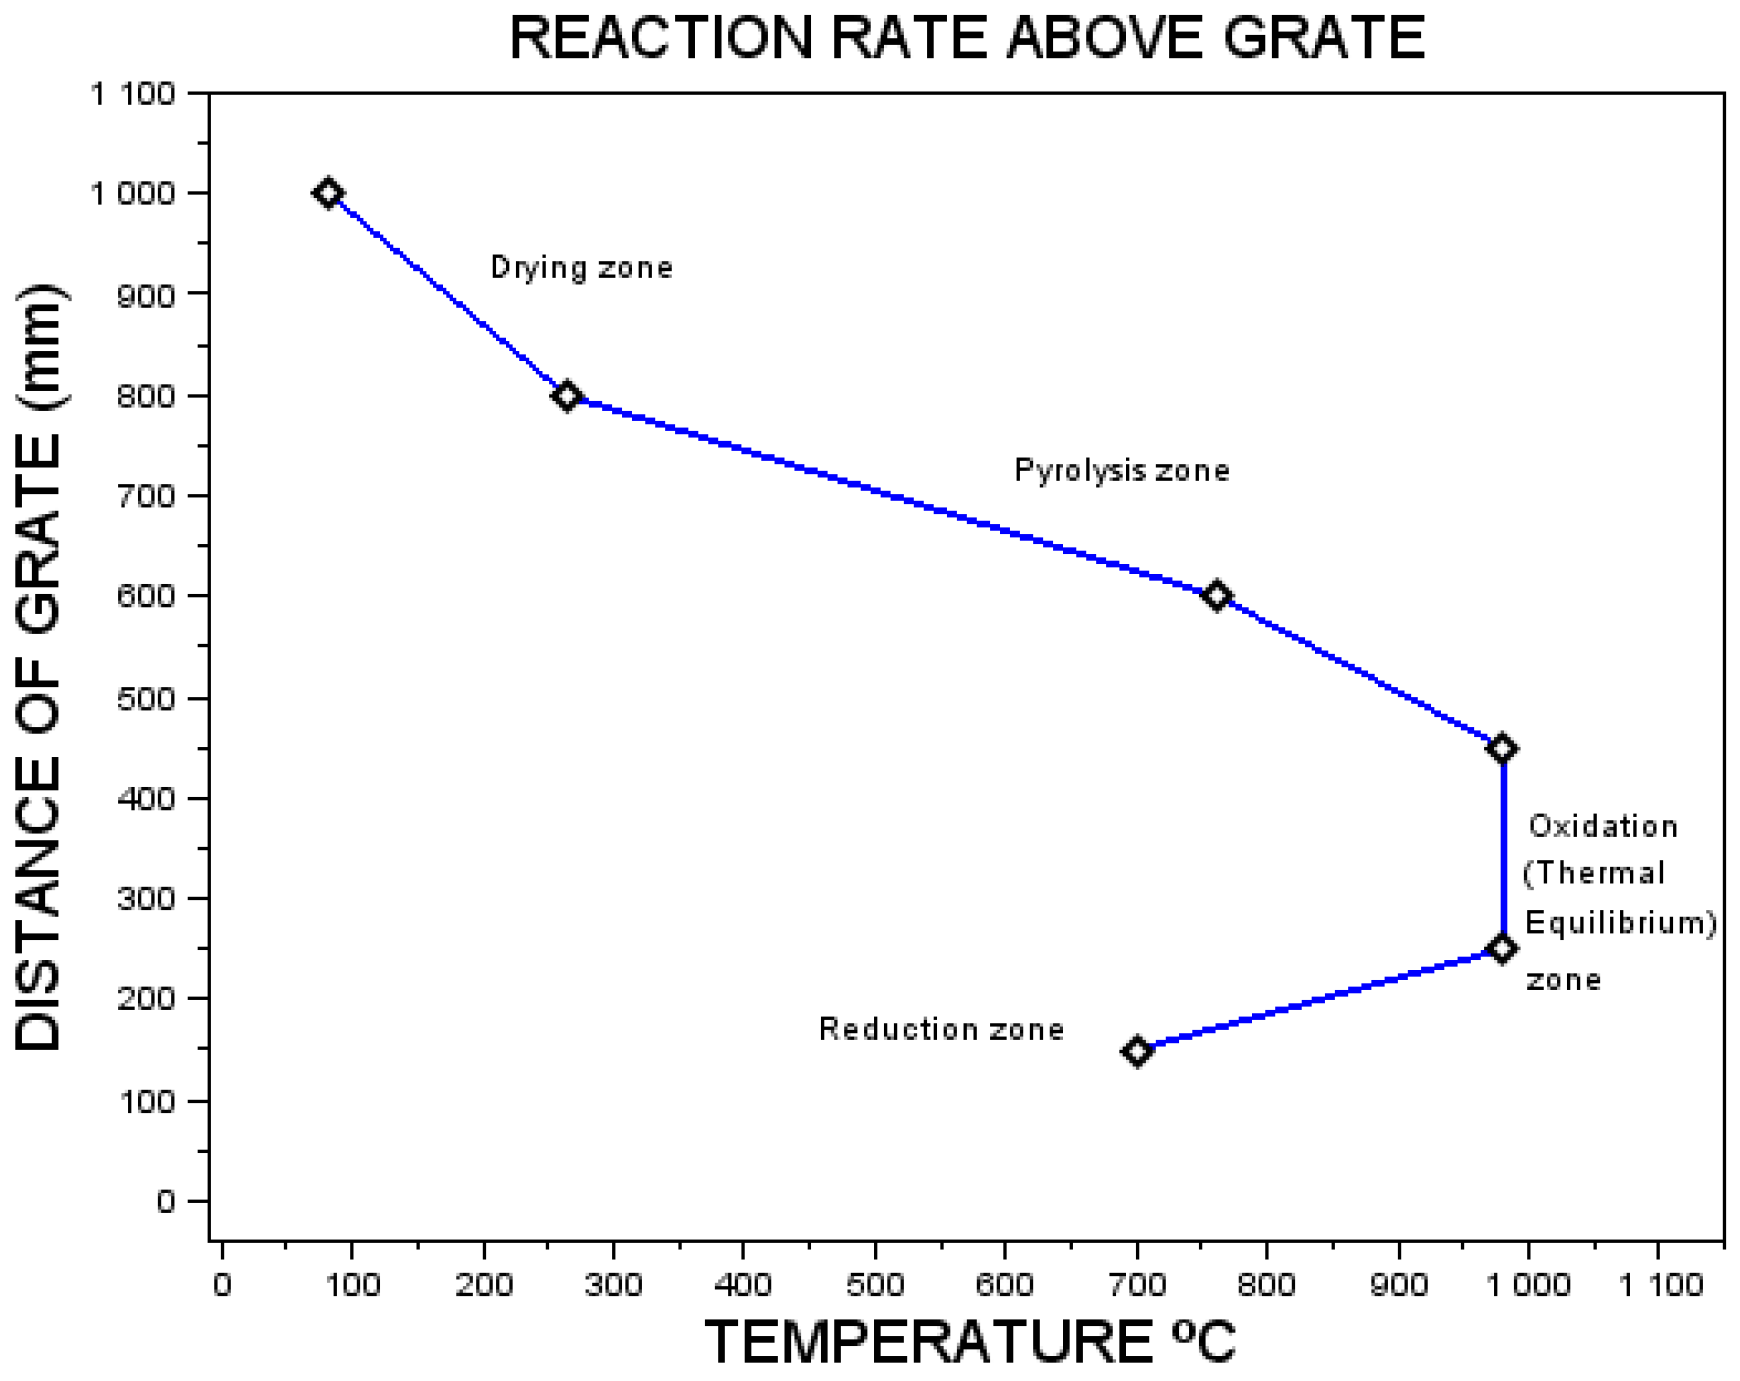
  • The temperature in the different gasifier zones.
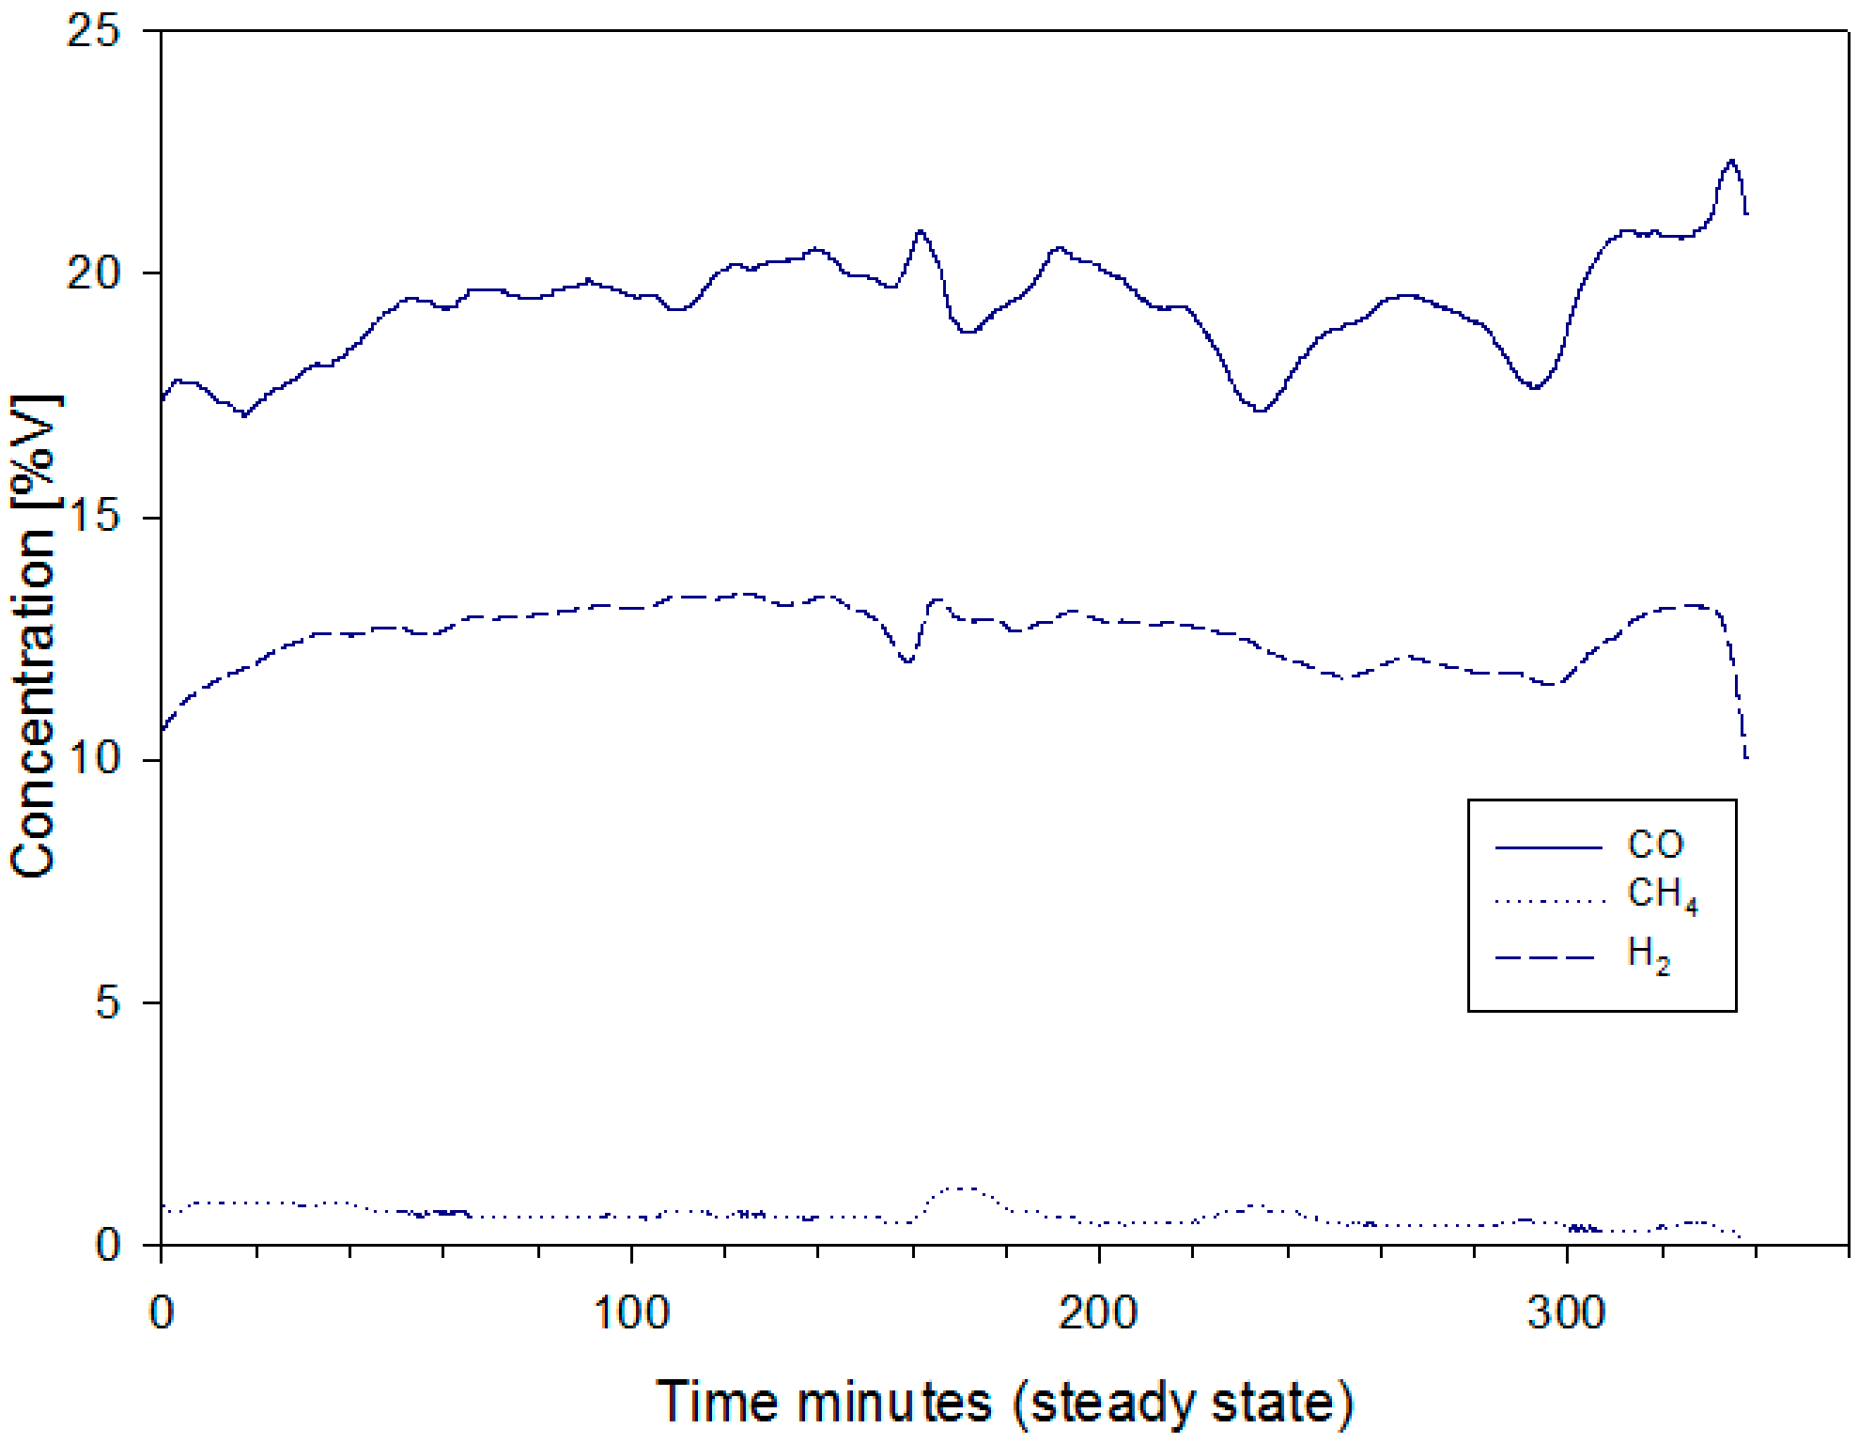
  • CO, CH4, and H2 concentrations of the producer gas using the gas analyzer systems: BINOS 100, and HYDROS 100 (Emerson Process Management, Hasselroth, Germany). The uncertainty of BINOS 100 is ±0.2%, while that of HYDROS 100 is ±0.01%
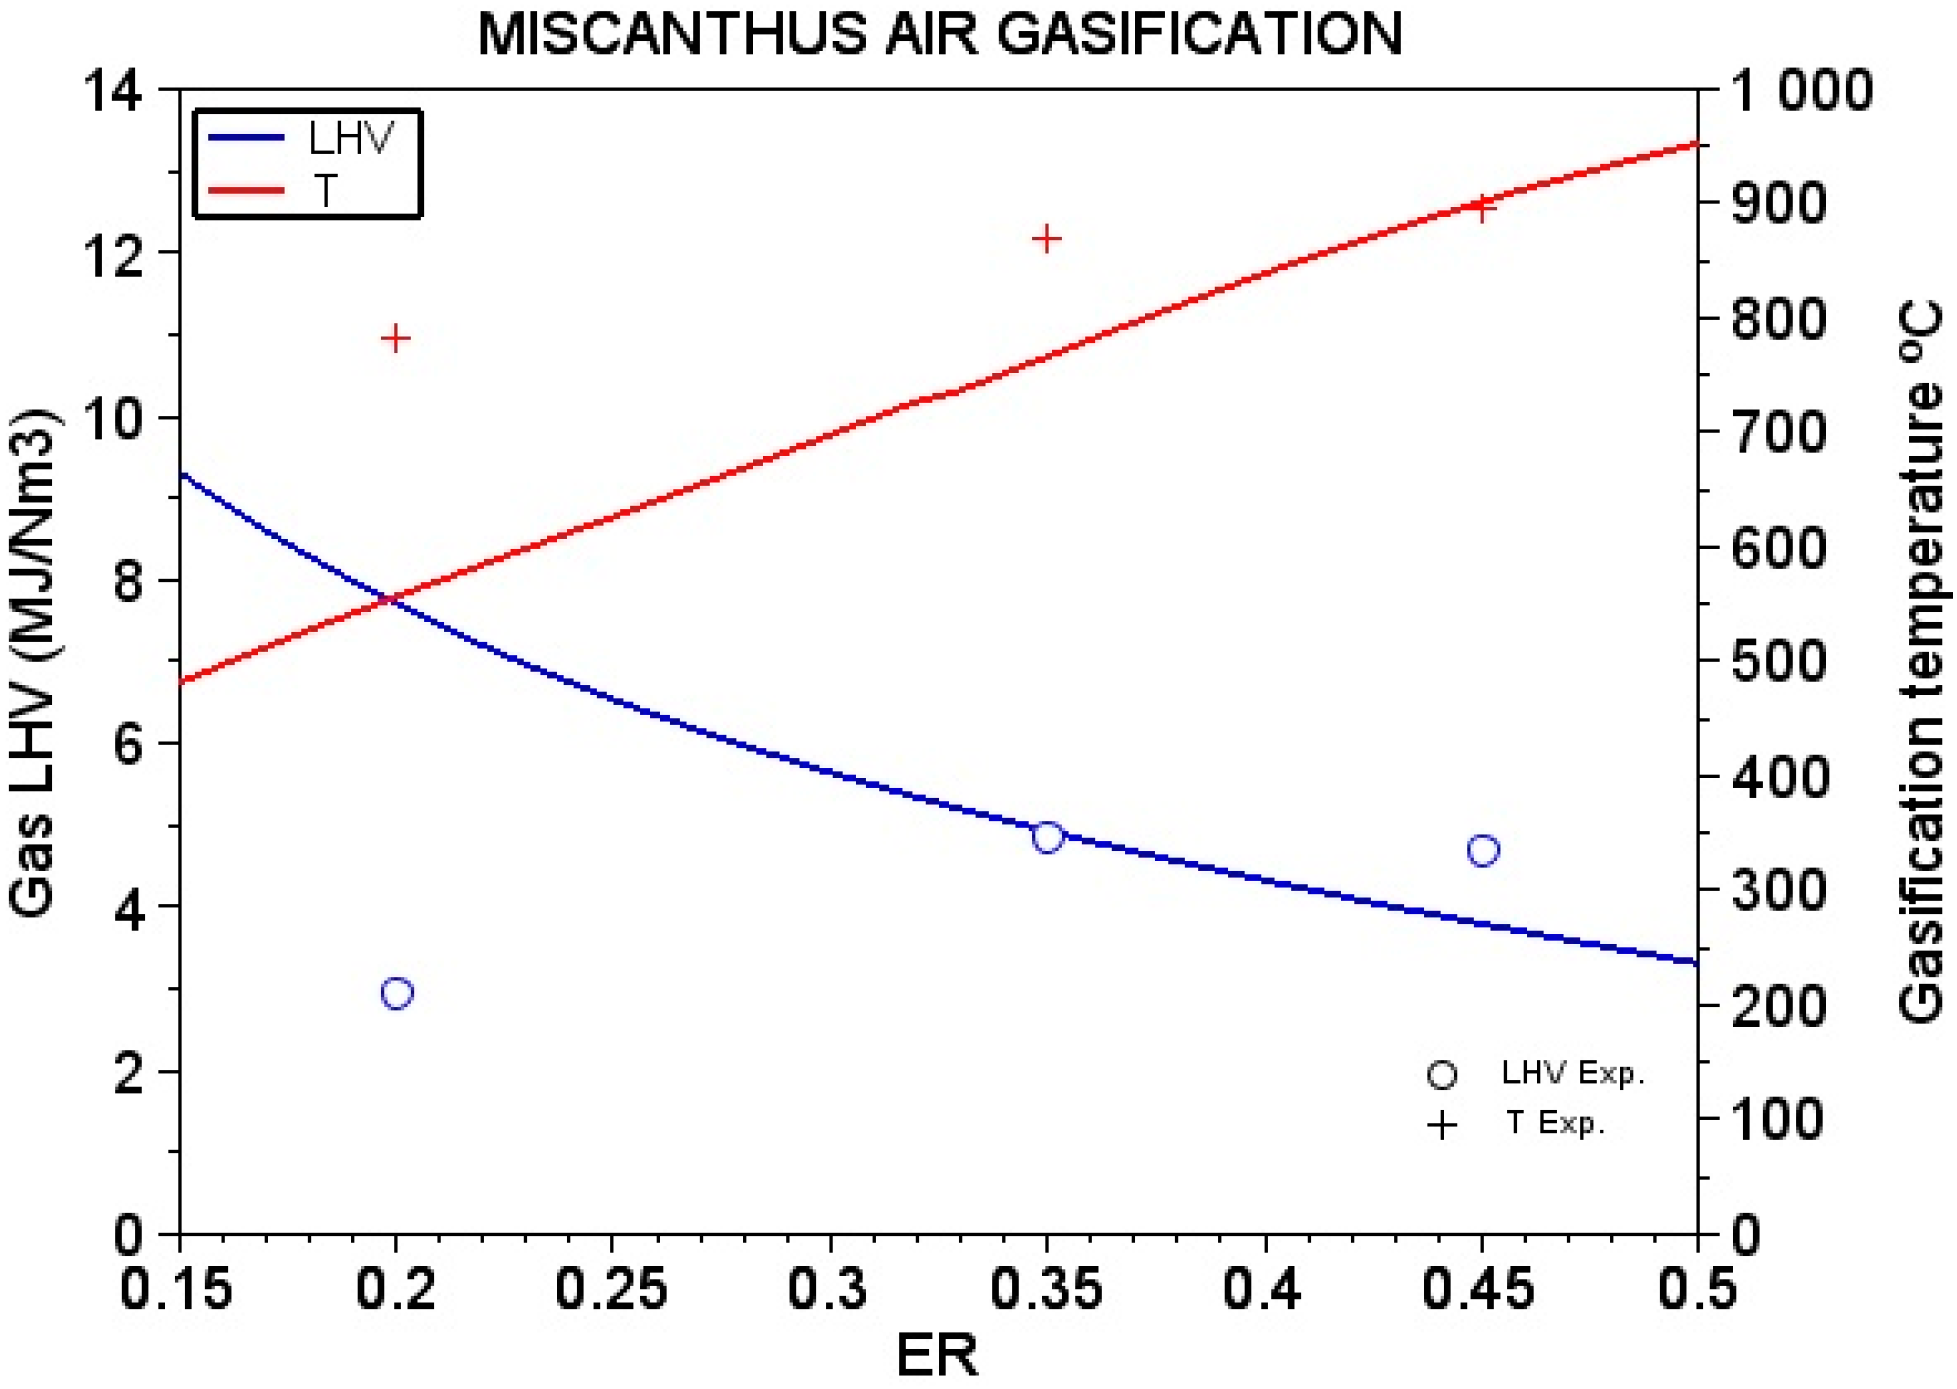
  • The syngas content for equivalence ratio between 0.2 to 0.45
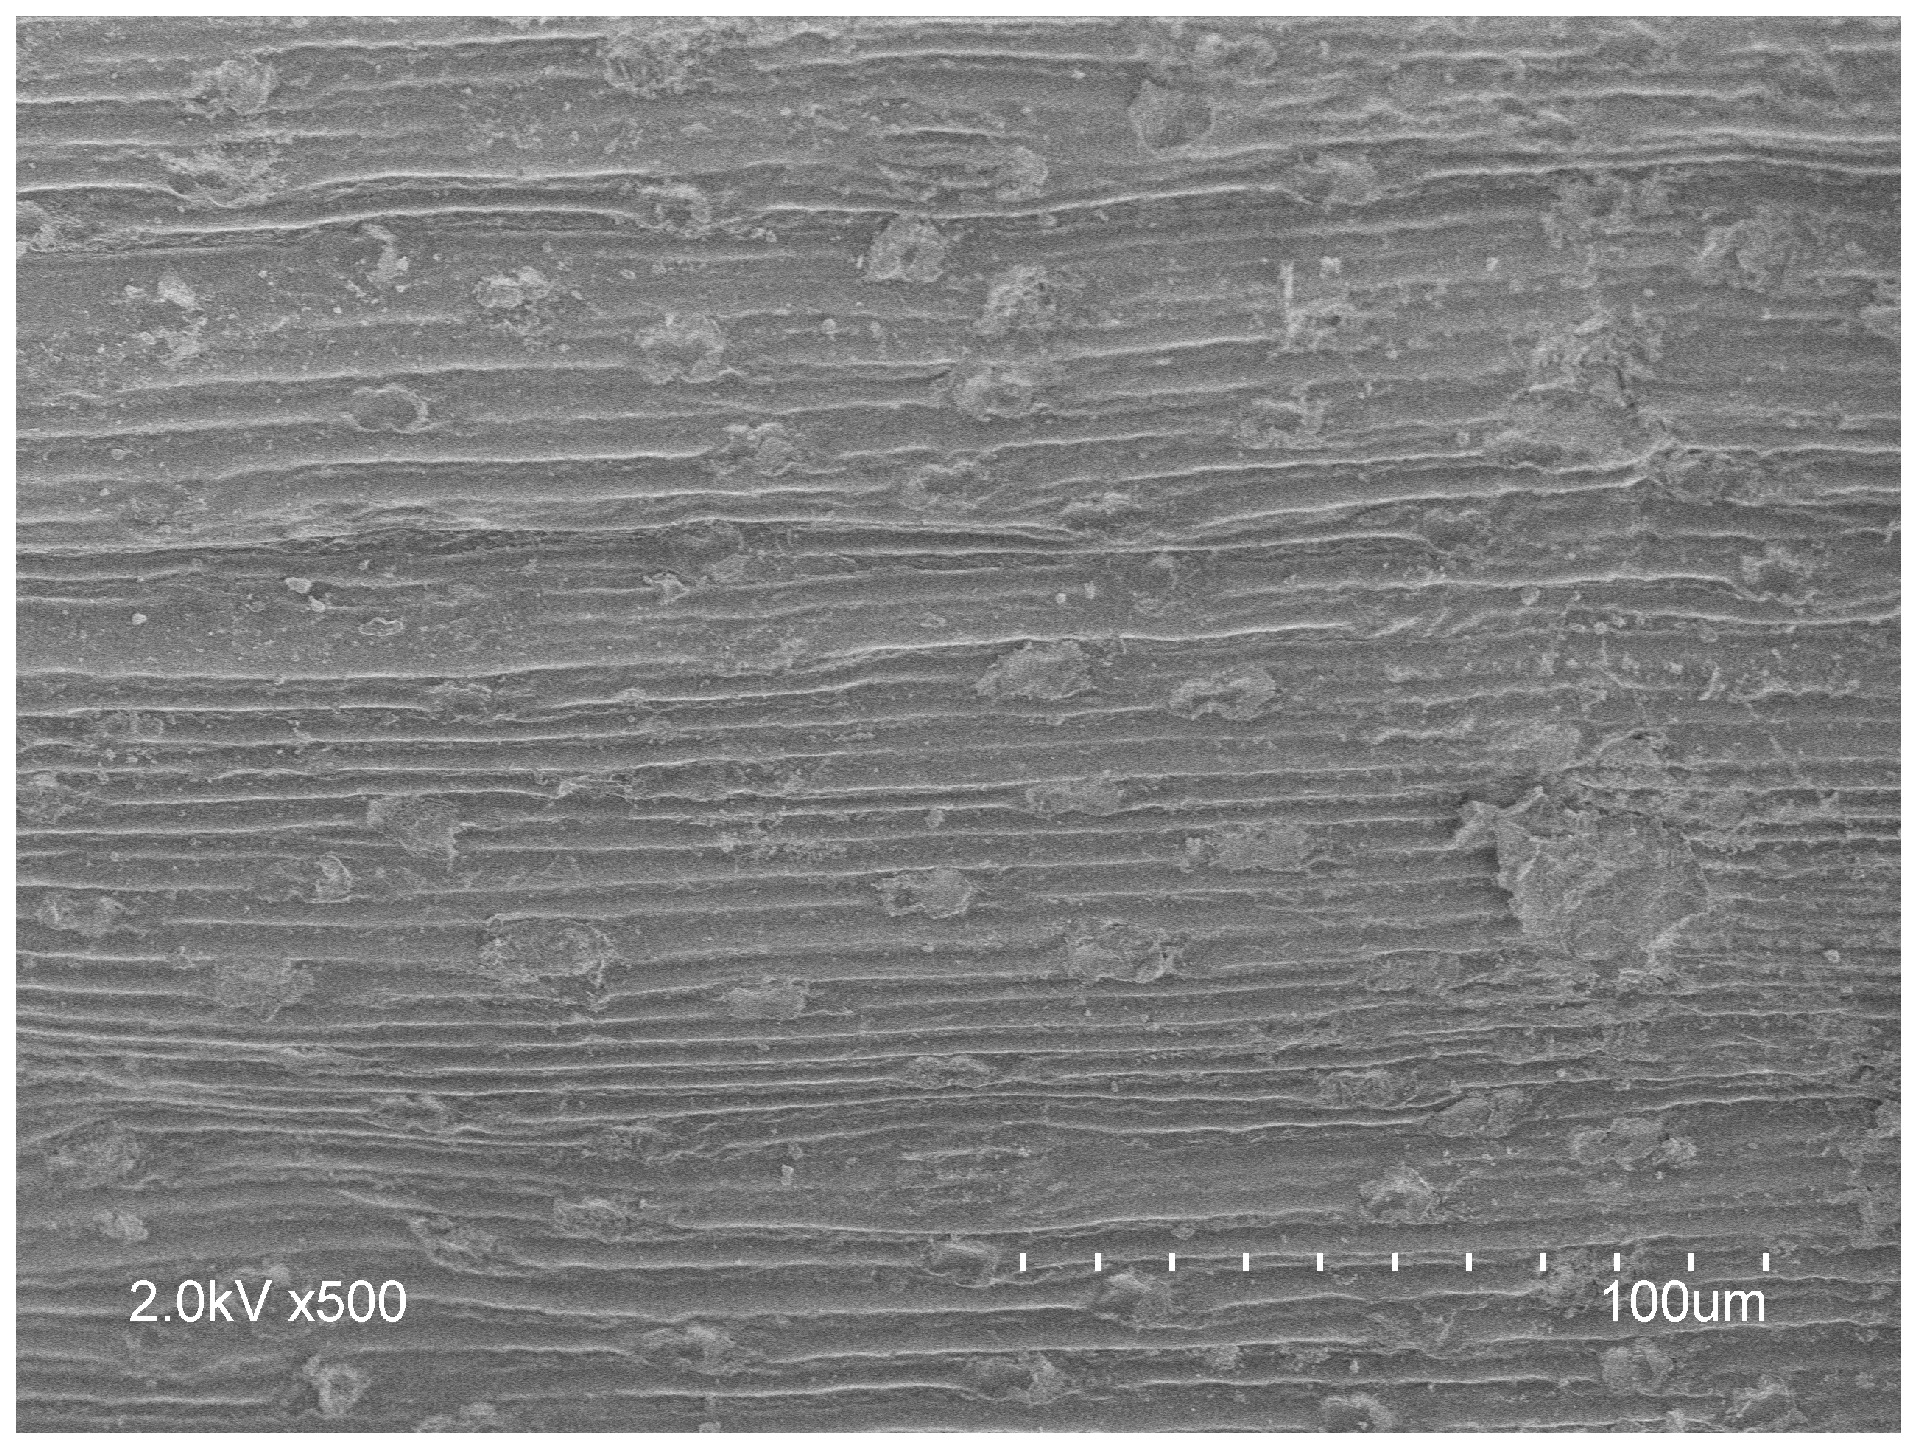
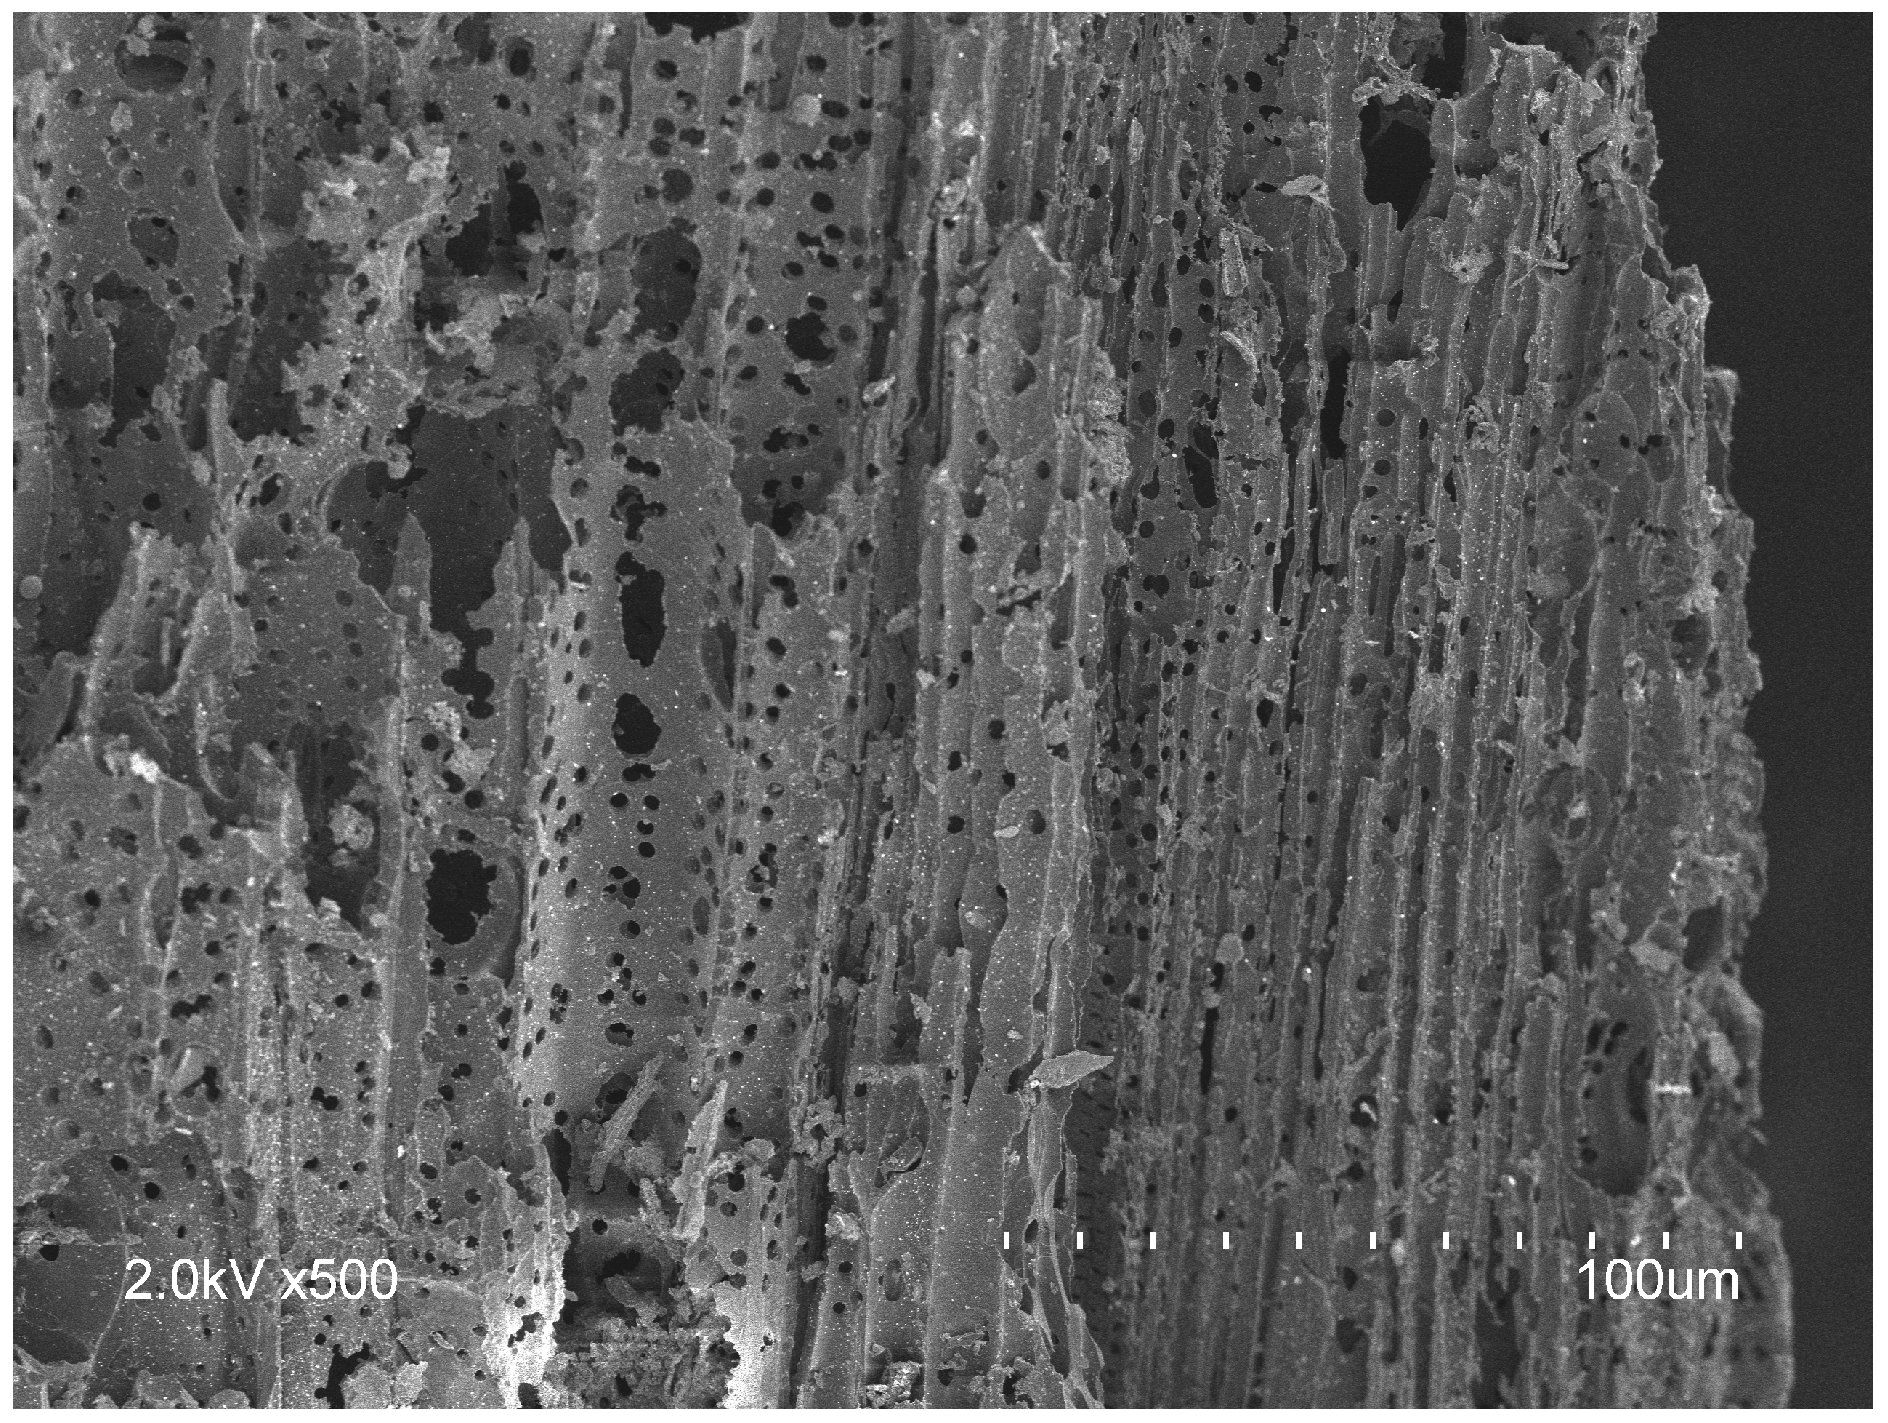
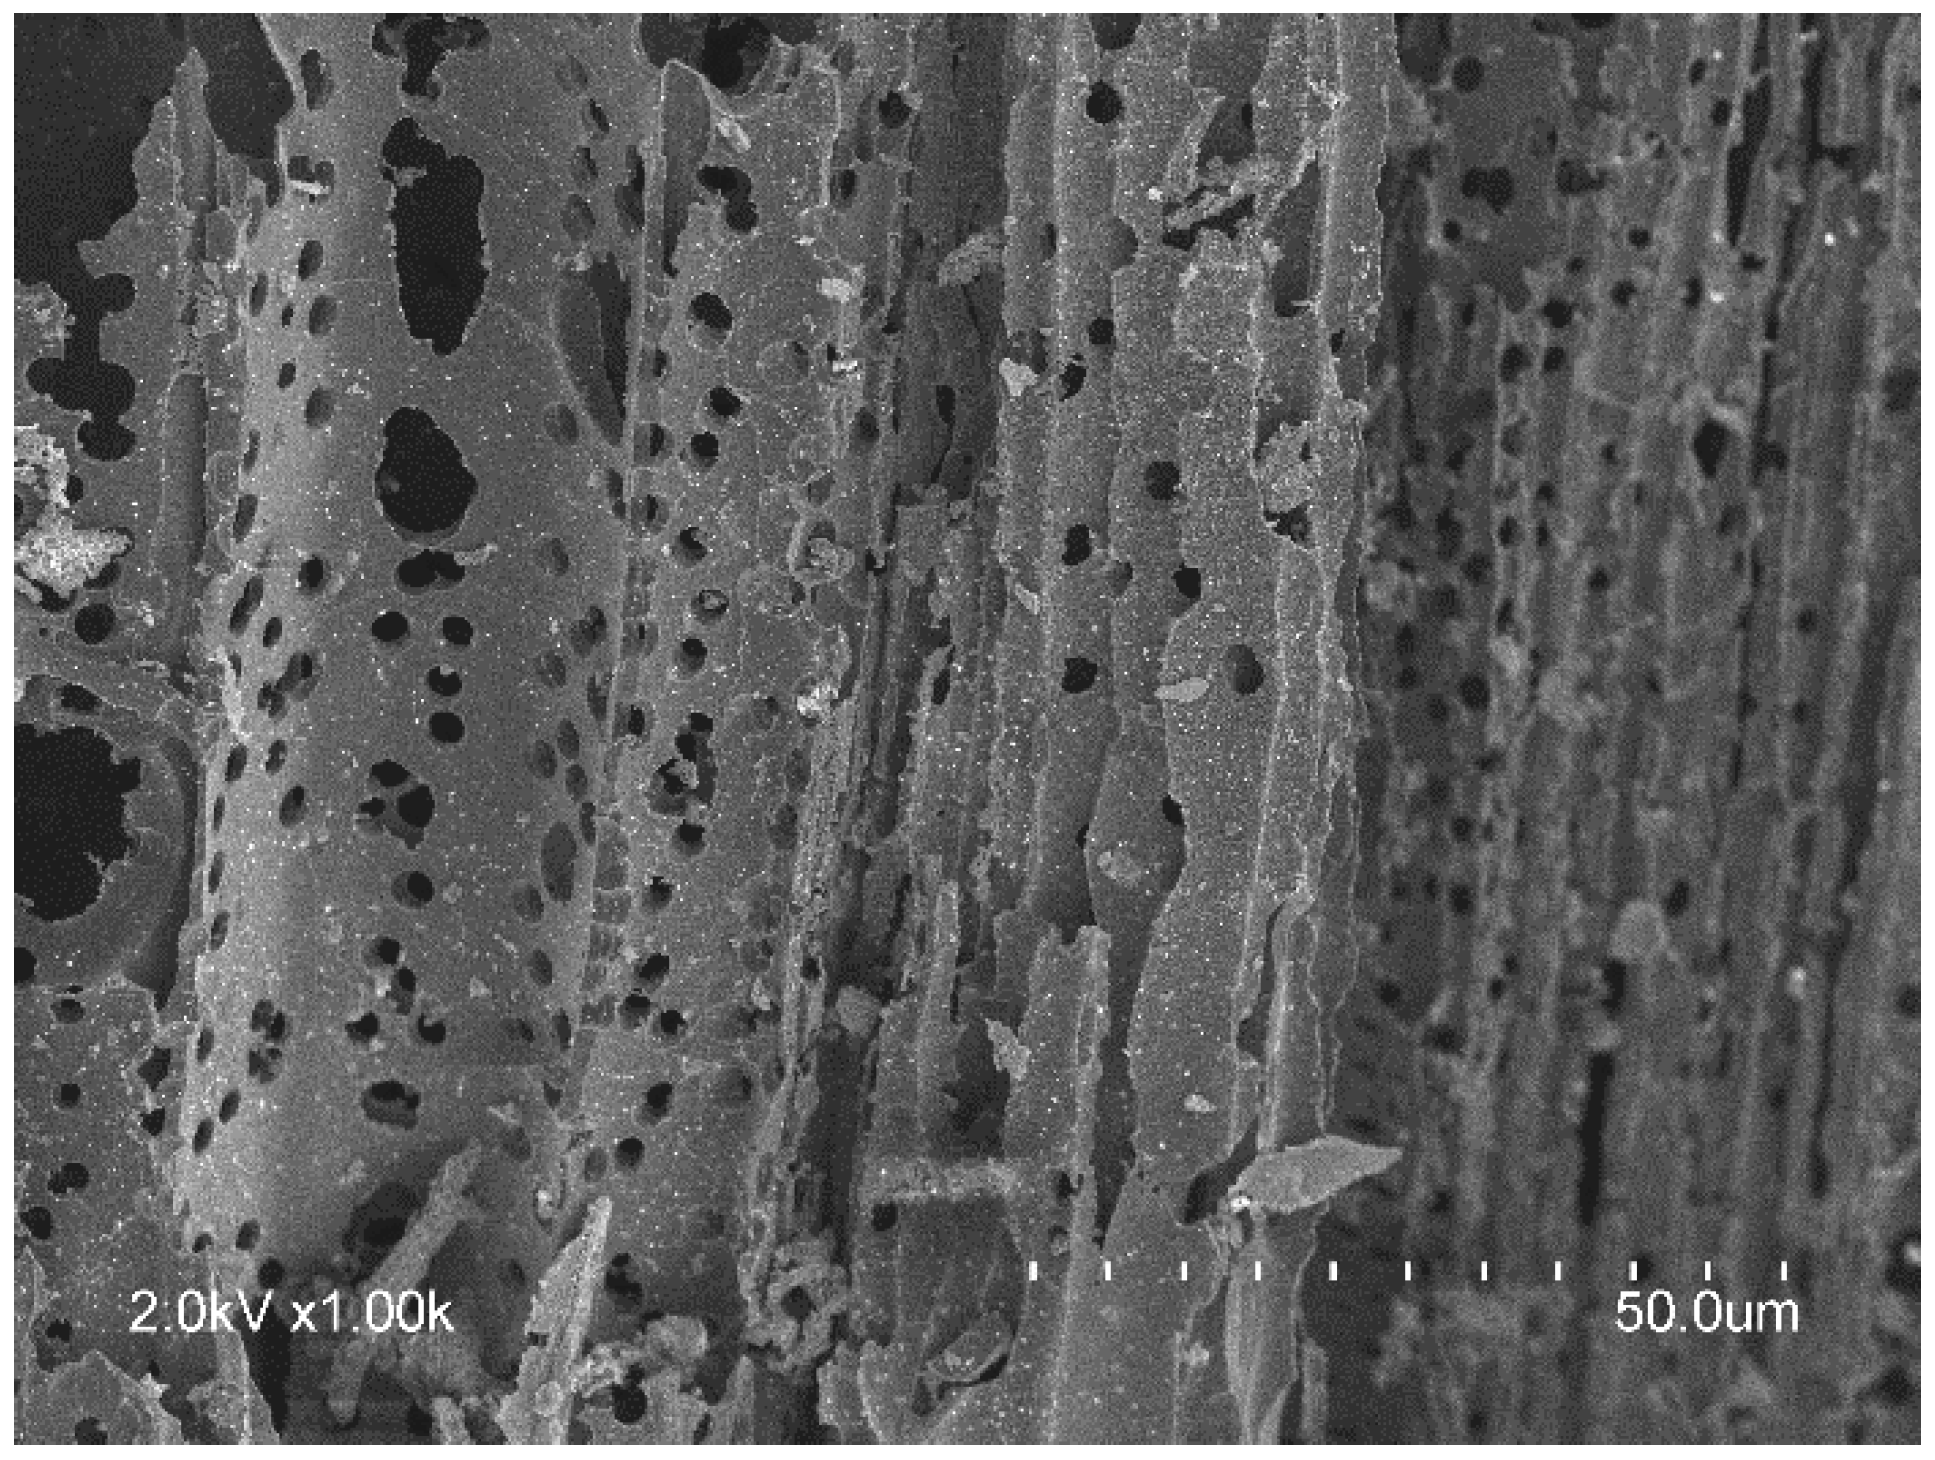
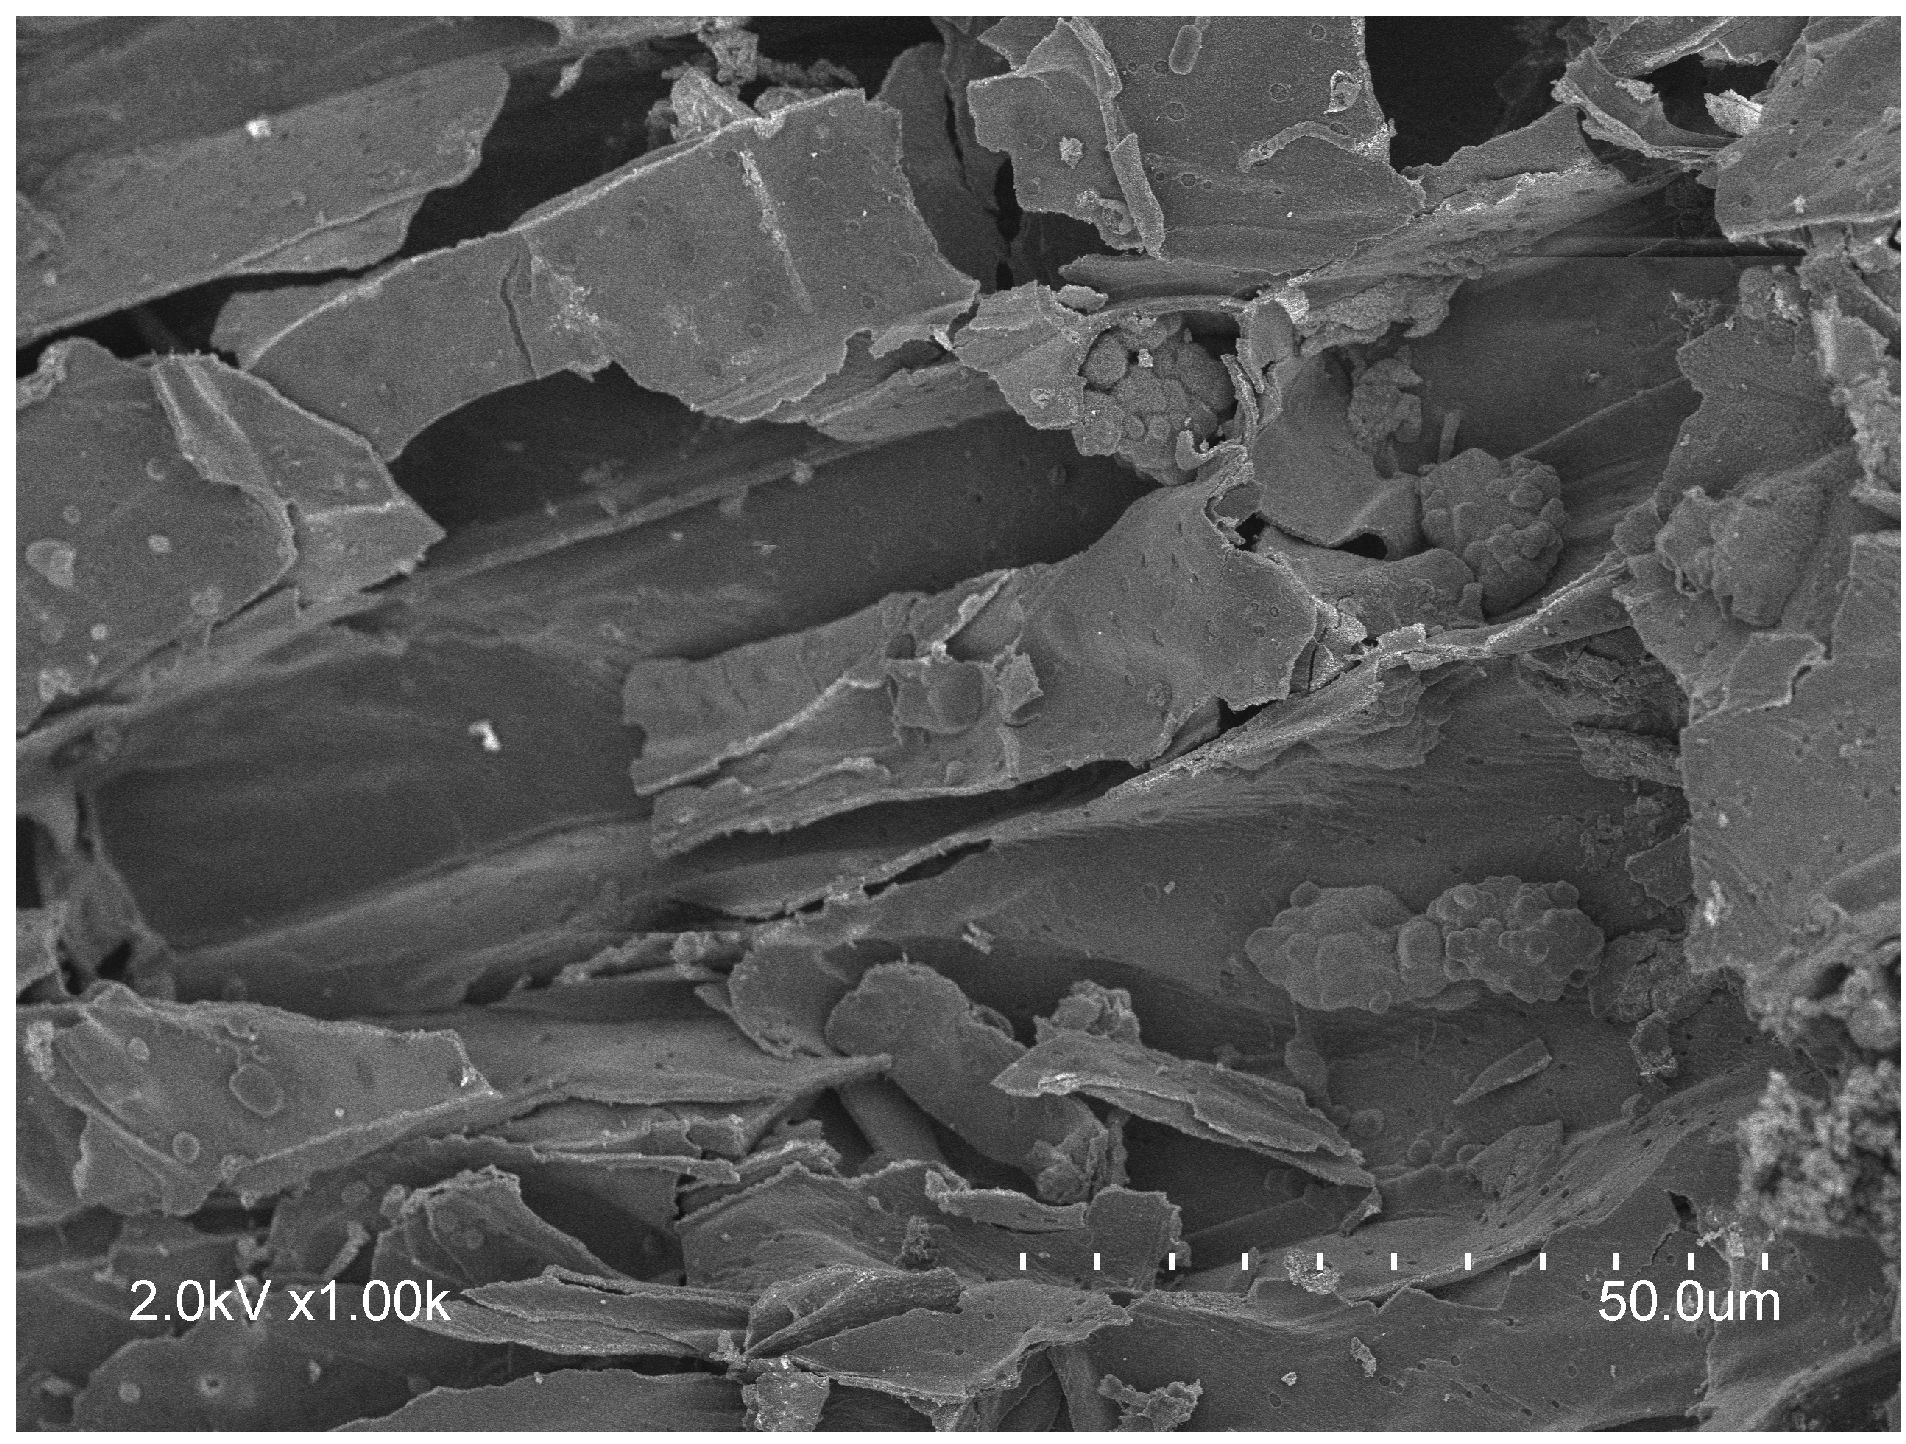
  • The biochar surface area was analyzed using a Nova 4200 instrument and a Hitachi S-4800 SEM instrument (Emerson Process Management, Hasselroth, Germany)
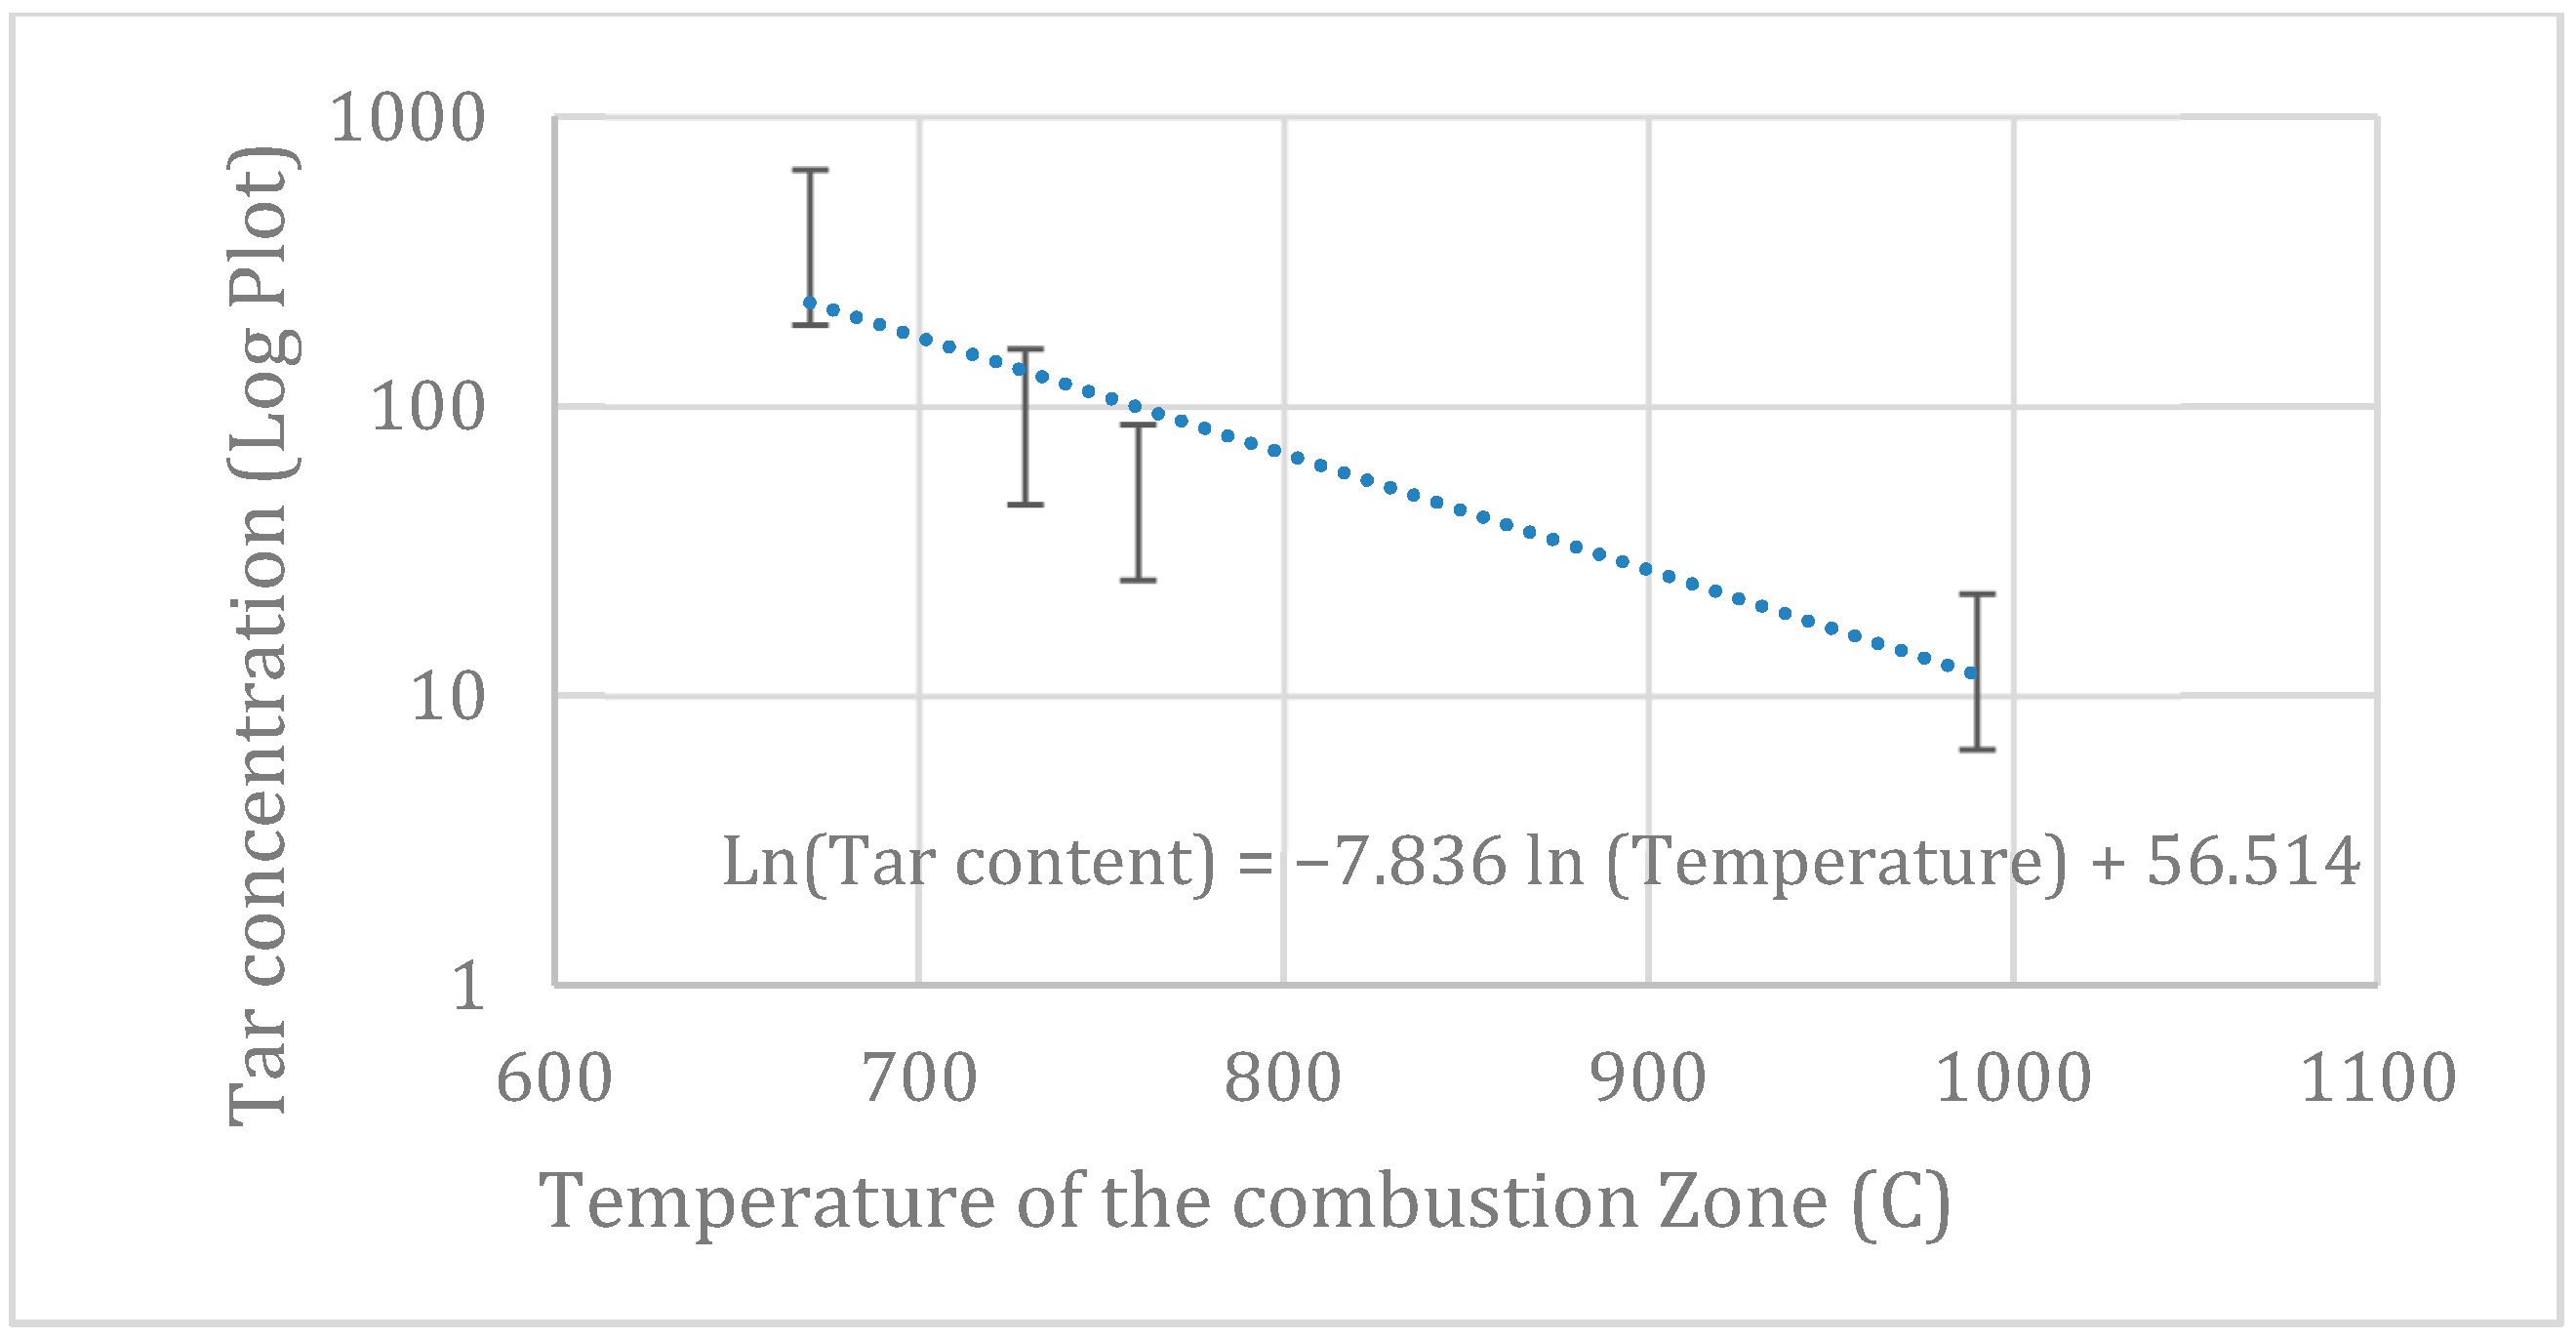
  • Tar was collected using a set of six impingers, five of which contain isopropanol at a temperature of less than 0 °C. The average tar collected at steady state and content is obtained in mg/Nm3.

3. Mass and Energy Balance

According to Ahmed et al. [32], the concept of chemical reaction equilibrium is based on the second law of thermodynamics, as applied to a reaction system. Here, the species of the reaction system no longer experience any net changes in concentration over time. As such, through the governing equations that describe the behavior of this state, an equilibrium model can be formulated.
At chemical equilibrium, a reaction system is most stable when the entropy of the system is maximized and its Gibbs free energy is minimized. However, this thermodynamic equilibrium may not be achieved at relatively low operation temperatures [40]. As such, equilibrium models become an important tool for predicting the highest gasification efficiency that can possibly be achieved for a given feedstock. These equilibrium model simulations can be applied for different gasifier configurations because they are independent of the gasifier’s design, and are not limited to the gasifier’s operating conditions. There are mainly two equilibrium modeling approaches widely used to predict equilibrium compositions of a product gas. Both models are based on the minimum value of the Gibbs free energy, and are known as stoichiometric and non-stoichiometric models. The stoichiometric models are based on equilibrium constants of a proposed set of reactions associated with Gibbs free energy change. An algorithm based on the stoichiometric equilibrium model has been developed at SCILAB to predict the results for a wide range of ER. These simulated results were compared with the experimental results. In this paper, the stoichiometric model was used to analyze the gasification output, energy conversion, and solid fuel efficiency.

3.1. Model Formulation

The gasification model was developed based on stoichiometric equilibrium, also known as the Gibbs free energy minimization method. The actual experimental data was used to validate the developed thermodynamic equilibrium model. The model was used to investigate the performance of the gasifier when it was operating with air, steam, and oxygen mixtures as gasifying fluids.
The global reaction in the downdraft gasifier can be written as:
C x H y O z N w S v + α H 2 O + γ H 2 O s t e a m + β ( O 2 + δ N 2 ) a 1 C O 2 + a 2 C O + a 3 H 2 + a 4 H 2 O + a 5 C H 4 + a 6 N 2 + a 7 S O 2 + a 8 H 2 S + t a r
where x, y, and z are the number of atoms of hydrogen, oxygen, and nitrogen per number of atoms of carbon in the feedstock, respectively. The molar moisture content of biomass is represented by α, and steam molar content represented by γ. The molar quantity of air is represented by β, while δ represents the molar amount of nitrogen contained in the air. For air gasification, δ assumes the typical value of 3.76, whereas the air is composed primarily of oxygen and nitrogen in the proportion of 79% nitrogen and 21% oxygen. When gasifying with enriched air (100% oxygen), δ tends to zero.
Although the content of Sulphur in the fuel is less than 0.1%, it is an important component, as Sulphur leads to H2S formation, which can cause corrosion and also act as a poison for synthetic catalysts. Therefore, to avoid these undesired problems, these compounds have to be removed or reduced to a certain required level prior to the end use of the product gas. In order to improve the product gas quality and the overall gasification efficiency of the process, it is necessary to effectively measure and reduce the formation of sulfur and tar during biomass gasification [41].
A downdraft gasifier has a high carbon conversion which results in low tar content in the producer gas. Puig-Arnavat et al. [34] show a review on biomass gasification models which assumes that all carbon is converted in the gasifier, and as such, the ash content can be neglected in the mass balance. Further sections describe the model used in the present work [32].
Furthermore, according to Martinez et al. [7], two-stage configuration is considered as a primary method to improve the quality of the producer gas by reducing its tar content. The air flow fed to the gasifier and its distribution between stages can be controlled and measured. By varying these variables, the results suggest that a reduction of the CH4 concentration in a double stage downdraft gasifier is associated with the decreases of the tar content in the produced gas.
Zero-dimensional equilibrium models [42] are not affected by the geometry of the gasifier, are similar from each other in terms of the premises and the gasification reactions involved, and are a useful tool for preliminary comparison. For this reason, several attempts of modifications have been proposed by many authors, such as the correction of the equilibrium constants, or the quasi-equilibrium approach.
These models are useful to verify the influence of operational parameters on the produced gas, and to estimate the gasification process. The equilibrium model developed is also able to predict results for mixtures of steam and enriched air as gasifying fluids.
Making the stoichiometric balance for each element, a set of equations may be determined:
Carbon:
x = a 1 + a 2 + a 5
Hydrogen:
y + 2 α + 2 β = 2 a 3 + 2 a 4 + 4 a 5
Oxygen:
z + α + γ + 2 β = 2 a 1 + a 2 + a 4 + 2 a 7
Nitrogen:
w + 2 δ β = 2 a 6
Sulfur:
v = a 7
and the sum of the molar ratios of the products:
a 8 = a 1 + a 2 + a 3 + a 4 + a 5 + a 6 + a 7 + a 8
The equilibrium model assumes that all chemical reactions are in thermodynamic equilibrium, and the main reactions involved are described below:
Water gas shift reaction:
C O + H 2 O C O 2 + H 2
Metanation reaction:
C + 2 H 2 C H 4
Assuming that all reactions take place at atmospheric pressure and that all gases are ideal, the general equation of the equilibrium constants can be written as a result of minimizing the Gibbs equation:
Thus, the equilibrium constants k1 and k2 can be written as:
k 1 = a 1 a 3 a 2 a 4 = e ( g ¯ T , C O 2 + g ¯ T , H 2 g ¯ T , C O g ¯ T , H 2 O ) / R T
k 2 = a 5 ( a 3 ) 2 = e ( g ¯ T , C H 4 2 g ¯ T , H 2 ) / R T
where g(T, i) is defined as the Gibbs equation:
g ¯ T , i = h ¯ T T s ¯ T ( kJ kmol )
and the temperature equilibrium of the reactions can be determined by the first law of thermodynamics, which can be written as a function of the enthalpy of the reagents and the reaction products:
R N i h ¯ i r P N f h ¯ i p = 0
where h ¯ i r is the formation enthalpy (kJ/kmol) of the reagents in the reference state (T0 = 298.15 K and P0 = 1 atm), and h ¯ i p is the formation enthalpy of products.
Specific heat, enthalpy, and entropy may be calculated as a function of temperature according to Equations (15) and (16) [28,43]. The 7 polynomial coefficients, c1 to c7, can be used to calculate the following functions:
c p = R ( c 1 + c 2 T + c 3 T 2 + c 4 T 3 + c 5 T 4 )   ( kJ kmol   K )
h = R ( c 1 T + c 2 T 2 2 + c 3 T 3 3 + c 4 T 4 4 + c 5 T 5 5 + c 6 )   ( kJ kmol )
s = R ( c 1 l n T + c 2 T + c 3 T 2 2 + c 4 T 3 3 + c 5 T 4 4 + c 7 )   ( kJ kmol   K )
Considering the stoichiometric combustion of biomass and the equivalence ratio (ER):
C x H y O z N w S v + β s t o i c h ( O 2 + δ N 2 ) x C O 2 + y 2 H 2 O + ( w 2 + δ β e s t ) N 2 + v S O 2
β can be determined through the oxygen balance:
β s t o i c h = x + y 4 z 2 + v
The best performance parameters to validate the thermodynamic model for reactor operating conditions are the gasification temperature and the dimensionless variable, Equivalence Ratio (ER). Hence, the calculation of the equivalence ratio is as follows:
β = β s t o i c h E R
The molar amount of moisture in the biomass can be defined as a function of molecular weight of the biomass on a wet basis and moisture content (MC):
α = M C · M b i o M H 2 O ( 100 M C )
From the steam to biomass ratio (SB), which is defined as the ratio of the steam mass flow and mass flow of dry biomass, it is possible to determine the amount of steam molar content:
γ = S B ( M b i o + α M H 2 O ) M H 2 O
Finally, the value of δ from the oxygen content of the gasifying fluid:
δ = 100 O P O P   ( % )
When gasifying with air, OP = 21% and the δ value assumes the value of 3.76. When gasifying with 100% oxygen, δ tends to zero. The Equations 20, 21, and 22 where obtained from sources [44,45].
A nonlinear system, which has unknowns, i.e., molar ratios of the products a1 to a8, as well as thermodynamic equilibrium temperature, is generated from the equations of mass balance and equilibrium constants. The coefficients a1 through a8 are used for the energy equation solution, and integration results in a polynomial equation of temperature.
To solve the nonlinear system and the temperature of the polynomial equation, the solve Scilab® function was applied in an iterative process where the initial temperature is assumed.
From the thermodynamic tables, it is possible to determine the enthalpy of formation of the components at the reference temperature 298 K as follows:
Enthalpy of vaporization of water:
h l v = 2258   ( kJ kmol )
And the enthalpies of formation of the components:
h f 0 ¯ C O 2 = 393546   ( kJ kmol )
h f 0 ¯ C O = 110541   ( kJ kmol )
h f 0 ¯ C H 4 = 74831   ( kJ kmol )
h f 0 ¯ H 2 O   l = 285855   ( kJ kmol )
h f 0 ¯ H 2 O   g = 241845   ( kJ kmol )
h f 0 ¯ N 2 = 0
h f 0 ¯ H 2 = 0
h f 0 ¯ S O 2 = 296842   ( kJ kmol )
h f 0 ¯ N O = 90297   ( kJ kmol )
Fuel enthalpy for general solid fuel can be determined according to Equation (33) below [23]:
h f 0 f u e l = L H V d , f + 1 M f u e l j = p r o d ν j h f 0 ¯ j
where L H V d , f is the low heat value of fuel in a dry basis.
The representative molar mass of the biomass is given by the components in its formula:
M f = j = p r o d a j M j
The coefficient, aj, is determined from the ultimate analysis (wj, dry basis):
a j = ω d , j M j · M C ω d , C
The two thermodynamic parameters usually applied to evaluate the gasification performance are the syngas heating value and cold gas efficiency.
The cold gas efficiency of the gasifier is defined as the ratio between the produced gas energy and the energy content of the biomass:
C G E = a 9 R T 0 P 0 L H V g a s M b i o L H V B i o   ( % )
The useful gas power is obtained by taking producer gas flow, in kg/s, its specific mass, in kg/m3, and its lower heating value, in kJ/Nm3, into account.
The producer gas lower heating value, in (kJ/(Nm3)), is calculated using the following equations:
L H V g a s = i = 1 n ( Y i L H V i )
L H V g a s = 126 v C O + 358 v C H 4 + 108 v H 2 1000 MJ N m 3
where v C O , v C H 4 , and v H 2 are C O , C H 4 , and H 2 volumetric concentrations.

3.2. Model Validation

The model is validated using experimental data from Campoy et al. [46]. The comparisons were for test cases with mixtures of steam and enriched air. Table 2 shows the different cases, with their respective equivalence ratios, steam to biomass ratios (SB > 0), and enriched air fractions (OP > 0).
The ultimate analysis of the dry biomass employed by the authors is C = 50.76%, H = 5.92%, O = 43.32%, and moisture = 6.3%. With these input data, simulations were carried out for the test conditions listed. “E” corresponds to experimental results, and “M” to the results obtained with the model developed in this study.
As the model is designed for equilibrium conditions, the parameters that are most likely to produce the appropriate conditions are those at a low ER and a low OP. Conditions that support high temperature and quick combustion, such as high ER and/or high OP, will be furthest from equilibrium, and should deviate most from model predictions. The cases closest to equilibrium parameters are 4, 5, 8, and 9 (highlighted). The model’s results are 2 to 2.6% RMS different from those of the experimental results, which corresponds to a 10–20% difference in predicted value for each species.
A secondary effect is that the model has no tar production mechanism. This means that conditions that produce a lot of tar will deviate from model predictions.
The root mean squared errors were calculated (RMS) for each test, and the amounts in the table below by the expression below, where Ei values are the experimental values and Mi to the values predicted by the mathematical model where N is the number of experiments as shown below:
R M S = ( E i M i ) 2 N
The model predicts the amounts of H2 with good accuracy when gasifying with air. However, it overestimates the content of H2 when gasifying with air and rich oxygen mixtures. Equilibrium models from literature generally overestimate the hydrogen content [46,47].

4. Results

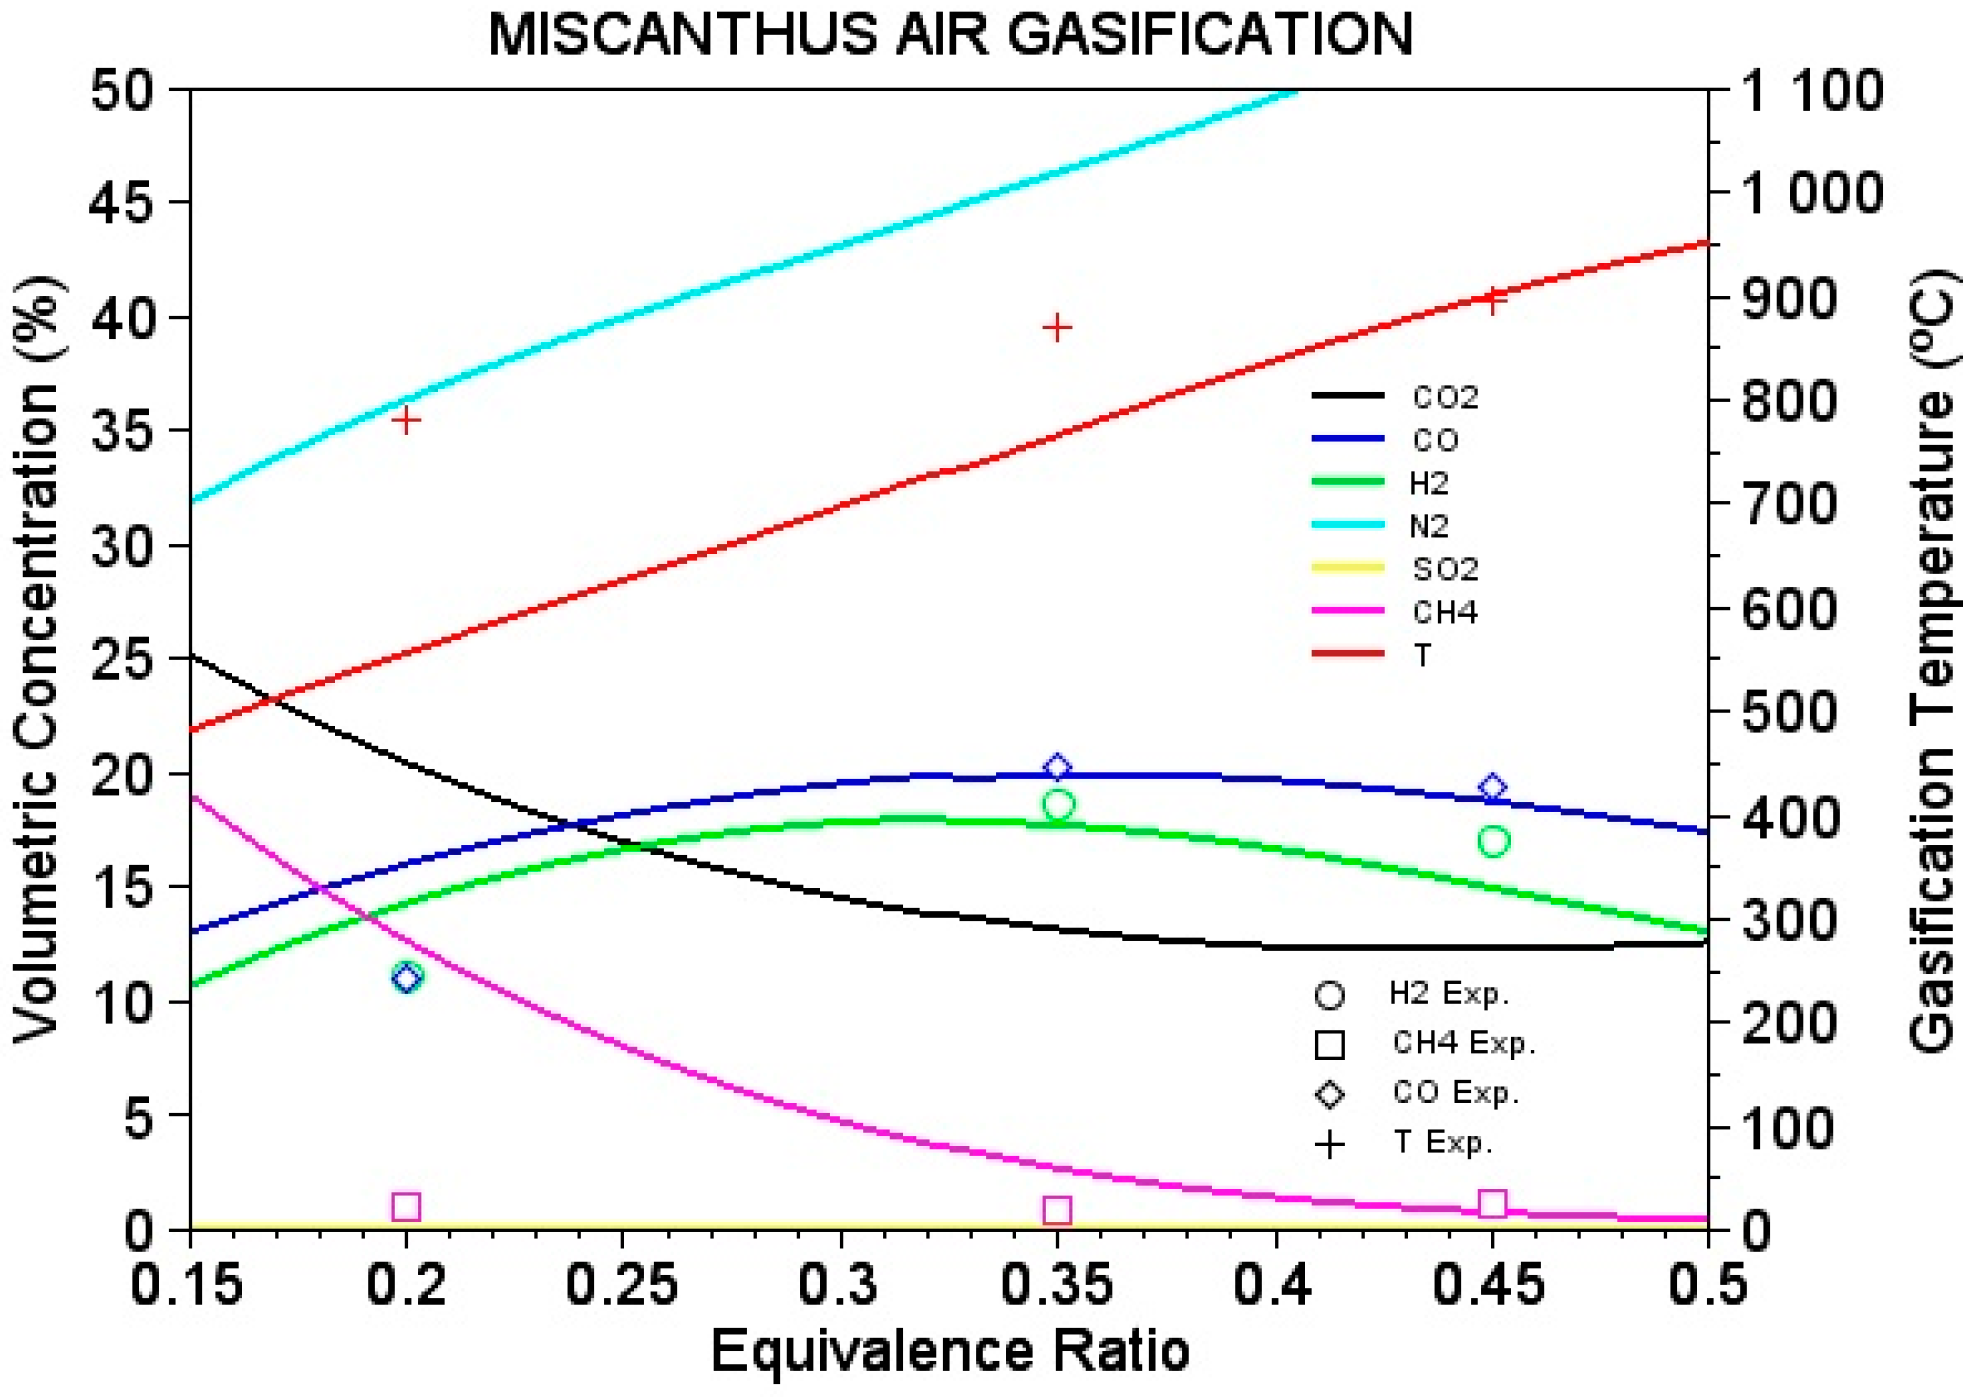
4.1. Gas Composition and Analysis

The average syngas contents, obtained at equivalence ratios of 0.2, 0.35, and 0.45, can be seen in Table 3:
Figure 3 shows the CO, CH4, and H2 concentration content at the equivalence ratio of 0.35. The maximum average syngas content at 0.35 was found to be 20.29% CO, 18.68% H2, and 0.86% CH4. These results agree with others from literature. The gas compositions obtained in the experiment are similar to those in the gasification of Eucalyptus: 19.2% CO, 17.14% H2, and 1.3% CH4 [15]. Kallis et al. carried out Miscanthus gasification on a downdraft gasifier with ER values between 0.27 and 0.30, which yielded a syngas composition of 14.26% CO, 11.29% H2, and 1.93% CH4 [29]. The results from Kallis et al. (obtained at ER = 0.28) show a smaller percentage in CO and H2, but a higher CH4 composition, when compared to our results. This difference could be due to the low ER used.
Figure 4 shows the respective temperatures within the gasifier in a steady state. The measured temperatures may not be precise due to the location of the thermocouples along the gasifier wall. However, this gives a general idea of the temperatures in each zone. The drying and pyrolysis zones correspond (in location) to the primary air inlet, while the combustion and reduction zones correspond to the secondary air inlet.
As seen in Figure 4, the thermal equilibrium zone is much wider than the temperature profiles obtained in a single stage gasifier such as those listed in [48,49], in which thermal equilibrium is much smaller. Therefore, the thermal equilibrium zone in the second stage downdraft gasifier is wider and more stable than a single-stage downdraft gasifier.

4.2. Comparison to Simulation Model

The developed equilibrium model [50] was applied to investigate the performance of the double-stage downdraft gasifier. This model used the same conditions and parameters as those of the experiment using air as the gasifying agent. The ER and the biomass composition were used to predict the output gas quality. The simulation results of the producer gases with respect to ER and temperature can be seen in Figure 5:
It can be seen that most of the experimental points are closer to simulation lines. From the comparison, one can see that the CO and H2 concentrations peaked at ER = 0.35, which was consistent with the experimental results. We can also see the experimental and simulation results are closer at an ER of 0.45.

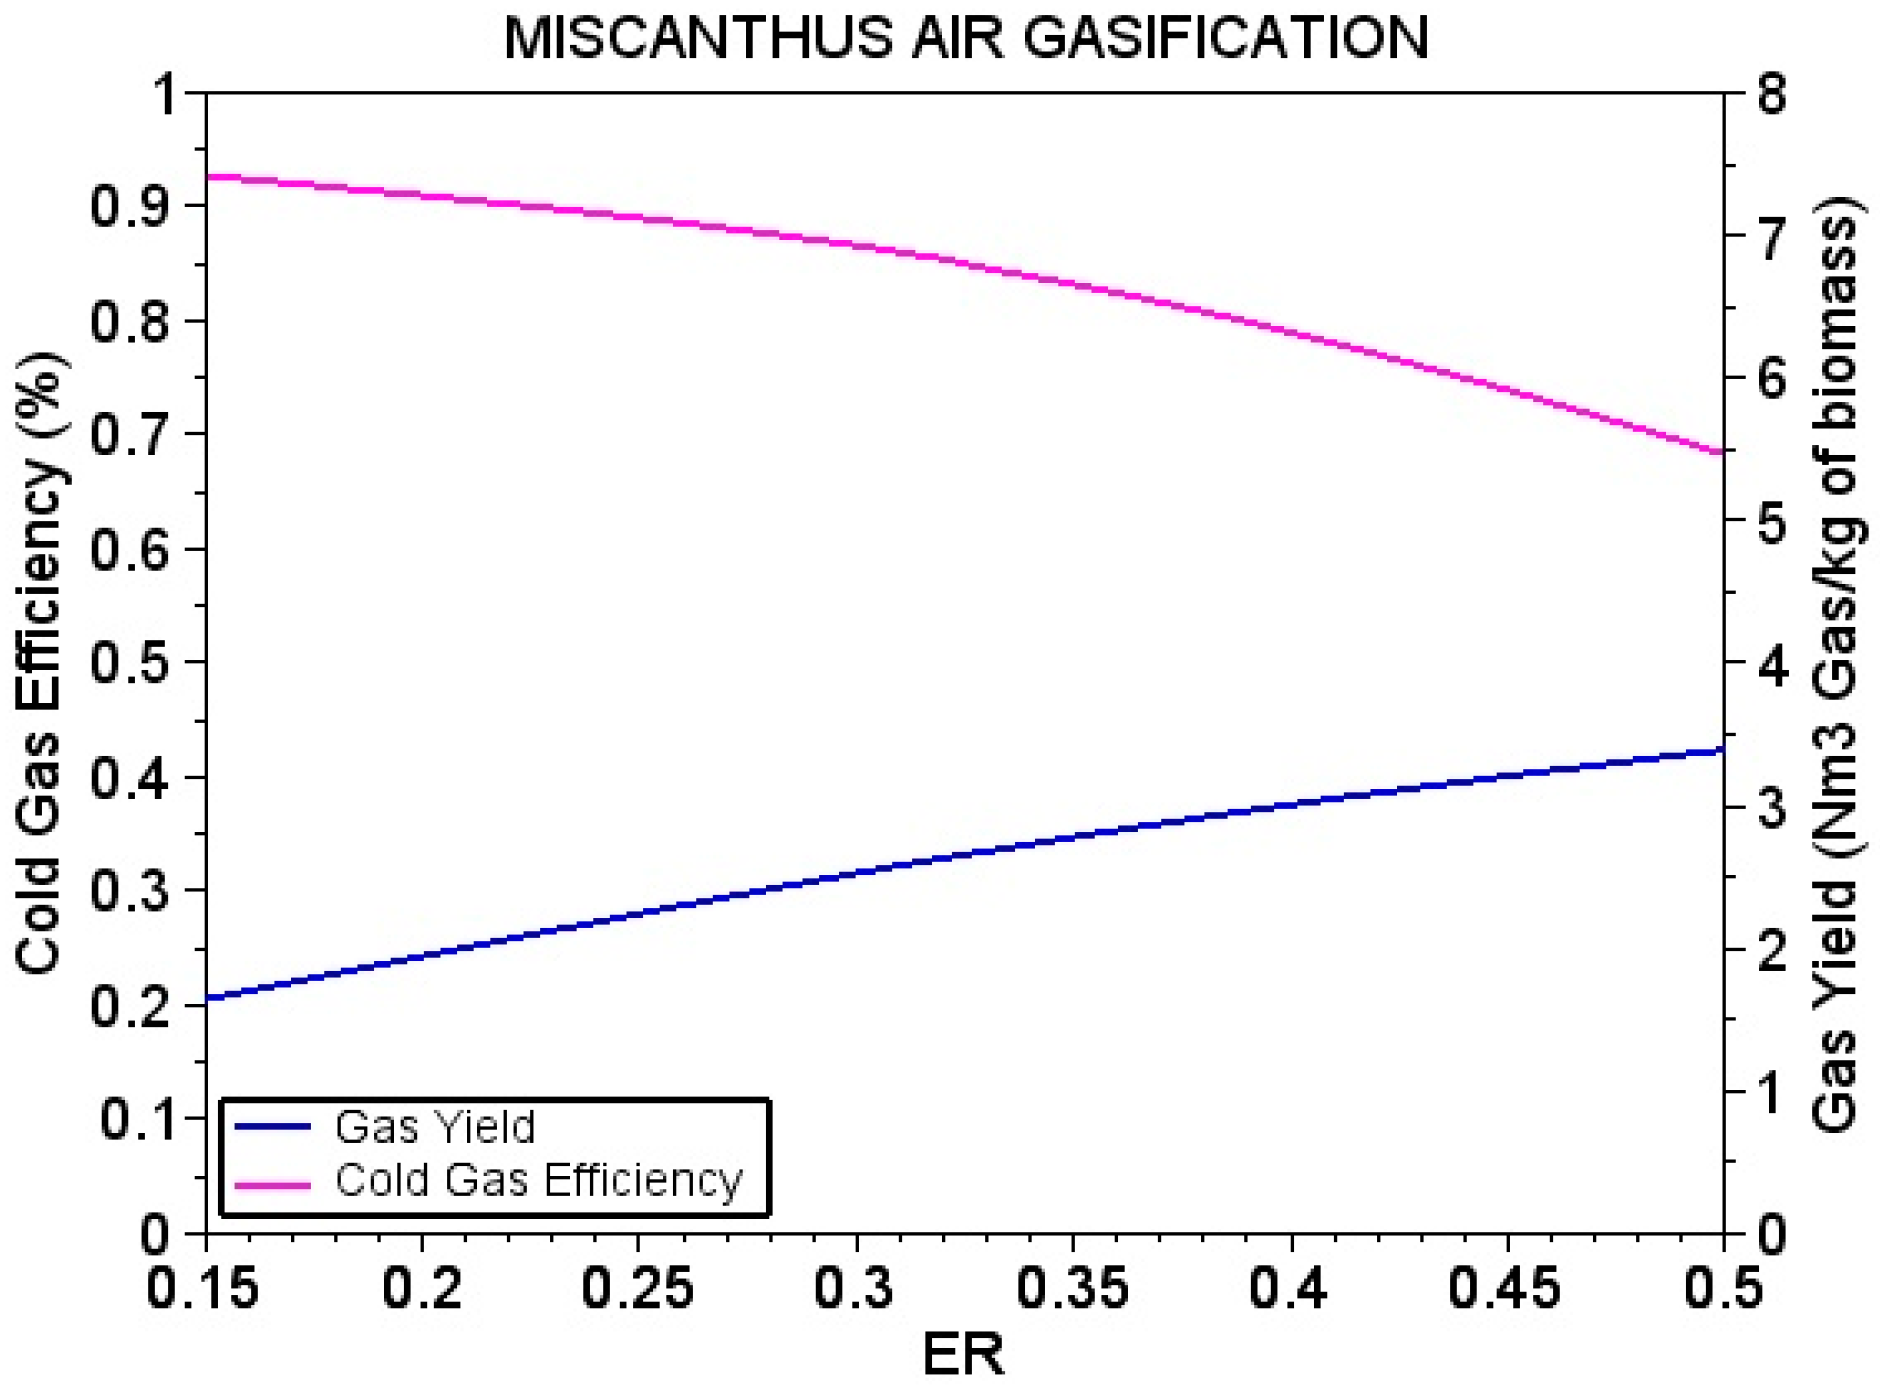
4.3. Performance of Variables
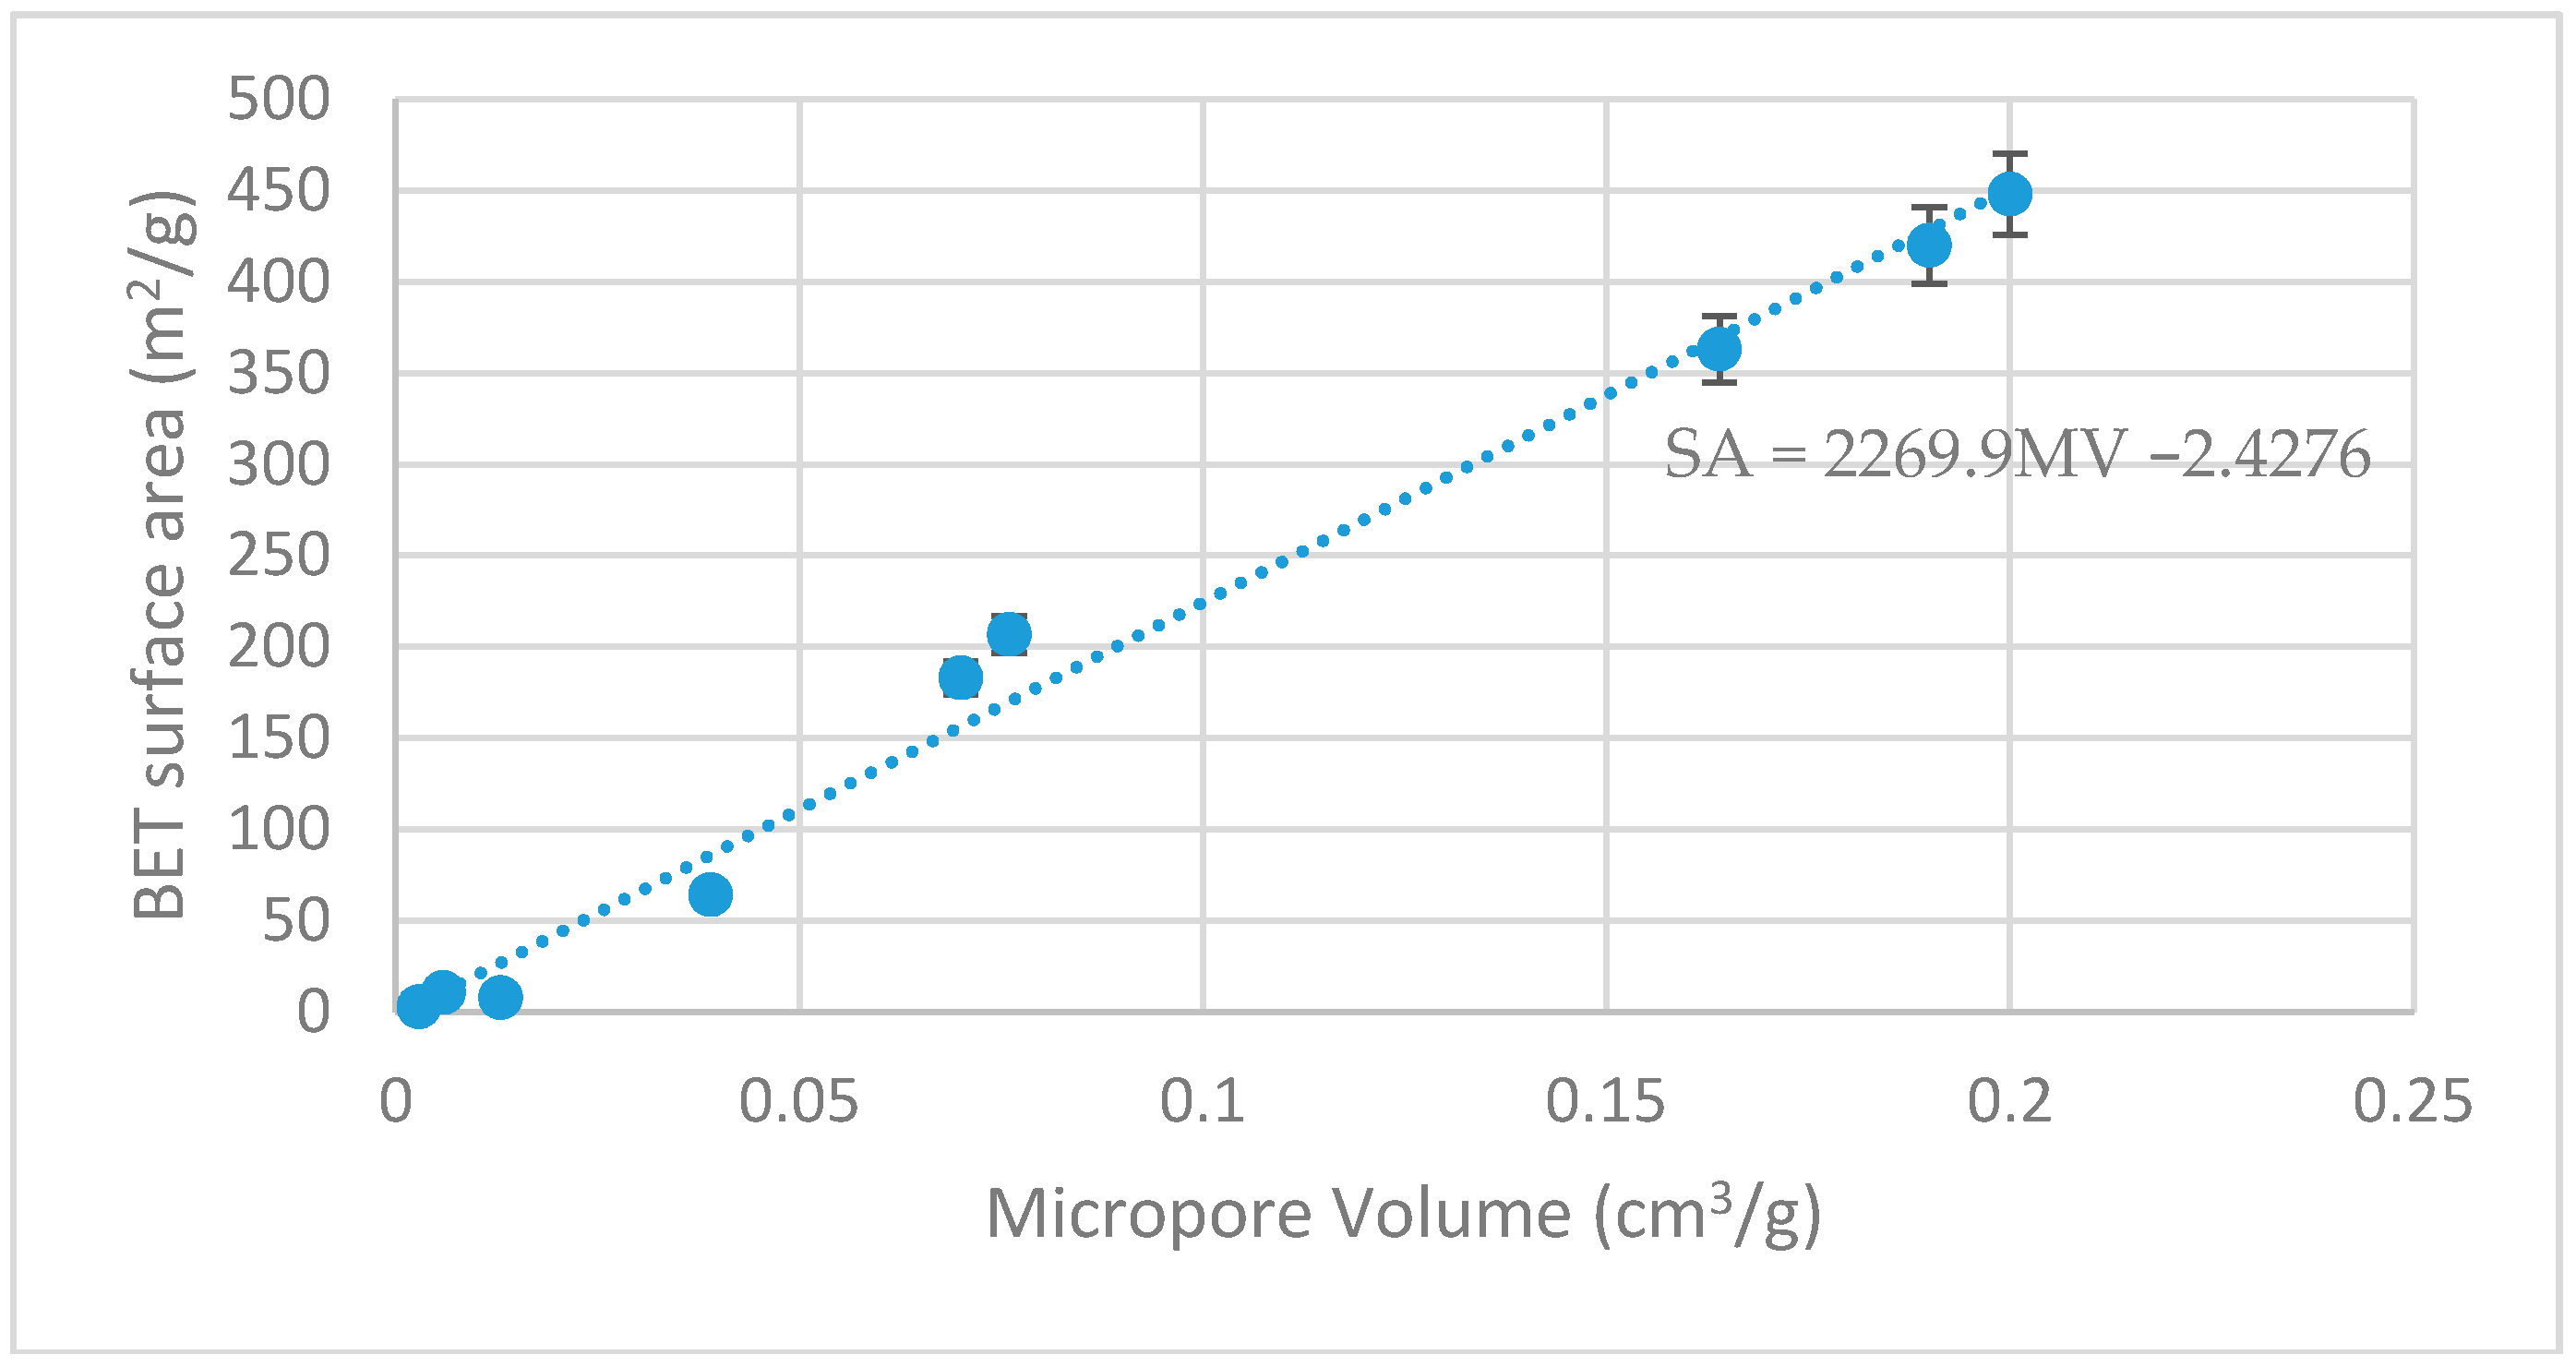
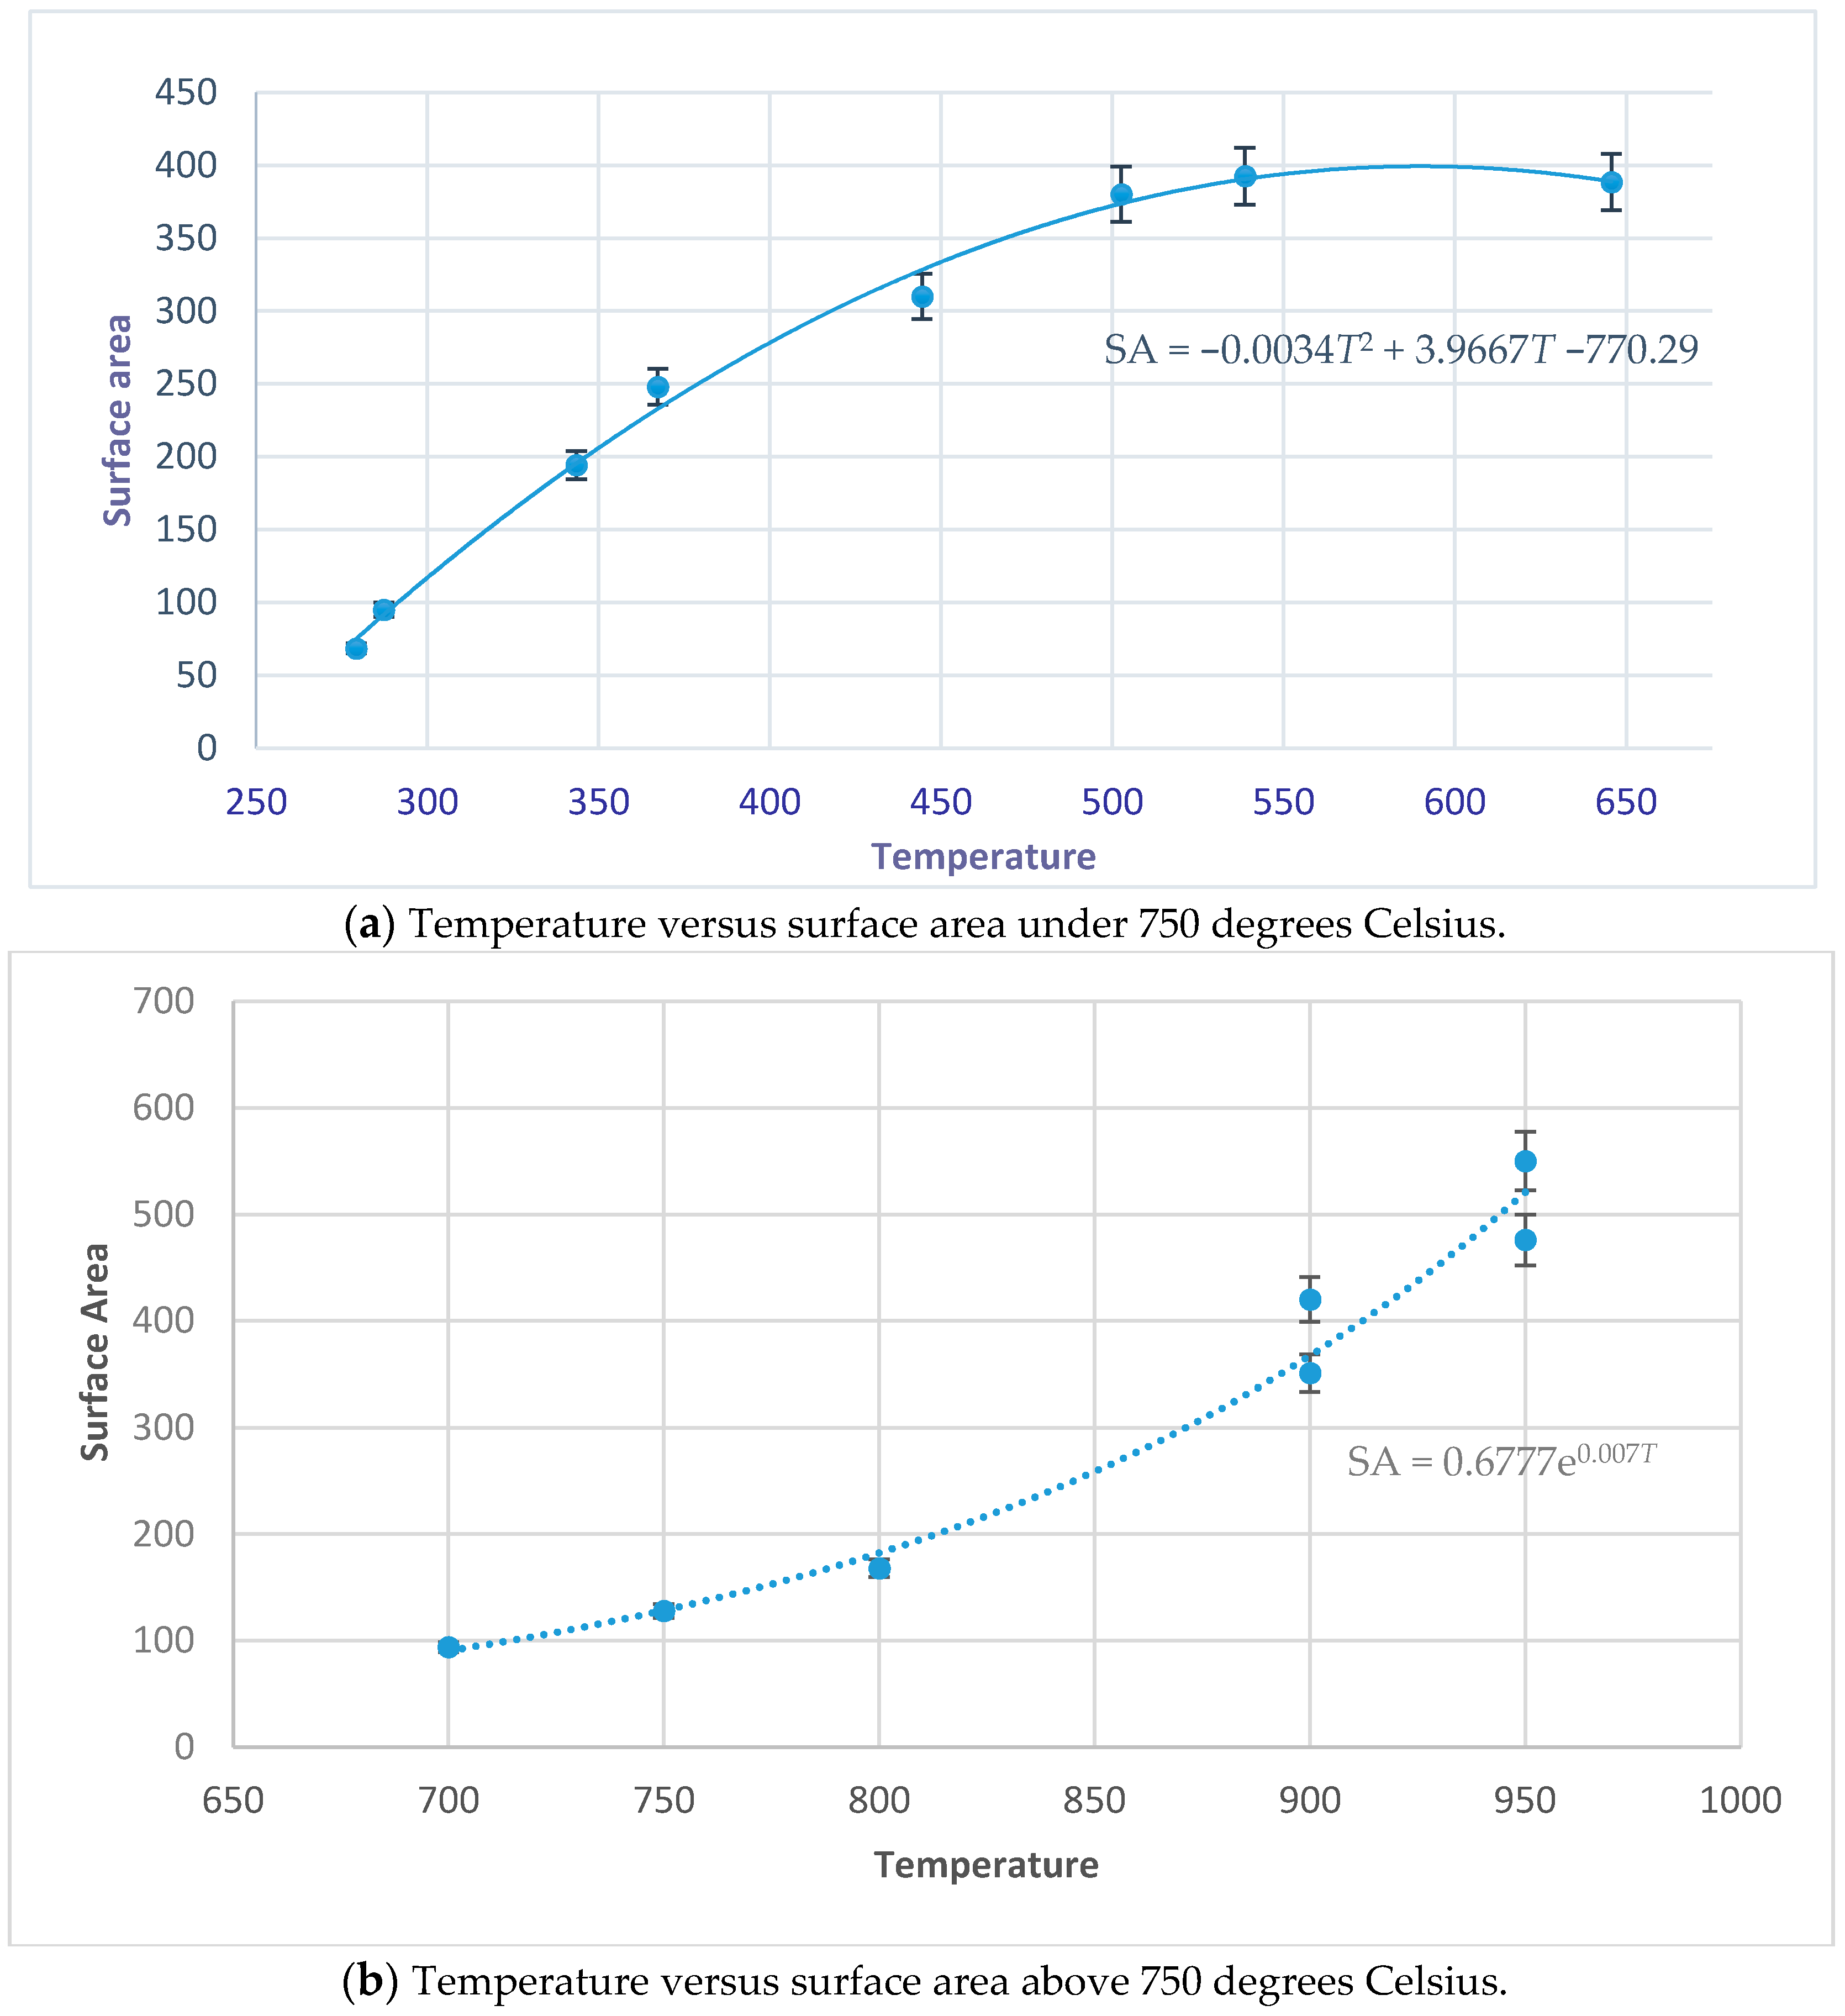
• Biomass consumption
The amount of biomass consumed in a system every hour is highly dependent on the equivalence ratio of the system [7,39]. The biomass consumption in this experiment was, on average, 14 kg/h, with an average airflow of 24 Nm3/h.
Figure 6 shows the gas LHV with respect to ER. It was observed that the LHV of the gas decreased with an increase in ER. At an equivalence ratio of 0.35, the LHV was calculated to be approximately 5.5 MJ/Nm3, which corresponds to the experimental value.
• Gas Yield and Cold Gas Efficiency
When plotting the cold gas efficiency with respect to the ER, one can see that an increase in ER leads to an increase in gas yield. This also agrees with other the experimental studies, such as the one carried out by Kallis et al. [29]. The gas yield, at an ER of 0.35, was calculated to be 3 Nm3/kg of biomass. The plot of the cold gas efficiency with respect to the ER is shown in Figure 7.

4.4. Biochar

• BET biochar analysis
The BET analysis provides a precise surface evaluation of a material by using a gas multilayer adsorption. A Nova 4200 instrument was used to calculate the surface area of the biochar using a nitrogen adsorption method. A degassing temperature of 150 °C was used for a time period of 10 h. The surface area of Miscanthus biochar was 186.06 m2/g. Experiments carried out by Cetin et al. [51] found that surface areas of other biochar, such as pine char, range from 236 to 296 m2/g. Other studies also showed biochar with a surface area of 141 m2/g to increase water retention and reduce toxic pollutants in fields, such as mines [52].
The Micro-pore volume of the Miscanthus biochar from the double stage downdraft gasifier was calculated using the Dubinin-Radushkevich equation [53]. The biochar was found to have a micro-pore volume of 0.07 cm3/g. When comparing to other studies [54,55,56,57,58], as seen in Figure 8, we see that miscanthus biochar falls in the medium porous region. The biochar with a surface area between 0–100 m2/g with a micro pore volume between 0–0.05 cm3/g can be considered to be a low porous region, while those with a surface area of greater than 400 m2/g (mostly activated carbon) with micro-pore greater than 0.15 can be considered to be in higher porosity region.
Temperature is one of the parameters that affects the surface of the biochar. There are many studies done which look into the general behavior of temperature and biochar surface area. The general trends reported by Lehman et al. [59] as plotted in Figure 9a, show that in thermal pyrolysis conditions, the surface area peaks at around 400 m2/g. For gasification studies in Figure 9b [60,61,62], where air was used to provide significant heat to the system, the air significantly reduces the porosity at 700 degrees Celsius to a 100 m2/g. Our data point fills the part of the gap where the biochar temperature is 800 degrees and the data at 950 has a higher porosity, as seen in Figure 9b. We see a keen sensitivity to temperature, and that there is a high porosity with significant oxygen and at high temperatures. What is surprising is that at 650 degrees, the amount of porosity reduces significantly.
Although these graphs do not fully contain data from all the studies, they show that a quantifiable relationship can be inferred to predict the surface area of biochar at varying temperatures.
To better understand the outer surface structure of the char produced, a scanning electron microscope (SEM) (Hitachi S-4800) was used.
As seen in Figure 10, under a magnification of ×500 (at 100 µm), little or no pores could be observed on fresh Miscanthus; rather, the biomass appeared to be made up of solid cells strongly bonded together. However, once the biomass underwent the process of gasification, different sizes of pore openings could be observed under the same magnification, as seen in Figure 11, where the cells appeared to be loosely bound. These pores on the surface may be the result of high temperatures within the gasifier. The high temperature in the gasifier leads to the weakening of the cell structure of the biomass [24,51].
Figure 12 and Figure 13 represent the SEM images of Miscanthus biochar at different locations under a higher magnification of ×1 k at 50 µm. It was observed that the pore sizes on the Miscanthus biochar ranged from 2 to 30 µm.
The pores on the surface may explain why biochar acts as a useful soil amendment. The pores on the surface of the biochar may enable an increase in nutrient absorption in the soil.

4.5. Tar Analysis

To capture the tar, the solid particles from the gas were filtered using a heated particulate filter at 300 °C (module 1), and tar was captured using five of the six impingers which contained isopropanol (module 2) as shown in Figure 14. A pump was used to extract the gas. The gas flow rate and temperature were monitored. The sample gas was passed through for an hour at a steady state. The temperature of the isopropanol was kept under 0 °C by using a mixture of salt and water. The cold temperature condensed the tar, which was present in vapor form in the producer gas. The average amount of tar present after particulate filtering was calculated to be 14.95 mg/Nm3. This is a popular method of capturing tar [63].
One of the key parameters that affects the amount of tar produced is temperature. In previous studies done by Galindo et al. [15], it was observed that an increase in temperature in the combustion zone leads to a significant decrease in tar content. Figure 15 shows a logarithmic relationship between temperature and tar production.
The following equations can be obtained:
Tar   concentration   ( g / N m 3 ) = e 7.836 ln ( T ) + 56.14
which can be reduced to:
Tar   concentration   ( g / N m 3 ) = 3.49718 × 10 24 T 7.836
where T is the temperature in °C in the combustion zone.
According to a study done by Basu, the limits of allowed tar content in producer gas for a gas turbine operation range from 0.05 to 5 mg/Nm3 [3], while internal combustion engines are limited to 50–100 mg/Nm3 [12]. Tars can condense in an internal combustion engine which can lead, in the long run, to damage in internal combustion engines [9]. The tar content from this study is relatively lower than the limits for a gas turbine and internal engine. As such, the syngas from the gasifier can go through minimal cleanup before been inserted to an internal combustion engine. This, in practice, could save some financial costs when converting syngas to other forms of energy.

5. Conclusions

From this study, it can be concluded that the optimum ER at which Miscanthus briquettes can be gasified in a double-stage downdraft gasifier is 0.35. This ER produced the highest content of CO and H2 at 20.29% CO and 18.68% H2, which yielded the maximum syngas heating value content of 5.5 MJ/Nm3, and was compared to gasification model. The model was developed based on stoichiometric equilibrium, also known as the Gibbs free energy minimization method. The Root mean square value between the experimental and simulation data was found to be 3.89. The discrepancy between actual and simulated results could be attributed to certain assumptions that were made in the model, such as the absence of tar, and that all gases involved were considered to be ideal, i.e., with no residue. The model also showed that the heating value decreased with increasing ER, and that hydrogen production peaked at ER = 0.37, while methane (CH4) production became negligible above ER = 0.42.
The surface area of Miscanthus biochar from the double stage downdraft gasifier was found to be 186.06 m2/g, and volume pore surface area was calculated to be 0.07 cm3/g. We found that the biochar from the double stage gasifier could be considered to fall within a medium porosity area, while those with higher volume and surface area such as activated biochar may be categorized as having a high porosity area. The structure of the biochar was also studied and the pores were examined. These pores, once immersed in the solid, absorb nutrients which enables plants to grow. By comparing our biochar data with those of other authors, we find that the biochar’s volume pore increases with an increase in surface area. A relationship between biochar properties and the temperature was also found. With reference to other studies, a predictive model could be used to approximate the surface area of biochar. Further studies on a specific gasifier would have to be done to fully validate this model. The average amount of tar present after particulate filtering was calculated to be 14.95 mg/Nm3. The amount of tar produced in a downdraft gasifier is much lower than the single stage gasifier. We see that a relationship between temperature and tar can be obtained, and can be used to predict the amount of tar formed. Similarly, if one could find a relationship between syngas content, biochar production, and tar, this would help to optimize the double-stage downdraft gasifier system.

Author Contributions

Data curation, T.S., D.M.Y.M., F.R.M.N., Y.S. and A.R.; Formal analysis, T.S., D.M.Y.M., F.R.M.N. and A.R.; Funding acquisition, A.R. and E.E.S.L.; Investigation, T.S., D.M.Y.M. and Y.S.; Methodology, T.S. and D.M.Y.M.; Project administration, A.R. and E.E.S.L.; Software, F.R.M.N.; Supervision, A.R. and E.E.S.L.; Validation, F.R.M.N.; Writing—original draft, T.S.; Writing—review & editing, T.S., D.M.Y.M., F.R.M.N., Y.S., A.R., E.E.S.L., L.M., J.C.E.P. and R.V.A.

Funding

This research was funded thanks to the Committee on Coordination of Improvements in Higher Education (CAPES), Call Projects: MEC/MCTI/CAPES/CNPq/FAPs No. 71/2013-Special Guest Researcher using the grant number: 152583. Process: 88881.030460/2013-01. The material in this paper is also based upon work supported by the National Science Foundation/ EPSCoR grant #EPS-1101284. We also would like to thank the USDOT UTC Mid America Transportation Center (MATC), grant # 69A3551747107 for their support.

Acknowledgments

We would also like to thank the graduate Stanley grant at the University of Iowa, and the continuous support from the Federal University of Itajubá. The authors would also like to express their gratitude to the National Research Council of Brazil (CNPq), the Committee on Coordination of Improvements in Higher Education (CAPES), and the Foundation of Science Support from the State of Minas Gerais (FAPEMIG) for graduate and research productivity grants allocations. We would also like to thank Nathaniel Weger, Shri Mailachalam, Brett Austin, Stephen Pitts and Gurjap Singh for revising this paper. This research is funded, in part, by the Mid-America Transportation Center via a grant from the U.S. Department of Transportation’s University Transportation Centers Program, and this support is gratefully acknowledged. The contents reflect the views of the authors, who are responsible for the facts and the accuracy of the information presented herein, and are not necessarily representative of the sponsoring agencies.

Conflicts of Interest

There are no conflicts of interest.

Nomenclature

AAsh content (%)
A/FAir Fuel
a1a8Stoichiometric coefficients of gasification products reaction
C Carbon
c Specific Heat (kJ/kgK)
CGECold gas efficiency (%)
c1c7Burcat polynomial coefficients
EREquivalence ratio
g ¯ Gibbs Equation (kJ/kmol)
h Specific enthalpy (kJ/kg)
HHydrogen
h f 0 Formation enthalpy (kJ/kmol)
k Equilibrium constant
m Mass (kg)
MMolecular mass (kg/kmol)
M C Biomass moisture-umid basis%
NNitrogen
OPOxygen concentration (%)
OOxygen
HVHeat Value (kJ/kg)
LHVLow heat value (kJ/kg)
HHVHigh heat value (kJ/kg)
SBSteam biomass ratio
SSulfur %
sSpecific entropy (kJ/kgK)
vNumber of sulfur atoms contained in biomass
xNumber of carbon atoms contained in biomass
x Molar fraction
X 1 X n Stoichiometric coefficients
yNumber of hydrogen atoms contained in biomass
Y Gas yield (kg gás/kg biomass)
wNumber of nitrogen atoms contained in biomass
zNumber of oxygen atoms contained in biomass
Subscripts
dbdry basis
biobiomass
drybiodry biomass
ccombustion
ccarbon
stoichstoichiometric
ccold
ggas
ggasification
hhydrogen
icomponent
jproduct
llíquid
lvlíquid vapor
mmass
nnitrogen
ooxygen
piropyrolysis
pconstant pressure
pproduct
rreagent
ssolid
ssulfur
Ttemperature
wwet
vvapor, volumetric
vstoichiometric coefficient for sulfur
xstoichiometric coefficient for carbon
ystoichiometric coefficient for hydrogen
zstoichiometric coefficient for oxygen
wstoichiometric coefficient for nitrogen
Greek letters
αMolar content of moisture biomass
βAir molar content
γMolar content of water vapor
δNitrogen molar content
νMatrix of stoichiometric coefficients
ωPercentage in elementary analysis (%)

References

  1. Sen, S.; Ganguly, S. Opportunities, barriers and issues with renewable energy development—A discussion. Renew. Sustain. Energy Rev. 2017, 69, 1170–1181. [Google Scholar] [CrossRef]
  2. International Energy Agency. Africa Energy Outlook 2014; International Energy Agency: Paris, France, 2015. [Google Scholar]
  3. Basu, P. Biomass Gasification, Pyrolysis and Torrefaction: Practical Design and Theory; Academic Press: Cambridge, CA, USA, 2013. [Google Scholar]
  4. Sikarwar, V.S.; Zhao, M.; Clough, P.; Yao, J.; Zhong, X.; Memon, M.Z.; Fennell, P.S. An overview of advances in biomass gasification. Energy Environ. Sci. 2016, 9, 2939–2977. [Google Scholar] [CrossRef] [Green Version]
  5. Son, Y.I.; Yoon, S.J.; Kim, Y.K.; Lee, J.G. Gasification and power generation characteristics of woody biomass utilizing a downdraft gasifier. Biomass Bioenergy 2011, 35, 4215–4220. [Google Scholar] [CrossRef]
  6. Ravikiran, A.; Renganathan, T.; Pushpavanam, S.; Voolapalli, R.K.; Cho, Y.S. Generalized analysis of gasifier performance using equilibrium modeling. Ind. Eng. Chem. Res. 2011, 51, 1601–1611. [Google Scholar] [CrossRef]
  7. Martinez, J.D.; Lora, E.E.S.; Andrade, R.V.; Jaén, R.L. Experimental study on biomass gasification in a double air stage downdraft reactor. Biomass Bioenergy 2011, 35, 3465–3480. [Google Scholar] [CrossRef]
  8. Molino, A.; Larocca, V.; Chianese, S.; Musmarra, D. Biofuels production by biomass gasification: A review. Energies 2018, 11, 811. [Google Scholar] [CrossRef]
  9. Huang, J.; Schmidt, K.G.; Bian, Z. Removal and conversion of tar in syngas from woody biomass gasification for power utilization using catalytic hydrocracking. Energies 2011, 4, 1163–1177. [Google Scholar] [CrossRef]
  10. Soomro, A.; Chen, S.; Ma, S.; Xiang, W. Catalytic activities of nickel, dolomite, and olivine for tar removal and H2-enriched gas production in biomass gasification process. Energy Environ. 2018, 29, 839–867. [Google Scholar] [CrossRef]
  11. Shrestha, S.; Ali, B.S.; Hamid, M.D.B. Cold flow model of dual fluidized bed: A review. Renew. Sustain. Energy Rev. 2016, 53, 1529–1548. [Google Scholar] [CrossRef]
  12. Devi, L.; Ptasinski, K.J.; Janssen, F.J. A review of the primary measures for tar elimination in biomass gasification processes. Biomass Bioenergy 2003, 24, 125–140. [Google Scholar] [CrossRef]
  13. Paethanom, A.; Nakahara, S.; Kobayashi, M.; Prawisudha, P.; Yoshikawa, K. Performance of tar removal by absorption and adsorption for biomass gasification. Fuel Process. Technol. 2012, 104, 144–154. [Google Scholar] [CrossRef]
  14. Bui, T.; Loof, R.; Bhattacharya, S.C. Multi-stage reactor for thermal gasification of wood. Energy 1994, 19, 397–404. [Google Scholar] [CrossRef]
  15. Galindo, A.L.; Lora, E.S.; Andrade, R.V.; Giraldo, S.Y.; Jaén, R.L.; Cobas, V.M. Biomass gasification in a downdraft gasifier with a two-stage air supply: Effect of operating conditions on gas quality. Biomass Bioenergy 2014, 61, 236–244. [Google Scholar] [CrossRef]
  16. Reed, T.B.; Walt, R.; Ellis, S.; Das, A.; Deutch, S. Superficial velocity—The key to downdraft gasification. In Biomass—A Growth Opportunity in Green Energy; Overend, R., Chornet, E., Eds.; Pergamon Press: Pergamon, Turkey, 1999. [Google Scholar]
  17. Peterson, S.C.; Jackson, M.A.; Kim, S.; Palmquist, D.E. Increasing biochar surface area: Optimization of ball milling parameters. Powder Technol. 2012, 228, 115–120. [Google Scholar] [CrossRef]
  18. Brewer, C.E.; Schmidt-Rohr, K.; Satrio, J.A.; Brown, R.C. Characterization of biochar from fast pyrolysis and gasification systems. Environ. Prog. Sustain. Energy 2009, 28, 386–396. [Google Scholar] [CrossRef]
  19. Bhandari, P.N.; Kumar, A.; Bellmer, D.D.; Huhnke, R.L. Synthesis and evaluation of biochar-derived catalysts for removal of toluene (model tar) from biomass-generated producer gas. Renew. Energy 2014, 66, 346–353. [Google Scholar] [CrossRef]
  20. Qian, K.; Kumar, A.; Patil, K.; Bellmer, D.; Wang, D.; Yuan, W.; Huhnke, R.L. Effects of biomass feedstocks and gasification conditions on the physiochemical properties of char. Energies 2013, 6, 3972–3986. [Google Scholar] [CrossRef]
  21. Atkinson, C.J. Establishing perennial grass energy crops in the UK: A review of current propagation options for Miscanthus. Biomass Bioenergy 2009, 33, 752–759. [Google Scholar] [CrossRef]
  22. Siedlecki, M.; De Jong, W. Biomass gasification as the first hot step in clean syngas production process-gas quality optimization and primary tar reduction measures in a 100 kW thermal input steam-oxygen blown CFB gasifier. Biomass Bioenergy 2011, 35, S40–S62. [Google Scholar] [CrossRef]
  23. Heo, H.S.; Park, H.J.; Yim, J.H.; Sohn, J.M.; Park, J.; Kim, S.S.; Ryu, C.; Jeon, J.K.; Park, Y.K. Influence of operation variables on fast pyrolysis of Miscanthus sinensis var. Purpurascens. Bioresour. Technol. 2010, 101, 3672–3677. [Google Scholar] [CrossRef] [PubMed]
  24. Porbatzki, D.; Stemmler, M.; Müller, M. Release of inorganic trace elements during gasification of wood, straw, and miscanthus. Biomass Bioenergy 2011, 35, S79–S86. [Google Scholar] [CrossRef]
  25. Michel, R.; Rapagnà, S.; Di Marcello, M.; Burg, P.; Matt, M.; Courson, C.; Gruber, R. Catalytic steam gasification of Miscanthus X giganteus in fluidised bed reactor on olivine based catalysts. Fuel Process. Technol. 2011, 92, 1169–1177. [Google Scholar] [CrossRef]
  26. De Jong, W.; Andries, J.; Hein, K.R. Coal-biomass gasification in a pressurized fluidized bed gasifier. In Proceedings of the ASME International GT and Aerospace Congress, Stockholm, SE, USA, 2–5 June 1998; pp. 1–7. [Google Scholar]
  27. Xue, G.; Kwapinska, M.; Horvat, A.; Li, Z.; Dooley, S.; Kwapinski, W.; Leahy, J.J. Gasification of Miscanthus × giganteus in an air-blown bubbling fluidized bed: A preliminary study of performance and agglomeration. Energy Fuels 2014, 28, 1121–1131. [Google Scholar] [CrossRef]
  28. Kwapinska, M.; Xue, G.; Horvat, A.; Rabou, L.P.; Dooley, S.; Kwapinski, W.; Leahy, J.J. Fluidized Bed Gasification of Torrefied and Raw Grassy Biomass (Miscanthus× gigantenus). The Effect of Operating Conditions on Process Performance. Energy Fuels 2015, 29, 7290–7300. [Google Scholar] [CrossRef]
  29. Kallis, K.X.; Susini, G.A.; Oakey, J.E. A comparison between Miscanthus and bioethanol waste pellets and their performance in a downdraft gasifier. Appl. Energy 2013, 101, 333–340. [Google Scholar] [CrossRef]
  30. Jayaraman, K.; Gökalp, I. Pyrolysis, combustion and gasification characteristics of miscanthus and sewage sludge. Energy Convers. Manag. 2015, 89, 83–91. [Google Scholar] [CrossRef]
  31. Khelfa, A.; Sharypov, V.; Finqueneisel, G.; Weber, J.V. Catalytic pyrolysis and gasification of Miscanthus Giganteus: Haematite (Fe2O3) a versatile catalyst. J. Anal. Appl. Pyrolysis 2009, 84, 84–88. [Google Scholar] [CrossRef]
  32. Ahmed, T.Y.; Ahmad, M.M.; Yusup, S.; Inayat, A.; Khan, Z. Mathematical and computational approaches for design of biomass gasification for hydrogen production: A review. Renew. Sustain. Energy Rev. 2012, 16, 2304–2315. [Google Scholar] [CrossRef]
  33. Baruah, D.; Baruah, D.C. Modeling of biomass gasification: A review. Renew. Sustain. Energy Rev. 2014, 39, 806–815. [Google Scholar] [CrossRef]
  34. Puig-Arnavat, M.; Bruno, J.C.; Coronas, A. Review and analysis of biomass gasification models. Renew. Sustain. Energy Rev. 2010, 14, 2841–2851. [Google Scholar] [CrossRef]
  35. Widholm, J.A.C.K.; Zabotina, O.A.; McIsaac, G.F.; David, M.B.; Voigt, T.B.; Boersma, N.N.; Long, S.P. Miscanthus: A promising biomass crop. Adv. Bot. Res. 2010, 56, 75–137. [Google Scholar]
  36. Lewandowski, I.; Clifton-Brown, J.C.; Scurlock, J.M.O.; Huisman, W. Miscanthus: European experience with a novel energy crop. Biomass Bioenergy 2000, 19, 209–227. [Google Scholar] [CrossRef]
  37. Heaton, E.; Voigt, T.; Long, S.P. A quantitative review comparing the yields of two candidate C 4 perennial biomass crops in relation to nitrogen, temperature and water. Biomass Bioenergy 2004, 27, 21–30. [Google Scholar] [CrossRef]
  38. Termoquip Energia Alternativa Ltd. Gaseificador Tipo Co-Corrente com Dois Estágios; Protocolo de Venda do Equipamento; Termoquip Energia Alternativa Ltd.: São Paulo, Brazil, 2007. [Google Scholar]
  39. Reed, T.B.; Das, A. Handbook of Biomass Downdraft Gasifier Engine Systems; Biomass Energy Foundation: Golden, CO, USA, 1988. [Google Scholar]
  40. Souza-Santos, M.L.D. Solid Fuels Combustion and Gasification. Modeling, Simulation and Equipment Operation; CRC Press: Boca Raton, FL, USA, 2010. [Google Scholar]
  41. Jarungthammachote, S.; Dutta, A. Thermodynamic equilibrium model and second law analysis of a downdraft waste gasifier. Energy 2007, 32, 1660–1669. [Google Scholar] [CrossRef]
  42. Itai, Y.; Santos, R.; Branquinho, M.; Malico, I.; Ghesti, G.F.; Brasil, A.M. Numerical and experimentaassessment of a downdraft gasifier for electric power in Amazon using açaí seed (Euterpe oleracea Mart.) as a fuel. Renew. Energy 2014, 66, 662–669. [Google Scholar] [CrossRef]
  43. Burcat, A. Third Millennium Ideal Gas and Condensed Phase Thermochemical Database for Combustion with Updates from Active Thermochemical Tables; Argonne National Lab.: Argonne, IL, USA, 2005. [Google Scholar]
  44. Balu, E.; Lee, U.; Chung, J.N. High temperature steam gasification of woody biomass—A combined experimental and mathematical modeling approach. Int. J. Hydrogen Energy 2015, 40, 14101–14115. [Google Scholar] [CrossRef]
  45. Diyoke, C.; Gao, N.; Aneke, M.; Wang, M.; Wu, C. Modelling of down-draft gasification of biomass—An integrated pyrolysis, combustion and reduction process. Appl. Therm. Eng. 2018, 142, 444–456. [Google Scholar] [CrossRef]
  46. Campoy, M.; Gómez-Barea, A.; Vidal, F.B.; Ollero, P. Air–steam gasification of biomass in a fluidised bed: Process optimisation by enriched air. Fuel Process. Technol. 2009, 90, 677–685. [Google Scholar] [CrossRef]
  47. OLIVEIRA, C.A.V.B.D. Estudo experimental da gaseificação do eucalipto em gaseificador co-corrente de duplo estágio com ar, vapor saturado e oxigênio para produção de gás de síntese. Ph.D. Thesis, Universidade Federal de Itajubá, Itajubá, Brazil, 2015. [Google Scholar]
  48. Dogru, M.; Howarth, C.R.; Akay, G.; Keskinler, B.; Malik, A.A. Gasification of hazelnut shells in a downdraft gasifier. Energy 2002, 27, 415–427. [Google Scholar] [CrossRef]
  49. Guo, F.; Dong, Y.; Dong, L.; Guo, C. Effect of design and operating parameters on the gasification process of biomass in a downdraft fixed bed: An experimental study. Int. J. Hydrogen Energy 2014, 39, 5625–5633. [Google Scholar] [CrossRef]
  50. Nascimento, F.R.M. Equilibrium Modeling of a Downdraft Gasifier Using Different Gasification Fluids, Itajubá. Master’s Thesis, Institute of Mechanical Engineering, Federal University of Itajubá, Itajubá, Brazil, 2015. [Google Scholar]
  51. Cetin, E.; Moghtaderi, B.; Gupta, R.; Wall, T.F. Influence of pyrolysis conditions on the structure and gasification reactivity of biomass chars. Fuel 2004, 83, 2139–2150. [Google Scholar] [CrossRef]
  52. Fellet, G.; Marchiol, L.; Delle Vedove, G.; Peressotti, A. Application of biochar on mine tailings: Effects and perspectives for land reclamation. Chemosphere 2011, 83, 1262–1267. [Google Scholar] [CrossRef] [PubMed]
  53. Nguyen, C.; Do, D.D. The Dubinin–Radushkevich equation and the underlying microscopic adsorption description. Carbon 2001, 39, 1327–1336. [Google Scholar] [CrossRef]
  54. Sun, L.; Wan, S.; Luo, W. Biochars prepared from anaerobic digestion residue, palm bark, and eucalyptus for adsorption of cationic methylene blue dye: Characterization, equilibrium, and kinetic studies. Bioresour. Technol. 2013, 140, 406–413. [Google Scholar] [CrossRef] [PubMed]
  55. Cha, J.S.; Park, S.H.; Jung, S.C.; Ryu, C.; Jeon, J.K.; Shin, M.C.; Park, Y.K. Production and utilization of biochar: A review. J. Ind. Eng. Chem. 2016, 40, 1–15. [Google Scholar] [CrossRef]
  56. Ahmad, M.; Lee, S.S.; Dou, X.; Mohan, D.; Sung, J.K.; Yang, J.E.; Ok, Y.S. Effects of pyrolysis temperature on soybean stover-and peanut shell-derived biochar properties and TCE adsorption water. Bioresour. Technol. 2012, 118, 536–544. [Google Scholar] [CrossRef] [PubMed]
  57. Chen, B.; Zhou, D.; Zhu, L. Transitional adsorption and partition of nonpolar and polar aromatic contaminants by biochars of pine needles with different pyrolytic temperatures. Environ. Sci. Technol. 2008, 42, 5137–5143. [Google Scholar] [CrossRef] [PubMed]
  58. Yang, K.; Peng, J.; Srinivasakannan, C.; Zhang, L.; Xia, H.; Duan, X. Preparation of high surface area activated carbon from coconut shells using microwave heating. Bioresour. Technol. 2010, 101, 6163–6169. [Google Scholar] [CrossRef] [PubMed]
  59. Lehmann, J.; Joseph, S. (Eds.) Biochar for Environmental Management: Science, Technology and Implementation; Routledge: Abingdon, UK, 2015. [Google Scholar]
  60. Guerrero, M.; Ruiz, M.P.; Millera, Á.; Alzueta, M.U.; Bilbao, R. Characterization of biomass chars formed under different devolatilization conditions: Differences between rice husk and eucalyptus. Energy Fuels 2008, 22, 1275–1284. [Google Scholar] [CrossRef]
  61. Macias-García, A.; García, M.B.; Díaz-Díez, M.A.; Jiménez, A.H. Preparation of active carbons from a commercial holm-oak charcoal: Study of micro-and meso-porosity. Wood Sci. Technol. 2004, 37, 385–394. [Google Scholar] [CrossRef]
  62. Ronsse, F.; Van Hecke, S.; Dickinson, D.; Prins, W. Production and characterization of slow pyrolysis biochar: Influence of feedstock type and pyrolysis conditions. GCB Bioenergy 2013, 5, 104–115. [Google Scholar] [CrossRef]
  63. LI, C.; SUZUKI, K. Tar property, analysis, reforming mechanism and model for biomass gasification—An overview. Renew. Sustain. Energy Rev. 2009, 13, 594–604. [Google Scholar] [CrossRef]
Figure 1. Miscanthus Briquettes.
Energies 11 03225 g001
Figure 2. Downdraft double-stage gasifier (a) and with thermocouples (b).
Energies 11 03225 g002
Figure 3. Syngas composition at ER 0.35.
Energies 11 03225 g003
Figure 4. Temperature profile in double stage downdraft gasifier at steady state.
Energies 11 03225 g004
Figure 5. Gas concentration with respect to Equivalence ratio and temperature.
Energies 11 03225 g005
Figure 6. Gas LHV value with respect to ER.
Energies 11 03225 g006
Figure 7. Cold efficiency and gas yield with respect to the equivalence ratio.
Energies 11 03225 g007
Figure 8. Relationship between Biochar surface area and Micropore volume. SA = Surface Area and MV = Micro pore Volume.
Energies 11 03225 g008
Figure 9. Where SA = Surface Area and T = Temperature.
Energies 11 03225 g009
Figure 10. Fresh Miscanthus briquettes outer layer at a magnification of ×500 (100 µm).
Energies 11 03225 g010
Figure 11. Miscanthus char outer layer at a magnification at ×500 (100 µm).
Energies 11 03225 g011
Figure 12. Biochar obtained from Miscanthus briquettes gasification at a magnification at ×1000 (50 µm).
Energies 11 03225 g012
Figure 13. Miscanthus char at a magnification of ×1000 (50 µm).
Energies 11 03225 g013
Figure 14. Tar collection system.
Energies 11 03225 g014
Figure 15. Output tar concentration vs. gasifier bed temperature.
Energies 11 03225 g015
Table 1. Proximate and ultimate analysis of Miscanthus (wt.%).
Proximate AnalysisUltimate Analysis
Moisture11.6%Carbon48.6%
Volatile Matter67.1%Hydrogen6%
Fixed Carbon16.9%Nitrogen0.3%
Ash4.4Sulfur0.1%
Total100.0%Oxygen45.0%
LHV (MJ/kg)16.3Total100%
Table 2. The comparison of predicted results with the experimental data from [46].
RunGasification ParametersCOH2CO2CH4RMS
-ERSBOPEMEMEMEM-
10.3502115.8024.578.7017.0315.109.685.102.086.08
20.330.222115.4019.3011.9019.2615.9013.964.803.273.89
30.330.452113.8014.4613.3020.1217.0017.564.604.123.09
40.270.232115.0017.6214.0018.9016.2016.674.706.462.64
50.270.432111.9012.9616.2019.6718.6020.125.307.281.97
60.360.323018.9024.2416.4024.2017.6015.425.502.004.63
70.350.603015.7018.1818.3025.7018.8019.935.703.243.74
80.250.313020.8021.4020.0024.5315.8019.306.707.382.60
90.240.583015.3014.3922.3025.2420.3024.667.109.292.61
100.380.333520.0026.5717.5025.3816.8016.065.601.554.97
110.340.563517.5021.0621.8027.8918.0020.246.103.313.61
120.270.313523.9024.8622.4027.0612.6018.357.305.743.46
130.260.633519.3016.5725.1028.1016.2024.537.407.764.24
140.320.104027.4035.2618.3026.8416.2012.237.302.315.94
150.330.294025.1025.5423.1028.3713.7016.156.502.583.23
160.350.364023.9027.9322.3028.2914.6017.246.702.234.08
170.320.544020.2022.8524.5029.8916.7020.976.903.923.67
180.330.574019.3022.5125.7029.8717.0021.156.703.613.44
190.260.304028.5026.8425.7028.579.2018.688.106.184.66
200.240.564023.5018.7027.5029.3314.6024.817.708.755.22
-Average3.89
Table 3. Syngas composition.
ERH2 %CO%CH4 %
0.211.210.971.03
0.3518.6820.290.86
0.4517.0719.431.22

